Northern Territory Emergency Response Evaluation Report 2011 November 2011

Welcome message from author
This document is posted to help you gain knowledge. Please leave a comment to let me know what you think about it! Share it to your friends and learn new things together.
Transcript

Northern Territory Emergency Response
Evaluation Report 2011
November 2011

With the exception of the Commonwealth Coat of Arms and where otherwise noted all material presented in this document is provided under a Creative Commons Attribution 3.0 Australia (http://creativecommons.org/licenses/by/3.0/au/) licence.
The details of the relevant licence conditions are available on the Creative Commons website (accessible using the links provided) as is the full legal code for the CC BY 3.0 AU licence (http://creativecommons.org/licenses/by/3.0/au/legalcode).
This report must be attributed as: Northern Territory Emergency Response Evaluation Report 2011.
ISBN PDF 978-1-921975-20-2 RTF 978-1-921975-21-9 PRINT 978-1-921975-22-6

Northern Territory Emergency Response: Evaluation Report 2011 iii
Foreword
This evaluation examines the Northern Territory Emergency Response (NTER), which was initiated in June 2007, from a whole-of-government perspective. The requirement for an independent, outcome-focused evaluation is a key feature of the National Partnership Agreement for Closing the Gap in the Northern Territory, which committed to a joint evaluation with the Northern Territory Government in 2011–12.
This report assesses the outcomes from both the initial emergency phase of the NTER and the redesign and stabilisation under the Closing the Gap in the Northern Territory National Partnership Agreement.
The overall aim of this evaluation was to examine whether the measures, both individually and collectively, have been effective and comprehensive and have led to improved and sustainable outcomes in safety, health, education and employment. It also sought to examine how well coordination and engagement have been conducted.
The evaluation strategy identified some key principles which have guided this evaluation. It builds on separate evaluations of individual measures and programs and the extensive data publicly available in the Closing the Gap in the Northern Territory monitoring reports.
Each chapter of the evaluation has been prepared by independent authors. Given the strong focus of the evaluation on outcomes, the authors include some of Australia’s most prominent analytical organisations. The authors are the Australian Institute of Criminology, the Australian Institute of Health and Welfare, the Australian Institute of Family Studies, the Australian Council for Educational Research, Allen Consulting Group, Colmar Brunton Social Research, and KPMG. An overview chapter which draws on each of the individual chapters was prepared by Kathryn Julie Roediger, who is an independent consultant who was previously a Deputy Director in the Australian Institute of Health and Welfare.
A key guiding principle for this evaluation was to make the most of the data that does exist, rather than to focus on what cannot be done. This report was not intended to provide policy advice or suggest what should be done next; rather, it provides an assessment of outcomes to date.
While the report does have a strong focus on data, it is important to understand that there are only around 45,000 Indigenous Australians resident in the NTER communities. It can be difficult at times to observe trends in some outcome data for what is a relatively small population over a four-year period. It is also important to understand that the NTER is a very complex policy response that has many elements. It is not always possible to identify the additional impact of individual measures because so many changes, both NTER and other measures, were introduced at a similar time.
Where possible the report provides data for people directly affected by the NTER however, on occasion data refers to the Northern Territory as a whole. It is worth noting that over two-thirds of all Indigenous people in the Northern Territory live in NTER prescribed areas. In some instances data are presented for remote and very remote parts of the Northern Territory. In interpreting these data it should be noted that over 80 per cent of all Indigenous people who live in either remote or very remote parts of the Northern Territory live in NTER prescribed areas.

iv Northern Territory Emergency Response: Evaluation Report 2011
A key gap in the evaluative evidence that we have addressed was the systematic collection of data about the experiences and views of local people from NTER communities. The lived experience of local people is a vital input into the evaluation, and to address this gap, FaHCSIA commissioned a substantial study of safety and wellbeing for this evaluation. This project, the Community Safety and Wellbeing Research Study, is outlined in Chapter 3 of this report. To our knowledge, this is an unparalleled study in Indigenous communities in the Northern Territory in terms of both size and approach, covering 16 communities and more than 1,300 people. The study used a mixed method approach in which both quantitative surveys and qualitative participatory style research were used to ensure that community views and experiences were captured in a robust, accurate and ethical manner. The data on community members’ lived experiences are complemented by a separate survey of several hundred service providers who work with or in the remote communities.
This evaluation has been assisted by an independent advisory group comprising members from the community, academia and the non-government sector, including specialist advisers and eminent researchers, both Indigenous and non-Indigenous, from the Northern Territory and elsewhere. While the group provided advice to the authors of the chapters, the content of each chapter is the responsibility of each author. The members of the advisory group were:
• Toby Hall, Chief Executive Officer, Mission Australia
• Professor Megan Davis, University of New South Wales
• Dr Gill Westhorp, Director, Community Matters
• Bess Nungarrayi Price, Consultant
• Priscilla Collins, Chief Executive Officer, North Australian Aboriginal Justice Agency
• Dr Howard Bath, Children’s Commissioner, Northern Territory Government
• Professor Steve Larkin, Pro Vice-Chancellor, Indigenous Leadership, Charles Darwin University.
An evaluation board comprising representatives of the Northern Territory Government and key Australian Government departments helped oversee the evaluation to ensure factual accuracy and to ensure that the lessons learned during the conduct of the evaluation were shared across governments. The evaluation was managed and overseen on a day-to-day basis by Performance and Evaluation Branch in the Department of Families, Housing, Community Services and Indigenous Affairs.
Report structure Part 1 of this report begins with an ‘Overview’ chapter which summarises and synthesises results from each of the individual chapters that are provided in Part 2 of the report. The overview is followed by a ‘Background’ chapter which provides some context, tells the story of how the NTER unfolded and gives more detail on the overall evaluation strategy, including the program logic. Part 1 closes with a chapter describing the Community Safety and Wellbeing Research Study.
Part 2 comprises a set of seven subject-specific chapters. Each chapter reports on a subset of the measures implemented under the NTER against the evaluation criteria in the Northern Territory Emergency Response Whole-of-Government Evaluation Strategy. Each chapter includes a methodology section outlining the data sources and methods used. The seven chapters and their authors are:

Northern Territory Emergency Response: Evaluation Report 2011 v
• Coordination and engagement: Allen Consulting Group
• Promoting law and order: Australian Institute of Criminology
• Improving child and family health: Australian Institute of Health and Welfare
• Supporting families: Australian Institute of Family Studies
• Enhancing education: Australian Council for Educational Research
• Welfare reform and employment: Colmar Brunton Social Research
• Housing and land reform: KPMG.
This evaluation represents a substantial body of work by many people.
The Australian Government thank the evaluation advisory group, the individual authors and the Northern Territory Government for their contributions to this report. Both governments also thank and acknowledge the work of many officers in government agencies and non-government organisations who provided published and unpublished information that was used in this report.
It would be impossible to thank all involved. A special word of thanks is warranted, however, to those Indigenous people who participated in the various evaluation studies both by contributing information about their lives and as researchers involved in data collection or analysis. We are grateful for their collaboration and have sought to do this work in an ethical and rigorous manner. We hope to build on this collaborative two-way learning partnership.
Performance and Evaluation Branch FaHCSIA


Northern Territory Emergency Response: Evaluation Report 2011 vii
Contents
Foreword.................................................................................................................................... iii Abbreviations and acronyms .....................................................................................................ix
Part One...........................................................................................................1
1 Overview ........................................................................................................................... 3 Executive summary ...................................................................................................... 3 Key findings .................................................................................................................. 5 Introduction................................................................................................................. 10 Engagement ............................................................................................................... 11 Individual measures.................................................................................................... 14 Outcomes—whole of NTER ....................................................................................... 42 Sustainable communities............................................................................................ 43 Informing future policy development .......................................................................... 46 Bibliography................................................................................................................ 48
2 Background..................................................................................................................... 53 Introduction................................................................................................................. 53 History......................................................................................................................... 53 Context ....................................................................................................................... 56 Implementation of the NTER ...................................................................................... 65 Evaluation................................................................................................................... 78 Bibliography................................................................................................................ 85
3 Research into community safety, wellbeing and service provision ................................ 89 Key findings ................................................................................................................ 89 Introduction................................................................................................................. 89 Overview..................................................................................................................... 90 Community Safety and Wellbeing Research Study.................................................... 92 Community Safety Service Provider Survey ............................................................ 106 Dissemination and use of the research .................................................................... 121
Part Two ......................................................................................................123
4 Coordination and engagement ..................................................................................... 125 Key findings .............................................................................................................. 125 Introduction............................................................................................................... 126 Definitions and characteristics of effective coordination and engagement .............. 129 Findings .................................................................................................................... 132 Conclusions .............................................................................................................. 150 Bibliography.............................................................................................................. 156
5 Promoting law and order............................................................................................... 159 Key findings .............................................................................................................. 159 Approach .................................................................................................................. 160 Background............................................................................................................... 162 The law and order measures.................................................................................... 164 Community safety—changes.................................................................................... 166 Review of individual measures................................................................................. 173 Increased policing presence in communities............................................................ 173 Alcohol restrictions ................................................................................................... 177

viii Northern Territory Emergency Response: Evaluation Report 2011
Pornography restrictions........................................................................................... 184 Night patrols.............................................................................................................. 189 Substance Abuse Intelligence Desk and Dog Operations Unit ................................ 194 Legal aid services..................................................................................................... 196 Northern Territory Aboriginal Interpreter Service ..................................................... 197 Overall conclusions .................................................................................................. 198
6 Improving child and family health ................................................................................. 201 Key findings .............................................................................................................. 201 Introduction............................................................................................................... 203 Background............................................................................................................... 204 Methods used for this chapter .................................................................................. 206 NTER health initiatives ............................................................................................. 207 Trends in health outcomes ....................................................................................... 227 Changes in alcohol and other drug treatment services............................................ 242 Conclusions .............................................................................................................. 243
7 Supporting families ....................................................................................................... 245 Key findings .............................................................................................................. 245 Introduction............................................................................................................... 246 Methodology ............................................................................................................. 247 Background............................................................................................................... 252 Community, family and child safety.......................................................................... 257 NTER measures designed to overcome risk factors for family dysfunction and child abuse/neglect................................................................................................... 277 Conclusions .............................................................................................................. 288
8 Enhancing education .................................................................................................... 292 Key findings .............................................................................................................. 292 Introduction............................................................................................................... 293 Context ..................................................................................................................... 294 Scope and methodology........................................................................................... 295 Progress and challenges .......................................................................................... 300 Educational outcomes .............................................................................................. 311 Effects of the NTER on school enrolments and attendance .................................... 322 Conclusion................................................................................................................ 326 Bibliography.............................................................................................................. 328
9 Welfare reform and employment .................................................................................. 333 Key findings .............................................................................................................. 333 Introduction............................................................................................................... 335 Methodology/approach ............................................................................................. 335 Background and overview ........................................................................................ 335 Discussion ................................................................................................................ 344 Conclusion................................................................................................................ 362 Bibliography.............................................................................................................. 365
10 Housing and land reform............................................................................................... 369 Key findings .............................................................................................................. 369 Introduction............................................................................................................... 371 Five-year Leases ...................................................................................................... 375 Permit Reforms......................................................................................................... 382 Urgent Repairs to Infrastructure ............................................................................... 386 Community Clean Up ............................................................................................... 387 Government Business Manager Accommodation.................................................... 391 Summary of findings................................................................................................. 394

Northern Territory Emergency Response: Evaluation Report 2011 ix
Abbreviations and acronyms
ABS Australian Bureau of Statistics ACC Australian Crime Commission ACCHO Aboriginal community controlled health organisation AEDI Australian Early Development Index AFP Australian Federal Police AGD Attorney-General’s Department AIC Australian Institute of Criminology AIFS Australian Institute of Family Studies AIHW Australian Institute of Health and Welfare AIS Aboriginal Interpreter Service ALPA Arnhem Land Progress Aboriginal Corporation ALRA Aboriginal Land Rights (Northern Territory) Act 1976 AMP Alcohol Management Plan AMSANT Aboriginal Medical Services Alliance of the Northern Territory ANAO Australian National Audit Office ANTaR Australians for Native Title and Reconciliation AOD Alcohol and other drugs AODTS–NMDS AOD Treatment Services National Minimum Data Set ARPnet Aboriginal Practitioners Research Network ASGC Australian Standard Geographical Classification BBF Budget Based Funding Program BER Building the Education Revolution CCU Community Clean Up CDEP Community Development Employment Projects CEB Community Employment Broker CGC Commonwealth Grants Commission CHCI Child Health Check Initiative CIRCA Cultural and Indigenous Research Centre Australia CLC Central Land Council COAG Council of Australian Governments CSSPS Community Safety Service Provider Survey CSWRS Community Safety and Wellbeing Research Study DEEWR Department of Education, Employment and Workplace Relations DOU Dog Operations Unit EHSDI Expanding Health Service Delivery Initiative ENT Ear, nose and throat FaHCSIA Department of Families, Housing, Community Services and Indigenous Affairs FTE Full-time equivalent GAA Growth Assessment and Action GBM Government Business Manager GST Goods and services tax HSDA Health service delivery area ICC Indigenous coordination centre IEO Indigenous Engagement Officer IEP Indigenous Employment Program ILP Indigenous Leadership Program JSA Job Services Australia LIP Local Implementation Plan LLNP Language, Literacy and Numeracy Program MACS Multifunctional Aboriginal Children’s Services MBS Medicare Benefits Scheme MCPT Mobile Child Protection Team MOS Northern Territory Sexual Assault Mobile Outreach Service

x Northern Territory Emergency Response: Evaluation Report 2011
NAAJA North Australian Aboriginal Justice Association NAPLAN National Assessment Program—Literacy and Numeracy NATSISS National Aboriginal and Torres Strait Islander Social Survey NDRI National Drug Research Institute NGO Non-government organisation NHMD National Hospital Morbidity Database NLC Northern Land Council NPA National Partnership Agreement NPARIH National Partnership Agreement on Remote Indigenous Housing NPARSD National Partnership Agreement on Remote Service Delivery NT Northern Territory NT AIS Northern Territory Aboriginal Interpreter Service NT DCF Northern Territory Department of Children and Families NT DET Northern Territory Department of Education and Training NT DoH Northern Territory Department of Health NTER Northern Territory Emergency Response NTJP Northern Territory Jobs Package NTNER Northern Territory National Emergency Response Act 2007 NTNPA Northern Territory National Partnership Agreement RAE Remote Area Exemption RAFCW Remote Aboriginal and Family Community Worker RAHC Remote Area Health Corps RDA Racial Discrimination Act 1975 ROC Regional Operations Centre RPA Regional Partnership Agreement RSD Remote Service Delivery SAID Substance Abuse Intelligence Desk SIHIP Strategic Indigenous Housing and Infrastructure Program SLA Statistical local area SNAICC Secretariat of National Aboriginal and Islander Child Care SNP School Nutrition Program STEP Structured Training and Employment Projects STEP ERS STEP—Employment and Related Services TOO Tasks of Opportunity UNICEF United Nations Children’s Fund URTI Urgent Repairs to Infrastructure VON Visiting Officer Notification WfD Work for the Dole

Part One
Part One
1 Overview 3
2 Background 53
3 Research into community safety, wellbeing and service provision
89


Overview: Executive Summary
Northern Territory Emergency Response: Evaluation Report 2011 3
1 Overview
Kathryn Julie Roediger
Executive summary The Northern Territory Emergency Response (NTER) was announced on 21 July 2007 and has been implemented over the last four years. The NTER aims to protect children, to make communities safe and to build a better future for people living in Indigenous communities and town camps in the Northern Territory. It has changed since its initial implementation but its focus and many of the key themes and measures remain the same.
The report of the Board of Inquiry into the Protection of Aboriginal Children from Sexual Abuse, Ampe akelyernemane meke mekarle: ‘Little children are sacred’, gave the issue of child sexual abuse in the Northern Territory a high profile and was a direct catalyst for the Northern Territory Emergency Response (NTER).
There has been a very large increase in child protection substantiations for Indigenous children in the Northern Territory since 2006–07. Around three-quarters of this increase is accounted for by child neglect, and the increase probably reflects an increase in child protection resources rather than a change in the underlying rate. While child sexual assault is an issue, child neglect is a much larger one.
The NTER sought to improve outcomes for Indigenous children and families by targeting communities that had lower than needed service levels for police, child protection, health, housing, education and infrastructure.
The current NTER measures in the Closing the Gap in the Northern Territory National Partnership Agreement (NTNPA) are improving the basic services, infrastructure and safety of communities and showing some early signs of positive outcomes for Indigenous people.
Outcomes for health, education, employment, housing and safety are still well below those for non-Indigenous people but they have improved since the start of the NTER. In a survey of over 1,300 NTER community members, most people (58.7%) reported that they felt that their lives were better than they had been three years ago. A majority of people surveyed (72.6%) also said that their community was safer now than it had been three years ago.1
The number of simultaneous activities (many unrelated to the NTER), the long lag time between actions and outcomes, and the short duration of the NTER mean it is rarely possible to attribute outcomes to individual measures.
Educational attainment remains a key challenge. Average school attendance rates were low and have not improved since the start of the NTER. There has been some improvement in National Assessment Program—Literacy and Numeracy (NAPLAN) results for Year 3 reading in NTER schools since 2008, but most children in NTER schools do not meet national minimum standards for reading, writing and numeracy.
Problems with the implementation of the NTER relate primarily to poor consultation and the blanket imposition of a small number of initiatives. The initial rollout was marked by a sense of crisis that favoured short-term approaches with little consultation. This delivered much
1 G. Shaw & P. d’Abbs, Community Safety and Wellbeing Research Study consolidated report, Bowchung for FaHCISA, Canberra, 2011.

Overview: Executive Summary
4 Northern Territory Emergency Response: Evaluation Report 2011
needed additional government services, such as police, teachers, night patrols and classrooms. Communities generally welcomed these additional government services despite short consultation periods.2
However, for initiatives specific to the NTER communities—such as income management and signage outside communities referring to the alcohol and pornography bans—the abrupt, imposition broke trust and made some people feel that they had been unfairly labelled.3 Many people valued the measures, but the manner in which they were implemented caused problems.
Additional engagement mechanisms have been added over the course of the NTER. A survey of 85 government and service providers conducted by the Allen Consulting Group found that 71 per cent of respondents thought that engagement approaches improved over time. Despite this, there are ongoing challenges.
Looking forward, new measures to improve enrolment and attendance at school and the extent and sustainability of the economic base are needed if the NTER is to fulfil its objectives. Education and jobs are critical to the wellbeing of communities. Housing also remains an issue of prime importance to communities.
Workforce shortfalls, especially shortfalls of suitably skilled Indigenous people, are evident in health, education, policing and governance. Yet there is low employment and low school attendance. There is potential for more Indigenous people to pursue careers that would assist their communities, particularly if they succeed in school.
Longevity of both programs and personnel has been demonstrated to work better than rapid change. Long-term commitment and evolution in accordance with community strengths and on timeframes agreed with communities have the greatest chance of bringing about sustained improvement.
The capacity of communities to build on government services will be essential to sustained improvement. Dodson and Smith have identified Indigenous governance as the key factor for the sustainable development of Indigenous communities: ‘Without improved governance capacity, there is unlikely to be sustained development, and valuable opportunities will be squandered.’4
2 ibid., pp. 48–67. 3 FaHCSIA, Report on the Northern Territory Emergency Response redesign consultations, FaHCSIA, Canberra, 2009, p. 40. 4 M. Dodson & D.E. Smith, Governance for sustainable development: Strategic issues and principles for Indigenous Australian communities, Discussion Paper No. 250, Centre for Aboriginal Economic Policy Research, 2003, p. 20.

Overview: Key Findings
Northern Territory Emergency Response: Evaluation Report 2011 5
Key findings
Engagement The rapid delivery of much-needed additional government services was broadly supported by communities, despite short consultation periods.5
However, for initiatives specific to the NTER communities which aimed to change behaviour within those communities—such as income management, changes to alcohol restrictions and signage—the lack of consultation and blanket imposition attracted criticism even when the measures themselves were valued.6
The suspension of Part II of the Racial Discrimination Act 1975 was required for the implementation of some initiatives, and attracted particular criticism.7 The Australian Parliament passed legislation in June 2010 to reinstate the operation of the Act.
While the lack of engagement attracted criticism in the initial phase of the NTER, there was also concern, as the NTER continued, that some communities were overburdened with consultation. The volume of visits to communities during the NTER was high: analysis of the Visiting Officer Notification system shows that 45,000 personnel visitations were made during the period from August 2007 to August 2011.8
Engagement was not always fit-for-purpose. Communities argue that they are overconsulted on some things, but also report that they are not sufficiently engaged on other matters. This suggests that better strategic planning of consultation and engagement is required.
Individual measures The effectiveness of individual NTER measures in improving the basic services, infrastructure and safety of communities is described below.
There was strong support for Indigenous Engagement Officers (IEOs). In a survey of service providers, 85 per cent of respondents said that the current IEO model worked well to promote engagement in communities.9
The Allen Consulting Group found that the Government Business Manager (GBM) model was widely supported. However, it also found that the effectiveness of the role was seen to vary widely between individual GBMs.10
There is a need for additional interpreter services. While the use of interpreters increased over the course of the NTER, a survey of service providers found that 80 per cent of respondents said that interpreters were either never used when required or were only used when required some of the time.11
5 G. Shaw & P. d’Abbs, op. cit. 6 NTER Review Board, Northern Territory Emergency Response: Report of the NTER Review Board, NTER Review Board, Canberra, 2008, pp. 20-25. 7 ibid., p. 46. 8 FaHCSIA, unpublished data, FaHCSIA administrative records on the Visiting Officer Notification, provided on request for this review, 23 August 2011. More than one person can be included on one VON request. The total of 45,000 visitations to NTER communities and town camps came from 20,000 VON requests. 9 A full analysis of the survey of 85 government and other service providers by the Allen Consulting Group is in Chapter 4 of this report 10 A full analysis of the survey of 85 government and other service providers by the Allen Consulting Group is in Chapter 4 of this report 11 A full analysis of the survey of 85 government and other service providers by the Allen Consulting Group is in Chapter 4 of this report

Overview: Key Findings
6 Northern Territory Emergency Response: Evaluation Report 2011
Increased police presence was welcomed by most people in the NTER communities.12 In the Community Safety and Wellbeing Research Study (CSWRS), which included a survey of more than 1,300 NTER community members, a majority of people (72.6%) said that the community was safer than it had been three years ago.13
The NTER alcohol restrictions have been more consistently enforced than previous restrictions. However, there is not enough evidence to know whether the NTER pornography restrictions have been effective. Night patrols have strong community support. The Substance Abuse Intelligence Desk (SAID) has made measurable improvements in the policing of illicit substances. The additional funding supplied for legal and interpreter services has been important in supporting access to justice.14
The Child Health Check Initiative (CHCI) provided checks for most children in the NTER communities, and for nearly all children in smaller communities. Around two-thirds of referrals have been followed up, but the checks have highlighted the limitations of the health system. Substantial unmet need remains, and the Expanding Health Service Delivery Initiative is a promising vehicle for future investment. The capacity for alcohol and other drug treatments has been expanded; however, the expected demand for residential ‘drying out’ services did not match client preferences.15
Fourteen Remote Aboriginal and Family Community Workers (RAFCWs) were based in 13 priority communities under the NTER.16 These workers are providing services to the 13 priority communities and outreach services to an additional 20 communities as part of the priority community service model. Safe houses are also proving to be valuable community assets.17
One hundred and ninety-two additional teaching positions have been funded. Additional professional development opportunities for teachers have been provided to improve the quality of teaching, and more housing has been constructed to encourage teachers to stay for longer. Overcrowding in schools has been reduced through the construction of new classrooms. The School Nutrition Program (SNP) has not increased attendance, but may have improved student behaviour and parental engagement with the school.18 Additional early childhood programs have had moderate take-up and reasonable support from parents.
Income management was supported by many people in the communities who believed that it was bringing about positive outcomes, especially for children19 although there are still problems in finding out the balance on a BasicsCard. Community stores now stock a wider range of healthy foods.
Creating additional jobs in communities has been the biggest positive influence on people’s perceptions of their lives and their communities.20 However, issues around low job availability, poor enforcement of mutual obligations arising from welfare or employment programs, and fly-in, fly-out service models need to be reviewed. The current model does not help service
12 J. Pilkington, Aboriginal communities and the police’s Taskforce Themis: Case studies in remote Aboriginal community policing in the Northern Territory, Northern Australian Aboriginal Justice Agency & Central Australian Aboriginal Legal Aid Services, Darwin, 2009. 13 G Shaw & P d’Abbs, op. cit. 14 See Chapter 5 for a full discussion. 15 See Chapter 6 for a full discussion. 16 The initial investment was for RAFCWs in 13 communities. In late 2010, in response to the findings of the Board of Inquiry into the Child Protection System in the Northern Territory, the Australian Government announced a range of measures that included an additional 22 RAFCWs. 17 See Chapter 7 for a full discussion. 18 DEEWR, School Nutrition Program: Operational guidelines, 1 January 2011 to 30 June 2012, DEEWR, Canberra, 2010. 19 G Shaw & P d’Abbs, op. cit. 20 ibid., p. 33.

Overview: Key Findings
Northern Territory Emergency Response: Evaluation Report 2011 7
providers to develop their understanding of local conditions and the needs of local job seekers, perhaps resulting in a lack of engagement with many NTER programs.21
Compulsory five-year leases allowed the Australian Government to provide much-needed services for the duration of the NTER, and to introduce changes to tenancy arrangements. However, they may have slowed negotiations with traditional owners for long-term leases, which are important to the long-term sustainability of these communities. Changes to the permit system for access to Indigenous-owned land have saved the government time, but some people have felt disempowered by the changes. The Community Clean-up program addressed a genuine need, but had some implementation issues. The Urgent Repairs to Infrastructure program delivered against its objectives.22
Lessons learned The NTER revealed a high level of need within the NTER communities. All measures encountered demand for the services provided. While the mix of services is complex, there is little evidence of duplication or of unnecessary service provision.
It has been difficult to attract and retain suitably skilled people to provide services in areas such as health, education, policing and governance. Suitably skilled and qualified Indigenous people were particularly in demand. Despite this, employment rates were low, as were rates of school attendance. More Indigenous people could pursue careers that would help their communities, especially if they succeed in school.
There were some positive signs that coordination and engagement activities improved during the NTER. In a survey of service providers23 71 per cent of respondents reported that coordination had improved over time. However, the same survey also found evidence of the re-emergence of program and funding ‘silos’. Some service providers believed that transition away from the NTER Operations Centre occurred too early, before the necessary coordination structures were in place.24
Gaps The School Nutrition Program was the only NTER measure that primarily targeted school attendance, which has not improved over the course of the NTER. Additional measures targeting enrolment and attendance at school are needed.
Employment remains low and narrowly based. Economic development will be essential to producing sustainable improvement in the NTER communities.
Community members rated housing as the most important challenge still facing communities.25,26
The recorded rates of alcohol-related offences and violent crime in NTER communities remain high.27 Further increases in policing, safety and alcohol management programs may be required.
21 See Chapter 9 for a full discussion. 22 See Chapter 10 for a full discussion. 23 A full analysis of the survey of 85 government and other service providers by the Allen Consulting Group is in Chapter 4 of this report 24 See Chapter 4 for a full discussion 25 G Shaw & P d’Abbs, op. cit. 26 The qualitative research component involved approximately 1,000 people. 27 Australian Institute of Criminology analysis of Northern Territory Police offences dataset. See Chapter 5 for a full analysis.

Overview: Key Findings
8 Northern Territory Emergency Response: Evaluation Report 2011
Outcomes Outcomes for health, education, employment, housing and safety showed some improvement but were still well below those for non-Indigenous people.
As a result of the NTER, 18 communities gained a resident police presence for the first time. Other communities received more policing resources. Communities that did not have night patrols got them, and alcohol restrictions were more consistently enforced.
Some 10,605 children had at least one health check. A health condition or risk factor was identified for 97 per cent of children checked. Ninety-nine per cent of those children received some form of management during the check. Seventy per cent received at least one referral for follow-up treatment.
Of the children who had multiple checks, all those with trachoma and ringworm, 93 per cent of those suffering from scabies, 91 per cent of those with skin sores and 74 per cent of those suffering from anaemia had recovered by the time of the later check.
The percentage of Year 3 students in NTER schools who were at or above the national minimum standard in reading increased from 18 per cent in 2008 to 41 per cent in 2010.28
Since the start of the NTER, 2,241 properly paid jobs have been created and 2,233 positions have been filled. From July 2007 to December 2010, 4,100 job placements were brokered.
According to the Community Safety and Wellbeing Research Study (CSWRS), most NTER residents surveyed said that it was easier to get help from the clinic, Centrelink and the police than it had been three years before. Respondents also reported that schools were better, and that youth schemes provided valuable activities for young people.29
Sustainable communities NTER communities have often experienced rapid turnover of teachers, GBMs, employment brokers and other service providers. This has diminished the capacity of providers to form personal relationships and gain a deeper understanding of the communities, and therefore limited their capacity to provide appropriate services. Similarly, some programs, particularly income management, have been improved through community consultation and are now better understood and accepted. Keeping these programs and personnel in place for long periods has improved their effectiveness.
Access to jobs remains a key problem for communities and a challenge to the sustainability of improvements.
Issues of equity are arising with the creation of many types of communities with different access to services.
Indigenous governance capacity will be a key to sustained development.30
28 See Chapter 8 for a full discussion. 29 G Shaw & P d’Abbs, op. cit. 30 See the ‘Sustainable communities’ section of this chapter for a full discussion.

Overview: Key Findings
Northern Territory Emergency Response: Evaluation Report 2011 9
Informing future policy development Future policy development should take into account the complexity and the range of policies and programs already operating across the region.
Policymakers, service providers and residents of the affected communities would all benefit from a simple, stable enunciation of the strategy supported by ongoing, or at least long-term, funding assurances.
Creating shared ownership of community-specific initiatives will require strong governance from communities and supportive practices from government.

Overview
10 Northern Territory Emergency Response: Evaluation Report 2011
Introduction This report provides a whole-of-government evaluation of the NTER since July 2007. It aims to place the NTER in its political, social and historical context, assess the effectiveness of the NTER measures against the stated objectives, identify lessons learned and inform future policy development.
Part 1 is a self-contained overview of the NTER as a whole. It tells the story of why the NTER occurred and how it evolved over time, reports the evaluation outcomes and summarises the key findings. Part 2 contains separate analyses of seven NTER themes, including detailed analysis of individual measures.
This ‘Overview’ chapter is structured in accordance with the five evaluation goals set out in the NTER Evaluation Strategy31:
a) to establish whether governments have been effective in developing and delivering a coordinated and integrated suite of services and initiatives, and in undertaking effective engagement with Indigenous communities
b) to examine if individual measures are effective and appropriate, and whether there are any gaps in the suite of services and initiatives
c) to establish whether this approach has led to an improvement in the safety, health and education outcomes of children and vulnerable people in the affected communities
d) to assess whether this approach has contributed to more sustainable communities, and progress in achieving the Closing the Gap targets
e) to inform future policy development and decision making about where and how improvements could be made to achieve the objectives of the National Partnership Agreement.
Each of these goals is addressed in turn below. Italics have been added to key phrases in the goals; those phrases are used as section headings to guide the reader through the evaluation.
Engagement is addressed in two parts.
Specific engagement outcomes and measures were formally added to the NTER in 2008. These measures are evaluated in the Coordination and engagement chapter in Part 2 and summarised in the ‘Coordination and engagement’ subsection within the ‘Individual measures’ section of this chapter.
The majority of NTER measures and of NTER funding was directed at increasing the level of general government services. A smaller set of measures were specific to the NTER communities. Some of these measures caused particular engagement problems, which are discussed in the ‘Engagement’ section below.
31 FaHCSIA, Northern Territory Emergency Response Whole-of-Government Evaluation Strategy, FaHCSIA, Canberra, 2010.

Overview
Northern Territory Emergency Response: Evaluation Report 2011 11
Engagement The NTER has changed significantly over its life. It is important to understand the changes in any assessment of the NTER and its impacts.
The NTER, as its name suggests, was an emergency response and as such it was implemented quickly and with minimal time for engagement and consultation. As the NTER has evolved, there has been a stronger focus on engagement.
A substantial increase in funding allowed additional services to be provided to communities within the first year of the NTER, as detailed in Part 2 of this report. Views of people affected by the NTER, captured through the Community Safety and Wellbeing Research Study (CSWRS)32, indicate strong support for the increase in services such as additional police, school nutrition programs, night patrols and more teachers.
But certain community specific measures were resented at first. One of the most controversial aspects of the NTER was the introduction of compulsory income management. Income management was initially imposed according to place of residence, and only communities on Aboriginal-owned areas within the Northern Territory were selected.
The income management measure is now seen as beneficial by many people, especially women.33 However, the initial selection of only Indigenous communities caused ‘widespread disillusionment, resentment and anger in a significant segment of the Indigenous community’.34
Even in its original form, income management generated a mixed reaction. In a 2008 survey in six NTER communities commissioned by the Central Land Council, local residents were almost evenly divided between those in favour (51%) and those opposed (46%) to income management.35
Significant changes to income management were introduced in 2010. Under the changes, a new scheme of income management was commenced across the Northern Territory—in urban, regional and remote areas—as a first step in a future rollout of income management to disadvantaged regions. The Racial Discrimination Act (RDA) applied in relation to the new scheme from its implementation in July 2010.
Other community-specific measures also had to change over the course of the NTER in response to criticism of the initial manner of implementation. The signage announcing the exclusion of alcohol and pornography from designated areas was erected with little consultation. Members of some communities felt that, in erecting the signs, the government had unjustly branded all residents.36 Many Indigenous people described the signs as a government ‘shame job’.37 In 2009 the Australian Government agreed to ‘work with the Northern Territory Government and Indigenous communities to look at ways to make the alcohol and prohibited materials road signs more acceptable to local people’.38
Compulsory five-year leases were not well explained to the affected people and ‘added to their distrust of the government’s intentions, exacerbated by the fact that the Commonwealth
32 G Shaw & P d’Abbs, op. cit. 33 ibid. 34 NTER Review Board, op. cit., p. 20. 35 Central Land Council, Reviewing the Northern Territory Emergency Response: Perspectives from six communities, 2008. 36 FaHCSIA, Report on the Northern Territory Emergency Response redesign consultations, p. 40 37 ibid., p. 34 38 Australian Government, Policy statement: Landmark reform to the welfare system, reinstatement of the Racial Discrimination Act and strengthening of the Northern Territory Emergency Response, Australian Government, 2009, p.8

Overview
12 Northern Territory Emergency Response: Evaluation Report 2011
had failed to pay rent’.39 The government has now agreed to pay rent, and appropriate rents have been determined by the Northern Territory Valuer-General.
The Child Health Check Initiative (CHCI) was initially announced as a compulsory check, including an examination for sexual abuse. A new policy of voluntary child health checks with no sexual abuse component was announced shortly after the initial announcement (see Chapter 6, Improving child and family health). No compulsory checks were undertaken, and no checks involved an examination for sexual abuse. However, the initial announcement, in combination with the actions described above, left some Indigenous people feeling frightened and angry.40
The NTER Review Board, convened to examine the NTER after its first year of operation, encountered intense hurt and anger so regularly that it felt compelled to advise the Minister for Indigenous Affairs that the hostility was a matter of serious concern even before it had finished the review.41
In its final report, the NTER Review Board made three overarching recommendations:
• The Australian and Northern Territory governments should recognise as a matter of urgent national significance the continuing need to address the unacceptably high level of disadvantage and social dislocation experienced by Aboriginal Australians living in remote communities throughout the Northern Territory.
• In addressing these needs both governments acknowledge the requirement to reset their relationship with Aboriginal people based on genuine consultation, engagement and partnership.
• Government actions affecting communities should respect Australia’s human rights obligations and conform with the Racial Discrimination Act.42
The Australian Government accepted these recommendations in 2008. It then released the Future directions for the NTER discussion paper setting out proposals for the measures affected by the Racial Discrimination Act as a starting point for further discussion and consultations.43
The final recommendation referred to the Northern Territory National Emergency Response Act 2007 (NTNER), which was enacted by the then Australian Government. The Act deemed some measures to be ‘special measures’ for the purposes of the Racial Discrimination Act 1975 (RDA), but also excluded the operation of Part II of the RDA as it affected the NTER, including the RDA’s provisions relating to special measures.
In its 2007 Social justice report, the Australian Human Rights Commission argued that:
The NT legislation is inappropriately classified as a special measure. It is not possible to support the government’s contention that all of the measures contained in the NT intervention legislation can be justified as special measures. It is therefore also not possible to say that in its current form the legislation is consistent with the RDA.44
39 NTER Review Board, op. cit., p. 40. 40 ibid., p. 37. 41 ibid., p. 8. 42 ibid., p. 12. 43 Australian Government, Future directions for the Northern Territory Emergency Response discussion paper, Australian Government, Canberra, 2009. 44 Australian Human Rights Commission (AHRC), Social justice report 2007, AHRC, 2008, p. 292.

Overview
Northern Territory Emergency Response: Evaluation Report 2011 13
The Australian Human Rights Commission noted that the intention of the NTER was not in contention and provided a 10-point action plan to modify the manner of implementation to accord with human rights obligations. This included rights to procedural fairness, reinstatement of the Racial Discrimination Act, ‘just terms’ compensation for leases, reinstatement of the Community Development Employment Projects (CDEP) program and a range of review and engagement mechanisms.45
The Racial Discrimination Act was reinstated in 2010. This and key related actions are outlined below,
• Legislation introduced in June 2009 gave income management clients a right of appeal through the Social Security Appeals Tribunal (see Chapter 9, Welfare reform and employment, for detail).
• In July 2010, income management was extended across the Northern Territory and was focused on the long-term unemployed, disengaged youth, people considered vulnerable by a Centrelink social worker, and people referred by a child protection worker. NTER residents could be exempted from income management following the 2010 changes. (See Chapter 9, Welfare reform and employment, for detail.)
• The government has agreed to pay compensation for the leased land and in October 2008 requested the Northern Territory Valuer-General to determine reasonable amounts of rent to be paid to the relevant Aboriginal landowners (see Chapter 10, Housing and land reform, for detail.)
• CDEP was reinstated in April 2008 following the change of government in 2007 (see Chapter 9, Welfare reform and employment, for detail).
• In June 2010, the Australian Parliament passed legislation to reinstate the operation of the Racial Discrimination Act from 31 December 2010. The legislation redesigned the NTER measures as either special measures or non-discriminatory measures under the Racial Discrimination Act.
The community-specific measures that attracted criticism were few within the context of the overall NTER; however, the manner of their initial announcement and implementation caused distress to some community members, and considerable additional work was needed to re-engage with communities and reposition the policies.
Most NTER measures did not encounter those problems. The provision of additional general government services was widely welcomed despite the short period for consultation. Resentment, where it did arise, attached to community-specific measures—especially those aimed at bringing about behaviour change in the targeted communities.
The requirement for different types of engagement has been recognised in the Engaging today—building tomorrow engagement guidelines and embedded into the National Partnership Agreement on Remote Service Delivery. Both documents include a requirement to be transparent regarding the role and level of Indigenous engagement along a continuum from information sharing to decision making.
Genuine cooperation in decision making is complicated by many factors. Government budget processes need to be considered. Officials who engage without a budget approval may raise expectations and then fail to secure funding, but obtaining approval before consulting may
45 ibid., p. 294.

Overview
14 Northern Territory Emergency Response: Evaluation Report 2011
constrain options and reduce the opportunity for genuine input. The desire to show quick results also creates an incentive to curtail consultations in favour of action.
These procedural constraints may partially explain why some service providers working in NTER communities argued that government had already made decisions prior to the consultations and that engagement occurred on ‘Canberra’ timetables.46
Distinguishing between different purposes and using fit-for-purpose engagement strategies remain challenging for government officials. The present engagement guidelines acknowledge that different types of engagement are needed; however, they do not give guidance on distinguishing between different types of measures, nor on how far along the budget approval process different policies should go before community engagement, nor on how long different types of engagement process should run.
A strategic approach to engagement that addresses these issues may improve outcomes without increasing the engagement burden on communities.
Individual measures A description of the measures in the Closing the Gap in the Northern Territory National Partnership Agreement (NTNPA)47and related agreements can be found in the ‘Implementation’ section of Chapter 2, Background. A detailed assessment of individual measures is in Part 2 of this report. This section provides a summary of the seven theme-based analyses in Part 2, and is followed by a cross-theme analysis.
Before summarising the theme based analyses of the NTER measures it is worth providing some of the key results from the Community Safety and Wellbeing Research Study (CSWRS). This survey of over 1,300 NTER residents was a key resource for this evaluation. An overview of the CSWRS and the Community Safety Service Provider Survey (CSSPS) is provided in Chapter 3.
A key focus of the NTER was community safety. Table 1.1 shows the results for a question in which NTER residents were asked to specify whether particular measures made a difference to safety in their community. There was strong support for safe houses, night patrols and the police. For example, just under 75 per cent of respondents reported that better night patrols had made either a big difference or some difference to community safety.
Table 1.1 Responses to ‘Do you think these things have made a difference to safety in your community?’ (%)
Variable A big
difference
A little bit of
difference No
difference Made it worse Don’t know
No response
Safe house (n = 777) 41.3 28.6 12.0 1.5 10.2 6.4 New grog rules 23.5 19.9 19.0 5.8 13.0 14.6 New rules for sexy pictures 8.8 7.7 18.0 11.1 47.6 6.8 Better night patrols 43.3 31.5 16.8 3.4 3.6 1.4 New police station (n = 350) 48.6 31.4 13.1 2.9 2.9 1.1 Additional police (n = 405) 32.3 25.7 25.4 5.9 8.9 1.9 More things for young people to do 39.6 25.8 24.1 2.7 6.6 1.3 Notes: n = 1,343 unless specified. Questions were asked only where additional services were provided (for example, only communities that gained a police station were asked about the impact of a new police station on safety).
46 See Chapter 4 for a full discussion 47 COAG, Closing the Gap in the Northern Territory National Partnership Agreement, COAG, Canberra, 2011.

Overview
Northern Territory Emergency Response: Evaluation Report 2011 15
Residents were also asked to categorise the nature of changes in five service areas. About half of the people interviewed strongly agreed that all services had improved; schools gained the most support (57.6%), followed by Centrelink (55.0%).
Table 1.2 Responses to ‘Can you tell us if these things have changed in your community in the past three years?’ (%)
Variable Strongly
agree Agree a bit Disagree Strongly disagree Don’t know
No response
School is better 57.6 25.7 8.3 3.6 3.8 0.9 Easier to get help from Centrelink 55.0 25.6 7.1 3.1 7.9 1.2 Easier to get help at the clinic 51.2 27.1 11.5 4.8 4.3 1.1 Easier to get help from the police 45.5 30.8 13.0 6.2 3.8 0.7 Store is better 46.1 30.1 13.7 6.5 2.7 1.0 n = 1,343
Coordination and engagement An analysis of the remote service delivery and ‘resetting the relationship’ measures of the NTNPA has been conducted by the Allen Consulting Group and is reported in Chapter 4, Coordination and engagement. This section summarises the findings of that analysis.
The measures analysed here are the NTER Operations Centre, Government Business Managers (GBMs), Indigenous Engagement Officers (IEOs), the Northern Territory Aboriginal Interpreter Service (NT AIS) and the Indigenous Leadership Program (ILP).
The perception of government engagement and coordination was affected by a range of parallel activities, especially the introduction of the National Partnership Agreement on Remote Service Delivery, the resulting regional operations centres and local implementation plans, and Northern Territory local government reform, which caused the dissolution of community councils.
NTER Operations Centre
The NTER Operations Centre operated between June 2007 and December 2009, after which NTER activities were coordinated by the Department of Families, Housing, Community Services and Indigenous Affairs (FaHCSIA). The centre was established to provide cross-agency coordination and decision-making. It was effective in breaking down silos and delivering programs quickly.
The Operations Centre brought decision-makers close to the action and overcame many logistical problems, enabling the rapid rollout of many programs. However, consultation was rushed and existing communication channels were often bypassed.
A number of informants interviewed by the Allen Consulting Group believe that the Operations Centre was closed before adequate alternative structures and mechanisms had been developed to support ongoing coordination. There is a perception that problems of siloing have re-emerged, and responsibility for decision-making and issue resolution has moved further away from local staff.48
Government Business Managers
GBMs are FaHCSIA employees who are tasked with coordinating all government activities within the communities they serve. Surveys of government and non-government service providers conducted by the Allen Consulting Group found that the GBM model, introduced at
48 See Chapter 4 for a full discussion.

Overview
16 Northern Territory Emergency Response: Evaluation Report 2011
the start of the NTER, is generally supported but that the GBMs’ role is not well understood.49 In a survey of 85 service providers, 77 per cent of respondents agreed that the GBM model is an appropriate structure to coordinate services in communities.
The Australian National Audit Office’s 2010 performance audit, Government Business Managers in Aboriginal communities under the NTER, noted that ‘the development of an engagement and reporting model that connects the issues of a single community to multiple agencies in the APS through the GBMs is also an appropriate design element.’50 The then acting Commonwealth Ombudsman, in a submission to the Senate Committee on Finance and Public Administration, also stated that ‘A model similar to the role Government Business Managers and Indigenous Engagement officers play in the delivery of joined up Indigenous programs should be further developed.’51
Survey respondents and informants believed that the effectiveness of GBMs varied, mainly according to the attitude and skills of the particular GBM. The role has worked best when the GBM has good relations with the IEO, makes good use of interpreters and proactively engages with communities and other agencies at all levels of government.52
Some informants interviewed by the Allen Consulting Group stated that they would like GBMs to lead community development, but the Australian Government is committed to GBMs remaining focused on government coordination. An alternative community development model is considered by some to be essential in developing local leadership and capacity.53
Indigenous Engagement Officers
IEOs are people who live in, or are accepted by, the communities they serve. They are funded by FaHCSIA and work to promote mutual understanding between government and the communities. In a survey conducted by the Allen Consulting Group the vast majority of government and non-government service providers supported the role of the IEOs. However, it has been difficult to recruit sufficient people.54
Some IEOs are experiencing tension between their professional and cultural roles, including being required to communicate difficult messages to family and close community members. When combined with a large workload, this can lead to ‘burnout’. Informant and survey responses indicated that several opportunities exist to improve the effectiveness of the IEO role, including careful monitoring of workload, regular support from interpreters (to allow IEOs to focus on their own tasks), and clearer guidance regarding expectations.55
The IEO role is highly valued and, with appropriate training in government processes and procedures, it is possible that the role of IEO may provide a pathway to becoming a GBM. IEOs indicate that they want training to build their leadership capacity and understanding of how government works.56
49 A full analysis of the survey of 85 government and other service providers by the Allen Consulting Group is in Chapter 4 of this report 50 ANAO, Government Business Managers in Aboriginal communities under the Northern Territory Emergency Response, Audit report no. 18, Canberra, 2010, p. 20. 51 Submission by the Acting Commonwealth Ombudsman, Ron Brent, on the reform of Australian Government Administration, Senate Committee on Finance and Public Administration, August 2010. 52 See Chapter 4 for a full discussion. 53 See Chapter 4 for a full discussion. 54 A full analysis of the survey of 85 government and other service providers by the Allen Consulting Group is in Chapter 4 of this report 55 See Chapter 4 for a full discussion. 56 See Chapter 4 for a full discussion.

Overview
Northern Territory Emergency Response: Evaluation Report 2011 17
Northern Territory Aboriginal Interpreter Service
The Northern Territory Aboriginal Interpreter Service provides interpreters on a fee-for-service basis. The service predates the NTER, but received additional funding to support engagement about the NTER. According to the Allen Consulting Group, there is evidence that the use of interpreters increased over the course of the NTER. However, in the survey of service providers, 80 per cent of respondents reported that interpreters were ‘used when required’ either never or only some of the time.57 Government agencies and other stakeholders could improve engagement with communities by better recognising the value of interpreters.
Indigenous Leadership Program
The Indigenous Leadership Program (ILP) was run by FaHCSIA to improve local leadership and engagement with government. The program, which commenced in 2004, provides training and development opportunities for Indigenous people. Participants, past and present, have assisted government with issues relating to their communities.
Early in the NTER, 300 current and former ILP participants were invited to an engagement workshop about the NTER. In July 2008, ILP participants prepared a brief for the NTER Operations Centre leadership on how to improve community engagement and participation in the NTER redesign. In 2009, ILP participants provided support for the NTER redesign process.58
Community visits conducted by Allen Consulting Group identified a concern amongst many service providers that the leadership skills of young people in communities were not being developed. Lack in appropriate programs for this age bracket were considered as having a longer term impact on the development of community leadership capacity
Outcomes—coordination and engagement
In a survey of service providers59, 50 per cent of respondents reported that overall coordination approaches were effective in delivering initiatives as part of the NTER some of the time, and 13 per cent reported that coordination was effective most or all of the time. Respondents noted significant communication challenges: just over half reported that communication practices across agencies are never effective. A significant proportion of respondents also suggested that local cultural traditions were not taken into account most of the time.
CSSPS respondents were asked about their satisfaction with how well cross-agency cooperation contributed to community safety. There were mixed views amongst remote community respondents: nearly one-third (27%) said that they were ‘neither satisfied nor dissatisfied’, and similar proportions said that they were ‘satisfied’ (26%) or ‘dissatisfied’ (27%).60
Earlier evaluations made the level of distress over the lack of consultation abundantly clear. However, this evaluation, and subsequent evaluations as recently as 201161, also indicated
57 A full analysis of the survey of 85 government and other service providers by the Allen Consulting Group is in Chapter 4 of this report. 58 FaHCSIA, Submission of background material to the NTER Review Board, FaHCSIA, Canberra, 2008, p. 36. 59 See the Allen Consulting Group survey of 85 government and other service providers. A full analysis of data gathered by the Allen Consulting Group as part of this evaluation is contained in Chapter 4 of this report. 60 J Putt, S Middleton, J Yamaguchi & K Turner, Community safety: Results from the survey of service providers in the Northern Territory, unpublished draft report, FaHCSIA, Canberra, 2011. 61 A full analysis is in Chapter 4 of this report.

Overview
18 Northern Territory Emergency Response: Evaluation Report 2011
that communities were feeling overburdened by the number of government officials repeatedly requiring their time.
The volume of visits to communities during the NTER was high: analysis of the Visiting Officer Notification system shows that 45,000 personnel visitations were made during the period from August 2007 to August 2011.62 The NTER Review Board found that communities struggle with the number of visits.63
Many communities feel they are overconsulted. Informants interviewed by the Allen Consulting Group identified opportunities for engagement activities with communities to be combined and rationalised, rather than held as separate forums. Informants and survey respondents also suggested that the Visiting Officer Notification system could be used as a tool to reduce fragmentation and minimise the engagement burden in communities.64
Promoting law and order Improving safety and establishing the stable living conditions needed for personal and community progress was a major objective of the NTER.
A full analysis of the law and order measures of the NTNPA was conducted by the Australian Institute of Criminology and is reported in Chapter 5, Promoting law and order. This section summarises the findings.
NTER measures to improve safety included greater police presence, alcohol restrictions, pornography restrictions, additional funding for more night patrols, extension of the Substance Abuse Intelligence Desk, and more funding for legal and interpreter services to improve Indigenous people’s access to justice.
The NTER measures were implemented at the same time as the Northern Territory Government was running the Violent Crime Reduction Strategy, the Property Crime Reduction Strategy and the Social Order Strategy. All those measures may have affected actual and recorded levels of criminal offending, as they will have influenced police priorities and activities.
Additional policing
Through the NTER, a resident police presence was established in 18 communities for the first time. Four facilities for police to stay overnight were constructed in communities without a police station, and 62 additional police (compared with pre-NTER numbers) were present throughout 2010.65 These measures sought to align policing levels more closely with community needs.66
Community feedback indicates that people welcome the additional police presence.67 A study conducted by the Allen Consulting Group recommended more female and Indigenous police officers.68 The study also indicated that police should engage respectfully with the community,
62 FaHCSIA, unpublished data, FaHCSIA administrative records on the Visiting Officer Notification, provided on request for this review, 23 August 2011. More than one person can be included on one VON request. The total of 45,000 visitations to NTER communities and town camps came from 20,000 VON requests. 63 NTER Review Board, op. cit., p. 44. 64 A full analysis is in Chapter 4 of this report. 65 FaHCSIA, Closing the gap in the Northern Territory: Monitoring report, January to June 2010, FaHCSIA, Canberra, 2010; FaHCSIA, Closing the gap in the Northern Territory: Monitoring report, July to December 2010, Part 1, FaHCSIA, Canberra, 2011, p. 18. 66 Chapter 5 of this report notes that some NTER communities had no police presence, while other similarly sized communities did. 67 G Shaw & P d’Abbs, op. cit. 68 Allen Consulting Group, Independent review of policing in remote Indigenous communities in the Northern Territory: Policing further into remote communities, Allen Consulting Group, Melbourne, 2010.

Overview
Northern Territory Emergency Response: Evaluation Report 2011 19
especially with young people, work closely with night patrols and improve availability at peak demand periods.69
Alcohol restrictions
The NTER brought in a range of measures to reduce alcohol misuse, including uniform alcohol restrictions in NTER communities. Changes to the Northern Territory National Emergency Response Act 2007 (Cwth) and the Northern Territory Liquor Act created new offences for using or supplying alcohol in NTER communities and a requirement to supply photo identification and an address when buying takeaway alcohol. Signage was erected outside communities, setting out the restrictions and the penalties.70
Most communities were already dry or had alcohol management arrangements in place. The replacement of existing alcohol management arrangements without real community consultation has reduced ‘ownership’, and there is some feeling that the problem has simply been relocated.71
The uniform restrictions are being supported by the progressive introduction of local alcohol management plans (AMPs) developed in conjunction with the communities. By the end of June 2011, AMPs were being developed and negotiated in 25 NTER communities as well as some town camps, AMPs had been implemented in five large Northern Territory centres and liquor supply plans were in place in Groote Eylandt and the Gove Peninsula.72
This practice accords with evidence that alcohol restrictions work best when they are developed and owned by the people subject to them.73 The experience on Groote Eylandt demonstrates how a community owned and supported alcohol management arrangement can foster a happier, safer community with less alcohol-related offending.
It is unclear whether the new arrangements for alcohol restrictions are better than the old ones in their design; however, there is clear evidence that they are being more consistently enforced and that levels of alcohol-related crime were high before the NTER.
There appears to be less full-strength alcohol and cask wine being procured. Most people in communities also believe that their communities are safer. Additional policing and income management, as well as new alcohol management arrangements implemented in Alice Springs, Katherine, Tennant Creek and Nhulunbuy, separate to the NTER, are likely to have contributed to these outcomes.74
The NTER Review Board noted that measures to control the supply of alcohol work best when supported by measures to reduce demand and services to reduce harm.75
Pornography restrictions
Measures to reduce the presence of pornography in NTER communities included restrictions on some types of material, signage to communicate the restrictions and an audit of publicly
69 ibid. 70 Although not noted in Chapter 5, concurrent activities undertaken by the Northern Territory Government, such as the banned drinkers register, may also have affected alcohol use in the NTER communities. 71 Tangentyere Council, Intervention: Experiences and opinions of Alice Springs town camp residents of the Northern Territory Emergency Response, 2008. 72 FaHCSIA, Closing the gap in the Northern Territory: Monitoring report, January to June 2011, Part 1, FaHCSIA, Canberra, p. 19. 73 D Gray & S Saggers, Indigenous Australian alcohol and other drug issues: Research from the National Drug Institute, National Drug Institute, Curtin University of Technology, Perth, 2008. 74 Northern Territory Department of Justice, Northern Territory wholesale alcohol supply for the period 2002 to 2009. These attributions have not been independently examined or tested for this review. 75 NTER Review Board, op. cit., p. 24

Overview
20 Northern Territory Emergency Response: Evaluation Report 2011
funded computers to ensure that they were not used to access sexually explicit and other restricted material.
The signage initially caused much offence and Australian Government has agreed to look at ways to make the signs more acceptable to local people.76
The Australian Crime Commission provides a summary confidential report of each audit to FaHCSIA.77 The reports indicate that there may have been some accessing of prohibited material using publicly funded computers. Levels of response and compliance with the audit have decreased possibly in response to a lack of follow-up.
The issue of access to ‘sexy pictures’ did not rate highly as a concern amongst communities when people were asked to rate the severity of this problem. Many people had no opinion about pornography restrictions.78 There is some evidence of active enforcement of pornography restrictions but the number of convictions is still very small79 and there is no evidence of behaviour change, which would be difficult to detect.
Night patrols
Night patrols are community operated and funded by the Australian Attorney-General’s Department. The aim is to prevent antisocial and violent behaviour through engagement in community safety plans and by intervening to calm situations, transport people to places of safety and provide information and referrals. Patrols operated in 23 communities before the NTER, and by the end of 2009 were operating in 80 locations, including 72 of the 73 NTER communities80 and these continue as of 30 June 2011.
Night patrols enjoy stronger community support than any other community safety measure.81 Forty-three per cent of respondents to the CSWRS felt that night patrols had made a big difference to safety in their community. The patrols assisted almost 60,000 people (noting that people can be assisted on multiple occasions) from January to June 201182, indicating a significant need for this service. Night patrols are most effective when they work closely with the police.
Substance Abuse Intelligence Desks
Substance Abuse Intelligence Desks (SAIDs) collate intelligence and coordinate police activity to reduce trafficking of illicit drugs. SAIDs have developed good working relationships with other law enforcement bodies. The main achievements of the SAIDs relate to cannabis and kava. They have also assisted in detecting and deterring criminal networks.83
The measure has the support of its stakeholders.
Access to justice
An additional $2.5 million has been directed to the Northern Territory Legal Aid Commission, Aboriginal and Torres Strait Islander Legal Services and community legal centres to ensure that Indigenous people were not denied access to justice for reasons of language or culture.
76 Australian Government, Policy statement: Landmark reform to the welfare system, reinstatement of the Racial Discrimination Act and strengthening of the Northern Territory Emergency Response, Australian Government, p.8 77 ibid. 78 G Shaw & P d’Abbs, op. cit. 79 ABS, Criminal courts, Australia 2009–10, cat. no. 4513.0, ABS, Canberra, 2011. 80 FaHCSIA, Closing the gap in the Northern Territory: Monitoring report, July–December 2009, Part 2, p. 60. 81 G Shaw & P d’Abbs, op. cit. 82 FaHCSIA, Closing the gap in the Northern Territory: Monitoring report, January-June 2011, Part 1, FaHCSIA, Canberra, 2011, p. 18. 83 J Putt, Review of the Substance Abuse Intelligence Desk and Dog Operations Units, report, FaHCSIA, Canberra, 2011

Overview
Northern Territory Emergency Response: Evaluation Report 2011 21
There has been a substantial increase in legal services provided during the NTER; however, the three program areas continue to report high levels of unmet need, particularly in remote communities.84
The NTER also provided additional funding for the Northern Territory Aboriginal Interpreter Service, which assists people to understand and feel more comfortable with legal proceedings, as well as a range of other services and benefits.
Outcomes—law and order
Community residents believe that the overall result of the NTER law and order measures has been positive: most people believe that there is less trouble, less family fighting and less drinking than three years ago. According to the CSWRS, 92 per cent of people in small communities (fewer than 350 people), 87 per cent of people in medium-sized communities (350–699 people), 73 per cent in large communities (700–1,099 people) and 63 per cent in very large communities (1,100 plus) report that their community is safer than it was three years ago.85
Since the start of the NTER, there has been a 56 per cent increase in the rate of alcohol-related offences and a 26 per cent increase in non alcohol-related offences. Much of the change in alcohol-related offences has been in traffic offences and illegal alcohol consumption, indicating a greater enforcement of alcohol regulations. Levels of recorded offending have increased the most where a resident police presence was established for the first time. The number of alcohol-related offences dropped markedly in 2010 after peaking in the last six months of 2009. Figures for 2011 indicate a stabilisation in the number of recorded violent incidents.
More convictions for assault were recorded, but with a slightly lesser increase in rates of incarceration for offences committed in NTER communities. Across the Northern Territory as a whole, there was no statistically significant increase in assault-related hospitalisations.86
Recorded crime statistics are in part a product of police activity and community willingness to report offending and victimisation, as well as actual behaviour. The number of violent offences experienced by people can be much higher than the official data indicate, due to an unwillingness to report offences to police.87 The large jump in reported offences that coincided with the increase in policing is probably due to increased police activity and public reporting. This underscores the importance of respectful engagement by police to build trust.
Assessments of changes to underlying crime rates will take many years as the additional police activity and trust levels become normalised; however, many people consider that their communities are now safer and that it is now easier to get help from the police.88
Improving child and family health A full analysis of the NTER ‘Improving child and family health’ measures has been conducted by the Australian Institute of Health and Welfare and is reported in Chapter 6. The findings are summarised in this section.
84 See Chapter 5 for details. 85 G Shaw & P d’Abbs, op. cit. 86 Although not noted Chapter 5, this may indicate that police are now able to act in relation to less serious cases. 87 M Willis, Non-disclosure of violence in Australian Indigenous communities, Trends and issues in crime and criminal justice no. 405, Australian Institute of Criminology, Canberra, 2011. 88 G Shaw & P d’Abbs, op. cit.

Overview
22 Northern Territory Emergency Response: Evaluation Report 2011
Health has been improving for Indigenous people in the Northern Territory since before the beginning of the NTER. Life expectancy has increased since 196789, but at 61.5 years for males and 69.2 years for females (in 2005–07) is still lower than for Indigenous people in the other states for which data are available. Indigenous infants in the Northern Territory are over three times as likely as other infants to die before reaching their first birthday. From 2006 to 2008, the hospitalisation rate for Indigenous people of the Northern Territory was six times the rate for other people in the Territory, and the incidence rate of end-stage renal disease was 26 times the rate for non-Indigenous Australians.90
The government’s primary funding vehicle for addressing poor health amongst Indigenous people is the National Partnership on Closing the Gap in Indigenous Health Outcomes. Most measures included in the NTNPA also have some effect on Indigenous health, either by addressing the social determinants of health (housing, education, employment, empowerment, safety) or by improving health services.
Health services analysed here include the Child Health Check Initiative, the Expanding Health Service Delivery Initiative, and expanded alcohol and other drug services.
Child Health Check Initiative
The Child Health Check Initiative (CHCI) provided medical check-ups for children up to 15 years old. It was initially announced as a compulsory check with a focus on detecting sexual abuse, but was changed to a voluntary general health check within days. No compulsory checks or checks for sexual abuse were conducted under this measure.
The initial check-ups were followed by a program of medical treatments for conditions identified in the checks and a series of initial and exit chart reviews to monitor the delivery of referred services and changes in children’s health. Referred services included primary care; dental care; hearing treatment; paediatric services; ear, nose and throat treatment; optometry; and a range of other specialist care.
The CHCI closed as a discrete program in June 2009, by which time 10,605 children had at least one check-up (approximately 65 per cent of children). Nearly all children in smaller communities received a check.91 The main reasons for children not having a check were that they were absent from the community, that guardians were ashamed or frightened, or decisions by older children not to have a check.92
A health condition or risk factor was identified for 97 per cent of children checked. Ninety-nine per cent of those children got some form of management during the check. Seventy per cent of children received at least one referral for follow-up treatment. Staff shortages and infrastructure limited the number of children who could receive the referred services.93
Health checks were generally delivered by interstate teams working alongside local service providers. Lack of consultation prior to establishing these arrangements caused friction with providers and possibly with Indigenous people.94 In some communities, the local Aboriginal
89 T Wilson, J.R. Condon & T. Barnes, ‘Northern Territory Indigenous life expectancy improvements, 1967–2004’, Australian and New Zealand Journal of Public Health, vol. 31, no. 2, 2007. 90 Analysis of published and unpublished data in Chapter 6. 91 Allen and Clarke, Evaluation of the Child Health Check Initiative and the Expanding Health Service Delivery Initiative: Final report, Department of Health and Ageing, Canberra, 2011, pp. 52–53. 92 ibid., pp. 56–57. 93 ibid., p. 78. 94 Australian Indigenous Doctors’ Association and Centre for Health Equity Training, Research and Evaluation, UNSW, Health impact assessment of the Northern Territory Emergency Response, Australian Indigenous Doctors’ Association, Canberra, 2010, p. 14.

Overview
Northern Territory Emergency Response: Evaluation Report 2011 23
community controlled health organisation was funded to undertake the checks and the follow-up primary care.
In addition to providing additional services to redress some of the substantial unmet need, the CHCI provided data that could be used to prioritise future service delivery.
Expanding Health Service Delivery Initiative
The Expanding Health Service Delivery Initiative (EHSDI), a program to expand and reform primary health care in remote Aboriginal communities in the Northern Territory, was announced in the 2008 federal budget. The EHSDI includes funding for 251 additional full-time equivalent staff; capital for information technology, clinical infrastructure and workforce accommodation; and measures to address workforce shortages. Funding is confirmed to July 2012.
The EHSDI is being implemented through a partnership between the Australian Government, the Northern Territory Government and the Aboriginal Medical Services Alliance of the Northern Territory (AMSANT). It aims to deliver more and better primary health care using a regional approach under Aboriginal community control. The expansion and reform of health services in the Northern Territory is a significant and complex program of change and is not without challenges and risks.95
The considerable unmet need revealed by the CHCI indicates a requirement for ongoing funding to increase medical services. Many staff positions funded through the EHSDI were not filled until 2009, and it is too early to form definite conclusions about the effectiveness of the initiative.
The existing governance framework provided by the Northern Territory Aboriginal Health Forum has enabled the sudden increase in resourcing under the EHSDI to be managed within existing systems. The strategic partnership between the Australian Government, the Northern Territory Government and the Aboriginal community controlled sector, embodied in the Northern Territory Aboriginal Health Forum, is well positioned to provide the leadership needed to continue to implement the program of primary health care reform and expansion.96
The Remote Area Health Corps provided 30 full-time equivalent staff through a series of short-term (usually two- to four-week) deployments. Staff shortages continue to be a major constraint in delivering the EHSDI, especially shortages of Aboriginal health workers and Aboriginal staff for clinical and administrative roles.97
Alcohol and other drug services
Early planning for the NTER predicted an increased demand for alcohol treatment services arising from the changed alcohol management arrangements. Demand did not follow the expected pattern, as many clients chose to ‘dry out’ in their communities rather than use residential treatment options.98
The capacity for outreach services and hospital and residential services was increased under this measure, despite difficulties in attracting staff. Some of the expansions were short-lived
95 Allen and Clarke, op. cit. 96 ibid., p. 181. 97 ibid., pp. 163. 98 Origin Consulting and Bowchung Consulting, Review of the alcohol and other drug service components of the NTER: Final report, 25 May 2010

Overview
24 Northern Territory Emergency Response: Evaluation Report 2011
due to the short-term funding. However, the program strengthened alcohol and other drug (AOD) treatment capacity through staff education and the creation of additional positions.99
There has been a marked increase in episodes of AOD treatment provided to children between the ages of 10 and 19 since 2006–07. This may reflect the expansion of AOD services.100
There is still a need for additional AOD services and staff shortages are a regular problem. The sector is developing more effective service models to match client needs and preferences.101
Outcomes—improving child and family health
General health measures for Indigenous children aged up to four years in remote communities in the Northern Territory showed substantial improvement between 2004 and 2010. Over that period, there was a 25 per cent decline in anaemia rates, a 26 per cent decline in the proportion of children who are underweight, a 26 per cent decline in the proportion of children who are subject to wasting and a 22 per cent decline in the proportion of children who are stunted. This reflects a much wider set of factors than the NTER.
Some improvements can be attributed to the combination of the additional services provided under the NTER and the Northern Territory Government’s efforts to address the need identified through those services. For children who received more than one health check, comparisons of their health status between checks indicate that outcomes were generally good. Of the children who had multiple checks, all those with trachoma and ringworm, 93 per cent of those suffering from scabies, 91 per cent of those with skin sores and 74 per cent who were suffering from anaemia had recovered by the time of the later check.
The rate of hospitalisation of Indigenous children from remote and very remote areas of the NT has increased amongst children aged up to 14 years of age from 524 per 1,000 in 2006–07 to 595 per 1,000 in 2009–10.102 This increase was mainly due to increased hospitalisations for diseases of the ear103 and is most likely as a result of CHCI referrals and increased effort by the Northern Territory Government.
Analysis of audiology and ear, nose and throat services provided to children indicates that there have been some improvements in children’s hearing and a notable decline in middle ear conditions.
Referrals arising from the child health checks highlighted constraints on the health system. The shortage of health professionals and Indigenous health professionals in particular remains a considerable challenge.
Supporting families (including child protection) Indigenous people in the NTER communities accord a high priority to children. When asked to identify the most pressing problems in their communities, the top two problems they identified were about children.104 However, Aboriginal children are more likely to be exposed to multiple life stresses and cumulative risks at the family, community and societal level.
99 ibid., pp. 6–7. 100 AIHW analysis of Alcohol and Other Drug Treatment Services National Minimum Data Set. See Chapter 6. 101 Origin Consulting and Bowchung Consulting, op. cit. 102 AIHW analyses of National Hospital Morbidity Database. See Chapter 6 for details. 103 AIHW analyses of National Hospital Morbidity Database. See Chapter 6 for details. 104 G Shaw & P d’Abbs, op. cit.

Overview
Northern Territory Emergency Response: Evaluation Report 2011 25
A full analysis of the child protection and family support measures has been conducted by the Australian Institute of Family Studies and is reported in Chapter 7, Supporting families. This section summarises the findings.
Many initiatives analysed in other parts of this evaluation support the safety of families and children through improving their social conditions. Measures analysed here include children’s services and family support, Northern Territory child protection services, Remote Aboriginal and Family Community Workers, safe places for families escaping family violence, and youth alcohol diversionary services.
Child‐at‐risk workers for Northern Territory child protection services
A Mobile Child Protection Team (MCPT) was implemented under the NTER Family Support package to investigate and assess concerns relating to children in remote and regional Northern Territory communities who were reported to be at risk. In late 2010 the Australian Government announced a range of measures that included an additional 15 mobile child protection workers to ensure that the needs of children in vulnerable families are met.105 The MCPT workers play a key role in assisting staff in central offices with workload and case management issues by accessing local staff with cultural and community knowledge, while building stakeholder relationships and services.
An evaluation conducted by the Menzies School of Health Research106 described the MCPT as having had a positive impact on Northern Territory child protection issues by providing relief for regional offices, particularly in relation to reducing the backlog of case investigations. The evaluators described initial uncertainties about formal policy and procedural guidelines that may have contributed to high levels of staff turnover, but noted that new recruiting procedures are expected to reduce turnover.
Remote Aboriginal and Family Community Workers
Fourteen Remote Aboriginal and Family Community Workers (RAFCWs) were based in 13 priority communities under the NTER.107 These workers provided outreach services to an additional 20 communities as part of the priority community service model. RAFCWs provide family support and community education in areas relevant to child protection. They are playing an important role in preventing some children from needlessly entering the statutory child protection system. The Evaluation of the Family Support package: A community perspective report concluded that RAFCWs need to be able to concentrate on prevention and not be drawn into statutory child protection work.108
An independent evaluation of the RAFCW found anecdotal evidence to suggest that family functioning, the health and wellbeing of families and communities, and attitudes and perceptions about community safety and child protection were being addressed by the
105 FaHCSIA, Stronger futures in the Northern Territory: Discussion paper, FaHCSIA, Canberra, June 2011, p. 5. 106 K McGuinness, F Arney & M Westby, Mobile Child Protection Team final evaluation report, April 2011, Menzies Centre, Darwin, 2011, unpublished. 107 The initial investment was for RAFCWs in 13 communities. In late 2010, in response to the findings of the Board of Inquiry into the Child Protection System in the Northern Territory, the Australian Government announced a range of measures that included an additional 22 RAFCWs. 108 C Holmes, L Fasoli & P Stephenson, Evaluation of the Family Support Package: A community perspective, Research Division, Batchelor Institute of Indigenous Tertiary Education, September 2011, unpublished, p. 110.

Overview
26 Northern Territory Emergency Response: Evaluation Report 2011
program. For the most part, RAFCWs were making a significant contribution to supporting at-risk families.109
Evaluators identified issues concerning clarity about RAFCW roles, duties and approaches, and a need for training aligned with nationally accredited certificate programs for workers to facilitate career advancement. The evaluators, team leaders and RAFCWs expressed frustration about the lack of available infrastructure. There are concerns about the safety of some staff under the RAFCW initiative because of the distances they are required to travel to see clients and the remote nature of their work.110
The initiative has improved community perceptions of the Northern Territory child protection system.111
Safe places for families escaping family violence
The NTER Safe Places initiative involved the retrofitting (or construction, in one community) of 20 remote and two urban safe houses. Women’s Safe Houses aim to provide crisis accommodation and increase the safety options for women and their children. In addition, they provide a range of programs for women and their children for safety, health and wellbeing.112
Men’s Places aim to provide short-term crisis support and accommodation for men wishing to prevent the escalation of family violence. Men’s Places also provide an avenue for men seeking support in managing violent behaviour.
There are 22 Safe Places in 15 remote communities, as well as Darwin and Alice Springs. There are 12 Safe Places for remote community women and their accompanying children escaping family violence. Eleven Women’s Safe Places or Women’s Safe Houses have been operating since 2009 and one since 2010. In addition to the Women’s Safe Places, there are also 8 Men’s Places that have been established through the FSP for men who seek support in managing violent behaviour.113 For the period January to June 2011, on average, 73 positions for Safe Places in remote areas were filled (72 of them local Indigenous people).114 In the period April 2009 to June 2011 some 1,453 clients have accessed the Women’s Safe Houses; these clients include 802 women and 651 accompanying children.115
A 2009 evaluation of the Safe Places initiative found that they were becoming an important asset to communities for employment, for supporting community-led initiatives, for raising the profile of violence as a community issue, for linking service providers and for reducing the risk to ‘strong women’ in the community who provide help to those who are in need due to domestic violence.116
109 E Williams et al., ‘I’m here to support you’: updated informative evaluation of the Remote Aboriginal Family and Community Programme, Social Partnerships in Learning Research Consortium Evaluation Unit, Charles Darwin University, Darwin, 2010, unpublished. The evaluation used multiple methods, including document review, field visits to a sample of remote communities, and interviews with internal and external stakeholders. 110 ibid. 111 ibid. 112 C Holmes, L Fasoli & P Stephenson, op. cit. 113 C. Holmes, L. Fasoli & P. Stephenson, Evaluation of the Family Support Package: A community perspective, Bachelor Institute of Indigenous Tertiary Education - Research Division, unpublished report prepared for NTDCF, Northern Territory, 2011, p. 1-2 114 FaHCSIA, Closing the gap in the Northern Territory monitoring report, January to June 2011, Part 2, FaHCISA, Canberra, p. 72. 115 Ibid. p. 72 116 A Arnott, J Guenther & E Cummings, Final evaluation report of safe places, Social Partnerships in Learning Research Consortium, Charles Darwin University, Darwin, 2009, unpublished.
Overview
Northern Territory Emergency Response: Evaluation Report 2011 27
The evaluation highlighted a lack of supervision and training for Indigenous staff. Staff often lack telephone access and transport, which limits their capacity to provide service.117
According to the Evaluation of the Family Support package: A community perspective report, the evaluators found that the very existence of the Women’s Safe House was perceived to be an important deterrent to violence. Its presence in the community was symbolic of a growing culture that regarded domestic violence as unacceptable and was also a reminder that women had options available to them to escape violence.118
A limited review of the Men’s Places measure identified staff shortages and the lack of a clear service model and practices to guide implementation.119 Evaluation of the Family Support package highlighted the low usage of the Men’s Places.120 The Northern Territory Government is developing a service model with the key criterion of consulting with local men on what they would like to see happen at the Men’s Place.121
Youth alcohol diversionary services
There has been $8.8 million directed to the Youth Alcohol Diversion initiative to fund youth-focused equipment, infrastructure and activities.
URBIS conducted an independent evaluation of the initiative in 2010122 which found that that the activities were largely implemented as intended and were enjoyed by participants. The projects enhanced the capacity of Indigenous youth service providers and provided infrastructure benefits beyond the life of the program. Benefits were noted in increased attendance at school and at some holiday programs, and reductions in vandalism and antisocial behaviour.
The review highlighted the difficulties of implementing youth programs in remote communities, which is further compounded by short-term funding. One finding related to inadequacy of program planning and implementation combined with poor interagency coordination. For example, some infrastructure and activity projects did not complement each other and there was a lack of consultation with communities and stakeholders.
Outcomes—supporting families
The total number of child sexual assault convictions for the NTER communities over four years from 1 July 2007 to 1 July 2011 was 44, compared to a total of 25 convictions in the four years prior to the commencement of the NTER (1 July 2003 to 30 June 2007).
Nationally, most headline statutory child protection indicators have increased over the last decade.123 Data from the Northern Territory Department of Children and Families show that from 2006–07 to 2010–11 the number of child protection substantiations for Indigenous children in the Northern Territory grew by 136.6 per cent. The vast majority of the increase (81.7%) occurred outside the Greater Darwin area, implying that much of it occurred in the NTER communities.
117 E Williams et al., op. cit. 118 C Holmes, L Fasoli & P Stephenson, op. cit. p. 34. 119 C. Holmes, L. Fasoli & P. Stephenson, op. cit., p. 5 120 ibid., p. 5. 121 ibid. 122 J. Ohlin, S. Ross, A. Wilczynski, R. Pigott, J. Connell & K. Reed-Gilbert, Review of certain FaHCSIA-funded youth services, URBIS for FaHCSIA, Canberra, 2010. 123 L. Bromfield & P. Holzer, NCPASS comparability of child protection data: Project report, National Child Protection Clearinghouse, AIFS, Melbourne, 2008

Overview
28 Northern Territory Emergency Response: Evaluation Report 2011
Part of the increase in numbers will be attributable to population increase. Substantiation rates remove that factor. From 2006–07 to 2009–10, the rates of substantiated child maltreatment of Indigenous children in the Northern Territory more than doubled.124 In 2006–07, the rate was 16.8 per 1,000, rising to 33.5 per 1,000 in 2009–10.
Of the total increase in the number of child protection substantiations from 2006–07 to 2010–11 for Indigenous children in the Northern Territory, the majority (73.7%) were for ‘neglect’ (based on data from the Northern Territory Department of Children and Families). While the initial public focus of the NTER was on child sexual abuse, the child protection data clearly show that neglect is a much larger issue.
Even after those increases, state child protection agency data indicate that the child protection substantiation rate for Indigenous children in the Northern Territory is still below the national average for all Indigenous children. Given the poor socioeconomic status of NTER communities and the rapid rise in the rate of substantiations in response to an increase in child protection resources, the figures probably substantially under-represent the problem. The increase in the rate of substantiations probably reflects increased capacity in the sector.
Four out of the five Northern Territory remote communities that participated in the Evaluation of the family support package study perceived that levels of family violence and child abuse had improved over recent years.125
There was an 84 per cent increase in domestic violence incidents recorded by police in the NTER communities between 2007–08 and 2010–11.126 This was probably due to increased police presence, coupled with legislative changes that affect the recording and reporting of domestic violence (including 2009 legislation which introduced mandatory reporting of domestic violence).
Enhancing education A full analysis of the NTER education and early childhood measures has been conducted by the Australian Council for Educational Research and is reported in Chapter 8, Enhancing education. This section summarises the findings.
Indigenous children in the Northern Territory have much higher rates of vulnerability than non-Indigenous children, as measured by the Australian Early Development Index. Fifty-nine per cent of children in the NTER communities were developmentally vulnerable in two or more domains in 2010, compared with 23 per cent of children in the Northern Territory overall in 2009.127 Vulnerable children are more likely to have problems making the transition to school.
NTER measures to improve educational outcomes for children included a package to improve the quality of teaching, enhanced literacy programs, school infrastructure programs, the School Nutrition Program (SNP) and programs to improve child services and family support.
At the same time as the NTER was rolling out, the Northern Territory Government was already changing its policies, curriculums and investment in education. It is not possible to separate the contribution of the NTER measures from the changes occurring across the Northern Territory education system as a whole.
124 Productivity Commission, op. cit. 125 C Holmes, L Fasoli & P Stephenson, op. cit., p. 116. 126 FaHCSIA, Closing the gap in the Northern Territory monitoring report, January to June 2011, Part 2, op. cit, p. 65 127 See Chapter 8, Enhancing Education.

Overview
Northern Territory Emergency Response: Evaluation Report 2011 29
Improving the quality of teaching
Students at schools in remote communities often have English as a second language,128 have a higher than normal incidence of hearing impairment and come from families that have fewer years of formal education. Due to poor housing and conditions, and the limited availability of local qualified people, teachers recruited to teach in these schools are often young and inexperienced. They rarely stay for long periods.129
In order to improve the numbers, training and retention of teachers at schools in the NTER communities, the NTER funded and deployed an extra 192 teachers, funded professional development for all levels of teaching staff and funded the construction of additional teacher housing. Professional development for remote Indigenous educators included scholarships, on-the-job training, workshops and mentoring.
The teacher housing shortage in NTER communities was reduced from about 90–100 houses at the start of the NTER to 26 dwellings by the end of 2010 as a result of Australian and Northern Territory government funding.130
It is too early to tell whether teacher turnover has been reduced as a result of these measures.
Enhancing literacy
NTER-funded specialist teams worked with teaching staff to develop whole-of-school approaches to literacy and numeracy, the management of classrooms and behaviour, and the teaching of English as a second language.
Literacy programs have been changed since the start of the NTER and are now being aligned with the Northern Territory Department of Education and Training’s (NT DET) strategic directions for the long term. Success of the new measures is likely to depend on continuity of program delivery according to reporting by the NT DET. A combination of good school planning and increased employment of local Indigenous teaching staff, who are expected to stay in communities for longer, is expected to promote the effectiveness of the revised literacy programs.
School infrastructure program
At the start of the NTER, average student attendance exceeded the available classrooms in at least 10 schools. Facilities were often overcrowded, were inadequately maintained and had poor temperature control. The NTER invested an additional $10.3 million to construct 20 new classrooms, in addition to the $97 million invested under Building the Education Revolution for classrooms in these communities.
In the CSWRS, 57.6 per cent of respondents strongly agreed that the school in their community is better than it was three years ago.
School Nutrition Program
The School Nutrition Program provides breakfast and lunch to students, paid for by the parents and provided by the school. It was established in 68 schools servicing the 73 NTER communities by July 2008 and was primarily intended to increase student attendance. There
128 According to the Productivity Commission, English is the second, third or fourth language for about 70 per cent of Indigenous students. 129 Commonwealth Grants Commission, General revenue grant relativities: Northern Territory workplace discussions, 2008, <http://www.cgc.gov.au/__data/assets/file/0012/20451/NT_-_2010_Review_-_brief_for_State_visit.pdf> (accessed 12 September 2011). 130 Northern Territory Department of Education and Training, 200 Additional Teachers Measure: 2010 annual report, Attachment 1, Northern Territory Department of Education and Training, Darwin, 2010.

Overview
30 Northern Territory Emergency Response: Evaluation Report 2011
has not been an increase in attendance. However, secondary goals of the program, such as better student attentiveness and greater community and parental engagement with the school, are being achieved to some degree and the program has a reasonable level of support within NTER communities. A DEEWR survey of parents, providers and school principals found that over 80 per cent of respondents thought the program had a positive impact on student behaviour.131
More than 160 Indigenous people are employed in the School Nutrition Program across the communities.
Early education and family support services
The market in most NTER communities is too small to support private-sector early childhood services. Instead, communities generally rely on non-mainstream services funded under the Australian Government’s Budget Based Funded services, which are a component of the broader Child Care Services Support Program.
Under the NTER, the government provided funding to construct and operate nine new crèches and to upgrade the facilities of 13 existing Budget Based Funded crèches, all of which has occurred.
Government has run a range of additional programs that have had moderate take-up and reasonable support from parents. However, there are concerns that the overlaying of new programs onto existing programs has resulted in overlap and confusion amongst early childhood education providers. Playgroups and preschool services were not sustained in seven of the 15 communities where they had been established.132
These early education services require continuing inputs of professional supervision and support. There is concern that they will fail if responsibility is placed upon community members without suitable support due to the limited training of participants, weak local agency support and competition with other demands.133
Outcomes—enhancing education
There has been little overall change in school attendance rates in NTER schools. Northern Territory Department of Education and Training data show that the average primary school attendance rate for NTER schools was 64.6 per cent in 2006 and 60.3 per cent in 2010.134
The majority of students in the NTER schools do not meet national minimum standards in reading, writing and numeracy. However, National Assessment Program—Literacy and Numeracy (NAPLAN) testing indicates a definite increase in reading skills amongst Year 3 students between 2008 and 2010. The percentage of Year 3 students in NTER schools who were at or above the national minimum standard in reading increased from 18 per cent in 2008 to 41 per cent in 2010. Some improvement was seen at other year levels.135
Enrolment appears not to have changed significantly. It is difficult to determine accurately the number of children who are not enrolled in school because of uncertainty about the population
131 DEEWR, Findings of the School Nutrition Program Stakeholder Survey, DEEWR, Canberra, 2009. 132 For a full discussion, see Chapter 8 of this report. Although the chapter does not note it, the first early childhood services under the NTER were provided only in 2008, so the first NAPLAN Year 3 assessment of children who may have benefited from these services will occur in 2011. These data were not available in time for inclusion in the analysis conducted by the Australian Council for Educational Research. 133 Charles Darwin University, School for Social and Policy Research, Institute of Advanced Studies, Let’s Start: Exploring Together—An early intervention program for Northern Territory children and families: Final evaluation report, 2010, p. 102. 134 See Chapter 8. Average attendance rates changed little between 2006 and 2009. 2010 was an unusually wet year which may have reduced students’ ability to attend. 135 See Chapter 8 for a full discussion.

Overview
Northern Territory Emergency Response: Evaluation Report 2011 31
of Indigenous school-aged children in the Northern Territory. Even so, the number of eligible Indigenous children who are not enrolled across the Territory has been estimated as 2,000, or 13 per cent of all school-aged (5–14 years) Indigenous children in the Northern Territory in 2008.136 Increases in enrolment from 2006 to 2010 averaged 2.5 per cent a year, which is only marginally above the average population increase.137
There is an inherent difficulty in retaining teachers and maintaining facilities in remote and very remote areas. The cost of providing educational opportunities that match the demonstrated need of children in these areas will continue to be high.
One example of success is the Ramingining School, where students improved their academic performance in reading, writing and numeracy. The school’s results are almost one standard deviation above the mean for NTER schools but still below the mean for all Northern Territory schools.
There is a long-term shortage of Indigenous teachers. One-third of residents, but only 3 per cent of teachers, are Indigenous. Of the 150 principals in Northern Territory schools, only four are Indigenous.138,139
Welfare reform and employment In 2008, 61.1 per cent of Indigenous people of working age in the Northern Territory were in the labour force, compared to almost 90 per cent of non-Indigenous Territorians. Employment is particularly low in remote areas where job markets are more limited.140
A full analysis of the income management and welfare reform measures of the NTNPA and of relevant employment measures has been conducted by Colmar Brunton Social Research and is reported in Chapter 9, Welfare reform and employment. This section summarises the findings.
The NTER sought to improve access to priority items, such as healthy groceries, through a combination of income management and the licensing of community stores, and to improve job readiness through increased participation opportunities for people on income support, CDEP transitions to jobs and the establishment of Community Employment Brokers.
Income management
Income management sets aside a portion of a recipient’s welfare benefits—usually half of ongoing payments and all lump sum payments—for spending on priorities such as food, clothing, rent, utilities and transport. In the period from July 2007 to December 2010, $463 million was set aside, of which $461 million was spent. Sixty-eight per cent was spent at food stores, 9 per cent on housing, 7 per cent at clothing and footwear stores and 3 per cent on the School Nutrition Program.141
136 H Bath, ‘Intervening in the Northern Territory’, invited opinion piece for Developing Practice (in press). 137 FaHCSIA, Closing the Gap in the Northern Territory: Monitoring report, July–December 2010, Part 1, FaHCSIA, Canberra, 2011, <http://www.fahcsia.gov.au/sa/indigenous/pubs/nter_reports/closing_gap_NT_jul_dec_2010/Pages/default.aspx>. Combined enrolments increased from 7,114 in 2006 to 7,861 in 2010, an increase of 11 per cent over four years. 138 J Ladwig & C Sarra, Structural review of the Northern Territory Department of Education and Training: Delivering the goods, Northern Territory Department of Education and Training, 2009. 139 Although not noted in Chapter 8, appropriate strategies and styles of instruction (pedagogy) are important for children’s engagement with schooling. Greater numbers of Indigenous educators and greater awareness of Indigenous pedagogy practices may assist in improving enrolment and attendance. 140 COAG Reform Council, National Indigenous Reform Agreement: Baseline performance report for 2008–09, COAG Reform Council, 2010. 141 FaHCSIA, Closing the Gap in the Northern Territory, July 2010 to December 2010 whole of government monitoring report, Part 2, Progress by measure, FaHCSIA, Canberra, 2010, p. 36.

Overview
32 Northern Territory Emergency Response: Evaluation Report 2011
The manner of initial implementation of the income management provisions—a blanket imposition without consultation and requiring the suspension of the Racial Discrimination Act—initially caused anger amongst some people. The program targeted all welfare recipients resident in selected communities—all of which were primarily Indigenous communities.142
Significant changes to income management were introduced in 2010. Under the changes, a new scheme of income management was commenced across the Northern Territory in urban, regional and remote areas as a first step in a future rollout of income management to disadvantaged regions. The Racial Discrimination Act applied in relation to the new scheme from the scheme’s implementation in July 2010.
In 2008, the Central Land Council undertook research in six southern NTER communities to document the experiences and opinions of Indigenous people in Central Australia in relation to the NTER. Responses by survey participants were almost evenly divided between people in favour (51%) and opposed (46%) to income management. This research was conducted before the revisions to the income management scheme and reflects divided views even during its initial implementation.
Under the changes, income management was extended across the Northern Territory and was focused on the long-term unemployed, disengaged youth, people considered vulnerable by a Centrelink social worker, and people referred by a child protection worker. NTER residents could be exempted from income management following the 2010 changes.
After the change to the program, many people who had been forced onto income management were taken off it. Of those released from compulsory income management at least 59 per cent had chosen to go onto voluntary income management by the end of 2010.143 Some participants have been able to save for and purchase major household items, such as washing machines or new refrigerators. Some are using income management as the basis of a household saving program.
Managed funds may be spent using the BasicsCard or through arrangements with Centrelink. At first the BasicsCard was poorly explained, and its imposition was seen as discriminatory. It was also very difficult for a cardholder to find out the balance on their card.144
The number of outlets in the Northern Territory that accept the BasicsCard has grown, but still does not include many smaller outlets, such as roadhouses. Initially, many retailers outside the Northern Territory did not accept the BasicsCard, which restricted people’s ability to travel. The number of retailers that accept the card is growing, and Centrelink provides information to support the use of the card across Australia.145
The ability to find out the balance remaining on a BasicsCard and to access funds through other means are improving, and the Ombudsman is receiving fewer complaints about the program. However, as many as 22 per cent of transactions still failed (mainly because of lack of funds) after the release of the second version of the card in April 2010, and the card is of limited use outside the Northern Territory.146
142 This evaluation focuses on the period from July 2007 to June 2010, when income management was part of the NTER. Changes associated with policies since July 2010 (e.g. the introduction of new income management arrangements) are out of scope for this report. 143FaHCSIA, Closing the Gap in the Northern Territory: Monitoring Report, July-December 2010, Part 1, p 15, FaHCSIA, Canberra, 2011. 144 See Chapter 9 145 See Chapter 9 146 FaHCSIA, Closing the Gap in the Northern Territory: January 2010 to June 2010 whole of government monitoring report, Part 2, Progress by measure, FaHCSIA, Canberra, 2010, p. 39.
Overview
Northern Territory Emergency Response: Evaluation Report 2011 33
The BasicsCard was not included in the survey used in the CSWRS, but a great deal of qualitative data concerning the card was gathered. While the card was not universally popular, the majority of comments about it were favourable. People commented on the BasicsCard in relation to children and families having more access to food; improvements in child health; the consumption of less alcohol and gunja (marijuana); less ‘humbugging’; and better budgeting. In qualitative research involving approximately 1,000 people, the Basics Card was voted equal third as the most significant change in the past three years.147,148
A Cultural and Indigenous Research Centre Australia (CIRCA) report commissioned by the NTER Review Board found that people caring for others were the most positive about income management, especially women who were caring for young children (older and younger women), larger families and/or people with disabilities. Generally, women tended to be more positive than men; however, most people (even some who opposed the NTER) recognised the positive impact of income management on children. Single men tended to be the least positive about income management, especially if they did not have child care responsibilities.
As part of the income management model, the Australian Government allocated $50 million to expand financial literacy initiatives, including upskilling and a savings matching scheme. Take-up was low, and there were problems in delivering services to some communities due to difficulties in engaging service providers and lack of training facilities.149
Community stores licensing
The licensing of community stores was a precondition for the introduction of income management to ensure that participants had at least one local option for buying necessities with their managed funds. The program aimed to improve the supply of healthy food and drink and the management skills of store managers. Ninety-two stores were licensed as part of the program,
In an evaluation of stores licensing, CIRCA found that stores now had a greater quantity and wider range of healthy foods.150 Managers noted that spending had become more regular and predictable, allowing them to confidently stock a wider range of fresh produce.151
Employment measures
Measures under the NTER aimed to increase the number of available jobs, link people effectively to those jobs and foster a participation culture via attendance at services and programs.
The removal of remote area exemptions from job seekers’ mutual obligation requirements meant that job seekers in the NTER communities had the same participation obligations as people in regional or urban areas.
Since the commencement of the NTER, 2,241 properly paid jobs have been created and 2,233 positions have been filled. From July 2007 to December 2010, 4,100 job placements were brokered.
147 G Shaw & P d’Abbs, op. cit. 148 The voting process involved each community compiling a list of significant changes that have occurred in the community in the past few years and challenges still remaining. Community members were asked to vote on the changes and challenges they thought were most important to them, from 1 (most important) to 5 (least important). 149 DEEWR, Language, Literacy and Numeracy Program (LLNP): Overview of the NTER, 2011, p. 2. 150 Cultural & Indigenous Research Centre Australia (CIRCA), Evaluation of the Community Stores Licensing Program, final report, CIRCA, May 2011, p. 11. This research included an analysis of data from a random selection of 32 stores, including assessment forms, in-depth interviews with key stakeholders (n = 15) and site visits to five communities to collect views from store operators, store committees, stakeholders and community members. 151 See Chapter 9.

Overview
34 Northern Territory Emergency Response: Evaluation Report 2011
The NTER has also been a direct source of employment. Jobs have been created by the School Nutrition Program, the Safe House program and the night patrols. The NTER has created the role of IEOs, and increased the number of health workers, Remote Aboriginal and Family Community Workers (RAFCW), interpreters and teaching assistants. It has also created temporary employment for people conducting housing works.
Community Employment Brokers (CEBs) were employed to coordinate employment services at the start of the NTER. CEBs played a role in implementing a range of changes, such as the elimination of the remote area exemption but they were discontinued in mid-2009 when services reverted to Job Services Australia providers (JSAs). JSAs predated the NTER and were intended to provide tailored services to disadvantaged job seekers. There is evidence that the fly-in, fly-out service model they employ leads to a confusing array of new faces and limited provider understanding of their client base.152 Stronger links to the community may yield better results.
As part of the NTER, Centrelink has engaged more intensively with individual community members. This has led to a significant increase in the number of people accessing income support. There were increases in the number of people receiving the Disability Support Pension (34%), the Carer Pension (26%), Parenting Payment Partnered (15%), Newstart (14%) and Youth Allowance (33%) between December 2009 and December 2010. Much of this growth is the result of assessments and the correct categorisation of entitlements.153
The NTER measures also included language, literacy and numeracy programs to enhance the workforce readiness of people in the NTER communities. As yet, few people have completed the training.
Outcomes—welfare reform and employment
In the CSWRS, an increase in employment was the most commonly cited reason for community members believing that individuals and their communities were on the way up.154 However, most of the new jobs are dependent on ongoing government funding and provide little scope for career progression or mobility.
Establishing a participation culture remains challenging. Engagement with programs such as Work for the Dole, and language, literacy and numeracy programs is low. There is some evidence that Centrelink has not been enforcing mutual obligation requirements in remote communities to the same extent as in urban environments.155
Increasing the number and range of employment opportunities requires sustained economic development. This depends on removing barriers such as poor transport and low education, improving certainty through land tenure changes, and providing mobility through managed programs.
152 NTER Review Board, op. cit., p. 22. 153 FaHCSIA, Closing the Gap in the Northern Territory, July 2010 to December 2010 whole of government monitoring report, Part 2, Progress by measure, FaHCSIA, Canberra, 2010, p. 39. 154 G Shaw & P d’Abbs, op. cit. 155 Northern Territory Government, Northern Territory Coordinator General for Remote Services Report, 4 December 2010 to May 2011, 2011, pp. 65. It should be noted that there was a significant increase in the proportion of participation reports (the compliance tool for Job Services Australia’s reporting of job seeker participation failures to Centrelink) applied in remote areas from July to December 2010 according to FaHCSIA, Closing the Gap in the Northern Territory: Monitoring report, July 2010 to December 2010, Part 2, FaHCSIA, Canberra, 2010, pp. 45–46.

Overview
Northern Territory Emergency Response: Evaluation Report 2011 35
Housing and land reform A full analysis of the NTER housing and land reform measures has been conducted by KPMG and is reported in Chapter 10, Housing and land reform. This section summarises the findings.
NTER measures to improve housing include compulsory five-year leases, changes to permit arrangements for accessing Indigenous-owned land, Community Clean-up projects, urgent repair projects and the construction of GBM accommodation.
Compulsory five‐year leases
The Australian Government currently holds five-year leases over 64 communities under the NTER. The leases were initially acquired without just compensation. The government has now agreed to pay rents as determined by the Northern Territory Valuer-General; however, most traditional landowners have not yet received payment.156
Compulsory five-year leases allowed the enforcement of tenancy agreements and gave government an obligation, as landlord, to meet minimum standards. They also allowed government employees and contractors ready access for service delivery, building repairs and infrastructure development. This has supported the rapid establishment of the GBM Accommodation project; Safe Houses; the Community Stores Licensing and Aboriginal Benefit Account stores infrastructure project; Community Clean-up (CCU) works; and Strategic Indigenous Housing and Infrastructure Program (SIHIP) refurbishments and upgrades, including the removal of asbestos.
Ownership of assets will revert to traditional owners on the expiry of the leases unless new leases are negotiated.
Legislative changes in 2010 stipulated that leases must be administered in a way that respects Indigenous culture and that government must negotiate voluntary leases in good faith if requested to by the owners.
Compulsory leases provided a period in which work could progress while longer term voluntary leases were negotiated. The longer term leases are intended to support housing management, security of tenure and economic development by giving housing authorities long-term access to and control over public housing assets and giving people rights over a capital asset. There is not uniform community support for longer term leases, as some people see them as a step towards breaking down communal ownership.157
Section 19 leases, which were available prior to the NTER, were not widely used and took about two years to establish.158 Section 19A (whole of township) leasing arrangements—which support the granting of tradeable sub-leases159—are now considered by FaHCSIA160 to be appropriate for larger communities in the light of the streamlined process available through the Executive Director of Township Leasing.
156 Rent payments for two five-year leased communities on the Tiwi Islands (Milikapiti and Pirlangimpi) have been distributed to landowners. Rents paid with respect to the remaining 45 five-year leased communities on Aboriginal Land Rights (Northern Territory) Act 1976 land have not been distributed. Rent payments for an additional 16 community living area communities have commenced for two of the communities. (FaHCSIA, Closing the Gap in the Northern Territory: Monitoring report, January–June 2011) 157 Department of Finance and Deregulation, Strategic review of Indigenous expenditure, Department of Finance and Deregulation, Canberra, 2010. 158 Record of interview with FaHCSIA Land Reform Branch, 29 July 2011. See Chapter 10 for detail. 159 Amendments to the Aboriginal Land Rights (Northern Territory) Act 1976 in July 2007 have enabled traditional owners to grant a lease of a township, and the Australian Government (or Northern Territory Government, where an approved entity is established) to acquire such a lease, where the Minister consents. These are known as ‘township leases’, or ‘section 19A leases’. 160 FaHCSIA, Closing the Gap in the Northern Territory: Monitoring report, January–June 2011.

Overview
36 Northern Territory Emergency Response: Evaluation Report 2011
The Australian Government and local councils have been slower to request long-term leases than the Northern Territory Government and NGOs. NGOs often require long-term leasing as a condition of receiving government funding, and that incentive seems to be more effective than the expiry deadline on the compulsory five-year leases.
Compulsory leases may have slowed the introduction of longer term leases by adding an additional requirement for ministerial approval and creating tenure without the need to negotiate with owners; however, some longer term leases have been entered into.
Permits
Legislative changes for the NTER abolished the requirement for the public to obtain permits to access communal areas in major communities on Aboriginal land, on the basis that the permit system was isolating Indigenous communities. The changes involved allowing all government workers and contractors to enter and remain on Aboriginal land without a permit and giving the Commonwealth Minister for Indigenous Affairs the right to authorise a ‘class of persons’ to enter and remain on Aboriginal land for the five-year period of the NTER. In addition, members of the public could access common areas of 52 major communities, and travel to those communities by air, sea and public road without a permit.
The approval for government workers and contractors saved time as it used to take weeks to gain permission. It has not made much practical difference to who can access Indigenous land, as permits for government employees were always approved in the past and arrangements for other people remain essentially unchanged. However, the changes have caused confusion and a feeling of loss of empowerment amongst Indigenous communities.161
The Central Land Council’s review of the NTER in six communities found that the overwhelming majority (94%) of respondents were opposed to changes to the permit system, mainly because of concerns about the safety of children, unrestricted photography and media access, strangers entering communities, and the privacy of people in the communities.162 Similarly, community members consulted by the NTER Review Board were consistently critical of changes to the permit system.163
Community clean‐up
The CCU project provided funding for urgent make-safe works and minor repairs ahead of major investment under SIHIP, which is now part of the National Partnership Agreement on Remote Indigenous Housing in the Northern Territory. 3,274 buildings were surveyed during the CCU program resulting in 2,801 make-safe works and 2,814 minor vital works being conducted. The community clean-up work has been completed.
The CCU project provided some employment opportunities, as CDEP labour was used in some cases and five people obtained formal qualifications; however, some communities felt that better use could have been made of community-based work crews.164
The program began with an assessment of housing condition (an audit), and communities supported the project when audits were done well and actions were followed up. There were
161 See Chapter 10. Comments provided by FaHCSIA Land Reform Branch, 2 August 2011, and record of interview with the Central Land Council, dated 2 August 2011. 162 Central Land Council, Reviewing the Northern Territory Emergency Response: Perspectives from six communities, 2008, p. 7. 163 NTER Review Board, op. cit., p. 41. 164 Central Land Council, op. cit.

Overview
Northern Territory Emergency Response: Evaluation Report 2011 37
cases where audits needed to be repeated and work did not eventuate, leading to communities being unhappy.165
Asbestos was uncovered in some communities through surveys of the 73 NTER communities. An investigation of the program found that communication about asbestos discovered during inspections was inadequate.166
Urgent repairs to infrastructure
The Urgent Repairs to Infrastructure program was conducted under an umbrella funding arrangement in which individual projects were identified as the program progressed. One hundred and eleven projects were approved and completed at a cost of $33.2 million. Most were run through local organisations and community councils, making good use of local labour.
Overall, the project was implemented as intended.
Government Business Manager accommodation
Fifty-eight communities required GBM accommodation and all have received it, after some implementation problems. Initially, containers were used as well as demountables and other housing options; however, GBMs were moved out of the containers after unacceptable levels of formaldehydes were detected. In many cases, it was not possible to resolve the problem and new demountables were provided instead.
GBM accommodation is now considerably better than the informal sleeping arrangements which were previously the norm. GBM accommodation is still not usually suitable for an accompanying spouse, and this may limit the time that GBMs are willing to stay in communities.
According to the 2008 Blunn Report, failure to maintain health and safety standards in the initial rollout of this program led to a loss of confidence amongst the GBMs.167
It is too early to tell whether the accommodation has had any effect on the duration of GBM postings.
Outcomes—housing and land reform
Five-year leases have enabled repairs and upgrades to community housing and related infrastructure, and provide a means of formalising government obligations as the landlord of public housing. However, the movement from five-year leasing to the negotiation of longer term leases has not been undertaken by a majority of relevant agencies or organisations.
The impacts of the CCU and Urgent Repairs to Infrastructure sub-measures are unable to be quantified precisely. The available qualitative evidence suggests that all scheduled works under those projects were undertaken and completed and that the objectives of the programs were met. Given the purpose and scope of the projects (to fix community housing and infrastructure), successfully completed works are likely to have led to improvements in local amenity.
165 ibid. 166 Commonwealth Ombudsman, FaHCSIA asbestos surveys: Communication issues, report no. 18/2009, December 2009 167 AS Blunn, Review of issues related to the acquisition and management of container accommodation in the Northern Territory and the Management of ACMS on prescribed communities for the Department of Families, Housing Community Services and Indigenous Affairs, 2008.

Overview
38 Northern Territory Emergency Response: Evaluation Report 2011
While housing availability and overcrowding are not part of the NTER, it is worth noting that Indigenous Australians are under-represented in home ownership and the private rental market. According to the 2006 Census, two-thirds (66%) of Indigenous people in the Northern Territory were living in overcrowded households. The comparative figure for all Australians in 2006 was only 6 per cent. In 2008, 66 per cent of Indigenous people aged 15 years and over living in remote/very remote areas of the Northern Territory were living in overcrowded housing.168
In the qualitative research component of the CSWRS, each community identified a list of significant changes that have occurred in their community in the past few years and challenges still remaining. Community members were asked to vote on the changes and challenges they thought were most important to them, from 1 (most important) to 5 (least important). The survey found that continued improvement in housing was perceived as the most important challenge still to be faced, receiving a third more votes than any other issue.169
The Australian and Northern Territory governments have been working under the National Partnership Agreement on Remote Indigenous Housing (NPARIH) to improve the quality, supply and management of housing in remote Indigenous communities. As of 30 June 2011, the NPARIH had delivered 324 new houses in the Northern Territory, exceeding the target of 310. Over the same timeframe, 1,592 refurbishments were completed, exceeding the target of 1,182.170
Cross-theme analysis The preceding analyses of the seven NTER themes reveal a number of recurring issues and lessons.
The bulk of NTER activity has been to increase the level of government services to bring services in NTER communities more into line with their identified level of need. Of the 32 measures described in the NTNPA, only seven are about community behaviour or upskilling. Four measures are about how government conducts itself, five are about improving government engagement with communities, thirteen redress service shortfalls and three are government activities to perform functions normally provided by the private sector or NGOs.
The additional services go some way towards redressing the historical underservicing of these communities; however, issues remain in housing, infrastructure (including roads), safety and employment opportunities.
Maintaining a level of services that is comparable to that available to other Australians living in similarly sized communities, and that takes into account the relative need for those services in remote Indigenous communities, will require a large continuing investment due to the cost of service provision in remote communities and the limited capacity of market-based service provision.
168 ABS, National Aboriginal and Torres Strait Islander Social Survey, 2008, cat. no. 4714.0, ABS, Canberra, 2008. 169 G Shaw & P d’Abbs, op. cit. The qualitative research component involved approximately 1,000 people. 170 Media Release, the Hon Jenny Macklin, MP, Minister for Families, Community Services and Indigenous Affairs, ‘Remote Indigenous housing targets exceeded’, media release, 9 August 2011, accessed 3 November 2011, <http://www.jennymacklin.fahcsia.gov.au/mediareleases/2011/pages/remote_indig_house_target_exceed_09082011.aspx> Media release, Remote Indigenous housing progress, the Hon Jenny Macklin, MP, Minister for Families, Community Services and Indigenous Affairs, 15, July 2010, accessed 3 November 2011, <http://www.jennymacklin.fahcsia.gov.au/mediareleases/2010/pages/remote_indig_housing_progress_15jul10.aspx>

Overview
Northern Territory Emergency Response: Evaluation Report 2011 39
Unmet need Perhaps the clearest lesson from the NTER is the high level of unmet need within the NTER communities:
• the fact that nearly all children in remote areas presented for a health check and that hospitalisations doubled for Indigenous children for some conditions following the child health checks and the referrals not followed up
• the appreciation of communities that received a resident police presence for the first time together with the growth in police activities
• the amount of urgent work to repair housing and the still high occupancy rate for houses
• the need for additional interpreters
• the high level of activity by night patrols
all indicate a high level of need for the services provided under the NTER.
Workforce shortages The delivery of health, education, policing, housing and governance services were all hampered by difficulties in attracting and retaining suitably qualified personnel. In each area, there was demand for additional workforce and especially for suitably qualified Indigenous employees.
A history of poor access to education has led to the present mismatch between Indigenous people who are keen to work171 but have low educational attainment and employers seeking Indigenous staff. That demand would not be enough to significantly redress the low employment levels; however, higher Indigenous participation in these professions could improve the appropriateness of services and the empowerment of communities.
Sadly, the poor rate of school enrolment and attendance amongst Indigenous children indicates that many children are not gaining the benefits of education, despite the potential future demand for their contribution and the opportunities they could have for careers that would benefit them and their communities.
The low availability of suitable accommodation also makes it difficult to attract and retain workers from other areas. The NTER has gone some way towards redressing the shortfall in accommodation for service providers.
Longevity The NTER Review Board emphasised the need to ‘stay with it for the long haul’ in order to overcome the long-term disadvantage of Indigenous communities.172 Leading up to the NTER, communities had seen a series of short-term programs, and providers had been engaged on a series of short-term contracts. In the words of one Gunbalanya resident, ‘We have a 20-year history of six-month programs.’173
171 G Shaw & P d’Abbs, op. cit. 81.2 per cent of people rated people having a proper job as very important. 172 NTER Review Board, op. cit., p. 58. 173 P Anderson & R Wild, (2007) Ampe akelyernemane mele mekarle: ‘Little children are sacred’: Report of the Northern Territory Board of Inquiry into the Protection of Aboriginal Children from Sexual Abuse, Northern Territory Government, Darwin, 2007, p. 55.

Overview
40 Northern Territory Emergency Response: Evaluation Report 2011
At the program level, it has taken time to build community understanding and acceptance of some NTER measures especially income management and five-year leases, which were initially resented. Acceptance improved over time as better information was provided and people had a chance to understand the measures. Other measures, such as alcohol and drug treatment services and youth alcohol diversionary services have suffered from the planning and recruitment problems that come with short-term funding arrangements. The NT DET believes that the future success of the literacy programs are dependent on continuity of program delivery.
Service providers, such as police, GBMs and employment brokers, were most effective when they sustained informal and interpersonal relationships with members of the community and other service providers.
Use of existing structures and programs The rapid implementation at the beginning of the NTER meant that existing governance and engagement mechanisms were not always used. The choice not to use existing structures and programs in some cases caused consternation amongst some Northern Territory Government professionals, such as health workers. For example, the Indigenous Coordination Centres were underused at the start174 as were Indigenous health service organisations.175
Bypassing existing engagement mechanisms can both offend people and result in inadequate engagement despite the best endeavours of staff on the ground. Over time, greater use was made of pre-existing engagement mechanisms and the level of understanding and acceptance of government activities increased.
Overlap The NTER objectives overlap with objectives being pursued through many other agreements and measures, such as Building the Education Revolution and the National Partnership Agreements on Closing the Gap in Indigenous Health Outcomes, Remote Indigenous Housing, Indigenous Early Childhood Development and Indigenous Economic Participation.
Overlap is difficult to identify in an environment that sometimes seems like a fog of similar and rapidly changing measures. An issues paper developed by the Menzies School of Health Research noted that ‘the Northern Territory Emergency Response has seen a proliferation of discrete, short-term funded initiatives, often overlapping in aim and purpose and not integrated with existing universal and targeted services.’176
Although there is clear evidence of overlap in the declared aims and purposes of various programs, there is no firm evidence of overlap in activity. All measures encountered a high level of unmet demand and, while the mix of services is complex, there is no evidence of duplication of activities or of unnecessary service provision—with the possible exception of AOD services, for which the expected demand for residential services did not eventuate.
Gaps Areas for improvement were evident in all seven themes analysed in this evaluation. Many of these issues are being addressed outside the NTER.
174 See Chapter 4 for a full discussion 175 Allen and Clarke, op. cit. 176 Menzies School of Health Research, Early childhood development in the NT: Issues to be addressed, 2011, p. 17.

Overview
Northern Territory Emergency Response: Evaluation Report 2011 41
The NTER Operations Centre provided co-located decision-making capacity close to the areas where services were being provided. With the closure of the centre, there has been increasing reference to problems in coordination and engagement arising from the re-emergence of program and funding ‘silos’.
The increase in policing has been welcomed by communities. However, rates of recorded offending are still much higher in NTER communities, leaving people more likely to be exposed to crime than other Australians. Rates of alcohol-related offending continue to be high. The link between alcohol misuse and the persistent high levels of violent and antisocial behaviour in many Northern Territory communities suggests that further increases in policing, safety and alcohol management programs may be required.
The health of Indigenous people in the Northern Territory was improving prior to the announcement of the NTER, but continues to be poor. Referrals arising from the NTER highlighted constraints across the health system and the continuing difficulty in recruiting health workers, especially Indigenous health workers.
Independently of the NTER, the number of full-time equivalent child protection workers in the professional stream increased by 70 per cent from 101 in 2007 to 172 in 2010.177 However, the Growing them strong, together report highlighted the inadequate resourcing of child protection in the Northern Territory.
The standout gap evident in this evaluation is in measures to improve school enrolment and attendance. School attendance was very poor at the start of the NTER and has not improved. The NTER contained many measures to improve the quality of education offered, and they appear to be achieving results already. However, there was only one measure to increase attendance—the School Nutrition Program—and it did not achieve that goal. Effective measures specifically targeting enrolment and attendance are needed.
Improvements in employment made under the NTER have been largely responsible for people believing that their personal lives are better and their communities are on the way up.178 However, the employment rate remains low and most jobs that have been created depend upon ongoing government funding. The creation of diverse, sustainable employment opportunities will be critical to sustained improvements in communities. Success will depend on removing barriers such as poor transport and low education, improving certainty through land tenure changes, and providing mobility through managed programs.
While housing availability and overcrowding were not part of the NTER, members of NTER communities raised them as the most important challenge still to be faced, giving housing a third more votes than any other issue in the CSWRS.179
Finally, the current suite of measures and the evaluation strategy do not address decision-making in government. Arguably, the timeframes imposed and the decision to consult after key decisions had already been taken were responsible for many of the problems in the early stages of the NTER. There is no program to evaluate decision-making processes and how they support or constrain government officials undertaking engagement with communities.
177 Bamblett, M, H Bath & R Roseby, Growing them strong, together: Promoting the safety and wellbeing of the Northern Territory’s children, summary report of the Board of Inquiry into the Child Protection System in the Northern Territory, Northern Territory Government, Darwin, 2010, p. 471. 178 G Shaw & P d’Abbs, op. cit. 179 G Shaw & P d’Abbs, op. cit. The voting process involved each community compiling a list of significant changes that have occurred in the community in the past few years and challenges still remaining. Community members were asked to vote on the changes and challenges they thought were most important to them, from 1 (most important) to 5. Approximately 1,000 community members participated in this process.

Overview
42 Northern Territory Emergency Response: Evaluation Report 2011
Engaging today—building tomorrow does not provide sufficient guidance to ensure fit-for-purpose engagement.
Outcomes—whole of NTER Evaluations tend to focus on deficits and areas for future improvement, but that should not detract from the strength within communities and their achievements of the past four years, which have been considerable.
Outcomes for health, education, employment, housing and safety showed some improvement but were still well below those for non-Indigenous people. Some of the improvements began prior to the NTER, such as improvements in health, and some may be at least partly attributable to other activities occurring simultaneously with the NTER.
The overall age-standardised mortality rate for Indigenous Australians in the Northern Territory fell by 26.6 per cent from 1998 to 2009, and there was a statistically significant narrowing of the gap with non-Indigenous Territorians over that period. Over the same period, the Indigenous child (0–4 years) mortality rate in the Northern Territory declined by 41.5 per cent, compared to a 37.8 per cent decrease in non-Indigenous child mortality.180
Some 10,605 children had at least one health check under the NTER. A health condition or risk factor was identified for 97 per cent of children checked. Ninety-nine per cent of those children received some form of management during the check. Of the children who had multiple checks, all those with trachoma and ringworm, 93 per cent of those suffering from scabies, 91 per cent of those with skin sores and 74 per cent of those suffering from anaemia had recovered by the time of the later check.
There was a definite improvement in reading skills amongst Year 3 students between 2008 and 2010. The percentage of Year 3 students in NTER schools who were at or above the national minimum standard in reading increased from 18 per cent in 2008 to 41 per cent in 2010. Some improvement in reading was seen at other year levels, but it was not as pronounced.181
Since the commencement of the NTER, 2,241 properly paid jobs have been created and 2,233 positions have been filled. From July 2007 to December 2010, 4,100 job placements were brokered.
In addition to these outcomes, the available infrastructure and services have been improved. While improved services are not an outcome in themselves, the program logic indicates that they are likely to result in further improvements to outcomes if they are sustained over the long term.
Eighteen NTER communities gained a resident police presence for the first time. Other communities received more policing resources. Communities that did not have night patrols got them, and alcohol restrictions are being more consistently enforced. Indigenous people now have better access to legal aid services.
Parents have better access to early childhood services.
Communities now have better health, education and police infrastructure. The quality and quantity of housing for residents and service providers have improved.
180 Based on AIHW analysis of mortality data. 181 See Chapter 8 for a full discussion.

Overview
Northern Territory Emergency Response: Evaluation Report 2011 43
According to the CSWRS, most NTER residents said that it was easier to get help from the clinic, Centrelink and the police than it had been three years before. Respondents also reported that schools were better and that youth schemes provided valuable activities for young people.182
Unintended consequences The relationship problems arising from the NTER are discussed at length in this evaluation, as befits the importance of this unintended and undesirable consequence. However, the NTER had several other unintended consequences.
Disempowerment
The change from community-based to Northern Territory shire-based councils was not part of the NTER, but happened at a similar time. The loss of community councils—together with the NTER’s bypassing of local mechanisms, the suspension of Part II of the Racial Discrimination Act and forced changes to leasing and access arrangements for Indigenous lands—caused a feeling of frustration and disempowerment.
Efforts to re-establish local representative boards are underway; however, the boards can only influence programs delivered by the local shire. Where they have been established, the results are ‘mixed at best’.183
Labelling
The NTER was prompted by the publication of the Little children are sacred report, but it should be remembered that the report found that the number of perpetrators of abuse was small and that considerable community functionality remains, together with a strong will to overcome the problems.184
Signage erected outside communities without consultation reinforced the idea that all residents were perpetrators, and the suspension of the Racial Discrimination Act made it appear to be a problem based in race rather than in disadvantage. Unfortunately, the blanket imposition of policies together with the publicity about the NTER has made many Indigenous people feel that they have all been unfairly labelled.185
Sustainable communities The fourth evaluation goal—to assess whether this approach has contributed to more sustainable communities, and progress in achieving the Closing the Gap targets—has been partly answered in the above sections on the outcomes of individual NTER measures.
The question of whether the NTER has contributed to more sustainable communities requires an exploration of ‘sustainable’ in this context. The United Nations defines sustainable development in terms of three legs: economic development, social development and environmental protection.186
Dodson and Smith describe a multidimensional framework for sustainable development:
182 G Shaw & P d’Abbs, op. cit. 183 See Chapter 4 for a full discussion 184 P Anderson & R Wild, op. cit., p. 6. 185 G Shaw & P d’Abbs, op. cit. 186 United Nations Department of Economic and Social Affairs 2002, para. 5, cited in M Dodson & DE Smith, op. cit., p. 5.

Overview
44 Northern Territory Emergency Response: Evaluation Report 2011
For many Indigenous Australians, the ‘test’ of sustainability relates to being able to answer a set of difficult questions arising out of these different dimensions: What kinds of activities and changes might be acceptable and consented to now, and acceptable to people over the generations? Will the economic or other benefits of a current development initiative still be available for future generations? Might future negative impacts outweigh any benefits?187
Dodson and Smith go on to identify governance as the key factor for the sustainable development of Indigenous communities: ‘Without improved governance capacity, there is unlikely to be sustained development, and valuable opportunities will be squandered.’188
This brings additional criteria of social acceptability across generations and governance capacity. The question of whether the NTER has contributed to sustainable communities is discussed in this section in terms of economic development, social development, social acceptability and governance capacity. Questions of environmental protection are important, but outside the scope of this evaluation.
Economic development
Since the start of the NTER, 2,241 properly paid jobs have been created. This is a substantial improvement, but employment rates remain very low. Jobs created under the Northern Territory Jobs Program are dependent on ongoing government funding, and the economic base within the NTER communities remains narrow.
Poor transport infrastructure and education, together with limited mobility and capacity to raise capital, limit the potential for economic development in the NTER communities. Increasing the employment prospects in these areas will require commitment and innovation, given their distance from most markets, the legacy of poor access to education and consequent low educational attainment, and the limited capital base.
Social development
According to the United Nations Research Institute for Social Development, social development promotes universal social protection and equity.189 The CSWRS indicated that people in NTER communities are feeling safer, that most believe that they are better off and that people in small and medium-sized communities believe that their communities are on the way up.190
Increases in services and infrastructure are redressing the service gaps. However, differences are emerging between Indigenous communities. NTER communities received services not available outside the prescribed areas. Similarly, communities designated as Northern Territory Growth Towns are perceived to be receiving services not available to other communities. There is a question of how hub services will be delivered to the spokes. Some communities are concerned that people will be forced to move to larger communities to receive basic services.191
These developments are raising issues of equity between Indigenous communities.
187 M Dodson & DE Smith, op. cit., p. 6. 188 ibid., p. 20. 189 United Nations Research Institute for Social Development <http://www.unrisd.org/80256B3C005BB128/(httpProgrammeAreasForResearchHome)/BFA13785EC135F568025718B003C5FA7?OpenDocument>. 190 G Shaw & P d’Abbs, op. cit. 191 <http://www.amnesty.org.au/indigenous-rights/comments/26216>

Overview
Northern Territory Emergency Response: Evaluation Report 2011 45
Social acceptability
Social acceptability, as defined by Dodson and Smith, relates to changes being acceptable and consented to. This is difficult to assess directly; however, we can examine the opportunities and mechanisms for communities to define what they find acceptable and to give their consent.
The Little children are sacred report emphasised the importance of local ownership and customising actions to use the unique strengths of each community. Quoting Fred Chaney on why government has not succeeded in the past, the report noted:
I think governments persist in thinking you can direct from Canberra, you can direct from Perth or Sydney or Melbourne, that you can have programs that run out into communities that aren’t owned by those communities, that aren’t locally controlled and managed, and I think surely that is a thing we should know doesn’t work.192
Government has added additional engagement mechanisms and more localised planning mechanisms over the course of the NTER. Local planning vehicles include alcohol management plans, local implementation plans under the National Partnership Agreement on Remote Service Delivery, the regionalisation of health services and the creation of the Local Priorities Fund.
It is too early to assess the effectiveness of these initiatives; for example, the first local implementation plan was finalised only in 2010.
Future assessments of these mechanisms will need to address the responsibilities of both parties. The success of a planning and governance model that allows Indigenous communities to define what they find acceptable and to give their consent will depend upon the governance capacity within the communities and the willingness of government to clearly identify which policies would work best with community ownership and to cede some control over these from the beginning of the policy development process.
Governance capacity
The NTER made some investment in developing the governance capacity of individuals within communities. Most people agree that their community is working better to fix problems, that there is more respect for elders, and that community leaders are stronger than three years ago.193
A survey of service providers working in NTER communities, however, found that 86 per cent of respondents thought that local leadership and governance capability has never been developed, or only developed some of the time, to support better engagement between government agencies and the community.194 To be fully effective, training and development in governance need to be accompanied by real opportunities to exercise leadership and governance skills. The NTER supplied few such opportunities in its initial form. This has improved, but there remains substantial scope for further improvement.
192 Fred Cheney, interview with Kerry O’Brien, 7.30 report, ABC TV, 19 April 2007; P Anderson & R Wild, op. cit., p. 23.
193 G Shaw & P d’Abbs, op. cit. 194 A full analysis of the survey of 85 government and other service providers by the Allen Consulting Group is in Chapter 4 of this report

Overview
46 Northern Territory Emergency Response: Evaluation Report 2011
Informing future policy development In considering new policies or changes to existing policies it is important to keep in mind the complexity of the environment and the amount and rapidity of change that Indigenous people have already experienced.
Complexity The environment is of such complexity that it is difficult for professionals working in the field to understand how the programs are intended to come together to achieve the government’s desired outcomes. Eighty-one per cent of government service providers thought the responsibilities of other agencies were never clear or clear only some of the time.195 An Australian Government report on expenditure on Indigenous programs found that, at the national level, ‘the current set of Indigenous-specific programs across the Commonwealth is unduly complex and confusing.’196
An issues paper developed by the Menzies School of Health Research noted that ‘the Northern Territory Emergency Response has seen a proliferation of discrete, short-term funded initiatives, often overlapping in aim and purpose and not integrated with existing universal and targeted services.’197
Variation between NTER and non-NTER communities, and between Growth Towns and other communities, makes it difficult for residents to determine what services they are entitled to and which engagement mechanisms to use.198
Future policy development should consider the complexity of the range of policies and programs operating across the region so that service providers and their clients can work within the system effectively.
Rapidity of change The complexity of the environment is compounded by the rapidity of change. The NTER was rolled out very quickly and has been changed many times during its four-year history. Changes occurred within the first weeks of the NTER announcement in response to community feedback, again a year later in response to the NTER Review Board and the NTER redesign, and then again with the NTNPA.
This has created challenges for evaluators, since few programs have remained stable long enough for a thorough evaluation. It has also caused some confusion amongst both service providers and service recipients. The NTER itself came on the back of a history of rapid policy change, as reflected in the Gunbalanya resident’s comments about ‘a 20-year history of six-month programs’.199
Despite changes during its life, there is considerable underlying continuity both throughout the duration of the NTER and between NTER measures and previous policies. The NTER has had a relatively stable funding platform. It has not been affected by the uncertainty that can be created by annual funding cycles. However, the continuous changes in language, legislation and regulation, the rolling program of short-term funding agreements and the high level of
195 A full analysis of the survey of 85 government and other service providers by the Allen Consulting Group is in Chapter 4 of this report 196 Department of Finance and Deregulation, op. cit., p. 11. 197 Menzies School of Health Research, Early childhood development in the NT: Issues to be addressed, 2011, p. 17. 198 See Chapter 4 for a full discussion. 199 P Anderson & R Wild, op. cit., p. 55

Overview
Northern Territory Emergency Response: Evaluation Report 2011 47
staff turnover and fly-in, fly-out engagements hide the underlying strategy in a maelstrom of change.
Policymakers, service providers and residents of the affected communities would all benefit from a simple, stable enunciation of the strategy supported by ongoing, or at least longer term, funding assurances.
Future evaluations This report has relied on outcome data and on evaluations of individual NTER measures. In some instances, evaluations for individual measures were not available when the report was being prepared. Ideally, this situation should be avoided in any future large-scale whole-of-government evaluation.
Separating the relative contributions that different inputs make to a shared outcome is always difficult. The rapid rollout of measures at the start of the NTER meant that data were often not gathered prior to rollout and evaluation principles were not always built into the implementation of individual measures. More careful consideration of program evaluation in the design phase would improve the consistency of outcome measurement and support better analysis of the relative contributions of individual measures and their cost-effectiveness.
Most of the outcomes sought in the NTER will be slow to realise and subject to perturbations from unrelated events. Retaining a common set of data collection parameters would support the compilation of the long time-series necessary to analyse lag responses to interventions.
The service delivery environment in the Northern Territory has changed significantly as a result of the NTER; however, it was not possible to analyse the effect this has had on NGOs. A close look at the role of NGOs in service delivery and the effects of government policy on their service delivery capacity would be useful in any future evaluation.
The development of community research capacity in the CSWRS has the potential to support stronger Indigenous ownership of research and evaluation in the future. Traditional opinion-gathering mechanisms, such as storytelling and yarn-circles, and a continuation of the practice of local people conducting research, owning it and feeding it back into their communities, should be included in all future evaluation strategies.
The current evaluation strategy focuses on evaluating what government is doing to communities. Some feedback received during the conduct of the evaluation suggested that including evaluation of what communities are doing in their own interests would be a logical component of any future evaluation. Community-owned and government-supported research into community contributions could provide a valuable resource for communities. The process used for the CSWRS could be used as a model.

Overview
48 Northern Territory Emergency Response: Evaluation Report 2011
Bibliography ABS (Australian Bureau of Statistics), National Aboriginal and Torres Strait Islander Social
Survey, cat. no. 4714.0, ABS, Canberra, 2008.
——, National Aboriginal and Torres Strait Islander Social Survey, 2008, cat. no. 4714.0, ABS, Canberra, <http://abs.gov.au/AUSSTATS/[email protected]/Lookup/4714.0Main+Features122008?OpenDocument>.
——, Criminal courts, Australia 2009–10, ABS, Canberra, 2011.
AIHW (Australian Institute of Health and Welfare), Evaluation of income management in the Northern Territory, occasional paper no. 34, AIHW, 2010.
Allen and Clarke, Evaluation of the Child Health Check Initiative and the Expanding Health Service Delivery Initiative: Final report, Canberra, 2011.
Allen Consulting Group, Independent review of policing in remote Indigenous communities in the Northern Territory: Policing further into remote communities, Melbourne, 2010.
ANAO (Australian National Audit Office), Government Business Managers in Aboriginal communities under the Northern Territory Emergency Response, Audit report no. 18, Canberra, 2010.
——, Multifunctional Aboriginal children’s services (MACS) and crèches, Audit report no. 8 2010–11, ANAO, Canberra, 2011.
Anderson, P, & R Wild, Ampe akelyernemane meke mekarle: ‘Little children are sacred’: Report of the Northern Territory Board of Inquiry into the Protection of Aboriginal Children from Sexual Abuse, Northern Territory Government, Darwin, 2007.
Arnott, A, J Guenther & E Cummings, Final evaluation report of safe places, Social Partnerships in Learning Research Consortium, Charles Darwin University, Darwin, 2009.
Australian Government, Future directions for the Northern Territory Emergency Response discussion paper, Commonwealth of Australia, Canberra, 2009.
Australian Human Rights Commission, Social Justice Report 2007, Chapter 3: The Northern Territory ‘Emergency Response’ intervention—A human rights analysis, 11 February 2008.
Australian Indigenous Doctors’ Association and Centre for Health Equity Training, Research and Evaluation, UNSW, Health impact assessment of the Northern Territory Emergency Response, Australian Indigenous Doctors’ Association, Canberra, 2010.
Bamblett, M, H Bath and R Roseby, Growing them strong, together: Promoting the safety and wellbeing of the Northern Territory’s children, summary report of the Board of Inquiry into the Child Protection System in the Northern Territory, Northern Territory Government, Darwin, 2010.
Bath, H, ‘Intervening in the Northern Territory’, invited opinion piece for Developing practice (in press).

Overview
Northern Territory Emergency Response: Evaluation Report 2011 49
Bromfield, L & Holzer, P, NCPASS comparability of child protection data: Project report, National Child Protection Clearinghouse, AIFS, Melbourne, 2008.
Blunn, AS, Review of issues related to the acquisition and management of container accommodation in the Northern Territory and the management of ACMS on prescribed communities for the Department of Families, Housing Community Services and Indigenous Affairs, 2008.
Bourke, CJ, K Rigby & J Burden, Better practice in school attendance: Improving the school attendance of Indigenous students, report prepared for the Department of Education, Training and Youth Affairs by Monash University, Melbourne, 2000.
Bryant, C & M Willis, Risk factors in Indigenous violent victimisation, technical and background paper no. 30, Australian Institute of Criminology, Canberra, 2008.
Central Land Council, Reviewing the Northern Territory Emergency Response: Perspectives from six communities, Central Land Council, 2008.
Charles Darwin University, School for Social and Policy Research, Institute of Advanced Studies, Let’s Start: Exploring Together—An early intervention program for Northern Territory children and families: Final evaluation report, 2010
Cheney, F, interview with Kerry O’Brien, 7.30 report, ABC TV, 19 April 2007.
CIRCA (Cultural and Indigenous Research Centre Australia), Report on the NTER Redesign Engagement Strategy Implementation: Final report, report for FaHCSIA, CIRCA, Sydney, 2009, <http://www.fahcsia.gov.au/sa/indigenous/pubs/nter_reports/Documents/redesign_engagement_strategy/final_report_09_engage_strat.PDF>.
COAG (Council of Australian Governments), National Partnership Agreement on Remote Service Delivery, Canberra, ACT, 2009, <http://www.federalfinancialrelations.gov.au/content/national_partnership_agreements/indigenous.aspx>.
——, Closing the Gap in the Northern Territory National Partnership Agreement, Canberra, ACT, 2011 http://www.federalfinancialrelations.gov.au/content/national_partnership_agreements/indigenous.aspx.
COAG Reform Council, National Indigenous Reform Agreement: Baseline performance report for 2008–09, COAG Reform Council, 2010.
Commonwealth Grants Commission, General revenue grant relativities: Northern Territory workplace discussions, 2008, <http://www.cgc.gov.au/__data/assets/file/0012/20451/NT_-_2010_Review_-_brief_for_State_visit.pdf> (accessed 12 September 2011).
Commonwealth Ombudsman, FaHCSIA asbestos surveys: Communication issues, report no. 18/2009, December, 2009
Coordinator General for Remote Service Delivery, Six monthly report: September 2010 – March 2011, Canberra, 2011.

Overview
50 Northern Territory Emergency Response: Evaluation Report 2011
DEEWR (Department of Education, Employment and Workplace Relations), Language, Literacy and Numeracy Program (LLNP): Overview of the NTER, 2011.
——, School Nutrition Program: Operational guidelines, 1 January 2011 to 30 June 2012, DEEWR, Canberra, 2010.
Department of Finance and Deregulation, Strategic Review of Indigenous Expenditure, Department of Finance and Deregulation, Canberra, 2010.
Dodson, M & DE Smith, Governance for sustainable development: Strategic issues and principles for Indigenous Australian communities, discussion paper no. 250/2003, Centre for Aboriginal Economic Policy Research, Australian National University, 2003.
FaHCSIA (Department of Families, Housing, Community Services and Indigenous Affairs), Submission of background material to the Northern Territory Emergency Response Review Board, FaHCSIA, Canberra, 2008.
——, Report on Northern Territory Emergency Response redesign consultations, FaHCSIA, Canberra, 2009.
——, Northern Territory Emergency Response Whole-of-Government Evaluation Strategy, in accordance with the Closing the Gap in the Northern Territory National Partnership Agreement, FaHCSIA, Canberra 2010.
——, Closing the Gap in the Northern Territory: Monitoring report, July–December 2010, FaHCSIA, Canberra, 2011, <http://www.fahcsia.gov.au/sa/indigenous/pubs/nter_reports/closing_gap_NT_jul_dec_2010/Pages/default.aspx>.
——, Closing the Gap in the Northern Territory: Monitoring report, January–June 2011, FaHCSIA, Canberra, 2011, <http://www.fahcsia.gov.au/sa/indigenous/pubs/nter_reports/closing_gap_NT_jul_dec_2010/Pages/default.aspx>.
——, ‘Remote Indigenous housing targets exceeded’, media release, FaHCSIA, Canberra, 2011, <http://www.jennymacklin.fahcsia.gov.au/mediareleases/2011/pages/remote_indig_house_target_exceed_09082011.aspx> (accessed 3 November 2011).
——, Stronger futures in the Northern Territory: Discussion paper, FaHCSIA, Canberra, June 2011.
Gray, D & S Saggers, Indigenous Australian alcohol and other drug issues: Research from the National Drug Institute, National Drug Institute, Curtin University of Technology, Perth, 2008.
Higgins, DJ, Child safety and wellbeing in the NT: A report to the Northern Territory Emergency Response (NTER) Review Board, Australian Institute of Family Studies, Melbourne, 2008.
Holmes, C, L Fasoli & P Stephenson, Evaluation of the Family Support package: A community perspective, Research Division, Batchelor Institute of Indigenous Tertiary Education, September 2011, unpublished.

Overview
Northern Territory Emergency Response: Evaluation Report 2011 51
Karvelas, P, ‘Only one recipient of $53m matched savings scheme’, The Australian, March 2011.
Kleiman, Mark AR, When brute force fails: How to have less crime and less punishment, Princeton University Press, New Jersey, 2009.
Ladwig, JG & C Sarra, Structural review of the Northern Territory Department of Education and Training: Delivering the goods, report to the Minister for Education and Training, 2009.
McGuinness, K, F Arney & M Westby, Mobile Child Protection Team final evaluation report, April 2011, Menzies Centre, Darwin, 2011, unpublished.
Menzies School of Health Research, Early childhood development in the NT: Issues to be addressed, Menzies School of Health Research, 2011.
Nicholson, A, L Behrendt, A Vivian, N Watson & M Harris, Will they be heard? A response to the NTER consultations, June to August 2009, Jumbunna Indigenous House of Learning, 2009.
Northern Territory Department of Justice, Northern Territory wholesale alcohol supply for the period 2002 to 2009, Northern Territory Government, Darwin, 2010.
Northern Territory Government, Northern Territory Coordinator General for Remote Services, Report 4, December 2010 to May 2011, Northern Territory Government, Darwin, 2011.
NTER Review Board, Northern Territory Emergency Response: Report of the NTER Review Board, Department of Families, Housing, Community Services and Indigenous Affairs, Canberra, October 2008, <http://www.nterreview.gov.au/docs/report_nter_review/default.htm>.
Ohlin, J, Ross, S, Wilczynski, A, Pigott, R, Connell J, & Reed-Gilbert, K, Review of certain FaHCSIA-funded youth services, URBIS for FaHCSIA, Canberra, 2010.
Origin Consulting & Bowchung Consulting 2010, Review of the alcohol and other drug service components of the NTER: Final report, 25 May 2010.
Productivity Commission, Overcoming Indigenous disadvantage: Key indicators 2011, Steering Committee for the Review of Government Service Provision, Australian Government, Melbourne, 2011.
Putt, J, S Middleton, J Yamaguchi & K Turner, Community safety: Results from the survey of service providers in the Northern Territory, unpublished draft report, Department of Families, Housing, Community Services and Indigenous Affairs, Canberra, 2011.
Shaw, G & P d’Abbs, Community Safety and Wellbeing Research Study: Consolidated report, Department of Families, Housing, Community Services and Indigenous Affairs, Canberra 2011.
Silburn, S, J McKenzie & B Moss, Northern Territory results for the Australian Early Development Index 2009, Menzies School of Health Research & Northern Territory Department of Education and Training, Darwin, 2010.

Overview
52 Northern Territory Emergency Response: Evaluation Report 2011
Tangentyere Council, Intervention: Experiences and opinions of Alice Springs town camp residents of the Northern Territory Emergency Response, 2008.
United Nations Research Institute for Social Development, Social policy and development, <http://www.unrisd.org/80256B3C005BB128/(httpProgrammeAreasForResearchHome)/BFA13785EC135F568025718B003C5FA7?OpenDocument> (accessed 12 August 2011).
Williams, E et al., ‘I’m here to support you’: Updated informative evaluation of the Remote Aboriginal Family and Community Programme, Social Partnerships in Learning Research Consortium Evaluation Unit, Charles Darwin University, Darwin, 2010, unpublished.
Willis, M, ‘Non-disclosure of violence in Australian Indigenous communities’, Trends & Issues in Crime and Criminal Justice, no. 405, Australian Institute of Criminology, Canberra, 2011.
Wilson, T, JR Condon & T Barnes, ‘Northern Territory Indigenous life expectancy Improvements, 1967–2004’, Australian and New Zealand Journal of Public Health, vol. 31, no. 2, 2007.

Background
Northern Territory Emergency Response: Evaluation Report 2011 53
2 Background
Kathryn Julie Roediger
Introduction The Northern Territory Emergency Response (NTER) is a set of government initiatives designed to protect children, to make communities safe and to build a better future for people living in Indigenous communities and town camps in the Northern Territory. It was launched by the Australian Government on 21 June 2007 and will continue until the expiration of the Closing the Gap in the Northern Territory National Partnership Agreement (NTNPA) in 2012.200
The NTNPA was agreed between the Australian Government and the Northern Territory government in July 2009. Around $450 million was expended on NTER programs each year from 2007–08 to 2009–10, and around $311 million in 2010–11. The NTNPA also includes a requirement to evaluate the Closing the Gap in the Northern Territory initiatives in 2011–12. This chapter provides some background and context for that evaluation.
The chapter begins with a brief ‘History’ section listing earlier policies and key events leading up to the announcement of the NTER. This is followed by a ‘Context’ section. A full analysis of the disadvantage and social exclusion experienced by Indigenous Australians is beyond the scope of this report. However, the substantial government resources committed to the NTER can only be understood when seen in the context of the need created by decades of disadvantage and underinvestment, the structural difficulties in funding government activities in the Northern Territory and the substantial cost differential of undertaking works in remote areas.
Events occurring concurrently with the NTER shaped people’s perceptions of the NTER and the outcomes for communities. The most important of these were a series of initiatives delivered by the Northern Territory Government, which are outlined briefly at the end of the ‘Context’ section.
This is followed by an ‘Implementation’ section that describes the evolution of the NTER from first announcement through the cycles of review and revision culminating in the current government policy. The section ends with an outline of the consultations presently underway to guide the way forward.
The chapter closes with an ‘Evaluation’ section. This section describes the evaluation strategy which guided this whole-of-government evaluation. This is followed by a brief discussion of the program logic, which captures many of the assumptions about the relationship between NTER measures to the desired outcomes.
History The NTER is one of the most comprehensive, intensive and well-resourced government responses to disadvantage amongst Indigenous Australians. It builds upon previous government initiatives addressing the social dysfunction arising from this disadvantage.
200 COAG, Closing the Gap in the Northern Territory National Partnership Agreement, COAG, Canberra, 2011. Most measures in the agreement will expire on 30 June 2012, with the exception of the Additional Teachers component which expires on 31 December 2012.

Background
54 Northern Territory Emergency Response: Evaluation Report 2011
Events since the arrival of Europeans are relevant to understanding the present situation; however, this brief history will focus on events in the past 20 years beginning with the start of the formal reconciliation process.
The Council for Aboriginal Reconciliation was set up in 1991, with bipartisan support, to provide a formal process for progressing reconciliation. The council wound up at the end of 2000, to be replaced by a new national body, Reconciliation Australia, in 2001.
In 2002, Dr William Jonas, the Aboriginal and Torres Strait Islander Social Justice Commissioner, presented to Parliament the Social justice report 2001 and Native title report 2001. The reports questioned what had happened to reconciliation and expressed concerns about the nation’s lack of progress in achieving rights for Indigenous Australians.
In July 2003, the then Prime Minister, the Hon John Howard, called a national meeting with Indigenous leaders on violence in Indigenous communities and committed extra funding to address the problem.
In the same year, the Australian Institute of Family Studies released its comprehensive report, Child abuse and neglect in Indigenous Australian communities. The report analysed factors leading to child abuse and concluded that community-based responses which empower Indigenous Australians were needed to protect Indigenous children.201
In June 2004, the Council of Australian Governments (COAG) agreed to the National Framework on Indigenous Family Violence and Child Protection (the National Framework).
On 16 March 2005, the Aboriginal and Torres Strait Islander Commission was abolished in a bipartisan vote.
On 15 May 2006, on ABC TV, the Crown Prosecutor in Alice Springs, Dr Nanette Rogers, aired reports and allegations about longstanding issues of violence and child abuse in Aboriginal communities.202 This followed almost a decade of media reporting on assault, murder and suicide in Indigenous communities in northern and remote Australia. Dr Rogers’ comments received considerable support and calls for action from Indigenous people, including well-publicised support from the women’s centre at Yuendemu.203
In June 2006, the Australian Government, through the auspices of COAG, convened the Intergovernmental Summit on Violence and Child Abuse in Indigenous Communities, which involved ministers from all states and territories. The Australian Government provided $130 million over four years to support an action strategy developed at the summit, which included $40 million for additional police resources in Indigenous communities.
COAG agreed:
• to provide more resources for policing in very remote areas, where necessary, and to establish joint strike teams on a bilateral basis
• to work in remote Indigenous communities where there is evidence of endemic child abuse or violence
201 J. Stanley, A. Tomison & J. Pocock, Child abuse and neglect in Indigenous Australian communities, Australian Institute of Family Studies, Melbourne, 2003. 202 T. Jones, ‘Crown prosecutor speaks out about abuse in Central Australia’, Lateline, ABC TV, 15 May 2006, Available at: <http://www.abc.net.au/lateline/content/2006/s1639127.htm>. 203 S. Smith, ‘Indigenous community expresses thanks for exposing child abuse’, ABC broadcast, 26 June 2006, Available at: <http://www.abc.net.au/lateline/content/2006/s1672370.htm>.

Background
Northern Territory Emergency Response: Evaluation Report 2011 55
• to invest in community legal education for Indigenous people to ensure they were informed about their legal rights, understood how to access assistance and were encouraged to report incidents of violence and abuse
• that governments should work together to fund and administer complementary measures that address key contributing factors to violence and child abuse, such as alcohol and substance misuse, in Indigenous communities
• to further support communities seeking to control access to alcohol and illicit substances at a local level
• to provide additional resourcing for drug and alcohol treatment and rehabilitation services in regional and remote areas, with states and territories agreeing to encourage magistrates to make attendance at drug and alcohol rehabilitation programs mandatory as part of bail conditions or sentencing
• to an early intervention measure to improve the health and wellbeing of Indigenous children living in remote areas by trialling an accelerated rollout of Indigenous child health checks in high-need regions, the locations of which were to be agreed on a bilateral basis
• that jurisdictions work together on addressing low rates of school attendance in Indigenous communities to increase the future life chances of Indigenous children.
On 13 July 2006, following a resolution by the Australasian Police Ministers’ Council and supported by COAG, the Australian Crime Commission (ACC) Board authorised the National Indigenous Violence and Intelligence Taskforce to address issues raised by the summit. The taskforce, led by the ACC, was jointly resourced by the Australian and states and territory governments, and involved the Australian Federal Police, state and territory police forces and other relevant agencies.
A 2006 COAG communiqué, which reported on the outcomes of the summit and the other developments, covered many of the same areas as the NTER announcement would one year later, but at substantially lower funding levels.204
On 8 August 2006, the Northern Territory Government convened the Board of Inquiry into the Protection of Aboriginal Children from Sexual Abuse, which was co-chaired by Ms Patricia Anderson and Rex Wild QC.
The board of inquiry released the ‘Little children are sacred’ report on 15 June 2007. The report recommended the ‘Aboriginal child sexual abuse in the Northern Territory be designated as an issue of urgent national significance by both the Australian and Northern Territory government.’205
On 21 June 2007, the then Prime Minister, the Hon John Howard, and the then Minister for Families, Community Services and Indigenous Affairs, the Hon Mal Brough, announced national emergency measures aimed at protecting Aboriginal children in the Northern Territory from abuse and giving them a better, safer future. The then Leader of the Opposition, the Hon Kevin Rudd, offered bipartisan in-principle support.
204 COAG, COAG Meeting: Communiqué 14 July 2006, COAG, Canberra, 2006, Available at: <http://www.coag.gov.au/coag_meeting_outcomes/2006-07-14/index.cfm>. 205 P. Anderson & R. Wild, Ampe Akelyernemane Meke Mekarle: ‘Little children are sacred’, Report of the Northern Territory Board of Inquiry into the Protection of Aboriginal Children from Sexual Abuse, Northern Territory Government, Darwin, 2007, p. 7.

Background
56 Northern Territory Emergency Response: Evaluation Report 2011
Although the Australian Government’s measures were an urgent response to the problems highlighted by the ‘Little children are sacred’ report, they did not directly address its specific recommendations.
As had numerous previous reports, the ‘Little children are sacred’ report underlined:
• the strong connections between alcohol abuse, violence, child abuse and neglect
• the destructive effects of alcohol for Aboriginal communities
• that many children were not protected and nurtured, and many children were not attending school
• the important contribution of schools and schooling in keeping children safe, and their potential as positive influences in children’s lives.
The report included 97 recommendations and stressed that they should be approached in consultation with communities:
In the first recommendation, we have specifically referred to the critical importance of governments committing to genuine consultation with Aboriginal people in designing initiatives for Aboriginal communities, whether these be in remote, regional or urban settings.206
It also noted that the problem had arisen over a long period and advised that the response required a similarly long-term commitment:
However, it must be said again that the problems that we—and anyone else who has investigated or even visited Aboriginal communities—have encountered are so fundamental that nothing short of a massive reform effort, coupled with a long-term injection of funds, can hope to turn them around.207
The subsequent implementation and evolution of the NTER into its current form are detailed in the ‘Implementation’ section. Understanding why this particular suite of measures was chosen requires a brief analysis of the social, cultural and demographic context in which the NTER has operated.
Context In analysing the reasons behind the problem, the authors of the ‘Little children are sacred’ report concluded that this was not an Indigenous problem but a problem of disadvantage and social exclusion.208 The following describes the demography and circumstances of people in the affected communities in terms of health, employment, education, housing and safety.
Demographics of the affected communities Not all Indigenous Territorians were included in the NTER initiatives. The area designated for the NTER included most Aboriginal townships and town camps in the Northern Territory. Some measures, including alcohol restrictions, five-year leases and pornography measures apply over wide areas, known as ‘prescribed areas’. Prescribed areas are defined in the Northern Territory National Emergency Response Act 2007 (NTNER) and include:
• Aboriginal land defined under the Aboriginal Land Rights (Northern Territory) Act 1976
206 Ibid., p. 21. 207 Ibid., p.17. 208 Ibid., p. 6.

Background
Northern Territory Emergency Response: Evaluation Report 2011 57
• roads, rivers, streams, estuaries or other areas on Aboriginal land
• areas known as Aboriginal Community Living Areas (a form of freehold title issued to Aboriginal corporations by the Northern Territory Government)
• town camps declared by the Minister for Families, Housing, Community Services and Indigenous Affairs (the Minister) under the Northern Territory National Emergency Response Act
• any other area declared by the Minister to be a prescribed area.
Indigenous Australians living in the Northern Territory but outside those areas did not receive funding and services under the NTER; however, they may have received funding and services under the other agreements referenced in this evaluation, such as the National Partnership on Indigenous Economic Participation or the Smarter Schools National Partnerships. Map 2.1 shows the NTER communities.
The number of Indigenous people living in NTER prescribed areas has been estimated to be 44,229 in 2006 and has been projected to grow to 45,654 by 2008.209
The Indigenous population of the Northern Territory is far less urbanised than the Indigenous population in other states. In 2006, 32 per cent of Indigenous people in Australia lived in major cities, 21 per cent in inner regional areas, 22 per cent in outer regional areas, 9 per cent in remote areas and 15 per cent in very remote areas. In contrast, 80 per cent of the Indigenous population in the Northern Territory lived in remote or very remote areas; the remainder lived in Darwin, which is classified as outer regional.210
The distance from metropolitan centres creates problems in accessing employment markets, government services and even basics such as fresh food for far more Indigenous people in the Northern Territory than for Indigenous people in other states.
The number of Aboriginal towns within this predominantly remote settlement pattern is growing. Only three Aboriginal towns had a population of over 1,000 people 20 years ago. Barely 12 per cent of the Territory’s remote area Aboriginal population lived in these three towns. Now there are 10 such towns, which are home to more than one-quarter of the prescribed area population, and four more settlements will soon reach that size.211
Like Australia’s Indigenous population as a whole, the Indigenous population of the Northern Territory is relatively young. Of the projected population in NTER prescribed areas in 2008, 4,166 were aged 0–3 years, 2,408 were aged 4–5 years (pre-school age), 9,811 were aged 6–15 years (school age), 9,200 were aged 15–24 years (youth), 15,998 were aged 25–49 years (working age) and 5,026 were over 50 years of age.212
In 2006, nearly three-quarters (74%) of Indigenous people in very remote parts of the Northern Territory spoke an Indigenous language at home compared with 66 per cent of Indigenous people in remote parts of the Territory.213
209 NTER Review Board, Northern Territory Emergency Response: Report of the NTER Review Board, NTER Review Board, Canberra, 2008, p. 17. 210 ABS, Experimental Estimates of Aboriginal and Torres Strait Islander Australians, Jun 2006, cat. no. 3238.0.55.001, ABS, Canberra, 2008. 211 NTER Review Board, op. cit., p. 18. 212 Ibid., p. 17. 213 ABS, 2006 Census of Population and Housing, cat. no. 2914.0, ABS, Canberra, 2007.
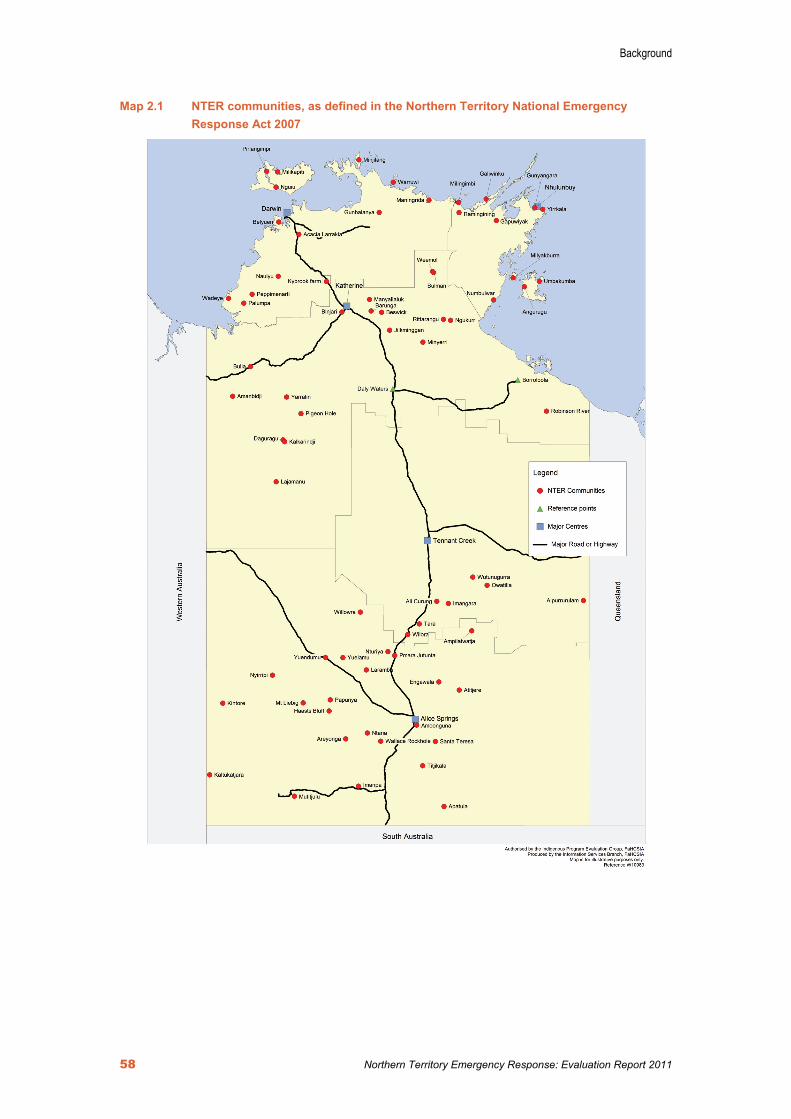
Background
58 Northern Territory Emergency Response: Evaluation Report 2011
Map 2.1 NTER communities, as defined in the Northern Territory National Emergency Response Act 2007

Background
Northern Territory Emergency Response: Evaluation Report 2011 59
Health Indigenous people in the Northern Territory have long suffered substantially poorer health than other Australians, including Indigenous people in other states.214
Estimates for the 2005–07 period show that Indigenous life expectancy in the Northern Territory is lower than in any other jurisdiction, at 61.5 years for males and 69.2 years for females. This is well below the corresponding estimates for the Indigenous population of Australia as a whole (67.2 for males and 72.9 years for females). Life expectancy for non-Indigenous Australians in the Northern Territory is 76 years for males and 81 years for females.215
For the period from 2003 to 2007, the mortality rate for Indigenous children under five in the Northern Territory was 3.6 deaths per 1,000—three times the rate for non-Indigenous children.216
Over the two years from 2006–07 to 2007–08, Indigenous children in the Northern Territory were hospitalised at more than two and half times the rate of non-Indigenous children (457.4 per 1,000 compared to 178.1 per 1,000).217
Babies born to Indigenous mothers in the Northern Territory are more than two and a half times as likely to have low birthweight as those born to non-Indigenous mothers. While access to antenatal care for Indigenous women in the Northern Territory has improved, access still occurs later and less frequently than for other women. Less than half of Indigenous women in the Northern Territory attended at least one antenatal visit during the first trimester.218
Employment In 2008, the year after the ‘Little children are sacred’ report was released, the National Aboriginal and Torres Strait Islander Social Survey showed that 61.1 per cent of working-age Indigenous people in the Northern Territory were in the labour force (that is employed or unemployed). This compares to 86.9 per cent of non-Indigenous Territorians. The unemployment rate for Indigenous Australians (age 15-64) in the Northern Territory was 16.8 per cent in 2008 compared to 2.2 per cent for non-Indigenous Territorians.219
The employment rate for Indigenous people of working age (15–64) in the Northern Territory in 2008 was 50.8 per cent. However, the employment rate decreases from 50.8 per cent to 33.3 per cent if Community Development Employment Project (CDEP) participants are not counted as employed.220
A family history of limited access to educational opportunities and of exclusion from employment increases the probability of Indigenous children experiencing intergenerational unemployment. In 2006, only 6 per cent of working-age Indigenous people living in very remote areas of the Northern Territory had completed Year 12 schooling or its equivalent.221
214 Much of the existing data on the status of Indigenous people at or around the date of commencement of the NTER can be found in: COAG Reform Council, National Indigenous Reform Agreement: Baseline performance report for 2008–09, COAG Reform Council, Sydney, 2010. 215 ABS, Deaths, Australia, 2009, cat. no. 3302.0, ABS, Canberra, 2010. 216 COAG Reform Council, op. cit., p. 59. 217 Ibid., p. 65. 218 Ibid., pp. 69–70. 219 Ibid., p. 106. 220 Ibid., p. 105. CDEP figures derived using 2008 National Aboriginal and Torres Strait Islander Social Survey data. 221 Ibid., p. xvii.

Background
60 Northern Territory Emergency Response: Evaluation Report 2011
It was not until 1964 that the Northern Territory Social Welfare Ordinance legislated the same employment conditions for Indigenous people. Even then, two-thirds of Indigenous people living on Christian missions and government settlements were excluded under the Ward’s Employment Ordinance.222
Improvements in the legal status of Indigenous people did not always result in immediate benefits. In 1966, the Conciliation and Arbitration Commission found in favour of an application from the North Australian Workers’ Union for award wages for Aboriginal pastoral workers. Many Indigenous workers in the cattle industry lost their jobs and Indigenous communities were moved off properties that were their traditional lands.223
Overall, Indigenous employment in the Northern Territory has remained low since the 1970s. Employment of Indigenous women has grown, but Indigenous men in the Territory are now significantly less likely to be employed than they were in the 1970s.
Education School attendance and achievement in literacy and numeracy tests is lower for Indigenous students than non-Indigenous students and declines over the years of schooling. In 2008, up to 13 per cent of Indigenous children in the Northern Territory failed to enrol, the attendance rate was 64 per cent and only around 20 per cent of students achieved national benchmarks in literacy and numeracy.224
Less than half of Indigenous people aged 20–24 have attained Year 12 or its equivalent, and attainment rates steadily decrease with remoteness. The Northern Territory has the lowest attainment rate (18.3%) and the largest gap between Indigenous and non-Indigenous attainment rates: non-Indigenous people in the Northern Territory are four times more likely to have attained at least Year 12 than their Indigenous counterparts.225
The provision of educational opportunities to Indigenous children has historically been poor, and problems in retaining sufficient trained teachers in remote areas persist.
The education of Indigenous children did not come under the Department of Education until 1940. The first formal schooling for Aboriginal children in the Northern Territory was provided in 1950. The lack of facilities was rationalised by the claim that children ‘beyond the age of 10 couldn’t keep up with white children anyway’.226
The Northern Territory Department of Education and Training (NT DET) now has the primary responsibility for public education in the NTER communities. In 2007, NT DET began to negotiate ‘remote learning partnerships’, which involve discussions between the communities and NT DET staff to arrive at agreed processes and priorities for the next five years. Agreements reached include joint governance arrangements, set targets for student attendance, the provision of cultural support, community-appropriate education program design and student education outcomes, particularly in literacy and numeracy.
222 Creative Spirits, Aboriginal Timeline, Available at: <http://www.creativespirits.info/aboriginalculture/history/aboriginal-history-timeline-late-20th.html#ixzz1UVcpd8JW>. 223 Ibid. 224 NTER Review Board, op. cit., p. 30. Information on students achieving national minimum standards was based on results of the Northern Territory’s assessment program. Beginning in 2008, national minimum standards for literacy and numeracy have been based on the National Assessment Program Literacy and Numeracy (NAPLAN). 225 COAG Reform Council, op. cit. 226 Creative Spirits, op. cit.

Background
Northern Territory Emergency Response: Evaluation Report 2011 61
Housing A review of the Community Housing and Infrastructure Program undertaken in 2007 found that Indigenous Australians have little access to public housing, private rental or home ownership, and that the available houses were inappropriate to local needs, poorly constructed and poorly maintained.227
In 2006, Biddle estimated that 31.5 per cent of dwellings in remote areas of the Northern Territory required major repair or replacement.228 The maintenance burden on Indigenous communities is exacerbated by poor construction standards. A review of housing and infrastructure conducted by PricewaterhouseCoopers found that ‘most remedial work is normal wear and tear, and that poor specifications and faulty workmanship are 2.5 times more likely to be the cause of maintenance problems than intentional or unintentional damage.’229
According to the 2006 Census, two thirds (66%) of Indigenous people in the Northern Territory were living in overcrowded households. The comparative figure for all Australians in 2006 was only 6 per cent. Analysis conducted by the Centre for Aboriginal Economic Policy Research, and based on data from the Australian Bureau of Statistics 2006 Housing and Infrastructure Needs Survey, indicates an occupancy rate in the Northern Territory at 9.4 persons per household230 compared to a national average occupancy rate of 2.56 persons per household in 2007-08.231
If the dwellings that required major repair or replacement were eliminated, it has been estimated that 7,827 additional houses would be required to achieve the average household size for dwellings Australia-wide.232
National Partnership Agreement on Remote Indigenous Housing (NPARIH) is the Indigenous housing program undertaken by the Australian and Northern Territory governments to help close the gap on Indigenous disadvantage across the Territory. Improved housing is fundamental to achieving improvements in Indigenous health, education and employment and makes a major contribution towards closing the gap in life outcomes between Indigenous and other Australians.
NPARIH specifically acknowledges the importance of effective community engagement in the design and delivery of remote Indigenous housing and aims to encourage best practice and innovation in the design and construction of capital works projects. All capital works are required to comply with the Building Code of Australia, relevant Australian Standards and the National Indigenous Housing Guide. The guide helps to ensure that housing is appropriate to the needs of Indigenous Australians, particularly those living in remote Indigenous communities.
As of 30 June 2011, the NPARIH had delivered 324 new houses in the Northern Territory, exceeding the target of 310. Over the same timeframe, 1,592 refurbishments were completed, exceeding the target of 1,182.
227 PricewaterhouseCoopers, Living in the sunburnt country: Findings of the review of the community housing and infrastructure program, PricewaterhouseCoopers for FaHCSIA, 2007, p. 16. 228 N. Biddle, The scale and composition of Indigenous housing need, 2001–06, CAEPR working paper no. 47, Centre for Aboriginal Economic Policy Research, 2008, p. 14. 229 PricewaterhouseCoopers, op. cit., p. 41. 230 Households included are those households residing in functional dwellings managed by the Indigenous Housing Organisation. 231 ABS, Housing Occupancy and Costs, 2007-08, cat. no. 4130.0, ABS, Canberra, 2009. 232 N. Biddle, op. cit., p. 15.

Background
62 Northern Territory Emergency Response: Evaluation Report 2011
Safety In 2008, 20 per cent of Indigenous people aged 15 and above in remote and very remote parts of the Northern Territory reported being the victim of actual or threatened violence in the previous 12 months.233 Of Indigenous people aged 15 and above living in remote and very remote parts of the Northern Territory, 34 per cent reported family violence as being a concern in their community in 2008. This compares to 25 per cent for all Indigenous Australians.
Initiatives to control the supply and reduce alcohol related harm were already in place prior to the NTER. This included regulation of alcohol advertising and promotional activities, requirements for the responsible service of alcohol, new public restricted areas, general restricted areas and over 110 private restricted premises. There were also strong measures to seize and dispose of vehicles following breaches of the Liquor Act.
The Northern Territory (NT) Police had also implemented several crime reduction strategies prior to the NTER, the effects of which will have occurred simultaneously with changes under the NTER. This included:
• the Remote Community Drug Strategy—implemented in 2004 to minimise the incidence of illegal drugs in remote communities
• the Peace at Home Project—a joint NT Police and Department of Health and Families initiative designed as a new approach to tackling child abuse and family violence by closer coordination, including with non-government service providers
• the Child Abuse Taskforce—established initially in Darwin in 2006 followed by establishment of an arm in Alice Springs. The taskforce’s role is to investigate complex cases of child sexual abuse and sexualised behaviour across the Northern Territory. The taskforce was funded as an ongoing initiative under the 2007 Northern Territory Closing the Gap strategy.
In November 2007, the Legislative Assembly passed the Northern Territory Domestic and Family Violence Act 2007 (the Act). The definition of ‘domestic relationship’ within the Act is broader than the definition contained within the previous Domestic Violence Act 1992. Changes to the Domestic and Family Violence Act came into effect on 12 March 2009, when it became mandatory for all adults in the Northern Territory to report serious physical harm to police. The serious harm needs to be actual, suspected or an imminent threat between people in a domestic or family relationship.234
The current NT Police Violent Crime General Order sets out processes and procedures for police response to, and investigation of, domestic violence incidents and related criminal offences. It details procedures for initiating civil and criminal action in those matters. The order also states that ‘a prosecution may proceed despite the wishes of an unwilling victim …’ All assaults related to family and domestic violence are recorded, even if the victim does not want to proceed with criminal charges.235
In addition to the challenges posed by the remoteness and the health, employment, education, housing and safety issues facing people within the NTER communities, there are issues with raising revenue and high cost of service delivery.
233 ABS, National Aboriginal and Torres Strait Islander Social Survey, cat. no. 4714.0, ABS, Canberra, 2008. 234 Northern Territory Government, Domestic and Family Violence Reporting, Available at: <http://www.safeterritory.nt.gov.au/stopping_violent_crime/domestic_violence_reporting.html>. 235 ABS, Recorded crime, Victims, Australia, 2009, cat. no. 4510, ABS, Canberra, 2010, p. 85.

Background
Northern Territory Emergency Response: Evaluation Report 2011 63
Structural issues for raising government revenue in the Northern Territory Under Australian constitutional arrangements, the Australian Government has a greater capacity to raise revenue than the states and territories, and fewer service delivery commitments. In recognition of those circumstances, the Commonwealth provides both untied funding (predominantly goods and services tax (GST) revenue) and tied funding (specific purpose payments) to the states and territories.
The Commonwealth Grants Commission (CGC), is responsible for recommending the distribution of GST revenue to the Australian Government such that:
each of the six States, the Australian Capital Territory and the Northern Territory (the States) would have the capacity to provide services and the associated infrastructure at the same standard, if each State made the same effort to raise revenue from its own sources and operated at the same level of efficiency.236
In order to make its assessment, the CGC considers a jurisdiction’s revenue raising capacity and government service delivery obligations. The CGC shows that the Territory’s per capita revenue raising effort is about 20 per cent above the national average, and its per capita revenue capacity is the same as the national average. Territory own-source revenue contributes 19 per cent ($864 million) of the Territory’s 2011–12 budget. This is not expected to change significantly in the near future. In comparison, own-source revenue in other states is in the order of 50 per cent.
The cost of providing services in the Territory is higher, given the Territory’s small population, which is dispersed over a large and very remote landmass, and its high proportion (about 30%) of Indigenous people, many of whom live in remote areas. The 2010 Indigenous Expenditure Report found that 53.9 per cent of Territory government expenditure was related to its Indigenous population.
The CGC estimates that the per capita costs of delivering services in the Territory are about 2.15 times the national average. The Northern Territory Government considers that an underestimate. The costs were derived on the basis of average services compared to other states. Arguably, higher levels of service are required in the Northern Territory to redress the legacy of disadvantage amongst Indigenous Territorians in areas such as health and education.
Research by the Centre for Aboriginal Economic Policy Research indicates that continuing high costs and low revenues have led to high levels of unmet need and consequent disadvantage in Indigenous townships and other communities compared to communities or townships of similar size in other parts of remote Australia.237
Cost differential Remoteness from the major population centres increases the cost of goods and services in the NTER communities. Issues include a shortage of skilled labour due to competition with the resources industry, transport costs due to the long distances and time taken, irregular services to communities, and lack of competition.
236 Commonwealth Grants Commission, What is horizontal fiscal equalisation (HFE)?, Frequently asked questions, Available at: <http://www.cgc.gov.au/fiscal_equalisation/navigation/4>. 237 J. Taylor and O. Stanley, The opportunity costs of the status quo on the Thamarrurr Region: Northern Territory, CAEPR working paper no. 28, Centre for Aboriginal Economic Policy Research, Canberra, 2005.

Background
64 Northern Territory Emergency Response: Evaluation Report 2011
Provision of goods and services to remote communities involves additional transport costs and rarely affords the economies of scale that benefit metropolitan consumers. For example, in June 2011, a typical basket of groceries cost around $193.55 in Darwin. The same basket of groceries cost $232.51 in Nhulunbuy and $264.50 in Yulara.238
A review of the drivers of housing costs in the Northern Territory noted that there ‘are significant additional risks priced into remote area work’, that prices are increased by the need to meet mixed purposes, such as providing training and capacity building, and that buildings in remote communities require high standards and robust construction.239
Summary Low levels of employment; poor educational opportunities, participation and attainment; substandard housing; a backlog of infrastructure requirements; limited locally raised revenues; and high costs are key elements of the backdrop against which the NTER measures have been implemented.
Despite these pervasive and enduring issues, the authors of the ‘Little children are sacred’ report found that the number of perpetrators of abuse was small and that considerable functionality remains, together with a strong will to overcome the problems.240
Concurrent Northern Territory Government activities The Northern Territory Government continued to roll out its own programs and evolve its own policies after the Australian Government initiated the NTER. The five activities discussed below are particularly relevant to the NTER. Many of these policies interact with NTER measures and some, especially the local government reforms, have become confused with the NTER in many people’s minds.
Closing the Gap on Indigenous Disadvantage—a Generational Plan of Action was the Northern Territory Government’s own response to the ‘Little children are sacred’ report. The plan of action was launched on 20 August 2007 and included responses to the 97 recommendations outlined in the report.
The plan went beyond the recommendations of the inquiry and sought to address the underlying social and environmental factors contributing to child sexual abuse. The Northern Territory Government subsequently committed more than $286 million to the implementation of the plan in the first five years, and committed to a range of targets over the next 20 years in the areas of safety, health, education, housing, jobs, culture and ‘a better way of doing business’.
Territory 2030 is the planning document that sets the Northern Territory Government’s direction for the next 20 years, and includes priorities for society, economic sustainability, health and wellbeing, the environment, and knowledge, creativity and innovation.
A Working Future is the Northern Territory Government’s plan for improving the lives of remote Territorians. The plan involves six priority areas: Territory Growth Towns; Homelands and Outstations; Remote Service Delivery; Employment and Economic Development; Remote Transport Strategy; and Closing the Gap Targets and Evaluation. It includes a commitment
238 Northern Territory Government, Grocery Price Index: June 2011, Northern Territory Government, Darwin, 2007, Available at: <http://www.nt.gov.au/ntt/economics/publications/gps/gps_2011jun.pdf>. 239 Szava, M. Moran, B. Walker & G. West, The cost of housing in remote Indigenous communities: Views from the Northern Territory construction industry, Centre for Appropriate Technology, Alice Springs, 2007, pp. 1–2. 240 P. Anderson & R. Wild, op. cit., p. 6.

Background
Northern Territory Emergency Response: Evaluation Report 2011 65
that the Australian and Northern Territory governments will work together to provide services that local people need supported by staff from both governments working together and ‘one-stop shops’ in remote towns.
Local government reforms were announced by the Northern Territory Government in October 2006. The intention was to improve and expand the delivery of services to towns and communities across the Territory by establishing new shire councils in larger regional areas. Many existing local councils had a poor history of service provision, accountability and staff retention, and many were not financially viable. However, many were also local Aboriginal community councils that were perceived to be responsive and representative of their communities; their abolition left a gap in local governance arrangements.
The system came into full effect on 1 July 2008. It includes new shire boundaries, the establishment of shire council offices in major centres, the appointment of shire council senior staff, the ongoing recruitment of staff, the installation of unified business systems, and the development of shire business plans which include details on core and agency services to be provided in each community.
Growing them strong, together241, the 2010 report of the Board of Inquiry into the Child Protection System in the Northern Territory, provided a series of recommendations that were picked up in the Safe Children, Bright Futures Strategic Framework 2011.242 The framework includes:
• the setting up of the Department of Children and Families
• a strategy for reducing the backlog of child protection investigations
• strengthening the role of the Aboriginal community sector
• supporting foster carers
• building community capacity
• strengthening the legal framework
• supporting staff.
These concurrent activities focussed on long term planning, the wellbeing of children, employment, local governance and the manner in which the Northern Territory and Australian governments would work together; many of the same areas that the NTER would also address.
Implementation of the NTER On 21 June 2007, the then Minister for Families, Community Services and Indigenous Affairs, the Hon Mal Brough, issued a media release on the national emergency response to protect Aboriginal children in the Northern Territory. He announced that the Australian Government was implementing immediate, broad-ranging measures to stabilise and protect communities in the crisis area:
241 M. Bamblett, H. Bath & R. Roseby, Growing them strong, together: Promoting the safety and wellbeing of the Northern Territory’s children, Northern Territory Government, Darwin, 2010. 242 Northern Territory Government, Safe children, bright futures, strategic framework 2011–2015, Northern Territory Government, Darwin, 2011.

Background
66 Northern Territory Emergency Response: Evaluation Report 2011
The situation facing children in Indigenous communities is a national emergency and the immediate action of the Australian Government is an appropriate response to the crisis highlighted by the Little Children are Sacred report.243
When announcing the NTER, the Minister said that ‘the Government’s approach to the emergency in the Northern Territory is in three phases; stabilising; normalising and then exiting.’244
‘Exiting’ evolved into the current development phase. The aim of this phase is to maintain and strengthen the core NTER measures while placing a greater emphasis on community engagement and partnerships, and building capability and leadership within Indigenous communities.245
Initial NTER measures The NTER has evolved since its initial rollout; however, the core themes have remained. Key measures announced and implemented at the start of the NTER were:
• increased policing levels, including the secondment of officers from other jurisdictions to supplement Northern Territory resources
• comprehensive health checks for Indigenous children under 16 years of age to identify and treat health problems, including identifying follow-up and ongoing health care requirements (the checks were initially to be compulsory and to include a forensic examination for sexual abuse but were changed to non-compulsory basic health checks in response to feedback prior to the conduct of any checks)
• clean-up and repair of communities to make them safer and healthier, with local people encouraged to participate through Work for the Dole
• widespread alcohol restrictions
• welfare reforms to reduce the amount of money into alcohol and substance abuse and to ensure funds intended for children's welfare and development are used for children
• indirectly improving school attendance through the provision of school meals
• compulsory five-year leases to the Commonwealth over land in 64 communities, later modified to include provisions to pay reasonable compensation to relevant landowners if those leases constitute an acquisition of property within the meaning of the Constitution
• improvements to essential infrastructure in communities
• banning possession or supply of X 18+ films, restricted publications, ‘refused classification’ material, and unclassified material that would be classified at those levels
• auditing of publicly funded computers to identify prohibited material
• changes to the permit system for access to Aboriginal land under the Aboriginal Land Rights (Northern Territory) Act 1976, including in relation to government officials, common areas of major communities and road corridors
• improved governance through the appointment of Government Business Managers (GBMs) to remote communities; GBMs are Department of Families, Housing, Community
243 M. Brough, ‘National Emergency Response to protect Aboriginal children in the NT’, media release, FaHCSIA, 21 June 2007, Available at: <http://www.formerministers.fahcsia.gov.au/malbrough/mediareleases/2007/Pages/emergency_21june07.aspx>. 244 M. Brough, ‘Howard Government getting on with the job of protecting children in the Northern Territory’, media release, FaHCSIA, 6 August 2007, Available at: <http://www.formerministers.fahcsia.gov.au/malbrough/mediareleases/2007/Pages/nter_6aug07.aspx>. 245 COAG, Closing the Gap in the Northern Territory National Partnership Agreement, op. cit.

Background
Northern Territory Emergency Response: Evaluation Report 2011 67
Services and Indigenous Affairs (FaHCSIA) employees deployed into remote communities to provide a key liaison and consultation point between governments and other stakeholders and the community members.
Engagement initiatives were included later as a result of the NTER redesign, after extensive consultations with communities, but there were no specific engagement measures at the start of the NTER.
The Northern Territory National Emergency Response Act introduced by the then Australian Government deemed the measures to be ‘special measures’ for the purposes of the Racial Discrimination Act 1975 (RDA) but also excluded the operation of Part II of RDA to the NTER, including the RDA provisions relating to special measures.246
The government also announced the closure of the CDEP program. The objective was to replace CDEP with ‘real jobs’ with better pay and conditions (award rates of pay, superannuation and holiday pay) and training through the Indigenous Employment Program (IEP), formerly the Structured Training and Employment Projects (STEP) and STEP—Employment and Related Services (STEP ERS), as well as the Job Network and Work for the Dole.
Approximately 8,000 individuals were receiving CDEP prior to its progressive withdrawal throughout the Northern Territory. As well as the loss of employment, the uncertain status of CDEP and replacement programs made it difficult for some service delivery agencies and organisations to plan workforce needs. For example, outstation service delivery was underpinned by the CDEP.
The emergency Minister Brough’s media release stated that the emergency response was to be overseen by a taskforce and that control of the majority of the measures would be transferred to the Australian Government.247 Some measures, such as child health checks and income management, were already administered by the Australian Government. This limited the participation of the Northern Territory Government in planning and design at the start of the NTER.
Immediately following the announcement, the Australian Defence Force was mobilised to facilitate implementation. The first survey teams and child health check teams were sent into communities. The Army’s Norforce unit assisted implementation by providing logistical support, including vehicles and long-range communications, and assistance with community liaison. The soldiers were unarmed and not involved in policing or security tasks.
An NTER Operations Centre was established by FaHCSIA. It was responsible for whole-of-government coordination in implementing NTER initiatives. All key Australian government departments and agencies were involved in implementing the stabilisation phase.
The Northern Territory Emergency Response Taskforce provided advice to the Australian Government on a range of issues and oversaw the Operations Centre.
In June 2008, the taskforce provided a final report to the Australian Government with recommendations on a range of topics.248 The rollout and continuation of measures were then
246 A full analysis of the suspension and later reinstatement of Part II of the Racial Discrimination Act is in the ‘Engagement’ section of the ‘Overview’ chapter of this report. 247 Ibid. 248 Northern Territory Emergency Response Taskforce, Final report to government, FaHCSIA, Canberra, 2008.

Background
68 Northern Territory Emergency Response: Evaluation Report 2011
transferred to normal delivery structures and processes managed through the Australian Government agencies, the FaHCSIA Northern Territory office and Indigenous Coordination Centres.
The initial implementation was rapid, bypassing existing engagement mechanisms and requiring the setting aside of normal management disciplines and legislative protections and the overriding of locally developed and owned management practices. The rapidity of rollout did not allow for adequate consultation, customisation to local circumstances or integration with mainstream and Northern Territory Government services.
Communities were concerned and angered by the suspension of the Racial Discrimination Act, changes to the permit system, the new leasing arrangements, signage relating to alcohol and pornography restrictions, compulsory income management, the abolition of CDEP, and were confused and inconvenienced by the BasicsCard.
The rushed imposition broke trust and shamed people. Reflecting on this period in its 2008 report, the NTER Review Board concluded that ‘[t]he Intervention was fuelled, accelerated and flawed by the heightened emotion that surrounded its inception.’249
Despite these issues, many people welcomed the high priority that the government accorded the issue, the direct intervention from Canberra and the substantial increase in funding. In an article critical of the failure of earlier policies, Professor Marcia Langton wrote, ‘[i]n some critical respects, the outcome is what many have recommended for decades: interventions to prevent the abuse, rape and assault of Aboriginal women and children and decisive action against the perpetrators.’250
Change of Government A federal election was called in September 2007; three months after the emergency response. A new ministry commenced on 3 December 2007, with the Hon Kevin Rudd as Prime Minister and the Hon Jenny Macklin as Minister for Families, Housing, Community Services and Indigenous Affairs.
In December 2007, the new Australian Government established an advisory group of 25 Aboriginal leaders from the Northern Territory to discuss the implementation of the NTER measures and to provide feedback to Minister Macklin.
The government indicated that it remained committed to the emergency response, but wanted to place a stronger emphasis on consultation and engagement with communities and on identifying opportunities for economic development.
On 12 February 2008, Prime Minister Kevin Rudd tabled a motion offering a broad apology to all Indigenous people and the Stolen Generations.251
NTER Review Board The Australian Government commissioned an independent review of the NTER in June 2008. It appointed a three-person review board comprising Mr Peter Yu (as chair), Ms Marcia Ella Duncan and Mr Bill Gray AM. An expert group, comprising 10 subject matter experts from a
249 NTER Review Board, op. cit., p. 58. 250 M. Langton, ‘It’s time to stop playing politics with vulnerable lives’, Sydney Morning Herald, 30 November 2007, Available at: <http://culturematters.wordpress.com/2007/11/30/marcia-langton-on-the-nt-intervention/>. 251 K. Rudd, House of Representatives, Official Hansard, no. 1, 12 February 2008, p. 165.
Background
Northern Territory Emergency Response: Evaluation Report 2011 69
range sectors, including health, child welfare and education, supported the NTER Review Board.
The review invited public submissions252 and undertook consultations with Indigenous people. From 9 July to 25 August 2007, the board visited 31 communities and met with representatives of 56 communities.
The NTER Review Board provided its report to the Australian Government on 13 October 2008. The report noted the deep belief amongst Aboriginal people that the NTER measures were imposed based on race, and a sense of injustice that Aboriginal people were being blamed for problems arising from decades of neglect. The board also found that, despite the problems with the manner in which the intervention had occurred, there were ‘definite gains as a result of the Intervention’ and ‘widespread, if qualified, community support for many NTER measures.’253
The report named some measures that received widespread support, such as increases in police numbers and police stations, measures that attempt to reduce alcohol-related violence and measures for improving health and early childhood outcomes (for example, new crèches, safe houses and follow-up treatment for children).
The board also found that:
communities felt humiliated and shamed by the imposition of measures that marked them out as less worthy of the legislative protections afforded other Australians.
These concerns were most palpable in the context of comments and submissions relating to the compulsory acquisition of land and the exclusion of external merits review in the Income management scheme applied in the Northern Territory.254
The NTER Review Board noted that the intent and purpose of many measures had not been properly explained due to the speed with which the NTER was rolled out, and that initial resentment could be negated if the measures were modified and improved in consultation with communities.255
In addition to its 97 specific recommendations, the board included three overarching recommendations:
• The Australian and Northern Territory governments recognise as a matter of urgent national significance the continuing need to address the unacceptably high levels of disadvantage and social dislocation experienced by remote communities and town camps in the Northern Territory.
• Governments reset their relationship with Indigenous people based on genuine consultation, engagement and partnership.
• Government actions respect Australian human rights obligations and conform to the Racial Discrimination Act.
252 NTER Review Board, Northern Territory Emergency Response Review submissions, Available at: <http://www.nterreview.gov.au/subs.htm>. 253 NTER Review Board, Report, op. cit., p. 10. 254 Ibid., p. 46. 255 Ibid., p. 10.

Background
70 Northern Territory Emergency Response: Evaluation Report 2011
Government response
On 23 October 2008, the Australian Government provided an interim response accepting the three overarching recommendations. A final and joint response with the Northern Territory Government was provided in May 2009. The majority of NTER Review Board recommendations were supported, including those for extra police and police training; extra measures to deal with alcohol supply reduction; extra legal assistance due to increased impacts on the justice system of extra law enforcement resources; reforms to CDEP; financial literacy initiatives; a range of additional sub-measures; and refinements to existing sub-measures that would strengthen the original NTER measures.256
The NTER Review Board recommended an end to the blanket application of compulsory income management in the Northern Territory, favouring a voluntary scheme. This was not supported. The Australian Government’s response was to develop compulsory income management arrangements that conformed to the Racial Discrimination Act, but it did support an additional voluntary income management scheme for all welfare recipients, Indigenous and non-Indigenous.257
Also in May 2009, in response to the board’s recommendation to reset the relationship, the government released the Future directions for the NTER discussion paper setting out proposals for the measures affected by the RDA as a starting point for further discussion and consultation.258
Redesign consultations
From June to the end of August 2009, the Future directions discussion paper formed the basis of consultations with Indigenous people in the Northern Territory about the NTER. The specific measures under discussion were income management, alcohol and prohibited material bans, the audit of publicly funded computers, five-year leases, community stores licensing and the powers of the Australian Crime Commission.
More than 500 meetings were held in communities, attended by several thousand people. Many people in the consultation meetings said that they felt hurt, humiliated and confused by the way the NTER had been implemented.
FaHCSIA’s Report on the Northern Territory Emergency Response redesign consultations provides a synthesis of feedback from the consultations.259 An independent evaluation of the consultations conducted by the Cultural and Indigenous Research Centre Australia found that the government-run consultation process provided effective and consistent information, and that most facilitators supported free-roaming discussions and made effective use of facilitators.260
In November 2009, following on from the consultations, the Australian Government released a policy statement titled Landmark reform to the welfare system, reinstatement of the Racial Discrimination Act and strengthening of the Northern Territory Emergency Response.261 The
256 Australian Government & Northern Territory Government, Response to the report of the NTER Review Board, Australian Government, 2009. 257 NTER Review Board, op. cit., pp. 12–15. 258 Australian Government, Future directions for the Northern Territory Emergency Response, discussion paper, Commonwealth of Australia, Canberra, 2009. 259 FaHCSIA, Report on Northern Territory Emergency Response redesign consultations, FaHCSIA, Canberra, 2009. 260 Cultural and Indigenous Research Centre (CIRCA), Report on the NTER redesign engagement strategy and implementation, CIRCA, Sydney & Melbourne, 2009, p. 11. 261 Australian Government, Policy statement: Landmark reform to the welfare system, reinstatement of the Racial Discrimination Act and strengthening of the Northern Territory Emergency Response, Australian Government, 2009.
Background
Northern Territory Emergency Response: Evaluation Report 2011 71
statement set out the proposed legislative changes including the redesign of a number of NTER measures and the introduction of income management on a non-discriminatory basis.
Redesigned measures
On 25 November 2009, the Australian Government introduced legislation relating to the redesigned measures and the new income management measure into Parliament:
• The Racial Discrimination Act 1975 was reinstated and NTER measures were redesigned so they conform with it.
• The NTER alcohol restrictions remained in place, with individual communities able to tailor restrictions to their circumstances based on agreed alcohol management plans. The NTER pornography restrictions remained in place, with the option for individual communities to have them lifted. Both restrictions provide for the Minister for Indigenous Affairs to consider the wellbeing of the community, the views of the community and advice from law enforcement authorities in making such decisions.
• Because the five-year leases would expire in August 2012, changes were made to clarify their purpose and operation.
• Community stores licensing arrangements were retained and strengthened. Roadhouses and takeaway stores require licences if they are the main source of food for a community. Stores are required to have a licence to participate in income management.
• The auditing of publicly funded computers in communities was continued to ensure that they were not being used to access pornography or other inappropriate material.
• Finally, the law enforcement powers of the ACC were amended to clarify that the powers applied where violence or child abuse is committed against Aboriginal people, irrespective of whether the perpetrator is Aboriginal or not.
Closing the Gap in the Northern Territory National Partnership Agreement The NTER then transitioned into a three-year development phase under the NTNPA. The NTNPA aimed to maintain and strengthen core NTER measures, with greater emphasis on community engagement and partnerships; building leadership and capability within Indigenous communities; and resetting the relationship262 with the Indigenous community in the Northern Territory.
The NTNPA was originally signed in July 2009 and then amended in April 2011. It expires on 30 June 2012, except for the Additional Teachers component, which expires on 31 December 2012. It cross-references several other intergovernmental agreements and provides funding for initiatives implemented under the National Partnership Agreement on Remote Service Delivery (NPARSD) and the Smarter Schools National Partnership Agreements.
Employment measures introduced under the National Partnership on Indigenous Economic Participation are also monitored within the NTER framework, in recognition of the importance of employment to achieving NTER outcomes.
The NTNPA retains its focus on the improved safety and wellbeing of Indigenous children, increased school engagement and performance, and creating sustainable communities to
262 Now referred to as ‘a reformed approach to engagement’

Background
72 Northern Territory Emergency Response: Evaluation Report 2011
support children, including education and employment pathways. It is clearly an evolutionary rather than revolutionary change to the NTER.
In response to feedback from communities, it also highlighted the need to promote positive behaviours among Indigenous youth, promote personal responsibility, and reset the relationship between governments and Indigenous people, described in the agreement as being ‘key to the sustainability of progress in closing the gap in the Northern Territory’.263
The agreement is structured around eight outputs: income management and welfare reform; law and order; family support; early childhood; improving child and family health; enhancing education; remote service delivery; and resetting the relationship. In addition to the eight themes, initiatives for housing and land reform are included in a schedule to the agreement.
Release of funding is in accordance with achievements against the milestones identified in the 13 schedules to the agreement, which provide the implementation detail. A summary analysis of activity and outcomes arising from these measures can be found in Chapter 1 ‘Overview’. Detailed analysis is provided in Part 2 of this report.
Income management and welfare reform
Income management and welfare reform measures aim to ensure that welfare recipients are able to manage their money and have access to life’s essentials, in particular to healthy food. They include the new non-discriminatory income management measure (which is now administered separate to the NTER), regulation of community stores to ensure food security, and additional language, literacy and numeracy training places.
These welfare reforms were complemented by employment policies contained in the National Partnership Agreement on Indigenous Economic Participation, which saw the conversion of many CDEP places into real jobs and changes to government procurement and workforce policies to maximise Indigenous employment.
Law and order
This measure involves improving family and community safety through law and justice responses, and preventive approaches that address the impact of alcohol and drugs. The new agreement emphasises community solutions to alcohol-related harm: blanket alcohol bans under the NTER are now augmented by alcohol management plans.
The NTNPA also continues the provision of legal assistance to Indigenous Australians for matters arising as a result of the NTER, support for the Northern Territory Aboriginal Interpreter Service, support for the Welfare Rights Outreach Project and funding for the Substance Abuse Intelligence Desks (SAIDs).
Family support
The safety of children and their families is supported through payments for the continued operation of safe houses. The NTNPA also funds the operation of the Mobile Child Protection Team and continuation of the existing Remote Aboriginal Family and Community Worker program.
The NTNPA provides funding for youth projects, services, organisations and infrastructure to promote positive behaviours amongst young people in the Northern Territory, and for
263 COAG, Closing the Gap in the Northern Territory National Partnership Agreement, op. cit.

Background
Northern Territory Emergency Response: Evaluation Report 2011 73
Australian Federal Police investigators to support the Northern Territory Child Abuse Taskforce.
Early childhood264
The early childhood measure supports the objective of ensuring that all Indigenous 4-year-olds in remote communities have access to early childhood education within five years. To that end, the NTNPA funds services to improve the skills of families and to educate young people about pregnancy, birth and parenting. It continued funding for the nine crèches established under the NTER and provided capital funding to finish construction of one crèche and upgrades to two existing crèches.
Improving child and family health
The health of Indigenous children and their families is primarily pursued through the National Partnership on Closing the Gap in Indigenous Health Outcomes. The NTNPA supplements these measures for people in the NTER communities with funding to expand primary health care services and specialist services, in particular the completion of ear, nose and throat specialist care and follow-up dental care for children.
The Expanding Health Service Delivery Initiative, detailed under Schedule L of the NTNPA, includes the expansion and reform of the primary health care system in remote Aboriginal communities in the Northern Territory.
Child abuse is specifically targeted through substantial strengthening of the Mobile Outreach Service to address trauma related to child abuse.
Enhancing education
This measure aims to improve the educational attainment of Indigenous children in NTER communities and to support initiatives designed to improve early childhood development, which will better prepare children for schooling.
The NTNPA includes funding for the construction of extra houses for teachers in remote communities, continuation of the School Nutrition Program and a range of initiatives supporting quality teaching and improving literacy and numeracy outcomes for Indigenous students.
These measures complement the three Smarter Schools National Partnership Agreements: the Literacy and Numeracy National Partnership, the Improving Teacher Quality National Partnership and the Low Socio-economic Status School Communities National Partnership.
Remote service delivery
The many reviews of the NTER already conducted found more problems with how measures were implemented than with the measures themselves. Those findings often focused on the need for better engagement with Indigenous people and greater capacity to tailor implementation to local circumstances. Much of this learning has been captured in the NPARSD.
The NTNPA references the NPARSD and complements it by providing funding for GBMs in NTER communities, building the capacity of interpreter services to support engagement
264 Some of these sub-measures, such as crèches, playgroups and parenting programs now covered under the Early Childhood building block in the NTNPA, were originally covered under the Supporting Families measure.

Background
74 Northern Territory Emergency Response: Evaluation Report 2011
between Indigenous communities and government and non-government agencies, and outreach visits to remote Indigenous communities by the Commonwealth Ombudsman.
Resetting the relationship
Resetting the relationship between Indigenous people and governments is a major focus of the NTNPA. The agreement funds leadership development, engagement and community development workshops to build local capacity and support people on the ground, and the employment and training of 15 Indigenous Engagement Officers (IEOs) in priority locations in the Northern Territory, which will be complemented by a further 15 IEOs through the NPARSD.
Housing and land reform
Schedule D to the NTNPA (Property and Tenancy Management) supports the implementation of public housing arrangements and reforms related to the delivery of repair and maintenance services in the 64 NTER communities where the Commonwealth has five-year leases.
Key activities funded under the schedule are repair and maintenance of existing houses; Community Clean-up; fair compensation for five-year leases; long-term leases to underpin housing and infrastructure investment; urgent repairs to infrastructure; and accommodation for Australian Government personnel.
Other activities
During the implementation of the NTER, associated reforms have contributed to change in the Northern Territory. They include:
• The Northern Territory Government activities outlined above: Closing the Gap on Indigenous Disadvantage—a Generational Plan of Action; Territory 2030; A Working Future; local government reforms; and the Safe Children, Bright Futures Strategic Framework 2011
• National Partnership Agreements entered into by the Australian and Northern Territory governments, particularly the NPARSD and the Smarter Schools National Partnership Agreement
• COAG agreements relating to Territory Growth Towns.
Due to this complex and dynamic environment, this evaluation references a range of agreements and activities outside the core NTER which have direct influence on the achievement of the NTER’s objectives. Readers will need to consider these related reforms in interpreting the findings of this evaluation.
Expenditure The total budget for the five years of the NTER and the NTNPA is $2,127.3 million, of which approximately 78 per cent had been spent at 30 June 2011. The largest single area of expenditure has been under employment and welfare reform (34%), followed by promoting law and order (17%), improving child and family health (14%) and coordination (14%). Eleven per cent of the total budget has been spent on enhancing education, 6 per cent on supporting families, and 5 per cent on housing and land reform.

Background
Northern Territory Emergency Response: Evaluation Report 2011 75
Stronger futures—the way forward The NTNPA will expire in 2012. In preparation, the Australian Government released the Stronger futures in the Northern Territory discussion paper in June 2011.265 The paper identified eight priority areas for action:
• school attendance and educational achievement
• economic development and employment
• tackling alcohol abuse
• community safety and the protection of children
• health
• food security
• housing
• governance.
The discussion paper provided the focus for a consultation period from June to mid-August 2011. The consultations were comprehensive, involving whole-of-community meetings in remote communities and town camps; individual and small group meetings in communities with GBMs and IEOs; public meetings in Darwin, Alice Springs, Katherine, Tennant Creek and Nhulunbuy; and meetings with key stakeholder groups, service provider organisations and local governments.
The report of the consultations was released on 18 October 2011, and will be analysed together with inputs such as this evaluation to inform government policy following on from the NTNPA.
Governance arrangements The NTER involved a large number of activities across different departments and levels of government and between two governments. At the start of the NTER, a variety of service suppliers were guided and supported by a dedicated coordination infrastructure.
Key elements of the governance arrangements in the first year included the NTER Taskforce, the NTER Sub-group of the Secretaries’ Group on Indigenous Affairs, interdepartmental committees, the NTER Operations Centre and the NTER Project Management Board. All of these have now been discontinued.
Many of these groups were established for the purposes of rolling out the NTER measures and were dissolved once their objectives were completed. For example, the NTER Taskforce and the Operations Centre were established to oversee and implement the NTER measures during the stabilisation phase. During the normalisation phase, the rollout and continuation of measures were transferred to normal delivery structures and processes managed through the Australian Government agencies, the FaHCSIA Northern Territory office and Indigenous Coordination Centres.
The effectiveness of key governance bodies is evaluated in Chapter 4 ‘Coordination and engagement’.
265 Australian Government, Stronger futures in the Northern Territory: Discussion paper, Commonwealth of Australia, 2011.

Background
76 Northern Territory Emergency Response: Evaluation Report 2011
Governance of the NTER can be grouped into three classes: suppliers and service elements; day-to-day coordination; and government administration.
Suppliers and service elements
The delivery of services remained the responsibility of line departments throughout the NTER. For example, Centrelink provided welfare services, and the NT DET managed the expansion of infrastructure and the employment of additional teaching staff within schools. The respective responsibilities for each government are set out in the NTNPA.
Government Business Managers and Indigenous Engagement Officers
The NTER added two groups of people to work directly with communities.
• GBMs are FaHCSIA employees deployed into remote communities to provide a key liaison and consultation point between governments, other stakeholders and community members. GBMs were included from the beginning of the NTER. They are funded and managed by FaHCSIA and report directly to FaHCSIA, but are intended to perform a whole-of-government role.
• The IEO positions were added in July 2008 to facilitate the work of local GBMs in providing information to communities and to help government understand how the NTER affects those communities. This in turn facilitates the community becoming more involved in government decision-making.
Both GBMs and IEOs normally live in the communities they serve. Both of these roles are still in use.
Day‐to‐day coordination
The Northern Territory Emergency Response Taskforce
The NTER Taskforce provided advice to the Australian Government on a range of issues and oversaw the management by the Operations Centre of the day-to-day activities and rollout of measures.
The taskforce was chaired by a civilian and had a military Operational Commander. The taskforce met 12 times, engaged with a range of stakeholders, alerted the Australian Government to emerging issues and helped to promote public understanding of the NTER. The taskforce’s terms of reference were to:
• provide expert advice to the Australian Government on the implementation of the emergency response
• provide oversight of the NTER Taskforce Operational Group
• promote public understanding of the issues involved
• alert government to current and emerging issues that relate directly to the implementation of the response
• report to the Prime Minister and the Minister for Families, Community Services and Indigenous Affairs on the progress of the response.
Background
Northern Territory Emergency Response: Evaluation Report 2011 77
In June 2008, the NTER Taskforce disbanded after providing a final report to the Australian Government with recommendations on a range of topics.266
NTER Operations Centre
The NTER Operations Centre was established by FaHCSIA. It was responsible for whole-of-government coordination in implementing NTER initiatives. All key Australian and Northern Territory government departments and agencies were involved in the implementation of the stabilisation phase.
The NTER Operations Centre was responsible for coordination and engagement with communities and ensured that:
• sufficient opportunity was provided for people to meet with Centrelink staff to discuss their priority needs and establish payment deductions
• GBM support was in place
• community stores were licensed and signed up to a Centrelink income management contract, or store cards were available to people living in towns
• other local third-party organisations were contracted, for example, for making deductions for the School Nutrition Program, rent, fuel, etc
• there was police coverage in the community/region to ensure stability
• an analysis was undertaken to identify customers and outstations affected by income management.
Representative liaison officers from Australian Government departments and agencies worked with the Operations Centre in Darwin to assist with their respective NTER measures and to ensure that their home agencies were well-informed of progress.
The NTER Operations Centre ceased operations on 30 June 2008.
Government administration
NTER Sub‐group of the Secretaries’ Group on Indigenous Affairs
This committee of relevant portfolio Secretaries coordinated policy advice to the Australian Government, and promoted cross-agency collaboration in the delivery of the measures. The committee was supported by a working group of Senior Executive Service officers from relevant Australian Government agencies. In the early stages, NTER weekly coordination meetings were convened, involving all relevant agencies and FaHCSIA policy and steering committees.
The groups were disbanded when they had completed their tasks.
Interdepartmental committees
Two interdepartmental committees were established, led by deputy secretaries from the then Department of Families, Community Services and Indigenous Affairs. One interdepartmental committee was concerned with the development of the two Appropriation Bills, and the other was concerned with the three emergency response enabling Bills.
The interdepartmental committees were disbanded on the completion of this work.
266 NTER Taskforce, op. cit.

Background
78 Northern Territory Emergency Response: Evaluation Report 2011
Northern Territory Emergency Response Project Implementation Plan
The measures were brought together and implemented through the Northern Territory Emergency Response Project Implementation Plan under the stewardship of the NTER Project Management Board. The plan captured in detail the measures funded through the Appropriation (Northern Territory National Emergency Response) Act (No.1) 2007–2008 and the Appropriation (Northern Territory National Emergency Response) Act (No.2) 2007–2008, and was amended to reflect continuing 2007–08 measures and new measures funded under the 2008–09 Budget.
The plan required that each government agency responsible for implementing NTER measures had its own internal governance arrangements in place, including committees and working groups, as well as associated plans, monitoring, evaluation and reporting.
FaHCSIA was responsible for the overall coordination and support for the plan, which was complemented by more detailed department- and agency-specific work plans. The plan covered the period through to the end of the stabilisation phase at 30 June 2008.
NTER Project Management Board
The NTER Project Management Board was established to oversee and drive the Northern Territory Emergency Response Project Implementation Plan. The board met monthly, on average, and was chaired by a FaHCSIA Deputy Secretary.
Membership of the Project Management Board included nominees from the Department of Education, Employment and Workplace Relations; Centrelink; the Department of Human Services; the Department of Health and Ageing; the Attorney-General’s Department; the Department of the Prime Minister and Cabinet; and Treasury, as well as the Operational Commander of the NTER Operations Centre and the FaHCSIA Northern Territory State Manager. Each agency involved with NTER measures was required to report monthly to the board.
The Project Management Board was disbanded on 30 June 2008.
Current governance arrangements
GBMs and IEOs continue to operate within communities.
Day-to-day coordination at the regional level is no longer managed through NTER-specific governance arrangements. Remote service delivery designated communities are supported by a Regional Operations Centre with co-located Australian and Northern Territory government offices and, progressively over time, local implementation plans. Non-remote service delivery designated communities are supported by their Indigenous Coordination Centres. Local community councils have been replaced by shire councils serving much larger areas.
There are no longer any NTER-specific government administration mechanisms.
Evaluation The overall aim of the whole-of-government evaluation of the NTER is to examine whether the measures, both individually and collectively, have been effective and comprehensive and have led to improved and sustainable outcomes in safety, health, education and employment, and how well coordination and engagement has been conducted. The broad goals of the evaluation are:

Background
Northern Territory Emergency Response: Evaluation Report 2011 79
• to establish whether governments have been effective in developing and delivering a coordinated and integrated suite of services and initiatives, and in undertaking effective engagement with Indigenous communities in the development of measures
• to examine whether individual measures are effective and appropriate, and whether there are any gaps in the suite of services and initiatives, with a view to deciding whether certain programs or subprograms should be continued in the future
• to establish whether this approach has led to an improvement in the safety, health and education outcomes of children and vulnerable people in the affected Northern Territory communities
• to assess whether this approach has contributed to more sustainable communities and progress in achieving the Closing the Gap targets
• to inform future policy development and decision-making about where and how improvements could be made to achieve the objectives of Stronger futures in the Northern Territory.
Program logic To aid understanding of the whole-of-government evaluation of the NTER, a program logic has been developed by specialist consultants.267 The program logic describes the logical links between policy and outcomes and helps explain the mechanism by which outcomes are achieved.
Mapping the logic and theory implicit in the NTER assisted in the development of the research questions for the evaluation. This approach guided choices about the evaluation focus by explaining the intention and testing the logic of a program against existing evidence and literature. This step reduced ambiguity in what was actually being evaluated and the questions the evaluation should answer.
Program logic is a tool, not an end in itself, and the focus, scope and detail are shaped by how the program logic is to be used. For the NTER evaluation, the focus involves analysing the logic involved in ‘bundles’ of measures that together contribute to key outcomes that reflect whole-of-government perspectives.
Six program logic themes were developed:
• Coordinated service delivery
• Reformed approach to engagement with Indigenous communities (covered under the ‘Coordination and Engagement’ measure)
• Community safety (covered under the ‘Promoting Law and Order’ measure)
• School readiness
• Education attainment (covered under the ‘Enhancing Education’ measure)
• Health and Nutrition (covered under the ‘Improving Child and Family Health’ measure).
Each theme shows how the NTER services and resources are intended to deliver immediate, intermediate and long-term outcomes within the context of other, related activities. Some
267 This section draws on material and ideas in the NTER program logic: ARTD Consultants & WestWood Spice, Development of program logic options for the NTER, unpublished report prepared for FaHCSIA, Canberra, 2010.

Background
80 Northern Territory Emergency Response: Evaluation Report 2011
measures contribute to more than one theme. For example, alcohol restrictions contribute to law and order, and to health and welfare through less money being spent on alcohol.
The program logic includes a range of objectively measurable long-term outcomes which may not be readily measurable in a four year timeframe. These include achievement in National Assessment Program—Literacy and Numeracy; levels of incarceration and recidivism; progress against the COAG child health indicators; incidences of injury and preventable disease; and recorded levels of substance abuse, child abuse and child neglect. These are captured in a range of administrative datasets.
There are also a range of long-term outcomes that can only be measured subjectively, such as whether families feel safer, whether families are stronger, whether community norms are positive, whether the relationship between communities and governments is sound, and whether service users and stakeholders are satisfied and believe that there is an appropriate level of community control. Subjective outcomes are measured through a range of surveys and research projects, such as the Community Safety and Wellbeing Research Study. It is rarely possible to demonstrate that a subjective outcome has been achieved; however, if suitable data capture methods are employed, trends over time can be ascertained.
The remaining long-term outcomes—community has access to sufficient and appropriate services, children are more prepared for school, children attain age-appropriate development (cognitive, social, emotional), school and school attendance are supported by carers, strong community support for school, service needs are met, perpetrators are rehabilitated, and there is more engagement in family, school, work and activities—may be measured using a mixture of objective and subjective sources.
The program logic shows a range of intermediate outcomes which may show change in a four year timeframe such as incidence of violence, access to support services, and teacher retention rates.
Evaluation strategy The evaluation is person-centred and whole-of-government. The concept of joined-up government recognises the increasing complexity of public policy delivery, which often involves multiple agencies across government jurisdictions. It acknowledges that many issues cut across departmental boundaries and require collaborative responses outside direct departmental lines. The NTER, as a whole-of-government initiative, works across agencies and tiers of government, and requires a joined-up response in both planning and delivery.
Methodology The evaluation approach is informed by multiple components designed to capture and analyse information relating to the short, medium and long-term effects of the NTER. Each element provides an incremental evidence base to inform the ongoing implementation and operation of the NTER.
Unfortunately, the initial rapid rollout of the NTER measures precluded much of the planning activity that would have assisted subsequent evaluation of the measures individually and collectively. In particular, the simultaneous rollout of multiple measures without preselected phasings makes it difficult to separate the relative contributions of each component to any overall change.

Background
Northern Territory Emergency Response: Evaluation Report 2011 81
Nevertheless, substantial volumes of administrative and survey data have been collected throughout the four years of the NTER. Much of this is publicly available on FaHCSIA’s website in the Closing the Gap in the Northern Territory monitoring reports.268
Each chapter of the evaluation includes a detailed methodology section covering the data sources used. In some cases, unpublished datasets were used or additional data were gathered specifically for this evaluation. All analyses made use of a common set of reports and datasets, including:
• Closing the Gap in the Northern Territory monitoring reports
• the NTER Review and the NTER redesign
• evaluation reports on separate measures269
• other relevant sources.
Additionally, the evaluation strategy identified some key gaps in available data. Evaluations of individual measures and secondary analysis of administration and outcome data were available to adequately inform most of the chapters; however, there was an obvious gap in the ‘community voice’, as well as in how well coordination and engagement were conducted as part of the NTER. Additional research conducted as part of the evaluation was intended to fill these gaps.
Two separate studies were conducted as part of this evaluation:
• a coordination and engagement research study (reported in Chapter 4)
• research into community safety, wellbeing and service provision (reported in Chapter 3).
More detail on each of the key inputs for this evaluation report is presented below.
Closing the Gap in the Northern Territory monitoring reports and analysis
The twice-yearly Closing the Gap in the Northern Territory monitoring reports, previously known as the NTER monitoring reports, have been developed to assess progress on the implementation of the measures and to understand how the living environment for children has changed. The progress of sub-measures, such as the Child Health Checks Initiative, follow-up care, night patrols, and additional police and teachers, is covered in these reports. The problems associated with implementing some of the measures are documented, and information on how they are being overcome is provided.
Evaluation reports of separate measures
Individual agencies are responsible for the evaluation of separate sub-measures. These ‘separate measure’ evaluations are a key source of information for the whole-of-government evaluation of the NTER. A key component of the evaluation strategy is research and analysis on how effectively measures have worked together in combination to achieve intended outcomes. For example, the Child Health Checks Initiative is targeted at identifying needs and providing health services for children in communities. Other measures, such as income management, the School Nutrition Program and community stores licensing, may contribute in the intermediate and longer terms to fewer occurrences of preventable childhood disease and to healthier children.
268 FaHCSIA, Indigenous Australians: Overview, Available at: <http://www.fahcsia.gov.au/sa/indigenous/overview/Pages/default.aspx>. 269 Separate measure evaluations are available from the implementing agencies’ websites.

Background
82 Northern Territory Emergency Response: Evaluation Report 2011
Secondary analysis of existing outcome data
To ensure that the evaluation is not unnecessarily burdensome on the people affected, existing data from government administrative systems or existing survey data have been analysed to assess changes and study casual effects. For example, changes in school attendance and literacy or numeracy can be assessed through analyses of administrative data. Likewise, data from the health system can be examined through existing mechanisms, including via the research capacity of the Australian Institute of Health and Welfare.
A range of approaches to secondary data analysis has been established for the evaluation, taking into account appropriate ethics protocols and collaboration agreements which may already be in place.
Coordination and engagement research study
The Allen Consulting Group was engaged to undertake a study on the Coordination and Engagement measure with the aim of examining how well governments coordinated within and between governments, and with non-government organisations involved in service delivery. The study sought to look at how well coordination worked on the ground and how successful it was in delivering services.
The study also examined how well the Australian Government had engaged with Indigenous people, with some of the issues surrounding engagement tied to those around coordination. The NTER Review Board specifically noted the importance of this measure in achieving sustainable outcomes. There has been a strong commitment from the government to improving the type and effectiveness of engagement. The study aims to shed light on whether the measures have been successful in achieving that outcome. The results from this study are presented in Chapter 4, ‘Coordination and engagement’, in Part 2 of this report.
Research into community safety, wellbeing and service provision
To assess whether community safety, wellbeing and service provision has changed as a result of the NTER measures, two studies were undertaken. The first, the Community Safety and Wellbeing Research Study, involved a survey and qualitative research with more than 1,300 local Indigenous people in 16 remote Northern Territory communities. Key issues covered in the study include:
• personal and community safety
• attitudes to violence
• changes in the past three years, including the impact of measures
• values and quality of life
• future priorities.
The second study, the Community Safety Service Provider Survey, involved a survey of 699 government and non-government service providers in the Northern Territory in a range of sectors, including education, health, police, housing, welfare, coordination, justice and legal services. Over half (58%) of participants answered questions about an urban centre where they had worked most in the past 12 months, and 40 per cent answered for remote communities.
The main aim was to canvass service providers’ views about changes related to community safety, social problems and the coordination of services and programs that affect community safety. Respondents were also asked to comment on the impact of NTER measures and on

Background
Northern Territory Emergency Response: Evaluation Report 2011 83
future priorities. The results have primarily been analysed using comparisons of results for towns compared with remote communities.
The findings of both studies are set out in the first part of Chapter 3, ‘Research into community safety, wellbeing and service provision’.
Evaluation governance An Evaluation Board made up of Australian and Northern Territory government representatives oversaw the NTER evaluation, and also provided direction and advice on the evaluation. The board was formed at the commencement of the evaluation and provided comment on the evaluation strategy and the program logic document, as well as each chapter of this report.
The Evaluation Board comprised senior representatives from FaHCSIA; the Department of Education, Employment and Workplace Relations; the Department of Prime Minister and Cabinet; the Attorney-General’s Department; the Office of the Commonwealth Ombudsman; the Department of Human Services; the Treasury; the Department of Finance and Deregulation; the Department of Health and Ageing; the Northern Territory Department of Housing, Local Government and Regional Services; the Northern Territory Chief Minister’s Office; and the Northern Territory Treasury.
An advisory group comprising eminent researchers, specialised subject matter experts, and members from non-government organisations with experience working alongside government and with Indigenous peoples provided advice on the overall NTER evaluation report. The key function of the advisory group was to work collaboratively with government to ensure that the NTER evaluation report is of high quality. The advisory group provided advice for the independent authors on factual and analytical matters throughout the report writing process.
The advisory group comprised:
• Toby Hall, Chief Executive Officer, Mission Australia
• Professor Megan Davis, University of New South Wales
• Dr Gill Westhorp, Director, Community Matters
• Bess Nungarrayi Price, Consultant
• Priscilla Collins, Chief Executive Officer, North Australian Aboriginal Justice Agency
• Dr Howard Bath, Children’s Commissioner, Northern Territory Government
• Professor Steve Larkin, Pro Vice-Chancellor, Indigenous Leadership, Charles Darwin University.

Background
84 Northern Territory Emergency Response: Evaluation Report 2011
Chapter writers FaHCSIA commissioned specialist consultants to write each chapter, as outlined below.
Section Author
Part 1: Introduction
1. Overview Kathryn Julie Roediger
2. Background Kathryn Julie Roediger
3. Research into community safety, wellbeing and service provision
Dr Judy Putt and FaHCSIA
Part 2: Evaluating the Northern Territory Emergency Response
4. Coordination and engagement The Allen Consulting Group
5. Promoting law and order Australian Institute of Criminology
6. Improving child and family health Australian Institute of Health and Welfare
7. Supporting families Australian Institute of Family Studies
8. Enhancing education Australian Council for Educational Research
9. Welfare reform and employment Colmar Brunton Social Research
10. Housing and land reform KPMG

Background
Northern Territory Emergency Response: Evaluation Report 2011 85
Bibliography Anderson, P & R Wild, Ampe Akelyernemane Meke Mekarle: ‘Little children are sacred’,
Report of the Northern Territory Board of Inquiry into the Protection of Aboriginal Children from Sexual Abuse, Northern Territory Government, Darwin, 2007.
ARTD Consultants & WestWood Spice, Development of program logic options for the NTER, unpublished report prepared for FaHCSIA, Canberra, 2010.
Australian Bureau of Statistics (ABS), National Aboriginal and Torres Strait Islander Social Survey, cat. no. 4714.0, ABS, Canberra, 2008.
Australian Bureau of Statistics (ABS), Housing Occupancy and Costs, 2007-08, cat. no. 4130.0, ABS, Canberra, 2009.
Australian Bureau of Statistics (ABS), Deaths, Australia, 2009, cat. no. 3302.0, ABS, Canberra, 2010.
Australian Bureau of Statistics (ABS), Population characteristics, Aboriginal and Torres Strait Islander Australians, Northern Territory, 2006, cat. no. 4713.7.55.001, ABS, Canberra, 2010.
Australian Bureau of Statistics (ABS), Recorded crime, victims, Australia, 2009, cat. no. 4510, ABS, Canberra, 2010.
Australian Government, Future directions for the Northern Territory Emergency Response, discussion paper, Commonwealth of Australia, Canberra, 2009.
Australian Government, Policy statement: Landmark reform to the welfare system, reinstatement of the Racial Discrimination Act and strengthening of the Northern Territory Emergency Response, Australian Government, 2009.
Australian Government, Stronger futures in the Northern Territory: Discussion paper, Commonwealth of Australia, 2011.
Australian Government & Northern Territory Government, Response to the report of the NTER Review Board, Australian Government, 2009.
Australian Human Rights Commission, Social justice report 2007, Chapter 3, Australian Human Rights Commission, 2008.
Bamblett, M, H Bath & R Roseby, Growing them strong, together: Promoting the safety and wellbeing of the Northern Territory’s children, Northern Territory Government, Darwin, 2010.
Biddle, N, The scale and composition of Indigenous housing need, 2001–06, CAEPR working paper no. 47, Centre for Aboriginal Economic Policy Research, 2008.
Biddle, N, J Taylor & M Yap, Indigenous participation in regional labour markets: 2001–06, CAEPR discussion paper no. 288, Centre for Aboriginal Economic Policy Research, 2008.

Background
86 Northern Territory Emergency Response: Evaluation Report 2011
Brough, M, ‘Howard Government getting on with the job of protecting children in the Northern Territory’, media release, FaHCSIA, 6 August 2007, Available at: <http://www.formerministers.fahcsia.gov.au/malbrough/mediareleases/2007/Pages/nter_6aug07.aspx>.
Brough, M, ‘National Emergency Response to protect Aboriginal children in the NT’, media release, FaHCSIA, 21 June 2007, Available at: <http://www.formerministers.fahcsia.gov.au/malbrough/mediareleases/2007/Pages/emergency_21june07.aspx>.
Central Land Council, Submission to NTER Review Board, submission no. 37, Available at: <http://www.nterreview.gov.au/subs/nter_review_report/37_clc/37_CLC.htm>.
COAG, COAG Meeting: Communiqué 14 July 2006, COAG, Canberra, 2006, Available at: <http://www.coag.gov.au/coag_meeting_outcomes/2006-07-14/index.cfm>.
COAG, Overarching Bilateral Indigenous Plan between the Commonwealth of Australia and the Northern Territory of Australia to Close the Gap in Indigenous Disadvantage 2010–2015, Available at: <www.Federalfinancialrelations.Gov.Au/Content/Intergovernmental_Agreement_Schedules/NT_Overarching_Bilateral_Indigenous_Plan_Final.Pdf>.
COAG Reform Council, National Indigenous Reform Agreement: Baseline performance report for 2008–09, COAG Reform Council, Sydney, 2010.
Commonwealth Grants Commission, What is horizontal fiscal equalisation (HFE)?, Frequently asked questions, Available at: <http://www.cgc.gov.au/fiscal_equalisation/navigation/4>.
Creative Spirits, Aboriginal Timeline, Available at: <http://www.creativespirits.info/aboriginalculture/history/aboriginal-history-timeline-late-20th.html#ixzz1UVcpd8JW>.
Cultural and Indigenous Research Centre (CIRCA), Report on the NTER redesign engagement strategy and implementation, CIRCA, Sydney & Melbourne, 2009.
FaHCSIA, Report on Northern Territory Emergency Response redesign consultations, FaHCSIA, Canberra, 2009.
FaHCSIA, Submission of background material to the NTER Review Board, FaHCSIA, Canberra, 2008.
Jones, T, ‘Crown prosecutor speaks out about abuse in Central Australia’, Lateline, ABC TV, 15 May 2006, Available at: <http://www.abc.net.au/lateline/content/2006/s1639127.htm>.
Langton, M, ‘It’s time to stop playing politics with vulnerable lives’, Sydney Morning Herald, 30 November 2007, Available at: <http://culturematters.wordpress.com/2007/11/30/marcia-langton-on-the-nt-intervention/>.
Northern Territory Emergency Response Taskforce, Final report to government, FaHCSIA, Canberra, 2008.

Background
Northern Territory Emergency Response: Evaluation Report 2011 87
Northern Territory Government, Grocery Price Index: June 2011, Northern Territory Government, Darwin, 2007, Available at: <http://www.nt.gov.au/ntt/economics/publications/gps/gps_2011jun.pdf>.
Northern Territory Government, Safe children, bright futures, strategic framework 2011–2015, Northern Territory Government, Darwin, 2011.
NTER Review Board, Northern Territory Emergency Response Review submissions, Available at: <http://www.nterreview.gov.au/subs.htm>.
NTER Review Board, Northern Territory Emergency Response: Report of the NTER Review Board, NTER Review Board for FaHCSIA, Canberra, 2008.
PricewaterhouseCoopers, Living in the sunburnt country: Findings of the review of the community housing and infrastructure program, PricewaterhouseCoopers for FaHCSIA, 2007, p. 16.
Rudd, K. House of Representatives, Official Hansard, no. 1, 12 February 2008, p. 165.
Smith, S, ‘Indigenous community expresses thanks for exposing child abuse’, ABC broadcast, 26 June 2006, Available at: <http://www.abc.net.au/lateline/content/2006/s1672370.htm>.
Stanley, J, A Tomison and J Pocock, Child abuse and neglect in Indigenous Australian communities, Australian Institute of Family Studies, Melbourne, 2003.
Szava, A, M Moran, B Walker & G West, The cost of housing in remote Indigenous communities: Views from the Northern Territory construction industry, Centre for Appropriate Technology, Alice Springs, 2007.
Taylor, J and O Stanley, The opportunity costs of the status quo on the Thamarrurr Region: Northern Territory, CAEPR working paper no. 28, Centre for Aboriginal Economic Policy Research, Canberra, 2005.
United Nations General Assembly, International Convention on the Elimination of All Forms of Racial Discrimination, United Nations, 1965.


Research into community safety, wellbeing and service provision
Northern Territory Emergency Response: Evaluation Report 2011 89
3 Research into community safety, wellbeing and service provision
Dr Judy Putt and FaHCSIA
Key findings • Research was undertaken on community safety to see whether there were perceived
changes in local communities as a result of recent reforms and Northern Territory Emergency Response (NTER) measures.
• Over 1,300 local Indigenous people were involved in a survey and in-depth research in 16 NTER communities, and 699 service providers across the Northern Territory participated in a survey.
• Night patrols, additional police and safe houses were viewed by many local Indigenous people and service providers as making a big difference to community safety.
• The majority of local Indigenous people said community safety had improved in the past three years and that children were better off now on a range of indicators.
• Service providers in remote communities were less positive about perceived changes, but in some communities family and other violence was perceived to have fallen.
• There remain concerns in remote communities about substance abuse, young people and children, local infrastructure and services, and local opportunities to lead and manage socioeconomic change.
Introduction This chapter summarises the key results from two research projects on community safety commissioned and undertaken by the Department of Families, Housing, Community Services and Indigenous Affairs (FaHCSIA) in 2011—the Community Safety and Wellbeing Research Study (CSWRS) and the Community Safety Service Provider Survey (CSSPS). As part of the overarching framework to the evaluation and a focus on outcomes, FaHCSIA saw the need to complement existing monitoring information and evaluations of individual initiatives with an examination of community safety in remote communities. By providing an account of the research, the chapter serves as a stand-alone picture of community safety and acts as context for how the research findings were used in other chapters of this report. The chapter begins with the rationale for the research, followed by a short description of the two studies. The methodology and results are summarised, first for the CSWRS and then for the CSSPS. The chapter ends with a brief description of how the research is being used and disseminated.
Chapter 3 is consistent with more detailed analysis of each research project. The ‘Community Safety and Wellbeing Research Study Consolidated Report’, authored by Gillian Shaw and Peter d’Abbs, provides an independent comprehensive thematic report of the CSWRS data. The ‘Community safety: results from the service provider survey in the Northern Territory’

Research into community safety, wellbeing and service provision
90 Northern Territory Emergency Response: Evaluation Report 2011
report, authored by Dr J Putt and others, provides more in depth analysis of the CSSPS data. Both of these reports are available on the FaHCSIA website.270,271
Overview
Rationale Community safety is one of the seven building blocks of the national Closing the Gap initiative and is included in the Northern Territory National Partnership Agreement (NTNPA). Given that the NTER sought to improve the safety of people in remote communities, especially the safety of women and children, it was recognised that a multipronged assessment of community safety was required.
There was a need to investigate whether people believed safety had changed, what had made a difference and what they viewed as current social problems and priorities. Such research complements and informs the interpretation of crime and justice administrative data. The NTER monitoring reports have included police and justice statistics on key categories of incidents. To understand whether the trends evident in those data are making a difference on the ground involves asking those people who are directly affected and dealing with the consequences of violence and other social problems—local Indigenous people and service providers.
Research of this kind is not new, although its scope and focus on Indigenous remote communities is unparalleled in Australia. The evidence base that underpins policies to address socioeconomic disadvantage and more specific crime prevention strategies includes recorded crime statistics and surveys that ask local residents about their experiences of victimisation, feelings of personal safety in certain situations and perceived neighbourhood problems.272 Crime and antisocial behaviour might not be reported to police. Being afraid of crime can have a deleterious effect on a range of behaviours and feelings. Being unsafe can affect how people act and the measures they take to protect themselves. Both contribute to social isolation as well as individual and community harms. Creating socially inclusive, cohesive and prosperous communities relies on a certain measure of safety, stability and security.
The research process was informed by work in Australia and overseas on community safety and Indigenous people. Inquiring into and working to achieve community safety is premised on:
• an appreciation of the complexity of issues related to colonisation and assimilation
• different types of knowledge
• community contributions in the co-production of safety (youth, women, men, families)
• the contribution of many different and interrelated community sectors (cultural, social, environmental, economic and political).
270 G. Shaw & P. d’Abbs, Community Safety and Wellbeing Research Study – Consolidated Report, FaHCSIA, 2011 271 Dr J. Putt, Sally Middleton, Jessica Yamaguchi and Kirsten Turner, Community safety: results from the service provider survey in the Northern Territory, FaHCSIA, 2011 272 For example, in Australia, see ABS, Crime victimisation, Australia, 2009–10, cat. no. 4530.0, ABS, Canberra, 2011; ABS, National Aboriginal and Torres Strait Islander Social Survey, 2008, cat. no. 4714.0, ABS, Canberra, 2009; ABS, Personal safety, Australia, 2005, cat. no. 4906.0, ABS, Canberra, 2006; H. Johnson, Crime victimisation in Australia: Key results of the 2004 International Crime Victimisation Survey, Research and Public Policy series no. 64, AIC, Canberra, 2005.

Research into community safety, wellbeing and service provision
Northern Territory Emergency Response: Evaluation Report 2011 91
In an international review of community safety strategies and practices with Indigenous peoples to improve the wellbeing of communities, the point is made that the reduction of crime is one of many possible positive indicators of safety. Crime indicators are crucial, but can include indicators of increased school retention rates, literacy, employment and meaningful employment opportunities, strong parental abilities, vocational skills, and protection of livelihoods.273 Community safety is therefore referred to as both a collective outcome of multiple measures and practices, and as a crucial social determinant of whether those measures and practices will improve collective wellbeing.274
Creating safe communities is one of the building blocks for overcoming disadvantage and a major focus of the NTER and NTNPA in the Northern Territory. The NTER measures that address community safety cover a wide range of services and resources that should contribute to making communities safe. Over time, the impact of those measures should lead to less violence, less substance abuse and less child abuse and neglect where people feel safer and violence is not tolerated. Building strong community leadership and positive social norms are important measures to support enhanced community safety on a sustained basis.275
Two studies This chapter presents the main findings of two studies undertaken on community safety in the Northern Territory. The CSWRS was a very large, complex and in-depth project which involved over 1,300 local Indigenous people in a representative sample of 16 NTER communities. To do this research well (that is, to commit resources and time to in-depth qualitative research and sensitive survey interviews), we knew we could only involve a limited number of the NTER communities. As a result, it was important to ascertain views on social problems and perceived changes to community safety from key stakeholders in a large number of locations to see whether core themes in the CSWRS were found to apply in a broader context.
Consequently, the second, smaller project, the CSSPS, involved asking service providers in towns and remote communities across the Northern Territory to participate in a survey.
Core elements of both projects were three research questions:
• How have community safety and social problems changed over the past three years?
• What are current perceptions of personal safety and the safety of different social groups in the local community?
• What has had an impact on community safety, and what should be done in the future?
Based originally on an instrument developed by the Australian Institute of Criminology276, the questionnaires in both studies included questions related to these issues, although some differences in wording and categories emerged during the testing and piloting phases. Many of the concepts and questions are consistent with questions asked in mainstream quantitative national surveys, such as the Australian Bureau of Statistics’ Crime and Safety, Women’s
273 Ibid., p. 9. 274 A recent analysis of 2008 National Aboriginal and Torres Strait Islander Survey (NATSISS) data shows the strong correlation between self-reported offending and victimisation, feelings of personal safety and wellbeing. See N. Biddle, Measures of Indigenous wellbeing and their determinants across the lifecourse: Crime and feelings of safety, CAEPR Lecture Series, Centre for Aboriginal Economic Policy Research, 2011. 275 ARTD Consultants & WestwoodSpice, Development of program logic options for the NTER, unpublished report prepared for FaHCSIA, Canberra, 2010. 276 M. Willis, Community safety in Australian Indigenous communities: Service providers perceptions, Research and Public Policy series no. 110, AIC, Canberra, 2010.

Research into community safety, wellbeing and service provision
92 Northern Territory Emergency Response: Evaluation Report 2011
Safety and General Social surveys. In addition to the shared focus on community safety, the studies had additional and distinct areas of interest linked to the main outcome themes of the NTER evaluation. The CSWRS sought to examine, in both the survey and qualitative research, community wellbeing and whether it was seen to have changed in recent years, while the CSSPS questionnaire included sections on the delivery and coordination of services.
Past surveys and research277 that had examined community safety, wellbeing and service delivery informed the design of the questionnaires employed in the studies. The instruments were subsequently reviewed by stakeholders and ethics committees, and testing in the field, prior to their rollout this year.
In both studies, a detailed definition of community safety was not provided in the questionnaires or in information about the studies. One of the reasons for the qualitative research component in the CSWRS was to investigate what local community residents understood by and about community safety. To explain what was meant by perceptions of community safety, the CSSPS included the following introduction to the questionnaire:
People can feel safe or unsafe in their homes, at work, and being outside in a community. The experience of seeing or hearing about various personal and household crimes such as assault, domestic violence, burglaries and property damage influence perceptions of safety. Certain places and times of the day can also be seen as less safe, with people often being influenced by signs of social disorder and the physical appearance of buildings and open spaces.
This chapter presents a summary of the key findings and methodology of both studies. At the end of the chapter there is a short account of how the research has informed the NTER evaluation and will continue to be used into the future. More detailed analyses of the CSWRS and the CSSPS are available as two separate reports.
Community Safety and Wellbeing Research Study
Introduction Through the CSWRS, we attempted to gain information from individuals to add the people’s perspective and community context to existing information about programs and places. This information is being used by government for program evaluation and policy development, and as a resource for development, planning and monitoring activities by each individual community.
The CSWRS involved three components:
• a quantitative, standardised survey of individuals in communities
• qualitative information collection, tailored to communities
• reporting back to communities.
277 Includes: ABS, National Aboriginal and Torres Strait Islander Social Survey, op. cit; ABS, Crime victimisation survey, Australia, 2009-10, op. cit; A survey of service providers: M. Willis, op. cit; A survey in Themis communities: J. Pilkington, Aboriginal communities and the police’s Taskforce Themis: Case studies in remote Aboriginal community policing in the Northern Territory, NAAJA and CAALAS, Darwin, 2009; A survey of police: B. Delahunty & J. Putt, Policing implications of cannabis, amphetamine and other drug use in Aboriginal and Torres Strait Islander communities, monograph no. 15, National Drug Law Enforcement Fund, Tasmania, 2006; A national survey of young people: Crime Research Centre UWA and Donovan Research, Young people and domestic violence, Attorney-General’s Department, Canberra, 2001; A survey on Aboriginal children’s health: S. Silburn & S. Zubrick, The Western Australian Aboriginal children’s health survey, Telethon Institute for Child Health Research, Perth, 2001; NPY Women’s Council, ‘Attitudinal survey’, unpublished survey, 2009.

Research into community safety, wellbeing and service provision
Northern Territory Emergency Response: Evaluation Report 2011 93
The CSWRS sought to address the following key research questions:
• What behaviours are occurring in the community in relation to violence?
• How safe do individuals feel in different situations and locations and how has this changed over time?
• What are the values and norms around acceptable behaviours in relation to safety and wellbeing?
• What has influenced the safety and wellbeing of the community since the commencement of the NTER?
• What other changes have occurred in the community to do with parenting, schooling, children’s wellbeing and youth participation?
The project aimed to collect systematic and robust data to:
• allow for an individual assessment of current status and recent changes in each place through a standardised quantitative survey
• aid our understanding of place-based perceptions of safety and wellbeing through systematic qualitative evaluation research
• provide a resource for each community involved that can be referenced for future community development and planning.
Methodology The study involved undertaking quantitative and qualitative research in a cross-section of NTER communities. A total of 16 communities were selected based on size, location and police presence. The fieldwork was undertaken between December 2010 and July 2011, involving over 1,300 individuals.
The quantitative component was a statistical social survey covering safety and wellbeing.
The qualitative component was undertaken using participatory research methods to provide context and local meaning to the survey.
The questionnaire was pre-tested with people in a number of Alice Springs town camps before it was piloted in one NTER community. The outcomes from the pilot project were incorporated into the final survey questionnaire and methodology.
In addition to the survey questionnaire, community members also took part in a participatory process that was designed to allow them to tell their stories about their priorities and experiences in their own community. The participatory processes both broadened the scope and allowed for a place-based analysis of survey results. The qualitative research exercise was designed to be a sensitive and locally relevant approach which included identifying and ranking major challenges and changes in each community. The qualitative component involved a number of participatory methods, including assessments of the most significant changes, mapping exercises, ranking exercises and small discussion groups.
Output from the qualitative component is comparable across 12 communities.278 In those communities, a list of around 10 to 15 changes and a similar number of challenges was
278 Three communities used a more in-depth participatory action research methodology which was not directly comparable to the other communities. In one community, the lists of changes and challenges were compiled but the voting process did not occur.

Research into community safety, wellbeing and service provision
94 Northern Territory Emergency Response: Evaluation Report 2011
created. The changes and challenges were compiled using a number of methods. Focus groups with a number of cohorts within the community were used in some communities to allow groups to discuss important changes they had observed in their community in the past three years and challenges that the community still faces. In other communities, the list of challenges and changes was compiled from the responses to the survey and analysis of all the comments that had been recorded throughout each survey. This methodology increased the scope of the survey to include issues that are important to each community. The lists were then provided to people in the community, who were asked to consider them and to vote on their top five changes in the community over the past three years, and the top five future challenges for the community. In most of the 12 communities, the sample size was slightly more than the qualitative survey and the sample frame was similar.
The following principles were critical to the study:
• Fostering a consultative and cooperative approach with each community.
• Receiving written community permission for the conduct of research.
• Incorporate capacity within the community to participate as part of the survey team.
• Confidential and ethical research.
• Feeding back results and handing over the report to the community.
Ethics approval FaHCSIA submitted documentation to both the Central Australian Human Research Ethics Committee and the Human Research Ethics Committee of the Northern Territory Department of Health and Families and Menzies School of Health Research, and undertook consultation with those ethics committees before commencing any field work with NTER communities.
Procurement External consultants were contracted by FaHCSIA to conduct the research through two established FaHCSIA procurement panels: the Social Policy Research and Evaluation Panel and the Participatory Research Panel. Members of the panels who had proven experience, knowledge and understanding of Indigenous people and communities and who had a proven record of working in a collaborative manner to engage and foster capacity as part of their research where invited to submit a proposal. In total, 17 organisations were approached with a request for quotation. The four specialised consultants engaged to conduct the CSWRS were Bowchung Consulting, N-Carta Group, Colmar Brunton Social Research, and Dr Bev Sithole and the Aboriginal Practitioners Research Network (ARPnet).
Community support A crucial component of the study involved obtaining community support for the research. This involved liaison with community representatives in each community, in many cases through a community visit. In most cases this was facilitated through the relevant consultant with the Government Business Manager (GBM), but for some of the larger communities in the north it was undertaken directly with the people through the local ARPnet research team. Signatories to these letters of permission included traditional owners, representatives of each family/clan group and elected community members of local community boards. Most letters had multiple signatories. A number of community members commented that they appreciated the opportunity to ‘tell their story to government’.

Research into community safety, wellbeing and service provision
Northern Territory Emergency Response: Evaluation Report 2011 95
There were two communities where we were unable to obtain consent. Research was not conducted in those communities, and alternative communities were approached.
Engagement with communities The CSWRS faced challenges in engaging a representative range of community members due to competing commitments and the nature of the study. Competing commitments was a frequently cited barrier in engaging and consulting for the survey. These included Centrelink, community meetings, and commitments in surrounding outstations, sorry business, footy and gambling. Respondent fatigue was considered a real factor affecting engagement with community members. Low levels of literacy and English language were noted as barriers in some of the communities, although these issues were often overcome by use of interpreters and assistance provided by research teams.
Seeking good levels of participation by young people was an important challenge that the study addressed. Young people can be shy of speaking in groups and unused to expressing their own opinions, where the norm is that consultations are done by older people. Young women with caring responsibilities were particularly difficult to engage. Consultants used tailored strategies to engage with youth and, as a result, found that young people were willing to discuss issues that arose from the survey questions. The survey response rates for 15 to 29 year olds were good, although they were slightly below the levels expected based on ABS population figures.
The CSWRS allowed us to gain opinions from a range of people from the community, many of whom would not normally have the opportunity to voice their opinions as many of the respondents were not on local boards, which are the major form of decision making in many communities. A communication awareness strategy developed specifically for each community by the consultants was deployed for approaching community members, local government and non-government organisations about the research. In addition, the consultants played a major role in communicating with selected communities to build rapport and gain support and approval for the study. They also worked with each community to identify capacity and scope for community members to participate as part of the study team.
Local research focus The project design specified that every attempt should be made to employ Indigenous researchers as part of the survey team—individuals who may have some prior experience or training in data collection techniques and interpreting, or who were interested in gaining such skills. The consultants did this with the assistance of the FaHCSIA GBM and/or Indigenous Engagement Officer or utilised established local research networks such as ARPnet and the Yalu Marngithinyaraw Aboriginal Corporation research team. All local researchers and interpreters were paid for their services. More than 60 local Indigenous people were employed across the 16 communities for the CSWRS. They worked with the consultants to conduct the survey and participatory component to capture the community voice.
Local researchers played a number of roles, depending on their experience and interests:
• as project leaders
• as interpreters
• as ‘brokers’ to encourage people to participate
• conducting surveys and interviews

Research into community safety, wellbeing and service provision
96 Northern Territory Emergency Response: Evaluation Report 2011
• organising groups and conducting participatory research
• entering data.
Training was conducted over two to five days depending on the prior experience of the local researchers. The aim was to go through the questionnaire, translating questions when required, discussing meanings of the question and the importance of the research and data requirements. Training was also given in participatory research methods. It was left to each consultant to work out the best training method and methodology for each community. Key characteristics of local researchers included:
• speak/understand a variety of local languages
• belong to one of the clans in the community
• strong family connections in the community
• local researchers or their close family hold important social and cultural positions in the community
• strong work ethic.
CSWRS NTER community sample The different cultural, sociolinguistic and historical backgrounds of communities needed to be considered when conducting the community sampling frame. Multiple languages may be spoken by people in a community, and complex clan and kinship relationships exist within communities and across regions. Patterns of settlement and movement in the north and south have been influenced by their distinct climates and geography, as well as local economic activities, transport routes and the growth of urban centres.
Northern Australia has two distinct seasons—the ‘dry’ and the ‘wet’—with most rain falling during the wet season between December and March. Most remote communities in northern Australia are cut off during the wet season due to impassable roads, relying on air and sea transport. Remote communities in Central Australia may also have access problems when there is heavy rain due to impassable roads which are closed for a few days or sometimes weeks at a time.
Many of the larger communities are in the north and are likely to be former mission and/or government settlements. Many of the communities in the south, although smaller in size, were former missions and/or government settlements. Many of the smaller communities in both the south and the north began as outstations or homelands formed by families wishing to move away from the larger settlements and return to their traditional country. Some of the homelands have developed over time into larger communities, particularly in the north. There are also a number of communities which are ‘community living areas’. Many community living areas are in pastoral regions and are occupied by families who are both traditional owners of the area and have had a long association with the local pastoral station.
There is considerable fluctuation in population size, particularly in northern Australia where many families from outstations move to the larger communities for the duration of the wet season (October–November through to March–April) to avoid being cut off from services. Population size also fluctuates in all regions due to large-scale participation in ceremonies and sporting events.

Research into community safety, wellbeing and service provision
Northern Territory Emergency Response: Evaluation Report 2011 97
The lack of a police presence in a community is not an indication of a low crime rate or even a small population.279 A major initiative of the NTER that aimed to improve community safety was funding for more police stations and additional police. Previous research in ‘Themis’280 communities found that the majority of local Indigenous residents were positive about the police presence and improvements in a number of social problems, although views on whether police were doing a good job varied by how engaged in local community life and responsive the police were perceived to be.281
To take some of the above points into account, the sample selection was a ‘purposive stratified sample’. The sample was drawn from the 73 discrete NTER communities and was selected to provide a cross-section of communities according to location, size and police presence. Other factors that were considered in the selection were the level of reported police incidents, school attendance, the presence or non-presence of a safe house, the level of isolation of the community, and whether or not the community had alcohol restrictions before the NTER.
Location The sample included communities from Central and Northern Australia. Most communities between the Gulf of Carpentaria in the east and Wadeye in the west and as far south as Katherine would be considered to be in Northern Australia or the Top End. For the purposes of our sampling strategy, we divided all communities into north or south (Central Australia). The dividing line between north and south is the point at which the Barkly Highway meets the Stuart Highway. This corresponds to the Indigenous Coordination Centre boundaries. There are 31 northern communities and 29 in the south.
The final sample included nine communities in the north and eight in the south.
Population Indigenous communities in the Northern Territory range in size from small family outstations/homelands with populations of under 100 to larger communities such as Wadeye or Maningrida, with populations of around 2,000 people. The largest community in the south is Yuendumu, with a population of over 750.
The population of each community was derived using data from the 2006 Census of Population and Housing. The relevant statistical local area (SLA) undercount (Post Enumeration Survey) was applied to the actual census count for each community. As the SLA population generally includes a higher ratio of non-Indigenous people than the community population, a weighted average of the undercount for Indigenous and non-Indigenous was applied.
A number of communities are so small that they were not separately identified in the 2006 Census output for confidentiality reasons. Therefore, 13 smaller communities were excluded from the sampling process. Table 3.1 shows the community sample by population size.
279 J. Valentin, An independent assessment of policing in remote Indigenous communities for the Government of Australia, Australian Government, Canberra, 2007. 280 ‘Themis’ is the term used for police stations installed as part of the NTER. 281 J. Pilkington, op. cit.

Research into community safety, wellbeing and service provision
98 Northern Territory Emergency Response: Evaluation Report 2011
Table 3.1 The final sample, by size
Size of community Total number of communities Number in sample Low = fewer than 350 27 4 Medium = between 350–750 19 6 High = more than 750 14 6 Total 60 16
Police status One of the significant measures of the NTER was the installation of a fully operational police station in 18 communities that previously did not have one. These police stations are often referred to as ‘Themis’ stations—an operational name given by the Northern Territory Police Service. Table 3.2 shows the community sample by police status.
Table 3.2 The final sample, by police status
Police status in community Total number of communities Number in sample Police station prior to the NTER 17 9 Themis station as a result of NTER 18 5 No police station 26 2 Total 60 16
Quantitative survey findings The survey was an interview-based questionnaire composed of 27 questions which ranged from ‘tick a box’ questions to open-ended questions. Topics included changes in the community, values, safety, social problems, attitudes to violence, experiences of crime and trouble, and attitudes about the future. The survey was conducted with over 1,300 respondents in 16 communities. Below are selected findings from the most relevant sections of the survey.
Changes in the community over the past three years
Table 3.3 shows responses to the question ‘Can you tell us if these things have changed in your community in the past three years?’

Research into community safety, wellbeing and service provision
Northern Territory Emergency Response: Evaluation Report 2011 99
Table 3.3 Agreement with change in community in the past three years (%)
Strongly
agree Agree
a bit Disagree Strongly disagree
Don’t know
Not answered
Less people are making trouble than 3 years ago 25.0 36.3 19.1 12.0 6.9 0.7 There is less family fighting than 3 years ago 23.3 35.3 21.4 13.1 6.1 0.8 People are drinking less grog than 3 years ago 23.8 33.4 20.9 10.8 5.6 5.4 People are smoking less gunja than 3 years ago 18.8 20.0 20.4 24.3 14.4 2.1 People are sniffing petrol less than 3 years ago 17.0 16.2 12.5 11.6 21.7 21.0 More kids are being looked after properly than they were 3 years ago
43.3 31.9 13.8 5.3 5.1 0.6
There is more respect for elders than 3 years ago 36.4 27.9 19.4 11.3 4.4 0.6 Community leaders are stronger than 3 years ago 33.0 28.0 20.8 10.7 6.4 1.1 The community is working better together to fix problems than 3 years ago
40.4 28.1 15.9 10.2 4.7 0.7
The community is safer than it was three years ago 41.0 31.6 14.7 7.2 4.7 0.8 It is easier to get help at the clinic than 3 years ago 51.2 27.1 11.5 4.8 4.3 1.1 It is easier to get help from the police than 3 years ago 45.5 30.8 13.0 6.2 3.8 0.7 It is easier to get help from Centrelink than it was 3 years ago
55.0 25.6 7.1 3.1 7.9 1.3
The school is better than it was 3 years ago 57.6 25.7 8.3 3.6 3.8 1.0 The store is better than 3 years ago 46.1 30.1 13.7 6.5 2.7 0.9 n = 1343 Source: CSWRS data file.
Overall, the majority of respondents have seen improvements in services in their communities. Over half of the people ‘strongly agree’ that the school, Centrelink, the clinic and the store have improved their services in the past three years. Adding responses for ‘agree a bit’ shows that there is a strong perception of change.
In addition, over three-quarters of respondents say that it is easier to get help from the police than it was three years ago. For those communities that now have a police station, it is no surprise that over 80 per cent of people find it easier to obtain help from the police. However, even in communities where there is still no police station over half (57.0%) agree to some extent that it is now easier to obtain help from the police. In communities with a previously established police station, the majority of respondents also found it easier to obtain help from police (77.0%) than they did three years ago. The survey data show that communities with no police station tend to use the clinic for advice and assistance on potential criminal matters.
Antisocial behaviour has reduced in some areas, as can be seen in Table 3.3. A majority of respondents agree to some extent that there is less trouble (61.3%), less family fighting (58.6%) and less drinking (57.2%) than three years ago. The qualitative analysis shows that in a number of communities there is a concern that drinking has moved to ‘the boundary’ (just outside the prescribed area). There is genuine concern for the physical safety of these drinkers while at the boundary drinking paddock (because of fighting) and returning to the community (drink driving).
However, when asked if people are smoking less ‘gunja’ (marijuana)282 than three years ago, more people disagreed (44.7%) than agreed (38.8%). In fact, gunja is perceived in many communities as more significant issue that alcohol. Some community residents fear for their safety because, at times when the drug is not available, many gunja smokers undertake intimidating and reckless behaviour.
282 ‘Gunja’ was the term used in both questionnaires to denote cannabis/marijuana, as it was found to be the most commonly recognised name during the piloting phases.

Research into community safety, wellbeing and service provision
100 Northern Territory Emergency Response: Evaluation Report 2011
Table 3.3 shows that many people agree to some extent that their community is working better to fix problems (68.5%), that there is more respect for elders in their community (64.3%) and that community leaders are stronger (61.0%) than three years ago.
In relation to desired higher level NTER outcomes, people agree to some extent that more children are being looked after properly (75.2%) and that their community is safer (72.6%) than three years ago.
NTER measures
The respondents were asked if particular NTER changes have made a difference to safety in their community (where applicable) (Table 3.4).
Table 3.4 Agreement with influence of NTER measures on safety in community (%)
A big
difference
A little bit of
difference No
difference Made it worse Don’t know
Not answered
Safe house (n = 777) 41.3 28.6 12.0 1.5 10.2 6.4 New grog rules 23.5 19.9 19.0 5.8 13.0 14.6 New rules for sexy pictures and movies 8.8 7.7 18.0 11.1 47.6 6.8 Better night patrols 43.3 31.5 16.8 3.4 3.6 1.4 New police station (Themis) (n = 350) 48.6 31.4 13.1 2.9 2.9 1.1 Additional police (n = 405) 32.3 25.7 25.4 5.9 8.9 1.9 More things for young people to do 39.6 25.8 24.1 2.7 6.6 1.3 n = 1,343 unless specified Source: CSWRS data file
Themis police stations appear to have been quite effective at increasing perceptions of safety. Respondents in the small and medium-sized communities were more likely to say that the stations had made a ‘big difference’ to safety in the community (59.0% and 56.0%, respectively). There was only one large community with a new station in the sample. In that community, just over a quarter of respondents thought that the Themis station had made a big difference (27.0%); over half (55.0%) thought it had made a little bit of difference.
Seven communities in the sample had received additional police through the NTER. Over half of respondents agreed that the additional police had made some difference to safety in their community.
The qualitative component of the research showed that a number of communities that do not have permanent police station think police stations are essential for community safety. In cases where a police ‘hub’ for overnight accommodation was built as part of the NTER, people said the hubs were not being used. Other issues identified by respondent comments that could be addressed include: short-term community placement practices, more police cultural awareness and a better understanding by the community of what local stations can do.
Seven communities in the sample have a ‘safe house’, five of which were implemented as part of the NTER. Table 3.4 shows that almost three-quarters (69.9%) of people think the safe house has made some difference to safety in their communities—almost one-third of those people think safe houses have made ‘a big difference’ to safety.

Research into community safety, wellbeing and service provision
Northern Territory Emergency Response: Evaluation Report 2011 101
There was a mixed response on the effect of the ‘new grog283 rules’ and their relationship to safety and the perceived level of alcohol consumption over the past three years. Over 40 per cent of people agreed that the new rules had made some difference, a quarter disagreed, and over a quarter did not know or did not answer the question.
When asked if pornography restrictions (phrased as ‘new rules for sexy pictures and movies’284) had made a difference to safety, 54.4 per cent of respondents answered ‘don’t know’ or did not answer. Consultants reported that people were not aware of the restrictions or any pornography in their communities, which is reflected in the very high ‘don’t know’ response. New rules had made a difference to safety according to 16.5 per cent of respondents while 18.0 per cent thought they had made no difference, and 11.1 per cent said they made the situation worse.
Night patrols are seen to have made a positive contribution to safety in the community. Almost three-quarters (74.8%) agreed that patrols have made some difference to safety in their community, and over 40 per cent said they have made a ‘big difference’. In small communities, almost 90 per cent say patrols have made a difference.
The NTER invested considerable resources though the Youth Diversion and Youth in Communities programs in the NTER communities. When asked whether they thought ‘more things for young people to do’ made a difference to safety, 65.4 per cent of all respondents thought that those investments had made some difference to safety in the community.
Community and personal safety
Community safety was considered to have improved by 72.6 per cent of respondents, while 21.9 per cent said it was worse (Table 3.3). People were asked about feelings of personal safety in different situations in the community. There were two standout scenarios in which few people felt safe: walking at night and at community meetings where people were arguing. For ‘walking around at night’, less than 40 per cent of people felt safe. The qualitative data indicate that some communities interpreted ‘unsafe at walking at night’ as including harm from wild animals, cars and lack of street lighting, as opposed to concern about physical violence.
Community meetings where arguments may develop are also intimidating for many people: only 33.4 per cent of people felt safe in that environment.
Children
People were asked a question about their perceptions on life for children in the community: ‘Has life changed for children in the community over the last three years?’ Over half of all respondents considered that there had been improvements in the past three years, across all areas (Table 3.5).
Table 3.5 Perceptions of life for children in the community over the past three years (%)
More Same Less Not answered Healthy 57.0 34.0 6.1 2.9 Food 68.8 23.5 5.0 2.7 Active—playing sport, watching less TV 65.8 24.8 6.9 2.5 Going to school 63.1 24.7 10.0 2.2 Happy 61.6 29.3 6.3 2.9 n = 1,343. Source: CSWRS data file.
283 ‘Grog’ was used for alcohol in the questionnaires as it is the most commonly used name for alcohol. ‘New grog rules’ was found in the piloting phase to be the best term to use for alcohol prohibitions introduced into communities under the NTNER legislation. 284 Pornography prohibitions were described as ‘new rules for sexy pictures and movies’.

Research into community safety, wellbeing and service provision
102 Northern Territory Emergency Response: Evaluation Report 2011
Ongoing problems
While there is recognition that improvements in many areas have been made, a question in the survey showed that a number of things are still considered quite a problem for a number of communities. There are a number of communities, primarily in the south, where few issues are considered big problems, if any.
The responses indicate that many perceived ongoing problems involve younger people. Table 3.6 shows the ranking of problems by respondents and the number of communities that identified that issue as a problem.
Table 3.6 Issues still considered big or very big problems
Top big or very big problem issues Respondents
(%) Communities
(no.) Young people not listening to older people 70.5 11 Kids being out at night 64.5 9 Drugs—too much gunja 61.7 9 People sending nasty phone messages 57.7 7 Drinking too much grog 52.1 6 Other types of family fighting 53.9 5 Men hurting women 52.5 5 Humbugging old people 49.3 6 Kids not going to school 46.4 5 ‘Spinning’ and other dangerous driving 42.3 3 Sorcery/black magic 40.0 4 Kids not being looked after properly 38.3 4 n = 1343 n = 16
Source: CSWRS data file.
Many of the items identified relate to young people and substance abuse. As Table 3.6 shows, ‘young people not listening to older people’ is number 1 in both lists. More respondents identified this as an issue than any other, and it came up as a major issue for most communities. The table also shows that ‘kids being out at night’ is a significant problem in a majority of communities. Another issue involving younger people is ‘people sending nasty phone messages’. This appears to be an emerging issue as internet and mobile technology becomes available in these very remote locations. Eleven of the communities in the sample have mobile coverage; of those, seven identified nasty phone messages as a big or very big problem. Comments provided with this question indicate that, in some instances, a nasty phone message can be the catalyst for disagreements and fighting between family groups, which in turn leads to children not being sent to school to avoid conflict.
‘Drinking too much grog’ and ‘smoking too much gunja’ were identified as big or very big problems by the majority of respondents. It is interesting that gunja was ranked significantly higher by respondents (61.7%) than grog (52.1%) as a problem. Some communities have stated that grog is no longer an issue in their community as they had already initiated alcohol bans prior to the NTER. Some of those communities indicated that they are now concerned that the increased use of gunja will cause the same problems (violence and antisocial behaviour) they had before they tackled the high alcohol consumption in their community.
Quality of life
The questions about values show that there is strong, almost universal support for the importance of connections to culture, living traditionally and speaking language

Research into community safety, wellbeing and service provision
Northern Territory Emergency Response: Evaluation Report 2011 103
(91.2%). Children being able to read, write and speak in English is also rated as very important (81.3%), as is having a proper job (81.2%).
After considering all the questions that had been asked, respondents were asked to think about their community and to rate the community as being on the way up or the way down. They were then asked to rate whether their life is better now than three years ago. Table 3.7 shows the results.
Table 3.7 Perceptions of life in the community and of the community’s current status (%)
Community is on the way up My life is better now than three years ago Way up 47.4 58.7 Way down 7.6 6.2 No change 42.1 31.1 Not answered 2.9 4.1 n = 1343 Source: CSWRS data file.
Comments made about why respondents thought their community was on the way up were many and varied. Better employment opportunities, unspecified positive changes in the community, improvements in housing, police presence and feelings of safer/happier communities were the most frequent.
However, there were a number of communities where a majority did not consider that their community was on the way up. Many of those respondents thought there was no change in their community over the past three years. In these communities, people believe local governance was effectively functioning with strong leadership before the NTER. Men, in particular, felt betrayed and disempowered as a result of the NTER and the change of governance from community to Northern Territory shire-based councils, which was not part of the NTER measures but occurred around the same time.
The majority of people in all communities rated their life as better than three years ago.
Comments made about quality of life were also numerous and varied. However, employment opportunities stood out as being the most frequently cited reason for improvement, followed by ‘happier/healthier/better life’, close to family and kin, safer/quieter community, better school and school attendance, and more activities for everyone.
Significance of population and community characteristics
Additional analysis of the survey results was undertaken to see how results varied by population characteristics (for example, sex and age) and community characteristics (size, location in the north or south etc.). Community reports contained considerable information about the results by sex and age, as local Indigenous people had expressed interest in knowing those differences. In the overview analysis, a consistent finding was that there were often obvious differences in results when the size of the community is considered. It seems that more change has been noticed in smaller communities, where, for example, greater proportions indicated that there was less trouble, fighting and drinking.
The corollary to this was that greater proportion of respondents in the small and medium-sized communities viewed their community as working better to fix problems, with more respect for elders and stronger community leaders. Respondents in small communities were also more likely than those in medium or large communities to say that various initiatives had made a big difference. With children, the greatest perception of change for small and medium communities was in relation to school attendance: around four-fifths (79%) of respondents

Research into community safety, wellbeing and service provision
104 Northern Territory Emergency Response: Evaluation Report 2011
said that children in their community are going to school more, compared with just over half (51%) of respondents in large communities. In the large communities, the greatest perception of change for children is food: 64 per cent of respondents agreed that children now have more food.
Almost 90 per cent and 84 per cent of respondents in small and medium communities, respectively, considered that community safety had improved, compared with 63 per cent in large communities. The majority of respondents in small and medium communities also rated their community as on the way up. Fewer people in large communities felt safe at community meetings when there were arguments (27%), compared with those in small communities (50%) and medium communities (47%). In addition, ‘men hurting women’ and ‘other types of family fighting’ were only identified as big or very big problems by the majority of respondents in large communities. Humbugging also seems to be predominantly an issue for large communities.
Based on these findings, the size of community seems to be a significant factor when considering whether community safety has changed in NTER communities. In some respects this is not surprising, given that it has been recognised that larger communities with multiple clan and family groups are often characterised by greater conflict and social problems than smaller communities, and that the impact of additional services will be more noticeable where there is a smaller population. In the CSWRS, the total number of communities was 16. Future research and analysis could further explore and identify the size of the community and other community characteristics that may influence crime and other social problems, as well as local people’s perceptions of personal and community safety and quality of life.
Future priorities
In an open-ended question, respondents were asked to nominate what they considered to be the most important things needed to make their community safer. The responses suggest the need to continue with or expand existing initiatives.
The top three most common responses were more employment opportunities (27%), more (permanent) police (25%) and more or new housing (24%). Other common responses were more night patrols (18%), more activities for young people (15%), increased sporting facilities (13%), and safer roads (12%).
Some differences in priorities are evident between the northern and southern communities. Those in the north have more focus on increased policing (29%) and night patrol (20%), while those in the south have more focus on improved employment opportunities (35%) and housing (44%).
Fifty-four per cent of those in communities with no permanent police presence considered a police presence to be a key requirement for the future, while those in small communities were particularly focused on the provision of more and newer housing.
Qualitative findings Outputs from the qualitative component are comparable across 12 communities, where a voting process to determine the biggest changes and challenges was used. Some of the changes and challenges identified were specific to each community; however, a number of issues were identified by all 12 communities, which allowed for a comparison across the communities. For example, the BasicsCard, food availability (including the School Nutrition Program), changes at the local school, police, night patrols and youth programs were all positive changes included in the list by all communities. Both the school and the BasicsCard

Research into community safety, wellbeing and service provision
Northern Territory Emergency Response: Evaluation Report 2011 105
were rated by six communities (a mix of small, medium and large) as one of their top five changes. In relation to NTER measures that improved safety—the police, night patrols and youth programs all ranked in the top five changes in five communities, which is consistent with the findings from the quantitative survey. Improvements in positive behaviours, such as less drinking and increased employment, rated well as positive changes, as did the clinic and Centrelink services.
Not all changes were regarded as positive. Two communities voted that the disempowerment of the community through the change in governance structure was one of the top five changes. For another community, a decrease in quality of life due to less money in the community through the changes to the Community Development Employment Projects program came up as a top five change—but a negative one. For one large community, pornography was a big negative change due to the use of mobile phones and the posting and sharing of images via the internet.
Challenges identified through the ranking exercise strongly support the findings of the survey: that is, that people think more housing (nine communities) and employment/training opportunities (eight communities) are needed. In addition, in six communities activities and programs for all community members rated as one of the top five challenges. The provision of infrastructure, such as street lights and a swimming pool, was regarded as a major challenge still facing some communities.
In contrast to the quantitative survey findings, which found that kids being out at night, gunja, grog and mobile phones were some of the biggest problems, only one to two communities ranked these issues in their top five challenges in qualitative polling.
The qualitative methods also allowed for a place-based interpretation of the quantitative responses. For example, the survey results indicated that 40 per cent of respondents feel unsafe, or a little unsafe, when walking around at night. However, when this is interpreted using the qualitative responses and participatory research, it appears that this response is often related to environmental safety, such as snakes and wild animals, or to sorcery concerns, rather than a concern about physical violence.
The CSWRS consolidated report produced by Bowchung Consulting explains in detail the participatory results.
Feeding back All communities that participated in the research had their community report presented to them at the conclusion of the research. The results were explained and discussed with a number of interested cohorts in each community. The community has joint ownership of the report, in conjunction with FaHCSIA, and can use the report for their future planning. Feedback from communities indicates that they are very pleased that the government has heard their voice about their opinions and concerns about safety and wellbeing in their community, and that they also have the report to address some of the problems themselves.
Conclusion from the CSWRS Both the quantitative survey and the qualitative material show that many of the areas where people identified improvements in their community are also often the areas where people identify future challenges. To give just one example, while many respondents cited some improvement in school attendance, 46.4 per cent still cited school attendance as a very big or big problem.

Research into community safety, wellbeing and service provision
106 Northern Territory Emergency Response: Evaluation Report 2011
Not surprisingly, there was very strong support for additional police, as respondents cited a strong link between more police and increased safety. There was also strong support for night patrols: 74.8 per cent of respondents said patrols had made a big or little bit of difference to community safety. The new grog rules also attracted a fair degree of support as contributing to increased community safety: 43.4 per cent reported a difference (23.5% reported a very big difference to safety and a further 19.9% reported a little bit of difference). Despite this, people ‘drinking too much grog’ was rated as a very big or big ongoing problem by 52.1 per cent of respondents.
Centrelink support also received a good rating: 55.0 per cent of respondents strongly agreed that it is easier to obtain support from Centrelink than it was three years ago. A lot of people (57.6%) also strongly agreed that the school is better than it was three years ago. In addition, 51.2 per cent of respondents strongly agreed that it was easier to get help at the clinic than it was three years ago, and almost half strongly agreed that the store is better than three years ago.
The major ongoing problems are centred on young people, such as children being out at night. From the qualitative research, it was apparent that concerns about children being out at night related to the risk of injury from environmental factors, such as dogs, cars and snakes. From the survey, the most commonly identified issue was young people not listening to older people. The use of internet and communication technology by young people to facilitate bullying and exacerbate jealousy was a widespread concern raised during the qualitative research and in the survey: many participants indicated that ‘nasty text messaging’ was a problem in the local community. Also worth noting is the ongoing challenge from gunja and alcohol use.
The results show that there is strong, almost universal, support for connections to culture, living traditionally and speaking language. However, having kids being able to read, write and speak in English also rated as very important, as did having a proper job.
In relation to what people see as the best way of improving safety in their community (noting that this question allowed for free responses), the top three were more employment opportunities (27%), more (permanent) police (25%) and more or new housing (24%).
Community Safety Service Provider Survey
Objective The aim of the CSSPS was to contribute to a better understanding of whether service providers in the Northern Territory believe community safety has changed as a result of measures introduced in recent years, and to indicate what service providers believe makes a difference. As the CSSPS was complementary to the CSWRS, the overall objective was to determine whether service providers across remote areas and in towns held similar views on a range of community safety issues to those found in the CSWRS and to investigate whether service delivery and coordination had changed.
Some community residents are also employed as service providers, so the two groups are not mutually exclusive. However, we were aware that there were likely to be some divergent results, as service providers’ perspectives would be shaped by their work and would be less likely to represent a ‘community’ culturally informed viewpoint based on a lifetime of local experience.

Research into community safety, wellbeing and service provision
Northern Territory Emergency Response: Evaluation Report 2011 107
In the longer term, the overall objective of the CSSPS was to contribute to an evidence base that seeks to inform efforts to reduce and prevent crime, and to assist local efforts to improve safety. It was also an opportunity to test out a relatively inexpensive research method that could be adapted and used in future assessments and monitoring of strategies aimed at improving community safety. As there were not the resources to undertake qualitative research and the survey was completed online, the interpretation of survey responses was informed by free text responses to a number of open-ended questions in the survey.
Ethics approval Ethics approval for the service provider survey was granted by two Northern Territory-based human research ethics committees: the Central Australian Human Research Ethics Committee and the Human Research Ethics Committee of the Northern Territory Department of Health and Families and Menzies School of Health Research.
Methodology The CSSPS sought the views and perceptions of key stakeholders in towns and remote communities throughout the Northern Territory. From networks of service providers throughout the Territory in a range of sectors, including health, police, education, child protection, social security, local government and GBMs, more than 1,000 people were directly invited to participate in the online survey from 5 April to 20 May 2011.
The survey of service providers sought to address the following key research questions:
• What are service providers’ current perceptions of safety and social problems?
• Do service providers believe community problems and safety have changed in their local area since 2007?
• What do service providers believe has made a difference to community safety since 2007?
• Do service providers believe there has been a change in how services are delivered and coordinated since 2007?
• Are there significant differences by location and sector in these perceptions?
Developmental phase The initial version of the survey questionnaire included questions on personal and community safety which were, as noted at the outset of this chapter, based on an earlier questionnaire piloted by the Australian Institute of Criminology amongst service providers in a range of locations across Australia in 2009. In addition, the questionnaire included questions about the availability and coordination of services, and perceived changes in availability and coordination.
One-day forums with service providers were held in Darwin, Alice Springs and Katherine in mid-November 2010, with the aim of explaining the research and seeking feedback on its purpose, method and instrument. Forum attendees provided invaluable advice on the survey’s purpose, the contents of the initial questionnaire and possible ways to promote the project and encourage participation amongst colleagues. A subset of 20 forum participants, representing a cross-section of sectors and locations, was followed up in December and January and asked to further test the revised questionnaire. Two modes of delivery were used—direct email with the questionnaire attached and online access. After more

Research into community safety, wellbeing and service provision
108 Northern Territory Emergency Response: Evaluation Report 2011
modifications to the questionnaire and in response to comments from an ethics committee, further piloting of the online survey was conducted in early March 2011.
Stakeholder support From October 2010 and with the involvement of the Northern Territory Office of Indigenous Policy, agreement to support the survey was sought from key Northern Territory Government agencies, such as police, justice, health, education and community services, via the Community Safety Working Group. A letter of support for the research project was received in January 2011 from the chair of the working group.
Based primarily on their experience of conducting research in the Themis communities285 and their links to the non-government sector, the North Australian Aboriginal Justice Association (NAAJA) was contracted to assist in engaging the non-government sector and encouraging participation amongst key networks in the sector.
Survey rollout The survey went live on 5 April 2011. Key people in Northern Territory Government organisations were sent a web link and password and asked to forward them, along with attachments that explained the research, to staff in the field. NAAJA also sent out links and the password to non-government organisations. We also contacted the forum participants, GBMs, Centrelink managers and shire CEOs and asked them to forward the link and/or information to staff or local service providers. The survey closed on 19 May.
Sample characteristics A total of 699 service providers participated in the survey. Of those, 59 per cent were female, nine per cent self-identified as of Aboriginal or Torres Strait Islander background, 57 per cent had lived in the Northern Territory for more than five years, and 86 per cent worked for government organisations.
Service providers were asked to answer questions about the place where they had worked most in the previous year. The main categories for place were ‘towns’ (the major urban centres of the Northern Territory) and ‘remote communities’, with a drop-down menu that included a list of all the 73 NTER communities. Over half of the sample answered questions about a town (58%) and 40 per cent answered for a remote community. Over a third of town respondents (40%) were in Darwin, followed by Alice Springs (22%), Nhulunbuy (12%), Katherine (12%), Palmerston (6%) and Tennant Creek (6%).
Among remote community participants there was good coverage of the Northern Territory, with at least one response in each community for over 80 per cent of the 73 NTER communities. The sample also covered the major service sectors, including health (22%), education (19%), coordination (15%), police (12%), housing/welfare (7%), justice/legal services (1%), and ‘other’ (23%).
Survey findings In the evaluation of the NTER measures, the main interest is in their impact on the 73 NTER remote communities. This chapter concentrates on presenting the results for the remote communities. The order that the results are presented follows the sequence in the questionnaire, which had questions about current perceptions of personal and community
285 J. Pilkington, op. cit.

Research into community safety, wellbeing and service provision
Northern Territory Emergency Response: Evaluation Report 2011 109
safety, social problems and service delivery, followed by perceptions of changes and the impact of individual measures on safety.
What are the current perceptions of safety, social problems and service delivery?
Personal safety
The majority of service providers in remote communities felt safe walking alone, at home alone, and doing their job during the day (see Figure 3.1). They felt less safe after dark doing their job, socialising and walking alone, although more people still felt safe than unsafe.
In the situation in which respondents felt most unsafe, ‘walking alone at night’, 26 per cent of those in remote communities felt unsafe.
Safety of social groups
Men were considered to be the safest social group: 36 per cent of remote respondents considering men to be ‘safe all the time’ and an additional 49 per cent considered them to be ‘safe some of the time’ (combined total of 85%; see Figure 3.2). After men, visitors to the community and service providers were viewed as the next safest groups. Girls, closely followed by women, were viewed as the least safe groups (the proportions of remote respondents viewing them as ‘safe all the time’ were 16% for girls and 17% for women).
Figure 3.1 Proportion that feel ‘safe’/’a bit safe’ in different situations (%): remote community service providers
Safe/A bit safe (Remote)
97
64
81
91
53
65
94
0 10 20 30 40 50 60 70 80 90 100
Doing your job in daylight
Doing your job after dark
Being home by yourself in daylight
Being home by yourself after dark
Walking alone in daylight
Walking alone at night
Socialising after dark
Percent
Remote community range of n = 278–280. Source: CSSPS FaHCSIA datafile.

Research into community safety, wellbeing and service provision
110 Northern Territory Emergency Response: Evaluation Report 2011
Figure 3.2 Perceptions of safety for different groups of people, percentage ‘safe all of the time’/’safe some of the time’(%): remote community service providers
Safe all/Some of the time (Remote)
72
51
7465
77 79
55
85
0102030405060708090
100
MenBoy
s
Women
Girls
Old men
Old wom
en
Service
prov
iders
Visitors
to th
e com
munity
Per
cent
Remote community range of n = 273–279. Source: CSSPS FaHCSIA datafile.
Social problems
Based on service provider responses to a list of 18 social problems, ‘children being out at night’, ‘children not going to school’ and ‘dogs’ ranked as the biggest social problems in remote communities (they were regarded as very big problems by 45%, 38% and 45%, respectively).
At least 50 per cent of remote community respondents said ‘vandalism’, ‘dogs’, ‘children not being looked after properly’, ‘children not going to school’, ‘children being out at night’, drugs (‘gunja’) and ‘drinking too much grog in places other than home’ were big or very big problems (Figure 3.3). There was a large proportion of ‘don’t know’ responses from service providers for the two sexual assault items (women/girls and boys being forced to have sex).

Research into community safety, wellbeing and service provision
Northern Territory Emergency Response: Evaluation Report 2011 111
Figure 3.3 Perceptions of social problems in the community/neighbourhood, ‘big’ or ‘very big’ problems (%): remote community service providers
Big/Very big problem (Remote)
33
46
27
50
16
7
21
50
47
47
57
74
71
73
51
35
16
22
0 10 20 30 40 50 60 70 80 90 100
Other types of violence
Family violence
Drinking to much grog in homes
Drinking too much grog in other places
Women and girls being forced to have sex
Boys being forced to have sex
Adults hurting children
Drugs (gunja)
Humbugging other people
Humbugging old people
Children not being looked after properly
Children being out at night
Children not going to school
Dogs
Vandalism
Burglaries/breaking and entering
Dangerous/noisy driving
Nasty mobile phone texting
Percent
Remote range of n = 264–270. Source: CSSPS FaHCSIA datafile.
Events/times when less safe
The most common time or event when service providers considered the community or neighbourhood to be less safe was any time alcohol was involved (mentioned in 41% of remote community responses to an open question on this topic). Service providers widely reported that the events or times making places less safe involved a combination of payday/weeks, times of royalty payments, and influxes of visitors because of events such as football matches. Other common times mentioned were times surrounding funerals and sorry business, when there were gangs and fighting, family feuding, and drugs (Table 3.8).

Research into community safety, wellbeing and service provision
112 Northern Territory Emergency Response: Evaluation Report 2011
Table 3.8 Themes in open-ended responses to question about times/events when the community/neighbourhood is less safe: remote community service providers
Remote (n = 237) Theme Number of responses % Alcohol 96 41 Sport 18 8 Payday 32 14 Outsiders 29 12 Royalties 16 7 Particular festival/event 3 1 School holidays 6 3 Seasonal 13 6 Gangs/fighting 20 8 Death/sorry business 20 8 Break-ins 6 3 Drugs 20 8 Dogs 8 3 Family feuding 25 11 Note: Respondents may have more than one category applied to their response. Source: CSSPS FaHCSIA datafile.
Incidents that heighten perceptions of people being unsafe Fighting and/or violence (including domestic/family violence, murder and sexual assault) was the most commonly mentioned topic (48% of remote responses) to the open question about things that have happened to make respondents feel that the community or neighbourhood is unsafe for some people. The second most common theme was alcohol and drinking/drunkenness (30% of remote community responses). Dogs and drugs (including gunja and volatile substance misuse) were also common themes in remote community responses to this question (Table 3.9). Table 3.9 Why some people are perceived as unsafe: remote community service providers
Remote (n = 246) Number of responses % Fighting/violence 119 48 Domestic/family violence 47 19 Murder 5 2 Sexual assault/rape 19 8 Alcohol/drunkenness 74 30 Break-in/theft 23 9 Harassment/humbugging 6 2 Antisocial behaviour 1 0 Drugs 37 15 Volatile substances 15 6 Youth/gang 20 8 Dogs 64 26 Car damage/theft 6 2 Road safety 3 1 Mental health/suicide 7 3 Uncategorised 36 15 Note: Respondents may have more than one category applied to their response. Source: CSSPS FaHCSIA datafile.
Availability of and need for services
The most common services that are available in remote communities, according to service providers, are ‘community health’, ‘police’, ‘24-hour emergency health care’ and ‘night patrols’. At least 85 per cent of participants indicated that each of those four services was available in their local area or through visiting services (Figure 3.4).

Research into community safety, wellbeing and service provision
Northern Territory Emergency Response: Evaluation Report 2011 113
Responses indicated that the 13 other services asked about in the survey were less likely to exist in remote communities. Less than half of remote community participants said the following services were available: ‘family and domestic violence service’ (46%), ‘women’s group’ (44%), ‘Aboriginal community police’ (40%), ‘other victim support/counselling service’ (39%), ‘men’s group’ (30%), ‘law and justice committee’ (16%), and ‘sobering up shelter/detox centre’ (13%).
Figure 3.4 Whether services are available in the community/neighbourhood (%): remote community service providers
44
30
16
86
13
40
91
62
39
46
54
58
53
53
59
88
97
0 10 20 30 40 50 60 70 80 90 100
women's group
men's group
law and justice committee
night patrols
sobering up shelter/detox centre
Aboriginal community police
police
child welfare/protection service
other vict im support/counselling service
family and domestic violence service
safe house
Aboriginal legal service
legal aid
drug and alcohol service
mental health service
24hr emergency health care
community health
percent
Remote community range of n = 251–257. Source: CSSPS FaHCSIA datafile.
When provided with a list of 17 services, respondents were asked to indicate whether a service exists, whether it does not exist and is needed, or whether it does not exist but is not needed. While for most services a majority of respondents indicated the service already exists, some had a large proportion of service providers indicating they didn’t exist and were needed. Remote respondents indicated that the most commonly needed service (that does not currently exist) was a ‘children’s refuge/safe house’ (51%), followed by a ‘men’s group’ (46%), ‘Aboriginal community police’ (42%), ‘family and domestic violence service’ (42%), and a ‘sobering up/detox centre’ (41%) (Figure 3.5).

Research into community safety, wellbeing and service provision
114 Northern Territory Emergency Response: Evaluation Report 2011
Figure 3.5 Proportion of respondents that indicated the service does not exist and is needed (%): remote community service providers
39
46
34
9
41
51
42
11
31
41
42
33
23
22
36
33
9
4
0 10 20 30 40 50 60 70 80 90 100
Women’s group
Men’s group
Law and Justice Committee
Night patrols
Sobering up shelter/detox centre
Children’s refuge/safe house
Aboriginal community police
State/Territory police
Child welfare/protection services
Other victim support/counselling service
Family and domestic violence service
Safe house
Aboriginal legal service
Legal aid
Drug and alcohol service
Mental health services
24 hour emergency health care
Community health
percent
Remote community range of n = 229–236. Source: CSSPS FaHCSIA datafile.
Although other services not provided in the list, such as mental health and youth services, were mentioned elsewhere in open text questions as being needed, many participants preferred to stress the need to improve existing services (especially their accessibility after hours) and the coordination of services, and workforce problems such as understaffing, housing and the need for security.
Coordination of services
Overall, there were more positive than negative comments from remote community service providers when asked how services work together in their community. However, quite a few stressed that only some organisations work well together, or only work well together some of the time. Negative comments were made about visiting services or the lack of engagement with the local community, and several stressed how much coordination is personality driven.
In response to a question about how well cross-agency cooperation works in relation to community safety objectives, remote community participants were most likely to be neither satisfied nor dissatisfied with the contribution that cooperation made to community safety (27%; see Table 3.10). Similar proportions of remote respondents were satisfied (26.0%) and dissatisfied (27%) with the contribution of cross-agency cooperation to community safety. Agencies and services were seen to work together more often when the work involved

Research into community safety, wellbeing and service provision
Northern Territory Emergency Response: Evaluation Report 2011 115
assisting at-risk or unsafe individuals, compared work to provide activities or programs that improve community safety.
Table 3.10 Satisfaction with cross-agency cooperation that contributed to community safety (%): remote community service providers
Remote Number % Very satisfied 24 10 Satisfied 63 26 Neither satisfied nor dissatisfied 67 27 Dissatisfied 66 27 Very dissatisfied 15 6 Don’t know 11 5 Total 246 100.0 Source: CSSPS FAHCSIA datafile.
The majority of remote participants enjoyed working in the community or neighbourhood always or most of the time (77%; Table 3.11). An even higher proportion would recommend working in the community/neighbourhood to others (82% of remote community respondents). Slightly more remote respondents thought community safety was not affecting staff retention than those who thought it was (49% compared with 40%).
Table 3.11 Level of enjoyment in working in the community/neighbourhood (%): remote community service providers
Remote Number % Always/most of the time 189 77 Some of the time 51 21 Never/rarely 4 2 Don’t know 1 <1 Total 245 100 Source: CSSPS FaHCSIA datafile.
What are the perceived changes to community safety, social problems and service delivery?
Changes in community safety and social problems in the past three years
Just under half of the remote community service providers considered the community to be safer now compared with three years ago (41%). Almost one-fifth (17%) considered the community to be the less safe, and 28 per cent considered it to be the same (not more safe or less safe).
The most common response to a list of eight social problems was that there had been no change, but more remote respondents indicated there was less of the problem now compared with those who said there was more for all problems except ‘gunja’ and ‘drinking too much grog in places other than home’ (Figure 3.6). Nearly a quarter (22%) said gunja use had increased, while only 9 per cent said there was less use. For ‘drinking too much grog in places other than home’ 21 per cent of remote respondents had noticed more of the problem compared with 16 per cent who had noticed less. At least a quarter of remote community participants said there was less ‘family violence’ (27%) and ‘violence other than family violence’ (25%).

Research into community safety, wellbeing and service provision
116 Northern Territory Emergency Response: Evaluation Report 2011
Figure 3.6 Perceived changes in community/neighbourhood problems in the past three years (%), remote community service providers
12
41
27
2013
36
25
12
36
2328
21
39
16
24
43
9
25
4
38
19
40
12
49
1622
18
43
20 182225
0
10
20
30
40
50
60
70
80
90
100
Mor
eSa
me
Less
Not
sure
Mor
eSa
me
Less
Not
sure
Mor
eSa
me
Less
Not
sure
Mor
eSa
me
Less
Not
sure
Mor
eSa
me
Less
Not
sure
Mor
eSa
me
Less
Not
sure
Mor
eSa
me
Less
Not
sure
Mor
eSa
me
Less
Not
sure
Familyviolence
Other typesof violence
Drinking toomuch grog in
homes
Drinking toomuch grog inother places
Gunja Adults hurtingchildren
Children notbeing looked
after properly
Children notgoing toschool
Perc
ent
Remote communities range n = 165–254. Source: CSSPS FaHCSIA datafile.
Changes in cross‐agency cooperation and staff retention
When remote service providers were asked about their satisfaction with cross-agency cooperation three years ago, they were most likely to say they did not know (44%). Of those who did know, more were dissatisfied than satisfied with cooperation three years ago (52% were either dissatisfied or very dissatisfied, compared with 29% who were satisfied or very satisfied) (see Figure 3.7). More remote respondents are satisfied with the current levels of cross-agency cooperation compared with three years ago (excluding those who do not know, 37% are satisfied or very satisfied with current levels compared with 29% three years ago). This implies an improvement in interagency cooperation, no doubt partly because of an increased provision and presence of services.
Respondents were asked whether staff retention is better now compared with three years ago. There was a large proportion of ‘don’t know’ responses to this question (39%). Of those who did know, the majority of remote respondents (45%) said staff retention is not different from three years ago, while 30 per cent said it was not better and 25 per cent said it was better.
What is seen as making a difference to community safety? Some programs and initiatives were implemented only in a selection of remote communities. There was also a considerable number of remote community service providers who did not know how initiatives/programs had affected community safety. The distribution of responses suggests that many service providers are not sure what has been implemented or how the various initiatives may have affected their local area.
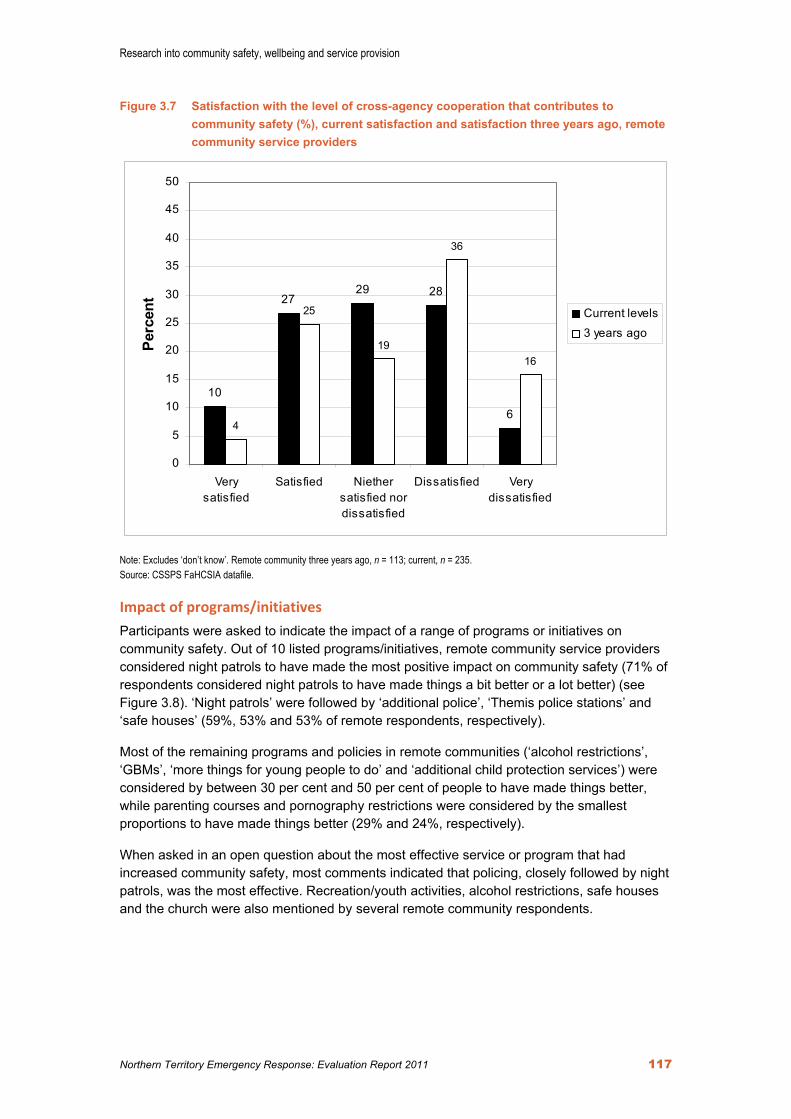
Research into community safety, wellbeing and service provision
Northern Territory Emergency Response: Evaluation Report 2011 117
Figure 3.7 Satisfaction with the level of cross-agency cooperation that contributes to community safety (%), current satisfaction and satisfaction three years ago, remote community service providers
10
2729 28
64
25
19
36
16
0
5
10
15
20
25
30
35
40
45
50
Verysatisfied
Satisfied Niethersatisfied nordissatisfied
Dissatisfied Verydissatisfied
Perc
ent
Current levels3 years ago
Note: Excludes ‘don’t know’. Remote community three years ago, n = 113; current, n = 235. Source: CSSPS FaHCSIA datafile.
Impact of programs/initiatives
Participants were asked to indicate the impact of a range of programs or initiatives on community safety. Out of 10 listed programs/initiatives, remote community service providers considered night patrols to have made the most positive impact on community safety (71% of respondents considered night patrols to have made things a bit better or a lot better) (see Figure 3.8). ‘Night patrols’ were followed by ‘additional police’, ‘Themis police stations’ and ‘safe houses’ (59%, 53% and 53% of remote respondents, respectively).
Most of the remaining programs and policies in remote communities (‘alcohol restrictions’, ‘GBMs’, ‘more things for young people to do’ and ‘additional child protection services’) were considered by between 30 per cent and 50 per cent of people to have made things better, while parenting courses and pornography restrictions were considered by the smallest proportions to have made things better (29% and 24%, respectively).
When asked in an open question about the most effective service or program that had increased community safety, most comments indicated that policing, closely followed by night patrols, was the most effective. Recreation/youth activities, alcohol restrictions, safe houses and the church were also mentioned by several remote community respondents.

Research into community safety, wellbeing and service provision
118 Northern Territory Emergency Response: Evaluation Report 2011
Figure 3.8 Whether programs/policies have made a positive impact on safety (%): remote community service providers
53
46
24
71
53
59
36
44
43
29
0 10 20 30 40 50 60 70 80 90 100
Safe house
Alcohol restrictions
Pornography restrictions
Night patrols
Themis Police Station
Additional police
Additional child protection services
More things for young people to do
Government Business Managers
Parenting courses
Percent
Note: Includes proportion who think policy/program made things ‘a lot better’ or ‘a bit better’. Those who answered ‘Not in this community’ have been removed from the analysis. Remote communities range of n = 165–254. Source: CSSPS FaHCSIA datafile.
What do service providers say should happen? In remote communities, social problems or issues that frequently recurred in responses were kids, dogs, lighting/roads, alcohol, gambling and family fighting. There is variation across community settings and across problems, with some respondents indicating the situation was worse and others better. Several respondents said the community was safe because it was a strong community and/or because of its small size.
Almost all service providers agreed that more should be done to make the neighbourhood or community safer (81% of remote community respondents).
When asked about the three most important things that could be done to make the community or neighbourhood safer, the topic that came up most frequently in remote communities was the need to increase policing (including increasing numbers, having more police presence and employing more Aboriginal police officers). Other common themes for remote communities were increasing youth activities and facilities such as youth centres; the need for a grog program/stricter grog rules; getting more children to go to school; more enhanced and proactive night patrol services; addressing dog issues; providing a safety/night shelter (including having specific shelters for men, women and children); improving law and justice measures; and parenting programs/courses.
Another key message that came through in remote community responses was about the need to increase community involvement in appropriate decision making and to build community capacity and leadership. Suggestions to facilitate this included engaging community leaders and establishing working groups, such as community safety action groups, men’s and women’s groups and having clan leaders developing the safety agenda.

Research into community safety, wellbeing and service provision
Northern Territory Emergency Response: Evaluation Report 2011 119
How do service provider perceptions compare with the perceptions of Indigenous residents of remote communities? When key items in the service provider survey were compared with the CSWRS survey, Indigenous residents and service providers in remote communities had the following similar results: ‘children being out at night’ was one of the most prevalent problems; there is less violence and fighting than three years ago in some places; and there have been positive impacts from Themis police stations, night patrols, additional police and safe houses.
Table 3.12 shows the responses to the questions about the measures that had the most positive responses in both surveys. As the questions and response categories were somewhat different, they are not directly comparable, but they show similar patterns (for example, the greater proportion of positive responses for the selected categories of measures). CSWRS respondents tended to be slightly more positive about most measures; CSSPS respondents were more likely to say that the measures had made no difference than were CSWRS respondents.
Table 3.12 Perceived impact of selected measures on community/neighbourhood safety (%), CSSPS remote service providers and CSWRS
CSSPS categories(a) CSSPS remote CSWRS categories(b) CSWRS results Safe houses % Safe house % A lot better 10 Big difference 44 A bit better 24 Little bit of difference 29 Made no difference 15 No difference 13 A bit worse <1 Made it worse 2 A lot worse <1 Not in this community 36 Not answered(c) Don’t know 14 Don’t know 11 Night patrols Better night patrols A lot better 21 Big difference 43 A bit better 46 Little bit of difference 31 Made no difference 16 No difference 17 A bit worse <1 Made it worse 3 A lot worse 1 Not in this community 6 Not answered 1 Don’t know 10 Don’t know 4 Themis police stations New police station A lot better 22 Big difference 45 A bit better 18 Little bit of difference 30 Made no difference 12 No difference 19 A bit worse 0 Made it worse 2 A lot worse 1 Not in this community 25 Not answered(c) Don’t know 22 Don’t know 4 Additional police Additional police A lot better 21 Big difference 29 A bit better 22 Little bit of difference 27 Made no difference 13 No difference 18 A bit worse <1 Made it worse 4 A lot worse <1 Not in this community 27 Not answered(c) Don’t know 16 Don’t know 8 (a) CSSPS question: ‘Have the following affected safety in this community/neighbourhood?’. Range of n = 257–262. (b) CSWRS question: ‘Do you think these things made a difference to safety in your community?’. Range of n = 399–1,306. (c) ‘Not answered’ category did not apply to the safe house, new police station and additional police questions, as the responses are
only from the communities where those initiatives were introduced. Sources: CSSPS FaHCSIA datafile and CSWRS FaHCSIA datafile.

Research into community safety, wellbeing and service provision
120 Northern Territory Emergency Response: Evaluation Report 2011
When asked about the three most important things that were needed to make the community or neighbourhood safer, there was some overlap between respondents in the CSWRS and CSSPS. Having more police was among the top three most common responses in both surveys. Other common themes that emerged in both surveys were increasing night patrols and more activities for young people. Increasing job opportunities and improving roads were also themes that came up in both surveys, although they were more common in the CSWRS than they were in the CSSPS.
Conclusions from the CSSPS The results from the survey indicate that in many remote communities service providers believe that some things have improved in the past three years. Many felt safer than they did three years before, and certain problems, such as family and other violence, were perceived to have declined in some communities.
Alcohol-related violence or fighting may have declined in some remote communities, but many service providers indicated that drinking too much grog in places other than home was still a big problem and had increased. Some of this drinking is likely to be outside communities, or in nearby towns.
Service providers in remote communities said girls followed by women were the least safe social groups in the local neighbourhood or community. It is not known, however, whether this was because girls and women were considered to be most at risk of serious and less frequent violent victimisation, such as sexual assault, or whether they were viewed as more at risk of more prevalent but less serious forms of intimidation and coercion.
The sizeable proportion of ‘don’t know’ responses from the service provider survey to questions about sexual assault against women, girls and boys, and to questions about other problems, such as phone texting and drinking in homes, underlined the ‘visibility’ of certain types of behaviour and activity.
Service providers were concerned about children on a number of measures; however, based on the proportion of respondents who indicated it was a problem, children being out at night was the most common problem closely followed by children not going to school. A consistent theme in the service provider responses was the need for youth services and activities, or for their better implementation, although it is not clear what age group respondents had in mind. In addition to issues relating to children and alcohol-related problems, service providers considered aggressive dogs to be one of the major problems in remote communities. Several respondents indicated that dogs were the most important problem that needed addressing.
In remote communities, what seems to have had the most impact on community safety are night patrols, followed by additional police, Themis stations, safe houses and alcohol restrictions. This is not surprising, given the direct relevance of NTER and other measures to efforts to reduce crime and alcohol-related violence. Other measures may have a salutary effect on individual wellbeing and social capital, but not in an immediate or obvious way on community safety.
Although there were clearly gaps in services in certain places and in remote communities, the responses to the suite of questions about service delivery and community safety suggest that it is not necessarily more services that are required. This is certainly the case in towns, and to a lesser extent in remote communities.
Instead, many service provider responses referred to how services are delivered and coordinated. These were seen as the key areas for improvement. A frequent complaint in

Research into community safety, wellbeing and service provision
Northern Territory Emergency Response: Evaluation Report 2011 121
remote communities was about the absence of after-hours services, and at least one-third of respondents were not satisfied with the way services worked together to address community safety.
Overall, the survey results underline the need for local leadership and engagement in remote communities to plan and implement strategies that tackle alcohol consumption during periods of risk, dogs, cannabis, and young adults’ antisocial behaviour. Increasing the safety of women and children continues to be a priority, along with improving after-hours service delivery, interagency cooperation and work conditions. Compared with towns, remote communities seem to be faring better on a number of fronts, although the results from both the CSSPS and CSWRS suggest that there remain concerns in local communities about substance misuse, young people and children, local infrastructure and services, and local opportunities to lead and manage socioeconomic change.
Dissemination and use of the research The views of service providers in the Northern Territory surveyed through the CSSPS align with many of those highlighted by community members through the CSWRS surveys. A strong theme from both surveys relates to children not attending school and being out late at night. Both surveys found that police and night patrols are seen to have positive impacts on community safety. The majority of community members feel that their children are happier, healthier, more active, have more food and are going to school more than three years ago, and, on the whole, community members feel their life is on the way up.
Key research findings from both projects have already been disseminated. Community reports have been given back to local people in the 16 communities where the CSWRS was conducted. The local community reports will inform future planning and program development. In some cases, for local researchers involved in the CSWRS, the survey training and experience has led to other employment opportunities (such as the 2011 Census). This research has already given many an opportunity to attend and participate in the Australasian Evaluation Society conference in Sydney in September 2011.
Information from both projects has been circulated to various independent authors of this report’s chapters, and was especially relevant to Chapter 5, ‘Promoting law and order’. Further dissemination of the results to key stakeholders, including service providers and ethics committees, will occur.
Both research projects were undertaken in 2011 and represent a snapshot of perceptions and views of local Indigenous people and service providers in a range of remote communities at that time. In the future, the methods and instruments may be adapted and used in other evaluations and research where community safety is a concern, and assist in cross-sectoral strategic planning and program development in government and the non-government sector.


Part Two
Part Two
4 Coordination and engagement 125
5 Promoting law and order 159
6 Improving child and family health 201
7 Supporting families 245
8 Enhancing education 292
9 Welfare reform and employment 333
10 Housing and land reform 369

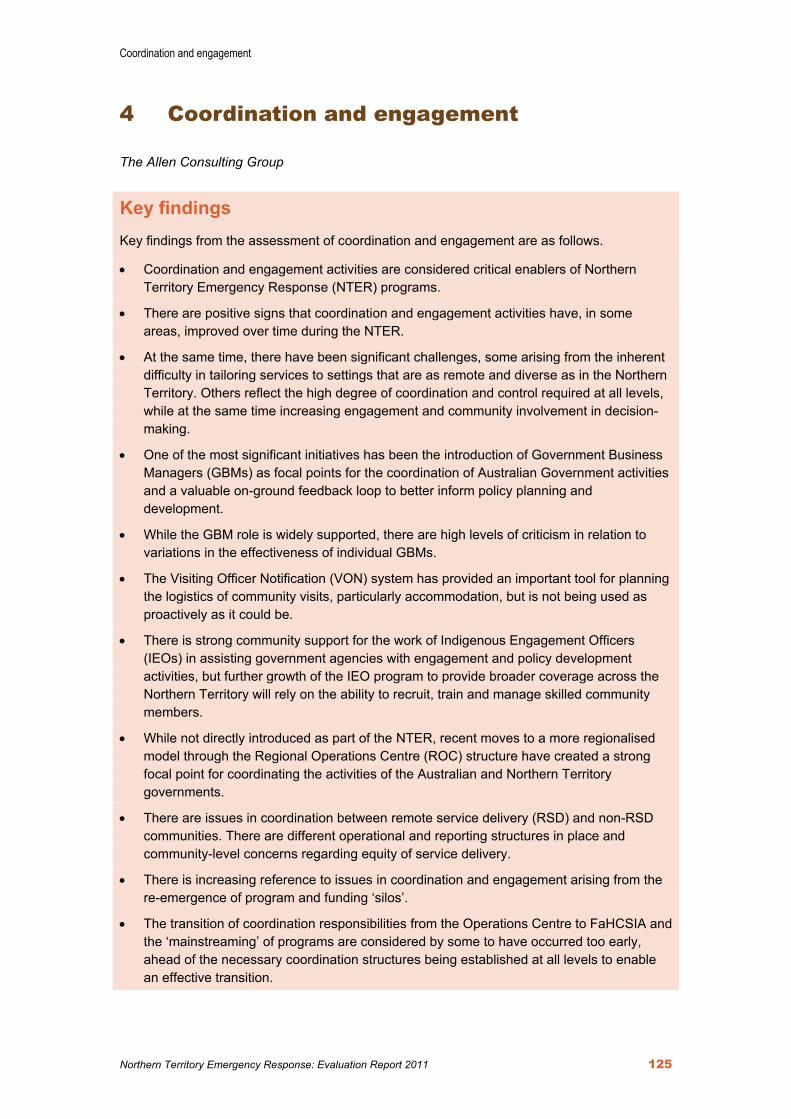
Coordination and engagement
Northern Territory Emergency Response: Evaluation Report 2011 125
4 Coordination and engagement
The Allen Consulting Group
Key findings Key findings from the assessment of coordination and engagement are as follows.
• Coordination and engagement activities are considered critical enablers of Northern Territory Emergency Response (NTER) programs.
• There are positive signs that coordination and engagement activities have, in some areas, improved over time during the NTER.
• At the same time, there have been significant challenges, some arising from the inherent difficulty in tailoring services to settings that are as remote and diverse as in the Northern Territory. Others reflect the high degree of coordination and control required at all levels, while at the same time increasing engagement and community involvement in decision-making.
• One of the most significant initiatives has been the introduction of Government Business Managers (GBMs) as focal points for the coordination of Australian Government activities and a valuable on-ground feedback loop to better inform policy planning and development.
• While the GBM role is widely supported, there are high levels of criticism in relation to variations in the effectiveness of individual GBMs.
• The Visiting Officer Notification (VON) system has provided an important tool for planning the logistics of community visits, particularly accommodation, but is not being used as proactively as it could be.
• There is strong community support for the work of Indigenous Engagement Officers (IEOs) in assisting government agencies with engagement and policy development activities, but further growth of the IEO program to provide broader coverage across the Northern Territory will rely on the ability to recruit, train and manage skilled community members.
• While not directly introduced as part of the NTER, recent moves to a more regionalised model through the Regional Operations Centre (ROC) structure have created a strong focal point for coordinating the activities of the Australian and Northern Territory governments.
• There are issues in coordination between remote service delivery (RSD) and non-RSD communities. There are different operational and reporting structures in place and community-level concerns regarding equity of service delivery.
• There is increasing reference to issues in coordination and engagement arising from the re-emergence of program and funding ‘silos’.
• The transition of coordination responsibilities from the Operations Centre to FaHCSIA and the ‘mainstreaming’ of programs are considered by some to have occurred too early, ahead of the necessary coordination structures being established at all levels to enable an effective transition.

Coordination and engagement
126 Northern Territory Emergency Response: Evaluation Report 2011
• There is a growing level of uncertainty about the future focus and funding of initiatives within Northern Territory remote communities, which places at risk the momentum already achieved and the longer-term goals being pursued.
Introduction The Northern Territory is a unique and demanding environment in which to deliver services. The demographic, geographic, economic and historical characteristics of the Territory set it apart from other Australian jurisdictions, creating challenges for policymakers and service delivery agencies alike.286
The Northern Territory comprises over a sixth of Australia’s landmass (1,346,000 km2), but contains only slightly more than 1 per cent of Australia’s population (229,700 people).287 More than half of the Northern Territory’s population lives in Darwin, and Indigenous Australians comprise almost a third of the Northern Territory population—the highest proportion of any Australian state or territory.
The remoteness of Northern Territory communities presents particular difficulties in providing basic services such as health and education, and has impacts on the ease of supply, transportation and communication. It also poses challenges in attracting and retaining staff in communities. In addition, remote communities face historically high levels of disadvantage, including constraints on access to resources, economic markets, essential services and information and communications technology infrastructure.
A further complexity is the diversity of cultures into which services need to be delivered. The Northern Territory has more than 100 Indigenous ‘nationalities’ or clan groups, and multiple groups live in some communities. A key challenge for policy design is to provide sufficient levels of flexibility to meet the varying needs of individual communities.
The NTER introduced a number of new initiatives and expanded other existing programs across the Northern Territory. Critical areas of focus have been child health checks, additional police presence, licensing of community stores and school attendance.
Within such an environment, coordination of services and engagement with communities are considered by agencies, providers and community members to be critical for the effective delivery of programs.
Methodology The Allen Consulting Group was commissioned by the Department of Families, Housing, Community Services and Indigenous Affairs (FaHCSIA) to assess the effectiveness of coordination and engagement activities for the delivery of the NTER.
The assessment undertaken here is based on the key questions outlined in Figure 4.1. The questions have been adapted from the key evaluation questions set out for the overall synthesis report, together with the program logic maps developed for the coordination and engagement measures.
286 H. Bath, M. Bamblett & R. Roseby, Growing them stronger, together: Report of the Board of Inquiry into the Child Protection System in the Northern Territory, Northern Territory Government, Darwin, 2010, p. 10. 287 ABS, Inform NT, March 2011, cat. no. 1308.7, ABS, Canberra, 2011.

Coordination and engagement
Northern Territory Emergency Response: Evaluation Report 2011 127
Figure 4.1 Approach to coordination and engagement
The assessment was conducted in two phases. Phase 1 scoped the areas for further investigation and determined where further data were required. This involved interviews with 27 key informants and the investigation of existing literature and reviews. Phase 2 focused on gathering additional data through:
• visits to three NTER communities (a total of 21 interviews were held in communities with government agency staff, service delivery staff and a limited number of community members)
• 29 informant interviews with more than 50 staff members from across the Australian Government, Northern Territory Government, local government and non-government organisations (NGOs) involved in the delivery of the NTER
• a telephone survey of government agencies and service providers, completed with 85 stakeholders, including 35 GBMs
• a telephone survey of nine IEOs.

Coordination and engagement
128 Northern Territory Emergency Response: Evaluation Report 2011
Scope of analysis The focus of the analysis is on programs in the Closing the Gap in the Northern Territory National Partnership Agreement from mid-2009 and expiring in June 2012. However, given that the NTER began in mid-2007, the analysis also considers certain coordination and engagement measures put in place during the first two years of the NTER (the ‘stabilisation’ phase), as well as additional structures or roles that have evolved throughout the following period (the ‘normalisation’ phase).
A challenge for the analysis is that there have been significant changes since the beginning of the NTER in June 2007. Limited pre-NTER or baseline data exist regarding coordination and engagement, which has made it difficult to assess directly whether coordination and engagement approaches have improved as a result of the NTER. As found in many previous reviews of Indigenous programs in the Northern Territory, there is a lack of rigorous evidence upon which to base findings and reach conclusions. Moreover, consultations can result in a range of individual views and perceptions which, while valid in their own settings, are difficult to examine on a Territory-wide basis. Where possible, other reports and evaluations undertaken throughout the NTER have been drawn on here to assist in developing and validating findings and conclusions in relation to coordination and engagement, as well as to determine where further investigation is required.
Only three communities could be visited due to the need to coordinate with other community consultations, To augment the analysis, reflections on community perspectives, where relevant, have been gathered through discussions with government agency and service delivery staff in communities. The views of community members outlined through other NTER research have also been incorporated.
The assessment considers cross-agency coordination and engagement activities and structures, most of which primarily link to, or result from, FaHCSIA’s coordination role within the NTER. Individual coordination activities within each agency have not been able to be considered in any detail. The specific areas considered in detail are:
• the NTER Operations Centre
• GBMs
• IEOs
• the Northern Territory Aboriginal Interpreter Service (NT AIS)
• the Indigenous Leadership Program.
The assessment also considers some broader actions of the Australian, Northern Territory and local governments and NGOs involved in service delivery, all aimed at addressing Indigenous disadvantage. While many of those initiatives are not specifically part of the NTER, from a community perspective they are indistinguishable and therefore have been addressed here to the extent that they have had a bearing on coordination and engagement activities. These other initiatives include:
• the NTER redesign consultations
• the National Partnership Agreement on Remote Service Delivery, and the resulting ROC and local implementation plans (LIPs)
• Indigenous Coordination Centres (ICCs)
• Northern Territory shire reform
Coordination and engagement
Northern Territory Emergency Response: Evaluation Report 2011 129
• the VON system.
Structure of the chapter The remaining sections of this chapter:
• outline the definitions and characteristics of coordination and engagement used for this assessment
• present summary survey findings and address the key themes of policy coordination, service coordination, on-ground impacts and building community capacity
• present overall conclusions, summarise the lessons learned throughout the review and suggest areas for further consideration.
Appendix 4 (in a separate document) details government and service provider survey results.
Definitions and characteristics of effective coordination and engagement This section outlines the definitions and characteristics of coordination and engagement used throughout the review.
Joined-up government and whole-of-government service delivery A key objective of this assessment is to examine the extent to which joined-up service delivery has occurred in relation to the NTER. A starting point for this is to examine the characteristics of joined-up government; that is, where public sector agencies work across traditional portfolio boundaries to achieve shared goals, provide integrated government responses to particular issues, and share responsibilities for a defined outcome.288,289,290
Common rationales for using a joined-up government approach include:
• eliminating contradictions and tensions between different policies
• better using resources by reducing duplication between programs
• improving the flow of ideas between stakeholders
• producing a more seamless and integrated set of services.291,292,293
Literature in this area identifies that collaborative, joined-up government approaches are most suitable for complex and longstanding policy issues, which defy traditional agency boundaries.294,295,296 Successful delivery of complex policy directions requires the support of multiple agencies and levels of government—a joined-up approach.297
288 State Services Authority Victoria, Joined up government: A review of national and international experiences, Melbourne, 2007, p. 2. 289 Department of Premier and Cabinet (Tasmania), Collaboration: A Tasmanian Government approach, Hobart, 2007, p. 4. 290 Australian Public Service Commission, Connecting government: Whole of government responses to Australia’s priority challenges, Canberra, 2004, p. 5. 291 C. Pollitt, ‘Joined-up government: A survey’, Political Studies Review, vol. 1, no. 1, 2003, p. 38. 292 D. Majumdar, ‘Collaboration among government agencies with special reference to New Zealand: A literature review’, Social Policy Journal of New Zealand, issue 27, March 2006, p. 185. 293 National Audit Office (UK), Joining up to improve public services, London, 2001, p. 2. 294 D. Blackman, F. Buick, J. Halligan, J. O’Flynn & I. Marsh, ‘Australian experiences with whole of government: Constraints and paradoxes in practice’, IRSPM conference, University of Berne, 7–9 April 2010. 295 Australian Public Service Commission, op. cit., pp. 4–5. 296 State Services Authority Victoria, op. cit., p. vii. 297 H. Bath, M. Bamblett & R. Roseby, op. cit., p. 413.

Coordination and engagement
130 Northern Territory Emergency Response: Evaluation Report 2011
However, effective joined-up delivery can be resource intensive, costly and time consuming, and need only be used for issues that cannot be handled by one agency. Joined-up approaches require multiple accountability arrangements and introduce an additional degree of complexity in the administration of programs due to the existence of multiple players.298,299
Placing joined-up government in the context of this assessment, the NTER seeks to achieve a joined-up government response across measures that span and require input from multiple agencies.300 The benefits of a coordinated approach to service delivery have the potential to flow through to positive engagement at the community level, which can enable community development.
The NTER is one of the most complex examples of joined-up government, requiring significant coordination not just between agencies of one government, but also across the Australian, Northern Territory and local governments, as well as with non-government service delivery agencies.
Acknowledging this, COAG’s Service delivery principles for programs and services for Indigenous Australians identify considerations to support genuine and effective engagement with Indigenous people. The principles note that services should consider the:
• priority principle: programs and services should contribute to meeting targets while being appropriate to local needs
• Indigenous engagement principle: engagement should be central to the design and delivery of programs
• sustainability principle: programs should be directed and resourced over an adequate period
• access principle: programs should be physically and culturally accessible
• integration principle: there should be collaboration between and within governments at all levels and their agencies to effectively coordinate programs and services
• accountability principle: programs and services should have regular and transparent performance monitoring, review and evaluation.301
Defining coordination and engagement In the context of this assessment, ‘coordination’ is taken to refer to the activities of, and interaction between, organisations and individuals involved in delivering the NTER measures, and ‘engagement’ refers to how organisations responsible for delivering services interact with communities.
The consideration of engagement here focuses on engagement processes adopted by government and service providers, rather than an assessment of community views about the effectiveness of engagement in leading to outcomes. The program logic outlined that the longer term outcomes anticipated through engagement activities are ‘a sound relationship between community and government, strengthened community capacity and leadership and
298 J. Hunt, ‘The whole of government experiment in Indigenous affairs: A question of governance capacity’, Public Policy, vol. 2, no. 2, 2007, p. 155. 299 C. Pollitt, op. cit., p. 38. 300 C. Pollitt, op. cit., p. 36. 301 COAG, Service delivery principles for programs and services for Indigenous Australians, COAG, Canberra, 2009.

Coordination and engagement
Northern Territory Emergency Response: Evaluation Report 2011 131
community members having needs met through accessing appropriate services which are community controlled where possible.’302
Literature regarding coordination suggests that effective approaches require characteristics such as the exchange of information, the sharing of resources, a commitment to a common purpose, joint planning and ongoing evaluation.303,304,305,306 Moreover, to be effective, coordination is required at all levels—local, regional, territory and national. Building on this, the following set of characteristics was developed by the evaluation team for use as an assessment framework for effective coordination:
• shared objectives—agencies share a common commitment to the policy directions, building on mutual understanding, trust and respect
• clear roles and responsibilities—agencies understand who is responsible for each aspect of program delivery
• adequate resourcing—sufficient staffing, funding and leadership support are provided
• open communications—avenues exist for agencies to discuss activities and issues for mutual benefit
• sharing of information—agencies share relevant information with other services to support coordinated service provision
• continuous improvement—processes are in place to monitor progress and resolve issues.
The evaluation considered using the International Association of Public Participation’s engagement continuum.307 That scale gauges different levels and styles of engagement, from one-way ‘informing’ through ‘consulting’, ‘involving’ and ‘engaging’ to ‘empowering’. The scale was not considered appropriate for the purposes of this review, as the changing styles and aims of engagement activities during different phases of the NTER mean that each level of engagement may be required at different stages.
The review therefore focused on the presence of characteristics of effective engagement, tailored to the Indigenous context, as follows:
• tailored engagement—engagement approaches are flexible, building on knowledge of local-level cultural norms and community preferences
• clear messages—communities are provided with information that is accessible and clear
• feedback loops—open communication channels exists between government and the community to discuss progress towards community priorities
• leadership development—engagement approaches work with established community leaders, thereby reinforcing and building their capacity
• continuous improvement—processes are in place to monitor progress and resolve issues.
302ARTD Consultants & WestWood Spice, Development of program logic options for the NTER, unpublished report prepared for FaHCSIA, 2010, p. 15. 303 S. Bell & A. Hindmoor, ‘The governance of public affairs’, Journal of Public Affairs, vol. 9, 2009. 304 A. Sheedy, M.P. MacKinnon, S. Pitre & J. Watling, Handbook on citizen engagement: Beyond consultation, Canadian Policy Research Networks, 2008. 305 Scottish Government, Public value and participation: A literature review for the Scottish Government, Edinburgh, 2008. 306 Department of Premier and Cabinet (Tasmania), op. cit. 307 International Association for Public Participation, IAP2 spectrum of public participation, 2007, Available at: <http://www.iap2.org/associations/4748/files/spectrum.pdf>.

Coordination and engagement
132 Northern Territory Emergency Response: Evaluation Report 2011
While coordination and engagement characteristics are distinct concepts, there are strong overlaps and interdependencies. Effective coordination can lead to more tailored and targeted engagement activities on the ground, while effective on-ground engagement can provide valuable information to aid policy development and coordination. As a result, discussions of coordination and engagement often occur in parallel throughout this chapter.
The link between coordination and engagement and outcomes is less clear. Good coordination and engagement are considered in the evaluation strategy program logic as ‘enablers’ of development, without which outcomes cannot be efficiently and effectively achieved. However, the achievement of actual outcomes does not result from coordination or engagement itself—it is through program-specific activities or services delivered to communities. As such, the evaluation of outcomes of positive coordination and engagement will be manifested in sector- or program-based outcomes, which are considered in other chapters of this report.
Findings This section first presents general findings from the survey of government agencies and service providers in relation to the characteristics of good coordination and engagement. That is followed by a discussion drawing together data collected from the survey, informant interviews and community visits, along with other NTER literature. The discussion is organised around the four key evaluation questions:
1. Policy coordination—How well have governments worked to make intersectoral policy and planning decisions?
2. Service coordination—How well has the Australian Government worked within itself and with other governments and service delivery bodies?
3. Community impact—How have coordination and engagement impacted on the ground?
4. Building community capacity—How have governments worked with communities to increase their capacity for and role in community development?
These questions cover concepts of both coordination and engagement. An overall summation is provided in the ‘Summary of findings’ section, which considers the broader evaluation question of whether joined-up delivery has occurred.
Survey findings in relation to coordination The survey included questions about whether the NTER exhibited characteristics of good coordination, as well as on the effectiveness of specific structures and programs aimed at supporting coordinated service delivery. Respondents were also asked several open-text questions to identify issues and improvements.
Survey responses of ‘most of the time’ and ‘always’ are generally considered to be desirable. While ‘some of the time’ may in certain instances indicate a significant change as a result of the NTER, ‘some of the time’ and ‘never’ are generally considered to indicate that further improvement is required.
The survey sample included 85 government agency and service provider staff, comprising:
• 21 Australian Government representatives from seven agencies, with a maximum of five respondents per agency

Coordination and engagement
Northern Territory Emergency Response: Evaluation Report 2011 133
• 36 of a total of 56 current GBMs, including 24 from northern communities and 12 from southern communities
• 10 Northern Territory Government representatives from nine agencies
• nine representatives of service delivery organisations, including community health services, job services and community stores
• four local government representatives
• four representatives of support agencies, including legal aid
• one university representative.
Given the central on-ground role of GBMs, the analysis of survey results distinguishes between responses provided by GBMs and non-GBMs.
Survey findings regarding coordination are outlined in Table 4.1.
The majority of survey respondents (71% overall and 74% of GBMs) indicated that coordination had improved during the course of the NTER. A FaHCSIA survey of 699 service providers across the Northern Territory, conducted in April and May 2011, tested attitudes to community safety. In relation to the levels of cross-agency cooperation contributing to community safety, the survey found that ‘remote community participants were more dissatisfied three years ago’ than in 2011.308 Although framed in relation to levels of dissatisfaction, the findings similarly indicate improvement in coordination, albeit in a single sector.
Despite the government and service provider survey indicating some improvement in coordination over time, both GBM and non-GBM survey responses were critical of the actual levels of coordination. A majority found that coordination approaches were ‘never’ effective (37%) or only effective ‘some of the time’ (50%). This suggests that substantial improvement is required in the way that agencies work together in the delivery of NTER initiatives.
GBMs were one of the main coordination mechanisms implemented at the community level. In response to the survey, 94 per cent of GBMs and 65 per cent of non-GBMs thought that the GBM model was an appropriate structure to coordinate services in communities.
Specific responses in relation to the characteristics of good coordination are discussed below. In general, GBMs shared a more positive view of NTER coordination activities than non-GBMs.
Shared objectives
GBM and non-GBM survey respondents were largely consistent in relation to views regarding the agencies sharing a common commitment to policy directions. A substantial proportion of survey respondents considered that government agencies ‘never’ (31%) or ‘some of the time’ (43%) share a common commitment, while others indicated a common commitment ‘most of the time’ (24%).
Further emphasis is required on involving agencies in developing policy directions and working towards their implementation.
308 J. Putt, S. Middleton, J. Yamaguchi & K. Turner, Community safety: Results from the survey of service providers in the Northern Territory, FaHCSIA, Canberra, 2011, p. 54.
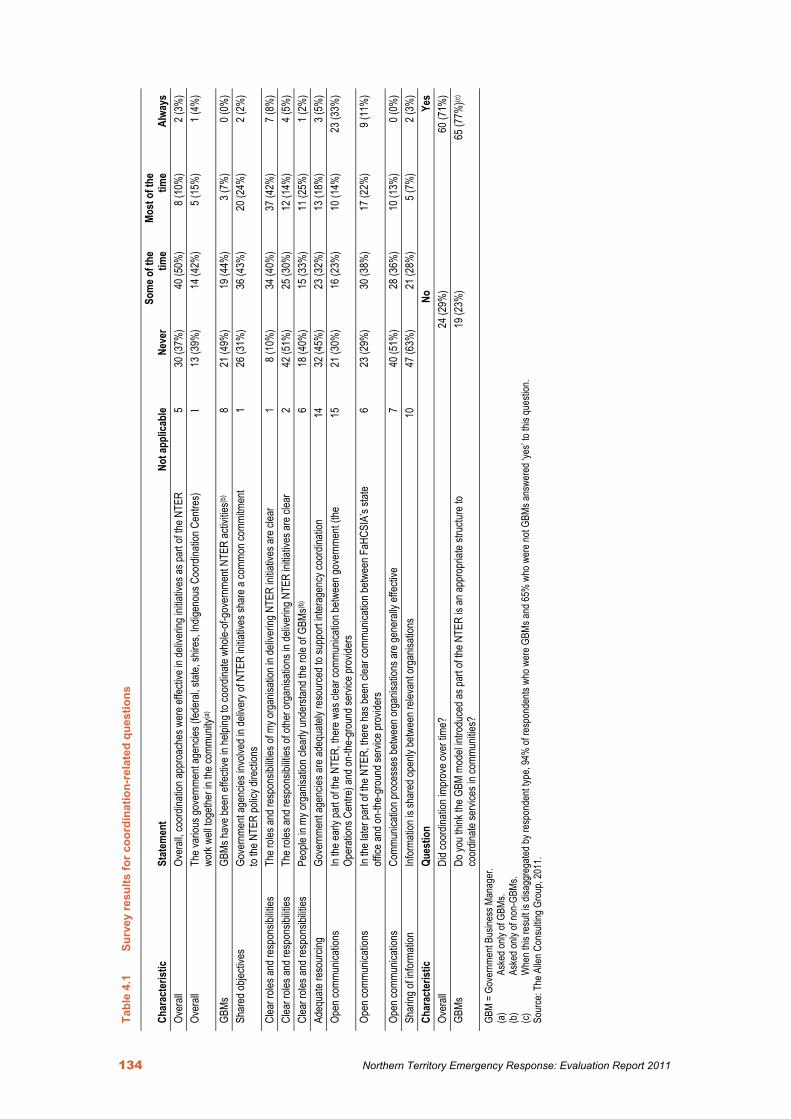
134 Northern Territory Emergency Response: Evaluation Report 2011
Tabl
e 4.
1 Su
rvey
resu
lts fo
r coo
rdin
atio
n-re
late
d qu
estio
ns
Char
acte
ristic
St
atem
ent
Not a
pplic
able
Neve
r So
me o
f the
tim
e Mo
st o
f the
tim
e Al
ways
Ov
erall
Ov
erall
, coo
rdina
tion a
ppro
ache
s wer
e effe
ctive
in de
liver
ing in
itiativ
es as
part
of the
NTE
R 5
30 (3
7%)
40 (5
0%)
8 (10
%)
2 (3%
) Ov
erall
Th
e var
ious g
over
nmen
t age
ncies
(fed
eral,
state
, shir
es, In
digen
ous C
oord
inatio
n Cen
tres)
work
well t
ogeth
er in
the c
ommu
nity(a
) 1
13 (3
9%)
14 (4
2%)
5 (15
%)
1 (4%
)
GBMs
GB
Ms ha
ve be
en ef
fectiv
e in h
elping
to co
ordin
ate w
hole-
of-go
vern
ment
NTER
activ
ities(b
) 8
21 (4
9%)
19 (4
4%)
3 (7%
) 0 (
0%)
Shar
ed ob
jectiv
es
Gove
rnme
nt ag
encie
s inv
olved
in de
liver
y of N
TER
initia
tives
shar
e a co
mmon
comm
itmen
t to
the N
TER
polic
y dire
ction
s 1
26 (3
1%)
36 (4
3%)
20 (2
4%)
2 (2%
)
Clea
r role
s and
resp
onsib
ilities
Th
e role
s and
resp
onsib
ilities
of m
y org
anisa
tion i
n deli
verin
g NTE
R ini
tiativ
es ar
e clea
r 1
8 (10
%)
34 (4
0%)
37 (4
2%)
7 (8%
) Cl
ear r
oles a
nd re
spon
sibilit
ies
The r
oles a
nd re
spon
sibilit
ies of
othe
r org
anisa
tions
in de
liver
ing N
TER
initia
tives
are c
lear
2 42
(51%
) 25
(30%
) 12
(14%
) 4 (
5%)
Clea
r role
s and
resp
onsib
ilities
Pe
ople
in my
orga
nisati
on cl
early
unde
rstan
d the
role
of GB
Ms(b
) 6
18 (4
0%)
15 (3
3%)
11 (2
5%)
1 (2%
) Ad
equa
te re
sour
cing
Gove
rnme
nt ag
encie
s are
adeq
uatel
y res
ource
d to s
uppo
rt int
erag
ency
coor
dinati
on
14
32 (4
5%)
23 (3
2%)
13 (1
8%)
3 (5%
) Op
en co
mmun
icatio
ns
In the
early
part
of the
NTE
R, th
ere w
as cl
ear c
ommu
nicati
on be
twee
n gov
ernm
ent (
the
Oper
ation
s Cen
tre) a
nd on
-the-
grou
nd se
rvice
prov
iders
15
21 (3
0%)
16 (2
3%)
10 (1
4%)
23 (3
3%)
Open
comm
unica
tions
In
the la
ter pa
rt of
the N
TER,
ther
e has
been
clea
r com
munic
ation
betw
een F
aHCS
IA’s
state
office
and o
n-the
-gro
und s
ervic
e pro
vider
s 6
23 (2
9%)
30 (3
8%)
17 (2
2%)
9 (11
%)
Open
comm
unica
tions
Co
mmun
icatio
n pro
cess
es be
twee
n org
anisa
tions
are g
ener
ally e
ffecti
ve
7 40
(51%
) 28
(36%
) 10
(13%
) 0 (
0%)
Shar
ing of
infor
matio
n Inf
orma
tion i
s sha
red o
penly
betw
een r
eleva
nt or
ganis
ation
s 10
47
(63%
) 21
(28%
) 5 (
7%)
2 (3%
) Ch
arac
teris
tic
Ques
tion
No
Yes
Over
all
Did c
oord
inatio
n imp
rove
over
time?
24
(29%
) 60
(71%
) GB
Ms
Do yo
u thin
k the
GBM
mod
el int
rodu
ced a
s par
t of th
e NTE
R is
an ap
prop
riate
struc
ture t
o co
ordin
ate se
rvice
s in c
ommu
nities
? 19
(23%
) 65
(77%
)(c)
GBM
= Go
vern
ment
Busin
ess M
anag
er.
(a)
Aske
d only
of G
BMs.
(b)
Aske
d only
of no
n-GB
Ms.
(c)
Whe
n this
resu
lt is d
isagg
rega
ted by
resp
onde
nt typ
e, 94
% of
resp
onde
nts w
ho w
ere G
BMs a
nd 65
% w
ho w
ere n
ot GB
Ms an
swer
ed ‘y
es’ to
this
ques
tion.
Sour
ce: T
he A
llen C
onsu
lting G
roup
, 201
1.

Coordination and engagement
Northern Territory Emergency Response: Evaluation Report 2011 135
Clear roles and responsibilities
In relation to the delivery of NTER initiatives, GBMs were ‘always’ (14%) or ‘most of the time’ (51%) clear about the roles and responsibilities of their own agencies. However, non-GBMs stated that the roles of their own agencies were clear ‘most of the time’ (35%), ‘some of the time’ (47%) or ‘never’ (14%). This demonstrates that GBMs were generally clearer about what FaHCSIA was aiming to achieve in the delivery of the NTER than others in the survey sample.
However, GBMs and non-GBMs were less clear about the responsibilities of other agencies. GBMs stated that the responsibilities were ‘never’ clear (40%) or clear only ‘some of the time’ (31%). Likewise, non-GBMs were ‘never’ clear (58%) or clear ‘some of the time’ (29%) about the roles of other agencies. This shows a clear lack of understanding about what other agencies are doing to support NTER programs and policy directions.
In relation to the role of GBMs themselves, non-GBM respondents did not clearly understand the role of GBMs. They were ‘never’ clear (40%) or clear ‘some of the time’ (33%).
Adequate resourcing
Consistent results were provided by GBMs and non-GBMs identifying that agencies were ‘never’ (45%) adequately resourced to support inter-agency coordination activities. A third of respondents indicated that agencies were adequately resourced only ‘some of the time’ (32%). Without adequate staffing, funding and leadership support, service delivery activities are less likely to be effectively coordinated among agencies.
Open communication
GBM and non-GBM respondents stated that there was clearer communication between government and service providers on the ground while the Operations Centre was in place than during the later part of the NTER. Over half of the survey respondents indicated that present communications processes were ‘never’ effective (51%) or effective ‘some of the time’ (36%). Since the ‘stabilisation’ phase of the NTER, the clarity of communication processes between agencies appears to have declined as program delivery has been ‘normalised’ with agencies.
Sharing of information
GBM and non-GBM respondents found that information is not openly shared between relevant agencies (‘never’, 63%; ‘some of the time’, 28%).
Continuous improvement
Continuous improvement was not tested specifically through the survey. However, feedback from community visits and informant interviews suggested that more could be done at the local level to improve the monitoring and management of the performance of coordination-related initiatives, including of GBMs. The remoteness of many communities means that local issues can remain undetected for significant periods.
The survey also gathered suggestions for improving coordination activities, including for:
• all agencies to improve their understanding of and support for the NTER and related strategies
• coordination activities to pay closer attention to community needs
• closer links between the Australian, Northern Territory and local governments

Coordination and engagement
136 Northern Territory Emergency Response: Evaluation Report 2011
• better awareness of legislative issues that may inhibit the exchange of relevant information between agencies
• a clearer mandate for GBMs to coordinate service delivery at the local level, with increased support from other agencies
• greater coordination of funding to avoid duplication of programs
• greater oversight of non-government service providers
• improved coordination between policy development and service delivery staff to ensure that policy directions are able to be implemented
• coordination responsibilities to be added to job descriptions and service delivery contracts.
Survey findings in relation to engagement The survey included general questions on the characteristics of good engagement, as well as specific questions regarding the roles played by IEOs, GBMs, the VON system and interpreters in assisting engagement with communities (Table 4.2).
GBM and non-GBM respondents indicated in matching proportions that engagement approaches have improved (71%) during the course of the NTER. This finding is supported by informant interviews and community visits, which identified general improvements to engagement approaches, particularly through the use of more open questioning in consultation processes, and earlier and greater use of interpreter services to convey messages in more relevant language.
However, many respondents indicated that community engagement approaches have ‘never’ (39%) been effective in developing good relationships with the community, or have only been effective ‘some of the time’ (49%). Some more positive reflections were provided by GBM respondents, 21 per cent of whom considered that engagement approaches had helped to develop good relationships ‘most of the time’, in contrast to the response of non-GBMs (2% ‘most of the time’ and 2% ‘always). There clearly remains far greater potential to build good relationships with communities.
The survey responses also identified challenges in relation to the characteristics of good engagement, as discussed below. As for coordination, GBMs often shared a more positive view of NTER engagement activities than non-GBMs.
Tailored engagement
Responses indicated that local cultural traditions were ‘never’ considered (35%), considered ‘some of the time’ (43%) or considered ‘most of the time’ (18%). It is unclear whether this result reflects a lack of understanding about local cultural traditions amongst agencies, the limitations of GBMs’ and IEOs’ ability to actively manage and support appropriate community engagement, or other factors. GBMs were more positive in relation to this question than non-GBMs: 30 per cent considered that cultural traditions were considered ‘most of the time’ (24%) or ‘always’ (6%).

Northern Territory Emergency Response: Evaluation Report 2011 137
Tabl
e 4.
2 Su
rvey
resu
lts fo
r eng
agem
ent-r
elat
ed q
uest
ions
Char
acte
ristic
St
atem
ent
Not a
pplic
able
Neve
r So
me o
f the
tim
e Mo
st o
f the
tim
e Al
ways
Ov
erall
In
gene
ral, o
rgan
isatio
ns in
volve
d in d
elive
ring s
ervic
es ha
ve w
orke
d coll
abor
ative
ly wi
th co
mmun
ities
3 36
(44%
) 33
(40%
) 11
(13%
) 2 (
3%)
Over
all
Over
all, c
ommu
nity e
ngag
emen
t app
roac
hes h
ave b
een e
ffecti
ve in
deve
loping
good
relat
ionsh
ips
betw
een g
over
nmen
t age
ncies
and t
he co
mmun
ity
8 30
(39%
) 38
(49%
) 8 (
11%
) 1 (
1%)
Indige
nous
Eng
agem
ent
Offic
ers (
IEOs
) Ind
igeno
us E
ngag
emen
t Offic
ers a
re an
impo
rtant
supp
ort to
comm
unity
enga
geme
nt ac
tivitie
s(a)
0 1 (
3%)
7 (21
%)
14 (4
3%)
11 (3
3%)
IEOs
Th
e cur
rent
IEO
mode
l wor
ks w
ell to
prom
ote en
gage
ment
in co
mmun
ities
7 12
(15%
) 30
(38%
) 14
(18%
) 22
(29%
) IE
Os
Comm
unitie
s are
rece
ptive
to th
e wor
k of IE
Os
6 11
(14%
) 23
(29%
) 17
(21%
) 28
(36%
) IE
Os
IEOs
have
a go
od un
derst
andin
g of th
e com
munit
ies in
whic
h the
y wor
k 5
4 (5%
) 23
(29%
) 29
(36%
) 24
(30%
) GB
Ms
GBMs
have
been
effec
tive i
n ach
ieving
comm
unity
enga
geme
nt ar
ound
NTE
R ac
tivitie
s 9
22 (5
2%)
17 (4
1%)
3 (7%
) 0 (
0%)
Tailo
red e
ngag
emen
t Co
mmun
ity en
gage
ment
proc
esse
s con
sider
loca
l cult
ural
tradit
ions
7 27
(35%
) 34
(43%
) 14
(18%
) 3 (
4%)
Clea
r mes
sage
s En
gage
ment
appr
oach
es pr
ovide
comm
unitie
s with
clea
r infor
matio
n 7
38 (4
9%)
31 (4
0%)
9 (11
%)
0 (0%
) Cl
ear m
essa
ges
Inter
prete
rs ar
e use
d whe
re an
d whe
n req
uired
7
28 (3
6%)
34 (4
4%)
11 (1
4%)
5 (6%
) Fe
edba
ck lo
ops
GBMs
assis
t in ke
eping
the c
ommu
nity a
nd ot
her a
genc
ies in
forme
d of v
isits
to the
comm
unity
(b)
6 20
(44%
) 17
(38%
) 6 (
13%
) 2 (
5%)
Feed
back
loop
s IE
Os pl
ay a
key r
ole in
shar
ing co
mmun
ity m
essa
ges a
bout
gove
rnme
nt ini
tiativ
es
8 8 (
10%
) 25
(32%
) 21
(28%
) 23
(30%
) Fe
edba
ck lo
ops
The V
isitin
g Offic
er N
otific
ation
syste
m is
effec
tive i
n help
ing to
coor
dinate
comm
unity
visit
s(a)
3 7 (
23%
) 11
(37%
) 10
(33%
) 2 (
7%)
Lead
ersh
ip de
velop
ment
Loca
l lead
ersh
ip an
d gov
erna
nce c
apab
ility h
as be
en de
velop
ed to
supp
ort b
etter
enga
geme
nt be
twee
n gov
ernm
ent a
genc
ies an
d the
comm
unity
12
28
(38%
) 35
(48%
) 6 (
8%)
4 (6%
)
Lead
ersh
ip de
velop
ment
How
involv
ed is
the c
ommu
nity i
n its
own m
anag
emen
t?(a)
n.a
. 0 No
t invo
lved
6 (23
%)
A litt
le inv
olved
12
(46%
) Mo
stly
involv
ed
8 (31
%)
Entire
ly inv
olved
0 (
0%)
Char
acte
ristic
Qu
estio
n n.
a. No
Ye
s Ov
erall
Di
d eng
agem
ent a
ppro
ache
s imp
rove
over
time?
0
24 (2
9%)
60 (7
1%)
IEOs
Do
you t
hink t
he IE
O mo
del in
trodu
ced a
s par
t of th
e NTE
R is
an ap
prop
riate
struc
ture t
o pro
mote
enga
geme
nt in
comm
unitie
s?
14
6 (9%
) 64
(91%
)
(a)
Aske
d only
of G
BMs.
(b)
Aske
d only
of no
n-GB
Ms.
Sour
ce: T
he A
llen C
onsu
lting G
roup
, 201
1.

Coordination and engagement
138 Northern Territory Emergency Response: Evaluation Report 2011
Clear messages
GBMs and non-GBMs were relatively consistent in their responses that engagement approaches ‘never’ (49%) provided communities with clear information or did so only ‘some of the time’ (40%). In addition, GBM and non-GBM respondents were largely consistent in their views that interpreters were ‘never’ (36%) used when and where required or were only used ‘some of the time’ (44%).
These results indicate a need for clear information to be provided to communities and for greater use of interpreters.
Feedback loops
Survey respondents indicated that IEOs are able to play a positive role in sharing messages with community members about government initiatives (‘always’, 30%; ‘in most cases’, 28%). A question only for non-GBMs captured the view that there remains greater potential for GBMs to keep the community informed about community visits; responses indicated that GBMs ‘never’ do this (44%) or only do this ‘some of the time’ (38%). A question for GBMs regarding the effectiveness of the VON system in helping to coordinate community visits found a diversity of views. Some considered that that VON was ‘never’ effective (23%) or effective ‘some of the time’ (37%), while some felt that VON was effective ‘most of the time’ (33%). This may reflect different GBM approaches to the use of the VON tool.
Leadership development
Non-GBMs were less positive about progress in relation to improving local leadership and governance capability in communities to support better engagement. Non-GBM survey respondents indicated that leadership and governance capability has ‘never’ been developed to support better engagement between government agencies and the community (49%), or has been developed ‘some of the time’ (47%). In some contrast, responses from GBMs indicated that leadership development had ‘never’ been developed (23%), had been developed ‘some of the time’ (50%), ‘most of the time’ (17%) or ‘always’ (10%).
Similarly, GBMs were asked how involved communities were in their own management. Responses indicated that communities were ‘not involved’ (23%), ‘a little involved’ (46%) or ‘mostly involved’ (31%). These results indicate greater potential for involvement in future.
Continuous improvement
Although continuous improvement was not tested through the survey, informant interviews and community visits indicated that the effectiveness of engagement approaches had been improved by increasing the accessibility of the Commonwealth Ombudsman to provide communities with improved opportunities to raise issues about engagement processes and other matters affecting them.309 In addition, continuous improvement and transparency were supported through the independent monitoring of major community consultation processes by independent evaluators (the Cultural and Indigenous Research Centre Australia—CIRCA) during the NTER.310
Respondent suggestions for improving engagement approaches included:
• retaining staff in communities for longer periods to build trust and rapport with community members
309 NTER Review Board, Northern Territory Emergency Response: Report of the NTER Review Board, NTER Review Board, Canberra, 2008, p. 43. 310 CIRCA, Report on the NTER redesign engagement strategy and implementation, 2009.

Coordination and engagement
Northern Territory Emergency Response: Evaluation Report 2011 139
• ensuring that consultations are undertaken as both an early and an ongoing part of the policy formulation process
• minimising fly-in, fly-out consultations
• being flexible about timeframes for consultation by providing adequate notice prior to meetings and sufficient time during discussions
• continuing the IEO initiative to build stronger community linkages
• engaging through existing structures and using resources already available in communities.
Engagement approaches during the initial phase of the NTER have been criticised by many reviewers and community members. For example, the NTER Review Board noted that the emergency response ‘diminished its own effectiveness through its failure to engage constructively with the Aboriginal people it was intended to help’.311 Further criticisms related to the ‘lack of initial consultation, the blanket approach to measures, the embarrassment caused by the introduction of income management, the requirement to use the BasicsCard, and the road signs notifying the alcohol and pornography restrictions’.312
The Australian and Northern Territory governments have increased their emphasis on re-engaging with Indigenous communities following their acceptance of the NTER Review Board’s recommendations that ‘governments acknowledge the requirement to reset their relationship with Aboriginal people based on genuine consultation, engagement and partnership’.313
Policy coordination The key evaluation question addressed here is: how well have governments worked to make intersectoral policy and planning decisions?
While the early stages of the NTER focused strongly on coordinating the logistics and delivery of programs, more recently significant effort has been applied to establishing closer involvement between government agencies and communities, including in policy planning.
The 2009 NTER redesign process is an example of governments’ commitment to reset the relationship with Indigenous people based on genuine consultation, engagement and partnership.314 It was designed to gather input from various stakeholders at the community and service delivery levels about NTER directions, including legal arrangements regarding the suspension of the Racial Discrimination Act 1975 and policy directions for income management. Informants largely considered the four-tiered redesign structure and extensive reach of consultations to be appropriate and successful. For example, an independent evaluation found the Tier 2 consultations in communities to be ‘fair and open’.315
Notwithstanding this, there was some level of dissatisfaction with the nature of consultations that took place.316 Criticism included a perception that government had already made decisions about how the NTER was to be redesigned prior to the consultation process, and that the consultations were used as a forum to gather community input as to how those
311 NTER Review Board, op. cit., p. 10. 312 FaHCSIA, Report on Northern Territory Emergency Response Redesign Consultations, Canberra, 2009, p. 8. 313 NTER Review Board, op. cit., p. 12. 314 FaHCSIA, Future directions for the Northern Territory Emergency Response: Discussion paper, Canberra, 2009, p. 3. 315 CIRCA, op. cit. 316 A. Nicholson, L. Behrendt, A. Vivian, N. Watson & M. Harris, Will they be heard? A response to the NTER consultations, June to August 2009, Jumbunna Indigenous House of Learning, 2009, p. 9.

Coordination and engagement
140 Northern Territory Emergency Response: Evaluation Report 2011
decisions could be implemented.317 This emphasises the need for the rationale and purpose of consultation processes to be clearly communicated.
In relation to policy planning processes in communities, strong feedback was received from service providers that community-level engagement processes need to acknowledge the slower pace in communities and be designed with such cultural differences in mind. This is true of timeframes for both planning and conducting community meetings. In many cases, communities do not consider that they have been provided with sufficient lead time to arrange their attendance or to absorb information prior to the community meetings. The independent review of the NTER redesign process noted the need ‘to provide sufficient time during consultations to explain and discuss various initiatives in sufficient depth’.318
Another factor impacting on the ability of agencies and communities to participate effectively in policy planning and development is that the overall policy framework for development in the Northern Territory is not well understood. Specific NTER funded measures appear to be competing with a number of other policy programs, many of which are being delivered by single agencies or by non-government agencies under separate contracts. An Australian Government report on expenditure on Indigenous programs found that, at a national level, ‘the current set of Indigenous-specific programs across the Commonwealth is unduly complex and confusing’.319
The relationship between policy planning and implementation is also an important consideration. Local-level plans support the coordinated implementation of policy by fostering agreement between community members, service providers and governments. At this stage, only a few communities are developing local-level plans that link high-level objectives with local actions. Informants regularly cited the Groote Eylandt Regional Partnership Agreement (RPA) and the Tanami RPA as key mechanisms that supported coordinated service delivery of policy priorities agreed by community leaders at the local level.
Service coordination The key evaluation question addressed here is: how well has the Australian Government worked within itself and with other governments and service delivery bodies?
Service coordination has received significant attention throughout the NTER, specifically through establishment of the Operations Centre and GBMs, the development of stronger relationships between agencies, and more recently through greater involvement of ICCs. The ROC based in Darwin, introduced as part of the RSD National Partnerships Agreement, has also had a bearing on service coordination in RSD communities. Each of these is discussed in more detail below.
Operations Centre
The NTER Operations Centre was established at the beginning of the NTER to coordinate and drive the planning, design and logistical rollout of various NTER measures during the ‘stabilisation’ phase. The Operations Centre established a structure for cross-agency communication and decision-making, drawing together staff from various Australian government agencies. The Operations Centre was in place between June 2007 and December 2009, after which responsibility for coordination of NTER activities reverted to FaHCSIA, operating as lead agency, through its Northern Territory office.
317 ibid., p. 10. 318 CIRCA, op. cit. 319 Department of Finance and Deregulation, Strategic review of Indigenous expenditure, Canberra, 2010, p. 11.

Coordination and engagement
Northern Territory Emergency Response: Evaluation Report 2011 141
The Operations Centre was generally considered to be highly effective in coordinating the rapid rollout of a large number of initiatives by multiple government agencies. It was considered particularly effective in breaking down ‘silo’ arrangements that often limit the ability for seamless service delivery. The location of the Operations Centre in the Northern Territory, together with the co-location of leaders from relevant agencies, is credited with achieving a more relevant ‘on the ground’ focus in decision-making and the rollout of NTER measures. The report of the NTER Review Board noted that the Operations Centre had been ‘a very effective mechanism for cutting through the many logistical and administrative impediments associated with the roll-out of the major programs’.320
Although the Operations Centre did apply resources directly and quickly, community engagement activities did not always occur on the terms, or at a pace, appropriate to different communities. Indeed, the consistent feedback was that the Operations Centre achieved the rollout of initiatives despite communities not being adequately consulted, nor clear, about why many of the NTER initiatives were selected.
It was widely acknowledged that the intense early focus and cross-agency support required for activities of the Operations Centre were not sustainable in the longer term and that program and service delivery needed to be migrated towards the responsible agencies and departments.
While such normalisation provided increased opportunities for agencies to focus more closely on services for which they were primarily responsible, there was consistent feedback that it also reduced the level of interagency service coordination. Indeed, a number of informants suggested that the transition of coordination responsibilities from the Operations Centre to FaHCSIA and the ‘mainstreaming’ of programs was premature, ahead of the necessary coordination structures being put in place. Moreover, the lack of an effective structure at all levels (local, regional, territory, national) has reduced the ability of agencies to coordinate effectively and has led to further ‘silo’ approaches to implementation and delivery. The request from these informants was to ‘re-introduce some, but not too much, of the initial urgency and focus’ on coordination between agencies that was present while the Operations Centre was in place.
Government Business Managers
At the local level, GBMs are perhaps the single most visible coordination initiative. The GBM role is intended to coordinate Australian Government work with communities to ensure the effective whole-of-government delivery of services; work with government-funded service providers and local governments; manage and coordinate the day-to-day activities of staff from different Australian Government agencies; manage visits to the communities; and provide feedback to Australian Government agencies about the progress of the emergency measures, government-funded services and issues impacting on the community.321 Where required, GBMs also refer issues that cannot be resolved locally to higher levels. They provide a valuable ground-level resource for governments to coordinate local visits and activities, which was not present prior to the NTER.
The Australian National Audit Office’s 2010 performance audit, Government business managers in Aboriginal communities under the NTER (the GBM audit) identified that there are insufficient baseline performance data available to support an assessment of the extent to which the GBM initiative has contributed to improvements in community engagement and
320 NTER Review Board, op. cit., p. 40. 321 FaHCSIA, Submission of background material to the NTER Review Board, FaHCSIA, Canberra, 2008, pp. 78–80.

Coordination and engagement
142 Northern Territory Emergency Response: Evaluation Report 2011
whole-of-government coordination in the Northern Territory.322 Notwithstanding this, the GBM audit also concluded that the engagement and reporting model that connects the issues of a single community to multiple agencies in the Australian Public Service through the GBM is appropriate.323 This is supported by feedback from the survey, informant interviews and community visits conducted as part of this assessment. All indicated a high level of support for the GBM initiative overall in supporting coordination activities in communities. Specifically, 94 per cent of GBMs and 65 per cent of non-GBMs surveyed thought that the GBM model was an appropriate structure to coordinate services in communities.
In many communities, GBMs have established regular meetings of service providers to discuss and coordinate community-based activities. Community visits found that service providers and GBMs find these forums valuable for communicating information, coordinating services, avoiding service duplication, and discussing community needs. In some locations, community members also attend service provider meetings, which are also used to authorise activities with senior community representatives. The nature and frequency of stakeholder meetings varied among the communities visited: some had not held meetings for several months.
Many informants stated that there is a large variation in the effectiveness of GBMs. Some GBMs are viewed as vital to the day-to-day operation and capacity development in communities, but others are considered to have little discernible impact. Factors leading to the variable performance were considered by informants and in survey open-text responses to relate primarily to differences in GBMs’ attitudes and skill levels.
Specific challenges were also noted by informants in respect of the role of GBMs in the areas of recruitment, role clarity and monitoring. Clearer role definition and more careful selection and matching of GBMs are required, together with more active mentoring and coaching support. Greater oversight and more active performance monitoring of GBM activities in communities are also considered by informants to be important to help identify and address performance issues.
Through surveys, GBMs were asked to identify the skills and knowledge considered essential to be an effective GBM. Responses indicated four key areas:
• advanced communication skills, with a particular emphasis on listening and building relationships
• cultural awareness about how to work effectively with Indigenous people
• knowledge of government and relevant policies
• administrative and management skills.
Many informants and service delivery staff in communities viewed GBMs essentially as working narrowly to meet the needs of FaHCSIA rather than all Australian Government agencies, as originally intended. Some staff saw GBMs as ‘reporting on’ rather than ‘working with’ other agencies. Service providers in communities noted that GBM reports were not widely shared across the community, although some issues were discussed in person. It was considered that more open circulation of GBM reports to service providers at the community level would help promote greater transparency and foster constructive working relationships,
322 Australian National Audit Office (ANAO), Government business managers in Aboriginal communities under the Northern Territory Emergency Response, audit report No. 18, Canberra, 2010, p. 76. 323 ibid., p. 52.

Coordination and engagement
Northern Territory Emergency Response: Evaluation Report 2011 143
and that this could enable some issues to be addressed locally without the need to refer to other levels.
Some informants and survey respondents noted that GBMs do not have sufficient authority to influence activities of other service providers operating in communities. This has been a longstanding issue, identified in the NTER Review Board report and through the GBM Audit. The audit notes the continuing frustrations of GBMs ‘with some agencies’ apparent unwillingness or inability to work under their guidance or direction or, in some cases, to simply keep [them] informed about their activities’.324,325
Community visits also raised issues regarding coordination between the activities of GBMs and local shires. There had been little communication between GBMs and local government staff in some locations. Strengthening these relationships was considered important, particularly given the link between shires and leadership structures in many communities.
In relation to the effectiveness of GBMs in achieving community engagement, the survey identified that GBMs had been largely ineffective (52% answered ‘never’ and 41% answered ‘some of the time’). Many informants noted that the engagement role of the GBM would be more effective if it had a greater focus on capacity building at the community level. This was acknowledged in the NTER Review Board report, which recommended that the GBM’s title be changed to ‘community development manager’.326 The Australian Government response to this recommendation was that ‘the primary role of GBMs in individual communities is to coordinate whole-of-government activity and this should be reflected in their name’.327
Irrespective of whether the most appropriate mechanism is through the GBM or another model, the strong feedback from the review is that supporting community development requires consideration in future. An effective community development model was considered by many informants to be essential to progress community-level leadership and capacity development and, in time, to help community members generate the skills required for local self-determination.
Interagency relationships
The characteristics of good coordination discussed above emphasise the importance of effective interagency working arrangements. Agencies must share a commitment to agreed policy directions, understand the roles and responsibilities of other agencies involved in service delivery, and communicate and share information openly for mutual benefit.
Informants noted specific examples of effective interagency coordination associated with the NTER, such as FaHCSIA and Centrelink working closely to develop policy and roll out income management, including the licensing of community stores. Informants noted that information and observations drawn from Centrelink staff at the community level were shared openly and used to refine policy directions. Law and order programs, including policing, were also noted through informant interviews as working effectively with other agencies.
In some contrast to this, the government and service provider survey responses (see the appendix to this chapter) suggested that income management and community safety were less well coordinated than child health checks, child protection and school nutrition. In the case of income management, the apparent difference may reflect the difficulties associated
324 NTER Review Board, op. cit., p. 86. 325 ANAO, op. cit., p. 85. 326 NTER Review Board, op. cit., p. 45. 327 Australian and Northern Territory governments, Australian Government and Northern Territory Government response to the report of the NTER Review Board: Table of recommendations, 2009.

Coordination and engagement
144 Northern Territory Emergency Response: Evaluation Report 2011
with rolling out the program or, as one evaluation noted, that perceptions of income management are largely linked with perceptions of the NTER overall.328 The difference between informant views and survey results highlights an area that may require further research.
A survey of GBMs commissioned by FaHCSIA in 2008 and repeated in 2009 indicates that interagency collaboration in communities was ‘effective’ (51%), ‘neutral’ (15%) or ‘ineffective’ (30%), with the remainder answering ‘unsure’ (3%).329 Somewhat different results were obtained from the government and service provider survey as part of this assessment, which reflected GBMs’ views that government agencies worked well together in communities ‘never’ (39%) or only ‘some of the time’ (42%). Further investigation is required to reconcile these results, but they may suggest that the level of interagency collaboration in communities has diminished since the 2009 GBM survey, at least for the survey sample.
Some reviews conclude that the persistence of coordination difficulties is more a reflection of the scale and complexity of the task than of inadequacies in governance.330 However, as the survey results indicate, further improvement is required to improve overall cross-agency coordination. With the initial intensive coordination associated with the Operations Centre no longer present, consideration should be given to strengthening formal arrangements for coordination between agencies at all levels, including ensuring appropriate levels of delegation for decision-making across agencies.331
Regional Operations Centre
The National Partnership Agreement on Remote Service Delivery (NPARSD), signed in January 2009, committed governments to work with community members to improve community capacity and service delivery outcomes. The broad objectives of the NPARSD are to:
• improve the access of Indigenous families to a full range of suitable and culturally inclusive services
• raise the standard and range of services delivered to Indigenous families to be broadly consistent with those provided to other Australians in similarly sized and located communities
• improve the level of governance and leadership within Indigenous communities and Indigenous community organisations
• provide simpler access and better coordinated government services for Indigenous people in identified communities
• increase economic and social participation wherever possible
• promote personal responsibility, engagement and behaviours consistent with positive social norms.332
Fifteen Northern Territory communities were identified as RSD communities, receiving additional and accelerated investments.
328 Australian Institute of Health and Welfare, Evaluation of income management in the Northern Territory, occasional paper no. 34, 2010, pp. 36–37. 329 K. Snow & S. Eichhorn, 2009 survey of government business managers, TNS Social Research for FaHCISA, 2010, p. 42. 330 Department of Finance and Deregulation, op. cit., p. 298. 331 ibid., p. 288. 332 COAG, National Partnership on Remote Service Delivery, COAG, Canberra, pp. 5–6.

Coordination and engagement
Northern Territory Emergency Response: Evaluation Report 2011 145
The NPARSD introduced the Darwin ROC as a co-located structure for Australian and Northern Territory government staff to work together to provide services to RSD communities. The ROC had responsibility for overseeing the development of LIPs.
The ROC is considered by informants to have been effective as a coordination mechanism bringing Australian and Northern Territory government staff together to support community development. The ROC structure is seen as reducing the levels of program duplication and providing greater support to RSD communities. The ROC, in tandem with GBMs and IEOs, may help to identify and address service implementation challenges across governments.333
The additional funding and resources available through the RSD model were identified by informants as having positive effects at the local level in RSD communities. There is, however, increasing awareness in the non-RSD communities that they are not receiving similar levels of service. One of the important questions to address is how the level of services being provided in RSD communities can be extended to other, smaller communities in a cost-effective way.
Informants also identified that relationships between the Australian and Northern Territory governments had improved during the NTER. This was considered to be largely a result of constructive working arrangements fostered through staff co-location at the ROC.
Indigenous Coordination Centres
Even though existing prior to the NTER as ‘one-stop’ locations for coordinating the funding and delivery of Indigenous services, ICCs had only a limited role during the early phases of the NTER.
Feedback from informants and some literature noted that this was a ‘missed opportunity’ to build on an existing and accepted cross-agency coordination structure.334 The involvement of ICCs has now been increased, and it is considered that they are performing an important role in assisting with the coordination of GBMs in both RSD and non-RSD communities, while supporting regional development activities.
Informants also observed that there should be greater sharing of information between GBMs reporting to the ROC in RSD communities and GBMs that report to ICCs in non-RSD communities.
Community impact The key evaluation question addressed here is: how have coordination and engagement impacted on the ground?
Specific initiatives aimed at improving community engagement and impacts include the introduction of IEOs, the development of local-level plans, and the increased use of interpreters, and use of the VON system. Each of these is discussed further below.
Indigenous Engagement Officers
IEOs were first introduced through the NTER in 2008–09. IEOs are funded by FaHCSIA and work alongside GBMs in communities (there is current funding for 15 IEOs for RSD communities and 15 for non-RSD communities). The IEO role seeks to help communities
333 Coordinator General for Remote Indigenous Services (CGRIS), Six monthly report: September 2010 – March 2011, CGRIS, Canberra, 2011, p. 120. 334 Department of Finance and Deregulation, op. cit., p. 288.

Coordination and engagement
146 Northern Territory Emergency Response: Evaluation Report 2011
better engage in government planning and decision-making activities; inform community members about government initiatives; reflect community views to government regarding the impact of policies and programs; and help GBMs and other government staff to better understand the impact of government measures on the communities they serve.335 IEOs are often members of the community in which they work or, if not, are accepted by the communities they serve.
IEOs are considered to be a successful NTER initiative for facilitating improved engagement between government and communities. An overwhelming majority (91%) of government and service provider survey respondents indicated that the IEO role is appropriate for promoting engagement with communities.
IEOs are considered to be most effective when they form strong collaborative partnerships with a supportive GBM. Informants highlighted that IEOs play a key role in assisting GBMs and other government employees to engage appropriately with communities. It is also recognised that IEOs facilitate key feedback loops with community members for discussion about government policies.336 Many informants (including IEOs) expressed a desire to expand the number and reach of IEOs across the Northern Territory, and to establish career pathways for IEOs, potentially to transition into GBM roles in communities.
Challenges associated with the IEO initiative centre primarily on recruitment and retention. It has been difficult to recruit IEOs with the requisite skills, particularly in literacy and numeracy. While those skills are valuable, the primary requirement of IEOs is the knowledge, authority and connections with communities they bring to help communicate government messages.
In relation to retention, some current IEOs have experienced significant pressures associated with balancing their professional and cultural obligations. These mainly arise where they are required to communicate difficult messages to family or close community members amongst whom they live. This, combined with a large workload, can lead to ‘burn out’ among IEOs.
Telephone surveys with IEOs, conducted as part of this review, identified their desire for a program of training to continue to build capacity to lead community engagement activities and in order to better understand how government works. Telephone surveys also identified difficulties faced by IEOs in engaging with community members of the opposite gender.
Informant and survey responses identified other opportunities to improve the effectiveness of the IEO role, including careful monitoring of workload to avoid ‘burn-out’; regular support from interpreters during community consultation and engagement processes to enable IEOs to focus on liaison rather than translation; clearer guidance regarding expectations of IEOs; and the ability for IEOs to continue reporting through, and regularly share information with, GBMs.
Local implementation plans
LIPs are considered to be the key local coordination mechanism in RSD communities.337 LIPs were introduced in 2010 as part of the NPARSD and are developed collaboratively between communities, governments and service providers. LIPs formalise and document local-level strategies that are tied to the Closing the Gap building blocks.
LIPs were considered by many informants to be a positive coordination, planning and engagement mechanism drawing service providers and communities closer together.
335 FaHCSIA, Indigenous Engagement Officer, Available at: <http://www.fahcsia.gov.au/careers/vacancies/Pages/aps4_ntso.aspx>. 336 ANAO, op. cit., p. 72. 337 CGRIS, Six monthly report: September 2010 – March 2011, op. cit., pp. 15–16.

Coordination and engagement
Northern Territory Emergency Response: Evaluation Report 2011 147
However, some LIPs are not considered to be tailored to individual communities.338 The Coordinator General noted that the next steps are to enhance LIPs by defining actions more precisely, establishing deadlines for delivery and adding greater clarity about the desired outcomes and performance measures.339 The Northern Territory ROC has agreed that a LIP refresh will occur as a matter of priority in Northern Territory RSD communities.
Non-RSD communities generally do not have such local plans in place. This was highlighted as an issue which impacts on the effectiveness of GBMs in the GBM audit: ‘in the absence of a plan developed by agencies and reflecting community priorities, GBMs’ coordination activities are largely ad hoc and reactive’.340
Aboriginal Interpreter Service
The NT AIS provides interpreters on a fee-for-service basis to support engagement and communication with communities. While the NT AIS existed prior to the NTER, the service was allocated additional NTER funding to improve relationships between governments and communities through facilitating open communication. The service currently has interpreters for 105 Indigenous languages, including 15 core languages.341 Interpreters are usually local community members who have undertaken some interpreter training.
Informants consistently emphasised the importance of using interpreters in facilitating accurate and effective communication between government and communities. They noted that interpreters are essential to support clear communication by assisting government agencies to tailor communication documentation to specific Indigenous communities. It was suggested that GBMs have a greater role to play in ensuring that interpreters are adequately briefed on the topics, policies or programs to be discussed with communities.
As discussed above, the survey results regarding interpreters reinforced findings from a recent Commonwealth Ombudsman review that interpreters were not used as often as they should be for engagement activities in communities.342 This also accords with feedback from informant interviews and community visits, although those did note that the availability and use of the NT AIS had improved, not only for community meetings but also in the development and presentation of policy and other information materials.
Although interpreters were not used sufficiently or effectively in the early stages of the NTER, and some informants identified that interpreters may have been reluctant to be seen supporting certain NTER initiatives, their use and effectiveness are considered to have increased over time. Informants noted that interpreters had increased both in number and coverage through the NTER, but that further recognition by government agencies and other stakeholders of the need for and value of interpreters is required.
Visiting Officer Notification system
The VON system was established early in the NTER as a register of visits to NTER communities by Australian Government staff members. Notifications of visits registered through the VON system are provided to GBMs to help them prepare accommodation and other arrangements for visits to the community. VON is compulsory for Australian
338 CGRIS, Six monthly report: December 2009 – August 2010, CGRIS, Canberra, 2010, p. 63. 339 CGRIS, Six monthly report: September 2010 – March 2011, op. cit., pp. 17–18. 340 ANAO, op. cit., p. 81. 341 Attorney-General’s Department, Aboriginal Interpreter Service, Available at: <http://www.ag.gov.au/www/agd/agd.nsf/Page/Indigenouslawandnativetitle_Indigenouslawprograms_AboriginalInterpreterService(AIS)>. 342 Commonwealth Ombudsman, Talking in Language: Indigenous language interpreters and government communication, Canberra, 2009, p. 19.

Coordination and engagement
148 Northern Territory Emergency Response: Evaluation Report 2011
Government staff members, but not for Northern Territory Government staff members or other service providers.
The GBM audit outlined that approximately 16,000 VON requests were processed from the start of the NTER until May 2010, representing at least 200 visits per NTER community. That number is unlikely to include many NGO and other unregistered government agency visits.343
The NTER Review Board report identified in 2008 that ‘communities continue to struggle under an ever increasing demand for meetings with unfamiliar faces representing government and NGO providers.’344 Community visits identified that community members continue to feel overconsulted about services in their communities. Informants identified many instances where engagement activities with communities could be combined and rationalised, rather than held as separate forums.
While the VON system is generally considered by informants to be a positive initiative, it is used predominantly as an accommodation booking system. Informants and surveys suggested that the VON system could be used more effectively and strategically as a tool for GBMs to coordinate community visits. GBMs could draw together agencies with similar or related objectives to minimise the engagement burden in communities. For that to occur, however, the levels of VON compliance need to be improved, as do GBM levels of authority in directing activities of other agencies.
Staff retention
Continuity of staff can have a significant impact on the effectiveness of coordination and engagement, which often depend on sustained informal and interpersonal relationships, particularly at the community level. Frequent changes in staff can limit the levels of trust and rapport able to be built between government, service providers and communities.
There are many challenges associated with attracting and retaining staff in remote communities. Community visits highlighted instances where staff vacancies have led to significant gaps in service delivery. In one case, staff vacancies resulted in the suspension of senior school classes until such time as another teacher could be attracted to the community. The 2011 service provider survey by FaHCSIA was not able to conclude whether staff retention is better now than three years ago in remote communities: almost equal numbers of responses indicated positive and negative changes.345
High rates of GBM turnover were particularly singled out as impacting on communities. Data on FaHCSIA’s northern communities indicated that those communities have experienced a new GBM approximately every 1.2 years since the start of the NTER.346 This is consistent with findings from the GBM audit.347 This is in part the result of the one-year contract duration initially offered to GBMs, the intent being to rotate GBMs regularly to help them maintain an independence and objectivity when dealing with communities. Greater contract flexibility has been provided recently to support GBMs to remain in communities for longer periods. Although higher than normal staff turnover is expected in remote locations, the need remains to identify ways to promote better retention levels.
343 ANAO, op. cit., p. 83. 344 NTER Review Board, op. cit., p. 44. 345 J. Putt, S. Middleton, J. Yamaguchi & K. Turner., op. cit., p. 54. 346 FaHCSIA, ‘GBM north turnover data’, unpublished data via email, July 2011. 347 ANAO, op. cit., p. 69.

Coordination and engagement
Northern Territory Emergency Response: Evaluation Report 2011 149
Building community capacity The key evaluation question addressed here is: how have governments worked with communities to increase their capacity for and role in community development? This question acknowledges the assistance and support required by communities to build their capacity to lead and sustain change in the longer term.
The United Kingdom’s Community Development Exchange defines ‘community development’ as ‘a long-term value based process which aims to address imbalances in power and bring about change founded on social justice, equality and inclusion’.348 According to the Community Development Exchange, it involves changing the relationships between ordinary people and people in positions of power, so that everyone can take part in the issues that affect their lives.
For this evaluation, ‘community development’ refers to supporting community members through building skills and knowledge to a point where they are able to lead and manage their own affairs. Community development is an aim of many programs and activities delivered across the Northern Territory. The design of coordination and engagement activities can play an important role in assisting Indigenous people to participate in local management and decision-making.
As discussed above, survey results indicated limited involvement by communities in their own management. Leadership is considered a critical part of community development. As stated by the Coordinator General for Remote Indigenous Services, ‘leadership from Indigenous community members and organisations and from all levels of government is a necessary precondition for closing the gap.’349
Prior to the NTER, community councils provided local leadership forums for community members to influence matters affecting their areas. Through the Northern Territory Government’s shire reform process in mid-2008, community councils were replaced by broader representative arrangements. While this was separate to the NTER, its impact on local community leadership capacity development is often associated with the NTER.
Efforts have since been made to re-establish local representative boards to provide opportunities for local community leadership in many communities. As noted by the Coordinator General for Remote Indigenous Services in November 2009 in relation to local area boards in RSD communities, ‘their success, however, is mixed at best, with some functioning ineffectively or yet to be established. This has left a community governance vacuum in some cases.’350 The third report from the Coordinator General in March 2011 noted that 13 of 15 local area boards were in place in RSD communities, and that there were also a range of other governance entities providing opportunities for community leadership, such as through school councils, health boards and community safety committees.351
Community visits identified that where local leadership boards have been introduced as part of the new local shire arrangements, they play a limited role in steering cross-community development. Given their link to local shires, they primarily advise and influence local shire activities rather than other agencies involved in community development. As a consequence, they are limited in their scope as broader community leadership forums.
348 Community Development Exchange, ‘What is community development?’ Available at: <http://www.cdx.org.uk/community-development/defining-community-development>. 349 CGRIS, Six monthly report: July2009 – November 2009, CGRIS, 2009, p. 6. 350 ibid., p. 98. 351 CGRIS, Six monthly report: September 2010 – March 2011, op. cit., p. 113.

Coordination and engagement
150 Northern Territory Emergency Response: Evaluation Report 2011
The Indigenous Leadership Program (ILP) has been set up by FaHCSIA to build local leadership in Indigenous communities and facilitate improved interaction between government and communities. The ILP has provided a mechanism for selected community members to develop their leadership skills and capabilities. Many IEOs participated in ILP prior to their selection, and all IEOs have been able to access training through the ILP once employed through FaHCSIA.
ILP participants have played an important role in supporting community engagement activities, particularly during the early phases of the NTER. For example, in 2007, 300 past and current ILP participants were invited to participate in engagement workshops as an early part of the NTER’s coordination measure.352 These briefings aimed to increase acceptance and understanding of NTER initiatives. In July 2008, ILP participants prepared a brief for consideration by the NTER Operations Centre leadership outlining how to improve community engagement activities. In 2009, ILP participants played a role in supporting the NTER redesign process.
Community visits identified that many service providers were concerned at the lack of development of leadership skills by young people in communities. One issue identified was that many secondary school aged students ceased attending classes after achieving initiation into adulthood, impacting on their continued skills development. These young people felt too old to participate in youth programs, but too young to engage in formal work programs, such as the Community Development Employment Projects program, leading to boredom and social isolation. Gaps in appropriate programs for this age bracket were considered as having a longer term impact on the development of community leadership capacity.
Conclusions This section brings together the findings to provide an overall assessment of the extent to which governments and service delivery organisations have worked collaboratively with communities in pursuing NTER outcomes.
The key evaluation question addressed here is: has joined-up delivery occurred and has it enhanced the achievement of outcomes?
Summary of findings The evidence gathered and examined as part of this review indicates that coordination and engagement activities are critical enablers of the NTER measures.
While it has not been possible to isolate the specific contribution of coordination and engagement measures to the achievement of outcomes as outlined in the other chapters of this report, there are positive signs that coordination and engagement activities have, in some areas, improved over time throughout the NTER.
But for many of the steps forward, there have also been challenges. Some have arisen from the inherent difficulty in tailoring services to settings that are as remote and diverse as in the Northern Territory. Others reflect the high degree of coordination and control required at all levels, while at the same time increasing engagement and community involvement in decision-making.
352 FaHCSIA, Submission of background material to the NTER Review Board, op. cit., p. 36.

Coordination and engagement
Northern Territory Emergency Response: Evaluation Report 2011 151
One of the most significant initiatives has been the introduction GBMs, which for many communities has provided a focal point for the coordination of Australian Government activities and a valuable on-ground feedback loop to better inform policy planning and development.
While the GBM role is widely supported, there are high levels of criticism in relation to variations in the effectiveness of individual GBMs. There is also a view that there should be a greater focus on community development, irrespective of whether the GBM or another model is most appropriate.
The VON system has provided an important tool for planning the logistics of community visits, particularly accommodation, which is in high demand in many remote communities. However, as with GBMs, the VON system is not considered to be used to its fullest potential as it focuses primarily on administration rather than the proactive coordination of agency and provider visits to communities.
A key engagement initiative has been the introduction of IEOs, who have supported GBMs in achieving greater levels of engagement with, and understanding of, community needs. There is strong community support for the work of IEOs in assisting government agencies with engagement and policy development activities. Further growth of the IEO program to provide broader coverage across the Northern Territory will rely on the ability to recruit, train and manage skilled community members. The IEO role is also a challenging one, requiring IEOs to balance cultural and professional obligations.
While not directly introduced as part of the NTER, recent moves to a more regionalised model have created a strong focal point for coordinating the activities of the Australian and Northern Territory governments. Examples include the establishment of RSD communities, which are supported by the Northern Territory ROC, with responsibility for overseeing LIPs, and the increased role of ICCs to complement the coordination activities of the FaHCSIA northern and southern regional centres.
Despite the coordination framework established in RSD communities, there are issues in coordination between RSD and non-RSD communities, which have different operational and reporting structures in place. For example, GBM reports are not routinely shared between the ROC, which is responsible for RSD communities, and ICCs, which coordinate non-RSD communities. This can result in communication gaps and disjointed service planning and delivery across RSD and non-RSD communities.
Concerns are also being expressed about the equity of service delivery between RSD and non-RSD communities. It is not well understood by non-RSD community members whether they have any avenues to seek and access similar advanced levels of services in their own locations. Indeed, for many communities the distinction between RSD and non-RSD communities is not readily apparent; nor is the rationale for the selection of locations clear.
Many informants observed an increasing prevalence of issues in coordination and engagement resulting from the re-emergence of program and funding ‘silos’. Numerous examples were given where interagency issues identified at a local community level needed to be referred up to senior levels within the relevant departments, some to Canberra, before they could be resolved, rather than being addressed much closer to the community.
Indeed, a number of informants suggested that the transition of coordination responsibilities from the Operations Centre to FaHCSIA and the ‘mainstreaming’ of programs occurred too

Coordination and engagement
152 Northern Territory Emergency Response: Evaluation Report 2011
early, ahead of establishing the necessary coordination structure to enable an effective transition.
Moreover, in the last year of the NTER under the Closing the Gap National Partnership Agreement, there is a growing level of uncertainty about the future focus and funding of initiatives within Northern Territory remote communities. This is a critical time for current programs and has the potential to interrupt their progress, and places at risk the momentum already achieved and longer term goals being pursued.
Lessons and issues identified As the NTER nears the completion of its five-year program, it is an important time to reflect on how these findings can assist governments with the next phase of addressing the levels of disadvantage in the Northern Territory.
Communication of the policy framework
The NTER is generally associated with specific initiatives, such as child health checks, alcohol restrictions, income management, community stores and additional police presence. There is little awareness, however, of the broader and longer term policy directions and how they will jointly address the pressing issues facing remote Indigenous communities. The COAG building blocks define the overarching outcomes that programs in Indigenous communities are seeking to achieve, but there is limited understanding by service delivery staff and community members as to how those goals come together to achieve outcomes at the community level.
While the intensive central coordination of the initial NTER rollout has been replaced by more normalised departmental control of program delivery, this has tended to fragment the delivery of programs and initiatives—each with its own goals—thereby increasing the difficulty of coordinating the agency involvement required to achieve the intended outcomes.
Significantly, funding coordination is also decentralised: funding for communities flows from different tiers of government, program funding pools, grant programs and individual service delivery contracts. This can lead to efforts that are not effectively coordinated. It can also tie providers to performance indicators that may not link with consolidated community priorities or plans, which can impact on the alignment of effort by service providers towards the achievement of consistent goals that are generated and accepted by community members.
Consolidation of engagement processes
Community consultation and engagement are essential parts of planning and developing policy to meet community needs. While there has been positive feedback that there is now greater two-way consultation with governments, there is still strong criticism of the timeframes afforded for such consultation processes. Consultation activities are perceived as being scheduled with little notice and seen as working to ‘Canberra’ timeframes, which do not allow for communities to discuss ideas and solutions to problems at the pace and in the manner they are accustomed to. This tension arises largely from the need to meet government’s decision-making and budget timeframes.
Consultation activities are perceived as fragmented, working on a program-by-program basis rather than through coordinated discussions on interrelated policies and programs. This both increases the overall level of consultation burden on communities and reduces the effectiveness of consultation activities. In addition, many consultation processes are one-off,

Coordination and engagement
Northern Territory Emergency Response: Evaluation Report 2011 153
without feedback loops back to communities, so it is often unclear how results will be used to support broader policy frameworks.
Planning at the local level
LIPs have been introduced in RSD communities to tie high-level policy objectives to service delivery activities within communities. LIPs have provided a greater focus for community members to work with governments and service providers. While still in their formative stages, LIPs are seen as a positive step in improving the coordination of service provision at the local level. They are also a mechanism to support good community engagement.
There is limited local-level planning, however, in non-RSD communities. As a result, they do not benefit from the same level of coordination and policy direction as provided by LIPs in RSD communities.
Coordination at all levels
The lack of adequate points of coordination at all levels—from policy design and planning at central levels and program management at regional levels down to service delivery at local community levels—means that there can be unnecessary referrals of issues and decisions from communities to regional and central levels, particularly where multiple agencies are involved.
The absence of a well-defined coordination structure tied to a community means that there is often insufficient representation, delegation or authorisation from relevant departments to be able to make program prioritisation and funding decisions that are consistent with overall policy parameters and tailored to the needs of the community.
Government Business Managers
While GBMs have provided critical logistical support within communities, there is strong feedback that the role of GBMs is not clearly understood. In particular, there are views that GBMs have not been sufficiently proactive in the coordination of other government agencies, or in supporting the development of community leadership and governance capabilities. It is acknowledged that this may require GBMs to have additional levels of authority and skills than at present, although there are examples where existing GBMs are already undertaking some aspects of those additional roles.
An existing mechanism that is not used to greatest effect by GBMs is the VON system. It is currently used predominantly to schedule accommodation for community visits, rather than to bring together separate visits that would be more effective if they were coordinated.
It is also not clear in communities whether the GBM role is intended to be permanent or whether GBMs should be working to develop community capacity—a role already being played by several GBMs. Some GBMs consider that their role could be handed over to community members in the future.
Indigenous Engagement Officers
IEOs, where present, are accepted as providing an essential link between government and communities, supporting coordination and information sharing about policy and programs. In particular, IEOs provide valuable support to GBMs and may provide a potential pathway for community members to move into GBM roles.
There is, however, insufficient coverage of communities by IEOs, in part due to the limited supply of suitable candidates. Appropriate skills training and support, particularly relating to

Coordination and engagement
154 Northern Territory Emergency Response: Evaluation Report 2011
government operating methods, is essential, and workloads need careful monitoring to ensure that IEO effectiveness is not impacted or compromised. Some IEOs called for a more appropriate balance of male and female IEOs to help them to engage more fully across communities.
Community leadership and capacity
As a result of shire reforms that dissolved pre-existing community representative structures, many communities are in the process of establishing new leadership and governance structures. Those structures vary widely both in their nature and in their levels of capability, and this has a significant impact on a community’s ability for self-representation and leadership, and therefore its ability to effectively engage with government and service providers. Moreover, where there are existing community strengths, they have not been adequately adopted into leadership and governance structures appropriate to each community.
The issues are interrelated While the section above identifies a number of specific issues that can be examined individually, those issues have many interdependencies and need to be considered as a whole. Figure 4.2 indicates how the individual areas are related, from policy communication through to the ultimate community development outcomes.
The role of well-constructed local plans is both critical and central, and brings together the issues identified above in relation to a clear understanding of the policy framework, appropriate consultation and coordination structures, and GBMs and IEOs with sufficient skills and authority to assist communities to develop the leadership and capabilities required to help achieve the long-term goals set out in the policy framework.

Coordination and engagement
Northern Territory Emergency Response: Evaluation Report 2011 155
Figure 4.2 Interrelationships between the key issues

Coordination and engagement
156 Northern Territory Emergency Response: Evaluation Report 2011
Bibliography ARTD Consultants & WestWood Spice, Development of program logic options for the NTER,
unpublished report prepared for FaHCSIA, 2010.
Attorney-General’s Department, Aboriginal Interpreter Service, Available at: <http://www.ag.gov.au/www/agd/agd.nsf/Page/Indigenouslawandnativetitle_Indigenouslawprograms_AboriginalInterpreterService(AIS)>
Australian and Northern Territory governments, Australian Government and Northern Territory Government response to the report of the NTER Review Board, 2009.
Australian Bureau of Statistics, Inform Northern Territory, Mar 2011, cat. no. 1308.7, ABS, Canberra, 2011.
Australian Institute of Health and Welfare, Evaluation of income management in the Northern Territory, occasional paper no. 34, 2010.
Australian National Audit Office, Government business managers in Aboriginal communities under the Northern Territory Emergency Response, Audit report no. 18, Canberra, 2010.
Australian Public Service Commission, Connecting government: Whole of government responses to Australia’s priority challenges, APSC, Canberra, 2004.
Bath, H, M Bamblett & R Roseby, Growing them stronger, together: Report of the Board of Inquiry into the Child Protection System in the Northern Territory 2010, Northern Territory Government, Darwin, 2010.
Bell, S & A Hindmoor, ‘The governance of public affairs’, Journal of Public Affairs, vol. 9, March 2009.
Blackman, D, F Buick, J Halligan, J O’Flynn & I Marsh, ‘Australian experiences with whole of government: constraints and paradoxes in practice’, IRSPM conference, University of Berne, 7–9 April 2010.
Commonwealth Ombudsman, Talking in Language: Indigenous language interpreters and government communication, Canberra, 2009.
Community Development Exchange, ‘What is community development?’ Available at: <http://www.cdx.org.uk/community-development/defining-community-development>.
Coordinator General for Remote Indigenous Services, Six monthly report: September 2010 – March 2011, CGRIS, Canberra, 2011.
Coordinator General for Remote Indigenous Services, Six monthly report: December 2009 – August 2010, CGRIS, Canberra, 2010.
Council of Australian Governments, Service delivery principles for programs and services for Indigenous Australians, COAG, Canberra, 2009.
Council of Australian Governments, National Partnership on Remote Service Delivery, Canberra, COAG, 2009.

Coordination and engagement
Northern Territory Emergency Response: Evaluation Report 2011 157
Cultural and Indigenous Research Centre Australia (CIRCA), Report on the NTER redesign engagement strategy and implementation, CIRCA, Sydney & Melbourne, 2009.
Department of Finance and Deregulation, Strategic review of Indigenous expenditure, Canberra, 2010.
Department of Premier and Cabinet, Collaboration: A Tasmanian Government approach, Department of Premier and Cabinet, Hobart, 2007.
Department of the Prime Minister and Cabinet, Ahead of the game: Blueprint for the reform of Australian Government administration, Canberra, Department of the Prime Minister and Cabinet, 2010.
FaHCSIA, Future directions for the Northern Territory Emergency Response: Discussion paper, Canberra, FaHCSIA, 2009.
FaHCSIA, Indigenous Engagement Officer, Available at: <http://www.fahcsia.gov.au/careers/vacancies/Pages/aps4_ntso.aspx>.
FaHCSIA, ‘Government business manager turnover data’, unpublished data via email, 2011.
FaHCSIA, Report on Northern Territory Emergency Response redesign consultations, FaHCSIA, Canberra, 2009.
FaHCSIA, Submission of background material to the NTER Review Board, FaHCSIA, Canberra, 2008.
Hunt, J, ‘The whole of government experiment in Indigenous affairs: A question of governance capacity’, Public Policy, vol. 2, no. 2, 2007.
International Association for Public Participation, IAP2 spectrum of public participation, 2007, Available at: <http://www.iap2.org/associations/4748/files/spectrum.pdf>.
K. Snow & S. Eichhorn, 2009 survey of government business managers, TNS Social Research for FaHCISA, 2010.
Majumdar, D, ‘Collaboration among government agencies with special reference to New Zealand: A literature review’, Social Policy Journal of New Zealand, issue 27, March 2006.
National Audit Office (UK), Joining up to improve public services, London, 2001.
Nicholson, A, L Behrendt, A Vivian, N Watson & M Harris, Will they be heard? A response to the NTER consultations, June to August 2009, Jumbunna Indigenous House of Learning, 2009.
NTER Review Board, Northern Territory Emergency Response: Report of the NTER Review Board, NTER Review Board for FaHCSIA, Canberra, 2008
NTER Review Board, Northern Territory Emergency Response: Report of the NTER Review Board, Canberra, 2008.
Organisation for Economic Co-operation and Development, Citizens as partners: Information, consultation and public participation in policy making, Paris, 2001.
Pollitt, C, ‘Joined-up government: A survey’, Political Studies Review, vol. 1, no. 1, 2003.

Coordination and engagement
158 Northern Territory Emergency Response: Evaluation Report 2011
Putt, J, S Middleton, J Yamaguchi & K Turner, Community safety: Results from the survey of service providers in the Northern Territory, FaHCSIA, Canberra, 2011.
Rowe, G & LJ Frewer, ‘A typology of public engagement mechanisms’, Science, Technology, & Human Values, vol. 30, no. 2, 2005.
Scottish Government, Public value and participation: A literature review for the Scottish Government, Scottish Government, 2008.
Sheedy, A, MP MacKinnon, S Pitre & J Watling, Handbook on citizen engagement: Beyond consultation, Canadian Policy Research Networks, 2008.
State Services Authority Victoria, Joined up government: A review of national and international experiences, working paper no. 1, Melbourne, 2007.

Promoting law and order
Northern Territory Emergency Response: Evaluation Report 2011 159
5 Promoting law and order
Australian Institute of Criminology
Key findings • Increased policing resources, including the establishment of a police presence in some
communities for the first time, and the enforcement of broad-ranging alcohol restrictions, have contributed to increases in recorded offence rates in Northern Territory Emergency Response (NTER) communities.
• Survey results suggest NTER community members are, overall, supportive of the increased policing resources and expanded night patrol services.
• While recorded crime has increased, survey results suggest that people in communities, particularly women, are feeling safer than they did before the NTER. Sizeable proportions of both community members and service providers report that their communities have become safer. Having a police presence in communities that received a Themis police station has given people the option of reporting offending behaviour in a way they were unable to previously, and it appears that community members are feeling safer in reporting and more willing to report.
• There are insufficient data and information available to determine whether pornography restrictions have been effective in reducing access to, or use of, pornographic materials in prescribed areas.
• The Substance Abuse Intelligence Desk (SAID) and Dog Operations Units (DOU) appear to be making a valuable contribution to law enforcement responses to alcohol and substance misuse in remote Indigenous communities.
This chapter discusses and reviews measures introduced through the NTER to promote law and order and build safer communities. The chapter begins by outlining the methodological approach adopted by the Australian Institute of Criminology (AIC) in conducting this review and the main information sources the AIC drew on.
The chapter then puts the law and order measures in the context of the high rates of violent and other crime, and associated high rates of victimisation, that are seen in some Indigenous communities and that have contributed to the overrepresentation of Indigenous Australians in the criminal justice system. These issues are well known to Indigenous people, and the information is not presented here to tell people something they already know, to focus on negativity or to direct blame. Nor is it intended to convey or perpetuate a view that all Indigenous Australians engage in offending and antisocial behaviour, or that all Indigenous communities have high crime rates. Rather, it is intended to establish a context for the community safety environment into which the NTER measures were introduced and a basis for better understanding the review evidence and conclusions that follow.
An examination is then presented of the community safety-related changes that have taken place across the NTER communities since the introduction of the NTER law and order measures, based on analysis of police and courts data and survey results, and how those changes relate to the suite of law and order measures. The third main element of the chapter is a closer examination of the individual law and order measures and the evidence for their

Promoting law and order
160 Northern Territory Emergency Response: Evaluation Report 2011
effectiveness or otherwise, based on criminal justice data, survey results, independent reviews and evaluations, and related literature.
Approach The review of law and order measures set out in this chapter relies on the following key data and information sources:
• data provided by Northern Territory (NT) Police covering policing incidents, and the offences arising from those incidents, for the period from 1 July 2004 to 31 December 2010 (the analysis of these data is detailed in Appendix 5, and elements of the analysis are included in this chapter)
• data provided by the NT Department of Justice covering court lodgements and outcomes for assault and sexual assault offences for the period from July 2005 to December 2010
• data produced through a survey undertaken by FaHCSIA for its Community Safety and Wellbeing Research Study (CSWRS), covering 1,343 community members in 16 NTER communities353
• a survey undertaken by the Department of Families, Housing, Community Services and Indigenous Affairs (FaHCSIA), covering 699 service providers working in towns and remote communities across the Northern Territory (the Community Safety Service Provider Survey (CSSPS))354
• a range of independent evaluations and reviews of individual NTER law and order measures
• literature on measures undertaken prior to the NTER but related to the NTER law and order measures, and other relevant literature identified through a literature search conducted by the AIC
• program logic developed for FaHCSIA for the NTER measures355
• regular monitoring reports on the measures, produced by FaHCSIA.
The AIC’s review was a limited ‘meta review’, involving a ‘desktop’ analysis of these data and information sources, in keeping with the terms of reference under which the AIC was engaged by FaHCSIA. The scope and timing of the review the AIC was engaged to undertake did not allow for independent evaluation of the NTER measures, fieldwork, consultations, surveys or other independent research aside from data analysis and interpretation. The AIC’s review was conducted with the approval of the AIC’s independent Human Research Ethics Committee. It is arguable whether independent evaluation and research would have been beneficial, given the range of interconnected measures involved and the extent of the work that has already been undertaken. However, an important factor to consider in drawing on previous studies is the limitations of each of those studies and the caveats noted by the authors in relation to the methodology and resulting data. The CSWRS and CSSPS studies conducted by FaHCSIA are detailed elsewhere in this report, and caveats relating to those studies should be applied to their use in this chapter.
353 G. Shaw and P. d’Abbs, Community Safety and Wellbeing Research Study consolidated report, Bowchung for FaHCISA, Canberra, 2011. 354 J. Putt, S. Middleton, J. Yamaguchi & K. Turner, Community safety: Results from the survey of service providers in the Northern Territory, FaHCSIA, Canberra, 2011. 355 ARTD Consultants & WestWood Spice, Development of program logic options for the NTER, unpublished report prepared for FaHCSIA, Canberra, 2010.

Promoting law and order
Northern Territory Emergency Response: Evaluation Report 2011 161
Through these data and information sources, the AIC sought to answer a number of questions about the law and order measures. Those questions were examined for the measures collectively and, to the extent that each question was applicable, individually. The key review questions were:
• How has the extent and type of offending in NTER communities and elsewhere in the Northern Territory changed since the introduction of the NTER?
• Were those changes the result of NTER law and order measures, and what have been the impacts of the individual measures?
• How have the measures contributed to the safety of people, particularly women and children, in NTER communities?
• Do NTER community members perceive themselves to be safer as a result of the NTER and, if so, how have the different law and order measures contributed to those perceptions?
As indicated, the review was informed by an NTER program logic analysis—an analysis that captures the theory of how policy and program measures will deliver outcomes. This logic placed the law and order measures under a broader ‘Creating safer communities’ theme.356 The program logic identified immediate outcomes for each of the individual measures, as well as a set of intermediate outcomes that applied across the law and order measures. The intermediate outcomes relevant to this review included:
• Incidents of violence deterred or better managed – fewer incidents – effective reporting and police response – incidents have less impact – perpetrators held accountable and deterred – youth diverted
• Community has protections for people at risk of violence – safe places and night patrols remove people from violence – people use and have confidence in protections – protections are sustainable
• Individuals have greater capacity for self-protection and healing – access and benefit from support services – individuals, young people diverted from justice system.
Taking the program logic into account, a number of key performance indicators were used in assessing the data and information available for this review:
• changes in police recorded incidents and offences, including decreases and increases in: – violent, property, public order and traffic offences – alcohol-related offences – NTER communities and elsewhere in the Northern Territory
• perceptions of changes to community safety: – for members of NTER communities overall – for women and children in NTER communities – in relation to specific social problems – attributed to NTER law and order measures
• community support for the NTER law and order measures.
356 ibid.

Promoting law and order
162 Northern Territory Emergency Response: Evaluation Report 2011
Within police data, an ‘incident’ refers to any occasion where police undertake a recorded activity that results from a report to police (such as when a victim contacts police), or is a police-initiated activity (such as when police observe antisocial behaviour while conducting a patrol, or police undertake a traffic operation). Some incidents will not result in offences, for instance when reported behaviour is not deemed to constitute an offence or when an incident is activity such as serving an order, while some may result in multiple offences being recorded. The analysis of police data in Appendix 5 distinguishes between incidents that do not result in offences, incidents that do result in offences, and the offences that arise from those incidents. While police record data on alleged offenders and victims (such as age, sex and Indigenous status), those data were not available for this analysis. The term ‘alcohol-related’ refers to specific incidents and/or offences considered by police to have involved the use of alcohol. For example, an assault offence will be recorded as alcohol-related when police consider that the consumption of alcohol contributed to the offence occurring.
Before moving to an examination of some of the changes to community safety that have occurred in the Northern Territory, it is important to note that there were a number of other Australian and Northern Territory government activities, initiatives and measures potentially influencing community safety outcomes in the period following the introduction of the NTER. Many of the other NTER measures, particularly family support measures such as safe houses, the Mobile Child Protection Team and income management, were, to a greater or lesser extent, targeted at improving the safety of women and children. While those measures will be examined in other parts of this report, their influence on the law and order measures should be borne in mind. Apart from the NTER, initiatives such as the Australian Government’s Petrol Sniffing Strategy, the introduction of mandatory reporting of domestic and family violence legislation by the NT Government and the NT Police’s violent crime reduction strategy may have influenced reported crime and offending rates, and community safety outcomes. There may also have been influences from other sources, such as changes within communities, families and individuals unrelated to any law and order measures, which may have impacted on law and order outcomes. Given the scale of the NTER measures and the proportion of the Territory’s Indigenous population they affected, those factors are less likely to be influential than may be the case when evaluating smaller and more localised policy or program measures.
Background
Indigenous Australians are heavily overrepresented in the criminal justice system, both as offenders and as victims. The available data indicate that Indigenous people are 15 to 20 times more likely than non-Indigenous Australians to be apprehended for violent offences and experience violent victimisation at rates two to five times those experienced by non-Indigenous people.357,358 National crime victimisation surveys show that the Northern Territory recorded higher victimisation rates for assault and break-ins and higher proportions of people who reported feeling unsafe than other states and territories.359
Results from the 2008 National Aboriginal and Torres Strait Islander Social Survey (NATSISS), which surveyed more than 13,000 Indigenous people across Australia, showed that nearly one-quarter (23%) of Indigenous people reported being a victim of actual or
357 C. Bryant & M. Willis, Risk factors in Indigenous violent victimisation, Technical and background paper no. 30, Australian Institute of Criminology, Canberra. 2008. 358 J. Wundersitz, Indigenous perpetrators of violence: Prevalence and risk factors for offending, Research and public policy series no. 105, Australian Institute of Criminology, Canberra, 2010. 359 ABS, Crime victimisation, Australia, 2009–10, cat. no. 4530.0, ABS, Canberra, 2011.

Promoting law and order
Northern Territory Emergency Response: Evaluation Report 2011 163
threatened physical violence in the 12 months prior to being surveyed.360 Moreover, the 2008 NATSISS showed that 16 per cent of Indigenous people aged over 15 years in the Northern Territory reported having been arrested at least once in the past five years.361 A higher proportion of respondents in the Territory cited family violence as a neighbourhood or community problem (32%) than respondents across Australia overall (25%). More Territory respondents cited assault as a problem (31%) than Australians overall (23%). Similar results were found in the 2009–10 crime victimisation survey, in which markedly higher proportions of respondents in the Northern Territory than in any other state or territory reported social disorder issues such as being pestered or harassed in the street, public drunkenness, rowdy behaviour and offensive language and behaviour to be problems for them.362
Indigenous people are heavily overrepresented in homicide statistics, both as offenders and as victims. This has been the case in recent decades, and the most recent data from 2007–08 show that Indigenous females were represented as homicide offenders at a rate some 25 times higher than non-Indigenous offending rates, while males were overrepresented at approximately eight times the non-Indigenous rate.363
Despite making up less than 3 per cent of the Australian population, Indigenous people comprise more than a quarter (26%) of the prisoner population and more than 40 per cent of those imprisoned for assault offences.364 The age-standardised Indigenous imprisonment rate (1,891.5 per 100,000 adult population) is more than 14 times the non-Indigenous rate (133.5 per 100,000 adult population), and the ratio has increased every year, apart from one, since 2000.365 A number of studies have suggested that Indigenous overrepresentation in the prison system is due to a combination of involvement in serious offences and higher rates of readmission to prison366,367,while increases in Indigenous imprisonment rates have been attributed to more severe treatment by the criminal justice system in its response to offending.368 Changes in the criminal justice system’s response to offending are likely to impact more heavily on Indigenous than non-Indigenous offenders, as Indigenous offenders are more likely to have extensive offending histories, to have been convicted of serious violent offences, to have breached previous court orders and to have been convicted of multiple concurrent offences.369,370
Indigenous Australians constitute a much higher proportion of the overall population in the Northern Territory (30%) than in other states and territories (less than 4% in all other states and territories) or in Australia overall (2.5%).371 The Indigenous population in the Territory also has a much younger age profile than the non-Indigenous population, as it does across Australia, with a much higher proportion of the population aged in the peak offending ages of 24 years and under.372,373 It is therefore not surprising that Indigenous people constitute a
360 ABS, National Aboriginal and Torres Strait Islander Social Survey, 2008, cat. no. 4714.0, ABS, Canberra, 2009. 361 ibid. 362 ABS, Crime victimisation, Australia, 2009–10, op. cit. 363 M. Virueda & J. Payne, Homicide in Australia: 2007–08 National Homicide Monitoring Program annual report, monitoring report no. 13, Australian Institute of Criminology, Canberra, 2010. 364 ABS, Prisoners in Australia, cat. no. 4517.0, ABS, Canberra, 2010. 365 ibid. 366 L. Snowball & D. Weatherburn, Indigenous imprisonment: The role of offender characteristics, New South Wales Bureau of Crime Statistics and Research, Sydney, 2006. 367 D. Weatherburn, B. Lind & J. Hua, ‘Contact with the New South Wales court and prison systems: The influence of age, Indigenous status and gender’, Crime and Justice Bulletin, no. 78, New South Wales Bureau of Crime Statistics and Research, Sydney, 2003. 368 J. Fitzgerald, ‘Why are Indigenous imprisonment rates rising?, Crime and Justice Statistics Bureau Brief, no. 41, New South Wales Bureau of Crime Statistics and Research, Sydney, 2009. 369 ibid. 370 L. Snowball & D. Weatherburn, op. cit. 371 ABS, Measures of Australia’s progress, 2010, ‘Population, Aboriginal and Torres Strait Islander peoples’, cat. no. 1370.0, ABS, Canberra, 2010. 372 ABS, Population characteristics, Aboriginal and Torres Strait Islander Australians, Northern Territory, 2006, cat. no. 4713.7.55.001, ABS, Canberra, 2010.

Promoting law and order
164 Northern Territory Emergency Response: Evaluation Report 2011
greater proportion of the prisoner population (81%) than in the next highest jurisdiction (Western Australia; 39%). However, the extent to which Indigenous people are overrepresented in the prison population compared with their representation in the general population is less in the Northern Territory (10.5 times) than in the state with the highest level of overrepresentation (Western Australia; 19.2 times) or Australia overall (14.2 times).
The overrepresentation of Indigenous young people in detention is even higher than it is for adults. Indigenous juveniles were more than 24 times as likely to be in detention as non-Indigenous juveniles at 30 June 2008.374 In the Northern Territory, Indigenous juveniles were more than 30 times as likely to be detained as non-Indigenous juveniles. However, the rate of Indigenous youth detention in the Territory (203.3 per 100,000 relevant population) at 30 June 2008 was below the national average (420.4 per 100,000 relevant population) and well below the state with the highest rate of youth detention (Western Australia; 794.0 per 100,000 relevant population).375
The high rates of offending and their impacts on the safety of Indigenous people, particularly women and children, provide a fundamentally important backdrop for assessing the law and order measures introduced through the NTER and the Northern Territory National Partnership Agreement (NTNPA). There were, and are, crucial differences between communities with predominantly Indigenous populations that result in large differentials in their relative safety. Research points to social cohesion linked with positive social norms as key elements that reduce levels of crime and antisocial behaviour.376 However, for many of the NTER communities, these measures were introduced into an environment where people lived in circumstances of compromised safety due to many historical, local and service access issues377, placing them at a level of disadvantage compared with the broader Australian population.
The law and order measures This chapter considers measures undertaken through the NTER and NTNPA to promote law and order and build safe communities. The measures examined are:
• policing—the establishment of a new police presence (‘Themis’ stations) in a number of communities and the deployment of additional policing
• alcohol restrictions—new laws that prohibited the possession, supply and consumption of alcohol in prescribed communities
• pornography restrictions and the audit of publicly funded computers—new laws that prohibited the possession, supply and consumption of certain classified and unclassified media and literature in prescribed communities, supported by a regular audit of publicly funded computers to ensure that appropriate steps were being taken to prevent them being used to access prohibited content
• night patrol services—increased funding to the Australian Government Attorney-General’s Department for the expansion of night patrol services to all NTER communities
373 K. Richards, ‘What makes juvenile offenders different from adult offenders?’, Trends & Issues in Crime and Criminal Justice, no. 409, Australian Institute of Criminology, Canberra, 2011. 374 K. Richards & M. Lyneham, Juveniles in detention in Australia, 1981–2008, Monitoring report no. 12, Australian Institute of Criminology, Canberra, 2010. 375 ibid. 376 R. McCausland & A. Vivian, ‘Why do some Aboriginal communities have lower crime rates than others? A pilot study’, Australian and New Zealand Journal of Criminology, vol. 43, no. 2, 2010, pp. 301–332. 377 M. Willis, ‘Non-disclosure of violence in Australian Indigenous communities’, Trends & Issues in Crime and Criminal Justice, no. 405, Australian Institute of Criminology, Canberra, 2011.

Promoting law and order
Northern Territory Emergency Response: Evaluation Report 2011 165
• Substance Abuse Intelligence Desk (SAID) and Dog Operations Unit (DOU)—increased funding to expand SAID and DOU operations and increase law enforcement capacity to tackle substance misuse, trafficking and supply
• access to justice—increase funding to legal aid services and the Aboriginal Interpreter Service to allow improved access to justice for people in prescribed communities and in relation to legal matters arising from the NTER.
These measures are described more fully and examined individually below, but a brief overall description is given here.
The NTER began to be implemented in Central Australia in July 2007 and was rolled out progressively across much of the Northern Territory. Most communities covered by the NTER received the measures only in the final quarter of the 12-month rollout period. Some measures took longer than 12 months to reach all communities. Generally speaking, Northern Australia received the NTER measures later than the more southern areas of the Northern Territory (Central Australia).
The law and order measures were not applied equally to all prescribed areas. Some applied on a broad scale, while others were applied on a needs basis to specific communities. For instance, legislation that restricted access to alcohol and pornography applied to all prescribed areas, although there were provisions that allowed for licensed venues to sell alcohol in a small number of locations. Increased funding for night patrol services aimed to establish these services in all NTER communities, while funding for improved access to justice aimed to make legal aid more available to residents of all prescribed communities. The funding also aimed to assist people in prescribed areas and service providers to access effective translating and interpreting services.
Other measures applied to a smaller number of communities. For instance, policing measures were only identified for a relatively small number of communities, as many communities already had an existing policing presence and some others were able to be serviced by police located in other, relatively proximate communities. In all, 18 communities (covering more than 30% of the relevant population) received a resident police presence for the first time in the form of police stations established through the Northern Territory Police Service’s Operation Themis, while others received an increased police presence through the deployment of additional NT Police and Australian Federal Police (AFP) officers. The fact that these communities did not have this level of policing before the NTER, despite the extent of violent and other offences in these communities, raises a concern about ‘underpolicing’ prior to the NTER, and points to an intuitively obvious potential benefit of the NTER—the ‘normalising’ of policing. The NTER communities ranged in size from 50 people to nearly 3,000 people; all but seven have populations of fewer than 1,000 people.378 However, it should be noted that there are many small rural towns across Australia with populations well under 1,000 that have long had an established police presence. Some of the many examples of such towns, and their populations at the 2006 Census379, are Burketown in Queensland (population 173), Henty in New South Wales (population 863) and Wyndham in Western Australia (population 770).
Recognising the differential timing and scope of the law and order measures—and similar differences in the timing and scope of the other NTER measures that may to a greater or lesser extent influence the operation of the law and order measures and the outcomes resulting from them—is critical to understanding evidence for the effectiveness of the
378 FaHCSIA-derived population estimates for NTER communities. 379 ABS, Census quickstats by location, ABS, Canberra, 2006.

Promoting law and order
166 Northern Territory Emergency Response: Evaluation Report 2011
measures. The interpretation of information such as changes in recorded offences and perceptions of community safety will be affected by knowledge of what measures particular communities received.
Community safety—changes In this section of the chapter, an examination is provided of the major changes to community safety—as measured by changes in police recorded incidents and offences, and surveyed perceptions of community safety—that occurred in the NTER communities in the period since the NTER law and order measures were put in place. This section draws on the AIC’s analysis of incident and offence data provided by the NT Police, and courts data provided by the NT Department of Justice. A brief summary of the results of this analysis is provided here; the full analysis is detailed in Appendix 5. The survey results are used to supplement the quantitative analysis, but also to provide valuable evidence in their own right. Well-designed and implemented surveys are able to capture elements of lived experience different from that reflected in administrative data, can be more responsive in measuring localised and specific variables of interest and can avoid some of the factors that can confound interpretations of administrative data.
In considering changes in the rates and numbers of offences occurring in NTER communities following the introduction of the NTER, it is important to note that increases in police recorded offences do not necessarily indicate increases in offending behaviour. As is discussed below, crime data recorded by police are partly a measure of police activity; increases in police activity and resources, or targeted police operations, can lead to an increase in the number of offences detected and recorded by police over and above any increases in offending behaviours. Crime data are also a measure of community confidence in the police, and resulting willingness to report criminal behaviour, as well as police data recording and management practices.
Table 5.1 shows changes in the numbers of offences across all NTER communities, within selected offence categories, in the ‘post-NTER’ period from July 2007 to December 2010, compared with the ‘pre-NTER’ period from July 2004 to June 2007. The offence categories shown are those that account for a large majority of all offences both in NTER communities and in the Northern Territory overall. The amount of change in offences shown is based on a comparison of six-monthly averages during the pre-NTER period with six-monthly averages during the post-NTER period. The table also shows the change in the total number of offences recorded by police as alcohol-related and those recorded as non-alcohol-related.
As is evident in Table 5.1, the number of offences recorded in all major offence categories increased substantially in the post-NTER period, with the exception of theft. The increase was particularly pronounced in relation to traffic and vehicle regulatory offences and offences against justice procedures, but there were also very large-scale increases in assault and public order offences. The increase in alcohol-related offences was more than double that in non-alcohol-related offences. From the July 2004 – June 2007 period to the July 2007 – December 2010 period, there was a 26 per cent increase in the number of non-alcohol-related offences recorded (from approximately 2,200 per six months to approximately 2,800 per six months), and a 56 per cent increase in the number of alcohol-related offences recorded (from approximately 1,100 per six months to approximately 1,700 per six months).

Promoting law and order
Northern Territory Emergency Response: Evaluation Report 2011 167
Table 5.1 Changes in recorded numbers of offences, selected offences, NTER communities, July 2007 to December 2010
Offence type Direction of change Degree of change (%) Assault Increase 44 Unlawful entry with intent Increase 22 Theft No change – Public order Increase 43 Traffic and vehicle regulatory Increase 61 Offences against justice procedures Increase 54 Alcohol-related Increase 56 Non alcohol-related Increase 26 Source: NT Police offences dataset (AIC computer file).
A closer examination of alcohol-related offences shows that there was a 92 per cent increase in alcohol-related traffic and vehicle regulatory offences in the post-NTER period, compared with the pre-NTER period. This period also coincides with the introduction of dedicated Traffic and Highway Patrol units in the Northern Territory. There was a 46 per cent increase in alcohol-related public order offences in the same period, approximately 80 per cent of which were related to the consumption of alcohol, and a 24 per cent increase in alcohol-related assault. There was also a 46 per cent increase in alcohol-related public order offences during the July 2007 – December 2010 period, compared with the July 2004 – June 2007 period (from approximately 360 to 520 offences per 1,000 people per six months). It is noted that the number of such offences dropped markedly in 2010, after peaking in the July–December 2009 period.
Increases in the post-NTER period, compared with the pre-NTER period, were markedly larger in those communities that received an established police presence for the first time, through the Themis police stations. Overall rates of recorded offences in communities that received a Themis station increased by 143 per cent in the post-NTER period. Communities without a police station experienced increases of 35 per cent in their overall offence rates, while communities that had an existing police station prior to the NTER experienced increases of 17 per cent. This suggests that at least some of the increase in recorded offending is due to increased police activity.
While most NTER communities had alcohol restrictions in place before those introduced with the NTER, a small number did not have any restrictions in place. Comparing post-NTER changes in offence rates in previously restricted and newly restricted communities can provide useful evidence for the influence of the NTER restrictions. In those communities with existing restrictions, rates of alcohol-related and non-alcohol-related offences increased by 62 per cent and 31 per cent, respectively, from the pre-NTER period to the post-NTER period. In communities with no existing alcohol restrictions there was a decrease in non-alcohol-related offences, but an 18 per cent increase in alcohol-related offences. Rates of alcohol-related offences were quite stable in those communities before the NTER, suggesting that the NTER alcohol restrictions were accompanied by a greater level of alcohol-related enforcement than previously.
The relationship between existing alcohol restrictions and policing arrangements is demonstrated in Table 5.2. The effects of the NTER measures are most clearly shown in the case of those communities where either or both variables changed as a result of the NTER.380
380 Changes in recorded offences in communities that did not experience a change in policing arrangements, and which had existing alcohol restrictions, would tend to suggest that those changes are not related to the NTER, or that possibly they are the effects of displacement from communities that experienced changes in policing and new alcohol restrictions.

Promoting law and order
168 Northern Territory Emergency Response: Evaluation Report 2011
The greatest proportional change in recorded offences occurred in previously restricted communities that received a Themis police station, where alcohol-related offences (particularly public order and traffic and motor vehicle regulatory offences) increased by 246 per cent and non-alcohol-related offences increased by 116 per cent. There was no increase in alcohol-related violent offending in those communities. This lends support to the notion that the increases in offending observed across NTER communities were directly linked to increased police presence.
Setting aside the increases in previously unrestricted communities that received Themis stations, which are overly influenced by high numbers of offences in one or two six-month periods, the next highest proportional increase (86%) was in alcohol-related offences in previously restricted communities with no police station. This observation—that recorded alcohol-related offences increased following the NTER alcohol restrictions, even when there were restrictions already in place—lends support to the notion that the alcohol restrictions introduced through the NTER have been more strongly enforced than previous restrictions. The particularly large increase in alcohol-related offences, especially public order offences including breaches of alcohol restrictions, in previously restricted communities that received a Themis station suggests that these two measures—increased police and alcohol restrictions—had a compounding effect on recorded offences.
Table 5.2 Change in number of recorded offences after July 2007, six-monthly averages, by presence of police station
Previous alcohol restrictions Police station Non-alcohol-related (%) Alcohol-related (%) Restricted Existing ↑12 ↑35 Themis ↑116 ↑246 None ↑30 ↑86 Unrestricted Existing ↓50 ↓82 Themis ↑71 ↑114 None ↓4 ↑6 Source: NT Police offences data (AIC computer file).
While all NTER communities recorded an increase in domestic violence-related offences in the post-NTER period, the increase was markedly higher in communities that received a Themis station. While rates of domestic violence-related offences increased by 26 per cent and 57 per cent, respectively, in communities with an existing police station or no police station, those that received Themis stations experienced increases of 196 per cent between the pre- and post-NTER periods.
Court data show there was an average of 15 per cent more assault convictions per year from July 2007 to December 2010 than from July 2005 to June 2007, for offences committed in NTER communities. The number of assault convictions also increased in other areas of the Northern Territory: there was an average of 10 per cent more assault convictions in those areas since July 2007. The increased number of assault convictions was due to a higher number of cases being lodged with the courts, rather than an increased rate of convictions. Across the Northern Territory, the number of orders of imprisonment resulting from assault convictions increased by 23 per cent in the July 2007 – December 2010 period, compared with the earlier period.381 However, for offences committed in NTER communities, the number of imprisonment orders increased by only 13 per cent. This may indicate that while the NTER led to a greater number of assault offences being recorded by police, resulting in a greater
381 The available data and information do not suggest an explanation for the number of imprisonment orders increasing by a greater percentage than the number of assault convictions. This may be due to one or more factors, including increased seriousness of offences, a greater proportion of offenders appearing before the courts with more extensive offending histories and prior imprisonment, changes in judicial attitudes or directions, or legislative changes.
Promoting law and order
Northern Territory Emergency Response: Evaluation Report 2011 169
number of convictions, the increases were for offences of relatively minor seriousness. It is worth noting that the most recent FaHCSIA monitoring report shows that the number of aggravated assault incidents across NTER communities in 2010–11 was similar to the number recorded in 2009–10, which may indicate a stabilisation in the prevalence of violence incidents recorded by police.382
The findings from FaHCSIA’s survey of service providers’ perceptions of community safety (the CSSPS), conducted in the first half of 2011, showed that just over four in 10 respondents (41.4%) who worked in or with remote communities felt that communities had become safer in the three years preceding the survey.383 Of those, equal proportions384 felt the community was ‘a little more safe’ and ‘a lot more safe’. Just over one-quarter (28%) felt the community was not more or less safe than previously, while 17 per cent felt it had become less safe.385 The responses of service providers working in or with remote communities were more positive than among service providers who responded in relation to towns, where less than 10 per cent felt their neighbourhood had become safer386 and more than half (54%) felt it was less safe.387
Respondents to the CSSPS were asked to identify to what extent 10 identified programs and initiatives had made a difference to community safety.388 In remote communities, a majority of respondents felt night patrols (71%), additional police (59%), Themis police stations (53%) and safe houses (53%) had made the safety of communities ‘a bit better’ or ‘a lot better’. Town respondents generally saw the same initiatives as having contributed to improvements but were overall more negative in their views, with smaller proportions indicating that night patrols (49%), additional police (42%), more things for young people to do (30%), safe houses (29%) and alcohol restrictions (28%) had made community safety a bit or a lot better. When questioned about the most effective service or program that had increased community safety, service providers in both towns and remote communities suggested that policing was the most effective. In remote communities there was similarly strong support for night patrols, while in towns service providers were more likely to support alcohol restrictions and youth services. Policing was also frequently cited in both community types when respondents were asked about priorities for improving community safety: more police, more Indigenous police, better community engagement and emphasis on addressing alcohol-related problems were seen as very important, although there were wide-ranging views on how to deal with the issues.389
Similar, but generally more positive, responses were gained by FaHCSIA through the CSWRS, which investigated perceptions of community safety among members of NTER communities.390 That study, which included more than 1,300 community member respondents in 16 NTER communities, found evidence to show that people in NTER communities feel safer as a result of the NTER than they did before. A little under three-quarters (73%) of NTER community members felt their community was safer than three years previously, a time period that aligns with introduction of the NTER.391 Around six out of 10 community members
382 FaHCSIA, Closing the gap in the Northern Territory: Monitoring report, January to June 2011, FaHCSIA, Canberra, 2011. 383 J. Putt, S. Middleton, J. Yamaguchi & K. Turner, op. cit, The question asked was ‘Overall, do you think this community/neighbourhood has become safer in the last 3 years?’. Options were ‘Yes, a lot more safe’; ‘Yes, a little more safe’; ‘It’s the same—not more safe or less safe’; ‘No, a little bit less safe’; ‘No, a lot less safe’; ‘Don’t know’. 384 20.7 per cent for each. 385 7.4 per cent felt the community was ‘a little bit less safe’ and 9.6 per cent felt it was ‘a lot less safe’; 13.3 per cent answered ‘a lot more safe’. 386 2.5 per cent answered ‘Yes, a lot more safe’ and 6.2 per cent ‘Yes, a little more safe’. 387 28.6 per cent answered ‘No, a little bit less safe’ and 25.4 per cent answered ‘No, a lot less safe’. 388 J. Putt, S. Middleton, J. Yamaguchi & K. Turner, op. cit. 389 ibid. 390 G. Shaw and P. d’Abbs, op. cit. 391 ibid.

Promoting law and order
170 Northern Territory Emergency Response: Evaluation Report 2011
(61%) felt that fewer people were making trouble in their communities than three years previously, while a similar proportion (59%) felt there was less family fighting.
Community members indicated support for a number of the NTER law and order measures and felt that those measures had contributed to community safety. Nearly half of respondents (48%) in communities that received a Themis station felt the new police station had made a ‘big difference’ to community safety, while nearly one-third (32%) felt it made ‘a bit of a difference’. Similar proportions felt that better night patrols had made a big difference (43%) or a bit of a difference (32%); the same was true for safe houses, which 41 per cent felt had made a big difference to community safety and 29 per cent felt made a bit of a difference. Few respondents indicated that any of these measures had made community safety worse.
Data on hospitalisations for assault in public hospitals across the Northern Territory provided by the Australian Institute of Health and Welfare show there was no statistically significant change in the rate of Indigenous people being hospitalised for assault between the pre-NTER and post-NTER periods (Table 5.3). Hospitalisation rates for Indigenous people were slightly higher in the years preceding the NTER than subsequently. While police data show increases in recorded assault offences following the introduction of the NTER, this did not manifest in greater numbers of assault-related hospitalisations. One interpretation is that while a greater number of assault offences occurred in the post-NTER period, they were relatively minor offences not resulting in serious injury. This is supported by NT Police data showing that, in the period before the NTER, just over 8 per cent of assaults recorded in NTER communities resulted in injury. In the period following the introduction of the NTER, just under 7 per cent of assaults resulted in injury. It may also be that the number of assault incidents not requiring hospitalisation did not change, but that the incidents were more likely to be reported because of increased police presence and/or a greater willingness in communities to report offending and victimisation. The introduction by the NT Government of mandatory reporting of domestic and family violence by health service providers may also have influenced the number of recorded assault cases.
Table 5.3 Age standardised hospitalisations for assault, public hospitals in the Northern Territory, rate per 1,000 population, 2001–02 to 2009–10
Year Indigenous rate Other Australians rate 2001–02 24.7 1.3 2002–03 21.6 1.7 2003–04 22.0 1.5 2004–05 27.2 1.3 2005–06 31.6 1.5 2006–07 28.2 1.7 2007–08 26.4 1.8 2008–09 27.5 1.6 2009–10 27.8 1.9 Annual change 5.3 0.4(a) Per cent change over period 21.5 31.5(a) (a) Represents a statistically significant change at the p < 0.05 level. Notes: • Categories are based on the ICD–10-AM 2nd through 6th editions (National Centre for Classification in Health 2008). • Financial year reporting (1 July to 30 June). • ‘Other’ includes hospitalisations of non-Indigenous people and those for whom Indigenous status was not stated. • Care types 7.3, 9 and 10 (newborn—unqualified days only; posthumous organ procurement; hospital boarder) excluded from analysis. • Excludes not stated and null responses. • Average annual change in rates, rate ratios and rate differences determined using linear regression analysis • Percentage change during designated period based on the average annual change over the period. • Rates have been directly age-standardised using the 2001 Australian standard population. Source: AIHW analyses of National Hospital Morbidity Database.

Promoting law and order
Northern Territory Emergency Response: Evaluation Report 2011 171
Community safety changes—discussion The increases in police recorded offence rates mentioned above do not necessarily reflect an increase in the amount of offending behaviour as a result of the NTER. This may be the case in a very limited sense, as the alcohol restrictions introduced with the NTER created offences for some behaviours that were previously lawful, and the increased policing allowed for active enforcement of those restrictions. However, as indicated above, increased rates of offending, based on police data, are to be expected following a substantial increase in police activity, such as that which resulted from the NTER measures. Recorded crime is invariably a measure of police activity and data collection as well as actual criminal behaviour. Further, there is strong evidence to show that high levels of violent offending behaviour existed in the Northern Territory prior to the NTER, and it is known that a very large majority of violent victimisation is not reported to police.392,393,394 Studies that have compared the results of victimisation surveys with police data show that high proportions of some categories of property offence, such as motor vehicle theft, are relatively likely to be reported to police, as victims will usually have to show evidence of having reported the offence to police to be able to claim on insurance policies.395 A wide range of other offences, including public order offences and traffic offences, generally do not come to police attention, and therefore are not captured in recorded crime datasets, unless police are both present and actively involved in detecting them through targeted policing activities or patrols. It was the numbers of these kinds of offences that were seen to increase following introduction of the NTER.
It is also the case that the NTER measures did not take place in a law enforcement vacuum, and the NT Police were undertaking a range of policing activities concurrent with the NTER that impacted on recorded offences. Those activities included the Violent Crime Reduction Strategy, the Property Crime Reduction Strategy and the Social Order Strategy, as well as the introduction of mandatory reporting of domestic and family violence, various localised strategies to target offending behaviours, the introduction of dedicated Traffic and Highway Patrol units and changes to data collection and recording that improved the quality of data and the extent of offences captured in the data.396
An examination of the literature conducted in the United States showed that studies investigating the impact of police resources on reducing crime rates showed either no relationship or a negative relationship, with increased police numbers leading to an increase in recorded crime rates.397 The author of the study contended that the key difficulty in examining this relationship had been separating changes in crime rates from decisions to deploy police resources. The author examined the relationship between crime rates and police numbers in the context of the United States, where cities with high crime rates tend to have large police forces.398 He argued that, as there will always be some degree of deficit in this situation because there will never be enough police to proactively or reactively deal with every incident, increased police resources will tend to lead to higher rates of crime being dealt with and recorded, even if police ultimately reduce the rate of crime. A study that sought to separate out these relationships used increases in police numbers linked to electoral campaigns in the United States399—a situation in some ways analogous to the increase in police numbers through the NTER. It found that increased police numbers do lead to
392 C. Bryant & M. Willis, op. cit. 393 M. Willis, op. cit. 394 J. Wundersitz, op. cit. 395 M. Willis, op. cit. 396 ABS, Recorded crime, victims, Australia, 2009, cat. no. 4510.0, ABS, Canberra, 2010. 397 S.D. Levitt, ‘Using electoral cycles in police hiring to estimate the effect of police on crime’, The American Economic Review, vol. 87, no. 3, 1997, pp. 270–90. 398 ibid. 399 ibid.

Promoting law and order
172 Northern Territory Emergency Response: Evaluation Report 2011
reductions in offences such as violent crime, robbery and motor vehicle theft, as there is greater capacity for investigation, patrols and vehicle checks. The study also noted that, given the discretion involved in making arrests in family violence situations, greater police resources may increase the likelihood of perpetrators being arrested, which would tend to increase the recorded crime rate in the short term. The author argued that the rate of these crime types would be expected to reduce over time in response to the greater level of policing, although the availability of appropriate programs and services to assist in the rehabilitation and reintegration of offenders and support victims may be a necessary precondition for a sustained reduction to occur.
In the situation of the NTER communities, it is too early to tell whether increased police resources will lead to reductions in offending in the longer term. While the numbers of recorded offences in many offence categories reduced in the first half of 2010, following a period of sustained increase, they appear to have increased again in the second half of 2010. This could be due to a wide range of factors, including fluctuations independent of police activity, but specific individualised data are not available to fully examine the variations and the reasons for them. It will take a longer period of observation before any trends in recorded offence rates in the NTER communities are known. However, it is apparent that the increased police presence was meeting a previously unmet level of demand. Responses to FaHCSIA’s CSWRS and CSSPS surveys, and a survey of community members’ perceptions about the Themis stations400, indicate support among members of NTER communities for the increased police presence and the other NTER law and order measures, particularly night patrols.
Community safety changes—conclusions Analysis of police incident and offence data shows there have been clear and marked increases in the number of recorded offences in most major offence categories in Northern Territory Indigenous communities since the introduction of the NTER. The increases appear to be strongly linked to the increase in police resources in NTER communities, through additional police deployments and through the establishment of Themis police stations, which provided a police presence in 18 communities and surrounding areas for the first time. The deployment of additional police and what appears to be the active enforcement of newly introduced restrictions on alcohol in NTER communities have contributed to an increase in recorded offences. The new restrictions meant an increase in potential offences, and it is possible that it took time for community members to become aware of the new restrictions and adjust their behaviour in response to them. While recorded crime has increased, survey results suggest that people in communities are feeling safer than they did before the NTER: sizeable proportions of both community members and service providers report that their communities have become safer.
Perceptions of increased community safety are an important outcome of the NTER and support its objectives of improving the safety of Indigenous people, particularly women and children, living in NTER communities. Through the NTER, the Australian Government sought to stabilise the high levels of violent and other offending seen in many NTER communities as a platform for making positive changes in those communities. While it is too early to tell whether the NTER law and order measures will ultimately result in a decrease in offending in NTER communities, they form part of the wider suite of measures that work in with other Australian and Northern Territory government activities in an attempt to achieve the goal of ‘closing the gap’ on Indigenous disadvantage. It has been contended that establishing a level
400 J. Pilkington, Aboriginal communities and the police’s Taskforce Themis: Case studies in remote Aboriginal community policing in the Northern Territory, Northern Australian Aboriginal Justice Agency & Central Australian Aboriginal Legal Aid Services, Darwin, 2009.

Promoting law and order
Northern Territory Emergency Response: Evaluation Report 2011 173
of community safety is a necessary precondition for improving the socioeconomic circumstances of neighbourhoods and communities.401 To the extent that community safety is at least perceived to be improving in NTER communities, it appears that this precondition may be becoming established.
There remain a number of questions that can only be answered with further data, information and the passage of time. While there are early indications that recorded crime rates in the NTER communities may be declining, it is too early to tell whether that is the case. It is also possible that increased prosecutions may have resulted in more people acquiring criminal records, or more extensive criminal histories, which may lead to some individuals having a greater level of involvement with the criminal justice system in the future.
Review of individual measures The following sections move on from a consideration of the overall changes that have occurred in community safety in the NTER communities and how the NTER law and order measures may have influenced them, to consider the evidence for the effectiveness or otherwise of the individual measures. While they are examined separately, their interrelationship with each other as part of the suite of measures, and their connections to other government measures and activities, should be kept in mind.
Increased policing presence in communities
What was done As part of the NTER, and with financial support from the Australian Government, the NT Police service established a resident police presence in 18 communities that had not previously had such a presence. Those presences were in addition to the 39 police stations that existed across the Territory prior to the NTER. The new police stations became known as ‘Themis stations’—the name was derived from the NT Police’s Taskforce Themis, which undertook the operation to establish the stations. As a result of this measure, almost all communities identified as priority Northern Territory communities under the National Partnership Agreement on Remote Service Delivery (RSD), and almost all those locations identified by the Northern Territory Government as Territory Growth Towns, now have an established police presence (of the 21 Territory Growth Towns, 19 are also NTER communities). The only RSD communities or Territory Growth Towns without police stations are communities that are either able to be effectively serviced from nearby stations, or those with facilities for police to visit and stay overnight on a regular basis.
The new stations were established quite quickly once the NTER commenced in mid-2007. By 30 June 2008, there were new police presences in 18 communities as well as 51 additional police, 18 of whom were NT Police and 33 of whom were AFP or interstate police members.402 By May 2009, there were 63 additional police in operation—45 AFP and interstate police and 18 NT Police—and four permanent police stations had been upgraded, while a new permanent police station had been opened in one community to replace a Themis station.403 FaHCSIA reported that at 30 June 2011 there were 62 additional police, compared with pre-
401 M. Kleiman, When brute force fails: How to have less crime and less punishment, Princeton University Press, New Jersey, 2009. 402 FaHCSIA, Northern Territory Emergency Response monitoring report: Measuring progress of NTER activities, August 2007 to 30 June 2008, FaHCSIA, Canberra, 2008. 403 FaHCSIA, Northern Territory Emergency Response monitoring report: Measuring progress of NTER activities, July 2008 to December 2008, FaHCSIA, Canberra, 2009.

Promoting law and order
174 Northern Territory Emergency Response: Evaluation Report 2011
NTER numbers, in communities.404 The number of 62 additional police was also reported as at 30 June 2010405 and at 31 December 2010.406 Five permanent police station upgrades had been funded, 18 Themis stations continued to operate and four overnight facilities had been installed in NTER communities.
In October 2009, it was announced that five new permanent police stations would be built in priority locations selected by the NT Police Commissioner. The first was opened in April 2011.
Assessing the measure The program logic developed for the NTER identified the immediate outcome of an increased police presence as being ‘adequate policing’. The definition of ‘adequate’ in this context is not easily able to be determined, and different police agencies have different ways of balancing factors such as population, relative proximity to other centres with a police presence, the location and availability of specialist and ancillary policing resources, level of demand (as indicated by rates across a range of offences) and a range of environmental factors.
A pre-NTER independent assessment of policing in remote Indigenous communities407 examined policing presence and needs in communities across the Northern Territory, Queensland, South Australia and Western Australia. The assessment suffered from difficulties in obtaining accurate data on policing numbers and offending data but nonetheless was able to provide an indication of those communities with 200 or more people that had no policing presence and also no police station within 75 kilometres. The assessment included the number of ‘implied police required’, based on staffing averages for existing stations, taking into account police-to-population ratios. The number of implied police required in the Northern Territory was a little over 0.3 police per 100 people and therefore ranged from 0.6 for communities of 200 people, to 2.3 for communities of 700 people, up to 8.0 for the largest community of 2,500 people. While a simple ratio of police to population does not suffice for making decisions about police placements, given the range of other factors to be taken into account, it does go some way to addressing the question of whether policing is ‘adequate’.
The assessment identified 19 Northern Territory communities that met the author’s ‘Category 1’ (no police within the community or within 75 kilometres) and 19 in ‘Category 2’ (no police within the community, but police within 75 kilometres). Of those, four Category 1 communities and one Category 2 community were nominated by NT Police as priorities for receiving a police presence. The priorities identified by NT Police were:
• construction of a police station, accommodation and infrastructure at Galiwin’ku, Alpurrurulam, Ramingining (also servicing Milingimbi) and Urapuntja
• construction of police facilities for Aboriginal community police officers at Milikapiti.
An independent review of policing in remote Indigenous communities considered some of the challenges in establishing appropriate policing in remote Northern Territory communities.408 They included the:
• large number of small communities spread over a very large area, in difficult geographic and climatic conditions
404 FaHCSIA, Closing the gap in the Northern Territory: Monitoring report, January to June 2011, FaHCSIA, Canberra, 2011. 405 FaHCSIA, Closing the gap in the Northern Territory: Monitoring report, January to June 2010, FaHCSIA, Canberra, 2010. 406 FaHCSIA, Closing the gap in the Northern Territory: Monitoring report, July to December 2010, FaHCSIA, Canberra 2011. 407 J. Valentin, An independent assessment of policing in remote Indigenous communities for the government of Australia, Australian Government, Canberra, 2007. 408 Allen Consulting Group, Independent review of policing in remote Indigenous communities in the Northern Territory: Policing further into remote communities, Allen Consulting Group, Melbourne 2010.

Promoting law and order
Northern Territory Emergency Response: Evaluation Report 2011 175
• wide range of differing local governance and cultural authority structures
• diversity in language and culture across communities
• variation in infrastructure and service provision available to communities
• substantially greater per capita costs than policing in urban environments
• limited data available at the community level to inform resourcing decisions.409
Review of Themis police stations
The perceptions of Aboriginal community members of the increased police presence introduced through Taskforce Themis were examined by Pilkington in a survey conducted in several communities that received Themis police stations.410 That study used a mixed methods approach to examine Aboriginal peoples’ experience and views in relation to the new policing arrangements. The main information source for the study was 331 surveys of Aboriginal community members411, conducted in 14 of the 18 communities that received Themis stations.412 The study also drew on insights from approximately 70 interviews with elders, community representatives, police officers and other service providers, as well as criminal justice data.
Three-quarters of survey respondents (75%) stated that they wanted a permanent police presence in their community, while a majority (53%) believed the police were doing a good job.413 As the author noted, this was slightly less than the proportion (59%) of the general Northern Territory population who indicated in a satisfaction survey reported by NT Police in 2008 that they thought the police were doing a good job.
The study found that 17 per cent of survey respondents felt there had been very positive change and that ‘everything’ in their communities had improved since the Themis stations were established.414 At the same time, a similar proportion (14%) thought ‘nothing’ had improved. Where respondents cited improvements in specified crime and antisocial behaviour problems in the community, the improvements tended to be in realm of visible behaviours that tend to occur in public spaces (problems such as alcohol use and community violence), while behaviours that tend to be less visible (such as marijuana use and sexual assault) tended to be seen as improving less. The study found that a community’s perception of the police, and of how effective police were in affecting rates of offending, was strongly linked to the extent to which the police sought to engage with the community and the methods they adopted for that engagement. Community members indicated they would be less likely to report crimes to police, or cooperate with police questioning, if they felt negatively about the officer.415
Independent review of policing
An independent review of policing in remote Indigenous communities in the Northern Territory was conducted by the Allen Consulting Group, reporting to the Australian and Northern
409 ibid. 410 J. Pilkington, op. cit. 411 This represented 6 per cent of the estimated adult population of these communities. The percentage of the estimated adult population in each community participating in the survey ranged from 1 per cent to 34 per cent; in six of the 14 communities, less than 10 per cent of the estimated adult population participated; in four communities between 10 per cent and 19 per cent participated; in four communities 20 per cent or more of the estimated adult population participated. Participants were 55 per cent female and 45 per cent male. Participants were largely representative of age groups in the communities, but middle-aged residents were underrepresented in two communities, elderly residents were underrepresented in one community and young adults were underrepresented in three communities. All methodological details are as per J. Pilkington, op. cit. 412 Twelve communities were selected by the researcher, based on achieving a spread of geographical location and size and local connections; two additional communities were added opportunistically during the research process. 413 J. Pilkington, op. cit. 414 ibid. 415 ibid.

Promoting law and order
176 Northern Territory Emergency Response: Evaluation Report 2011
Territory governments.416 The review had been jointly commissioned and funded by FaHCSIA, the Northern Territory Department of the Chief Minister and NT Police, Fire and Emergency Services. It examined the level of policing in place across the Northern Territory and the extent to which it covered remote communities. The review compared service delivery standards between remote communities and other equivalently sized communities, as well as assessing the quality, relevance and resourcing levels of a range of policing initiatives introduced between 2007 and 2009. The review used a mixed methodology involving stakeholder consultations and a desktop literature review together with quantitative modelling of community needs to produce a better understanding of resource allocations.
The Allen Consulting review concluded in relation to service coverage that all communities that did not have a permanent policing presence should receive an improved level of access to regular policing services.417 The review noted that many communities wanted more female and Indigenous police officers and also noted that there was often a difference between what communities expected of the police, particularly in terms of response times and availability, and what police were actually able to deliver. The review also emphasised the importance of police establishing communication with the community, engaging with the community to understand local safety issues, clarifying police and community expectations with each other and acknowledging the importance of police officers as community role models. Role modelling was seen as particularly important in relation to young people and was supported by the police participating in community activities and working with youth workers and other youth-oriented service providers. Similarly to the Pilkington study that reviewed community attitudes to the Themis police stations418, the Allen Consulting review recommended that police work closely with night patrols and also recommended that police operations be more strategically aligned with peak demand times, taking into account local circumstances and occasions such as paydays, when levels of alcohol use and related violence may increase.
Community Safety and Wellbeing Research Study
Survey-based community safety and wellbeing research conducted by FaHCSIA419 suggests that community members generally regard the increased policing presence as a positive change. Compared with three years previously, over three-quarters of community respondents felt that it was easier to get help from police; this was particularly true for communities with Themis police stations (86%, compared with 75% for communities with an existing police station and 57% for those with no police station). This is not a surprising result. It is quite apparent that it would be easier to get help from police if there was now a police station where there was none previously. The result then becomes a measure of basic service availability, rather than indicating the quality, suitability or desirability of that service. The same can be said of a survey item showing that people in communities with Themis stations were more likely (54%) to say that going to the police was an option for women who got hurt than were people in communities that had no police station (41%), although the result for Themis stations was also more positive than for communities that had an existing police station (42% of respondents in those communities cited the police as an option for women who got hurt), perhaps indicating that the establishment of a Themis station had increased community confidence in the police over and above that in communities that already had a police station.
416 Allen Consulting Group, op. cit. 417 ibid. 418 J. Pilkington, op. cit. 419 G. Shaw and P. d’Abbs, op. cit.

Promoting law and order
Northern Territory Emergency Response: Evaluation Report 2011 177
A clearer indication of community attitudes to NTER policing measures comes from an item that asked whether respondents thought getting a police station had made a difference to safety in the community. A majority (59%) of respondents in small communities with a Themis station thought it had made a ‘big difference’ to community safety, while this was true for just under half (46%) of respondents in medium-sized communities with a Themis station.
Additional police were seen as making some difference to community safety by nearly 80 per cent of respondents in medium-sized communities that had received additional police; 60 per cent of respondents in those communities indicated that the additional police had made a ‘big difference’. There were similar results for large communities with additional police; 69 per cent of respondents in those communities indicated that the additional police had made a difference, and just over half of those respondents indicated that this was a ‘big difference’.
Conclusions As noted above, it will be several years before any long-term impacts on offending behaviours resulting from the deployment of additional police in NTER communities are known. In the meantime, it appears clear that a majority of community members are supportive of the additional police being in communities, in particular the Themis stations, and feel they are making the communities safer.
However, it is not simply a new or increased police presence that leads to communities feeling safer. The study of perceptions of communities that received Themis stations420 found that each community had its own unique experience with the increased police presence and that those experiences were distinct and different from one community to another. The study found widespread variation in the policing styles and priorities adopted for each community. Police officers varied widely in the extent to which they sought to engage with the community and the methods they adopted for that engagement. This in turn impacted heavily on community members’ perceptions of the police: people reacted more positively to officers who were seen to be making genuine efforts to engage meaningfully and respectfully with the community. Community members judged individual officers, and the police overall, by their behaviours, and this influenced the way in which community members engaged with the police. For instance, community members indicated they would be less likely to report to crimes to police, or cooperate with police questioning, if they felt negatively about the officer. Given the extent to which offending in Indigenous communities, particularly violent offending, goes unreported421, any aspect of policing that tends to reduce the willingness of victims or witnesses to report offending and victimisation can be considered a problem.
Alcohol restrictions
What was done One of the more immediate measures implemented through the NTER was the placing of restrictions on alcohol use in prescribed areas. This was supported by new legislation: the Northern Territory National Emergency Response Act 2007 (NTNER) (Cwth) had the effect of restricting alcohol use across all prescribed areas. This legislation operated together with changes to the Northern Territory Liquor Act, creating new offences supported by serious penalties for the possession, use and supply of alcohol in prescribed areas. The restrictions and the penalties for breaching them, were set out on large signs placed at the road entrances to all NTER communities.
420 J. Pilkington, op. cit. 421 M. Willis, op. cit.

Promoting law and order
178 Northern Territory Emergency Response: Evaluation Report 2011
Other elements of the restrictions included requirements that applied across the Northern Territory, including restricting access to takeaway alcohol from licensed premises and requiring people buying takeaway alcohol to show photographic identification and provide information, such as their address and where they intended to consume the alcohol.
The alcohol restrictions were supported by the development of alcohol management plans (AMPs), which involved FaHCSIA, the Northern Territory Government, community members and local service providers. At the end of 2008, FaHCSIA reported that AMPs were being implemented in four large Northern Territory centres, while AMPs were being developed for seven other areas.422 At the end of 2009, FaHCSIA reported that AMPs were in place in four large Northern Territory centres, a liquor supply plan was in place in another and consultations in relation to developing AMPs had commenced with six communities.423 By the end of June 2011, AMPs were being developed and negotiated in 25 NTER communities as well as some town camps, and AMPs had been implemented in five large Northern Territory centres.424 It should be remembered that this was in the context of AMPs having previously been in place in some Northern Territory communities prior to the NTER.
There appears little doubt that the misuse of alcohol is one of the key factors contributing to the high levels of violence and antisocial behaviour seen in many Indigenous communities and to poor Indigenous health outcomes. Engaging in risky alcohol consumption has been found to increase the likelihood of arrest among Indigenous people.425 The association between alcohol use, violence in general and the abuse of women and children has been demonstrated through studies, including the Little children are sacred inquiry, which found alcohol use to be a serious and growing threat to the safety of Aboriginal children.426 The notion of restricting alcohol use among Indigenous people is not new; indeed, most of the NTER communities had some form of alcohol restriction in place before the NTER.427
Little is known about the effectiveness of pre-NTER restrictions and measures in individual communities; however, a range of earlier reports and studies have indicated the potential benefits of appropriately designed and implemented alcohol management processes for Indigenous communities. A body of research from the National Drug Research Institute (NDRI) showed that restrictions on availability can be effective in reducing alcohol consumption and related harm in remote Australia, particularly when solutions are locally based and built on acknowledgement and ownership of the issues by Indigenous people.428 The NDRI research highlighted the need for a broader range of treatment models and complementary, well-resourced intervention strategies as well as the need for more rigorous evaluation conducted in cooperation with Aboriginal-controlled organisations. The NDRI also suggested that restricting supply through a taxation levy to increase the price of cask wine in the Northern Territory was likely to be an effective means of reducing alcohol consumption and associated harm.
422 FaHCSIA, Northern Territory Emergency Response monitoring report: Measuring progress of NTER activities, July to December 2008, op. cit. 423 FaHCSIA, Closing the gap in the Northern Territory: Monitoring report, July to December 2009, FaHCSIA, Canberra, 2010. 424 FaHCSIA, Closing the gap in the Northern Territory: Monitoring report, January to June 2011, op. cit. 425 D. Weatherburn, L. Snowball & B. Hunter, The economic and social factors underpinning Indigenous contact with the justice system: Results from the 2002 NATSISS survey, NSW Bureau of Crime Statistics & Research, 2006. 426 R. Wild & P. Anderson, Ampe Akelyememane Meke Mekarle: ‘Little children are sacred’, Report of the Northern Territory Board of Inquiry into the Protection of Aboriginal Children from Sexual Abuse, Northern Territory Government, Darwin, 2007. 427 Fifty-eight NTER communities were covered by alcohol restrictions prior to the NTER; 15 were not covered by restrictions. 428 D. Gray & S. Saggers, Indigenous Australian alcohol and other drug issues: Research from the National Drug Institute, National Drug Institute, Curtin University of Technology, Perth, 2002.

Promoting law and order
Northern Territory Emergency Response: Evaluation Report 2011 179
The experiences and opinions of Alice Springs town camp residents were examined in relation to the NTER in a study that used qualitative information from interviews.429 Respondents suggested the ban on drinking in the town camps made the camps safer for women and children, with less family violence. However, there were concerns that alcohol consumption had not decreased but had merely been displaced, and that the problem drinkers were still misusing alcohol but doing it in less visible areas of the town. There were also concerns that the restrictions were impacting on those who drank responsibly, for instance by preventing them from drinking at home. Another concern—also reflected in the NTER Review Board’s report430—is that the restrictions interfered with the actions that individuals, families and communities had already taken for themselves to control alcohol consumption.
An alcohol management system was implemented on Groote Eylandt and Bickerton Island in July 2005, to attempt to reduce the harm resulting from the introduction of alcohol to the community with mining operations in the 1960s.431 Under the alcohol management system, every person in the region had to have a permit to buy or consume takeaway alcohol. An evaluation of the system was conducted shortly before the implementation of the NTER.432 There was clear support for the restrictions: there was unanimous agreement among those who were interviewed and knew what the communities were like before the permit system. They agreed that those communities most impacted by alcohol were safer, happier and more functional since the system was introduced. The perceptions of interviewees were supported by police data, which demonstrated substantial reductions in both violent and property offences, as well as the number of community members entering custodial and community corrections. While the evaluators acknowledged that the relative inaccessibility of the islands had helped the alcohol reduction efforts, they also recognised the importance of Aboriginal community ownership and the support of the community, service providers and the licensed premises.
An evaluation of alcohol management in Tennant Creek assessed the impact of two measures: an AMP that was implemented in August 2008 and changes to licensing conditions in July 2006.433 Those measures built on bans on takeaway alcohol sales, known as ‘Thirsty Thursday’ restrictions and designed to reduce payday binge drinking, introduced in the mid-1990s. The AMP included a suite of supply reduction and harm reduction strategies, supported by increased monitoring and collaboration between service provider agencies. The evaluation used data on alcohol sales, alcohol-related hospital presentations and separations, and police data covering alcohol-related assaults and public order incidents. Alcohol sales data suggested there had been declining consumption in recent years, but in the context of Tennant Creek’s very high levels of consumption (per capita consumption was nearly 50% higher than the Northern Territory average and more than double the national average). Hospital data showed that revoking the Thirsty Thursday restrictions had led to a substantial increase in mental and behavioural disorders due to alcohol use. The AMP produced decreases in those presentations, but they remained at levels higher than before the Thirsty Thursday revocation. Similarly, lifting the Thirsty Thursday restrictions saw an increase in the number of alcohol-related assaults, which was reversed by the Liquor Supply Plan and AMP,
429 Tangentyere Council, Intervention: Experiences and opinions of Alice Springs town camp residents of the Northern Territory Emergency Response, 2008. 430 NTER Review Board, Northern Territory Emergency Response Report of the NTER Board, 2008. 431 K. Conigrave, E. Proude & P. d’Abbs, Evaluation of the Groote Eylandt and Bickerton Island Alcohol Management System, Northern Territory Department of Justice, Darwin, 2007. 432 ibid. 433 P. d’Abbs, B. Ivory, K. Senior, T. Cunningham & J. Fitz, Managing alcohol in Tennant Creek, Northern Territory: An evaluation of the Tennant Creek Alcohol Management Plan and related measures to reduce alcohol-related problems, Menzies School of Health Research, Casuarina, Northern Territory, 2010.

Promoting law and order
180 Northern Territory Emergency Response: Evaluation Report 2011
but only to the same levels as before the Thirsty Thursday restrictions were revoked. However, the Liquor Supply Plan and AMP appeared to have produced substantial decreases in public order incidents and public drunkenness.
Have the measures been effective? The second reading speech by then Indigenous Affairs Minister Mal Brough noted that the purpose of the alcohol restrictions was to reduce the use and supply of alcohol in NTER communities to help the communities ‘stabilise’ and give them a chance to ‘recover’ from the harms, particularly to women and children, resulting from alcohol use.434 The effectiveness of the measure can therefore be determined by whether there are indications that any increases in alcohol use preceding the restrictions were stemmed and perhaps reversed, and whether there are any indicators that the harms resulting from alcohol use have been reduced.
As noted above, 79 per cent of the NTER communities were ‘dry’ communities that already had alcohol restrictions in place before the NTER, while others had AMPs to reduce alcohol-related harms. One important factor to consider in relation to the effectiveness of the NTER measures is whether they were necessarily more effective than the arrangements that preceded them or whether they impacted detrimentally on those communities that already had restrictions or management plans in place. This is important, too, given the Australian Government’s policy position that the blanket restrictions were necessary because the alcohol-related measures in place prior to the NTER were ‘far from adequate’.
In a submission to the NTER Review Board, the Northern Territory Government contended that the way in which the NTER legislation overlaid the existing Northern Territory Liquor Act resulted in ‘confusion and frustration at poorly targeted and ineffective restrictions’.435 Other submissions to the NTER Review Board stated that large numbers of people were continuing to drink outside the prescribed areas, in many cases forming ‘drinking camps’ at the border of the community or at the edge of the prescribed area at the point where the alcohol restrictions ceased to apply. There were reports in the submissions and in the media of people from remote communities travelling into regional towns where there were no restrictions, taking their families with them. This was reported to have increased demand on shelters and community organisations as women and children were left without adequate means of support. The NTER Review Board heard that in some cases children were being taken to unsafe drinking areas, while in some communities children were being left without care for long periods while parents travelled long distances away from the community to drink. There were also reports of increased alcohol-related violence and other anti-social behaviour in the larger towns resulting from people from NTER communities coming there to drink.
The board received submissions contending that, while alcohol consumption had decreased, this was due more to income management measures that reduced the amount of money people were able to spend on alcohol than the alcohol restrictions. The board heard evidence from many communities that the alcohol restrictions had been accompanied by an increase in illicit drug use, particularly of cannabis. There were concerns about the growing use of cannabis and its financial, behavioural and mental health impacts. At the same time, the NTER Review Board heard that some communities felt that women and children were safer as a result of the alcohol restrictions and that some communities welcomed the reduction in alcohol-related noise, disturbance and antisocial behaviour.
434 M. Brough, Second reading speech: National Northern Territory Emergency Response Bill 2007, House of Representatives, Parliamentary Debates, 7 August 2007, Australian Government, Canberra, p. 13. 435 NTER Review Board, op. cit. It is noted that some provisions of the NT Liquor Act relating to permits to sell alcohol continue to apply.

Promoting law and order
Northern Territory Emergency Response: Evaluation Report 2011 181
The NTER Review Board concluded that, despite the problems and ‘shortcomings’ of the alcohol-related legislative arrangements, the restrictions should remain in place.436 The board highlighted the importance of the restrictions operating as part of a more holistic set of strategies, covering supply, demand and harm reduction together with appropriate support services. The board also recommended that the Australian Government review the identification and information requirements for people buying large quantities of takeaway alcohol, as it was not satisfied there was any evidence to show that those requirements were effective or capable of being usefully monitored.
Police data
The analysis of NT Police data in Appendix 5 shows there were increases across most offence categories concurrent with the implementation of the NTER, including for alcohol-related offences. There were clear increases in offences directly related to the consumption of alcohol, including offences created by the NTER alcohol restriction laws. While alcohol restrictions were in place in many of the communities that became affected by the NTER, the increase in alcohol-related offences recorded by police, particularly offences that directly related to the alcohol restrictions introduced through the NTER, suggests that there was a higher level of enforcement of alcohol restrictions after the NTER than there was previously.
Alcohol sales data
Wholesale alcohol supply data can provide a high-level indicator of the amount of alcohol being consumed across an area and the extent to which consumption has changed overtime. Alcohol wholesale supply data published by the NT Department of Justice437 shows changes in supply that take into account the estimated alcohol content of different forms of alcohol. The data show a 53 per cent decrease in cask wine supply in the period from 2006 to 2009. In the Northern Territory ‘balance’ (that part of the Northern Territory that is not the major towns), there was a 28 per cent reduction in cask wine supply from 2007 to 2009, while from 2006 to 2009 there was a 38 per cent increase in bottled wine supply. While the overall supply of beer in the Northern Territory balance remained almost unchanged from 2002 to 2009, there was a trend towards consumption of lower alcohol beers. The amount of full-strength beer reduced by 18 per cent from 2006 to 2009, while supplies of mid-strength beer increased by 23 per cent and supplies of low-strength beer increased by 62 per cent. Overall, it appears there have been changes in alcohol use in the Northern Territory in recent years, including a shift away from cask wine and full-strength beer towards bottled wines and reduced-strength beer.
While decreases in the supply of cask wine and full-strength beer partly coincided with the introduction of the NTER, it is important to recognise the other initiatives that may have had a greater impact on wholesale alcohol supply. The NT Department of Justice has attributed at least some of the reductions to the impacts of the Alice Springs Liquor Supply Plan and the Katherine voluntary liquor restrictions (both introduced in 2006), the Tennant Creek Liquor Supply Plan introduced in 2007 and cask wine restrictions implemented in Nhulunbuy in 2006.438 The ‘alcopops’ tax introduced by the Australian Government in 2008 appears to have contributed to a large decrease in pre-mixed spirits during the 2007 to 2009 period. Sales of wine in four-litre casks were banned throughout the Northern Territory from 1 January 2011.
436 NTER Review Board, op. cit. 437 Northern Territory Department of Justice, Northern Territory wholesale alcohol supply for the period 2002 to 2009, Northern Territory Department of Justice, Darwin, 2011. 438 ibid. These attributions have not been independently examined or tested for this review.

Promoting law and order
182 Northern Territory Emergency Response: Evaluation Report 2011
Surveys
The annual survey of Government Business Managers (GBMs) conducted as part of the NTER evaluation framework showed that, in the first year after commencement of the NTER, GBMs in 58 per cent of communities reported no change in alcohol use, while 24 per cent reported a decrease in consumption.439
The CSWRS conducted by FaHCSIA examined community attitudes to the alcohol restrictions.440 Across all communities, just under one-quarter (24%; n = 315) of respondents said the ‘new grog rules’ had made a big difference to safety in the community, while a similar proportion (20%; n = 323) said they made ‘a little bit’ of difference. Only 6 per cent (n = 78) thought the restrictions had made community safety worse, while 19 per cent (n = 255) thought they made no difference to community safety. Thirteen per cent of respondents (n = 174) answered ‘don’t know’ to whether the alcohol restrictions had made a difference; 15 per cent (n = 198) did not answer the question.
Another question in the CSWRS specifically examined changes in alcohol use by asking respondents their level of agreement with a statement that, in the respondent’s community, people were drinking less than three years ago. While there are many reasons for people drinking less, including other NTER measures such as income management or a range of non-NTER factors, a perceived reduction in drinking could be one indicator pointing to the effectiveness of the alcohol restrictions.
Just under one-quarter (24%; n = 320) strongly agreed that people were drinking less, while a further one-third (33%; n = 449) agreed ‘a bit’ with the statement. Just over one-fifth of respondents (21%; n = 281) disagreed that people were drinking less, while a little over one-tenth (11%; n = 145) strongly disagreed. The remainder either did not know or chose not to answer the question. Therefore, of those respondents who indicated a level of agreement or disagreement with the statement, over half (57%) agreed or strongly agreed that people in their community were drinking less than previously, while just under one-third (32%) disagreed or strongly disagreed that people were drinking less. This suggests there were a very mixed impact within and between communities and widely differing views on the impact of the alcohol restrictions, perhaps reflecting the diversity of alcohol misuse issues and contexts across the communities. Further investigation could be valuable in examining the basis for these differing views. It could be hypothesised that the existence and effectiveness of AMPs could be one factor influencing these views.
Similar results were found in the study conducted by the Central Land Council across six NTER communities, which found that just over one-half (57%) of respondents thought alcohol consumption in their community had reduced since the NTER.441 Just over one-third (37%) felt that alcohol consumption was about the same. Respondents identified a number of reasons for reduced alcohol consumption, including the alcohol restrictions (‘grog running laws’), increased policing and income management.
The research study conducted by Pilkington, the North Australian Aboriginal Justice Association and the Central Australian Aboriginal Legal Service442, which primarily covered the attitudes of community residents to the introduction of Themis police stations, also considered a range of issues related to the NTER alcohol restrictions, as those arose
439 FaHCSIA, Northern Territory Emergency Response monitoring report: Measuring progress of NTER activities, August 2007 to 30 June 2008, op. cit. 440 G. Shaw and P. d’Abbs, op. cit. 441 FaHCSIA, Northern Territory Emergency Response monitoring report: Measuring progress of NTER activities, July to December 2008. 442 J. Pilkington, op. cit.

Promoting law and order
Northern Territory Emergency Response: Evaluation Report 2011 183
frequently during the research process. The laws introduced with the restrictions created powers enabling police to conduct random searches of people or vehicles in public places throughout the Northern Territory. Some community members and other informants were concerned that some police officers were abusing those powers and conducting what they saw as unreasonable searches of houses, without warrants or cause.
Respondents and informants were also concerned about the way the NTER alcohol laws replaced the restrictions and enforcement practices that had been in place under the restrictions that had applied to 12 of the 14 surveyed communities before the NTER, and how this had contributed to unsafe behaviours. The issues raised were similar to those heard by the NTER Review Board, including the creation of drinking camps far away from communities, drink-driving, binge drinking, sly grogging and the breaking down of conventions that had existed and which tended to promote responsible drinking. The author argued that ‘The NTNER Act appears to have also undone functioning community-owned systems to regulate alcohol consumption where they existed.’443
Some respondents to FaHCSIA’s service provider survey suggested that the earlier arrangements were more effective; one suggested that they were ‘previously handled better, more community ownership’444, while another suggested that the NTER alcohol restrictions had not had any impact as they did not address the fundamental issue of individual drinking problems and only made the problem drinkers go somewhere else.445
Conclusions While the clear link between alcohol misuse and the high levels of violent and antisocial behaviour in many Northern Territory communities strongly suggests the need for an appropriate government response, restrictions and plans were in place in many NTER communities before the NTER came into being. The high rates of alcohol-related offending that existed in communities under the previous alcohol restrictions suggest that those restrictions and/or the arrangements to support them were not fully effective. The situation that existed before the NTER, in which restrictions were sought by communities and there was limited policing in place to enforce them, if indeed they were enforceable by police, was replaced by the NTER measures. The greater levels of recorded alcohol-related offences following the NTER suggest that the increased policing presence and broad and consistent alcohol laws introduced through the NTER have led to restrictions being more effectively enforced.
Since the introduction of the NTER measures, there appears to have been less cask wine and less full-strength beer consumed in NTER communities, linked to restrictions on the sale and availability of those products. This has been accompanied by an increased perception of safety and of reduced alcohol consumption among a majority of people. Given both the perceived and demonstrated reduction in alcohol consumption, the increase in alcohol-related offences since the introduction of the NTER measures probably indicates greater enforcement of restrictions, assisted by the deployment of additional police. It is possible that the scope of the restrictions, which established more uniform laws across larger areas of the Northern Territory than previously, are more practical to enforce and, together with increased police, have led to enforcement on a greater scale than was possible previously.
443 ibid, p. 185. 444 J. Putt, S. Middleton, J. Yamaguchi & K. Turner, op. cit., p. 62. 445 ibid.

Promoting law and order
184 Northern Territory Emergency Response: Evaluation Report 2011
The evidence that the NTER restrictions changed behaviour in communities, for instance through the creation of drinking camps or people travelling long distances to regional centres to drink, is open to a number of interpretations. Reports show that some community members and service providers have seen these behaviours as unintended negative consequences of the NTER. It is not clear from the evidence to what extent this has occurred. It must be acknowledged that in some circumstances it is possible for the creation of drinking camps to create a more manageable situation for alcohol misuse—it may concentrate drinking behaviour in a particular location, making that behaviour more amenable to monitoring and observation by police, night patrols and other services. Further, it may be that shifting drinking behaviour away from communities can improve the safety of women and children in those communities, as alcohol-related violence may be less likely to occur in and around the home. Survey results show that, overall, people in NTER communities feel safer than they did before the NTER measures were introduced, although there is a diversity of opinion as to whether people are drinking less.
The NTER alcohol restrictions were implemented with the aim of helping to create stability in communities by restraining and reducing the misuse of alcohol. This would then create a basis for more localised AMPs to be developed and established. It appears that in many communities there is a perception that people are drinking less, although the presence of police to enforce the alcohol laws may have influenced that perception. The demonstrated success of AMPs on Groote Eylandt and Bickerton Island, which relied to a great degree on active community involvement, highlights the importance of community ownership and close engagement with communities in reducing alcohol use problems as well as the importance of ensuring appropriate treatment services are available for people with alcohol issues.
Pornography restrictions
What was done The Northern Territory Board of Inquiry into the Protection of Aboriginal Children from Sexual Abuse, in its Ampe Akelyernemane Meke Mekarle: ‘Little children are sacred’ report, recognised potential relationships between the use of pornography and the sexual abuse of children in remote Indigenous communities.446 It recommended an education campaign to inform Indigenous communities about the Australian media classification system, offences that could arise from exposing children to indecent material and the potential harm to children of seeing sexually explicit material. This was recommended as part of a wider strategy to educate the community about child maltreatment and violence, their impacts and the need to prevent their occurrence.447
Through the NTER, the Australian Government sought to limit the impacts of pornography in prescribed areas through legislation that made it an offence to possess and/or supply:
• publications classified Category 1 restricted or Category 2 restricted
• films classified X 18+
• Refused Classification material.
This legislation came into effect in the very early stages of the NTER. During the first phase of the NTER, assessments were conducted of 44 locations (including petrol stations, roadhouses, video stores and adult shops) to ensure they were complying with the new
446 R. Wild & P. Anderson, op. cit. 447 ibid.

Promoting law and order
Northern Territory Emergency Response: Evaluation Report 2011 185
restrictions.448 The information available for this review does not indicate the rate of compliance found through those assessments.
Linked to the pornography restrictions, further new legislation required persons in control of publicly funded computers to take specified steps to prevent those computers being used to access sexually explicit and other illegal materials. The legislation provided for regular audits of publicly funded computers located in prescribed areas, to ensure compliance.
Assessing the measure The program logic developed for the NTER measures in 2010 identified the immediate outcome of the pornography restrictions as simply ‘less porn’.
While not a part of the NTER and developed as a separate response to concerns raised in the ‘Little children are sacred’ report and elsewhere about the use of pornography in Northern Territory Indigenous communities, a campaign developed by the NT Department of Justice around the same time as the NTER was implemented sought to raise awareness of the Australian media classification system and issues relating to pornography. The campaign was funded by the Australian Government, through FaHCSIA, and may have played a role in influencing the response of Indigenous people in the Territory to the pornography restrictions. Workshops conducted through the campaign included elements that focused on the restrictions introduced through the NTER and the consequences for breaching them, together with other elements that aimed to increase understanding about the Australian media classification system and the potential harms of exposing children to pornography.449 The campaign was the subject of a process review by the AIC.450
While it was not possible to evaluate the impacts or outcomes of the campaign, the AIC’s review concluded that the NT Department of Justice had followed an appropriate process for developing and implementing the campaign, including undertaking extensive consultation with Indigenous representatives and stakeholders. Consequently, the review determined that the campaign was likely to have increased awareness and understanding about the media classification system and pornography among those attending the workshops and, through the sharing of information and understanding, others in the community. That review contributed to the NT Department of Justice receiving further funding from FaHCSIA to continue the campaign. The second iteration of the campaign is the subject of a current impact evaluation by the AIC, to be finalised in the first half of 2012.
The NTER Review Board report noted police concerns about the difficulties in enforcing the pornography restrictions, leading to the very small number of resulting offences.451 The board also heard from many community members who felt the signs erected at the entrances to communities advertising the alcohol and pornography restrictions tended to shame and label Aboriginal people as alcoholics and paedophiles and that, while they may have had some deterrent effect on visitors carrying alcohol and pornography, they had no useful effect in deterring local people. Community members also expressed concerns that the information on the signs was overly complex and not accessible to people without strong English reading
448 FaHCSIA, Northern Territory Emergency Response monitoring report: Measuring progress of NTER activities, August 2007 to 30 June 2008, op. cit. 449 C. Bryant & M. Willis, Pornography awareness: A process of engagement with Northern Territory Indigenous communities, technical & background paper no. 34, Australian Institute of Criminology, Canberra, 2008. 450 ibid. 451 NTER Review Board, op. cit.

Promoting law and order
186 Northern Territory Emergency Response: Evaluation Report 2011
skills, and that the costs of establishing the signage could have been better spent if communities had been better consulted.452
Data
Pornography restrictions
NT Police data analysed for this review included incidents and offences related to breaches of the pornography laws that were acted on by police. Across the period from 1 July 2007 to 31 December 2010, only a small number of offences were recorded. There were 44 incidents during that period in which the confirmed incident description related to potential pornography. Of those, 77 per cent related to the possession of prohibited material in a prescribed area, 16 per cent related to child abuse material and 7 per cent pertained to the possession of unclassified adult material.
The 44 incidents resulted in 47 pornography-related offences. Of those, 11 per cent (n = 5) related to child pornography offences and hence fall into the category of sexual assault and related offences. The remaining 95 per cent of offences (n = 42) were censorship offences (public order offences). They primarily related to the possession/control of prohibited materials (n = 39; 83%). There were a small number of offences that related to the possession/selling of unclassified films. There is a clear intervention effect, as only one pornography-related offence occurred in the period prior to the NTER. The increase in offences is best modelled by a combination of a step-wise increase in offences, and a gradual increase in offences since July 2007 (that is, the number of such offences jumped sharply after the introduction of the NTER, but numbers of such offences have continued to climb), although this is in the context of small overall numbers.
Almost one-third (32%) of pornography offences were encountered in incidents relating to other matters, including drug offences and warrant executions. That is, it appears that police came across prohibited materials incidentally while dealing with other matters. This is not to say that the enforcement of the pornography restrictions was not a priority for police or that they did not actively enforce the restrictions. Rather, it may be that there was not a lot of illegal use or distribution of pornography occurring. The results may also be indicative of the privacy that tends to accompany pornography use and makes it less amenable to proactive enforcement than, say, public use of alcohol.
While interpretation of these results would be aided by considering comparable data from communities in other areas of Australia, those data are not available. However, it is noted that across Australia in 2009–10 a total of 165 defendants (both Indigenous and non-Indigenous) were prosecuted in magistrates’ courts for a principal offence involving child pornography.453 This represented 0.03 per cent of the over 500,000 Indigenous and non-Indigenous defendants prosecuted in that year, indicating that child pornography offences are relatively rare compared with many other offence types. Data specifically identifying matters finalised in Northern Territory courts for child pornography offences were not available for this review. However, in 2009–10, there were only 14 defendants finalised in Northern Territory magistrates’ courts for a principal offence of sexual assault and related offences, the category
452 ibid. 453 ABS, Criminal courts, Australia 2009–10, cat. no. 4513.0, ABS, Canberra, 2011.

Promoting law and order
Northern Territory Emergency Response: Evaluation Report 2011 187
that includes child pornography offences as well as the more common offences of aggravated sexual assault and non-aggravated sexual assault.454
Audit of publicly funded computers
Linked to the pornography restrictions, further new legislation required persons in control of publicly funded computers to take specified steps to prevent those computers being used to access sexually explicit and other illegal materials. The legislation provided for regular audits of publicly funded computers located in NTER communities to ensure compliance with the legislation.
Provisions of the NTNER Act introduced a scheme of accountability intended to prevent and detect misuse of publicly funded computers in the prescribed areas of the Northern Territory. The provisions applied to the person in control of a publicly funded computer. The explanatory memorandum accompanying the legislation advised that the computers would be audited to determine whether they contain, or have been used to access, illegal material. In addition to banned sexually explicit material, illegal material may include instances of other misuse, such as stalking, fraud, breaches of privacy or breaches of copyright.
In order to comply fully with the legislation, in addition to six-monthly audits, a responsible person was required to install and maintain a content filter designed to prevent and/or record access to illegal material, maintain an acceptable use policy covering all users, notify users that all use could be audited and keep records that identify each user.
To date, responsible persons have been required on six occasions to report to FaHCSIA on their compliance with the relevant provisions of the NTNER and to conduct an audit of their publicly funded computers. Organisations have had 14 days to complete the audit response or provide a declaration that their computers are not ordinarily situated in a prescribed area. Data on each of the audits, the numbers of organisations responding and the number of organisations that were compliant is shown in Table 5.4.
Under subsection 29(5) of the NTNER Act, the outcome of the audit of a publicly funded computer is provided to the Australian Crime Commission and it may either be used by the commission for intelligence or other law enforcement purposes, or passed on to a relevant law enforcement agency for investigation. Investigations of possible breaches of classification and other laws are the responsibility of law enforcement agencies. Whether or not a matter can proceed to prosecution will depend on a large number of factors, including public interest considerations and statutory limitation periods.
The number and type of organisations involved in the audits have varied between audits due to:
• the introduction of shire reforms on 1 July 2008, which amalgamated a number of organisations
• the formation, dissolution and amalgamation of organisations between audits
• some organisations declaring that they no longer have publicly funded computers, or do not have computers connected to the internet.
454 ibid. In 2009–10, there were 1,298 defendants prosecuted in Australian magistrates’ courts for sexual assault and related offences; 48 per cent (n = 626) were for aggravated sexual assault, 20 per cent (n = 260) for non-aggravated sexual assault, 4 per cent (n = 47) for non-assaultive sexual offences against a child and 13 per cent (n =165) for child pornography offences.

Promoting law and order
188 Northern Territory Emergency Response: Evaluation Report 2011
Table 5.4 Summary of results of audits of publicly funded computers
Type No.
contacted No.
responded No. fully
compliant %
responded
% fully compliant (of respondents)
No. of computers
audited May 2008
Organisations 161 61 26 38 43 421 November 2008
Organisations 62 59 49 95 83 Shire centres 51 49 40 96 82 758
May 2009 Organisations 62 53 31 86 58 Shire centres 48 33 24 69 73 577
November 2009 Organisations 58 40 24 69 60 Shire centres 49 29 4 59 14 510
May 2010 Organisations 62 46 36 74 78 Shire centres 50 27 17 54 63 790
November 2010 Organisations 62 44 26 71 60 Shire 6 6 5 100 100 Shire service centres 5 1 1 20 100
862
Source: FaHCSIA, unpublished data and information from FaHCSIA administrative records on the conduct of publicly funded computer audits, provided on request for this review, 13 October 2011.
Response rates have varied between audits. FaHCSIA has sought to improve response rates through the introduction of new auditing software for the second audit, reportedly increasing the detection of inappropriate material, and education to improve understanding of the audit requirements before the May 2010 audit. This education campaign has been linked by FaHCSIA to the increased rate of compliance seen in the May 2010 audit. The NTER Review Board had noted that problems with compatibility of the computer software required to run the audit had caused delays in compliance. Information provided for this review indicates there has not been consistent follow-up action taken against non-responsive organisations, which may have contributed to reduced response and compliance rates.
Audit findings are analysed by the Australian Crime Commission, which provides summary confidential findings from audits and investigations to FaHCSIA. FaHCSIA has advised the authors that these reports have identified a number of breaches in each audit and have indicated that prohibited material has been accessed using publicly funded computers, including multiple breaches by some organisations. There has been some action taken by the Australian Crime Commission or another law enforcement agency in response to these breaches. The authors are not able to give details of the action taken or make any assessment of whether this action was appropriate.
Audit requirements define full compliance has having an accredited software filter in place, maintaining usage logs, having a user policy in place and having a declaration form signed by the Responsible Officer. Reasons for noncompliance with audit requirements may include a lack of follow-up action, filters no longer being provided for free and organisations reporting that they do not have the resources to supervise and maintain user logs of every public access terminal on their system. Further research, involving the relevant organisations and law enforcement agencies, would be needed to properly investigate the factors influencing compliance.

Promoting law and order
Northern Territory Emergency Response: Evaluation Report 2011 189
Conclusions The data provided by FaHCSIA on audits of publicly funded computers show that there have been decreasing and plateauing levels of response and compliance with the audit. A question remains regarding the extent to which a lack of follow-up action influences levels of response and compliance. While it is acknowledged that only limited information about the audit findings and responses to breaches has been made available for this review, it remains unclear whether follow-up actions and responses may have effectively supported the aims of the legislation.
It is not known to what extent there are problems with publicly funded computers being used to access restricted and explicit material. The limited information available suggests there has only been a small number of breaches, but does not indicate the extent of the material that has been accessed or whether that material has been distributed to Indigenous community members. It is yet to be determined whether law enforcement responses have been successful in addressing breaches. Further research into the effectiveness of the audit process and follow-up actions is warranted.
Night patrols
What was done Night patrol services are community-operated services aimed at preventing antisocial and violent behaviours through culturally appropriate interventions using conflict resolution and drawing on local knowledge and understanding. They are distinct and separate services from police. Night patrols, often known as ‘community patrols’, seek to complement rather than replace policing and other law enforcement measures provided by the state and rely on cultural and community acceptance of their service and authority, rather than the coercive powers and legally sanctioned authority of police.455 Some of the ways night patrols assist communities are by working preventively through community safety plans, as well as responding to prevent potentially violent situations from manifesting or escalating; taking at-risk persons, such as those who are intoxicated, to safe and appropriate places; and providing at-risk persons with information and referrals, such as to health and alcohol services and refuges.456 While there are no simple definitions of what role a night patrol adopts, the services it provides or the way it interacts, it is in the patrol’s ability to work appropriately in crime prevention at the local level to meet individual and community needs that their real value is found.457
Prior to the NTER, night patrols operated in 23 remote Northern Territory communities, supported by funding from the Australian Government Attorney-General’s Department (AGD) and having recently transitioned from a program largely supported by Community Development Employment Program workers. The NTER provided additional funding to establish night patrols in a further 50 communities, with existing night patrols transitioning to a new regional service delivery model that involved local patrols organised regionally. The AGD had provided funding for night patrols in all 73 NTER communities by mid-March 2008, and by 30 June 2008 there were 31 night patrols in operation while those in the remaining 42 communities were at a consultation phase.458 By December 2009 there were active night
455 H. Blagg & G. Valuri, An overview of night patrol services in Australia, Attorney-General’s Department, Canberra, 2003. 456 L. Beacroft, K. Richards, H. Westropp-Evans & L. Rosevear, Community night patrols in the Northern Territory: Toward an improved performance and reporting framework, technical & background paper no. 47, Australian Institute of Criminology, Canberra, 2011. 457 ibid. 458 FaHCSIA, Northern Territory Emergency Response monitoring report: Measuring progress of NTER activities, August 2007 to 30 June 2008, op. cit.

Promoting law and order
190 Northern Territory Emergency Response: Evaluation Report 2011
patrols in 80 communities, including 72 of the 73 NTER communities, and these patrols still continue as of 30 June 2011.459,460,461
Assessing the measure The program logic developed for FaHCSIA in 2010 identified the immediate outcome sought from night patrols as that there would be night patrols at high-risk times and places. The night patrol measure shared the intermediate outcomes identified for all the law and order measures, as set out above. One of the identified intermediate outcomes specifically related to night patrols removing people from violence.
The AIC has recently completed a project for the AGD aimed at developing an improved performance and reporting framework for night patrol operations.462 The program logic developed for the AIC’s project to develop an improved performance and reporting framework for night patrols463 identified two immediate outcomes for the AGD-funded night patrol program:
• well-targeted and locally respected community night patrols delivering core services effectively
• knowledge from community about safety captured and reported.
These were seen to lead to intermediate outcomes:
• Community takes greater responsibility for safety
• Services related to community safety are more effective
• Reduction in repeat assistance to individuals or repeat incidents.
The AIC program logic identified a number of other immediate outcomes for individual night patrols (as opposed to the overall program). They included:
• Community respects night patrol, which captures and reports on local community safety solutions
• There is effective support to and from other services, together with facilitating mechanisms
• Night patrol achieves key crime prevention actions in a way that is lawful, non-coercive and culturally appropriate
• Targeted assistance with incidents and vulnerable individuals.
Data
While night patrols have been in operation in the Northern Territory since the 1980s, there is little information available to assess their impacts and outcomes. Data are currently collected by the AGD; however, the data are not complete for some areas, do not cover all the activities the patrol services undertake, including much of their core business in crime prevention, and are not collected in a form that allows regular analysis. In the future, the improved performance framework developed by the AIC should help to provide more comprehensive and detailed data on the night patrols’ operations and impacts.
459 FaHCSIA, Closing the gap in the Northern Territory: Monitoring report, July to December 2009, op. cit. 460 FaHCSIA, Closing the gap in the Northern Territory: Monitoring report, July to December 2010, op. cit. 461 FaHCSIA, Closing the gap in the Northern Territory: Monitoring report, January to June 2011, op. cit. 462 L. Beacroft, K. Richards, H. Westropp-Evans & L. Rosevear, op. cit. 463 ibid.

Promoting law and order
Northern Territory Emergency Response: Evaluation Report 2011 191
As noted, there are few data available directly relating to night patrol activities. Some limited information is available through FaHCSIA’s monitoring reports on the NTER and Closing the Gap measures. This is based on data collected by the AGD and so carries the limitations referred to above. The available information on the number of people transported by night patrols is shown in Table 5.6. Leaving aside aspects of the accuracy and coverage of the data, the transportation of people, whether to their homes, to service providers or to other places of safety, is clearly only one of the many activities undertaken by night patrols.
Table 5.6 People transported by night patrols, Northern Territory, July 2008 to January 2011
Period People assisted—total People transported to safe
houses/places 01/07/08 – 31/12/08 36,220 n.a. 01/01/09 – 31/03/09 39,000 n.a. 01/07/09 – 31/12/09 30,427 550 01/01/10 – 30/06/10 45,741 730 01/07/10 – 31/12/10 49,984 359 01/01/11 – 30/06/11 54,695 5,155 Sources: FaHCSIA, Northern Territory Emergency Response monitoring report: Measuring progress of NTER activities, August 2007 to 30
June 2008; FaHCSIA, Northern Territory Emergency Response monitoring report: Measuring progress of NTER activities, July 2008 to December 2008, parts 1 and 2; FaHCSIA, Closing the gap in the Northern Territory: Monitoring report, July–December 2009; FaHCSIA, Closing the gap in the Northern Territory: Monitoring report, January–June 2010; FaHCSIA, Closing the gap in the Northern Territory: Monitoring report, July–December 2010; FaHCSIA, Closing the gap in the Northern Territory: Monitoring report, January–June 2011; FaHCSIA.
It should be noted that the action of transporting people to places of safety does not necessarily imply that the transport was from a place that was not safe. However, generally speaking, transportation will have been from a place carrying a degree of risk, such as a drinking camp or a street environment at night, to a place that had no or less risk, such as a home. In other cases, a person will have been transported to a service such as to a refuge or clinic if necessary.
These broad data suggest that, at least at a basic level, night patrols are achieving their intended outcome of intervening with people at risk, including by transporting and referring people to places of safety. The proportion of people assisted and the types of incidents in which the night patrols intervened cannot be discerned. However, the observation that the night patrols transported around 50,000 people in 80 communities in the six months to the end of December 2010 (an average of approximately 24 people each week in every community) does suggest that night patrols are performing a high level of service in response to a high level of demand. It is reasonable to conclude that this level of demand existed before the night patrols came into operation and that the night patrols are meeting a previously unmet need.
Police data are of little informative value in relation to night patrols. While there may be many incidents where police attend after being notified of an incident by the night patrol, police data identify the type of incident involved (such as disorderly behaviour or a domestic disturbance) rather than noting it as a referral from a night patrol. Across the entire NT Police dataset used for this review, only two incidents were recorded with an incident type referring to a night patrol.
Audit
An audit undertaken by the Australian National Audit Office (ANAO) in 2010 assessed the administrative effectiveness of the AGD’s management of the Northern Territory Night Patrols

Promoting law and order
192 Northern Territory Emergency Response: Evaluation Report 2011
Program.464 The audit extended beyond the NTER-related night patrol implementation, but is nonetheless useful in helping an understanding of how night patrols were implemented through the NTER.
The audit found that the AGD was able to effectively upscale the night patrol program from a relatively small and locally focused program to one covering all the NTER communities within the very short timeframes required by the NTER and in the context of the wide range of other initiatives underway or being established at the same time. In order to meet implementation timeframes, the AGD had to apply a common service delivery approach to all communities, which potentially reduced the ability of each night patrol to work effectively in the context of its local community. The ANAO noted, however, that the AGD was gradually modifying the service delivery approach to adapt the services to their communities and their needs.
The ANAO noted that the realities of the service delivery environment in which night patrols operate make it difficult for them to fully work in with other services and to meet their aims of providing information, support and referrals to other services. Given the diversity of the communities the AGD night patrol program covers, and the challenges of geography, the ANAO noted the difficulties in establishing a consistent understanding across communities of what night patrol services can provide. However, the ANAO noted the critical importance of community involvement and support to the success of night patrol services, as well as the importance of relationships between night patrols and the police. Community members and other stakeholders felt the patrol service was more effective where patrollers felt supported by police and police were able to work with patrollers in culturally appropriate ways to support the policing function. The ANAO also noted that the data collected by the AGD, while not utilised as well as it could be, indicated that the service was being heavily used across the Northern Territory.
Surveys
Surveys of GBMs showed that in just under two-thirds (61%) of communities with a night patrol the GBMs felt the service was adequate, in that it was sufficiently resourced and operated well in conjunction with the community and police. Concerns cited by remaining GBMs included issues with staff numbers, training, management, authority and accountability.465 However, it should be noted that these surveys were undertaken in 2007–08 at a time when night patrols were yet to be established in many communities.
A question in FaHCSIA’s CSWRS asked respondents whether they felt that the better night patrols had made a difference to safety in their community.466 Across all communities surveyed, close to one-half (43%; n = 582) of respondents felt that better night patrols had made ‘a big difference’ to safety in their community, while a further 32 per cent (n = 423) felt they had made ‘a little bit of difference’. Seventeen per cent (n = 225) felt that better night patrols had made no difference, but only 3 per cent (n = 45) felt they had made community safety worse. The proportions of people indicating that night patrols had improved community safety were much higher than for the other six measures included in the same question, which related to safe houses, alcohol restrictions, pornography restrictions, increased police and greater activities for young people. In a separate question in the CSWRS, respondents who felt that night patrols had made a big difference to community safety where more likely to perceive other people in their community as being safe all or most of the time than were those who thought night patrols had made no difference.
464 ANAO, Northern Territory night patrols, audit report no. 32, ANAO, Canberra, 2011. 465 FaHCSIA, Northern Territory Emergency Response monitoring report: Measuring progress of NTER activities, August 2007 to 30 June 2008, op. cit. 466 G. Shaw and P. d’Abbs, op. cit.

Promoting law and order
Northern Territory Emergency Response: Evaluation Report 2011 193
FaHCSIA’s service provider survey also indicated support for night patrols, particularly in remote communities; 46 per cent of respondents who answered in relation to remote communities they worked in said the patrols had made community safety a bit better, and a further 21 per cent said the patrols had made it a lot better. There were lower levels of support in towns, and one respondent questioned the effectiveness of the patrols, suggesting they appeared to ‘act as a taxi service for friends and not much else!’467 However, the more common view appeared to be reflected in a comment by another respondent, who said the ‘night patrol is very good. They are proactive in their job’.468
Conclusions While it is clear that night patrols are highly valued across NTER communities and are, overall, seen as clearly linked to improved community safety, the data and other information available do not allow conclusions to be drawn as to whether they are actually bringing about tangible improvements and whether they are as effective as they are perceived to be. Police data are not able to provide an indication of whether night patrols are contributing to reductions in violent crime or the number of Indigenous people coming into contact with the criminal justice system. This may be because the benefits that night patrols bring are through their contribution to community safety planning and referral to the other services, and by creating a feeling that dangerous situations are less likely to occur, or helping people feel assured that there is a source of support that will keep them safe, rather than directly reducing offending behaviour.
As discussed above, NT Police data show increases in most offences, including violent offences, concurrent with the introduction of new police stations and additional police in many communities. The effect of these new policing arrangements on recorded offences may have obscured any night patrol-related changes that may otherwise have appeared in the data. Given that it has taken some time for night patrols to be established in some communities, it may be too early for them to have reached peak operational effectiveness.
There remains a need for reliable and comprehensive data on night patrol services, although the AGD has taken steps to rectify this situation through the work undertaken by the AIC on developing a performance framework. Over time, this should help to build the kind of data needed to more effectively assess the effectiveness of night patrols.
Despite the limitations imposed by the available data, it is apparent that communities have responded very positively to night patrol services and see them as directly contributing to improvements in community safety. Studies of community safety and the fear of crime have consistently shown that there can be substantial differences between people’s perceptions and the actual likelihood of offending and victimisation.469 Feeling that night patrols have improved community safety and improving community safety are not necessarily the same. However, it can be hypothesised that the members of small communities are likely to have a reasonable understanding of how the safety environment around them has changed over time, and increased feelings of safety can in themselves be a positive outcome.
For night patrols to meet community safety needs into the future, night patrol service providers should work with local police on building relationships that ensure night patrols maintain a distinct and culturally appropriate contribution to crime prevention and community support, rather than becoming a kind of de facto police service. This was noted by the
467 J. Putt, S. Middleton, J. Yamaguchi & K. Turner, op. cit., p. 61. 468 ibid., p. 64. 469 B. Davis & K. Dossetor, ‘(Mis)perceptions of crime in Australia’, Trends & Issues in Crime and Criminal Justice, no. 396, Australian Institute of Criminology, Canberra, 2010.

Promoting law and order
194 Northern Territory Emergency Response: Evaluation Report 2011
ANAO470 and by the AIC.471 An independent review of policing in remote Northern Territory communities visited some communities where it found the night patrol was working effectively to deal with issues such as alcohol use, youths being out unsupervised at night, drug use and gambling.472 In other communities that the review visited, the night patrol was not considered to be working effectively, if indeed it operated at all. The key difference between these communities appeared, in the opinion of the review authors, to be the extent to which night patrols were able to work closely and regularly with police on community safety issues.
Substance Abuse Intelligence Desk and Dog Operations Unit
What was done SAIDs are an initiative to provide for collating intelligence and coordinating police activity concerned with illicit substances, including trafficking illicit drugs and substances between states, as well as petrol and alcohol misuse. SAIDs were set up to be particularly focused on coordinating substance-related policing activities in the cross-border area of the Northern Territory, South Australia and Western Australia, as well as the Top End. Another priority was enforcement and disruption activities using resources, including DOUs. The Katherine SAID was tasked with supporting the NTER alcohol bans in areas of Northern Australia.
The first SAID was set up in Alice Springs in 2006 to support the National Petrol Sniffing Strategy. A SAID based in Katherine began operating in January 2006, while another in Marla, South Australia, commenced in July 2009. By the end of December 2009, the Katherine SAID had three staff and the Alice Springs SAID had two staff.473 The Katherine, Alice Springs and Darwin DOUs had three, two and one staff, respectively. Combined funding from FaHCSIA for the SAIDs and DOUs in 2010–11 was a little over $3 million, which provided for 10 staffing positions and seven dogs based in the Northern Territory and one staff position based in South Australia.474
Table 5.7 shows the outcomes reported for the SAIDs and DOUs between January and June 2011. The numbers of outcomes achieved by the SAIDs and DOUs are markedly higher in the second half of the year, including in arrests, charges, warrants executed, infringement notices issued and quantities of substances seized. The increases appear to be in part due to Darwin DOU statistics being included from May 2010475 although it is noticeable that the outcomes also markedly exceeded the quantities of cannabis, amphetamines and kava seized in the first 18 months of SAID operations. Seizures and outcomes for the January–June 2011 period, on all measures, are markedly lower than for the July–December 2010 period. Most measures for the January–June 2011 period are similar to or, in some cases, higher than for the same six-month period in 2010. The reasons for the decreased measures from July–December 2010 to January–June 2011 are not clear without further analysis than was possible within the timeframe available for this chapter.
470 ANAO, op. cit. 471 L. Beacroft, K. Richards, H. Westropp-Evans & L. Rosevear, op. cit. 472 Allen Consulting Group, op. cit. 473 FaHCSIA, Closing the gap in the Northern Territory: Monitoring report July to December 2010, op cit. 474 J. Putt, Review of the Substance Intelligence Desk and Dog Operations Unit report, FaHCSIA, Canberra, 2011. 475 ibid.

Promoting law and order
Northern Territory Emergency Response: Evaluation Report 2011 195
Table 5.7 SAID and DOU outcomes for January 2010–June 2011
Activity January–June 2010 July–December 2010 January–June 2011 Arrests 112 231 115 Charges 279 586 269 Search warrants executed 70 234 101 Infringement notices issued 120 281 174 Seizures
Alcohol (litres) 404 2318 1233 Cannabis (kilograms) 16.7 38 24.6 Kava (kilograms) 1078 1034 352.8 Petrol (litres) 2 34 22 Amphetamines (grams) 17 387 66 MDMA (ecstasy) (grams) – 128 22 Other drugs (grams) – 1021 13
Proceeds of crime Vehicles seized 11 16 2 Cash seized 61,900 154,640 113,128
Remote community visits 66 295 221 Sources: FaHCSIA, Closing the gap in the Northern Territory: Monitoring report, January–June 2010; FaHCSIA, Closing the gap in the
Northern Territory: Monitoring report July–December 2010; FaHCSIA, Closing the gap in the Northern Territory: Monitoring report, January–June 2011.
Assessing the measure During the second quarter of 2011, FaHCSIA conducted a review of the SAID and DOU operations.476 The review utilised program and output information, statistical data and interviews with approximately 35 stakeholders. It noted that there is little existing information on patterns of substance misuse in remote areas of Australia, but that the available information suggests that cannabis is the most commonly used illicit drug in the Northern Territory and that there is little use of drugs such as methamphetamines. The review also noted that alcohol remains a much greater problem, in terms of level of use and community impacts, and is the focus of a much greater level of police activity, than illicit substances. This is reflected in other literature477 and is consistent with observations from the analysis of police data in Appendix 5.
FaHCSIA’s review of the SAIDs and DOUs found that their activities were influenced by differing priorities in the north and south of the Northern Territory. Seasonal, geographical and cultural differences, transport routes and patterns of substance use help to shape those priorities.478 The SAIDs and DOUs appear to have good working relationships with other law enforcement bodies, particularly the Australian Crime Commission’s National Indigenous Intelligence Taskforce. As one police stakeholder interviewed for the SAID/DOU review put it:
SAID utterly invaluable, provide an opportunity to develop a global picture of substances flowing into remote communities. Previously had no idea of the size of the problem and intelligence was often after the fact and reactive. There wasn’t an appetite in law enforcement to tackle the issues until SAID lifted the lid. …. GBM + police + SAID leads to good governance and transparency, SAID is providing a capability for police on the ground who intercede. Dogs a crucial component.479
DOU statistics showed that searches by dogs frequently resulted in detections. During 2009–10, 39 per cent of the 1,738 searches resulted in positive responses, meaning that the dogs
476 ibid. 477 For example, B Delahunty & J Putt, The policing implications of cannabis, amphetamine and other illicit drug use in Aboriginal & Torres Strait Islander communities, Monograph 15, National Drug Law Enforcement Research Fund, Hobart, 2006. 478 J. Putt ‘Review of the Substance Intelligence Desk and Dog Operations Unit’ conficential report, Canberra, 2011. 479 ibid.

Promoting law and order
196 Northern Territory Emergency Response: Evaluation Report 2011
had made a detection. For the first half of 2010–11, 24 per cent of the 2,751 searches produced positive responses.480
FaHCSIA’s review examined the impacts of the SAIDs and DOUs on drug crime and drug-related crime, organised crime, public health and public amenity using police data and community safety surveys.481,482 The review concluded that there appear to be changing substance misuse patterns in remote Indigenous communities within the areas of SAID and DOU operations. There have been reductions in petrol sniffing and alcohol use in some communities, and measures such as the introduction of low-aromatic Opal fuel and the NTER alcohol restrictions have contributed to those changes.483 The review found that the main achievements of the SAIDs and DOUs were in the policing of cannabis and kava, through the seizure of substances and apprehension of traffickers, while the intelligence produced by the SAIDs was valued by other law enforcement agencies. Stakeholders interviewed by FaHCSIA felt there would be greater misuse of cannabis and kava in remote communities if not for the work of the SAIDs and DOUs, which were also seen as playing an important role in detecting and deterring criminal networks. The role of the SAIDs and DOUs in coordinating law enforcement responses to illicit substances was seen by stakeholders as valuable, together with their exclusive focus on remote Indigenous communities.
Aside from the review undertaken by FaHCSIA, it is difficult to conclude with any certainty how effective the SAIDs and DOUs have been. Their work appears, on the basis of the FaHCSIA review, to be valued by other law enforcement agencies, and they play a unique role for which there is an easily demonstrated need. Ultimately, it is not possible to fully separate any impacts of the SAIDs and DOUs from the range of other measures and activities undertaken by Australian Government, state/territory government and non-government agencies targeting alcohol and other substance misuse.
The ultimate conclusion of FaHCSIA’s review was that the SAID and DOU initiative can be seen as very effective on most measures of drug law enforcement and intelligence-led policing.484 Given that the impacts of the SAIDs and DOUs cannot be separated from those of other activities, and given the support of stakeholders for the initiative, it seems reasonable to conclude that the SAID and DOU initiative is a worthwhile one that should be maintained.
Legal aid services
What was done
In 2010–11, the Northern Territory Legal Aid Commission, Aboriginal and Torres Strait Islander Legal Services and community legal centres received a total of $2.5 million to meet increased demand arising from the NTER. Legal assistance activities delivered through the three programs include advice, duty lawyer, case work and outreach sessions (including community legal education).
The law types covered include criminal, civil and family law. Legal issues involve child protection, domestic violence, welfare rights (including the new system of income management), housing, tenancy and consumer law. There has been increased demand for assistance relating to unpaid fines, traffic offences, police warrants and sexual offences,
480 ibid. 481 G. Shaw and P. d’Abbs, op. cit. 482 J. Putt, S. Middleton, J. Yamaguchi & K. Turner, op. cit. p.279 483 J. Putt op cit. 484 J. Putt op cit.

Promoting law and order
Northern Territory Emergency Response: Evaluation Report 2011 197
probably resulting from increased policing, along with alcohol and pornography restrictions. Table 5.8 shows the growth in assistance provided through the three legal aid services and indicates the level of demand being met through the services. As of September 2011, approximately 35.5 full-time equivalent staff, additional to previous legal service staff, were being utilised to deliver legal assistance arising from the NTER.
Table 5.8 Assistance provided by NTER-funded legal service providers, July 2008 to June 2011
Period Advices Duty matters Cases Total matters Outreach visits 2008–09 219 213 963 1395 215 2009–10 788 272 2046 3106 289 2010–11 1052 413 1753 3218 303 Source: Attorney-General’s Department, 2011.
Assessing the measure The level of activity appears to have stabilised and reflects the service level that can be achieved within the available funds. However, the three program areas continue to report high levels of unmet need, particularly in remote communities.485
It appears that the impact of the NTER was not realised by legal aid services until 2009–10. Initial difficulties in recruiting staff further hampered the ability of the programs to respond to need.
Northern Territory Aboriginal Interpreter Service
What was done The Northern Territory Aboriginal Interpreter Service (NT AIS) was established in April 2000 with the aim of promoting the human rights of Aboriginal people by assisting those with limited or no English language skills from accessing legal, health and other services.486 An evaluation of the Northern Territory Agreement highlighted the ‘overwhelming support for the need for an NT AIS in the NT’ and the inequities faced by Aboriginal people without strong English language skills seeking to access services.487
The evaluation noted that, from its inception in April 2000, the NT AIS had dealt with more than 5,000 requests for jobs and completed nearly 4,500 interpreting assignments. At the time of evaluation, the NT AIS was conducting around 1,500 interpreting assignments a year. The evaluation noted the involvement of the NT AIS in court rosters, professional development, specialist training and the conduct of an education and awareness program, in addition to the direct provision of translating and interpreting services. The evaluation noted that a number of earlier reviews had been conducted, which had mostly been positive, but also that the NT AIS had been responsive to problems identified in those reviews. Overall, the evaluation found that the establishment of the NT AIS had generated a range of identifiable benefits for Aboriginal people by enabling them to be:
• more effectively and fully represented in legal matters
• more comfortable in legal situations
• better able to provide appropriate information and instructions
485 Attorney-General’s Department, Legal aid funding, professional correspondence with author for the purposes of this review chapter, Canberra, 15 September 2011. 486 Urbis Keys Young, Evaluation of the Northern Territory Agreement, Attorney General’s Department, Canberra, 2004. 487 ibid., p. 17.

Promoting law and order
198 Northern Territory Emergency Response: Evaluation Report 2011
• better placed to access appropriate medical care
• more able to provide information about their health conditions
• in a position to provide fully informed consent to medical procedures.488
Table 5.9 shows the services provided by the NT AIS between July 2008 and January 2011, based on FaHCSIA monitoring reports. There was a clear and steady increase across the period in the number of people seeking access to NT AIS services. It is not possible to assess from the available information the quality of services provided or whether they met client needs.
Table 5.9 Services provided by the Northern Territory Aboriginal Interpreter Service, July 2008 to December 2010
Period People seeking
access Interpreting sessions Interpreting hours Training courses 01/07/08 – 31/12/08 2,518 n.a. 2,387 n.a. 01/01/09 – 30/6/09 2,934 n.a. 1,468 n.a. 01/01/09 – 30/06/09 3,010 n.a. 971 n.a. 01/07/09 – 31/12/09 3,114 2,899 2,066 45 staff 01/07/10 – 31/12/10 3,439 2,049 n.a. 229 01/01/11 – 30/06/11 3,007 n.a. 4,978 n.a. n.a. = not available Sources: FaHCSIA, Northern Territory Emergency Response monitoring report: Measuring progress of NTER activities, August 2007 to 30
June 2008; FaHCSIA, Northern Territory Emergency Response monitoring report: Measuring progress of NTER activities, July 2008 to December 2008, parts 1 and 2; FaHCSIA, Closing the gap in the Northern Territory: Monitoring report, July–December 2009; FaHCSIA, Closing the gap in the Northern Territory: Monitoring report, January–June 2010; FaHCSIA, Closing the gap in the Northern Territory: Monitoring report, July–December 2010; FaHCSIA, Closing the gap in the Northern Territory: Monitoring report, January–June 2011.
Assessing the measure The limited available information shows that the NTER-funded NT AIS has provided a service that is in demand. It is not possible to determine, in the absence of reviews such as those conducted on Aboriginal interpreter services in the past, whether the NT AIS is meeting that demand through quality services that are meeting the needs of those affected by the NTER.
Overall conclusions Overall, the review findings in this chapter suggest that the additional police deployed to Indigenous communities in the Northern Territory through the NTER were a necessary response to high levels of antisocial behaviour and a history of underservicing. The increases in reported offences indicate that the additional police have responded to a previously unmet need and have enforced new legislation. This is most clearly shown in those communities that received a police presence for the first time through the NTER. Survey results show that there is strong support in communities for the police and that large proportions of community members feel safer as a result of the police being in their communities. Survey results also show very strong support for the increased night patrol services: community members clearly see that night patrols have contributed to improved community safety. While more data would be valuable, the available data show that night patrols are a heavily utilised service in communities.
The evidence on the effectiveness of alcohol restrictions is more equivocal. Given the number of confounding and complicating factors, there is no clear evidence as to whether the restrictions are working to reduce alcohol misuse and the harms resulting from it. It appears
488 ibid.
Promoting law and order
Northern Territory Emergency Response: Evaluation Report 2011 199
that the laws introduced through the NTER are being enforced to a greater extent than those in place previously and have altered the behaviour of community members in ways that the previous laws did not. It will take time before the effects of the alcohol restrictions can be fully determined and assessments made as to whether the altered behaviours will achieve reductions in alcohol-related harm, but there are some positive early indications. As noted in various places in this chapter, the number of coinciding and interconnecting measures impacting on alcohol use and related behaviour in communities will make it difficult, if not impossible, to isolate the impacts of the alcohol restrictions.
Reducing levels of crime and improving safety in Indigenous communities can only come about through multifaceted approaches that deal with the full range of socioeconomic factors that contribute to crime and antisocial behaviour. At the same time, improvements in community safety can help to create the conditions under which socioeconomic gains can be made. The NTER law and order measures appear to be contributing to improvements in community safety and therefore establishing a more solid base for reducing socioeconomic disadvantage. Reducing disadvantage will in turn improve community safety—being unemployed and having educational deficits have been found to be risk factors for Indigenous people engaging in criminal offending.489
There remains much to do to ensure that the objectives of the NTER are fully realised and the gaps in socioeconomic advantage between Indigenous and non-Indigenous Australians are closed. There also remains more to be done to assess the longer term outcomes of the NTER and later government measures. Issues to be examined in the future include the question of unintended consequences of the NTER, such as whether the alcohol restrictions introduced through the NTER led to increases in antisocial behaviour in other areas of the Northern Territory. This question is yet to be fully explored. Another issue to be addressed through detailed and targeted research is to what extent perceptions of improved community safety in NTER communities are actually the result of NTER measures, or reflect broader trends and changes in communities that may have occurred without the NTER.
This review has not been able to consider the influence of local community activities on perceptions, or the way in which NTER measures have impacted and manifested at a local level. The survey results presented in this review are indicative of levels of consensus across the surveyed communities about perceived changes to community safety and the extent to which the NTER law and order measures have influenced those perceived changes. However, there will inevitably be differences in such perceptions between individual communities, and the experiences of each community will be different. A challenge for the future is to develop and maintain sufficiently disaggregated data to support quality, targeted research and robust evaluation designs able to generate evidence to support the development of policy responses amenable to local needs and circumstances.
489 D. Weatherburn, L. Snowball & B. Hunter, ‘Predictors of Indigenous arrest: An exploratory study’, The Australian and New Zealand Journal of Criminology, vol. 41, no. 2, 2008, pp. 307–322.


Improving child and family health
Northern Territory Emergency Response: Evaluation Report 2011 201
6 Improving child and family health
Australian Institute of Health and Welfare
Key findings
Northern Territory Emergency Response health initiatives The four main health programs established as part of the Northern Territory Emergency Response (NTER) were:
• The Child Health Check Initiative (CHCI), comprising child health checks, treatment and follow-up care, particularly in the areas of ear, nose and throat (ENT), oral health and primary health care. The CHCI as a discrete program closed at the end of June 2009. By that time, a total of 10,605 children had had at least one valid child health check. Of those, 70 per cent received at least one referral for follow-up treatment for a health condition.
• The Expanding Health Service Delivery Initiative (EHSDI) to expand and reform primary health care in remote Aboriginal communities in the Northern Territory. The EHSDI was initially funded for two years, which was then extended for an additional two years to July 2012. As at 30 June 2010, $181.688 million had been allocated to the EHSDI for the four-year period.
• A coordinated drug and alcohol response, which aimed to expand alcohol and other drug (AOD) treatment and rehabilitation services in both outreach personnel and bed capacity. A total of $8 million was allocated in 2007–08. In 2008–09, $2.76 million was provided to continue key activities commenced in 2007–08, within the context of overall growth in AOD service expenditure. A further $7.8 million is being provided over three years (2009–10 to 2011–12) to ensure that core service delivery components are continued.
• Child special services, Northern Territory Sexual Assault Mobile Outreach Service (MOS), to respond to child sexual assault and related trauma in remote communities. This was expanded to MOS Plus in 2009–10 with the aim of providing culturally safe counselling and support services in response to any form of child abuse-related trauma. The Australian Government has committed $15.6 million over four years to 2011–12.
Implementation • Of the 16,259 children eligible to receive health checks, 10,605 (65.2%) received at least
one health check.
• About 70 per cent of children who had a check were referred for follow-up services, including primary health care services, dental services, paediatricians and audiologists.
• The NTER led to the introduction of follow-up dental, audiology and ENT services that treated 7,144 children for dental problems, 4,502 for hearing and 2,581 for ENT, including 283 who received ENT surgery.
• The CHCI was successful in providing referrals for follow-up primary health care for a high proportion of Indigenous children, but the proportion receiving specialist follow-up services was lower. Access to specialist treatment was delayed, or in some cases not received, due to lack of infrastructure and bottlenecks at the primary care – referred service interface.

Improving child and family health
202 Northern Territory Emergency Response: Evaluation Report 2011
• The EHSDI provides a more sustainable response to ongoing health issues. It was implemented with an Australian Government commitment of $99.7 million over two years from July 2008. In July 2010, the government approved an investment plan of $50.7 million for EHSDI in 2010–11, $41.5 million of which is allocated for primary health care expansion and transition, including regional reforms. EHSDI has led to the recruitment of 273 new positions in Aboriginal health services, including 15 continuous quality improvement staff.
• Since the MOS began in April 2008, 736 visits to 87 communities and town camps have been made in the 12 eligible health service delivery areas. Between January and June 2011, the MOS and MOS Plus teams made a total of 210 visits to 73 communities and town camps. During that time, MOS provided 520 case-related services to children and/or their family members and 844 non-case-related services to service providers and community members.
Outcomes Health outcomes of children following the NTER have been published in four previous reports which are publicly available, and a fifth report is due to be released on 10 November. In addition, a final report on the evaluation of the CHCI and EHSDI has been published. A report on Northern Territory key performance indicators, focusing on primary health care in the Territory, is planned for release in the near future. The outcomes discussed below are largely based on the previously published reports.
Although caution must be used when interpreting trends in health status over the short period of time since the NTER began in 2007, some promising trends can be seen. However, some of those improvements were evident before the NTER. For example:
• since 2004, there has been a significant decline in anaemia among young Indigenous children aged 0–4 years
• in the same period, there has been a decline in the proportion of children who are underweight, wasted and stunted.
Other data specifically relate to children receiving services as part of the NTER:
• Data on children who received more than one health check found that all those with trachoma or ringworm at their first check were no longer suffering from those conditions at their latest check, 93 per cent of children suffering from scabies had recovered, 91 per cent with skin sores had recovered and 74 per suffering from anaemia had recovered.
• Audiology and ENT services indicate that there has been some improvement to children’s hearing, and that a notable decline in middle ear conditions occurred.
• AOD treatment services data indicate a marked increase since 2006–07 in episodes of care provided to Indigenous children aged 10–19. This may reflect the impact of the drug and alcohol response, which was intended to expand AOD treatment and rehabilitation services in the Territory. Nationally, AOD treatment episodes of care among 10- to 19-year-olds remained constant.

Improving child and family health
Northern Territory Emergency Response: Evaluation Report 2011 203
Other indicators based on child health checks show there is still a high need for follow-up dental, audiology and ENT services:
• Of children with an identified oral health issue at their first health check, only 34 per cent had no oral health issue at their most recent check. Most had untreated caries which required ongoing treatment (only 35% who had dental caries at their first check no longer needed treatment for caries).
• There was evidence that hearing had worsened for 34 per cent, or 175 children, initially identified with a hearing impairment during health checks. This reflects the fact that hearing conditions tend to be chronic and recurrent. It also indicates a need for monitoring to assess how well the CHCI has responded to conditions requiring ongoing treatment, such as dental and hearing health.
Introduction This chapter assesses and summarises outcomes relating to improving children’s health and wellbeing by examining Improving Child and Family Health initiatives under the NTER and in the Closing the Gap under the Northern Territory National Partnership Agreement (NTNPA). Initiatives include child health checks and medical follow-up treatment, child special services, and drug and alcohol treatment and rehabilitation services. The assessment was done in two parts:
• a desktop review of existing NTER evaluation documents and other related material to provide a succinct analysis of key components
• supplementary secondary analyses of relevant health data.
The remaining sections of this chapter are arranged as follows:
‘Background’ provides a brief outline of the health issues prevalent amongst Indigenous people in the Northern Territory. Detailed tables to support this section can be found in Appendix 6A.
‘Methods used for this chapter’ provides information on methodology and outlines issues relating to data sources and their limitations. A more detailed explanation of data issues can be found in Appendix 6B.
‘NTER health initiatives’ draws on evaluation material and secondary data analyses to assess how effective and comprehensive the initiatives have been. The literature reviewed includes government reports and academic articles as well as findings from the data collection established as part of the NTNPA to monitor the services provided. Additional data analyses are included in Appendix 6C.
‘Trends in health outcomes’ presents information about the health status of Indigenous people in the Northern Territory. Data are also presented about the children’s health, including infant health outcomes, findings from an analysis of the Northern Territory Growth Assessment and Action (GAA) Program, and hospitalisations.
‘Changes in alcohol and other drug treatment services’ looks at changes in the number of AOD treatment episodes provided to Indigenous clients in the Northern Territory.

Improving child and family health
204 Northern Territory Emergency Response: Evaluation Report 2011
Background The NTER was announced by the Australian Government in June 2007 in response to reports of abuse and neglect of children outlined in the Ampe akelyernemane meke mekarle: ‘Little children are sacred’ report.490
Three specific initiatives were introduced to improve the health and safety of Indigenous children: child health checks and medical follow-up treatment; child special services; and drug and alcohol treatment and rehabilitation services. These have continued under subsequent governments.
The CHCI, as originally conceived, aimed to establish the extent to which abuse was occurring, while the child special services were intended to provide specialist counselling and support services where child abuse and trauma had occurred. Additional alcohol detoxification and rehabilitation services were put in place to provide support to individuals and communities affected by alcohol restrictions under the NTER. From this initial focus, a more broadly based approach to preventing and treating health conditions emerged fairly rapidly.
Contextual information—what were the interrelated issues? The NTER measures did not occur in a policy vacuum, but were introduced into a dynamic context of reform already being pursued by both the Northern Territory and the Australian governments with the goal of narrowing the gap between Indigenous and non-Indigenous Australians in a number of areas, including health. Numerous initiatives, sometimes overlapping and sometimes complementary, flowed from each level of government, or sometimes from both in partnership.
Many of the programs related to the NTER health measures were further developed in the context of the agreement of the Council of Australian Governments (COAG) on 2 October 2008, which articulated six overarching targets for closing the gap between Indigenous and non-Indigenous Australians in urban, rural and remote areas. Two of the targets relate specifically to health:
• to close the gap in life expectancy within a generation
• to halve the gap in mortality rates for Indigenous children under 5 years old within a decade.
The COAG National Indigenous Reform Agreement committed all jurisdictions to achieving the Closing the Gap targets. It was accompanied over time by numerous National Partnership Agreements (NPAs) including the NPA on Remote Service Delivery and Preventive Health. The NPA on Closing the Gap in Indigenous Health Outcomes 2009–13, also comprised a package of health reforms focusing on five priority areas: tackling smoking, providing a healthy transition to adulthood, making Indigenous health everyone’s business, delivering effective primary health care and better coordinating the patient journey through the health system.491
490 P. Anderson & R. Wild, Ampe Akelyernemane Meke Mekarle: ‘Little children are sacred’, Report of the Northern Territory Board of Inquiry into the protection of Aboriginal children from sexual abuse, Northern Territory Government, Darwin, 2007. 491 COAG, National Partnership Agreement on Closing the Gap in Indigenous Health Outcomes, COAG, Canberra, 2009, p. 4.

Improving child and family health
Northern Territory Emergency Response: Evaluation Report 2011 205
Given the complex and changing nature of the policy environment, it is difficult to ascribe specific impacts or outcomes to single programs, and the evaluations focusing on health-related programs have had difficulty in attributing changes to specific initiatives.
The next section presents key health indicators for the Territory’s Indigenous population. It provides an overview of the health context in which the policy initiatives were enacted.
Health profile of Indigenous Australians living in the Northern Territory Data on the health of the Territory’s Indigenous people show two main trends: progress on some key indicators of health status, along with continued inequalities when the indicators are compared with those for non-Indigenous residents.
Wilson, Condon and Barnes492 have shown that in the Northern Territory from 1967 to 2004 life expectancy at birth increased by 8.0 years for Indigenous men and 14.2 years for Indigenous women. They concluded that ‘contrary to widespread perception, these large gains in indicate that Indigenous health status has improved considerably in recent decades, in the NT at least.’493
More recent data also suggest some improvements. For example, the overall age-standardised mortality rate for Indigenous Australians in the Northern Territory fell by 26.6 per cent from 1998 to 2009, and there was a statistically significant narrowing of the gap with non-Indigenous people. Over the same period, the Indigenous child (0–4 years) mortality rate decreased by 41.5 per cent compared with a 37.8 per cent decrease in non-Indigenous child mortality.
While progress has been made, significant challenges remain:
• From 2005 to 2007, life expectancy at birth was 61.5 years for Indigenous men and 69.2 years for Indigenous women. Although an improvement over time, this is considerably lower than for non-Indigenous Territorians and Australians in general. Indigenous men and women in the Northern Territory have lower life expectancy than Indigenous people in the other three jurisdictions for which data are available (New South Wales, Queensland and Western Australia).
• Babies born to Indigenous mothers in the Northern Territory are more than twice as likely to be of low birthweight as those born to non-Indigenous mothers.
• Smoking during pregnancy is one of the key factors that determines the birthweight of newborns. In the Northern Territory, Indigenous mothers are more than twice as likely as non-Indigenous mothers to report smoking during pregnancy. In 2006, at the first antenatal visit, the smoking rate was 52 per cent for Indigenous mothers and 21 per cent for non-Indigenous mothers.494
• Indigenous infants in the Northern Territory are more than three times as likely as other infants to die before reaching their first birthday.
• Indigenous Australians are more likely to suffer health conditions that require hospitalisations. From 2006 to 2008, Indigenous Territorians were hospitalised at over six times the rate of other persons in the Northern Territory.
492 T. Wilson, J.R. Condon & T. Barnes, ‘Northern Territory Indigenous life expectancy improvements: 1967–2004’, Australian and New Zealand Journal of Public Health, Vol. 31, no. 2, 2007, pp. 184-88. 493 ibid., p. 187. 494 K. Tew & X. Zhang, Northern Territory Midwives’ Collection: Mothers and Babies 2006, Northern Territory Department of Health and Families, Darwin, 2010.

Improving child and family health
206 Northern Territory Emergency Response: Evaluation Report 2011
• When dialyses were excluded, Indigenous Australians were hospitalised at twice the rate of other persons in the Northern Territory.
• The greatest differences in hospitalisation rates were for endocrine, metabolic and nutritional disorders, for which Indigenous Australians were hospitalised at around five times the rate of other persons. Indigenous Australians were hospitalised at over four times the rate of other persons for respiratory diseases and infectious and parasitic diseases.
• From July 2006 to June 2008, assault was the most common specific cause of injury and poisoning-related hospitalisation among Indigenous Australians.
• Indigenous females were 69 times as likely as other women to be hospitalised for assault (26 per 1,000 compared with 0.4 per 1,000).
• Indigenous Australians are five times as likely as other Australians to be hospitalised for alcohol-related problems.
• From 2006 to 2008, the incidence rate of end-stage renal disease among Indigenous Australians was 26 times that of non-Indigenous Australians.
• From 2006 to 2008, notification rates for chlamydia, gonorrhoea and syphilis were higher among Indigenous Australians of all ages than for other persons.
Methods used for this chapter
Desktop review The main sources for the desktop review and analysis included government and policy documents and reports related to the NTER initiatives, including progress reports, relevant academic articles, and two main evaluation reports.
The first report is a comprehensive evaluation of the CHCI and the EHSDI commissioned by the Australian Department of Health and Ageing. The evaluation, undertaken by Allen and Clarke between June 2009 and March 2011, aimed to examine the performance of the CHCI and EHSDI in relation to their effectiveness (to improve the health of remote Indigenous peoples in the Northern Territory); efficiency (to deliver the services in a cost-effective manner); appropriateness (to make sure the right services are delivered in the right way to the target population in a timely manner and in accordance with Australian Government priorities and policy); and sustainability.
The evaluation was based on a mixed-methods approach which included the integration of both quantitative and qualitative data, including secondary analyses of data collections, case studies, key informant interviews and workshops.
An independent evaluation of the Alcohol and Other Drug Response measure was commissioned from Origin Consulting and Bowchung Consulting in August 2008. The objective was to assess how well the measure had been implemented and the extent to which it had achieved its goals over the period from August 2008 to May 2010.
Information on child specialist services is covered in the ‘Supporting families’ and ‘Promoting law and order’ chapters and is not covered here.

Improving child and family health
Northern Territory Emergency Response: Evaluation Report 2011 207
Secondary data analyses Secondary analyses of quantitative data sources were undertaken specifically for this chapter. The main data sources include:
• the child health check and follow-up audiology, dental and ENT data collected as part of the NTER CHCI and held by the Australian Institute of Health and Welfare (AIHW)495
• the Northern Territory Growth Assessment and Action (GAA) Program496
• additional administrative data held by the AIHW, including national hospital morbidity data, national perinatal data, and data on AOD treatment services.
Findings from the School Nutrition Program stakeholder survey are also presented. More information on these data sources is provided in Appendix 6B.
A number of limitations should be noted when comparing quantitative data and interpreting the analyses. One issue in administrative data collections is the under-identification of Aboriginal and Torres Strait Islander people. This is a major problem in mortality and hospital morbidity datasets, although Northern Territory data are considered to be more complete and accurate than those from other jurisdictions. It is also important to analyse trends over long periods, not least because a simplistic focus on what happens after a ‘baseline’ point could obscure the impact of longer term trends.
When analysing the child health check data, it is important to bear in mind that:
• the checks were voluntary, and children who participated may not be representative of all Indigenous children in the Northern Territory
• the data on diseases are not a substitute for estimates of prevalence derived from rigorous scientific research. The data included in the CHCI collection are by-products of clinical processes, the aim of which was to detect, treat or refer children for clinically significant problems rather than to establish a definitive measure of disease prevalence.
Using hospitalisation data alone to determine the level of ill-health amongst a population also has limitations. For example:
• hospital separations data do not capture the full extent of ill-health (some sick people will be managed in a primary care setting and some will not seek treatment at all)
• data can also be influenced by the capacity of primary health care to detect and manage conditions early, either by averting a more serious illness that would require hospitalisation or by not dealing satisfactorily with the early stages of an illness, thus driving up hospitalisation rates.
• hospitalisation may be influenced by the availability of services or by changes in treatment practices reflecting new technologies and drugs or understandings of disease.
NTER health initiatives The NTER emerged in the context of longstanding concerns about the health and wellbeing of Indigenous people, including concerns for the health of children and families in remote Indigenous communities. The immediate catalyst for the NTER, the Little children are sacred
495 AIHW & DoHA, Progress of the Northern Territory Emergency Response child health check initiative: Update on results from the child health check and follow-up data collections, Cat. no. IHW 28, AIHW, Canberra, 2009. 496 AIHW analyses of unpublished GAA data supplied by the Northern Territory Department of Health.

Improving child and family health
208 Northern Territory Emergency Response: Evaluation Report 2011
board of inquiry, was primarily focused on child abuse. The inquiry recognised that poor access to health care was one of the factors which led to child abuse and neglect—alongside alcohol and drug abuse, unemployment, gambling, pornography, poor education and housing, and general loss of identity and control.497
As discussed in the ‘Background’ section, the main focus of the child health checks changed from establishing the extent of child abuse to a broader approach of preventing and treating health conditions. The health checks were implemented as a broader screening program for common health conditions, and services were provided to treat the conditions identified. These, in turn, led to a broad-based expansion of primary health care services in remote Indigenous communities.
Apart from the specific measure aimed at ‘improving the health of children and families’ in the initial emergency response, a number of other broader measures, both within and alongside the NTER, could be expected to impact in the intermediate or longer term on the underlying social conditions that are universally recognised as determinants of health. For example, improvements in education and employment would be expected to have a positive impact on health status.
What were the component parts and how did they evolve? The initial NTER measure specifically aimed at ‘improving child and family health’ contained three core components:
1. child health checks, treatment, and follow-up care, particularly in the areas of ENT, oral health, and primary health care
2. child special services to provide specialist counselling and support services to children and families experiencing trauma related to child sexual assault. This was expanded in 2009–10 to become MOS Plus to provide culturally safe counselling and support services for trauma related to any form of child abuse (see the ‘Research into community safety, wellbeing and service provision’ and ‘Promoting law and order’ chapters for further information)
3. a coordinated drug and alcohol response, which aimed to expand AOD treatment and rehabilitation services in both outreach personnel and bed capacity.
Of these three sub-measures, the bulk of the funding and attention focused on the first (the child health check initiative) and its subsequent evolution into broader primary health care service improvement, which became known as the EHSDI. The NTNPA between the Australian and Northern Territory governments began in July 2009 and ensured a three-year continuation of many of the NTER measures, including the health measures.
An important aspect of the CHCI objective and data collection process was the information it provided on the health status of Indigenous children and their need for follow-up services. This enabled government funding to directed into follow-up services in dental and hearing health, in particular.
497 P. Anderson & R. Wild, op. cit.

Improving child and family health
Northern Territory Emergency Response: Evaluation Report 2011 209
Between July 2007 and 30 June 2010, $75.688 million was allocated for child health checks and follow-up services. Actual expenditure totalled $54.469 million. According to the evaluators, over half of the follow-up funding was spent in 2007–08.498
This resulted in 10,605 children having at least one health check between July 2007 and 30 June 2009. Of those, 70 per cent received at least one referral for follow-up treatment.499
The Child Health Check Initiative and its evolution
The initial purpose of the child health checks was to identify and treat any effects of sexual abuse, and the health checks were to be compulsory.500 However, due to public and official concerns about both the compulsory nature of the health checks and their focus on sexual abuse, these policies were modified. An official announcement made by the then Health Minister, Tony Abbott, on 5 July 2007 confirmed that health checks would be voluntary and that the standard health checks would not include physical examinations for sexual abuse.501
The modified objectives of the CHCI became:
• to provide medical teams to conduct the health checks and follow-up health care
• to deliver a broad range of follow-up services, including referrals to primary health care, allied health services and specialist services.502
The format in which the child health checks were to be conducted was based on the existing Medicare-funded Indigenous health check scheme (MBS item no. 708), which had been announced by the Australian Government in June 2005 and implemented in mid-2006. The MBS health checks had a focus on detecting and diagnosing conditions and illness among Indigenous children (and their treatment), but they were designed to be carried out by the child’s regular health care provider (for example, their GP).
In contrast, the CHCI health checks were generally delivered by interstate teams deployed by the Australian Government, each made up of a doctor, up to three nurses and administrative staff. The teams received a two-day orientation before visiting Aboriginal communities, where they worked alongside local service personnel for up to three weeks. Some checks were arranged through the Northern Territory Department of Health (NT DoH), and in some communities the local Aboriginal community controlled health organisations (ACCHOs) were directly funded to deliver the checks as well as follow-up primary health care.503
The health checks were designed not only to identify any illnesses or conditions among the children, but also any social and environmental risk factors that may have been affecting their health, development and wellbeing. The checks included a strong clinical component, such as key growth measurements (for example, height and weight), hearing and vision tests, blood tests for anaemia, previous medical history and investigation of any symptoms. For adolescents aged 12–15 years, the checks included questions on drug and alcohol use. Health check providers recorded the data (including any procedures, treatments, or referrals)
498 Allen and Clarke, Evaluation of the Child Health Check initiative and the Expanding Health Service Delivery initiative: Summary report, DoHA, Canberra, 2011, p. 47. 499 AIHW and DoHA, Progress of the Northern Territory Emergency Response child health check initiative: Update on results from the child health check and follow-up data collections, op. cit., p. 1. 500 M. Brough, ‘National Emergency Response to protect Aboriginal children in the NT’, media release, FaHCSIA, 21 June 2007, Available at: http://www.formerministers.fahcsia.gov.au/malbrough/mediareleases/2007/Pages/emergency_21june07.aspx 501 T. Abbott, ‘Indigenous child health checks’, media release, DoHA, 5 July 2007, Available at: <www.health.gov.au/internet/ministers/publishing.nsf/Content/8B21F0DCBEB3E376CA25730F000A5A07/$File/abb084.pdf>. 502 Allen and Clarke, op. cit., p. 19. 503 AIHW and DoHA, Progress of the NTER Child Health Check Initiative: Final report on results from the child health check and follow-up data collections, Cat. no. IHW 28, AIHW, Canberra, 2009, p. 6.

Improving child and family health
210 Northern Territory Emergency Response: Evaluation Report 2011
on paper forms, copies of which were sent to the AIHW for inclusion in the CHCI data collection.504
The health checks began in 16 Central Australian communities from the second week of July 2007 and were then rolled out to the remaining communities. By early 2008, most communities had participated. A relatively small number of checks were provided after that time, and some agencies were funded to continue providing checks on an opportunistic basis until late September 2008.505
Changes over time
Phase 1 of the program was in place for the first 12 months (from July 2007 to the end of June 2008) and initially included only the health checks. In recognition of the fact that increased resources were required to provide follow-up care for the identified conditions, the CHCI then included follow-up service delivery; many services were provided by the NT DoH and the ACCHOs.506
Phase 2 of the CHCI extended the timeframe (initially by 12 months to the end of June 2009) and also expanded the program of follow-up services. The CHCI as a discrete program closed at the end of June 2009.507 By then, 10,605 children had had at least one check. Of those, 70 per cent received at least one referral for follow-up treatment.508
Specialist follow-up treatment for dental and hearing health began during 2007–08, and ENT services began in July 2009509, but the need for special facilities and staff made progress slow, and follow-up funding was extended by the Australian Government until the end of June 2010.
Follow-up dental services will continue until mid-2012 (an additional three years) and are provided via the NT DoH and six ACCHOs using outreach teams of dental professionals. The teams visit communities with a list of children who received referrals at their health checks to ensure they receive follow-up services. Also, the teams provide services to all eligible children in prescribed areas (that is, those aged 15 years and under). In the case of ENT services, children with referrals through any process, not just the CHCI referral, are attended to.510
Expanding Health Service Delivery Initiative
The EHSDI, a program to expand and reform primary health care in remote Aboriginal communities in the Northern Territory, was announced in the 2008 Budget. The program was funded under the NTNPA and the related Closing the Gap—Northern Territory—health and related measures budget measure. The EHSDI was initially funded for two years, which was then extended for an additional two years to July 2012. As at 30 June 2010, $181.688 million had been allocated to the EHSDI for the four-year period. Expenditure to 30 June 2010 was $88.577 million.
The need to enhance primary health care in the Northern Territory had been recognised by the Australian and Northern Territory governments in a memorandum signed on 17 September 2007, and the experience of the CHCI confirmed the need for longer term funding
504 The health check form underwent numerous revisions in the early stage of the rollout. 505 Allen and Clarke, op. cit., p. 46. 506 ibid., p. 6. 507 FaHCSIA, Closing the Gap in the Northern Territory whole of government monitoring report, January to June 2009, Part 2, FaHCSIA, Canberra, 2009, p. 19. 508 AIHW and DoHA, Progress of the NTER Child Health Check Initiative: Final report on results from the child health check and follow-up data collections, op. cit., p. 1. 509 FaHCSIA, Closing the Gap in the Northern Territory whole of government monitoring report, January to June 2009, Part 2, op. cit., p. 25. 510 ibid., p. 27.

Improving child and family health
Northern Territory Emergency Response: Evaluation Report 2011 211
and investment. Concerns about the ‘one-off’, limited, time-bound nature of the CHCI were raised in submissions to the NTER Review Board and highlighted the need for ongoing investment in health infrastructure, specialist medical services and outreach programs.511
The EHSDI was developed in partnership between the Australian Government, the Northern Territory Government and the Aboriginal Medical Services Alliance of the Northern Territory. The partnerships between these sectors and government had a significant impact on how the EHSDI was developed and implemented.
According to the evaluators, the EHSDI focused on developing a sustainable regional delivery model of health services to remote communities, which would lead to a more efficient, coordinated and community-controlled primary health care system.512
The objectives and goals of the EHSDI included:
• expanding primary health care to improve access to core health services
• improving the quality of remote primary health care services
• developing regional approaches to the planning and delivery of primary healthcare services
• increasing Aboriginal community control and participation in regional health service planning and delivery.513
In the first two years, the bulk of the funding ($60.5 million) was directed towards health service expansion and transition. EHSDI funds were distributed according to a formula that calculated a per capita funding benchmark for each proposed health service delivery area (HSDA). The main activities, including spending to 30 June 2010, were:
• expansion of health services by employing additional staff ($47.7 million; a total of 251 full-time equivalent positions were funded)
• development of regions (regionalisation) and the move towards Aboriginal community control ($5.2 million; four new HSDAs have been prioritised for transition to a regional Aboriginal community controlled health service)
• the development of hub services—that is, consideration of what services need to be delivered at different geographic levels, including at the community, regional and jurisdictional levels ($2.8 million)
• continuous quality improvement, which uses data to drive organisational change in a continuous cycle of improvement ($3 million; a strategy and model for implementation have been developed, but the program is still in its initial stages).
To support the expanded service delivery, the EHSDI included components for capital and infrastructure investment, as well as specific measures to address workforce shortages. The investment in infrastructure included upgraded information technology and information management systems, as well as the refurbishment of clinics and new and refurbished staff accommodation ($14.9 million to 30 June 2010).
One way of addressing workforce shortages was the Remote Area Health Corps (RAHC) agency. RAHC’s purpose was to recruit and support interested health professionals from
511 NTER Review Board, Northern Territory Emergency Response: Report of the NTER Review Board, NTER Review Board, Canberra, 2008. 512 Allen and Clarke, op. cit., p. 19. 513 ibid., p. 19.

Improving child and family health
212 Northern Territory Emergency Response: Evaluation Report 2011
other areas into short-term placements in remote Indigenous communities. The first deployment occurred on 4 December 2008, when two nurses were deployed to Ampilatwatja. The scheme was extended to include dental practitioners from July 2009, and spending reached $11.3 million by 30 June 2010. By November 2010, the RAHC had placed 315 health practitioners in 679 deployments514; this increased to 355 health practitioners in 910 deployments by May 2011.515
The EHSDI also included a component for program evaluation.
Child special services
The establishment of a Child Special Services response under the NTER began with funding to the Northern Territory Department of Health and Families to develop and implement the Northern Territory Sexual Assault Mobile Outreach Service (MOS).516
The MOS began in April 2008 with teams consisting of sexual assault counsellors and Aboriginal sexual assault workers delivering counselling and support services to children, adolescents and their families in remote communities and town camps across the Northern Territory. Services included casework services, professional development for service providers and community education.
The reach of the mobile services was expanded under a four-year funding agreement commencing in 2008–09 (to June 2012). Australian Government funding of $15.6 million over the four years created MOS Plus and related services. MOS Plus provides equitable access to timely, culturally safe responses to Aboriginal and Torres Strait Islander children, adolescents and their families living in remote communities of the Northern Territory affected by trauma associated with any form of child abuse and neglect, including sexual assault. The funding also includes forensic sexual assault medical examinations and training and workforce development for remote community services sectors.517
Drug and alcohol response
According to a discussion paper prepared in November 2007, the goals of the NTER alcohol-related initiatives were to:
• ensure that appropriate AOD-related health and substance-use services were in place to support individuals and communities affected by the new alcohol legislation
• create new opportunities to reduce harmful drinking levels.518
The NTER AOD response arose from a recognition by the Australian Government that there might be a heightened demand for detoxification and withdrawal services as a result of the NTER’s restrictions on access to alcohol on Aboriginal land and increased policing of the restrictions. Officials were concerned that the existing Northern Territory AOD services might not cope with a demand for withdrawal services or with the health impacts of unsupported withdrawal.519
514 Allen and Clarke, op. cit., p. 105. 515 DoHA unpublished data 516 FaHCSIA, Closing the Gap in the Northern Territory whole of government monitoring report, July to December 2009, Part 2, FaHCSIA, Canberra, 2010, p. 27. 517 FaHCSIA, Closing the Gap in the Northern Territory whole of government monitoring report, July to December 2010, Part 1, FaHCSIA, Canberra, 2010, pp. 30-31. 518 ‘Northern Territory Emergency Response (NTER), Drug and Alcohol Response Measure: Discussion paper for meeting with AMSANT and DHCS Darwin, 9 November 2007’, cited in Origin Consulting and Bowchung Consulting, Review of the alcohol and other drug service components of the NTER: Final report, Origin and Bowchung for DoHA, Canberra, 2010, p. 4. 519 ibid., p. 23.

Improving child and family health
Northern Territory Emergency Response: Evaluation Report 2011 213
A total of $8 million was allocated to expand AOD treatment and rehabilitation services in terms of both outreach personnel and bed capacity in 2007–08. In 2008–09, $2.76 million was provided to continue key activities began in the previous year.520 A further $7.8 million is being provided over three years (2009–10 to 2011–12) to ensure that core services are continued.
In the first phase, beginning from September 2007, two hospital-based detoxification beds were established at both Tennant Creek and Katherine District hospitals, together with associated temporary ‘response teams’. Funding was also provided to expand residential rehabilitation services at Darwin, Nhulunbuy, Katherine, Tennant Creek, Yuendumu and Alice Springs through an increase in beds, support workers and refurbished facilities.521
The major element of the second phase was the expansion of drug and alcohol services in Darwin, Nhulunbuy, Katherine, Tennant Creek and Alice Springs, which included the funding and recruitment of outreach workers. Funding was used to employ a total of 10 AOD nurses and eight community support workers in 2007–08.522
The role of the outreach workers was to be broad, and included assessment, referral, and treatment and support. They were to follow up patients discharged from residential facilities, develop links between services and provide education, training and mentoring for local workers as well as health promotion and community education.523
Other components in Phase 2 of the AOD response were524:
• funding to expand a sobering-up shelter in Tennant Creek (operational support is ongoing through the NT DoH)
• the establishment of a Clinical Director for AOD services in the NT DoH (funded initially until June 2010, but this support is ongoing)
• 10 small training, community education and professional development projects that enabled existing organisations to expand their training and education programs
• the short-term placement (for eight weeks) of AOD workers in Northern Territory hospitals (only achieved in Darwin and Nhulunbuy), funded by the NT DoH. Under the NTNPA, AOD workers have been placed in Darwin and Alice Springs hospitals on an ongoing basis.
How successful were the measures and sub-measures?
The Child Health Check Initiative
The success of the CHCI needs to be measured against its modified objectives: to assess the health of eligible children (who may not have had adequate access to services) and to provide follow-up care. If the program was successful, it would lead to the provision of more appropriate health services, and, in the long term, to an improvement in health status among Indigenous children.
There are several indicators that can be used to directly measure the CHCI’s success in the short term, including its reach, whether the health checks identified health conditions among Indigenous children, whether children with identified conditions received treatment at the time
520 ibid., pp. 4–5. 521 ibid., pp. 5–6. 522 ibid., p. 6. 523 ibid., p. 7. 524 ibid., pp. 6–8.
Improving child and family health
214 Northern Territory Emergency Response: Evaluation Report 2011
of the health check and/or were referred on for specialist services, and the extent to which they received follow-up services. It is also possible to examine changes in health conditions for children who received at least two health checks.
This section incorporates findings from both the Allen and Clarke evaluation and from the AIHW’s analyses of the CHCI data.
How effective were the checks in reaching the target population?
The estimated number of Indigenous people living in the NTER prescribed areas in 2006 was 42,229525, around 16,000 of whom are estimated to be children. The data show that 10,605 children (approximately 65% of the eligible population) received at least one health check under the CHCI program.526
Coverage varied by region, with rural areas having higher participation rates than urban areas. The case studies conducted as part of the evaluation also suggest that nearly all the children living in smaller communities received a check.527
Participation was highest for 2- to 9-year-olds (between 56.4% and 69.4%), while only 32 per cent of 15-year-olds received a check.528 Children under 2 years old are already likely to be on a schedule of health and developmental checks that fitted in with the timing of their immunisations and may not have presented for a separate health check during these early years.
According to Allen and Clarke, the most common reasons why children did not get checked were absence from the community, guardians feeling ashamed or frightened by the initial publicity (particularly with the focus on sexual abuse), and, for older children, choosing not to have a check.529
An important policy question is whether the CHCI was effective in reaching children who had not previously been screened. Population-based health data on all children in the prescribed areas which include information on whether the children participated in the CHCI or not are not available. To overcome this issue, the evaluators linked data from the CHCI with data from the NT Midwives collection, the NT Hospital Morbidity dataset, and the GAA to compare characteristics of children who had a health check and those who had not.
The evaluators noted that, while the data must be interpreted cautiously:
• the children who received a check had higher levels of previous hospitalisations than those who did not receive a check, which could indicate either greater need for services or better access to services
• there were no differences in birthweight between children who received a check and those who did not
• children who received a health check were more likely than those who did not to have accessed the GAA screening program.
525 Centre for Aboriginal Economic Policy Research, A report to the Board of Review of the Northern Territory Emergency, submission no. 123, 2008, Available at: http://www.nterreview.gov.au/subs/nter_review_report/123_caepr/123_Centre_for_Aboriginal_Economic.htm 526 Using a denominator of eligibility calculated from the DHF’s Client Master Index (CMI), Allen and Clarke calculated that the child health checks reached 57% of the eligible population, with additional child health checks provided to children who may have been visiting a prescribed area but not necessarily resident in those areas. Allen and Clarke, op. cit., p. 50. 527 Allen and Clarke, op. cit., pp. 52–53. 528 ibid., pp. 52–55. 529 ibid., pp. 56–57.

Improving child and family health
Northern Territory Emergency Response: Evaluation Report 2011 215
From these data, Allen and Clarke concluded that the CHCI was not an effective mechanism for reaching the unscreened population (that is, those who were not already accessing screening programs).530
Problems identified during health checks
The child health checks were designed to identify health risks or conditions through several different means, including physical exams, discussions with parents/carers about risk factors, and diagnostic tests. Table 6B.1 in Appendix 6B shows that 8,568 children (91%) received at least one test on-site at the time of their health check, including haemoglobin tests (91%), blood sugar level tests (28%) and urine tests (24%).
The findings show that almost every child who received a health check (97%) had at least one health condition or risk factor identified during that check. This finding supports the health check’s effectiveness as an opportunity to identify underlying health issues and risk factors. However, it may also indicate a potential selectivity bias in that parents who suspected their children may have a health-related issue may have been more likely to seek a health check. Again, it is important to note that these findings apply only to Indigenous children receiving a health check—not to all Indigenous children in the Northern Territory.
The most common conditions diagnosed during the health checks were oral health problems (43%), ear disease (30%) and skin problems (30%). These conditions can have long-term consequences for children’s overall health and wellbeing, as well as their education (particularly those related to ear disease). It is important to note that these conditions are strongly related to children’s socioeconomic and environmental circumstances.
The health checks also found that over one-third of infants less than 1 year old (37%) were at risk of sudden infant death syndrome due to loose bedding, almost one-quarter (24%) were at risk due to prone sleeping, and almost three-quarters (74%) were at risk due to bed sharing.531
Other notable findings were that 16 per cent had anaemia, 10 per cent had four or more skin sores, 9 per cent were underweight and 15 per cent were due for an immunisation.
Treatment/types of management received during health checks
While it is important that the health checks identified significant health conditions among the children, the extent to which those conditions were treated or managed is also an indicator of how effectively the CHCI operated.
During health checks, children were treated on site if they had a mild health condition. Children with severe or chronic health conditions were referred to primary health care and medical specialists for further treatment or follow-up. Some children may also have received preventive treatment (such as de-worming medication) and health advice, although they may not have been identified as having any health conditions.
Data show that nearly all children (99%) received some form of treatment or management for their health conditions at the time of their health check. Health advice was given to 69 per cent of the children, while referrals were made for 70 per cent.
In addition, 4,989 children (53%) were treated with at least one medication. Of those, 31 per cent received de-worming treatment, 20 per cent received medicine for skin diseases, 14 per
530 ibid., p. 61. 531 AIHW and DoHA, Progress of the NTER Child Health Check Initiative: Final report on results from the child health check and follow-up data collections, op. cit., p. 19.

Improving child and family health
216 Northern Territory Emergency Response: Evaluation Report 2011
cent received antibiotics, and 7 per cent were vaccinated. Overall, 8,344 medications were given. There were also 328 children (4%) who had at least one medical procedure, such as skin dressing (42%) or ear cleaning (47%).532
Referrals
Another form of management was referrals to specialist services. It is important to note, however, that child health check teams were not required to make referrals to specialist or allied health services if a referral was already in place and the child’s name was on a waiting list. This means that for some conditions there were fewer referrals than there were children identified with the condition.
Seven in 10 children (70%) were referred to at least one type of service for follow-up. Almost four out of 10 children (39%) were referred for primary health care clinic follow-up, 35 per cent were for dental services, 14 per cent to tympanometry and audiology services, 12 per cent to a paediatrician, and 10 per cent to an ENT specialist (Table 6B.2).
Provision of follow up services
One of the key elements of the CHCI was to ensure that children received appropriate follow-up care for identified health conditions. In order to monitor this, a separate data collection process was established, known as ‘chart review’.
This was designed to be conducted in two stages—an ‘initial chart review’ and an ‘exit chart review’. The purpose of the initial chart review was to ascertain whether the child had been seen at least once for conditions for which they received a referral during their child health check and whether the child had acquired any other conditions since the health check, and to indicate any follow-up care still required. The exit chart review was used to determine whether the child had been followed up in the period between the initial and exit chart reviews by specified clinician(s) and to see whether any further follow-up action was required.533
Overall, the CHCI chart review data indicate that a large number of children received at least one follow-up for their referred care.534 The CHCI was most successful in providing follow-up primary health care for a high proportion of Indigenous children with referrals (80% had been seen at least once).
Fewer children received follow-up specialist care: 63 per cent of children with referrals to cardiologists had been seen, followed by those with referrals to paediatricians (58%), ENT specialists (57%) and dieticians or nutritionists (42%).535 More up-to-date data at 31 May 2011 indicate that ENT follow-up has been provided to 73 per cent of the children with referrals from health checks.536
Over one-third of children who were referred to speech therapists and optometrists or ophthalmologists had not been seen. The proportion of those referred for follow-up who had been seen was lowest for other clinicians such as gynaecologists, obstetricians, dermatologists and renal physicians (6%), social workers (10%) and speech therapists (24%).
532 ibid., pp. 22-25. 533 The numbers of follow-up services were counted based on the services provided when the chart reviews were conducted. Children who received follow-up care after their chart review were not included. Therefore, chart review data may underestimate the true level of follow-up. 534 AIHW and DoHA, op. cit., p. 40 535 ibid., pp. 37–38. 536 AIHW, Ear and hearing health of Indigenous children in the Northern Territory, cat. no. IHW 60, AIHW, Canberra, 2011.

Improving child and family health
Northern Territory Emergency Response: Evaluation Report 2011 217
Referrals to these specific specialist services, however, were fairly low (33 children, or 0.4%).537
Lack of infrastructure and bottlenecks meant that access to specialist treatment was delayed or in some cases that children did not receive the services to which they were referred.538 In addition, Allen and Clarke note that some issues may have only been known at a population level and not always for individual children. They also suggested that service providers may not have referred some children for follow-up care based on a view that follow-up services would not have been provided in a timely manner.
In response to the high levels of health problems identified at child health checks and referrals received (and the bottleneck issues), the CHCI subsequently included funding for specialist dental, audiology and ENT services. These services operate in areas where the child checks were conducted. Any child living in the prescribed areas who is under 16 is eligible for the services, regardless of whether they received a child health check.
Follow‐up dental services for children with health checks
Table 6B.3 in Appendix 6B shows that 71 per cent of children who had a dental referral at their child health check have since received a dental service. The highest proportion of children who received a dental service was in Central Australia (88%) followed by Katherine/Barkly (79%), while the proportion was lowest in Darwin Rural (55%).
As at 31 May 2011, there were still 915 children with outstanding dental referrals. Katherine/Barkly had the lowest number (118) and Central Australia the highest (295).
The average waiting time between referral and service was 17 months. The waiting time was shortest in Central Australia (14 months). The longest was in Darwin Rural and Arnhem (both 19 months). The average waiting times are calculated excluding those with an outstanding dental referral.
Table 6B.4 shows that, apart from diagnostic services which were provided to almost all children, the most common services were preventive (74%) and restorative (48%). In addition, fluoride varnish and dental surgery were provided to 23 per cent and 16 per cent, respectively. Only a small proportion of children received endodontic (2%) and periodontic services (1%).
Dental services provided for all children
Because increased dental services were available for all children (under 16) in the prescribed areas, the reach of the CHCI-funded dental health initiatives goes beyond the children who received health checks.
Data show that 12,115 occasions of dental services had been provided to 7,082 children aged 15 or under by 31 May 2011, which was 44 per cent of the total child population in the prescribed areas.539 The proportion varies by region. The highest proportion was in Arnhem (53%), followed by Central Australia (47%). The lowest rates were in Katherine/Barkly (35%) and Darwin Rural (31%).
Table 6B.5 shows that a large component of the services was oral health education (64%). Treatment for previously untreated caries was provided to 53 per cent of children who had a
537 AIHW and DoHA, op. cit., p. 38. 538 Allen and Clarke, op. cit., pp. 9–10. 539 5,425 children provided consent for their information to be shared with the AIHW.

Improving child and family health
218 Northern Territory Emergency Response: Evaluation Report 2011
dental service, while 24 per cent were given a dental hygiene treatment, including plaque removal and calcification. The proportion of children who received treatment for problems such as mouth infection or sores (6% of those who had a dental service), gum disease (3%), broken or chipped teeth due to trauma (1%), abnormal teeth growth (1%) and missing teeth (<1%) was much lower.
Other problems, including dental abscesses, were treated by health professionals for almost a third (32%) of the children who were treated. There was little difference in the types of problems treated, regardless of whether the child had also received a health check. The largest difference was for oral health education, which was more common for children without a health check (62%) than for those who had had a check (67%).
Detailed analyses of the dental health data are available in Appendix 6B.
Audiology follow‐up for children with health checks
During the health checks, 1,291 children received a referral for audiology services. By 30 May 2011, 70 per cent had received an audiology service.540
The rollout of audiology services regions was gradual, and hearing booths were not always available to conduct audiology checks. As such, the average waiting time varied by region. Of the children who received a referral, the highest proportion receiving a service was in Arnhem (76%), followed by Central Australia (72%), Darwin Rural (70%) and Katherine/Barkly (62%). The average waiting time between referral and service was 14.2 months. Katherine/Barkly, as well as having the lowest proportion of children with a referral receiving a service, had the longest average waiting time (17.7 months). The shortest average waiting time was in Central Australia (10.8 months).
Over half the children who had not been seen by an audiologist were considered lost to follow-up. The main reasons for loss to follow-up were moving out of prescribed areas and failure to attend services after three attempts to provide services by the audiology outreach teams. At 31 May 2011, 175 children had not received an audiology service for their referral.
Audiology services provided for all children in the prescribed areas
A total of 6,876 audiology services were provided for 4,502 children between August 2007 and May 2011. Of the children who received an audiology service, 3,066 (68%) received one service and 853 (19%) received two. Thirteen per cent received three or more services.
Of those children who had received an audiology service, 74 per cent (3,314 out of 4,502) were reported as requiring further action. The most common action required was ongoing monitoring by Northern Territory hearing services (54%), followed by case management by primary health care workers (45%) and case management by an ENT specialist (36%). About 16 per cent of children were referred to Department of Education, Employment and Training Hearing Advisory Support, and 9 per cent were referred to Australian Hearing for rehabilitation.
Most children with chronic middle ear conditions or hearing problems require ongoing monitoring by an audiologist. Over half the children who had received their first audiology services through the CHCI needed ongoing audiology services. Of the 2,317 children who needed ongoing services, 786 (34%) received a follow-up service at least once by 31 May 2011.
540 AIHW, Ear and hearing health of Indigenous children in the Northern Territory. cat. no. IHW 60, AIHW, Canberra, 2011.

Improving child and family health
Northern Territory Emergency Response: Evaluation Report 2011 219
Despite the provision of more than 6,800 audiology services within the prescribed areas in the Northern Territory over the past two years, 2,248 children were either waiting for an audiology check or needed ongoing monitoring of their hearing:
• 175 children who received an audiology referral at their health check were waiting to be seen by an audiologist
• 466 who received a referral from their ENT consultation were waiting to be seen
• 88 required audiology follow-up care after their ENT surgery
• 1,646 were identified as requiring ongoing monitoring.
Central Australia had the highest number of children requiring follow-up audiology services (684), followed by Katherine/Barkly (521), Darwin Rural (497) and Arnhem (400) (Table 6B.6).
ENT services provided for all children in the prescribed areas
A total of 3,749 ENT services were provided to 2,581 children between August 2007 and May 2011. This comprised 3,458 ENT consultations for 2,573 children and 291 surgeries performed on 283 children. Just over half (52%) of children who received an ENT service were aged 6–11.
Almost three-quarters (73%) of children who received an ENT consultation required at least one further action. The most common action required was ENT review (65%), followed by audiology assessment (63%) and case management by primary health care services (42%).Surgery was recommended for 24 per cent. The most common surgery recommended was myringoplasty (16%), followed by adenoidectomy (5%) and myringotomy (4%).
Of the 468 children who were recommended for surgery, just over 60 per cent had received surgery by May 2011. The average waiting time between recommendation and surgery was 42.6 days: the longest was 64.1 days in Arnhem and the shortest was 31.0 days in Katherine/Barkly. The length of time between the recommendation and the operation is an indicator of the timeliness of a child’s course of care being followed.
Follow-up care after ENT surgery is important to ensure the appropriate continued course of care. Of the 283 children who received surgery, just over half (59%) received a follow-up audiology service and a follow-up ENT service. The median waiting times were 3.4 months between surgery and audiology service, and 3.3 months between ENT service and surgery.
Detailed analyses of audiology and ENT services are provided in Appendix 6B.
What is the likely impact of the CHCI and follow‐up services?
As shown in Table 6.1, the CHCI resulted in a significant number of health checks provided, health conditions identified, treatment/management provided, and referrals made to follow-up and specialist care. The data collected from the CHCI have also been invaluable in providing detailed information about the health and wellbeing of Indigenous children in the prescribed areas in the Northern Territory, albeit only about those who participated in the program.
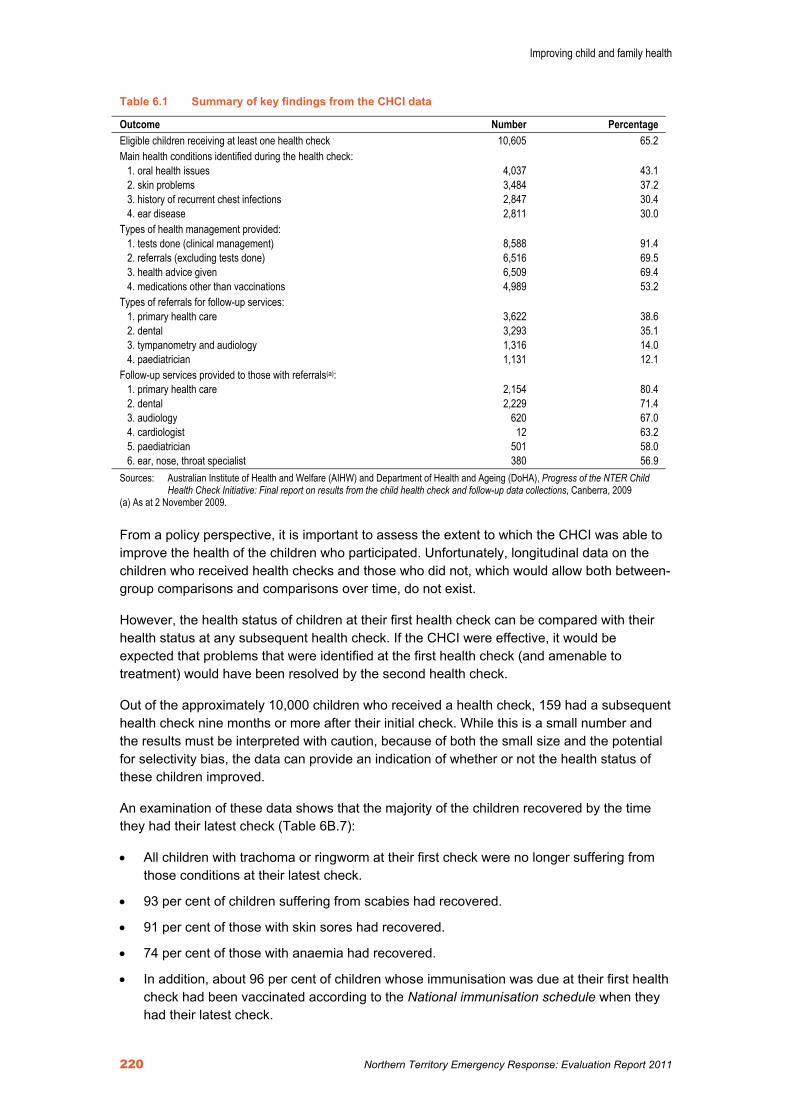
Improving child and family health
220 Northern Territory Emergency Response: Evaluation Report 2011
Table 6.1 Summary of key findings from the CHCI data
Outcome Number Percentage Eligible children receiving at least one health check 10,605 65.2 Main health conditions identified during the health check:
1. oral health issues 2. skin problems 3. history of recurrent chest infections 4. ear disease
4,037 3,484 2,847 2,811
43.1 37.2 30.4 30.0
Types of health management provided: 1. tests done (clinical management) 2. referrals (excluding tests done) 3. health advice given 4. medications other than vaccinations
8,588 6,516 6,509 4,989
91.4 69.5 69.4 53.2
Types of referrals for follow-up services: 1. primary health care 2. dental 3. tympanometry and audiology 4. paediatrician
3,622 3,293 1,316 1,131
38.6 35.1 14.0 12.1
Follow-up services provided to those with referrals(a): 1. primary health care 2. dental 3. audiology 4. cardiologist 5. paediatrician 6. ear, nose, throat specialist
2,154 2,229
620 12
501 380
80.4 71.4 67.0 63.2 58.0 56.9
Sources: Australian Institute of Health and Welfare (AIHW) and Department of Health and Ageing (DoHA), Progress of the NTER Child Health Check Initiative: Final report on results from the child health check and follow-up data collections, Canberra, 2009
(a) As at 2 November 2009.
From a policy perspective, it is important to assess the extent to which the CHCI was able to improve the health of the children who participated. Unfortunately, longitudinal data on the children who received health checks and those who did not, which would allow both between-group comparisons and comparisons over time, do not exist.
However, the health status of children at their first health check can be compared with their health status at any subsequent health check. If the CHCI were effective, it would be expected that problems that were identified at the first health check (and amenable to treatment) would have been resolved by the second health check.
Out of the approximately 10,000 children who received a health check, 159 had a subsequent health check nine months or more after their initial check. While this is a small number and the results must be interpreted with caution, because of both the small size and the potential for selectivity bias, the data can provide an indication of whether or not the health status of these children improved.
An examination of these data shows that the majority of the children recovered by the time they had their latest check (Table 6B.7):
• All children with trachoma or ringworm at their first check were no longer suffering from those conditions at their latest check.
• 93 per cent of children suffering from scabies had recovered.
• 91 per cent of those with skin sores had recovered.
• 74 per cent of those with anaemia had recovered.
• In addition, about 96 per cent of children whose immunisation was due at their first health check had been vaccinated according to the National immunisation schedule when they had their latest check.

Improving child and family health
Northern Territory Emergency Response: Evaluation Report 2011 221
In contrast, of the children with any oral health issue, only 34 per cent had no oral health issue at their most recent health check. Most had untreated caries which required ongoing treatment (only 35% of the children who had dental caries at their first health check no longer needed treatment for caries).
Data for children who had two or more audiology checks also provide a comparison of changes in health outcomes over time. Between their first and the last audiology checks, there was evidence of a decrease in the proportion of children with any hearing loss (55%, or 280 children).
However, there was also evidence that hearing had worsened for over a third of children (34%, or 175 children) initially identified with a hearing impairment. This reflects the fact that hearing conditions tend to be chronic and recurrent.541 It also indicates a need for ongoing monitoring to assess how well the CHCI has responded to conditions requiring ongoing treatment, such as dental and hearing health.
The evaluators concluded that even with adequate follow-up, medical intervention in the context of ongoing poor social determinants, particularly inadequate housing, may improve the health of children in the short term, but will have little or no impact at a population level, as children simply get reinfected or continue to live in conditions that promote or exacerbate chronic illness.542
While it is acknowledged that the social determinants have an important role in improving health outcomes, improvements in access to medication and treatments for specific diseases, in particular for chronic diseases, have been instrumental in gains in life expectancy over the past decade. In fact, the significant improvements in Indigenous infant mortality over the past two decades have come about through better access to primary health services, access to hospital services for severe health problems, and increased immunisation against communicable diseases.
It should also be noted that the referrals and follow-up services, and the information collected as a result of those processes, play a major role in continually improving health service delivery where it is most needed.
The Expanding Health Service Delivery Initiative
Given that the EHSDI is still in its emergent stages of implementation, it is too early to form conclusions about some aspects of the initiative, such as regional reform and any related improvements in health outcomes. However, the EHSDI has the potential to provide effective and appropriate services to improve health.
Has the EHSDI resulted in expanded primary health care services in remote Northern Territory?
Under-resourcing of the Northern Territory remote primary health care system has been widely acknowledged as a significant impediment to providing primary health services.543 Allen and Clarke note that the EHSDI has significantly increased the financial resources available to the Northern Territory remote primary health care system: funding increased by around 17 per cent in 2008–09 and by around 29 per cent in 2009–10.
541 Allen and Clarke, op. cit., p.96. 542 ibid., pp. 98–100. 543 C. Rosewarne and J. Boffa, ‘An analysis of the primary health care access program in the Northern Territory: A major Aboriginal health policy reform’, Australian Journal of Primary Health, vol. 10, no. 3, 2004, pp. 89-100.

Improving child and family health
222 Northern Territory Emergency Response: Evaluation Report 2011
In addition, one of the aims of the EHSDI was to ‘employ more doctors, nurses, Aboriginal Health Workers and community health workers’.544 The funding allocated to HSDAs enabled the creation of 251 full-time equivalent positions in the remote workforce by the end of June 2010. However, the evaluators found that recruitment and retention of appropriate staff remain an ongoing challenge, particularly in terms of Aboriginal Health Worker positions and skilled and qualified Aboriginal staff in clinical and administrative roles.545
Many of the new staff did not commence until March or April 2009, which makes measuring their impact on service provision (and population health) difficult. The EHSDI evaluation found a varied impact of the staff placements across services, with noticeable improvements in some clinics and negligible difference in others. Many of the positions have a focus on population health and preventive care, but it remains a challenge to ensure that the additional resources are not diverted into acute care.546
According to Allen and Clarke, the new transparent funding methodology for HSDAs has led to a more equitable distribution of resources across the Northern Territory primary health care system. Funding for service expansion was allocated to HSDAs on the basis of an EHSDI funding allocation model. That methodology was agreed on and endorsed by the Northern Territory Aboriginal Health Forum. This involved establishing a per capita EHSDI funding benchmark for each proposed HSDA, which was determined by multiplying the national average MBS payment with an agreed remoteness factor, a fluency in English language factor and a Northern Territory cost of service delivery factor for each HSDA. The sum of those factors created the final benchmark. This formula was developed as a means to distribute the available EHSDI funding equitably among the HSDA.547
What has been the impact of the measures to improve the workforce?
One of the specific goals of the EHSDI was to meet the need to recruit and deploy more health professionals to remote areas of the Northern Territory.548
The health workforce increased by 251 full-time equivalent positions over a two-year period.549 By the end of May 2011, this has increased to 273 full-time equivalent positions.550 The EHSDI also enabled increased infrastructure investment, such as in staff accommodation and clinic buildings. Since inadequate housing is a barrier to filling staff positions, the provision of capital funding has made a tangible contribution towards improving the workforce.551
The RAHC model has been successful in temporarily increasing health practitioner capacity in targeted areas. By November 2010, there were 679 deployments (of whom 54% were nurses) covering more than three-quarters of all Northern Territory remote health services.552 (Recent analyses show that at May 2011 the RAHC had placed 355 health practitioners in 910 deployments553). The average length of deployment was 2–4 weeks (including travel and training), and a total of 2,747 weeks of service were delivered to November 2010. This represented around 30 full-time equivalent positions.554
544 FaHCSIA, op. cit. 545 Allen and Clarke, op. cit., pp.114–117. 546 ibid., p. 113. 547 ibid., p. 108. 548 FaHCSIA, op. cit., p. 7. 549 Allen and Clarke, op. cit., p. 11. 550 Department of Health and Ageing, unpublished data. 551 Allen and Clarke op. cit., p. 118 552 ibid., p. 150. 553 Department of Health and Ageing, unpublished data. 554 Allen and Clarke op. cit., p. 40.

Improving child and family health
Northern Territory Emergency Response: Evaluation Report 2011 223
The steady increase in multiple deployments is building experience, and suggests a good potential for the RAHC to continue to supplement the remote Northern Territory workforce. The evaluators concluded that the model was cost effective, with comparable costs to those that would have been incurred through other commercial agencies.555
The RAHC model focuses only on short-term placements. Other longstanding workforce issues remain, including the difficulty of recruiting and retaining permanent staff and recruiting, training and supporting Aboriginal Health Workers.
Is the EHSDI well placed to continue to make an impact on health service delivery?
The policy intent of the EHSDI is to deliver a sustained improvement to remote primary health services through a range of strategies, improvements to service delivery models, appropriate follow-ups, improvements in recruiting ongoing staff, improvements to health infrastructure, ongoing funding, and regional and community-controlled governance.
The evaluation suggests that the program is contributing to an improvement to remote primary health services: ‘There has been significant progress to date which, given sufficient time and resourcing, is likely to bring improvements in health service delivery and outcomes.’556
The success of the EHSDI has been its contribution to building primary health care services that are well planned, organised and managed to deliver effective population-level outcomes. While it is too early to measure tangible results, the investment in funding and staffing levels has been significant. However, the evaluators noted that the regionalisation processes have been under-scoped and under-resourced, and that the transition to community control is not without risk.
Alcohol and other drug services, including rehabilitation
The data presented in this section are from an evaluation that is now 18 months old. No up-to-date data on this measure has been available since.
The evaluators found that the task of putting in place AOD services to accompany the restrictions to alcohol on Aboriginal land changes to liquor licensing was a substantial planning and logistical challenge, which may have affected the effectiveness of some elements of the AOD initiatives.
One of the successful components of the first phase was the establishment of the two hospital-based detox beds at the Tennant Creek and Katherine District hospitals and their accompanying response teams. The expected demand for hospital-based detoxification services did not eventuate, however, and only 13 per cent of patients used those beds for detoxification557; most of those requiring services preferred to stay in their own communities.
The other element of the first phase was the expansion of capacity in the residential care sector across all six locations. Funding supported a temporary increase of 39 beds, six drug and alcohol support workers, relief staff, administrative support, one counsellor, the refurbishment of a house for families, and the completion of a women’s rehabilitation centre.558 The evaluation found that some services had difficulties in recruiting staff, while others were
555 Allen and Clarke op. cit., p. 164. 556 ibid., p. 180. 557 Origin Consulting and Bowchung Consulting, op. cit., p. 30. 558 ibid., p. 38.

Improving child and family health
224 Northern Territory Emergency Response: Evaluation Report 2011
already running at full capacity and could not expand their services (and so used funding to improve their existing services).
The evaluation also found that a service’s reputation in the broader community was a key element in whether potential clients were willing to use the service if they were available, indicating that simply adding resources does not address issues related to the demand for AOD services at a community level.559
Implementation of the second phase of the AOD initiative was characterised by certain challenges, successes and variations across areas. Challenges across the board included uncertainty about roles, the lack of agreed-upon service models, difficulties in the recruitment of qualified staff, and funding that was short term. One of the key findings from the evaluation, however, was the importance of the leadership role (for example, the clinical director) in ensuring smooth transitions within services and providing support to workers.560
Based on available (albeit incomplete) data, the AOD outreach teams saw 177 clients on an individual basis and 312 people at health promotion events during the initial funding period (2007–08).561 The bulk of effort for the teams was directed at community engagement and development, organisational coordination and staff development.
Training, community education and professional development activities received a relatively small amount of funding.562 The outreach program shrank considerably with a reduction in funding in 2008–09, but ongoing funding to some sites was consolidated in 2009–10. The Clinical Director position in the NT DoH was funded until June 2010. These factors have generated further exploration of the best means of organising and delivering AOD services to remote areas, and more effective service models are beginning to emerge.563
Although the expected increase in demand for detoxification and withdrawal services did not eventuate and the urgent implementation of services for that purpose has had little sustained effect, the evaluation concluded that the AOD response has strengthened the capacity in the Northern Territory to deliver AOD services.564 The additional funding provided under the second phase of the NTER AOD response (together with other COAG funding streams) has markedly increased service-provider capacity in the funded regions. Some of the programs established under the AOD response have received ongoing funding from other sources ($2.6 million in 2008–09), and that has resulted in the maintenance of service delivery for longer than was originally envisaged.565
The evaluators concluded that the expansion of services has laid the foundation for a much stronger network of AOD services with a larger and more skilled workforce and more attention focused on best practice models of care and integration with existing primary care services.566
559 ibid., p. 6. 560 ibid., p. 51. 561 ibid., p. 46. 562 ibid., pp. 58–59. 563 ibid., p. 46. 564 ibid., pp. 6–7. 565 ibid., p. 69. 566 ibid., p. 67.

Improving child and family health
Northern Territory Emergency Response: Evaluation Report 2011 225
Other measures likely to have an intermediate or longer term impact on improving child and family health Many of the NTER measures over and above the improvements to health and medical services can be expected to have a potential impact on ‘improving child and family health’. Addressing causal factors to build healthy, resilient children is strongly supported by the body of international evidence.567
A number of other NTER measures can be seen as contributing to the intermediate outcomes of:
• carers providing healthy lifestyles for children
• the community having a supportive environment for health.
Those measures include income management to ensure that money is spent on feeding, clothing and providing basic living conditions for children. The licensing of community stores has meant that stores are a more reliable source of nutrition with better quality and affordable produce.
The School Nutrition Program may have directly contributed to health outcomes for school-aged children, and it also contained initiatives to promote good nutrition and food preparation skills amongst community members.
Restrictions on the supply of alcohol (a ‘Promoting law and order’ sub-measure) and the sub-measure to introduce youth alcohol diversionary services (a sub-measure under ‘Supporting families’) are both interconnected with improving child and family health.
Reduced overcrowding, improved health hardware, and improved water supply and other essential services (such as electricity and waste disposal) will all have significant positive effects on health in the short and longer term. Participation of the local community in the design, building and maintenance of housing will increase the likelihood of the housing being appropriate, and increased ownership will increase the longevity of quality housing stock.568
Successes, problems and lessons learned The varied success of each of the components of the health measure provides rich learning for implementing future programs. Although the CHCI and the EHSDI were both implemented as part of the NTER, they represent contrasting approaches to addressing the health needs of remote Aboriginal communities.569 Through its focus on population health and preventive care, the EHSDI appears to have the capacity to improve child and family health.
Two concerns about the CHCI that the Northern Territory Government initially raised related to service duplication and follow-up capability.570 As the program unfolded, the lack of capacity of the Northern Territory primary health care system to cope with the treatment needs arising from the checks became evident, particularly at the interface with secondary care and other referred services. An NTER monitoring report in 2009 identified a lack of workforce availability
567 J. Stanley, A.M. Tomison & J. Pocock, Child abuse and neglect in Indigenous Australian communities, Child abuse prevention issues Paper No.19, AIFS, Melbourne, 2003; DOHA, Aboriginal and Torres Strait Islander Health Performance Framework, cat. no. IHW 20, AIHW, Canberra, 2006, pp. 21-25. 568 Australian Indigenous Doctors’ Association and Centre for Health Equity Training, Health Impact Assessment of the Northern Territory Emergency Response, Australian Indigenous Doctors’ Association, Canberra, 2010, p. 30. 569 Allen and Clarke, op. cit., p. 7. 570 NTER Review Board, op. cit., p. 63.

Improving child and family health
226 Northern Territory Emergency Response: Evaluation Report 2011
and local infrastructure, particularly staff accommodation, as major impediments to the rollout of the CHCI and follow-up services.571
While the Department of Health and Ageing and the NT DoH reached a broad agreement through a memorandum of understanding on the level of funding and general scope of follow-up to the CHCI and on the expansion of primary health care, Allen and Clarke found that detailed planning for CHCI follow-up services commenced late and was done under considerable pressure. The acute lack of infrastructure and resources needed to provide follow-up services to remote communities, together with difficulties in planning the referral process, meant that existing health services were unable to deal with the level of referrals.
The data collected as part of the CHCI and follow-up services were used to address the issue by targeting children with most need for care.572 The transition from the CHCI to the EHSDI created an opportunity to address the under-resourcing of remote health services and to strengthen the existing primary health care system with ongoing resources.
The EHSDI has avoided many of the limiting factors encountered by the CHCI. It is engaged with and building on ‘a rich history of innovation and health system development in the NT’.573 The policy development process has encompassed successes and lessons learned from a long-term reform agenda for the remote Northern Territory primary health care system, including existing models of Aboriginal-controlled primary health care services, the Coordinated Care Trials, the Primary Healthcare Access program, the establishment of the Northern Territory Aboriginal Health Forum and the Pathways to Community Control framework. It is supported by other system-wide reform, such as agreement on a set of core primary health care services and the development of leadership and governance frameworks. According to its evaluators, ‘EHSDI’s achievements to date are a cause for celebration.’574
All the components of the NTER health initiatives were limited by difficulties in recruiting an appropriately skilled workforce able to provide continuity of care. Recruitment and retention of health professionals are key challenges in the provision of remote health services. The NTER Taskforce recognised that the greatest risk to improved health outcomes from the first phase (Year 1) of the NTER was a lack of adequate workforce.575 The RAHC was generally successful in meeting its immediate aims of recruiting skilled health professionals for short-term placements. However, the need for trained Indigenous health professionals remains a critical challenge.576
By 30 June 2011, 736 visits had been made to 87 communities and town camps in the 12 eligible health service delivery areas. Between January and June 2011, the MOS and MOS Plus teams made 210 visits to 73 communities and town camps. They provided 520 case-related services to children and/or their family members and delivered 844 non-case-related services to service providers and community members.
In the AOD initiatives, staff recruitment was a major challenge; innovative approaches are likely to be necessary to identify and attract applicants.
The AOD initiatives experienced longer start-up times than hoped for and uneven results, often related to difficulty in clarifying requirements, uncertainty about funding and lack of time
571 FaHCSIA, op. cit. 572 Allen and Clarke, op. cit., p. 64. 573 Allen and Clarke, op. cit., p. 7. 574 ibid., p. 7. 575 Northern Territory Emergency Response Taskforce, Final report to government, FaHCSIA, Canberra, 2008, p. 17. 576 Allen and Clarke, op. cit., p. 159.

Improving child and family health
Northern Territory Emergency Response: Evaluation Report 2011 227
to adequately test models of service delivery before implementation. Another challenge was how to sustain the learnings from short-term placements of experts and ensure that the leadership role of a clinical director was agreed by all relevant parties.577
Recommendations from the evaluations The evaluations of each of the components of the health measure contain detailed recommendations to improve future service delivery in remote Indigenous communities. The recommendations are summarised in Appendix 6C.
Trends in health outcomes This section presents information about the health status of the Indigenous population in the Northern Territory. It begins with data on key indicators related to early childhood health, then presents information on hospitalisations, and ends with a brief discussion of key mortality measures.
These health data are important because they set the context for future assessments of the extent to which the NTER initiatives may have a long-term impact on the health of children and families in the Northern Territory.
The NTER initiatives focused on prescribed areas. Ideally, data would be available for prescribed and other communities before and after the initiatives to permit comparisons of levels and trends. In the absence of such data, a remote/very remote category is used as a proxy measure for the prescribed areas, and these data are compared with outer regional areas—which is a proxy for Indigenous Australians living in other areas of the Northern Territory, such as the Darwin urban area and the townships of Katherine and Tennant Creek.
Where possible, changes over long periods are shown so that any longer term trends can be observed. However, the lack of reliable and consistent estimates of the Indigenous population by remoteness area in the Northern Territory before the 2006 Census limited the analysis of hospitalisation data for remote and very remote areas to the period since 2006. Data for the Territory as a whole are shown for longer periods. However, around 80 per cent of the Indigenous population in the Northern Territory lives in remote or very remote areas.
Perinatal health indicators
Smoking during pregnancy
Tobacco consumption during pregnancy is a significant risk factor for foetal growth retardation during pregnancy and for low birthweight. The proportion of Indigenous mothers who report smoking during pregnancy remained fairly stable in remote and very remote areas of the Northern Territory and Australia between 2004 and 2008. In outer regional Northern Territory and Australia, rates of smoking during pregnancy among Indigenous mothers appear to have declined over that period (Table 6.2).
577 Origin Consulting and Bowchung Consulting, op. cit., pp. 6–7.

Improving child and family health
228 Northern Territory Emergency Response: Evaluation Report 2011
Table 6.2 Proportion of Indigenous mothers who smoked during pregnancy, Northern Territory and Australia, by remoteness
Remote and very remote Outer regional Proportion (%) Northern Territory Australia Northern Territory Australia 2004–2005 50.7 53.6 58.7 56.9 2006–2007 50.5 54.2 57.1 56.0 2008 50.9 54.2 46.8 54.8 Source: AIHW analyses of National Perinatal Data Collection.
Birthweight
The proportion of babies who weigh less than 2,500 grams at birth (low birthweight) born to Indigenous mothers has remained fairly stable in the Northern Territory and Australia. Rates of low birthweight in remote and very remote areas of the Northern Territory remain at a higher level than those seen among Indigenous children in outer regional Northern Territory and Australia (Table 6.3).
Mean birthweight has also remained fairly stable over time for Indigenous babies in remote and very remote areas of the Northern Territory and Australia (Table 6.4). From 2005–06 to 2007–08 there has been a slight increase in mean birthweight for Indigenous babies in outer regional areas of the Northern Territory.
Table 6.3 Proportion of low birthweight babies among Indigenous Australians in the Northern Territory and Australia, by remoteness
Remote and very remote Outer regional Proportion (%) Northern Territory Australia Northern Territory Australia 2001–2002 11.9 12.2 11.9 11.6 2003–2004 14.0 13.2 12.2 11.9 2005–2006 13.7 12.9 13.4 11.9 2007–2008 13.2 12.5 11.1 10.9 Source: AIHW analyses of National Perinatal Data Collection.
Table 6.4 Mean birthweight of Indigenous babies in the Northern Territory and Australia, by remoteness
Remote and very remote Outer regional Mean birth weight (grams) Northern Territory Australia Northern Territory Australia 2001 3,150 3,170 3,168 3,202 2002 3,139 3,156 3,157 3,195 2003 3,096 3,144 3,126 3,171 2004 3,097 3,134 3,224 3,178 2005 3,104 3,126 3,137 3,178 2006 3,096 3,141 3,132 3,182 2007 3,128 3,139 3,214 3,216 2008 3,128 3,171 3,283 3,210 Source: AIHW analyses of National Perinatal Data Collection.
Growth Assessment and Action Program The Northern Territory Growth Assessment and Action (GAA) Program provides population-level information on the growth status of Indigenous children aged under 5 years living in remote communities across the Northern Territory. An estimated 3,800 children under five live

Improving child and family health
Northern Territory Emergency Response: Evaluation Report 2011 229
in remote communities, with an annual birth cohort of around 550. Annually, 78–80 communities participate in each collection of data578 by the NT DoH and ACCHO sites.
The GAA data provide information on four key indicators of children’s growth status: anaemia, proportion underweight, wasting and stunting. These can be used as a good marker of trends in the overall health of young Indigenous children in remote communities before the NTER. From 2004 to 2010, the rate of all four indicators was 22 per cent to 25 per cent. However, the rates of underweight and wasting have increased slightly in recent years. Both wasting and underweight are considered to be symptomatic of acute, rather than chronic, problems of growth and may be related to poor nutritional intake, infections and/or parasitic diseases.
The growth measures presented in this chapter are based on the WHO 2006 classification, whereas previously published GAA data from the Northern Territory have used Centers for Disease Control and Prevention 2000 reference tables.579
GAA growth measures definitions are as follows580:
• Wasting is defined as ‘below minus two standard deviations from median weight for height of reference population’.
• Stunting is defined as ‘below minus two standard deviations from median height for age of reference population’.
• Underweight is defined as ‘below minus two standard deviations from median weight for age of reference population’.
• Anaemia is determined using cut-offs based on age (HemoCue hemoglobinometer) as per CARPA protocol581:
– 6–12 months: Hb <105g/dL
– 1 year – 5years: Hb <110g/dL.
Two figures are presented for each indicator: data from 2004–2007 (pre-NTER interventions) and data from 2004–2010 (incorporating the interventions).
Anaemia, by age and sex
Among Indigenous children aged 0 to 4 years who were tested for anaemia between 2008 and 2010, those aged 1 year or less were most likely to be diagnosed with anaemia. The rates of anaemia decreased with age for boys from 0 to 4 and for girls from 1 to 4.
Over the 2004–2010 period in the Northern Territory, the age-standardised rate of anaemia among Indigenous children aged 0–4 years decreased significantly (average yearly decrease of 1.2 cases per 100 children, equivalent to a 25 per cent decline over the whole period). Between 2004 and 2007, there was a decline of 12.7 per cent; the annual change in anaemia prevalence was also 1.2 per cent (Table 6.5 and Figure 6.1).
While care should be exercised when examining short-term trends, the age-standardised rate of anaemia has fallen since 2007 for both boys and girls.
578 Northern Territory Department of Health and Families, Healthy under five kids data collection (GAA) program, second release, Northern Territory government, Darwin, 2009. 579 R.J Kuczmarski, C.L Ogden, S.S Guo, et al. 2000 CDC growth charts for the United States: Methods and development. Vital Health Statistics, vol. 11, no. 246, 2002. 580 World Health Organization. WHO child growth standards: length/height-for-age, weight-for-age, weight-for-height and body mass index-for-age: Methods and development, World Health Organization, Geneva, 2006. 581 Central Australian Rural Practitioners Association, CARPA standard treatment manual (5th Ed), Central Australian Rural Practitioners Association, Alice Springs, 2009.

Improving child and family health
230 Northern Territory Emergency Response: Evaluation Report 2011
Table 6.5 Number and age-standardised rate of Indigenous children aged 0 to 4 diagnosed with anaemia, by sex, Northern Territory, 2004–2010
2004 2005 2006 2007 2008 2009 2010 Annual
change(a) % change
over period(b) Total numbers of children who were diagnosed with anaemia Males 433 374 288 312 315 308 278 n.a. n.a. Females 377 330 294 268 322 278 274 n.a. n.a. Persons 810 704 582 580 637 586 552 n.a. n.a. Total numbers of children tested for anaemia Males 1,550 1,313 1,226 1,240 1,334 1,371 1,301 n.a. n.a. Females 1,428 1,236 1,161 1,182 1,313 1,276 1,244 n.a. n.a. Persons 2,978 2,549 2,387 2,422 2,647 2,647 2,545 n.a. n.a. Age-standardised rate per 100 population(c) Males 29.8 30.7 25.8 27.7 25.3 24.1 22.2 –1.3(d) –26% Females 27.7 28.5 27.2 24.1 25.3 22.1 22.5 –1.1(d) –24% Persons 28.8 29.6 26.5 25.9 25.3 23.2 22.3 –1.2(d) –25% n.a. = not applicable. (a) Average annual change in rates determined using linear regression analysis. (b) Percentage change between 2004 and 2010 based on the average annual change over the period. (c) Directly age standardised by 1 year age groups using the 2001 Indigenous children population in the Northern Territory. (d) Results with statistically significant increases or declines at the p < 0.05 level over the 2004–2010 period. Source: AIHW analysis of HU5K/GAA data collection.
Figure 6.1 Age-standardised rate of anaemia among Indigenous children aged 0 to 4, by sex, Northern Territory, 2004–2010
Source: AIHW analysis of HU5K/GAA data collection.
Underweight among Indigenous children
The proportion of Indigenous children who are underweight has been changing since 2004. By 2007, there had been a significant decline of 13 per cent in the proportion of underweight children. From 2004 to 2010, the age-standardised proportion of Indigenous children aged 0 to 4 who were underweight decreased significantly by 26 per cent. Over the same period, the age-standardised proportion of Indigenous boys who were underweight also decreased significantly. Although there was a decline in the proportion of Indigenous girls who were underweight, this was not statistically significant (Table 6.6 and Figure 6.2).
While care should be exercised with short-term comparisons, the age-standardised data suggest that the proportion of Indigenous children who are underweight was slightly higher in 2010 than it was in 2007; however, the latest results are lower than they were in 2004 and 2005.

Improving child and family health
Northern Territory Emergency Response: Evaluation Report 2011 231
Table 6.6 Number and age-standardised rate of Indigenous children aged 0 to 4 diagnosed as underweight, by sex, Northern Territory, 2004–2010
2004 2005 2006 2007 2008 2009 2010 Annual
change(a) % change
over period (b) Total numbers of children diagnosed as underweight Males 212 160 135 130 109 140 158 n.a. n.a. Females 132 121 83 84 86 92 118 n.a. n.a. Persons 344 281 218 214 195 232 276 n.a. n.a. Total numbers of children measured for weight Males 1,800 1,557 1,432 1,551 1,590 1,743 1,736 n.a. n.a. Females 1,642 1,449 1,354 1,465 1,563 1,617 1,659 n.a. n.a. Persons 3,442 3,006 2,786 3,016 3,153 3,360 3,395 n.a. n.a. Age-standardised rate per 100 population(c) Males 11.7 10.4 9.2 8.4 6.9 8.0 9.2 –0.5(d) –27% Females 8.2 8.2 6.1 5.7 5.5 5.7 7.1 –0.3 –23% Persons 10.1 9.4 7.7 7.1 6.2 6.9 8.2 –0.4(d) –26% (a) Average annual change in rates determined using linear regression analysis. (b) Percentage change between 2004 and 2010 based on the average annual change over the period. (c) Directly age standardised by 1 year age groups using the 2001 Indigenous children population in the Northern Territory. (d) Results with statistically significant increases or declines at the p < 0.05 level over the 2004–2010 period. Source: AIHW analysis of HU5K/GAA data collection.
Figure 6.2 Age-standardised rate of underweight among Indigenous children aged 0–4, by sex, Northern Territory, 2004–2010
Source: AIHW analysis of HU5K/GAA data collection.
Wasting
Between 2004 and 2010, the age-standardised proportion of Indigenous children aged 0 to 4 whose growth measures indicated they were wasting decreased significantly. The fitted trend implies an average yearly decrease of 0.3 cases per 100 children, equivalent to a 26 per cent decline over the period. The age-standardised rate of wasting among Indigenous girls decreased significantly, but there were no significant changes in the rate for boys (Table 6.7 and Figure 6.3).
The proportion of Indigenous children who are diagnosed as wasted has shown little change since 2007.

Improving child and family health
232 Northern Territory Emergency Response: Evaluation Report 2011
Table 6.7 Number and age-standardised rate of Indigenous children aged 0 to 4 diagnosed as wasted, by sex, Northern Territory, 2004–2010
2004 2005 2006 2007 2008 2009 2010 Annual
change(a) % change
over period(b) Total numbers of children diagnosed as wasted Males 119 78 68 65 69 82 69 n.a. n.a. Females 78 82 56 53 56 52 58 n.a. n.a. Persons 197 160 124 118 125 134 127 n.a. n.a. Total numbers of children measured for wasting Males 1,649 1,413 1,333 1,407 1,470 1,479 1,334 n.a. n.a. Females 1,497 1,331 1,265 1,320 1,439 1,398 1,323 n.a. n.a. Persons 3,146 2,744 2,598 2,727 2,909 2,877 2,657 n.a. n.a. Age-standardised rate per 100 population(c) Males 7.3 5.6 5.3 4.6 4.6 5.6 5.2 –0.3 –21% Females 5.4 6.2 4.6 4.1 4.1 3.9 4.4 –0.3(d) –32% Persons 6.5 5.9 5.0 4.4 4.4 4.8 4.8 –0.3(d) –26% (a) Average annual change in rates determined using linear regression analysis. (b) Percentage change between 2004 and 2010 based on the average annual change over the period. (c) Directly age standardised by 1 year age groups using the 2001 Indigenous children population in the Northern Territory. (d) Results with statistically significant increases or declines at the p < 0.05 level over the 2004–2010 period. Source: AIHW analysis of HU5K/GAA data collection.
Figure 6.3 Age-standardised rate of wasting among Indigenous children aged 0–4, by sex, Northern Territory, 2004–2010
Source: AIHW analysis of HU5K/GAA data collection.
Stunting among Indigenous children
Between 2004 and 2010, the age-standardised rate of stunting among Indigenous children aged 0 to 4 decreased significantly. The fitted trend implies an average yearly decrease of 0.6 cases per 100 children, equivalent to a 22 per cent decline over the period (Table 6.8 and Figure 6.4).
While care is required in making short-term comparisons, the age-standardised proportion of Indigenous children diagnosed as being stunted was lower in 2010 than it was in 2007.

Improving child and family health
Northern Territory Emergency Response: Evaluation Report 2011 233
Table 6.8 Number and age-standardised rate of Indigenous children aged 0 to 4 diagnosed as stunted, by sex, Northern Territory, 2004–2010
2004 2005 2006 2007 2008 2009 2010 Annual
change(a) % change
over period(b) Total numbers of children diagnosed as stunted Males 322 274 262 251 245 231 221 n.a. n.a. Females 205 175 146 164 160 141 155 n.a. n.a. Persons 527 449 408 415 405 372 376 n.a. n.a. Total numbers of children measured for stunting Males 1,648 1,410 1,328 1,407 1,476 1,484 1,393 n.a. n.a. Females 1,488 1,319 1,254 1,323 1,435 1,406 1,378 n.a. n.a. Persons 3,136 2,729 2,582 2,730 2,911 2,890 2,771 n.a. n.a. Age-standardised rate per 100 population(c) Males 18.9 18.6 19.2 17.5 16.4 15.3 15.9 –0.7(d) –21% Females 13.5 13.0 11.6 12.2 10.9 9.9 11.3 –0.5(d) –22% Persons 16.3 16.0 15.5 14.9 13.6 12.7 13.6 –0.6(d) –22% (a) Average annual change in rates determined using linear regression analysis. (b) Percentage change between 2004 and 2010 based on the average annual change over the period. (c) Directly age standardised by 1 year age groups using the 2001 Indigenous children population in the Northern Territory. (d) Results with statistically significant increases or declines at the p < 0.05 level over the 2004–2010 period. Source: AIHW analysis of HU5K/GAA data collection.
Figure 6.4 Age-standardised rate of stunting among Indigenous children aged 0 to 4, by sex, Northern Territory, 2004–2010
Source: AIHW analysis of HU5K/GAA data collection.
School Nutrition Program survey data
The previous section on the growth patterns of young Indigenous children in remote areas highlights the importance of good nutrition. One of the NTER’s initiatives was the DEEWR-funded School Nutrition Program (SNP), which is a breakfast and/or lunch service for school-aged children in remote communities. While the program was primarily designed to increase school attendance and improve children’s learning, the provision of nutritious food is also likely to have a positive effect on children’s health.
A DEEWR survey of SNP stakeholders between March and June 2009, presented qualitative and quantitative data on the impact of school breakfast/lunch programs.582 Parents of eligible children, program advisers, Government Business Managers, Community Employment Brokers and school principals were surveyed.
582 DEEWR, Findings of the School Nutrition Program Stakeholder Survey: March to June 2009, DEEWR, Darwin, 2009.

Improving child and family health
234 Northern Territory Emergency Response: Evaluation Report 2011
In total, 80 per cent of respondents reported that the SNP had a positive impact on children’s behaviour. While findings were not clear on the SNP’s influence on student enrolment and attendance, 100 per cent of service providers, 66 per cent of parents and 59 per cent of principals believed the SNP had a positive effect on students’ general health and wellbeing.
A high proportion of Government Business Managers and Community Employment Brokers reported a positive impact on children’s engagement with education (85%) and beneficial impacts on children’s general health and nutrition (89%). The survey respondents also believed that the SNP led to a good understanding in the community of the importance of good nutrition for children’s ability to learn. This was reported by 89 per cent of providers, 94 per cent of parents and 75 per cent of principals.
Trends in hospitalisations
Changes in the patterns of hospitalisations, particularly by cause and age, can provide information on a population’s health needs, contributors to morbidity and morbidity, and areas for improvement in service delivery. For example, hospitalisations for ambulatory-care sensitive conditions provide an indicator of unmet needs for primary care services in the community. Hospitalisation rates across populations can also highlight gaps in both health status and patterns of health service use. Hospitalisations for both Indigenous children and adults are two of the key performance indicators in the COAG National Indigenous Reform Agreement.
As noted above, however, hospitalisation data do not equate to prevalence rates of conditions in the community (see ‘Methods used for this chapter’ and Appendix 6A for a fuller discussion of these issues).
Potentially, the NTER health initiatives could affect hospitalisations in several ways over time. The enhancement of primary health services through the EHSDI could decrease the rate of preventable (or ambulatory-care sensitive) hospitalisations through prevention or better management of early stage chronic illnesses in the community. On the other hand, hospitalisations for children could increase for conditions identified during the CHCI, particularly if they require specialist care or surgery. If they are widespread enough, the AOD reforms could potentially decrease hospitalisations related to alcohol and other drugs (including those for violence).
This section uses data from the AIHW’s National Hospital Morbidity Database to present key information on hospitalisations, beginning with overall hospitalisation rates by age and remoteness along with potentially preventable hospitalisation rates. Hospitalisation rates for Indigenous children by cause are presented next, followed by rates for alcohol and violence-related causes among Indigenous and non-Indigenous residents of the Northern Territory.
One of the limitations of the dataset is the difficulty in identifying prescribed areas. Because all the prescribed areas are in remote/very remote areas, all patients who reside in remote/very remote areas are aggregated together and this is used as a proxy measure for prescribed areas. Because of the lack of reliable and consistent estimates of the Indigenous population by remoteness area in the Northern Territory before the 2006 Census, hospitalisation data by remoteness area are presented only from 2006–07 onward (which essentially provides a single year baseline before the NTER).
It should also be noted that the analyses are done using the patient’s place of usual residence rather than the hospital where they received treatment. This means that some patients who are residents of the Northern Territory but received treatment from a hospital in another jurisdiction are not captured in the analyses.

Improving child and family health
Northern Territory Emergency Response: Evaluation Report 2011 235
Hospitalisation rates
Table 6.9 presents trends in total hospitalisation rates by age group and remoteness status for Indigenous Australians in the Northern Territory and Australia. Because only four years of data are available, caution must be used in making conclusions about time trends.
Table 6.9 Total hospitalisation rates of Indigenous Australians in the Northern Territory and Australia, by age group and remoteness (rate per 1,000 people)
Remote and very remote Outer regional Age group Northern Territory Australia Northern Territory Australia 0–14 years 2006–07 248.5 244.6 161.3 129.4 2007–08 263.1 265.1 144.5 134.9 2008–09 294.1 262.8 159.4 146.4 2009–10 297.7 270.8 156.3 151.3
15–24 years 2006–07 290.1 336.9 287.9 226.0 2007–08 284.3 354.7 312.9 236.9 2008–09 301.7 352.7 284.0 247.5 2009–10 313.3 357.1 287.0 257.2
25+ years 2006–07 524.1 568.5 523.0 349.9 2007–08 514.9 579.9 530.1 366.5 2008–09 540.8 584.4 509.7 388.4 2009–10 595.4 619.4 518.0 412.9
Source: AIHW analyses of National Hospital Morbidity Database (NHMD).
The data show two key patterns: Indigenous Australians living in remote/very remote areas (whether in the Northern Territory or Australia) have higher rates of hospitalisation than those living in outer regional areas. The remote/non-remote differences may be due to numerous factors, including differences in disease prevalence rates, environmental factors, lack of primary health providers, and differential service use patterns. It is important to note, however, that not all remote Indigenous communities are characterised by high levels of morbidity and mortality.583
The second pattern is the increase in hospitalisation rates across all age groups and remoteness categories between 2006 and 2010, except for those living in outer regional areas of the Northern Territory.
Indigenous children in remote and very remote areas (referred to as ‘remote areas’ in this text) are much more likely to be hospitalised than either Indigenous children in outer regional areas or other children in remote areas and outer regional areas, and the increase in hospitalisation rates appears to be greater for children from these areas. Further analyses showed that the increase was mainly due to increased hospitalisations for diseases of the ear. This may be attributable to more children being referred to hospital following child health checks or due to heightened awareness and services, particularly audiology and ENT services, resulting from the NTER and associated initiatives.
The top reasons for hospitalisations among infants in remote areas included acute bronchiolitis; disorders related to short gestation and low birthweight; other gastroenteritis and colitis infections; pneumonia; acute upper respiratory infections of multiple and unspecified sites; and viral and other specified intestinal infections. Disorders related to short gestation and low birthweight, acute bronchiolitis, pneumonia, disorders of urinary system and
583 K. Rowley et al, ‘Lower than expected morbidity and mortality for an Australian Aboriginal population: 10-year follow-up in a decentralised community.’ Medical Journal of Australia, vol. 188, 2008, pp. 283–287.

Improving child and family health
236 Northern Territory Emergency Response: Evaluation Report 2011
respiratory distress of newborns appeared as main causes for other Indigenous babies in outer regions.
Potentially preventable hospitalisations
Potentially preventable hospitalisations indicate the extent to which people were hospitalised for conditions that could have been prevented if more effective care had been available, either at an earlier stage of the disease progression or as an alternative to hospital care. Hospitalisation rates for potentially preventable conditions among Indigenous people in the Northern Territory were five times the rate for other Territorians (117 and 24 per 1,000, respectively) (Table 6.10). Within the Indigenous population, the rates of potentially preventable hospitalisations are highest among adults and those in remote and very remote locations. Over time, the rates have shown a general increase for Indigenous people of all ages.
Table 6.10 Rates of potentially preventable hospitalisations per 1,000 population, Northern Territory (2002–03 to 2009–10), by remoteness (2006–07 to 2009–10) and age
Indigenous Other 0–14 15–24 25+ Total(a) 0–14 15–24 25+ Total Outer regional 2006–07 27.3 19.0 189.2 98.4 16.1 11.4 32.1 25.9 2007–08 27.9 24.6 189.4 99.7 16.5 11.1 33.0 26.6 2008–09 36.8 19.9 164.1 90.8 17.7 10.9 26.7 22.7 2009–10 34.2 22.9 153.9 85.8 14.7 9.8 25.6 21.2 Remote 2006–07 41.8 32.1 243.8 135.1 23.4 22.5 36.5 32.1 2007–08 52.9 32.8 271.4 152.1 24.8 24.5 42.5 36.7 2008–09 71.9 33.2 259.6 153.1 28.2 19.8 35.0 31.7 2009–10 66.6 44.9 267.3 157.1 31.0 19.8 30.4 29.1 Very remote 2006–07 34.0 23.7 177.1 95.5 24.5 23.3 26.9 26.1 2007–08 41.5 25.5 159.4 90.6 15.2 15.7 31.8 26.9 2008–09 64.9 25.6 154.3 96.5 23.1 13.2 32.9 28.8 2009–10 62.3 30.3 187.5 111.3 25.8 14.5 30.4 27.6
2002–03 33.2 19.8 114.6 67.3 19.1 11.8 22.9 20.7 2003–04 34.3 21.6 134.1 76.9 17.8 8.9 22.2 19.5 2004–05 33.0 23.1 163.2 89.9 15.6 10.8 26.9 22.5 2005–06 31.6 20.9 186.0 99.3 17.3 12.4 29.7 24.9 2006–07 34.3 24.7 195.9 105.4 18.3 15.1 33.0 27.6 2007–08 41.2 26.9 192.7 106.8 18.2 14.1 35.0 28.8 2008–09 60.4 26.2 182.0 108.6 20.3 12.9 29.1 25.1
Northern Territory(b)
2009–10 57.2 32.2 200.3 116.9 19.0 12.1 27.1 23.5 (a) Including hospital separations with unknown age. (b) Including hospital separations with missing remoteness area information for the usual residence. Note: Rates based on 2006 population. Source: AIHW analyses of NHMD.
An increase in potentially preventable hospitalisations for Indigenous children occurred across all remoteness classifications between 2006–07 and 2008–09, followed by a drop in 2009–10. The increase between 2006–07and 2007–08 was greater in the remote and very remote areas, however. This timing coincides with the timing of the CHCI implementation.
Hospitalisation trends for children
This section presents hospitalisation rates of Indigenous children in the Northern Territory for diseases that were found to be highly prevalent at the time of the health checks, as well as for other conditions that are highly prevalent among children.
Infectious and parasitic disease hospitalisations among Indigenous children aged 0–14 in remote areas of the Northern Territory and in Australia as a whole have declined, but remain

Improving child and family health
Northern Territory Emergency Response: Evaluation Report 2011 237
at a higher level than that seen among Indigenous children in outer regional areas of the Northern Territory and Indigenous Australian children as a whole (Table 6.11).
Table 6.11 Infectious and parasitic diseases hospitalisation rates of Indigenous children aged 0 to 14 in Northern Territory and Australia, by remoteness
Remote and very remote Outer regional Rate per 1,000 population Age group Northern Territory Australia Northern Territory Australia 0–14 years 2006–07 40.3 35.3 18.0 11.7 2007–08 41.3 38.2 17.2 11.3 2008–09 38.4 27.8 14.7 9.9 2009–10 38.0 29.6 11.0 9.6 Source: AIHW analyses of NHMD.
Diabetes-related hospitalisations for young children are not very common and have fluctuated between 4 and 7 per 1,000 children among Indigenous children aged 0–14 in remote and very remote areas. Indigenous children in remote and very remote areas of Australia also had similar levels of hospitalisations to those in the Northern Territory, while Indigenous children in outer regional areas of Northern Territory and Australia always had lower rates of hospitalisation compared with their remote and very remote counterparts (Appendix 6B, Table 6B.8).
Mental and behavioural disorders hospitalisations are lower among Indigenous children in remote and very remote areas, and have remained constant over time. In contrast, Indigenous children in outer regional areas had somewhat higher rates of hospitalisation for such disorders (Table 6.12).
Table 6.12 Mental and behavioural disorders, hospitalisation rates of Indigenous children aged 0 to 14 in the Northern Territory and Australia, by remoteness
Remote and very remote Outer regional Rate per 1,000 population Age group Northern Territory Australia Northern Territory Australia 0–14 years 2006–07 0.6 1.1 0.6 1.9 2007–08 0.7 1.4 1.0 2.1 2008–09 0.6 1.1 0.0 3.0 2009–10 0.6 1.5 0.6 3.2 Source: AIHW analyses of NHMD.
Hospitalisations due to diseases of the eye are higher for Indigenous children in remote and very remote Australia compared with those for children in outer regional areas of Northern Territory and Australia (Table 6.13). For Indigenous children in remote and very remote areas, there has been a slight increase in eye disease related hospitalisations in the most recent three years.
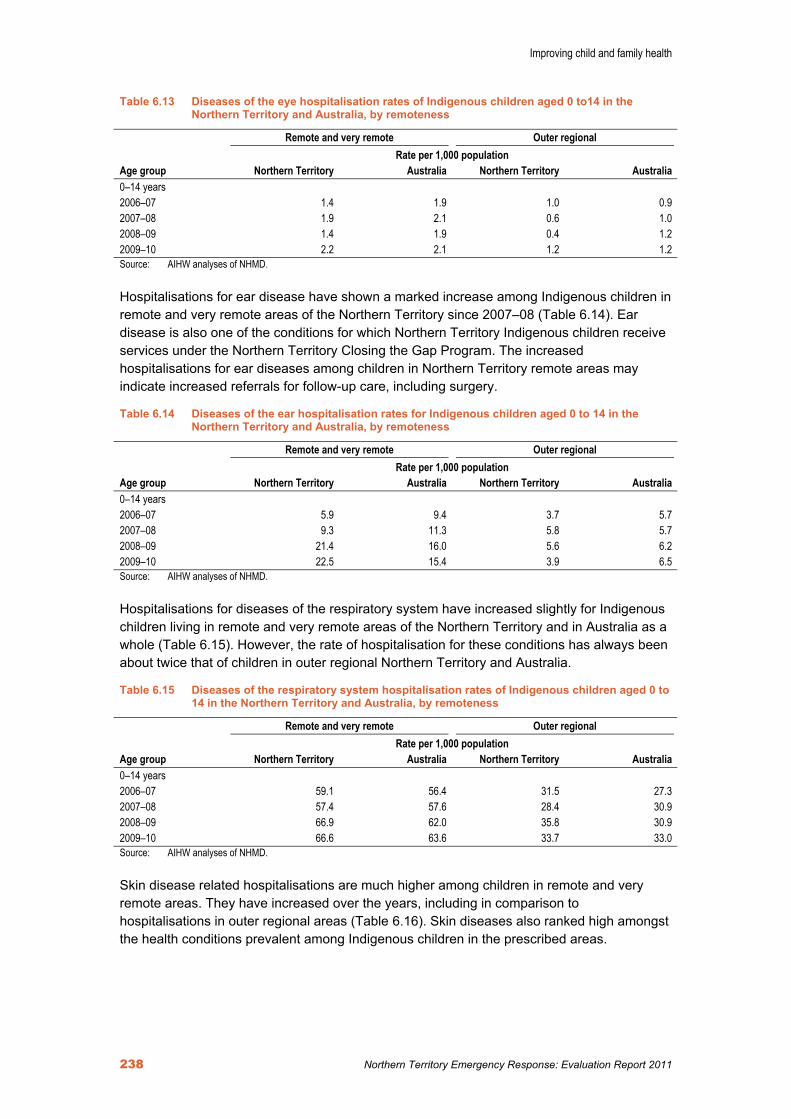
Improving child and family health
238 Northern Territory Emergency Response: Evaluation Report 2011
Table 6.13 Diseases of the eye hospitalisation rates of Indigenous children aged 0 to14 in the Northern Territory and Australia, by remoteness
Remote and very remote Outer regional Rate per 1,000 population Age group Northern Territory Australia Northern Territory Australia 0–14 years 2006–07 1.4 1.9 1.0 0.9 2007–08 1.9 2.1 0.6 1.0 2008–09 1.4 1.9 0.4 1.2 2009–10 2.2 2.1 1.2 1.2 Source: AIHW analyses of NHMD.
Hospitalisations for ear disease have shown a marked increase among Indigenous children in remote and very remote areas of the Northern Territory since 2007–08 (Table 6.14). Ear disease is also one of the conditions for which Northern Territory Indigenous children receive services under the Northern Territory Closing the Gap Program. The increased hospitalisations for ear diseases among children in Northern Territory remote areas may indicate increased referrals for follow-up care, including surgery.
Table 6.14 Diseases of the ear hospitalisation rates for Indigenous children aged 0 to 14 in the Northern Territory and Australia, by remoteness
Remote and very remote Outer regional Rate per 1,000 population Age group Northern Territory Australia Northern Territory Australia 0–14 years 2006–07 5.9 9.4 3.7 5.7 2007–08 9.3 11.3 5.8 5.7 2008–09 21.4 16.0 5.6 6.2 2009–10 22.5 15.4 3.9 6.5 Source: AIHW analyses of NHMD.
Hospitalisations for diseases of the respiratory system have increased slightly for Indigenous children living in remote and very remote areas of the Northern Territory and in Australia as a whole (Table 6.15). However, the rate of hospitalisation for these conditions has always been about twice that of children in outer regional Northern Territory and Australia.
Table 6.15 Diseases of the respiratory system hospitalisation rates of Indigenous children aged 0 to 14 in the Northern Territory and Australia, by remoteness
Remote and very remote Outer regional Rate per 1,000 population Age group Northern Territory Australia Northern Territory Australia 0–14 years 2006–07 59.1 56.4 31.5 27.3 2007–08 57.4 57.6 28.4 30.9 2008–09 66.9 62.0 35.8 30.9 2009–10 66.6 63.6 33.7 33.0 Source: AIHW analyses of NHMD.
Skin disease related hospitalisations are much higher among children in remote and very remote areas. They have increased over the years, including in comparison to hospitalisations in outer regional areas (Table 6.16). Skin diseases also ranked high amongst the health conditions prevalent among Indigenous children in the prescribed areas.

Improving child and family health
Northern Territory Emergency Response: Evaluation Report 2011 239
Table 6.16 Diseases of the skin hospitalisation rates of Indigenous children aged 0 to 14 in the Northern Territory and Australia, by remoteness
Remote and very remote Outer regional Rate per 1,000 population Age group Northern Territory Australia Northern Territory Australia 0–14 years 2006–07 23.0 20.9 10.1 5.8 2007–08 23.0 21.3 12.8 6.6 2008–09 25.2 22.4 13.5 6.7 2009–10 26.7 22.3 10.1 6.4 Source: AIHW analyses of NHMD.
Hospitalisations for conditions originating in the perinatal period have remained fairly stable over time for Indigenous children in all areas (Table 6.17).
Table 6.17 Certain conditions in perinatal period, hospitalisation rates of Indigenous children aged 0 to 14 in the Northern Territory and Australia, by remoteness
Remote and very remote Outer regional Rate per 1,000 population Age group Northern Territory Australia Northern Territory Australia 0–14 years 2006–07 17.2 16.9 21.5 13.5 2007–08 19.7 18.6 12.8 12.9 2008–09 18.9 18.1 17.8 15.1 2009–10 21.4 20.9 16.2 14.9 Source: AIHW analyses of NHMD.
Injury and poisoning related hospitalisations were high and remained fairly stable over time for Indigenous children in remote and very remote areas of the Northern Territory and Australia (Table 6.18). Children in outer regional areas also experienced high rates of hospitalisation for injury and poisoning, but the rates remained reasonably constant over time and were slightly lower than rates in remote areas.
Table 6.18 Injury and poisoning and external causes, hospitalisation rates of Indigenous children aged 0 to 14 in the Northern Territory and Australia, by remoteness
Remote and very remote Outer regional Rate per 1000 population Age group Northern Territory Australia Northern Territory Australia 0–14 years 2006–07 24.5 29.8 21.3 18.2 2007–08 24.9 31.1 19.3 17.8 2008–09 26.9 30.3 21.3 20.2 2009–10 30.5 33.4 25.1 20.1 Source: AIHW analyses of NHMD.
Assault
Between 2001–02 and 2007–08, hospitalisation rates for assault showed a non-significant increase among Indigenous Territorians, while there was a significant increase among other Territorians (tables 6.19 and 6.20). Indigenous people in remote areas are more likely than those in outer regional areas to be hospitalised for assault. There was a small decrease in assault hospitalisations among remote area Indigenous people (from 31 per 1,000 in 2006–07 to 30 in 2009–10).

Improving child and family health
240 Northern Territory Emergency Response: Evaluation Report 2011
Table 6.19 Indigenous Australians, age-standardised hospitalisations for assault, by Australian Standard Geographical Classification (ASGC) of usual residence, public hospitals, Northern Territory, per 1,000 population, 2001–02 to 2009–10
Year Outer regional Remote and Very remote Total
2001–02 24.7 2002–03 21.6 2003–04 22.0 2004–05 27.2 2005–06 31.6 2006–07 19.1 30.5 28.2 2007–08 17.9 28.6 26.4 2008–09 20.1 29.2 27.5 2009–10 19.2 29.9 27.8 Notes: 1. Categories are based on the ICD-10-AM 2nd through 6th edition (National Centre for Classification in Health 2008). 2. Data are reported by ASGC of usual residence, probabilistically assigned using postcode or statistical local area (SLA) and state of
usual residence variables supplied by the jurisdiction. 3. Care types 7.3, 9 and 10 (Newborn—unqualified days only; posthumous organ procurement; hospital boarder) excluded from
analysis. 4. Excludes not stated and null responses. 5. Rates have been directly age standardised using the 2001 Australian standard population. Source: AIHW analyses of NHMD.
Table 6.20 Other Australians, age-standardised hospitalisations for assault, by ASGC of usual residence, public hospitals, Northern Territory, per 1,000 population, 2001–02 to 2009–10
Year Outer regional Remote and Very remote Total
2001–02 0.9 2.2 1.3 2002–03 1.5 2.2 1.7 2003–04 1.2 2.2 1.5 2004–05 1.3 1.5 1.3 2005–06 1.4 1.7 1.5 2006–07 1.4 2.4 1.7 2007–08 1.7 2.2 1.8 2008–09 1.3 2.4 1.6 2009–10 1.5 2.7 1.9 Notes: 1. Categories are based on the ICD-10-AM 2nd through 6th edition (National Centre for Classification in Health 2008). 2. ‘Other’ includes hospitalisations of non-Indigenous people and those for whom Indigenous status was not stated. 3. Data are reported by ASGC of usual residence, probabilistically assigned using postcode or SLA and state of usual residence
variables supplied by the jurisdiction. 4. Care types 7.3, 9 and 10 (Newborn—unqualified days only; posthumous organ procurement; hospital boarder) excluded from
analysis. 5. Excludes not stated and null responses. 6. Rates have been directly age standardised using the 2001 Australian standard population. Source: AIHW analyses of NHMD.
Alcohol
Between 2001–02 and 2009–10 hospitalisation rates for alcohol-related problems in the Northern Territory increased significantly (Table 6.21). Indigenous Territorians in remote areas are more likely than those in outer regional areas to be hospitalised for alcohol-related problems. There was a continuous increase in the rate of alcohol-related hospitalisations among Indigenous people in remote and very remote areas, while among Indigenous people in outer regional areas the rate has declined in the most recent period (2009–10).

Improving child and family health
Northern Territory Emergency Response: Evaluation Report 2011 241
Table 6.21 Indigenous Australians, age-standardised hospitalisations for alcohol-related problems, by ASGC of usual residence, public hospitals, Northern Territory, per 1,000 population, 2001–02 to 2009–10
Year Outer regional Remote and Very remote Total
2001–02 n.a. n.a. 3.8 2002–03 n.a. n.a. 4.2 2003–04 n.a. n.a. 5.9 2004–05 n.a. n.a. 6.3 2005–06 n.a. n.a. 6.3 2006–07 4.2 5.7 5.4 2007–08 8.3 6.3 6.7 2008–09 8.6 6.5 6.9 2009–10 6.6 7.7 7.4 Notes: 1. Categories are based on the ICD-10-AM 2nd through 6th edition (National Centre for Classification in Health 2008). 2. Data are reported by ASGC of usual residence, probabilistically assigned using postcode or SLA and state of usual residence
variables supplied by the jurisdiction. 3. Care types 7.3, 9 and 10 (Newborn—unqualified days only; posthumous organ procurement; hospital boarder) excluded from
analysis. 4. Excludes not stated and null responses. 5. Rates have been directly age standardised using the 2001 Australian standard population. Source: AIHW analyses of NHMD.
Table 6.22 Other Australians, age-standardised hospitalisations for alcohol-related problems, by ASGC of usual residence, public hospitals, Northern Territory, per 1,000 population, 2001–02 to 2009–10
Year Outer regional Remote and Very remote Total
2001–02 0.9 2.2 1.3 2002–03 1.5 2.2 1.7 2003–04 1.2 2.2 1.5 2004–05 1.3 1.5 1.3 2005–06 1.4 1.7 1.5 2006–07 1.4 2.4 1.7 2007–08 1.7 2.2 1.8 2008–09 1.3 2.4 1.6 2009–10 1.5 2.7 1.9 Notes: 1. Categories are based on the ICD-10-AM 2nd through 6th edition (National Centre for Classification in Health 2008). 2. ‘Other’ includes hospitalisations of non-Indigenous people and those for whom Indigenous status was not stated. 3. Data are reported by ASGC of usual residence, probabilistically assigned using postcode or SLA and state of usual residence
variables supplied by the jurisdiction. 4. Care types 7.3, 9 and 10 (Newborn—unqualified days only; posthumous organ procurement; hospital boarder) excluded from
analysis. 5. Excludes not stated and null responses. 6. Rates have been directly age standardised using the 2001 Australian standard population. Source: AIHW analyses of NHMD.
Mortality Mortality is considered a good summary measure of the overall health status of a population, and, as such, provides an overview of the gap between Indigenous and non-Indigenous Australians in the Northern Territory. While mortality is a good summary measure of health status, it will not be affected by the NTER initiatives in the short term. The data show the following:
• The overall age-standardised mortality rate for Indigenous Territorians fell by 26.6 per cent from 1998 to 2009, and there was a statistically significant narrowing of the gap with non-Indigenous people.

Improving child and family health
242 Northern Territory Emergency Response: Evaluation Report 2011
• In the most recent period (2004–2008), the all-cause rate among Indigenous people was twice that among non-Indigenous Territorians (1,582.3 and 679.2 per 100,000 people, respectively).
• From 1998 to 2009, the Indigenous child (under 5) mortality rate in the Northern Territory declined by 41.5 per cent, compared with a 37.8 per cent decrease for non-Indigenous children.
Excess deaths While mortality rates are a useful summary measure of overall health status and give a good indication of the gap between the Indigenous and non-Indigenous populations, additional information is required on the factors underpinning the mortality differentials. One such indicator is ‘excess deaths’, which are those deaths which occur at a higher than expected rate and can be examined by cause.
Excess deaths are calculated by subtracting the number of expected Indigenous deaths based on the age, sex and cause-specific rates for non-Indigenous Australians, from the number of actual cause-specific deaths in the Indigenous population.
Diseases of the circulatory system accounted for the highest proportion of excess deaths among Indigenous Australians in the Northern Territory over the 2003–2007 period (26% of male deaths and 27% of female deaths). Other major causes were external causes (injury and poisoning); diseases of the respiratory system; endocrine, metabolic and nutritional diseases; diseases of the digestive system; and cancer.
Avoidable deaths Between 1991 and 1996, there were significant declines in mortality rates from avoidable causes of death among Indigenous Territorians aged 0–74. There was an average yearly decline in the rate of around 53 deaths per 100,000 population, which is equivalent to a 25 per cent reduction.
Between 1997 and 2007, there were significant declines in mortality rates from avoidable causes among Indigenous Territorians aged 0–74, and an average yearly decline in the rate of around 35 per 100,000. This is equivalent to a 20 per cent reduction.
The main causes of avoidable mortality among Indigenous Australians living in remote and very remote areas are cerebrovascular diseases, cancer, alcohol-related diseases and suicide.
For children living in the Northern Territory, external causes—which include events such as transport accidents, intentional self-harm and accidental poisoning—account for around one-quarter (26%) of all deaths of children aged 1 to 16.584
Changes in alcohol and other drug treatment services Data presented in this section are from the AIHW AOD Treatment Services National Minimum Data Set (AODTS–NMDS), which captures data on some of the publicly funded agencies that provide treatment to Aboriginal and Torres Strait Islander people. The AODTS–NMDS collects unit records for closed treatment episodes. It does not provide a complete picture of AOD treatment services in Australia.
584 NT Child Deaths Review and Prevention Committee (NT CDRPC), Annual Report 2009-2010, NT CDRPC, Darwin, 2010.

Improving child and family health
Northern Territory Emergency Response: Evaluation Report 2011 243
The number of closed treatment episodes provided to Indigenous clients in the Northern Territory increased for all age groups between 2006–07 and 2007–08 and then declined in 2008–09, with the exception of the 10–19 year age group, which showed an increase of around 56 per cent between 2007-08 and 2008-09 (Table 6.23). A similar pattern was observed for other Australians, but the increase in 2008–09 for the 10–19 year age group was not as great. Nationally, the proportion of clients aged 10–19 who have received closed treatment episodes remained constant over time.
Table 6.23 Closed treatment episodes, by age group of client and Indigenous status, Northern Territory
Indigenous Other Age 2006–07 2007–08 2008–09 2006–07 2007–08 2008–09 10–19 186 281 437 75 90 119 20–29 455 814 797 283 346 312 30–39 417 641 589 331 473 430 40–49 242 393 370 252 252 320 50–59 52 96 88 124 140 168 60 yrs+ 12 20 17 18 23 33 Total(a) 1,364 2,322 2,298 1,083 1,324 1,390 (a) Includes age not stated. Source: AIHW analysis of AODTS–NMDS unpublished data.
The number of closed treatment episodes provided to Indigenous clients in outer regional, remote and very remote areas of the Northern Territory for which the principal drug of concern was alcohol almost doubled between 2006–07 and 2007–08 and then remained relatively stable in 2008–09 (Table 6.24).
Table 6.24 Closed treatment episodes by principal drug of concern, Indigenous clients in the Northern Territory, by remoteness
Alcohol Other drugs
Outer
regional Remote Very remote Outer
regional Remote Very remote Indigenous number 2006–07 241 462 264 157 195 45 2007–08 600 833 477 175 227 10 2008–09 520 838 478 204 240 18 Source: AIHW analysis of AODTS–NMDS unpublished data.
Conclusions Because the NTER health initiatives were introduced into a dynamic context of health reform in which numerous initiatives were being implemented to try to improve health outcomes and close the gap between Indigenous and non-Indigenous people, it is difficult to attribute success or ascribe impacts or outcomes to any particular program or measure.
Nevertheless, the findings in this chapter suggest that, while the voluntary nature of the CHCI meant that it is not possible to capture data on all eligible children, the initiative did provide much-needed information on the health status of Indigenous children presenting for health checks and follow-ups in the prescribed areas. This enabled government funding to be directed to follow-up services in areas of high need (dental and hearing health).
The health checks rolled out under the NTER reached between 57 and 65 per cent of the eligible population; 99 per cent of children received some form of management of their health condition at the time of the health check; 70 per cent of those who had a health check

Improving child and family health
244 Northern Territory Emergency Response: Evaluation Report 2011
received at least one referral for a health condition; and, of those who received referrals, around two-thirds had been followed up as at June 2010.
Based on the small number of children who received more than one health check, there seems to have been some improvement in the health of Indigenous children in the Northern Territory over a short period of time. For example, audiology and ENT services provided to children indicate that there has been some improvement to their hearing, and a notable decline in middle ear conditions has occurred. At the same time, however, a third of children saw an increase in hearing problems.
Other data sources presented in this chapter show that there were other improvements in children’s health happening concurrently with the CHCI. For example, there was a significant decline in anaemia among young Indigenous children and in the proportion of children who were underweight, wasted and stunted since 2004. Those declines continued after 2007, although the rates for underweight and stunting have increased slightly in the past two years.
Hospitalisations for ear disease have shown an increase among Indigenous children in remote and very remote areas of the Territory since 2007–08, which may indicate increased referrals for follow-up care, including surgery, as a result of the CHCI.
AOD treatment services data indicate a marked increase in episodes of care provided to Indigenous children aged 10–19 in the Northern Territory since 2008–09. This may be a result of the AOD response, which intended to expand AOD treatment and rehabilitation services in the Territory.
Despite the aforementioned successes of the CHCI and the AOD, a number of problems emerged. Both initiatives were limited by difficulties in recruiting an appropriately skilled workforce able to provide continuity of care. In relation to the CHCI, the emergency nature of the response limited the opportunity for broad consultation. The capacity of the Northern Territory primary and specialist care system to fully meet the treatment needs arising from the child health checks was tested as the program unfolded.
The varied successes and problems that arose from the CHCI provide rich learning for implementing future programs and have led to the CHCI’s progression into the EHSDI. There is evidence to suggest that this will provide a more sustainable response to ongoing health issues in prescribed areas.
There remains much to be done to ensure that the objectives of the NTER are fully realised and the gaps in health disadvantage between Indigenous and non-Indigenous Australians are closed. Indigenous Australians living in remote areas of the Northern Territory will benefit from the continued expansion of primary health care, from follow-up care as part of the child health checks, and from expanded child specialist services and continued AOD treatment services.
Supporting families
Northern Territory Emergency Response: Evaluation Report 2011 245
7 Supporting families
Debbie Scott and Daryl Higgins, Australian Institute of Family Studies
The Australian Institute of Family Studies is committed to the creation and dissemination of research-based information on family functioning and wellbeing. The views expressed here are those of the individual authors and may not reflect those of the Australian Institute of Family Studies or the Australian Government. Debbie Scott is a Research Fellow, and Daryl Higgins is Deputy Director (Research) at the institute
Author note:
Unless specifically differentiated, ‘children’ is used here to refer to ‘children and young people’.
The authors gratefully acknowledge the support from the Department of Families, Housing, Community Services and Indigenous Affairs (FaHCSIA) and the Northern Territory Department of Children and Families, and members of the Advisory Group in providing access to data, reports, and giving feedback on the chapter.
Key findings • The Northern Territory Emergency Response (NTER) measures reviewed in this chapter
are called ‘Supporting Families’ measures; the objective of these measures were to support families and communities, through supporting the safety and wellbeing of children; however, the measures are also closely related to efforts to prevent and respond to child abuse and neglect. Therefore, this chapter focuses on risk factors associated with child protection concerns, such as poverty, parental alcohol/substance misuse, domestic violence, unemployment, and inadequate housing. Often, the risk factors that lead to child abuse or neglect are also those that are closely associated with family dysfunction.
• There are limited data to allow any direct monitoring of changes in child safety and family wellbeing in relation to NTER communities. Where available, proxy data show some positive changes in the characteristics of families and communities that are associated with family wellbeing and the safety of children.
• During the period since the introduction of the NTER measures, there has been a substantial increase in the number of child protection workers and police. This has been associated with an increase in the detection of violence and child abuse and neglect.
• Between 2007–08 and 2010–11, there was an 84 per cent increase in domestic violence incidents recorded by police in the NTER communities. This is probably associated with both increases in the number of police and the introduction of the mandatory reporting of domestic violence to police.
• Investment in child protection services has increased the availability of staff to investigate child safety concerns. Between 2007 and 2010, there was a 70 per cent increase in full-time equivalent child protection professionals working in the Northern Territory child protection department. Increased resources to authorities with responsibility for investigating concerns increase the capacity to detect and respond to notifications. This is associated with an increase in the number of cases that are substantiated, which in turn increases community confidence to make reports knowing that appropriate action is likely to be taken.
Supporting families
246 Northern Territory Emergency Response: Evaluation Report 2011
• During the period of the NTER, substantiations585 of child abuse and neglect have increased markedly in the Northern Territory as a whole—particularly in relation to Indigenous children. Similar increases in substantiation rates have occurred in other states and territories in the past decade, often in response to system reforms and increased investment following from an inquiry or system review.
• Rates of substantiated harm or risk of harm to children increased from 16.8 per 1,000 in 2006–07 to 33.5 per 1,000 in 2009–10. The largest proportion of substantiations was for the ‘neglect’ (51.4% of cases, which represents a rate of 18.1 per thousand children).
• Surveys of NTER communities show that most respondents feel their community to be improving, although the improvements were reported more often in small and medium-sized communities compared to larger communities.
• In the Evaluation of the Family Support Package: A community perspective report, four out of the five remote communities in the Northern Territory that participated in the study perceived that levels of family violence and child abuse had improved over recent years.586
• It is hard to produce definitive data to examine whether the NTER measures designed to prevent and respond to child abuse and neglect have been successful in reducing its occurrence. However, evidence suggests that there is an increased awareness of the problem of child abuse and neglect in Indigenous communities, and additional resources to deal with increased reporting and investigations have been provided.
Introduction In this chapter, we assess outcomes of the Northern Territory Emergency Response (NTER) relating to the ‘Supporting families’ measures under the Northern Territory National Partnership Agreement (NTNPA). We focus on one of the three specific outcomes under the NTNPA that relate to support for families: ‘Improved safety, health and wellbeing of Indigenous children’.
The NTNPA also lists one of its specific objectives as ‘Ensure the protection of women and children’.
The NTER ‘Supporting families’ measures are closely related to efforts to prevent and respond to child abuse and neglect. Therefore, the main focus in this chapter is on risk factors associated with child protection concerns. Often, the risk factors that lead to child abuse or neglect are also those that are closely associated with family dysfunction. Family dysfunction and child abuse/neglect do not occur in isolation and are complex issues. Consequently, many of the risk factors that affect the wellbeing of families—and the safety of children, in particular—are also relevant to other measures in the NTER. This chapter focuses on measures specifically as they relate to supporting families and protecting children; more in-depth analyses of some measures (such as housing, health and education) are in other chapters in the report. Where this occurs, specific mention is made to direct the reader to the chapter with additional information.
585 Substantiation is defined by the Australian Institute of Health and Welfare (AIHW) as a notification to a state or territory department responsible for child protection matters that has been investigated and about which it was concluded that there was reasonable cause to believe that the child had been, or was being, or was likely to be abused or neglected or otherwise harmed. AIHW, Child protection Australia 2009–10, Child welfare series no. 51, cat. no. CWS 39, AIHW, Canberra, 2011, pp. 124–128. 586 C. Holmes, L. Fasoli & P. Stephenson, Evaluation of the Family Support Package: A community perspective, Bachelor Institute of Indigenous Tertiary Education—Research Division, unpublished report prepared for NTDCF, Northern Territory, 2011, p. 116

Supporting families
Northern Territory Emergency Response: Evaluation Report 2011 247
Methodology This chapter was written as a desktop review of existing published data. In trying to identify relevant data, we have based our analysis on a ‘public health’ approach to identifying vulnerable families through the presence of associated risk factors and consideration of the continuum of public health interventions to minimise the effect of those risk factors.587 This draws on national and international trends to consider the abuse and neglect of children in a public health context588 and from a preventive, family-focused perspective.589 This public health approach is consistent with the National Framework for Protecting Australia’s Children 2009–2020.590 Activities under the NTER that were intended to have an impact on support for families (including the protection of children) are outlined in Table 7.1.
Many of the risk factors that make children vulnerable to child abuse/neglect are associated with familial and parental characteristics and circumstances. Our analysis here is structured around the components of the NTER that are likely to address those risk factors. In the Development of program logic options for the NTER, FaHCSIA outlined ‘factors of effectiveness’ for addressing issues of child welfare and positive community development approaches for Indigenous communities. They included approaches based on community strengths and healing; long-term investment and capacity building; development of local solutions; leadership (at community and government levels); and strong community governance.591
Table 7.2 provides an overview of the various kinds of data that can be drawn on to understand the impact of the NTER on support for families.
Statutory child protection data provide information at the whole-of-Territory level. Separate data for the 73 NTER communities are not available. However, Indigenous data for the Northern Territory as a whole are a good approximation for the NTER, given that the majority of Indigenous children in the Northern Territory live in NTER communities.592 Data relating to support for families to address the known risk factors identified in Table 7.3 were sought in available reports on the NTER, including FaHCSIA’s NTER monitoring reports; government documents relating to the NTNPA; Northern Territory Government documents associated with population details on Indigenous children, communities and families; and published literature (both peer-reviewed academic perspectives and media reports). Where additional detail was required, access to specific data has been requested and—where available—analysed. Comparisons of the presence of these risk factors pre-NTER through to the latest available information was used to identify trends indicative of the success of the NTER as it relates to supporting families and providing better outcomes for children.
587 C. Hunter, Defining the public health model for the child welfare services context, National Child Protection Clearinghouse resource sheet, Australian Institute of Family Studies, Melbourne, 2011. 588 M. O’Donnell, D. Scott & F. Stanley, ‘Child abuse and neglect: Is it time for a public health approach?’, Australian and New Zealand Journal of Public Health, vol. 32, no. 4, 2008, pp. 325–330. 589 B. Lonne, N. Parton, J. Thomson & M. Harries, Reforming child protection, Routledge, London, 2009. 590 Council of Australian Governments (COAG), Protecting children is everyone’s business: National Framework for Protecting Australia’s Children 2009–2020, COAG, Canberra, 2009. 591 ARTD Consultants and WestWood Spice, Development of program logic options for the NTER, unpublished report prepared for FaHCSIA, Canberra, 2010. 592 Based on an examination of both the population estimates prepared by Professor John Taylor for the NTER Review Board and the data published by the ABS, 68.1 per cent of all Indigenous children aged 0–14 years in the Northern Territory lived in the NTER prescribed areas in 2008. See ABS, Experimental estimates of Aboriginal and Torres Strait Islander Australians, June 2006, cat. no. 3238.0.55.001, ABS, Canberra, 2008; NTER Review Board, Northern Territory Emergency Response: Report of the NTER Review Board, NTER Review Board, Canberra, 2008.

Supporting families
248 Northern Territory Emergency Response: Evaluation Report 2011
Table 7.1 Overview of NTER measures
NTER measures Description of measure and policy intention Safe Places—Women’s Safe Houses (WSH) and Men’s Places (MP)
Venue for running prevention and community awareness programs and family interventions, including Women’s Safe Houses (WSHs) and Men’s Places (MPs). Both WSHs and MPs provide crisis/short-term accommodation. WSHs provide a range of programs for women and their children for safety, health and wellbeing. MPs provide an avenue for men seeking support in managing violent behaviour. Retrofit (or construct, in one community) 20 remote and 2 urban facilities
Mobile child protection teams (MCPT) Teams respond to the needs of regional and remote communities for investigation of child safety concerns and provide for culturally appropriate assessments of reports of harm to children, based on local community knowledge and stakeholder relationships Provides employment and training for local Aboriginal people employed to fill these roles
Remote Aboriginal and Family Community Workers (RAFCWs) Provides employment and training for local Aboriginal people employed to fill these roles. These workers provide family support and community education in areas relevant to child protection. RAFCWs play an important role in preventing some children from needlessly entering the statutory child protection system.
Youth in Communities The ‘Youth in Communities’ intent is to deliver a comprehensive youth strategy in the Northern Territory that: • Provides an effective diversion for young Indigenous
people form at risk behaviours • improves life choices and outcomes for young Indigenous
people, through engaging them in positive activities that promote pathways to better health and wellbeing, community capacity building and participation in school, work and social networks and
• strengthens and improves the youth services infrastructure, both in the number for youth workers employed and the facilities available for proving youth services and activities.
Parenting programs Support families to address underlying issues (social, cultural, historical, personal, financial and health)
Other NTER measures that may affect risk factors for poor family functioning and child abuse/neglect: • Law and order (including night patrols) • Income management and welfare reform • Housing and land reform • Enhancing education • Improving child and family health (including child health
checks) • Early childhood—includes crèches and playgroups • Remote service delivery • Resetting the relationship
These other NTER measures are addressed in the following chapters: • Promoting law and order • Welfare reform and employment • Housing and land reform • Enhancing education • Improving child and family health • Enhancing education • Coordination and engagement • Coordination and engagement

Supporting families
Northern Territory Emergency Response: Evaluation Report 2011 249
Table 7.2 Potential data for reviewing NTER Supporting Families measures
Type of data What the data can show
Availability and use as a measure of change in the NTER Strengths/limitations
Prevalence of child abuse/neglect
• True reflection of the extent of the problem of child abuse/neglect (how much of the population has been affected)
Not available • Expensive and hard to measure • Often retrospective • Has been used overseas, but
not used nationally or in any other state/territory in Australia
• May be difficult to obtain ethics approval for interviewing children about their experiences of abuse or neglect
• Questioning of children on such sensitive matters may require parental approval and input, which may in turn skew results
• Studies conducted in India, Australia (on sexual abuse), and Georgia attempt to understand the magnitude of the problem593,594,595
• The Australian Bureau of Statistics (ABS) Personal Safety Survey596 does measure retrospective lifetime rates of child physical abuse (9.8%) and child sexual abuse (8.5%)
Incidence – of child abuse/neglect – of family violence
The number of events experienced by an individual. The ABS Personal Safety Survey measures experiences of physical and sexual violence, including actions taken afterwards and effect on their lives (includes experiences in the past 12 months, since age 15, and prior to age of 15)
ABS Personal Safety Survey provides data at state/territory level, but not by Indigenous status, and cannot be disaggregated to look just at NTER communities
Statistics not granular enough to understand whether affected by NTER measures Measurements for women taken in 1996 and for men and women in 2005 Last data collection occurred prior to implementation of NTER, and data cannot be disaggregated to the level of the 73 NTER communities
Statutory child protection data
Child safety concerns reported to statutory authorities. Categories of harm reported: Sexual Physical Emotional Neglect
Available at state/territory level Unable to compare NTER communities with non-NTER communities
Indicative of system capacity and activity; figures reflect where activity is directed and will increase until system capacity is reached Unable to compare NTER communities with non-NTER communities Statistics may have been affected by measures other than NTER (unable to determine specific impact of NTER compared to other child protection reforms initiated in Northern Territory since 2007) Difficult to compare across jurisdictions, as definitional issues exist in the threshold for intervention, the classification of report, notification, substantiation.
593 M. Lynch, L. Saralidze, N. Goguadze & A. Zolotar, ‘The national study on violence against children in Georgia: The nature and extent of violence experienced by children in the home’, in World perspectives on child abuse, 8th edition, ISPCAN, Hong Kong, 2008. 594 L. Kacker & P. Kumar, ‘Child abuse in India’, in World perspectives on child abuse, 8th edition, ISPCAN, Hong Kong, 2008. 595 M. Dunne, D. Purdie, M. Cook, F. Boyle & J. Najman, ‘Is child sexual abuse declining? Evidence from a population based survey of men and women in Australia’, Child Abuse and Neglect, vol. 27, no. 2, 2003, pp. 141–152. 596 Australian Bureau of Statistics (ABS), Personal safety survey (Reissue), cat. no. 4906.0, ABS, Canberra, 2006.

Supporting families
250 Northern Territory Emergency Response: Evaluation Report 2011
Type of data What the data can show
Availability and use as a measure of change in the NTER Strengths/limitations
Hospital data Admitted patient data using diagnosis codes, external cause codes for assault, Z codes for counselling and observation and procedure codes and emergency department contextual data for presenting problem and nurse diagnosis
Available at state/territory level for admitted patient. Hospitalisation data injury codes are not able to be provided due to low numbers when the data are disaggregated by remoteness area.
Coded data only available for admitted patients (more severe only) Reliant on clinical identification, documentation and diagnosis of child abuse/neglect Emergency department data require complicated search of narrative text provided in ‘presenting problem’ field Emergency department data only available in hospitals with electronic admissions procedures (not in smaller, more remote hospitals) Data on assault and alcohol-related conditions, as well as injury and poisoning, are available in the Improving child and family health chapter
Child death data ABS Coroner’s findings re unexpected deaths Northern Territory Child Death Review Team data/report
Small numbers (protection of confidentiality precludes analysis at community level) Reflects only the most severe abuse/neglect that results in death Data not collated at NTER level
Police data Domestic/family violence Child sexual assault (recorded offences; charges and convictions) Sex offender register
Reflects police activity in response to identified concerns and is likely to seriously underestimate the problem Reliant on police identifying abuse Provides an insight into the overall level of abuse/neglect in the community Charges are not forthcoming and convictions may not be recorded
Safety perceptions
Service provider and community perspectives
Community Safety and Wellbeing Research Study (CSWRS) Community Safety Service Provider Survey (CSSPS) Evaluation of the Family Support Package: A community perspective
Data reflect perceptions and may be affected by experiences of violence and personal definition of ‘violence’ relative to lived experience Perceptions, not reality
Process variables: Statutory child protection workforce enhancements
Ratio of child protection workers to the number of children in the Northern Territory Increase in the number of remote workers
Unable to consider at community level to compare across NTER and other communities
Provides context for increased system capacity Only aggregate—granularity insufficient for community comparisons

Supporting families
Northern Territory Emergency Response: Evaluation Report 2011 251
Table 7.3 Northern Territory data relevant to addressing known risk factors for family dysfunction and child abuse/neglect
Proxy measures: Risk factors for child abuse/neglecta
NTER initiative likely to address risk factor Possible data source
Chapter addressing proxy measure
Poverty Income management, Northern Territory jobs package
ABS levels of advantage/disadvantage—unable to compare at community level and disaggregate from other NTER measures that may influence
Welfare reform and employment
Substance abuse Alcohol restrictions, alcohol and substance abuse recovery programs, additional policing capacity, Substance Abuse Intelligence Desks (SAIDs) and related Dog Operations Units
Hospitalisations relevant to diagnosis—may be treated as outpatient, levels of activity rather than patient (one patient may be readmitted a number of times or present to more than one service) Crime statistics—reflect activity and system capacity
Improving child and family health Promoting law and order
Mental illness Expanding Health Service Delivery Initiative
Hospitalisation statistics—only more severe cases hospitalised ABS statistics on suicide and suicide attempts Lag in coronial processes (capacity) and identification of suicide as cause of death
Improving child and family health
Maternal education Language, Literacy and Numeracy Program
Participation rates in community programs Participation may not indicate improved levels of understanding and capacity Effects of maternal education on child safety and family wellbeing can only be measured in the long term (i.e. intergenerationally)
Welfare reform and employment
Overcrowding/unstable housing
Repair and maintenance of existing houses, infrastructure and accommodation for government personnel, community clean-ups, compensation for 5-year leases, long-term leases for housing and infrastructure investment
ABS statistics on overcrowding (though these are likely to underestimate the true number of people living in each household).b
Housing and land reform
Health (including children with disabilities); low birthweight
Child health checks, Expanding Health Service Delivery Initiative
Hospital admissions data, child health check data
Improving child and family health
Dangerous/unsafe communities
Additional policing, Provision of additional permanent police stations, night patrol expansion, alcohol management plans, SAIDs
Overall levels of violence as depicted by police crime statistics Hospital admissions for assault Death data on murders/assault-related deaths Community safety surveys (CSWRS and CSSPS) Evaluation of the Family Support Package: A community perspective
Promoting law and order
Drug/alcohol misuse Alcohol restrictions, alcohol and substance abuse recovery programs, additional policing capacity, SAIDS and related Dog Operations Units
Hospitalisations relevant to diagnosis—may be treated as outpatient, levels of activity rather than patient (one patient may be readmitted a number of times or present to more than one service) Crime statistics—reflect activity and system capacity
Improving child and family health Promoting law and order
Unemployment Northern Territory jobs package Unemployment rates Additional jobs created Persons placed in appropriate employment situations
Welfare reform and employment

Supporting families
252 Northern Territory Emergency Response: Evaluation Report 2011
Proxy measures: Risk factors for child abuse/neglecta
NTER initiative likely to address risk factor Possible data source
Chapter addressing proxy measure
Parenting skills and capacity (including the stresses on single parents; parents who were themselves victims of child abuse/neglect or poor parenting)
Parenting programs Participation rates Fewer children taken into care as a result of poor parenting (measurement difficult as may indicate lack of system response)
Supporting families
a It is acknowledged that effective strategies to support vulnerable families focus on strengths, not just deficits. However, the focus here is on risk factors because research has consistently demonstrated a range of characteristics of parents and their communities that place children at greater risk of harm or maladjustment. These risk factors have been identified from within a framework in which ‘normative’ families are strong and healthy, where the absence of one or all risk factors can be seen as a strength. Risk factors should not be considered in isolation. For example, the presence of other protective factors can also ameliorate or reduce the impact of individual risk factors. For further information, see R Walker & C Shepherd, Strengthening Aboriginal family functioning: What works and why?, AFRC Briefing 7, Australian Family Relationships Clearinghouse, Melbourne, 2008.
b F Morphy, ‘Uncontained subjects: “population” and “household” in remote Aboriginal Australia’, Journal of Population Research, vol. 24, no. 2, 2007, pp. 163–184.
Sources: DJ Higgins, Community development approaches to safety and wellbeing of Indigenous children, Closing the Gap Clearinghouse Resource Sheet, AIHW & AIFS, Canberra, 2010; N Eisenstadt, ‘Think family: A new approach to families at risk’, Family Matters, no. 87, 2011, pp. 37–42; C Blackstock, ‘After the apology: Why are so many First Nations children still in foster care? A summary of research on ethnic over-representation and structural bias’, Children Australia, vol. 34, no. 1, 2009, pp. 22–27.
Key documents that were reviewed for this chapter included:
• FaHCSIA’s six-monthly NTER monitoring reports
• Northern Territory Emergency Response: Report of the NTER Review Board
• Ampe akelyernemane meke mekarle: ‘Little children are sacred’ report
• Growing them strong, together (report of the Board of Inquiry into the Child Protection System in the Northern Territory 2010)
• Child Protection Australia series published by the Australian Institute of Health and Welfare (AIHW)
• the Productivity Commission’s Overcoming Indigenous disadvantage report series
• The Community Safety and Wellbeing Research Study (CSWRS)597
• The Community Safety Service Provider Survey (CSSPS)598.
Background Risk factors at the family, community and societal level all contribute to the severity and incidence of abuse, neglect, violence and family dysfunction—and represent possible intervention points to mitigate the impacts of these risk factors. In its 2008 report, the AIHW noted that issues such as poverty, low socioeconomic status and cultural differences in the care of children and intergenerational impacts of colonisation make a significant contribution to the neglect of Indigenous children in Australia.599
The United Nations Children’s Fund (UNICEF), Save the Children and the United Nations High Commissioner for Refugees are increasingly advocating a ‘systems approach’ to child protection, in which a holistic perspective of children and child protection draws on all stakeholders to protect children’s rights. The prevention of violence and exploitation involving children by using engagement, partnership, exchange of dialogue and a shared analysis is
597 For more information on the CSWRS and CSSPS, see Chapter 3, ‘Research into community safety, wellbeing and service provision’. 598 J. Putt, S. Middleton, J. Yamaguchi & K. Turner, Community safety: Results from the survey of service providers in the Northern Territory, unpublished draft report, FaHCSIA, Canberra, 2011. 599 AIHW, Child protection Australia 2006–07, Child Welfare series no. 43, cat. no. CWS 31, AIHW, Canberra, 2008.

Supporting families
Northern Territory Emergency Response: Evaluation Report 2011 253
more in keeping with a human rights approach.600 Such an approach acknowledges the important role of families or kin, as well as communities, and the role of the broader societal system within which they exist.601
The 2007 UNICEF Innocenti Research Centre report also included health and safety, educational wellbeing, family and peer relationships, behaviours and risks, and subjective wellbeing in its index on child wellbeing.602 Public health research has demonstrated that there are strong links to social inequalities and poor outcomes for children and that those in the lowest socioeconomic groups bear a greater burden of poorer outcomes.603 Disadvantage suffered by those who live in poverty can be partially explained by the concept of social exclusion, and the Australian Government has attempted to address these issues in policy development. Specific policies to target job skills, work motivation, welfare dependence, parental responsibility, early childhood development and school readiness, behavioural problems, quality of child care, educational opportunity and neighbourhood resources are directed at minimising social exclusion.604
In order to support all families—and in particular to prevent children from vulnerability and harm—a range of different aspects of family functioning can be addressed. Walker and Shepherd605 identified 10 factors associated with Aboriginal family functioning:
• financial wellbeing
• quality of children’s diet
• level of educational attainment of the primary carer
• importance of religion/spirituality
• whether overuse of alcohol caused problems in the household
• parenting quality
• whether children were at high risk of clinically significant emotional or behavioural difficulties
• age of the primary carer
• whether the primary carer had been forcibly separated from their natural family
• whether the carer had a limiting medical condition.
The National Framework for Protecting Australia’s Children 2009–2020606 highlighted two issues that underpin better responses to children in need of protection:
• the benefits of a public health preventive approach
• appropriate understanding of responsibility for child abuse/neglect, and accountability for effective responses.
600 K. Landgren, ‘The protective environment: Development support for child protection’, Human Rights Quarterly, vol. 27, no. 1, 2005, pp. 214–248. 601 F. Wulczyn, D. Daro, J. Fluke, S. Feldman, C. Glodek & K. Lifanda, Adapting a systems approach to child protection: Key concepts and considerations, working paper, UNICEF, New York, 2010. 602 UNICEF Innocenti Research Centre, Child poverty in perspective: An overview of child well-being in rich countries, Innocenti Report Card 7, UNICEF Innocenti Research Centre, Florence, 2007. 603 N. Eisenstadt, ‘Think family: A new approach to families at risk’, Family Matters, no. 87, 2011, pp. 37–42. 604 A. Huston, ‘Children in poverty: Can public policy alleviate the consequences?’, Family Matters, no. 87, pp. 13–26. 605 R. Walker & C. Shepherd, Strengthening Aboriginal family functioning: What works and why?, AFRC Briefing 7, AIFS, Melbourne, 2008. 606 COAG, Protecting children is everyone’s business, op. cit.

Supporting families
254 Northern Territory Emergency Response: Evaluation Report 2011
Effective responses to child abuse and neglect based on a public health model emphasise the need for a continuum of services:
• primary (universal) prevention services, which are provided ‘universally’ to all citizens, such as maternal and child health services or intense home visiting
• secondary services, which target support to those families identified as being at risk or in need
• tertiary services, which include statutory child protection interventions, out-of-home care and therapeutic services to facilitate healing and interrupt the intergenerational transmission of trauma and child abuse.607
There is an inherent tension between seeing the abuse/neglect of children as a personal problem and seeing it as part of a broader societal issue in which accountability for individual behaviour is considered, as well as the broader context of structural factors relevant to preventing child abuse/neglect.608 While parents are responsible for their individual actions (or, in the case of neglect, inactions), issues such as poverty, lack of access to services and the breakdown of law and order, as well as moral values in particular communities, also contribute to the problem. However, not all poor families, or all families living in a particular community, are at equal risk of maltreating their children.
The Northern Territory context A report published by the Secretariat of National Aboriginal and Islander Child Care (SNAICC) in July 2003, State of denial: The neglect and abuse of Indigenous children in the Northern Territory609, represented the culmination of a substantial research project.610 The report was critical of the Northern Territory child protection system, arguing that it was fragmented and poorly resourced. The report also found that, although the reported rates of harm to children were relatively low in the Northern Territory compared to other Australian states and territories, many risk factors associated with child abuse/neglect were disproportionately high, pointing to a significant problem of underreporting in the Territory. For example, the report found that problems such as unemployment, overcrowded and inadequate housing, and limited access to essential utilities (such as clean drinking water, power and transport) were more prevalent in the Northern Territory than in any other part of the country. Communicable diseases were also reported to be more prevalent in the Northern Territory than elsewhere in Australia. The author explained that chronic environmental health problems and entrenched poverty experienced by some Aboriginal communities put children at considerable risk of major health problems, including hearing impairment and malnutrition.611
Since the release of SNAICC’s State of denial report, child protection services in the Northern Territory are likely to have been influenced by reactions to a number of key events and reports, all of which may have contributed to the current state of child protection in the Northern Territory. Some of these are:
607 C. Hunter, op. cit. 608 D.J. Higgins, Community development approaches to safety and wellbeing of Indigenous children, Closing the Gap Clearinghouse Resource Sheet, AIHW & AIFS, Canberra, 2010. 609 J. Pocock, State of denial: The neglect and abuse of Indigenous children in the Northern Territory, Secretariat of National Aboriginal and Islander Child Care, Melbourne, 2003. 610 ibid. 611 ibid.

Supporting families
Northern Territory Emergency Response: Evaluation Report 2011 255
• the release of the Report of the Review of the Northern Territory Department of Health and Community Services (the Bansemer report) in 2003612, and associated scrutiny and departmental changes
• the introduction of the Caring for our Children reforms in 2004, which was coupled with a substantial injection of funds
• media attention concerning child abuse in the Northern Territory, particularly the sexual abuse of Indigenous children, triggered by Northern Territory Crown Prosecutor Nanette Rogers’ comments to the media in 2006613
• the publication in 2007 of the Ampe akelyernemane meke mekarle: ‘Little children are sacred’ report on the protection of Aboriginal children from sexual abuse614
• the implementation in 2007 of the NTER in prescribed areas, with associated scrutiny and funds
• the release in 2010 of Growing them strong, together, the Northern Territory Government review of the child protection system615
• the introduction of the Safe Children, Bright Futures Strategic Framework 2011–15616 in 2011 as a response to the Growing them strong, together review.
In 2007, the Northern Territory Government released its Ampe akelyernemane meke mekarle: ‘Little children are sacred’ report on the protection of Aboriginal children from sexual abuse.617 This report was the impetus for the NTER. In the report, the authors commented:
There is nothing new or extraordinary in the allegations of sexual abuse of Aboriginal children in the Northern Territory. What is new, perhaps, is the publicity given to them and the raising of awareness of the wider community of the issue.618
The authors went on to discuss findings from a 2004 New South Wales taskforce examining the incidence of child sexual assault. It was identified as being endemic and intergenerational in some communities in New South Wales, demonstrating that child sexual abuse is not unique to Northern Territory Aboriginal communities.
While this was the impetus, the focus soon moved to the problems of child neglect and broader underlying issues facing remote Indigenous communities. The ongoing impact of colonisation (as well as differences in child-rearing practices, poverty and low socioeconomic
612 Banscott Health Consulting, Report of the review of the Northern Territory Department of Health and Community Services, Northern Territory Department of Health and Community Services, Northern Territory, 2003. 613 S. Smith, ‘Paper reveals sexual abuse, violence in NT Indigenous communities’, Lateline, ABC TV, 15 May 2006, <www.abc.net.au/lateline/content/2006/s1639133.htm>. Rogers described cases where a number of risk factors were present—in particular, alcohol/substance use, lack of supervision (i.e. neglect) and overcrowding (making the supervision and protection of children difficult and therefore making children vulnerable to sexual abuse). Rogers talked not only about the way in which violence is entrenched in Aboriginal communities, but also of the fact that Aboriginal people are constantly being overwhelmed by new tragedies. Rogers stated: ‘All child sexual assault in central Australia is happening at much higher rates than are currently being reported to police, as is violence on Aboriginal women and children.’ However, this is likely true of all of Australia. Rather than blame alcohol and substance abuse for domestic and community violence, Rogers said Indigenous communities—especially the men—must accept responsibility for the violence. 614 P. Anderson & R. Wild, Ampe Akelyernemane Meke Mekarle: ‘Little children are sacred’, Report of the Northern Territory Board of Inquiry into the protection of Aboriginal children from sexual abuse, Northern Territory Government, Darwin, 2007. 615 M. Bamblett, H. Bath & R. Roseby, Growing them strong, together: Promoting the safety and wellbeing of the Northern Territory’s children, Northern Territory Government, Darwin, 2010. 616 Northern Territory Government, Safe Children, Bright Futures Strategic Framework 2011 to 2015: The Northern Territory Government response to the Report of the Board of Inquiry into the Child Protection System in the Northern Territory, Department of Children and Families, Casuarina, Northern Territory, 2011. 617 P. Anderson & R. Wild, op. cit. 618 ibid., p. 5.

Supporting families
256 Northern Territory Emergency Response: Evaluation Report 2011
status) is one of a number of key contributors to neglect in Indigenous communities, including in the Northern Territory.619
The ‘Little children are sacred’ report described coronial reports dating back to 1998 and 1999 by Mr Greg Cavanagh SM and Colin McDonald QC regarding the suicide of four Aboriginal youths in the Tiwi Islands. The coronial reports described serious underlying problems, including:
• alcohol abuse across the community
• marijuana abuse
• prevalence of violence, especially domestic/family violence
• family breakdown
• weakening of the traditional and cultural values in modern Australian society
• lack of employment opportunities and other advantages enjoyed by many non-Indigenous Australians
• a clash of culture, occasioned by various means, which can lead to a sense of hopelessness and low self-esteem, especially among young men.
Mr Cavanagh also described comments made by Judge Muirhead in 1977620 describing young people in and around Alice Springs:
In dealing with Aboriginal children one must not overlook the tremendous social problems they face. They are growing up in an environment of confusion. They see many of their people beset with the problems of alcohol; they sense conflict and dilemma when they find the strict, but community-based cultural traditions of their people, their customs and philosophies set in competition with the more tempting short-term inducements of our society. In short the young Aboriginal is a child who requires tremendous care and attention, much thought, much consideration.621
Similar themes emerged in the Growing them strong, together report, which investigated the child protection system in the Northern Territory in 2010.622 The authors—Bamblett, Bath, and Roseby—said that the issue of child protection in the Northern Territory could be seen as one of inequity and injustice, and that the levels of poverty and disadvantage made expectations of income security, stable and secure housing in safe neighbourhoods, accessible and affordable health care, food security, and opportunities for social care unrealistic.623 Aboriginal children are more likely than their non-Aboriginal counterparts to be exposed to multiple life stresses and cumulative risks. Furthermore, the report went on to say that:
the impacts of severe and pervasive risk factors at community levels are associated with the normalisation of risk to children, for example, chronic neglect or sexualised behaviours between children.624
619 AIHW, Child protection Australia 2009–10, op. cit; D.J. Higgins, op. cit. 620 Jabaltjaril v Hammersley (1977) 15 ALR 94 (NT) Muirhead J, at 98. 621 P. Anderson & R. Wild, op. cit., p. 13. 622 M. Bamblett, H. Bath & R. Roseby, op. cit. 623 ibid., p. 24. 624 ibid., p. 25.

Supporting families
Northern Territory Emergency Response: Evaluation Report 2011 257
Community, family and child safety This section examines those interventions under the NTER that are intended to support community, family and child safety, particularly as they relate to addressing risk factors of family violence, substance and alcohol abuse, as well as community violence. NTER measures likely to have had an impact on these issues include an increased police presence in communities; the implementation of night patrols; the restrictions on alcohol, drugs and pornography within the prescribed areas; the introduction of a child abuse intelligence desk; the provision of safe houses; and the provision of additional child protection workers to identify and respond to children who have experienced—or are at risk—of harm in communities (see Chapter 5, ‘Promoting law and order’).
There is a well-documented body of research to demonstrate the negative outcomes of exposure to domestic violence for children in terms of health outcomes625, substance abuse and mental health problems626, and an increased risk of child abuse/neglect.627
While family violence occurs in all communities, Indigenous women are at much greater risk than their non-Indigenous counterparts.628 Indigenous people are overrepresented in domestic violence statistics. Of Indigenous people aged 15 and above living in remote and very remote parts of the Northern Territory, 34 per cent reported family violence as being a concern in their community. This compares to 25 per cent for all Indigenous Australians.629 In the National Plan to Reduce Violence Against Women and their Children, there is specific mention of the need to improve safety in Indigenous communities and to empower the women who live in those communities so as to minimise the effect of domestic violence and enable women to proactively protect themselves and their children.630 Domestic violence is often not reported to authorities, and these statistics are likely to be an underrepresentation of the true picture. Barriers to reporting include the fear of having children removed by child protection services, the possibility that the perpetrator will serve a prison sentence, and fear of conflict, including payback within the community and family.631,632,633 This can result in women trying to manage the violence themselves. Limited housing options and remoteness also are likely to affect families, as they have few options available, particularly within their home community, should they decide to leave a violent situation.
Community safety According to the CSWRS, 92 per cent of people in small communities (fewer than 350 people), 87 per cent of people in medium-sized communities (350-699 people), 73 per cent in large communities (700-1,099 people) and 63 per cent in very large communities (1,110 plus) report that theur community is safer than it was three years ago.634 Feelings of safety at home
625 M. Bair-Merritt, M. Blackstone & C. Feudtner, ‘Physical health outcomes of childhood exposure to intimate partner violence: A systematic review’, Paediatrics, vol. 117, no. 2, 2006, pp. 278–290. 626 P. Kohl, R. Barth, A. Hazen & J. Landsverk, ‘Child welfare as a gateway to domestic violence services’, Children and Youth Services Review, vol. 27, no. 11, 2005, pp. 1203–21; P. Kohl et al., ‘Domestic violence and pathways into child welfare services: Findings from the National Survey of Child and Adolescent Well-Being’, Child and Youth Services Review, vol. 27, no. 11, 2005, pp. 1167–1182. 627 S. Hamby, D. Finkelhor, H. Turner & R. Ormrod, ‘The overlap of witnessing partner violence with child maltreatment and other victimisations in a nationally representative survey of youth’, Child Abuse and Neglect, vol. 34, no. 10, 2010, pp. 734–241. 628 J. Mulroney, Australian statistics on domestic violence, topic paper, Australian Domestic and Family Violence Clearinghouse, Sydney, 2003. 629 ABS, National Aboriginal and Torres Strait Islander social survey 2008, cat. no. 4714.0, ABS, Canberra, 2009 630 COAG, National plan to reduce violence against women and their children: Including the first three-year action plan, COAG, Canberra, 2010. 631 N. Taylor & J. Putt, ‘Adult sexual violence in Indigenous and culturally and linguistically diverse communities in Australia’, Trends and Issues in Crime and Criminal Justice, no. 354, Australian Institute of Criminology, Canberra, 2007. 632 K. Cripps & H. McGlade, ‘Indigenous family violence and sexual abuse: Considering pathways forward’, Journal of Family Studies, vol. 14, no. 2–3, 2008, pp. 240–253. 633 K. Cripps, ‘Indigenous family violence: From emergency measures to committed long-term action’, Australian Indigenous Law Review, vol. 11, no. 2, 2007, pp. 6–18. 634 FaHCSIA, Unpublished data from the Community Safety and Wellbeing Research Study (CSWRS), FaHCSIA, Canberra, 2011.

Supporting families
258 Northern Territory Emergency Response: Evaluation Report 2011
at night were less uniform but also appear to be related to community size: only 65.8 per cent of respondents in large communities feel safe in their own homes at night, compared to 83.8 per cent and 81.4 per cent of respondents in small and medium-sized communities, respectively.635 Feelings of safety while walking around the community at night varied by community size as well: fewer respondents reporting feeling safe in large communities (22.7%) than in medium-sized communities (51.7%) and small communities (59.1%). Under Operation Themis, new police stations were built in 18 communities. The CSWRS included five ‘Themis communities’, and respondents from those communities reported feeling safer walking around at night, compared to other communities.636 In their evaluation of the Family Support Package, Holmes et al. identified one of the key reasons for improvements in community perceptions about violence and child abuse as the increased presence—and improvements in the approach—of police in the communities.637
Respondents in the CSWRS were presented with a range of issues and asked whether they felt each was still a problem in their community. For several of the issues, a majority of respondents thought that they were still a very big or big problem. Those issues included young people not listening to older people (70.5%), young people being out at night (64.5%), young people sending nasty phone messages (57.7%), smoking too much ‘gunja’ (marijuana; 61.7%) and drinking too much (52.1%).638
In a separate survey of service providers, the CSSPS, 41.4 per cent of respondents working in NTER communities felt that community safety had improved, while 28.1 per cent felt it was the same as three years ago.639 The CSWRS also showed that a majority of residents (47.4%) were likely to feel that their community was on the way up, compared to only 7.6 per cent who felt it was on the way down (42.1% thought there was no change). Men were more likely to feel that the community was on the way up (52.6%) than women (42.8%).640 The report by Holmes et al. reflects similar views about improvements to community safety.641
In 2010, an audit of publicly funded computers was commenced in an effort to protect women and children from unexpected exposure to inappropriate material.642 The restriction of pornography in communities did not result in a perception of improved community safety for all survey respondents. When surveyed for the CSSPS, most service providers working in NTER communities said they did not know whether the pornography restrictions had made a difference to safety in their community (36.7%). Of those who did have a view, 34.4 per cent felt there had been no difference to safety, 23.5 per cent said there had been an improvement and 2.3 per cent felt that pornography restrictions had reduced community safety.643 Of community residents in the CSWRS, 16.5 per cent believed the pornography restrictions have made some improvements to safety, 18.0 per cent believe they have had made no difference and 11.1 per cent think they have made things worse (54.5% did not know or did not answer).644 In 2010, the Senate Community Affairs Legislation Committee noted that, if a community wanted the pornography restrictions lifted, the request would be considered by Minister for Family Affairs, Housing, Community Services and Indigenous Affairs or a
635 ibid. 636 G. Shaw & P. d’Abbs, op. cit. 637 C. Holmes, L. Fasoli & P. Stephenson, Evaluation of the Family Support Package: A community perspective, Bachelor Institute of Indigenous Tertiary Education—Research Division, unpublished report prepared for NTDCF, Northern Territory, 2011, p. 34. 638 G Shaw & P d’Abbs, op. cit. 639 J. Putt, S. Middleton, J. Yamaguchi & K. Turner,op. cit. 640 G. Shaw & P. d’Abbs, op. cit. 641 C. Holmes, L. Fasoli & P. Stephenson, op. cit. 642 FaHCSIA, Closing the Gap in the Northern Territory Monitoring Report, July–December, Part two, 2010. 643 J. Putt, S. Middleton, J. Yamaguchi & K. Turner, op. cit. 644 G. Shaw & P. d’Abbs, op. cit.

Supporting families
Northern Territory Emergency Response: Evaluation Report 2011 259
delegate after considering the views of those who were affected by the restrictions and after community consultation.645
The majority of service providers in NTER communities think that more could be done to make the community safer (81.2%). When asked about problems contributing to poor safety, service providers frequently mentioned roaming dogs, alcohol and family fighting.646 In some communities, dogs that appeared ill and poorly cared for roamed at will, frequently attacking both children and adults.647
Alcohol and substance abuse The introduction of the NTER included a blanket ban on drinking, possessing, supplying or transporting alcohol into a prescribed area.
A 2010 evaluation of NTER alcohol and drug services noted that changes in availability appeared to have had little impact on the use of detoxification services in NTER communities.648 Despite the restrictions, the CSWRS conducted in 2011 found that 62 per cent of respondents in large communities, 42 per cent in medium-sized communities and 50 per cent in small communities felt that alcohol caused problems for their family, particularly money and relationship problems. And there was no significant difference between those communities with or without a licensed canteen. No community had a majority who felt that alcohol restrictions had made a big difference, and residents of large communities experienced slightly less of an impact than residents of small ones (17% of respondents from large communities and 41% from small communities believed the restrictions had made a big difference).649 For service providers in the CSSPS, 39 per cent of those in towns and 34 per cent of those in NTER communities considered that alcohol restrictions had not had an impact on their community.650 (However, it should be noted that many Northern Territory communities were already ‘dry’, or were in the process of implementing such policies, at the time that the intervention was announced.)
In the CSSPS, service providers specifically mentioned alcohol and drunkenness in 30 per cent of responses to a question about reasons for feeling unsafe. This was often mentioned in combination with other factors, such as domestic violence and/or drunken locals and itinerants. Service providers identified that access to alcohol and drug services was a gap in service provision.651
Drunkenness was perceived to be more of an issue on paydays; when there were many people from outside the community visiting for football games, festivals or funerals; when there were seasonal inflows of people; or when defence force personnel arrived. In terms of substance abuse, 15 per cent of service providers in NTER communities mentioned the use of drugs and 6.1 per cent mentioned volatile substance abuse (petrol or glue sniffing) as issues contributing to feelings of a lack of safety.652
In the report by the Senate Community Affairs Legislation Committee, a submission from the Aboriginal Medical Services Alliance of the Northern Territory noted that a dangerous
645 Senate Community Affairs Legislation Committee, Families, Housing, Community Services and Indigenous Affairs and Other Legislation Amendment (Restoration of Racial Discrimination Act) Bill 2009, March 2010, Senate, Canberra, 2010. 646 J. Putt, S. Middleton, J. Yamaguchi & K. Turner, op. cit. 647 M. Bamblett, H. Bath & R. Roseby, op. cit. 648 Origin Consulting & Bowchung Consulting, Review of the alcohol and other drug service components of the Northern Territory Emergency Response: Final report, Origin and Bowchung for DoHA, Canberra, 2010. 649 FaHCSIA, Unpublished data from the Community Safety and Wellbeing Research Study (CSWRS), op. cit. 650 J. Putt, S. Middleton, J. Yamaguchi & K. Turner, op. cit. 651 ibid. 652 ibid.

Supporting families
260 Northern Territory Emergency Response: Evaluation Report 2011
situation had arisen because those who chose to drink had to do so in an area outside their community, and the geographic size of dry areas resulted in drinkers having to travel 20 or 30 kilometres from their community to do so.653 In many circumstances, drinkers go to neighbouring towns to drink, leaving their children in the care of others, or unsupervised.654
Commencing in 2010, there has been a move to consult with individual communities about the level of alcohol-related harm and the presence of an existing alcohol management plan and, based on community evidence and circumstances, to tailor alcohol restrictions to meet the needs of individual communities.655,656
Domestic violence ‘Domestic violence’ and ‘family violence’ are terms that are often used interchangeably; they refer to the perpetration of violence by one family or kinship member against another. The type and severity of violence can vary significantly—from occasional verbal abuse to physical beatings, confinement or murder—and the frequency can range from a single abusive incident to chronic, long-term abuse.
There is a significant body of research demonstrating the possible effects on children of exposure to domestic violence. Effects include psychological impacts, such as depression, anxiety, trauma symptoms and impaired cognitive functioning, and behavioural impacts, which may include increased aggression, antisocial behaviour, peer conflict and school difficulties. In addition, researchers have also suggested links to an increased likelihood of substance abuse, eating disorders, teen pregnancy and a number of other potential consequences, depending on a number of mediating circumstances, including the resilience of the child and levels of support received at the community or extended family level.657
In the CSSPS, service providers often mentioned that they saw family violence as a contributor to feelings of a lack of safety, particularly in NTER communities (19% compared to 5.5% in townships). One service provider in an NTER community said that ‘alcohol fuelled domestic violence continues to be a problem, particularly against women’.658 The authors of the Growing them strong, together report noted that high levels of family violence were frequently reported to the inquiry, often in the context of ‘a lack of a sense of community authority to assist in dealing with the violence’.659
In the Evaluation of the Family Support Package: A Community Perspective report, the evaluators found that domestic violence was reported by many participants as being a problematic issue, particularly in the wet season around January and February.660 The evaluators also found that community members saw ‘jealousy’ as being at the heart of much of the fighting and had an instrumental role in domestic violence, as well as general conflict.661
Some NTER measures are designed to assist in minimising the occurrence and effects of family violence through the establishment of night patrols, safe houses, family and parenting programs, and men’s programs. While extra levels of policing have been positively received
653 Senate Community Affairs Legislation Committee, op. cit. 654 M. Bamblett, H. Bath & R. Roseby, op. cit. 655 FaHCSIA, Closing the Gap in the Northern Territory Monitoring Report, July–December, Part two 2010 656 Senate Community Affairs Legislation Committee, op. cit. 657 K. Richards, ‘Children’s exposure to domestic violence in Australia’, Trends and Issues in Crime and Criminal Justice, no. 419, Australian Institute of Criminology, Canberra, 2011. 658 J. Putt, S. Middleton, J. Yamaguchi & K. Turner, op. cit. 659 M. Bamblett, H. Bath & R. Roseby, op. cit., p. 114. 660 C. Holmes, L. Fasoli & P. Stephenson, Evaluation of the Family Support Package: A community perspective, Batchelor Institute of Indigenous Tertiary Education—Research Division, Unpublished report prepared for NT DET, September, 2011 p. 44. 661 ibid p.45

Supporting families
Northern Territory Emergency Response: Evaluation Report 2011 261
across all NTER communities, existing justice responses—where violence is identified as a criminal offence and the offender is removed from the community and incarcerated—have not always proven to be effective. From a cultural perspective, Indigenous authors have argued for the need for alternative justice systems—and recognise that, for some Indigenous Australians, even accessing formal help systems is a challenge.662
According to data from the most recent NTER monitoring report, from 2007–08 to 2010–11 there has been an 84 per cent increase in domestic violence incidents recorded by police in NTER communities. While the number of these recorded incidents that are alcohol-related has also increased (see Table 7.4), as a proportion of overall reported incidents they have declined from 40 per cent of all incidents in 2007–08 to 34 per cent in 2010–11.663 Rather than an actual increase in the amount of family violence, the most likely explanation for the increase in domestic violence incidents is an increased police presence, coupled with legislative changes that affect the recording and reporting of domestic violence. This includes 2009 legislation (referred to below), which introduced mandatory reporting of domestic violence. The impact of the increased police presence on trends in recorded incidents and offences is examined further in Chapter 5, ‘Promoting law and order’.
Table 7.4 Police reports of domestic violence-related incidents in NTER prescribed communities
2007–08 2008–09 2009–10 2010–11 Alcohol-related incidents 639 856 922 1,009 Total incidents 1,612 2,235 2,700 2,968 Source: FaHCSIA, NTER monitoring reports.
Family violence is likely to be under-identified in most statistical data collections, as it occurs in private family settings. Anecdotal evidence suggests that even though a significant amount of Indigenous family violence seems to occur in public settings—often in a context of alcohol or substance abuse—this is still likely to be an underestimate of the problem.664 Particularly in an Indigenous context, people may be disinclined to report domestic violence if it may result in a family member being removed from the community and lead to their incarceration. Women may also not be willing to report domestic violence out of fear of having their children removed by child protection authorities.
Evaluating the effect of the NTER on levels of family violence in the NTER communities is difficult, as the data collected reflect what is reported to—and recorded by—police and are affected by policing and Safe Places activities rather than actual incidence rates. While these data are helpful in understanding the role of family violence in these communities, it does not provide the detail needed to understand whether or not the amount or severity of family violence in the NTER communities has changed over time, although recent reports suggest that perceptions of community safety under the NTER are improving.665 Where community members rely on informal family supports, rather than seeking assistance from police or formal services such as Women’s Safe Places, that information will not be captured in official police statistics.
The Northern Territory Government has implemented a whole-of-government approach to family violence, strengthening the laws to include economic abuse and intimidation as forms of violence. In 2009, it also introduced mandatory reporting legislation compelling all persons
662 K. Cripps & H. McGlade, op. cit. 663 FaHCSIA, Closing the gap in the Northern Territory monitoring report July–December 2010, op. cit. 664 J. Mulroney, op. cit. 665 C. Holmes, L. Fasoli & P. Stephenson, op. cit.

Supporting families
262 Northern Territory Emergency Response: Evaluation Report 2011
over 18 years of age to report to the police any instance of domestic violence that may result or has resulted in serious physical harm.666
The reduction of family violence must involve both preventive and reactive strategies. Preventive strategies that broadly raise community awareness and change attitudes are needed, as well as specific actions to increase safety for those at risk of family violence. Reactive strategies are also needed to deal with the outcomes of that violence, both for the victim in terms of support and for the perpetrator in terms of justice and rehabilitation.667
Child welfare-focused responses to the exposure of children to domestic violence promote collaborative responses by police, child protection and other community agencies.668 Considerable effort has gone into reducing the blaming of adult victims; however, there remain issues in the development of culturally safe and secure programs for Indigenous populations. Aboriginal communities often prefer programs in which the perpetrator is not forced to leave the family, and to deal with violence issues at a community level, ‘maintaining family relationships and acknowledging the role of historical trauma and men’s loss of traditional roles as a contributory cause of violence’.669 For example, programs for Indigenous people in Canada have now started to focus on utilising teaching and healing practices that encourage reclaiming the traditional roles of healer and elder and emphasise relationships with family, community and the broader society.670
Safe places for families escaping family violence
The NTER Safe Places initiative was established to provide prevention and community awareness programs, family interventions and crisis accommodation in a holistic and culturally appropriate service model. The initiative consists of two sub measures; Women’s Safe Houses and Men’s Places. Communities were provided with Safe Places based on a needs analysis conducted by the Commonwealth and community consultation about what services they required. According to the program logic for the NTER, medium-term goals of the project were:
• incidents of violence deterred or better managed
• a community environment that offers more protections for people at risk of violence
• individuals with greater capacity and opportunities for self-protection and healing
• stronger families, in which there is stability and capacity to care for, nurture and protect children.
The longer-term outcomes were described as ‘safer communities with attributes such as less violence, substance abuse, child abuse and neglect where people feel safer and violence and abuse are no longer tolerated’.671
666 Northern Territory Department of Children and Families, Mandatory reporting of domestic and family violence, NT Department of Children and Families, Casuarina, Northern Territory, 2009. 667 N. Taylor & J. Putt, op. cit. 668 K. Richards, op. cit. 669 A. Arnott, J. Guenther & E. Cummings, Final evaluation report of safe places 2008/09, Charles Darwin University Social Partnerships in Learning (SPiL) consortium, unpublished report prepared for NTDCF, Darwin, 2009, p.18. 670 Canadian Research Institute for the Advancement of Women, Aboriginal women healing themselves, their families and their communities: The case of the Minwaashin Lodge, Canadian Research Institute for the Advancement of Women, Ottawa, 2008. For additional information on the evaluation of similar programs, see L. Archibald, Promising healing practices in Aboriginal communities, Final report of the Aboriginal Healing Foundation, Vol. 3, Aboriginal Healing Foundation, Ottawa, Canada, 2006; L. Archibald, Decolonisation and healing: Indigenous experiences in the United States, New Zealand, Australia and Greenland, Aboriginal Healing Foundation, Ottawa, Canada, 2006. 671 ARTD Consultants and WestWood Spice, Development of program logic options for the NTER, unpublished report prepared for FaHCSIA, Canberra, 2010, p. 21.

Supporting families
Northern Territory Emergency Response: Evaluation Report 2011 263
The aim of the project was to increase the number of safe houses in communities, based on community consultation, and retrofit (or construct, in one community) 20 remote and two urban facilities. While short-term accommodation is offered for those who need it, the safe houses are also designed to provide a venue for group safety and wellbeing programs, behaviour change programs, linkages to support services, referrals to counselling for those who need it and access to legal services.672
Women’s Safe Houses aim to provide crisis accommodation and increase the safety options for women and their children. In addition they provide a range of programs for women and their children for safety, health and wellbeing.673 Men’s Places also aim to provide short-term crisis support and accommodation for men wishing to prevent escalating family violence. The Men’s Places were to also provide an avenue for men seeking support in managing violent behaviour.
A limited review of Northern Territory Men’s Places identified staff shortages and the lack of a clear service model and practices to guide implementation.674 Several recommendations were made by the evaluators on how to improve the service.675 In the report titled Evaluation of the Family Support Package: A Community Perspective, the low usage of the Men’s Places was highlighted. The report also noted that Men’s Places were originally called a Men’s Cooling Down Places, which had appeared to discourage men from using it because of the stigma associated with needing to cool down.676 The Northern Territory Government is developing a service model with the key criteria of consulting with local men on what they would like to see happen at the Men’s Place.677
In the Northern Territory, as part of the Family Support Package (FSP), there are 22 Safe Places in 15 remote communities, as well as Darwin and Alice Springs. There are 12 Safe Places for remote community women and their accompanying children escaping family violence. Eleven Women’s Safe Places or Women’s Safe Houses have been operating since 2009 and one since 2010. In addition to the Women’s Safe Places, there are also 8 Men’s Places that have been established through the FSP for men who seek support in managing violent behaviour.678 For the period January to June 2011, on average, 73 positions for Safe Places in remote areas were filled (72 of them local Indigenous people).679 In the period April 2009 to June 2011 some 1,453 clients have accessed the Women’s Safe Houses; these clients include 802 women and 651 accompanying children.680
In the CSSPS, when asked about service availability in their community, 34.5 per cent of service providers in NTER communities said there was no safe house in their community.681 When asked about services that do not exist and are needed, 33.2 per cent specifically identified a need for a safe house, along with 51.3 per cent who said their community needed a children’s refuge or safe house, 38.7 per cent who identified a need for a women’s group, and 45.8 per cent who saw a need for a men’s group.682 During community consultations by the NTER Review Board, a number of women voiced concerns about the lack of consultation and subsequent inappropriate design of safe houses in their community, meaning they would
672 FaHCSIA, Closing the Gap in the Northern Territory Monitoring Report, July–December 2010, Part two, op. cit. 673 C. Holmes, L. Fasoli & P. Stephenson, op. cit. 674 ibid., pp.5-6. 675 ibid., pp. 5–6. 676 ibid., p. 2. 677 C. Holmes, L. Fasoli & P. Stephenson, op. cit. 678 C. Holmes, L. Fasoli & P. Stephenson, op. cit., p. 1-2 679 FaHCSIA, Closing the Gap in the Northern Territory Monitoring Report, July–December 2010, Part two, op. cit., p.72 680 ibid., p. 72. 681 J. Putt, S. Middleton, J. Yamaguchi & K. Turner, op. cit. 682 ibid.

Supporting families
264 Northern Territory Emergency Response: Evaluation Report 2011
be unlikely to be used because they felt ‘more like detention centres’.683 Most residents from large communities in the CSWRS found that the presence of a safe house made a big difference to feelings of community safety, while those in small communities perceived less of a difference (73.0% in large communities and 51.5% in small communities684). However, there were regional differences in perceptions of safe houses for women. Those in northern communities were more likely than those in central communities to see a safe house as a place to go if they were hurt (71.0% compared with 48.6%). Most men used safe houses to participate in programs and for respite.685 In the Evaluation of the Family Support Package: A Community Perspective report, evaluators found that domestic violence was reported by many participants as being problematic, particularly in the wet season around January and February.686
A 2009 evaluation of the Safe Places initiative found that, while it is still in the very early stages, the program was showing evidence of becoming an important asset to communities in terms of increased employment opportunities, opportunities for support for community-led initiatives for Indigenous people, raising the profile of violence as a community issue, improved synergies between service providers, male connectedness, and reduced risk for the ‘strong women’ in the community who provide help to those who are in need due to domestic violence.687 Of concern to the authors of the evaluation was a lack of supervision and training for Indigenous staff. Often they lacked infrastructure in terms of telephone access (both to contact other support agencies and to be contacted by those agencies) and transport, where it was necessary to provide accommodation outside of the immediate community. They also mentioned a lack of quality data to understand the roles and services provided within the community. However, the evaluation noted that, despite the difficulties with funding security for the program, a strong will had emerged among many committed community workers to tackle issues of family violence.
According to the Evaluation of the Family Support Package: A community perspective report, the evaluators found that the very existence of the Women’s Safe House was perceived to be an important deterrent to violence. Its presence in the community was symbolic of a growing culture that regarded domestic violence as unacceptable to women, and also as a reminder that women had options available to them to escape violence.688 The evaluators also noted that Women’s Safe House staff had participated in various training and development programs.689
Qualitative data suggest that the Safe Places program is welcomed by communities and is improving perceptions of community safety in the communities where those services are provided.690 Although a service being valued and used by the community is important, data are needed to compare rates of violence for the broader Northern Territory Indigenous and non-Indigenous populations, to examine whether any effects are unique to those communities where the intervention was implemented. Such an examination would need to take into consideration other factors that may have influenced rates of family violence more broadly across the Northern Territory, either prior to the implementation of Safe Places or at the point of evaluation—including the range of other services that integrate with the Safe Places service (such as night patrols). Without these data, an evaluation of the efficacy of Safe
683 NTER Review Board, op. cit, p. 33. 684 FaHCSIA, Unpublished data from the Community Safety and Wellbeing Research Study (CSWRS), op. cit. 685 ibid. 686 C. Holmes, L. Fasoli & P. Stephenson, op. cit. 687 A. Arnott, J. Guenther & E. Cummings, op. cit. 688 C. Holmes, L. Fasoli & P. Stephenson, op. cit. 689 ibid. 690 ibid.

Supporting families
Northern Territory Emergency Response: Evaluation Report 2011 265
Places for those in need of the services is limited. Ideally, an evaluation would also utilise data on the characteristics of those who require or are eligible for the service, and compare those who access services and those who do not in order to understand where service gaps exist and what the barriers and facilitators to those services are. Additional information about Women’s Safe Places and Men’s Places can be found in Chapter 5, ‘Promoting law and order’.
Night patrols
Night patrols assist people at risk of either causing or becoming the victims of harm in order to break the cycle of violence and crime in the communities. The approach is to minimise harm by providing non-coercive intervention strategies to prevent anti-social and destructive behaviours through the promotion of culturally appropriate processes around conflict resolution in conjunction with contemporary law enforcement measures.691 The patrols are conducted by community members and are meant to operate five nights a week, with two people on duty at any time. Night patrols are an important part of the overall NTER suite of services (particularly in working in partnership with Safe Places), but have also existed in different forms for a number of years prior to the NTER in some communities. When service providers in the CSSPS were asked whether they thought a range of programs and initiatives had affected safety, 66.8 per cent of those in NTER communities felt that night patrols improved community safety (that is, made things a lot better or a bit better).692 Similarly for community residents from the CSWRS, 88.6 per cent in small communities, 76.7 per cent in medium-sized communities and 70.2 per cent in large communities felt night patrols contributed positively to community safety (that is, had made a big difference or a little bit of difference).693
Evaluation of the effectiveness of this initiative is difficult, as data are incomplete for some areas and do not include all activities of the night patrols. A monitoring framework is under development to improve this situation.694 (See Chapter 5 ‘Promoting law and order’ for more information.)
Australians for Native Title and Reconciliation (ANTaR), in its response to the Australian Government’s Stronger futures in the Northern Territory, argued for taking a community development approach to the issue of community safety, and called for the adoption of:
a justice reinvestment framework within which funding can be directed towards early intervention and diversionary initiatives to reduce the Aboriginal prison population.695
Service delivery is adapted to meet the needs of the community, as identified by its community members. Funding supports training and entitlements and helps to create career paths for Indigenous people in night patrol and other community services.696
Parenting programs Indigenous parenting services are designed to provide support to families to address underlying issues that can present barriers to effective parenting, such as social, cultural,
691 Attorney-General’s Department, Night Patrol Services in the Northern Territory: Operational Framework, Night Patrol Services, Northern Territory Service Delivery Team, Indigenous Policy and Service Delivery Branch, Social Inclusion Division. Attorney-General’s Department, January 2010 692 J. Putt, S. Middleton, J. Yamaguchi & K. Turner, op. cit. 693 FaHCSIA, Unpublished data from the Community Safety and Wellbeing Research Study (CSWRS), op. cit. 694 FaHCSIA, Closing the Gap in the Northern Territory Monitoring Report, July–December 2010, Part two, op. cit. 695 J. Phillips, E. Franklin & R. Viswanathan, A better way: Building healthy, safe and sustainable communities in the Northern Territory through a community development approach, Australians for Native Title and Reconciliation, Dulwich Hill, NSW, 2001, p. 7. 696 Attorney-General’s Department, op. cit.

Supporting families
266 Northern Territory Emergency Response: Evaluation Report 2011
personal, historical, financial and health factors, and ultimately aim to support families to prevent intervention by the child protection system. Skilled family support workers trained in early childhood education provide support to families with children under 12 years of age, particularly those under 2 years of age. Where possible, the programs are designed to integrate with existing services and infrastructure, such as childcare centres, schools or Aboriginal health centres. Where a need is identified, specific strategies seek to engage other particular groups, such as grandparents and kinship carers.697
Four Invest to Grow698 parenting programs have been implemented in a number of communities in the NTER:
• The Let’s Start program is a preschool program that aims to ‘support parents, enhance parenting practices, strengthen family units, develop children’s social skills and reduce problematic behaviour’. Positive family interactions and improved problem-solving skills have been noted in participants. Based upon the findings of the evaluation, the Let’s Start Indigenous Preschool Program is associated with reductions in children’s problem behaviours both at home and at school, children’s anxiety, and parental psychological distress; and improvements in parent–child relationships, parenting confidence and wellbeing.699
• In Ngaanyatjarra Pitjantjatjara Yankunytjatjara (NPY) communities, the Child Nutrition Program has been providing assistance to at-risk families through education, case management and a range of community development strategies. The services are targeted to families with children identified as suffering from failure to thrive, growth faltering or being at risk, and/or those involved in child protection interventions. Community events, school education and workshops were used to increase health promotion and nutrition awareness.700
• The Core of Life program provides information on pregnancy, birth, breastfeeding and early parenting to Aboriginal and Torres Strait Islander adolescents between 14 and 17 years of age. The program is conducted by midwives, school nurses, teachers, community members and youth workers who have received specific training. Evaluation by an independent consulting firm has shown that the program has produced good evidence to suggest that young people are challenged and have a new, heightened awareness about many aspects related to the journey of becoming a parent.701
• For Indigenous families where alcohol and substance abuse are problems, the Indigenous Children’s Program delivers services to improve family relationships, health, school readiness, and literacy and numeracy through early intervention. Families are encouraged to utilise services such as doctors, dentists and dieticians, and daily education sessions are conducted for mother and baby on nutrition and child health, parenting skills and play as a vehicle for skill development.702
Further information on specific community rollout and take-up of early childhood programs is available in Chapter 8, ‘Enhancing education’.
697 FaHCSIA, Family Support Program Guidelines Suite, Part C: Communities for Children Indigenous Parenting Services, Effective 1 July 2011Canberra, 2011 698 For a description of the Invest to Grow program and an evaluation of projects funded under the program, see http://www.aifs.gov.au/cafca/evaluation/pubs/pppfinalreport.pdf. 699 For an evaluation of the Let’s Start program and an evaluation of projects funded under the program, see http://www.aifs.gov.au/cafca/ppp/profiles/itg_lets_start.html and http://www.aifs.gov.au/cafca/ppp/profiles/pppdocs/itg_lets_start.pdf. 700 FaHCSIA, Closing the Gap in the Northern Territory monitoring report, July to December 2010, Part 2, op. cit. 701 ibid., pp. 70–72. For a description of the Core of Life Program and an evaluation of projects funded under the program, see http://www.aifs.gov.au/cafca/ppp/profiles/pppdocs/itg_core%20of%20life.pdf. 702 ibid.

Supporting families
Northern Territory Emergency Response: Evaluation Report 2011 267
There does not appear to be detailed data on children, families or carers who are eligible for, or identified as being likely to benefit from, participation in these early childhood and parenting programs. Some information on the number of community members who attend the programs and how often sessions are conducted in various communities is available, but that is not enough to evaluate the effect the programs have on supporting families, or to assess whether there is any growth in strengths/protective factors, or any overall reduction in the ‘risk profile’ of communities in terms of children’s vulnerability and need for protection.
Protecting children
Child‐at‐risk workers for Northern Territory child protection services
The Growing them strong, together report highlighted the inadequate resourcing of child protection in the Northern Territory, but also noted the uniqueness of the Territory context. Of particular note is the fact that a substantial number of children, particularly Indigenous children, live in small remote and very remote communities, and often English is not their first language.703
There has been a 70 per cent increase in full-time equivalent (FTE) child protection professionals working in the Northern Territory Department of Children and Families (NT DCF). In 2007, there were 101 FTE staff; by 2010, this has increased to 172704
Increased resources for authorities with responsibility for investigating child protection concerns increase their capacity to detect and respond to notifications, which increases the number of substantiated cases, which in turn increases community confidence to make reports knowing that appropriate action is likely to be taken.
Mobile Child Protection Team
A Mobile Child Protection Team (MCPT) was implemented under the NTER Family Support Package in an attempt to address the issues of workforce under-resourcing, recognising that remoteness and cultural diversity complicate child protection service delivery in the Northern Territory. In late 2010, in response to the findings of the Board of Inquiry into the child protection system in the Northern Territory, the Australian Government announced a range of measures that included an additional 15 mobile child protection workers to ensure that the needs of children in vulnerable families are met.705 The MCPT workers also play a key role in assisting staff in central offices with workload and case management issues by accessing local staff with cultural and community knowledge, while building stakeholder relationships and services.
In an evaluation conducted by the Menzies School of Health Research, the MCPT initiative was described as having had a positive impact on Northern Territory child protection issues. MCPT workers provided relief for regional NT DCF offices, particularly in relation to reducing the backlog of case investigations.706 The evaluators went on to describe initial uncertainties in formal policy and procedure guidelines that may have contributed to high levels of staff turnover, but noted that these have now changed with new recruiting procedures.
In the Evaluation of the Family Support Package: A Community Perspective report, evaluators were provided with a summary of initiatives undertaken by the MCPT:
703 M. Bamblett, H. Bath & R. Roseby, op. cit. 704 ibid., p. 471. 705 FaHCSIA, Stronger Futures in the Northern Territory—Discussion paper, FaHCSIA, Canberra, June 2011, p. 5 706 K. McGuinness, F. Arney & M. Westby, Mobile Child Protection Team Final Evaluation Report, Menzies School of Health Research, Darwin, unpublished report prepared for NTDCF, 2011, p. 54.

Supporting families
268 Northern Territory Emergency Response: Evaluation Report 2011
• implementation of a comprehensive induction process, including core training relevant to the MCPT
• organisation of regular team meetings, every three weeks, when the team is in Darwin
• regular ‘practice forums’ to build on knowledge within the team and identify best practice
• development of a comprehensive supervision policy, which provides supervision every three weeks to all practitioners and the establishment of Work Partnership Plans
• availability of permanent positions within the team
• development of a structured referral process with NT DCF Regional Offices highlighting best practice guidelines
• reorganisation of the MCPT to reflect regionalisation and to provide consistency to regional offices and communities, allowing a build up of local knowledge in the regions.707
In addition to the above, there have reportedly been 1,223 MCPT responses from 1 January to 30 June 2011, compared to 500 in the preceding six months.708
MCPT caseworkers had average caseloads of 19.4, with a range from 11.6 in March 2010 to 32.4 children per caseworker in May 2010, when the total MCPT caseload was 227. Qualitative data from the Menzies evaluation demonstrate the value that remote office NT DCF workers placed on MCPT workers and their contribution to finalising the backlog of cases created through previous strains on staff resources. One departmental child protection staff member commented:
But, you know, [we] wouldn’t have been able to be in the position we are, with the change reform that’s been going on in this office and where we’re heading—and we’re still undergoing significant change—without the mobile team … we have such a huge backlog and although it’s a new backlog now, to be able to get rid of that last backlog … When we crossed that last case off we had a celebration … It was this huge relief and it was a joint effort so you couldn’t just say, ‘Well it was because of the mobile team’, but between the Office and the mobile team, we did it.709
Despite qualitative data from MCPT workers and departmental co-workers commenting on the utility of the MCPT, the report authors noted that quantitative data are of poor quality: information is missing for some periods and there are limitations in the IT system capabilities for identifying some cases where the primary investigator was not an MCPT worker but the case investigation was performed by the MCPT. This made the evaluation of some outcome measures of the MCPT difficult.710 However, the difficulties in evaluating child abuse and neglect prevention programs are well recognised.711
In the evaluation conducted by the Menzies School of Health Research, the importance of MCPT team leaders in the structure of the MCPT is noted.712 The current system incorporates a team manager who is responsible for supervising and training the team, and below that a team leader who is responsible for mentoring the caseworkers managing and investigating cases. The authors of the report and MCPT workers noted the importance of the team leader role in the conduct of the units.
707 C. Holmes, L. Fasoli & P. Stephenson, op. cit pp.13-14, 708 ibid. pp. 13–14 709 K. McGuinness, F. Arney & M. Westby, Mobile Child Protection Team Final Evaluation Report, Menzies School of Health Research, Darwin, unpublished report prepared for NTDCF, 2011. 710 ibid. 711 P. Holzer, J. Higgins, L. Bromfield, N. Richardson & D. Higgins, ‘The effectiveness of parent education and home visiting child maltreatment prevention programs’, Child Abuse Prevention Issues, no. 24, AIFS, Melbourne. 712 K. McGuinness, F. Arney & M. Westby, op. cit.

Supporting families
Northern Territory Emergency Response: Evaluation Report 2011 269
Remote Aboriginal and Family Community Workers
One of the commitments under the NTER is to expand the Indigenous child protection and welfare workforce by the deployment of Remote Aboriginal and Family Community Workers (RAFCWs) to provide culturally appropriate child protection services for families in remote communities. Indigenous workers were employed to build the capacity of the Northern Territory child protection system in Indigenous communities and to respond to safety issues; however, they are not employed as statutory workers—their role is to focus on preventive work. Their tasks range from provision of support to families for managing day-to-day issues, through to working with departmental caseworkers and acting on specific reported concerns. For some families, it is necessary to coordinate access to various services (health, Centrelink etc.) and supply information and advice to departmental child protection workers. RAFCWs are often instrumental in locating and identifying at-risk children where the NT DCF has previously been unable to locate them. Part of their role is to facilitate linkages of services for families and to assist child protection workers by providing information on family and community dynamics and cultural issues.
RAFCWs establish relationships and liaise with police, night patrols, safe places, women’s centres, health clinics, schools, youth centres, sexual assault services, housing and Centrelink to help families in the day-to-day management of difficulties and their care plan implementation, assist in delivering and facilitating information sessions, facilitate interagency reference groups, and assist departmental case workers to talk about the benefits of income management.
In June 2011, 14 RAFCWs were based in 13 priority communities under the NTER. RAFCWs are providing services to the 13 priority communities and outreach services to an additional 20 communities as part of the priority community service model.713 These workers provide family support and community education in areas relevant to child protection. In the six months between January and June 2011, there were 97 referrals generated by individuals and families contacting the RAFCW Program for help for themselves or for other people and to report child protection concerns in their communities.714 In the same period there were 212 referrals from child protection staff for advice, information and assistance to engage and support clients and their families in communities.
RAFCWs are playing an important role in preventing some children from needlessly entering the statutory child protection system. However, the report Evaluation of the Family Support Package: A Community Perspective concluded that RAFCWs need to be able to concentrate on prevention work and to not be drawn into statutory child protection work.715
An independent evaluation by the Social Partnerships in Learning Research Consortium Evaluation Unit at Charles Darwin University of the RAFCW initiative during its establishment phase acknowledged difficulties in accessing definitive data, but identified anecdotal evidence to suggest that issues of family function, the health and wellbeing of families and communities, and perceptions about community safety and child protection were being addressed by the program. According to the evaluation report, and based on the report’s analysis of qualitative interviews and focus groups with stakeholders, for the most part, RAFCWs were making a significant contribution to supporting at-risk families. Evaluators
713 In accordance with the Closing the Gap in the Northern Territory National Partnership Agreement, the Family Support Package provides the Northern Territory Government funding for the placement of RAFCWs in 13 priority communities. In late 2010, in response to the findings of the Board of Inquiry into the child protection system in the Northern Territory, the Australian Government announced a range of measures that included an additional 22 RAFCWs. 714 FaHCSIA, Closing the gap in the Northern Territory monitoring report, January to June 2011, part 2, p. 77. 715 C. Holmes, L. Fasoli & P. Stephenson, op. cit.

Supporting families
270 Northern Territory Emergency Response: Evaluation Report 2011
identified issues with the clarity of the role of RAFCWs’ duties and approaches, and a need for nationally accredited training programs for workers in order to facilitate career advancement. The evaluators, RAFCW team leaders and RAFCWs expressed frustration with a lack of available infrastructure. The report authors also identified concerns about the safety of some staff under the RAFCW initiative in relation to the distances they are required to travel to see clients and the remote nature of their work. They suggested that infrastructure such as satellite telephones and emergency position indicating radio beacons would alleviate some of that risk.716 In terms of an evaluation of the project, they identified as a limitation a lack of quality data and tools to document change in family and community functioning.
The evaluation showed that RAFCW workers were preventing some children from needlessly entering the statutory child protection system by providing local and cultural contexts to investigations, linking clients to services and liaising between at-risk families and child protection workers to ensure effective communication. The initiative has also assisted by improving community perceptions of the Northern Territory child protection system.717
The authors of Evaluation of the Family Support Package: A community perspective noted that participants in the five remote communities involved in the study universally welcomed the concept of RAFCWs working with families and children at risk. Community members valued the provision of supports to families in concrete ways—helping them get what they need to better look after their children well before their situation deteriorates to the point where it is necessary to bring in the statutory child protection authorities or the MCPT.718
Thus, the available evidence suggests that the RAFCW Program is proving beneficial to Indigenous children who are identified as being at risk of harm. A serious limitation to the evaluation process is the lack of community-level data (such as reports or substantiations to the child protection authorities; survey data on the incidence of child abuse/neglect; or data on other wellbeing outcomes measures for children/families that would indicate that prevention efforts are having an effect) to enable comparisons between those communities where RAFCW programs have been implemented and those where they have not. Such a comparison is important for effective evaluation of a program such as the RAFCW Program.
Statutory child protection data
As shown in tables 7.2 and 7.3, measuring the frequency of child abuse/neglect is problematic because there is no national or state/territory study of incidence or prevalence. The societal and cultural factors that keep abuse and neglect hidden also contribute to difficulties in measuring its presence in a community, Indigenous or not, and the measurement of sexual abuse is particularly difficult.719
In addition, a statutory child protection system has a finite capacity. Where that capacity is exceeded, children will not appear in the child protection data (for example, where referrals are no longer made because professionals lack the confidence that there will be a timely response720). This is particularly important given that the Northern Territory child protection system is recognised as being under significant pressure in a range of areas, including receiving and responding to notifications in a timely manner, conducting consistent assessments and investigations of reports, supporting and recruiting foster carers, monitoring
716 E. Williams, E. Cummings, J. Geunther & A. Arnott, ‘I’m here to support you’ A formative evaluation of the Remote Aboriginal Family and Community Program, Charles Darwin University Social Partnerships in Learning (SPiL) consortium, unpublished report prepared for NTDCF, Darwin, 2009. 717 ibid. 718 C. Holmes, L. Fasoli & P. Stephenson, op. cit, p. 120. 719 K. Landgren, op. cit. 720 D. Higgins and Associates, op. cit.

Supporting families
Northern Territory Emergency Response: Evaluation Report 2011 271
family-based and residential care services (where there are high staff turnover and unfilled vacancies), promoting early intervention with limited family support services, and other issues in information-sharing between service providers.721 The newly formed NT DCF has refocused strategic directions towards keeping children and young people safe and supporting families.722
In response to the Growing them strong, together report, the Northern Territory Government announced the $130 million Safe Children, Bright Futures Strategic Framework 2011–15 child protection reform agenda. The reforms are intended to build a new child protection and family support system over the next five years, paying specific attention to supporting Indigenous families in rural and remote areas.723
Safe Children, Bright Futures incorporates:
• the establishment of the NT DCF
• legislative reform to strengthen and clarify the legal framework for protecting children and supporting families
• investment in recruiting, training and developing a skilled and supported workforce, including targeted learning strategies for Indigenous staff
• an investment of $9.1 million for the development of an Indigenous service sector that will provide culturally appropriate services and recognise the strengths of Aboriginal families and communities while involving Aboriginal organisations at a community level in decision-making processes regarding the wellbeing and safety of Indigenous children and young people.
It is impossible to determine the impact of these measures in isolation from the NTER. Any evaluation of child protection over this period may have been affected to varying degrees by changes implemented due to these reports and/or the NTER.
The impetus for the NTER came from the Little children are sacred report, published in 2007. The report described unacceptable levels of sexual abuse and sexualised behaviour in Northern Territory Aboriginal communities.
When respondents to the CSWRS were asked about safety for different population groups, little children were considered to be the least safe of all: 16.3 per cent felt that young children were unsafe some or all of the time.724 Based on extensive community consultation, the NTER Review Board found that neglect was recognised to be a widespread issue within communities, but there was also frustration over the lack of community involvement in initiatives and the lack of knowledge at the community level of what was being done to address the safety and wellbeing of children.725 This lack of community involvement was also identified as a key issue in the Little children are sacred report, which pointed out that what was needed was:
determined, coordinated effort to break the cycle and provide the necessary strength, power and appropriate support and services to communities, so they can lead themselves out of the malaise: in a word, empowerment.726
721 M Bamblett, H Bath & R Roseby, op. cit. 722 Northern Territory Government, Safe Children, Bright Futures Strategic Framework 2011 to 2015, op. cit. 723 ibid. 724 G. Shaw & P. d’Abbs, op. cit. 725 NTER Review Board, op. cit. 726 P. Anderson & R. Wild, op. cit.

Supporting families
272 Northern Territory Emergency Response: Evaluation Report 2011
At the national level, most headline statutory child protection indicators have increased over the past decade.727 In part, those increases can be explained as a continuation of broader historical trends over the past 30 to 40 years that have given rise to the current shape of child protection services in Australia, including:
• the influence of social change on community behaviour, such as attitudes to the physical punishment of children, and greater recognition of children’s rights
• increased public awareness of the issue of child abuse/neglect, leading to more frequent reporting to authorities
• broadening of the scope of child protection services beyond the early focus on neglect and severe physical and sexual abuse
• decreases in the ‘threshold’ for child protection intervention
• growing awareness of the cumulative impact of abuse/neglect on child development
• the increasingly complex needs of families referred to child protection services
• the cumulative effect of children entering care at a younger age and spending longer in care.728
In addition to the above issues, the data should also be interpreted with care. Indigenous children are more likely to come to the attention of authorities and have reports of suspected harm subsequently substantiated when compared to non-Indigenous children.729 Australia-wide, Indigenous children are nearly eight times more likely to have substantiated reports of harm than their non-Indigenous counterparts.730 The intervention brought about by child protection services is also more likely to be out-of-home care.731 Child protection data therefore reflect departmental investigatory and assessment activities rather than primary prevention activities.732 Furthermore, an increase in recorded levels of abuse may simply reflect more effective monitoring, rather than true changes in patterns of abuse/neglect.733,734
Unfortunately child protection data are not available for the NTER communities. However, the NT DCF has provided child protection data back to 2001–02 for Indigenous and non-Indigenous children by region. It is possible to exclude the Greater Darwin region to get a sense of trends in the NTER communities, given that the majority of Indigenous children in the Northern Territory who do not live in the Darwin region live in the NTER communities.
There have been very large increases in both notifications and substantiations for Indigenous children in the Northern Territory since the commencement of the NTER. However, those increases are likely to be associated not just with additional services provided by the NTER but also by extra resources provided by the Northern Territory Government:
• From 2006–07 to 2010–11, the number of child protection notifications for Indigenous children in the Northern Territory increased by 147.1 per cent. Most of the increase
727 L. Bromfield & P. Holzer, NCPASS comparability of child protection data: Project report, National Child Protection Clearinghouse, AIFS, Melbourne, 2008. 728 D.J. Higgins, Child safety and wellbeing in the NT: a report to the Northern Territory Emergency Response (NTER) Review Board, Australian Institute of Family Studies, unpublished report, Melbourne, 2008. 729 C. Berlyn, L. Bromfield & A. Lamont, Child protection and Aboriginal and Torres Strait Islander children, National Child Protection Clearinghouse Resource Sheet, AIFS, 2011. 730 AIHW, Child protection Australia 2009–10, op. cit. 731 D.J. Higgins, Community development approaches to safety and wellbeing of Indigenous children, op. cit. 732 ibid. 733 K. Landgren, op. cit. 734 Steering Committee for the Review of Government Service Provision, Overcoming Indigenous disadvantage: Key indicators 2011, Productivity Commission, Canberra, 2011.

Supporting families
Northern Territory Emergency Response: Evaluation Report 2011 273
(81.6%) occurred outside Greater Darwin. As a proportion of all notifications for Indigenous children in the Territory, regions other than the Greater Darwin area went from 64.2 per cent in 2006–07 to 74.6 per cent in 2010–11. (Many of these non-metropolitan areas are NTER communities.)
• From 2006–07 to 2010–11, the number of child protection substantiations for Indigenous children in the Northern Territory grew by 136.6 per cent. The vast majority of this increase (81.7%) occurred outside Greater Darwin.
• Of the total increase in child protection substantiations from 2006–07 to 2010–11 for Indigenous children in the Northern Territory, the majority (73.7%) were for ‘neglect’.
Area-level data from the NT DCF show substantial increases in notifications and substantiations across the entire Northern Territory. The largest increase in substantiations was for neglect, particularly in the Central Northern Territory and Katherine regions. The majority of notifications for 2010–11 were due to police reports (23.2%), followed by 16 per cent from hospitals or health care centres and 15.7 per cent from schools. These data are indicative of additional resources in child protection across these regions. (See Appendix 7B for a copy of the data supplied by the NT DCF.)
However, it should also be recognised that other jurisdictions have also experienced a similar pattern of increase in notifications and substantiations for Indigenous children—often in response to increases in the staffing and capacity of departments (although typically the increases in other states/territories occurred a few years earlier than in the Northern Territory).735 Figure 7.1 shows substantiation rates per 1,000 children for Northern Territory Indigenous children compared to non-Indigenous children in the Territory and the rest of Australia and Indigenous children outside of the Territory. These data demonstrate that rates of substantiation for harm relating to the abuse or neglect of Indigenous children are similar between Northern Territory and the rest of Australia, with the Northern Territory slightly lower throughout—but with the gap narrowing, particularly in the past year. (It is possible that this narrowing of the gap between the high substantiation rate for Indigenous children in other jurisdictions compared to the Northern Territory may be attributable to the greater resources given to the child protection systems and greater attention from professionals and the public to previously undetected and unreported child abuse in NTER communities). Similarly, the patterns of substantiation across the decade are similar for non-Indigenous Australians in the Northern Territory and the rest of Australia.
735 L. Bromfield & P. Holzer, op. cit.

Supporting families
274 Northern Territory Emergency Response: Evaluation Report 2011
Figure 7.1 Substantiation rates (per thousand children aged 0 to 16) for Indigenous and non-Indigenous children in the Northern Territory and Australia
0
5
10
15
20
25
30
35
40
1999-20002001-02
2003-042005-06
2007-082009-10
Sub
stan
tiatio
n ra
te (p
er '0
00 c
hild
ren)
Australia Indigenous NT IndigenousAustralia non-Indigenous NT non-Indigenous
Source: Productivity Commission, 2011.736
In 2006–07, 395 Indigenous children aged 0–16 years in the Northern Territory were the subject of child protection substantiations (16.8 per thousand children). Of those children, 118 (5.0 per thousand children) were subject to substantiations relating to ‘neglect’ (that is, 29.8% of cases).
By 2009–10, the number of Indigenous children in the Northern Territory aged 0–16 who were subject to a substantiation of harm had increased to 863 (33.5 per thousand children). In other words, the child protection substantiation rate for Indigenous children in the Northern Territory more than doubled from 2006–07 to 2009–10, bringing it closer in line with the rate for Indigenous children elsewhere in Australia (see Figure 7.1). Apart from Tasmania, there was no similar percentage increase in substantiations for Indigenous children in any other jurisdiction over the same period. However, large increases in substantiation rates for Indigenous and non-Indigenous children had already occurred in the previous five years (from 2000–01 to 2005–06) in other jurisdictions:
• The Australian Capital Territory had a sixfold increase (from 3.0 to 17.9 per thousand).
• New South Wales had a fourfold increase (from 4.9 to 19.8 per thousand).
• Queensland had a 50 per cent increase (from 9.6 to 14.3 per thousand).
(For further details of comparisons between jurisdictions, see Appendix 7A).
Of the total increase in substantiations from 2006–07 to 2009–10 for Indigenous children in the Northern Territory, three out of four were for the category of ‘neglect’ (74.4%).
Although data from the NT DCF suggest that only a small proportion of substantiations for Indigenous children in the Northern Territory relate to harm or risk of harm from sexual abuse, there has been an increase in the number of substantiations relating to sexual abuse in recent
736 Steering Committee for the Review of Government Service Provision, op. cit.

Supporting families
Northern Territory Emergency Response: Evaluation Report 2011 275
years. In the four years since the commencement of the NTER (from 2007–08 to 2010–11), the number of substantiations for sexual abuse of Indigenous children in the Northern Territory was 304. This compares to only 167 in the four years prior to the NTER (2003–04 to 2006–07). The increase in substantiations during the period of the NTER occurred only in areas outside the Darwin region, many of which are included in the NTER communities (in fact, the number of substantiations for harm from sexual abuse among Indigenous children in the Darwin region fell over this period).
While there are clear discrepancies and difficulties in measuring the magnitude of family dysfunction and child abuse/neglect in the Northern Territory, there is little doubt that the capacity of the Northern Territory system to respond to child safety concerns has increased, and the system is responding to greater numbers of notifications and substantiations.
Aboriginal child placement principle
An important part of the safety and wellbeing of vulnerable children is ‘cultural safety’. When children cannot remain safely in the care of their biological parents, it is recognised that it is important for them to be ‘culturally safe’ and to have the benefits of connection to kin, community and culture.737 To achieve this, all states and territories have adopted a placement principle for decision-making in relation to out-of-home care placements for Aboriginal and Torres Strait Islander children.738
The Aboriginal child placement principle outlines the preferred placement for an Aboriginal or Torres Strait Islander child who has been removed from their birth family, in descending order:
1. the child’s extended family
2. the child’s Indigenous community
3. other Indigenous people
4. non-Indigenous carers.739
Data from 2009–10740 show that 44.8 per cent of out-of-home care placements in the Northern Territory were with relatives/kin, with other Indigenous carers or in Indigenous residential care.741 However, increasing demand on the child protection system requires a similar increase in the availability of suitable placements. These issues are not unique to the Northern Territory, but are also faced elsewhere in Australia. According to the AIHW, the proportion of Indigenous to non-Indigenous children is higher in the Northern Territory (43.3%) compared to 4.6 per cent in the rest of Australia. Therefore, locating available and suitable Indigenous carers is more difficult in the Northern Territory, particularly in the context of economic disadvantage, remoteness and the large numbers of Indigenous children in out-of-home care. Of the 406 Aboriginal and Torres Strait Islander children in out-of-home care in
737 D.J. Higgins, Community development approaches to safety and wellbeing of Indigenous children, op. cit. 738 ibid. 739 D.J. Higgins, L. Bromfield & N. Richardson, Enhancing out-of-home care for Aboriginal and Torres Strait Islander young people: A report to the Australian Council of Children and Parenting, AIFS, Melbourne, 2005. 740 AIHW, Child protection Australia 2009–10, op. cit, p. 56 741 Many of the placements with non-Indigenous carers may still be made ‘in accordance’ with the principle. The principle still reflects the need for placement with non-Indigenous carers where an appropriate Indigenous carer cannot be found (for example, finding an appropriate family placement for a child with a disability may be particularly difficult, and placement in a remote area may be hazardous). Unfortunately, the data reported in the annual Child Protection Australia report covers only the outcome (placement with Indigenous vs. non-Indigenous carer), not whether the placement principle was followed in arriving at this outcome.

Supporting families
276 Northern Territory Emergency Response: Evaluation Report 2011
the Northern Territory on 30 June 2010, 182 were placed with relatives/kin, with other Indigenous caregivers or in Indigenous residential care.742
In a study that the Australian Institute of Family Studies (AIFS) conducted on ways to enhance Indigenous out-of-home care, carers and service providers explained that simply complying with the Aboriginal child placement principle was not sufficient to ensure a culturally appropriate placement.743 Despite adherence to the principle, children may be placed with:
• the ‘white’ side of a family
• an Aboriginal carer who is not from the child’s own cultural group
• kin who may have (as a consequence of their own removal) been disconnected from their traditional culture.
The children may therefore become disconnected from their community and culture. During the child protection system review, Growing them strong, together, some communities identified the need for ‘local safe houses so that removed children could remain close to culture’.744 Similarly, focus group discussions with Indigenous children in out-of-home care found that the children wanted help for their families in overcoming problems such as alcohol abuse to enable their reunification with their family. These children identified connection to family, community and culture as being the most important issues to them, as opposed to explicitly stating a desire to be ‘kept safe’.745
The Northern Territory statutory child protection system
There is currently little input into the child protection system by Aboriginal communities, and widespread distrust. Many people feel that child protection is little more than a process of removing children from their families.746 One of the urgent recommendations in the Northern Territory child protection system review was the establishment of an Aboriginal peak body to support the establishment of Aboriginal child and family safety and wellbeing services and child protection agencies.747
Sustainable improvements in child wellbeing are unlikely to be a result of changes to the child protection system alone. Experts consistently point to the benefits of child protection work being based on a child-focused, family support paradigm—backed up with provision of, and access to, additional support services. A public health approach—in which preventive measures are provided for all families within a community and more intense, targeted support services are provided for families who are exposed to a number of risk factors and so are identified as vulnerable—has been shown to minimise the demand on tertiary intervention child protection systems and has been adopted as best practice by the National Framework for Protecting Australia’s Children.748,749
742 ibid. 743 D.J. Higgins, L. Bromfield & N. Richardson, op. cit. 744 M. Bamblett, H. Bath & R. Roseby, op. cit, p. 112. 745 D. Higgins, L. Bromfield, J. Higgins & N. Richardson, ‘Protecting Indigenous children: Views of carers and young people on out-of-home care’, Family Matters, no. 75, 2006, pp. 42–49. 746 M. Bamblett, H. Bath & R. Roseby, op. cit. 747 ibid. 748 D.J. Higgins, Child safety and wellbeing in the NT, op. cit. 749 D.J. Higgins & I. Katz, ‘Enhancing service systems for protecting children: Promoting child wellbeing and child protection reform in Australia’, Family Matters, no. 80, 2008, pp. 43–50.

Supporting families
Northern Territory Emergency Response: Evaluation Report 2011 277
Child sexual assault police data
Although the initial impetus for the NTER related to concerns over the sexual abuse of Indigenous children in the Territory, the focus quickly shifted to the problem of neglect. Child protection data show that in 2009–10 neglect accounted for 51.4 per cent of all child abuse substantiations involving Northern Territory Indigenous children under the age of 16 years, whereas substantiations relating to harm from sexual abuse were the smallest category (8.6%), which is also true for all other jurisdictions.750
Understanding the magnitude of child sexual assault is complicated. In the first instance, child sexual assault is underreported, and in those cases only a small proportion of perpetrators are charged with offences—and fewer still are convicted.751
There were 11 convictions for child sexual assaults committed in the NTER communities in 2006–07, 11 in 2008–09, 12 in 2009–10 and 11 in 2010–11. The total number of child sexual assault convictions over the four years from 1 July 2007 to 1 July 2011 was 44. This compares to a total of 25 convictions in the four years prior to the commencement of the NTER (that is, from 1 July 2003 to 30 June 2007).
The conviction rate for child sexual abuse is likely to understate the actual level of abuse, and it is misleading to view it in isolation from other data about the safety of children.
NTER measures designed to overcome risk factors for family dysfunction and child abuse/neglect
Poverty and disadvantage The published literature shows clear associations between socioeconomic disadvantage and poor outcomes for children. In a recent report, both poverty and low socioeconomic status were listed as important contributors to current levels of neglect in Indigenous communities.752 Families with heightened stress levels—where there is substance abuse, family violence and child abuse/neglect—are also more likely to be faced with increased rates of poverty, discrimination and poor housing.753 These findings are further supported by research in Canada, where poverty and poor housing were among other factors that contributed to the numbers of First Nations children recorded in Canadian child abuse and neglect statistics.754
Aboriginal culture places a strong expectation on family commitment, which should be taken into account when analysing family characteristics and socioeconomic status.755 For sustainable reductions in family dysfunction and harm to children from abuse/neglect to occur, it is acknowledged that fundamental changes to the levels of poverty, living standards and the resources of individuals within Northern Territory Indigenous communities will have to occur.756
750 AIHW, Child protection Australia 2009–10, op cit. 751 D. Higgins, Cooperation and coordination: An evaluation of the Family Court of Australia’s Magellan case-management model, Family Court of Australia, Canberra, 2007. 752 AIHW, Child protection Australia 2009–10, p. 29, op. cit. 753 J. Garbarino, ‘Supporting parents in a socially toxic environment’, in J. Westman (ed.), Parenthood in America: Under paid, under valued, under siege, University of Wisconsin-Madison Press, Wisconsin, 2001. 754 N. Trocmé, D. Knoke & C. Blackstock, ‘Pathways to the overrepresentation of Aboriginal children in Canada’s child welfare system’, Social Services Review, no. 78, 2004, pp. 577–600. 755 R. Walker & C. Shepherd, op. cit. 756 M. Bamblett, H. Bath & R. Roseby, op. cit.

Supporting families
278 Northern Territory Emergency Response: Evaluation Report 2011
Welfare reform The NTER implemented a number of interventions that were expected to minimise this disadvantage, including income management and Community Development Employment Projects program.
Income management
As described in Chapter 9, ‘Welfare reform and employment’, income management was applied to individuals who received eligible income support payments and were living in NTER prescribed areas. Under the scheme, a proportion of each recipient’s Centrelink payments was ‘quarantined’ for priority purposes such as food, rent and household goods, restricting expenditure on items that are problematic for child wellbeing, such as alcohol, pornography and gambling. Following the initial implementation in 2007–08, further changes were made in 2010. Under the new system (which applies to the entire Northern Territory, not just to Indigenous Territorians or to the prescribed areas), particular families who are identified as being in need of support because of a high risk of social isolation, engagement in risky behaviours (such as gambling) and/or poor money management skills are specifically targeted. A worker from Centrelink or the NT DCF generally identifies participants; however, there is capacity for others to participate on a voluntary basis. In addition to the income quarantine restrictions, participants are also eligible to receive financial counselling, savings incentives and help with financial management (although issues of service availability should be noted).
A 2010 report by the Senate Community Affairs Legislation Committee found that there were 16,350 Indigenous people in the Northern Territory participating in the new scheme of income management, and that 96.6 per cent of all income management participants were operating under the new scheme (data on numbers of voluntary participants did not appear in the report). An analysis of the spending patterns of those on income management showed that most of their funds (68.4%) was being spent on food—which is one of the spending priorities, and part of the overall strategy under the NTER and the new scheme of income management to prevent the physical neglect of children.757
The same review noted differences of opinion among Indigenous people affected by income management. For more vulnerable groups, such as those with a disability, aged pensioners or women, it was felt that the scheme made it less likely that they would be harassed (‘humbugged’) for money. However, there was strong criticism about understanding of the effects of the scheme because of the compounding effects of other programs implemented at the same time. A lack of evidence to underpin the design and implementation was also apparent in the review.758 The committee noted that many commentators, Indigenous people and community representatives saw income management as simply an example of ongoing discrimination against Indigenous people and were especially critical of the ‘humiliating’ administrative processes of the scheme.759
A comprehensive, effective evaluation of the effect of income management on Indigenous families is beyond the scope of this chapter; however, in the Senate Community Affairs Legislation Committee report, the Australian Council of Social Services recommended the conduct of an independent evaluation that includes baseline, qualitative and quantitative data.760 FaHCSIA has engaged a consortium of researchers from the University of New South
757 Senate Community Affairs Legislation Committee, op. cit. 758 ibid. 759 ibid. 760 ibid.

Supporting families
Northern Territory Emergency Response: Evaluation Report 2011 279
Wales, the Australian National University and the AIFS to undertake such an evaluation of the new scheme of income management in the Northern Territory.
Additional information on the impact of income management can be found in Chapter 9, ‘Welfare reform and employment’.
Employment services
While job placements increased by 55 per cent between 2009 and 2010761, 27 per cent of respondents in the CSWRS identified a lack of employment opportunities as being one of three priorities for change.762 The proportion of Indigenous people of working age who are employed is much lower than for non-Indigenous people across all states and territories. In 2008, 53.8 per cent of all Indigenous Australians aged 15 to 64 years were employed, which is substantially smaller than the proportion of non-Indigenous Australians who were employed (75%). However, the situation is worse in the Northern Territory: in 2008, only 50.8 per cent of working-age Indigenous Territorians were employed, compared to 80.5 per cent of non-Indigenous Territorians in work.763
A number of initiatives under the NTER led to locally based job creation. As identified above, both the RAFCWs and the Women’s Safe Places are examples of this.
Access to support services A poor sense of attachment to the local community, a lack of sense of security and a lack of access to support services that enhance community connection and engagement all play a role in family dysfunction and child abuse/neglect. The legacy of the forced separations from family and traditional country of the Stolen Generations has implications for this generation and affects the social and emotional wellbeing of Aboriginal people.764 In order to minimise the need for intervention from statutory child protection authorities, it is vital for families to have adequate access to services that address the underlying risk factors for family dysfunction (such as poverty, unemployment or family health issues). In focus group discussions with children who had experienced out-of-home care, one of the most important issues they identified was the need for services to address their parents’ problems—particularly alcohol abuse.765
Relationships and social networks play vital roles in healthy growth and development in children. Research has shown that children have better outcomes when they share experiences with parents (such as play and social occasions) and come from an environment with strong connections between individuals, with established, trusting relationships within which support and resources are shared and exchanged. Such environments support effective parenting skills to buffer the effects of other risk factors and minimise negative childhood outcomes, such as gang participation, juvenile delinquency, dropping out of school, depression in teens and other problematic behaviours.766 The effectiveness of any program
761 FaHCSIA, Closing the Gap in the Northern Territory Monitoring Report, July–December 2010, Part two, op. cit. 762 G. Shaw & P. d’Abbs, op. cit. 763 Nationally, the gap of 18 percentage points between the Indigenous and non-Indigenous employment rates is widened to 47 percentage points if CDEP participants are excluded. In the Northern Territory, the Indigenous employment rate falls to 33.3 per cent if CDEP is not counted as employment. The gap in employment rates between Indigenous and non-Indigenous Australians is greater in the Northern Territory than in any other jurisdiction regardless of whether CDEP is treated as employment. COAG Reform Council, National Indigenous Reform Agreement: Baseline performance report for 2008–09, COAG Reform Council, Sydney, 2010. 764 R. Walker & C. Shepherd, op. cit. 765 D. Higgins, L. Bromfield, J. Higgins & N. Richardson, op. cit. 766 AIHW, National outcome measures for early childhood development: Development of an indicator based framework, cat. no. PHE 134, AIHW, Canberra, 2011.

Supporting families
280 Northern Territory Emergency Response: Evaluation Report 2011
that is implemented in a community where members do not feel connected is likely to be minimised.767
Youth support services The FaHCSIA surveys of communities and service providers about their perceptions of community safety identify a common theme: that unruly youths, often in the context of gangs wandering the streets, youth vandalism, classroom violence, unsafe driving by young people and youth ‘hanging out’, contributed to feelings of a lack of community safety.768
However, reports show that there are divergent views, and there is not sufficient data to know how representative those views are. For example, one service provider in the CSSPS said that they wouldn’t feel safe walking alone at night. On the other hand, another noted that:
Generally, it is a pretty safe place … The other main problem is young people who are bored and out ‘prowling’ at night. We used to have a Sport and Rec officer who was brilliant. Then the position became a Youth Worker, which was less community involved. There needs to be organised activities to stimulate and engage young people so they are not tempted into anti social behaviour through boredom.769
Many of the parents of these young people also have concerns about their own children’s difficult-to-manage behaviours, and want help. In the consultation process for the review of the Northern Territory child protection system, many community members said that they had difficulties setting boundaries and enforcing them for their children and asked for help with parenting their children.770
As part of the strategy to address alcohol and drug abuse among young Aboriginal people, the NTER provided funds for:
• the Northern Territory Youth Development Networks—which supported 46 projects aimed at establishing a range of regional and community-specific youth diversionary activities, increasing regional coordination and activity networks771
• the former Youth Alcohol Abuse Diversion Measure—which supported 15 projects aimed at providing infrastructure and youth diversion programs across the Northern Territory in 2008-09.772
School holiday programs were also conducted in 10 communities in April and June/July 2008.773 Around 2,000 Aboriginal youth accessed the programs, and 27–30 youth workers and 27–30 Indigenous trainee youth workers participated in the scheme.774 Of community residents surveyed in CSWRS, 65.4 per cent thought that having more things for young people to do had made a positive difference to safety (either a big difference or a little bit of difference). This compares to 24.1 per cent of residents who thought it had made no difference, 2.7 per cent who thought it had made things worse, and 6.6 per cent who did not know.775 When service providers were asked in the CSSPS about the effectiveness of having more things for young people to do, 16.5 per cent did not know and 33.8 per cent thought it
767 J. Scougall, Lessons learnt about strengthening Indigenous families and communities: Stronger Families and Communities Strategy 2000–2004, occasional paper no. 19, FaHCSIA, Canberra, 2005. 768 J. Putt, S. Middleton, J. Yamaguchi & K. Turner, op. cit., p. 72. 769 ibid. 770 M. Bamblett, H. Bath & R. Roseby, op. cit. 771 FaHCSIA Closing the Gap in the Northern Territory Monitoring Report, January 2009 to June 2009, Part two, pp. 30–31 772 ibid. 773 NTER Review Board, op. cit. 774 FaHCSIA, Closing the Gap in the Northern Territory Monitoring Report, July–December 2010, Part two, op.cit. 775 G. Shaw & P. d’Abbs, op. cit.

Supporting families
Northern Territory Emergency Response: Evaluation Report 2011 281
had improved safety (made things a lot better or a bit better). A further 23.8 per cent said that such measures did not exist in their community, and 4.6 per cent thought they had made things worse (a bit worse or a lot worse). One service provider said, ‘There has been no increase in things for young people to do. No drop in centre for young people.’776
Another said, ‘We currently don’t have a youth officer or any sport and recreation officer employed so it makes it hard to see progress in this area.’777
These quotes provide some insight into the lack of knowledge about available programs (or at least of what the names of the programs are). However, the CSSPS (from which the data were accessed) does not clarify whether this is due to a service coordination issue, an accessibility issue or a need for more targeted services in selected communities.
Providing access to services in remote Indigenous communities must go beyond the simple provision of staffed offices in regional towns. Researchers and experts consistently acknowledge the importance of services being delivered in a culturally sensitive context for Indigenous people to access them.778 Furthermore, in many communities English is a second (or third, or even fourth) language. There is a shortfall of available, trained interpreters for Indigenous language speakers, and interpreters’ limitations in literacy and numeracy influence their recruitment and retention. For example, in one six-month period, 3,439 people required the services of a trained Indigenous interpreter in the NTER region; however, only 2,049 sessions were delivered.779
Youth Alcohol Diversion measure As part of the NTER, $8.8 million was spent in 2008–09 on the Youth Alcohol Diversion measure, which aimed to divert young people away from harmful behaviour by providing youth-focused recreation, equipment and infrastructure as well as diversion activities.
In 2010, URBIS independently evaluated the Youth Alcohol Diversion measure780 and found that the large number of activities delivered to young people in the target communities were largely implemented as intended and were enjoyed by participants. The projects were found to enhance the capacity of Indigenous youth service providers and provided infrastructure benefits extending beyond the life of the program. Short-term impacts included an increase in school holiday program attendance and some school attendance, and reductions in vandalism or antisocial behaviour.
The review highlighted the complexities and difficulties of implementing youth programs in remote communities, which is further compounded by the funding of short-term programs. It found that successful youth programs take a case-management approach, strengthening the engagement with families and the capacity of communities and local youth workers in the longer term.
One finding, possibly as a result of the rapid implementation of programs under the NTER, was the inadequacy of program planning and implementation combined with poor interagency coordination. For example, some infrastructure and activity projects did not complement each other, and there was a lack of consultation with communities and stakeholders.
776 J. Putt, S. Middleton, J. Yamaguchi & K. Turner, op. cit. 777 ibid. 778 F. Al-Yaman & D. Higgins, What works to overcome Indigenous disadvantage: Key learnings and gaps in the evidence, produced for the Closing the Gap Clearinghouse, AIHW and AIFS, Canberra, 2011. 779 FaHCSIA, Closing the Gap in the Northern Territory Monitoring Report, July–December 2010, Part two, op. cit. 780 J. Ohlin, S. Ross, A. Wilczynski, R. Pigott, J. Connell & K. Reed-Gilbert, Review of certain FaHCSIA-funded youth services, URBIS for FaHCSIA, Canberra, 2010.

Supporting families
282 Northern Territory Emergency Response: Evaluation Report 2011
While issues of substance misuse by young people are of critical importance (particularly given the young age profile of Indigenous Australians), problems with alcohol misuse are not restricted to young people. It is well recognised that parental alcohol misuse is a significant risk factor for child abuse/neglect, as well as being associated with family violence and other aspects of family dysfunction.781 For further information on the alcohol measures, see Chapter 6, ‘Improving child and family health’.
Community empowerment Consultations conducted by the NTER Review Board for its 2008 report revealed a sense of disempowerment in Indigenous communities, where many felt that their attempts to address their own social problems were ignored by government. Government and communities should work together to achieve improved outcomes.782 Holmes et al. noted that community members felt that the NTER and shire amalgamations had eroded local leadership and the authority of elders, and that this was a contributor to violence and child abuse taking place within the community.783
A key theme that emerged from open text responses in the CSSPS, conducted by FaHCSIA as part of the NTER evaluation, was that increased community involvement in key decisions was required if programs were to have an impact on community safety and wellbeing. Many service providers suggested establishing community action groups and engaging community leaders who could drive the agenda where needed.784 This is consistent with research in the community development field that highlights the benefits of community-identified and community-led solutions.785
In Canadian communities where culturally based services and self-determination exist, research studies have demonstrated links between increases in the number of such services and decreases in youth suicides.786 The Senate Community Affairs Legislation Committee noted the conflict some communities and individuals felt between the application of Aboriginal law and Australian laws and expectations. As a result, the community felt there was nothing they could do. A Northern Australian Aboriginal Justice Agency submission described how customary law made the family responsible for an issue and that, if that responsibility could be recognised in Northern Territory courts, families could better manage many issues.787,788
Housing There are clear links between child abuse/neglect and overcrowding, and particularly between abuse/neglect and the number of adults living in a child’s home who are not biologically related to the child.789 This section addresses these risk factors as they have been affected by the housing and land reform component of the NTER.
781 S. Dawe, P. Harnett & S. Frye, ‘Improving outcomes for children living in families with parental substance misuse: What do we know and what should we do’, Child Abuse Prevention Issues, no. 29, AIFS, Melbourne, 2008. 782 NTER Review Board, op. cit. 783 C. Holmes, L. Fasoli & P. Stephenson, op. cit. 784 J. Putt, S. Middleton, J. Yamaguchi & K. Turner, op. cit. 785 D.J. Higgins (ed.), Early learnings: Indigenous community development projects, Telstra Foundation research report vol. 2, Telstra Foundation, Melbourne, 2005. 786 M. Chandler & T. Proulx, ‘Changing selves in changing worlds: Youth suicide on the fault-lines of colliding cultures’, Archives of Suicide Research, vol. 10, no. 2, 2006, pp. 125–140. 787 Senate Community Affairs Legislation Committee, op. cit. 788 L. Archibald, Promising healing practices in Aboriginal communities, op. cit; L. Archibald, Decolonisation and healing: Indigenous experiences in the United States, New Zealand, Australia and Greenland, op. cit. 789 ‘Children residing in households with adults unrelated to them were 8 times more likely to die of maltreatment than children in households with 2 biological parents.’ See M.N. Stiffman, P.G. Schnitzer, P. Adam, R.L. Kruse & B.G. Ewigman, ‘Household composition and risk of fatal child maltreatment’, Pediatrics, vol. 109, no. 2, 2002, pp. 615–621.

Supporting families
Northern Territory Emergency Response: Evaluation Report 2011 283
There is debate within communities and among academics, social commentators and activists about the role of different forms of land ownership and their effects on the material wellbeing of Indigenous communities. Some have argued that, given the central role that home ownership has in the Australian psyche and its contributions to the growth of individual household wealth, communal land ownership fails to deliver some expected benefits compared to the more positive results of land reform and the establishment of individual property rights. Helen Hughes, for example, argued that the current communitarian social organisation advocated for Indigenous communities contributes to ongoing socioeconomic deprivation.790 During consultations for the 2008 NTER Review Board report, a number of people commented on the negative impact, in exacerbating an existing sense of disempowerment, of the five-year compulsory lease acquisition of Indigenous lands without any consultation with the traditional owners.791
Home ownership, affordability, mobility, homelessness, overcrowding and the characteristics of the dwelling can affect family stress and wellbeing and child development—including academic achievement, as well as social, emotional, and behavioural problems. These impacts on child and family wellbeing can persist through life and may lead to the intergenerational transmission of social inequality.792 While some have argued that there is clear evidence of the failure of public housing in Aboriginal communities, there is no alternative for residents because all land is communally owned.793,794 Hughes pointed out that, without the possibility of freehold ownership, banks will not lend money, so those who remain in Indigenous communities are restricted in their options for housing.
The report into the Northern Territory child protection system identified ongoing concerns with housing despite the implementation of the NTER. Significant investment in refurbishing existing homes (under the NTER) and building new homes (under the Northern Territory’s Strategic Indigenous Housing and Infrastructure Program) was intended to reduce ‘average occupancy from high to mid teens’ in some remote communities and from 18 to 9 occupants in one particular community.795 While this is a step forward, occupancy rates are still very high according to ABS standards.796
In 2008, Indigenous people Australia-wide were five times more likely (27.5%) to be living in overcrowded conditions than non-Indigenous Australians (5.7%). The levels of overcrowding among Indigenous people increased with remoteness (13.3% in major cities, compared to 58.2% in very remote areas). Overcrowding was highest in the Northern Territory, where 61.8 per cent of the Indigenous population living in overcrowded conditions, compared to 3.4 per cent of non-Indigenous Northern Territory residents.797 In another study, it was found that there were as many as five people per bedroom in one area.
790 H. Hughes, The economics of Indigenous deprivation and proposals for reform, Issues analysis, Centre for Independent Studies, St Leonards, NSW, 2005. 791 NTER Review Board, op. cit. 792 AIHW, Headline indicators for children’s health, development and wellbeing 2011, cat. no. PHE 144, AIHW, Melbourne, 2011. 793 H. Hughes, op. cit. 794 The ABS used the Canadian National Occupancy Standard (CNOS) to determine acceptable levels of occupancy in a household. According to the ABS website, this standard specifies that: (a) there should be no more than two persons per bedroom; (b) children less than 5 years of age of different sexes may reasonably share a bedroom; (c) children 5 years of age or older of opposite sexes should have separate bedrooms; (d) children less than 18 years of age and of the same sex may reasonably share a bedroom; and (e) single household members 18 years or over should have a separate bedroom, as should parents or couples. The Canadian overcrowding model has been used by the ABS since at least 1996 and will continue to be used for 2011 Census data output. There is no single standard measure for housing utilisation; however the ABS has used the CNOS model, which is considered by the National Housing Strategy and the AIHW to conform reasonably to social norms in Australia. The CNOS is widely used and applied by national statistical offices around the world, as it is considered to be sensitive to both household size and composition, which some other measures are not. However, the model may not always be able to account for some complex family circumstances and the diversity of cultural practices. 795 FaHCSIA, Closing the Gap in the Northern Territory Monitoring Report, July–December 2010, Part Two, op. cit. 796 M. Bamblett, H. Bath & R. Roseby, op. cit. 797 Steering Committee for the Review of Government Service Provision, op. cit.

Supporting families
284 Northern Territory Emergency Response: Evaluation Report 2011
Concerns about housing quality and overcrowding are widespread. In the 2011 CSWRS, respondents were asked in an open question about what they considered to be the most important things needed to make their community safer. Housing was one of the top three most common responses (24% of respondents).798 NTER community members have also identified poor and inadequate housing as a major contributor to child abuse and family violence.799
During community consultation for the report of the NTER Review Board in 2008, every community raised housing as an issue, saying that most homes were overcrowded and in poor repair. Many community members felt they were paying rent for homes that were unliveable, and that the money spent had not improved the standard of housing.800
Since December 2008, housing in remote areas has been managed under the National Partnership Agreement on Remote Indigenous Housing, which aims to reduce severe overcrowding, increase the supply of new houses, and maintain rental housing in remote Indigenous communities. It will be important to monitor progress in achieving those objectives. As outlined above, helping families obtain—or maintain—adequate housing is one of the roles of RAFCWs.
Additional details on leasing and housing are available in Chapter 10, ‘Housing and land reform’.
Education The impacts of poor educational outcomes are intergenerational. Families in which the mother has a low educational attainment are at higher risk of being disadvantaged, and the children are likely to have similarly poor educational outcomes.801 The NTER implemented a number of initiatives likely to impact on educational outcomes in prescribed areas. Those initiatives are addressed in detail in Chapter 8, ‘Enhancing education’; in this chapter, we focus on the possible impact of educational issues on family support.
Attendance rates at school are problematic for Aboriginal children. Teachers have commented that the school is used more like a drop-in centre, and report that frequently only 50 per cent of eligible children are in attendance.802 Indigenous children make up 43.3 per cent of the population of children aged 0 to 17 in the Northern Territory, but are under-represented in early childhood and care services, comprising less than 10 per cent of children who attend those services.803 In the CSSPS, poor school attendance was considered a big or very big problem by 67 per cent of respondents in towns and 71 per cent of respondents in NTER communities.804 Similarly, in the CSWRS survey, when asked if there was still a problem with children not attending school, 46.4 per cent of respondents said this was still a very big or big problem.805 In November 2010, just over half of enrolled students (56.5%) were attending school. However, attendance has been highly variable across reporting periods. For example, primary school attendance rates have ranged from 53.7 per cent (in August 2010) to 62.1 per cent (in November 2009). Understanding enrolment and attendance is complicated, and discussed in more depth in the Chapter 8, ‘Enhancing education’.
798 G. Shaw & P. d’Abbs, op. cit. 799 C. Holmes, L. Fasoli & P. Stephenson, op. cit. 800 NTER Review Board, op. cit. 801 M. Mansour & A.J. Martin, ‘Home, parents, and achievement motivation: A study of key home and parental factors that predict student motivation and engagement’, Australian Educational and Developmental Psychologist, vol. 26, no. 2, 2009, pp. 111–126. 802 M. Bamblett, H. Bath & R. Roseby, op. cit. 803 ibid. 804 J. Putt, S. Middleton, J. Yamaguchi & K. Turner, op. cit. 805 G. Shaw & P. d’Abbs, op. cit.

Supporting families
Northern Territory Emergency Response: Evaluation Report 2011 285
Chapter 8 shows NAPLAN results for students in schools in the NTER communities, compared to results for other Northern Territory schools and results for the rest of Australia. Markedly fewer children in NTER schools than in other Territory schools or the rest of Australia achieve the minimum levels in reading, writing or numeracy. However, children in Year 3 are showing improvement in literacy, and this may be due to some of the school readiness and early childhood programs initiated as part of the NTER.
Early childhood is a very important time in a child’s life, during which the framework for future health, learning and wellbeing is established, particularly in the areas of linguistic and social competence, coping skills, cognitive development and physical and mental health. In order to optimise outcomes, a safe, nurturing family environment is especially important.806
National data from the 2009 Australian Early Development Index (AEDI)807 show that Indigenous children are more likely to be developmentally vulnerable at school entry age than non-Indigenous children.808 AEDI data for the NTER communities have not been publicly reported and analysed. In existing AEDI reports, data are not segmented according to Indigenous status within each state/territory. However, overall, Northern Territory was the jurisdiction with the highest proportion of children ranked as developmentally ‘vulnerable’ and ‘at risk’.
Research has shown that early childhood programs can have a beneficial impact on readiness for school and successfully transitioning to full-time education, especially in disadvantaged children.809,810 Providing access to early childhood education services goes beyond simply providing the facility and staff for those services. For parents to choose to engage their children in the system, parental and community understanding of the benefits of the program, the cultural appropriateness of the program, the physical structure of the facility and the availability of funding and support for the program all contribute to access.811 However, if programs are not relevant and high quality, little will be achieved. The choice of which particular early childhood services are offered to support families should be based on each community’s needs. Examples of services that can be provided are child-focused playgroups or child care, and parent-focused assistance, including education and networking opportunities for relationship-building.812
As well as contributing to educational readiness and developmental outcomes for children, early childhood services also provide an opportunity for professionals working in those services to undertake a monitoring and support role—assisting parents who might look like they are struggling, and identifying early on those children who might be experiencing suboptimal or even abusive/neglectful family environments.
806 AIHW, National outcome measures for early childhood development: Development of an indicator based framework, cat. no. PHE 134, AIHW, Canberra, 2011. 807 The Australian Early Development Index (AEDI) is a measure of child development at school entry and relies on teacher assessment of physical health and wellbeing; social competence; emotional maturity; school-based language and cognitive skills; communication skills; and general knowledge. 808 Centre for Community Child Health and Telethon Institute for Child Health Research, A snapshot of early childhood development in Australia—AEDI National Report 2009, Australian Government, Canberra, 2009, p. 12. 809 ibid. 810 S. Wise, L. da Silva, E. Webster & A. Sanson, The efficacy of early childhood interventions, research report no. 14, AIFS, Melbourne, 2005. In their review of early childhood interventions, Wise et al. found that many had short- or medium-term effects, but did not have data on long-term effects. They highlighted the need for more data on the costs and benefits of early childhood interventions. However, they noted that ‘Studies that have followed children longitudinally have found that cognitive effects tend to diminish over time, but that the interventions have positive long-term effects on crime and delinquency’ (p. ix). 811 M. Kronemann, Universal preschool education for Aboriginal and Torres Strait Islander children, AEU briefing paper, Australian Education Union, Melbourne, 2007. 812 M. Sims, Early childhood and education services for Indigenous children prior to starting school, Closing the Gap Clearinghouse Resource Sheet, AIHW & AIFS, Canberra, 2011.

Supporting families
286 Northern Territory Emergency Response: Evaluation Report 2011
Adult education literacy and numeracy programs have also been implemented, and there have been 497 referrals to those programs. The NTER monitoring report noted that community members were initially reluctant to engage with the programs, but that increased participation rates demonstrated an improvement.813
Health and wellbeing There is a number of health and wellbeing factors that are associated with a greater risk of child abuse/neglect. They include lack of antenatal care, parental mental illness/depression, children with poor health due to illness or injury, children born with low birthweights, children with behavioural problems, families in which there is alcohol or substance abuse, mothers who have their first child at a young age (less than 25 years), and large families.814,815,816 These issues are particularly acute in the NTER communities, due to the younger age profile of Indigenous Australians, including the age that Indigenous mothers give birth.817 The effect of poor parental health on all aspects of family life cannot be underestimated; for example, poor health affects the ability to parent and maintain social connections (through being able to work and provide a stable income).
In 2009, there were 431 Indigenous deaths in the Northern Territory. There were more men (66.8%) than women in this group (similarly to non-Indigenous people, where 68% of the deaths were of males). Just over 6 per cent of deaths were due to external causes, and the median age of this group was considerably younger for Indigenous than non-Indigenous people (32.4 years and 53.2 years, respectively). Self-harm (suicide) and assault accounted for 4.4 per cent and 1.6 per cent, respectively, of all Indigenous deaths in the Northern Territory, compared to 3.7 per cent and 0.6 per cent for non-Indigenous people in the Territory. Between 2006 and 2009, Aboriginal children were more than three times more likely to die than their non-Aboriginal counterparts (139 in 100,000 compared to 39 in 100,000).818 Over the same time period, Aboriginal children comprised 43 per cent of the population of children in the Northern Territory, but 73 per cent of child deaths. Since 2006, stillbirths in the Aboriginal population have consistently been higher than in the non-Aboriginal Northern Territory population, as have been Aboriginal perinatal and neonatal deaths (there were twice as many neonatal deaths in the Aboriginal population compared to the non-Aboriginal population).819 The Office of the Children’s Commissioner identified that, of the 15 deaths in the Northern Territory from self-harm that occurred between 2006 and 2009, all were of Aboriginal children, all but one of whom died by hanging. This suggests that suicide rates for Indigenous young people in the Northern Territory are between 5 and 13 times higher than those in Queensland and New South Wales. While the report did not specifically detail numbers of Aboriginal children who died from external causes, that was the most common underlying cause of death in all Northern Territory children after the first year of life.820
813 FaHCSIA, Closing the Gap in the Northern Territory Monitoring Report, July–December 2010, Part Two, op. cit. 814 J. Goldman, M. Salus, D. Wolcott & K. Kennedy, ‘What factors contribute to child abuse and neglect?’, in Goldman, J and Salus, M (eds.), A coordinated response to child abuse and neglect: The foundation for practice, US Department of Health and Human Services Office on Child Abuse and Neglect, Washington DC, 2003. 815 L. Bromfield, A. Lamont, R. Parker & B. Horsfall, Issues for the safety and wellbeing of children in families with multiple and complex problems: The co-occurrence of domestic violence, parental substance misuse, and mental health problems, NCPC Issues no. 33, AIFS, Melbourne, 2010. 816 D. Bugental & K. Happaney, ‘Predicting infant maltreatment in low-income families: The interactive effects of maternal attributions and child status at birth’, Developmental Psychology, vol. 40, no. 2, 2004, pp. 234–243. 817 S.R. Silburn, G. Robinson, F. Arney, K. Johnstone & K. McGuinness, Early childhood development in the NT: Issues to be addressed, topical paper commissioned for the public consultations on the Northern Territory Early Childhood Plan, Northern Territory Government, Darwin, 2011. 818 Northern Territory Child Deaths Review and Prevention Committee, Annual report 2009–2010, Child Deaths Review and Prevention Committee, Office of the Children’s Commissioner, Darwin, 2010. 819 ibid. 820 ibid.

Supporting families
Northern Territory Emergency Response: Evaluation Report 2011 287
Poor nutritional status in Aboriginal children is also a problem, and some children meet the criteria for a diagnosis of malnutrition. To begin to address this problem, there is a need for education and community feedback on nutrition status.821
A key component of the NTER was the Child Health Check Initiative, under which 57 to 65 per cent of eligible children received health checks. The children who were the least likely to have had checks were those aged 14 to 15 or aged younger than 1 year. Children between 2 and 9 years of age were most likely to have had a check. A review of the Child Health Check Initiative conducted by Allen and Clarke Regulatory Specialists revealed that in some NTER communities where there was no resident doctor or the resident doctor declined to participate in the health checks, interstate doctors and nurses conducted the checks. Many of the NTER doctors and nurses had little experience in Indigenous or child health and received only a two-day orientation. The checks were often conducted with little understanding of the complexity of caring for children with chronic health conditions, particularly where there is a lack of health services, and cultural issues and the remoteness of the communities need to be considered. There was also little understanding of the patient’s history in terms of family and living circumstances.822
In its 2008 submission to the NTER Review Board, the Aboriginal Medical Services Alliance of the Northern Territory found that the child health checks, which were initiated as an ‘emergency response to child sexual abuse’, were deemed inappropriate, unworkable and themselves constituted abuse if conducted. Medical identification of child sexual abuse is a highly specialised field and, even with specialist consultation, often yields inconclusive findings.823 As a result, the sexual abuse screening component of the child health checks was abandoned in the very early stages of the NTER.
In their review of the Child Health Check Initiative, Allen and Clarke noted that the lack of community consultation and the focus on sexual abuse in the early program implementation may explain why not all children received a health check. The report identified common reasons for failure to have a child health check as absence from the community, parents feeling ashamed or frightened, and older children choosing to not undergo a check.824
Chapter 6, ‘Improving child and family health’, notes that the implementation of child health checks was not ideal; however, the focus has been on provision of follow-up services and sustainable health service delivery.
Among those children who received health checks, untreated dental caries, recurrent chest infections, skin problems and ear diseases were the four most common conditions identified. Almost 70 per cent of those children received a referral for follow-up services.825
According to the Allen and Clarke report, a number of issues contributed to an inability to accurately understand whether or not all children who required additional care received that care. Those issues included the capacity to process referrals at the community and system level, inadequate planning for data capture in terms of timing and systems, and lack of consent by guardians to share information with the AIHW. Although there was relatively high success with primary health care follow-ups (81% of those with a referral were seen at least once), many of those children requiring specialist services had not received follow-up services
821 M. Bamblett, H. Bath & R. Roseby, op. cit. 822 D. Matheson & N. Hardie-boys, Evaluation of the Child Health Check Initiative and the Expanding Health Service Delivery Initiative: Final report, Allen and Clarke for DoHA, Canberra, 2011. 823 Aboriginal Medical Services Alliance of the Northern Territory, Submission to the NTER Review Board, submission no. 190. Available at: <http://www.nterreview.gov.au/subs/nter_review_report/190_aboriginal_medical_services/190_Aboriginal_Medical_Services.htm>. 824 D. Matheson & N. Hardie-boys, op. cit. 825 NTER Review Board, op. cit.

Supporting families
288 Northern Territory Emergency Response: Evaluation Report 2011
by mid-2010. Nearly 40 per cent of those children referred for dental services, 34 per cent of those referred to ear, nose and throat specialists, and 45 per cent of those referred for tympanometry and audiometry services had not received the specialist service by June 2010. The Allen and Clarke report highlighted the bottlenecks that exist in the primary case – referred service interface and provided recommendations on how to address this problem.826
Much of the NTER Review has focused on existing chronic conditions in children. No report has considered the role of injury, despite injury being a leading cause of death in Northern Territory children, particularly Indigenous children.827 While the majority of childhood injuries have been deemed to be unintentional, the clinical determination of whether an injury has been inflicted or not is extremely difficult, and there is a grey area in which the lack of supervision becomes neglect. Therefore, ignoring the effects of injury in these children is a gap in our understanding of their wellbeing.
Data on the numbers of Northern Territory children who were hospitalised for injury-related diagnoses, child abuse and assault could not be provided for publication in this review, due to the small numbers in each category. Further information on child health checks and the health of Northern Territory Indigenous families can be found in Chapter 6, ‘Improving child and family health’.
Conclusions There are legitimate concerns about the safety and wellbeing of children and families in Northern Territory Indigenous communities; however, it is important to note that without a nationally representative prevalence study of family dysfunction or child abuse and neglect in Australia, we do not have good data for comparisons between jurisdictions, or adequate historical data (from prior to the implementation of the NTER) to see whether levels of child abuse/neglect are changing. We have to rely on proxy measures, either of factors known to increase the risk of child abuse (such as parental mental illness, parental substance abuse or family violence), or systems measures (such as notifications, referrals or specific treatment services efficacy data). Therefore, any evaluation of the NTER should be considered in the context of the risks faced by all children, regardless of jurisdiction or Aboriginality, across Australia.
Internationally, it is understood that child abuse and neglect (particularly child sexual abuse) is under-reported, but that it is a common occurrence across all family forms and socioeconomic strata (although poverty and disadvantage are generally associated with higher risks of harm, particularly from neglect).828 There is also a tendency to support those measures that are ‘curative, rather than preventative in nature, addressing symptoms rather than the underlying systems that have failed to protect children’.829
Before the complex problems of safety, child protection and sustainable change can be solved, researchers widely acknowledge that fundamental needs such as poverty and secure access to food and shelter must first be addressed.830 Canadian research into the over-representation of First Nations children in child protection data found that once poverty, substance abuse and poor housing were accounted for there was little difference between First Nations populations and others in terms of child abuse/neglect.831 Furthermore, culturally
826 D. Matheson & N. Hardie-boys, op. cit. 827 Northern Territory Child Deaths Review and Prevention Committee, op. cit. 828 D.J. Higgins, Child safety and wellbeing in the NT, op. cit. 829 K. Landgren, op. cit., p. 214. 830 J. Scougall, op. cit. 831 N. Trocmé, D. Knoke & C. Blackstock, op. cit.

Supporting families
Northern Territory Emergency Response: Evaluation Report 2011 289
based interventions that target risk factors that utilise both Western and traditional know-how have the most likely chance of succeeding in achieving long-term sustainable change in the over-representation of Indigenous children in child abuse and neglect data.832
Community perceptions There is a variety of views and anecdotal evidence about the NTER, and whether it has been a success. For example, remote service providers provided the following perspectives:
‘Unless service providers work together toward a common goal and understand how best to fit in with each other we will make little difference.’
‘You can have all the programs etc in the world but you need community participation, belief and action. It doesn’t happen in [this remote community] as I believe the community has the wrong attitude’833
However, such views are not restricted to NTER communities and the Northern Territory intervention. There are similar concerns about the effectiveness of service provision and community action in townships in the Northern Territory outside the NTER. A respondent to a survey about safety in their town said, ‘After all is said and done, there is more said than done.’834
In contrast, anecdotal evidence from many NTER community representatives (particularly elders and women) indicates that many report feeling safer and are glad that action is being taken to address their concerns.835
In the Evaluation of the Family Support Package: A community perspective report, the authors also noted that community perceptions about levels of family violence and child abuse had improved over recent years. The presence of a Women’s Safe House in the community was understood to play an important role in preventing violence:
Its presence in the community was symbolic of a growing culture that regarded domestic violence as unacceptable to women and also as a reminder that women had options available to them to escape violence.836
The CSWRS found that almost half (47.4%) of respondents considered their community to be on the way up, and only 7.6 per cent felt that the situation was worsening. The study identified a decreasing gradient of feelings of safety with increasing community size. There was a significant difference between men and women in regard to their perceptions of improvements over the duration of the NTER: women were less likely to note changes, and men were more likely to identify positive community changes. Among those who were least able to identify positive changes in their community, ‘family fighting, disappointment with the Intervention and lack of employment’ were cited as reasons why the community had not changed.837
A number of experts have described how long-term sustainable change in family support and child safety is about more than intervening at a tertiary level. Effective community change requires behavioural and attitudinal change, rebuilding confidence and self-belief, addressing
832 C. Blackstock, ‘After the apology: Why are so many First Nations children still in foster care? A summary of research on ethnic over-representation and structural bias’, Children Australia, vol. 34, no. 1, 2009, pp. 22–27. 833 J. Putt, S. Middleton, J. Yamaguchi & K. Turner, op. cit. 834 ibid. 835 Australian Indigenous Doctors’ Association (AIDA), Submission to the Northern Territory Emergency Response Review Board, submission no. 187, Available at: <http://www.aida.org.au/pdf/submissions/Submission_8.pdf>. 836 C. Holmes, L. Fasoli & P. Stephenson, op. cit, p. 34. 837 G. Shaw & P. d’Abbs, op. cit, p. 33.

Supporting families
290 Northern Territory Emergency Response: Evaluation Report 2011
past trauma, and allowing decision-making to occur at a family level.838,839,840 Walker argued that:
mainstream support services that fail to recognise the nuances of the Aboriginal circumstance may not deliver significant enhancements in the overall wellbeing of Aboriginal families.841
Outcome data One of the major problems in evaluating the Supporting Families measures of the NTER is the apparent paucity of quality data at the community level—particularly data relating to child and family wellbeing outcomes. There is a lack of data to compare the current situation in NTER communities with the circumstances in those communities prior to the program initiation.842,843
To enable comparisons between NTER communities and other areas within the Northern Territory, aggregate data are needed for the 73 NTER communities. This is particularly the case for statutory child protection data, but is also true for a number of other administrative data collections that could provide insights into whether there are any changes to the underlying risk factors that are being targeted through the NTER (as outlined in Table 7.3). This could include data on health (for example, child morbidity), housing (levels of overcrowding), and poverty. As well as these social infrastructure issues, the role of parents’ characteristics and skills in supporting and protecting children would suggest that opportunities to conduct research to assess changes in mental illness, substance misuse, and parenting skills would also be important to demonstrate the effects of community-wide interventions to support children and families. Even where data are collected at the community level, it is often not available for public release, because the small numbers involved might lead to the identification of individuals. The ideal situation would be to have a population-based measure of the real incidence of child abuse and neglect (rather than relying on data about those cases that come to the attention of authorities). However, this is a luxury that does not exist in other states/territories in Australia. Large-scale retrospective data collection from adults or young people is costly, and does have its own limitations.
Without the development of clear and measurable indicators and the consistent and reliable collection of data to measure those indicators, a comprehensive evaluation of the efficacy of the NTER in relation to supporting families and protecting children is not possible.
Another limitation of much of the data is that often the eligible population for a particular service (the ‘denominator’) is not calculated. This is particularly so when considering the mobility of people within NTER communities. In order to understand the reach of a service (or to accurately survey and assess its impacts), it is important to know the number of parents of young children eligible for parenting support services, or the number of youths eligible for participation in a criminal justice diversion program, or the number of homes identified as requiring repairs.
Each of the other chapters in this report reviews a component of the NTER, and in many ways all of those components play a role in ‘supporting families’:
838 R. Walker & C. Shepherd, op. cit. 839 J. Scougall, op. cit. 840 D.J. Higgins & I. Katz, op. cit. 841 R. Walker & C. Shepherd, op. cit. 842 NTER Review Board, op. cit., p. 15. 843 However, it is important to consider not just changes over time. As with any intervention, the best comparison would be to have other, similar communities act as a ‘control’ group to enable an understanding of whether or not the intervention itself is responsible for the changes, or whether something more generic has occurred to cause changes across both intervention and comparison communities.

Supporting families
Northern Territory Emergency Response: Evaluation Report 2011 291
• In Chapter 9, ‘Welfare reform and employment’, the spending shift to priority needs as a result of income management and higher proportions of people in employment may suggest an improvement in the ability of some families to provide healthier and better food for their children.
• Chapter 6, ‘Improving child and family health’, supports that proposition by showing fewer numbers of children with wasting, stunted growth and failure to thrive. In addition, improved access to health services and specialist medical attention for existing health concerns is likely to improve the health of families.
• Chapter 8, ‘Enhancing education’, shows that there have been a substantial increase in resourcing for education needs in NTER communities, some improvement in enrolments and some improvement in NAPLAN test results for literacy and numeracy, which are likely to indicate improved educational outcomes in Indigenous children in those communities.
• Chapter 5, ‘Promoting law and order’, indicates strong support for the increased police presence in communities. Substantial numbers of community members say they now feel safer in their community.
• Chapter 10, ‘Housing and land reform’, describes positive outcomes from community clean-ups and from a number of repairs and upgrades to housing and infrastructure in NTER communities, although data on completed projects and outcomes are not available for all projects so evidence on improvements is inferred or anecdotal.
• In Chapter 4, ‘Coordination and engagement’, there are positive signs that NTER initiatives to improve the coordination of services and engagement activities are contributing to improved service delivery and relationships with communities.
Although it may be hard to produce definitive data to examine whether the NTER measures designed to support families and prevent and respond to child abuse and neglect have been successful in reducing the occurrence of child abuse/neglect, evidence suggests that they have increased awareness of the problem of child safety within Indigenous communities and provided additional resources to deal with increased reporting and investigation. These are essential components of the statutory system for identifying and responding to child safety concerns. Data on long-term changes to family characteristics and social factors known to be associated with higher rates of child abuse/neglect in the NTER communities are not available to demonstrate whether these measures have had the intended effects.
Surveys have also shown important positive changes in perceptions of community safety in NTER communities. In terms of supporting families, the limited qualitative and quantitative data available directly for NTER communities suggest that, at the least, the NTER has not made the situation worse for families and children—and many indicators are pointing in the right direction.

Enhancing education
292 Northern Territory Emergency Response: Evaluation Report 2011
8 Enhancing education
Australian Council for Educational Research844
We are utterly convinced that education (that properly addresses the needs of the local community) provides the path to success. We have been dismayed at the miserable school attendance rates for Aboriginal children and the apparent complacency here (and elsewhere in Australia) with that situation.
P. Anderson and R. Wild, Ampe Akelyernemane Meke Mekarle: ‘Little children are sacred’, Report of the Northern Territory Board of Inquiry
into the Protection of Aboriginal Children from Sexual Abuse, Northern Territory Government, Darwin, 2007, p. 18
Key findings • There is some evidence of improvement in literacy and numeracy already occurring
among Year 3 students in the NTER schools. That improvement is greater than the improvement among Year 3 students in all Northern Territory schools and all Australian schools. Over the three years of National Assessment Program—Literacy and Numeracy (NAPLAN) testing in Australia, the mean scale score for Year 3 Reading in the Northern Territory Emergency Response (NTER) schools has improved, as has the overall percentage of students who are at or above the national minimum standard. While there is no definitive evidence of improvement in Numeracy or Writing, it is probable that results in Year 3 Numeracy also indicate improvement. And while there has been improvement in Reading at other year levels as well, it is not as pronounced as at Year 3.
• There has been no observable improvement in school attendance between 2006, before the NTER was introduced, and 2010, the last full year for which data are available. There appears to have been a decline in attendance rates in 2010 after improvements for 2008 and 2009; data for 2011 are required to determine if that decline may be considered a ‘true’ decline or if it is related to other conditions.
• The NTER and other Australian Government and Northern Territory Government programs have contributed to a substantial increase in resources allocated to schools serving the NTER communities. There have been increases in infrastructure, such as new classrooms and other facilities, as well as teacher housing; in teacher professional support; in preschool programs; and in support for student wellbeing and nutrition. What is not clear, however, is whether these increases can be attributed to the NTER alone or how much can be attributed to the NTER.
• At this time, it is too early to determine the effects of efforts to improve the quality of teaching on student outcomes, as there has been little opportunity as yet for new teachers to enter the NTER schools, for the effects of professional development to flow through to the classroom or for new teacher housing to influence teacher turnover or the quality of teaching.
844 Sheldon Rothman, David Slattery, Sarah Buckley and John Ainley.

Enhancing education
Northern Territory Emergency Response: Evaluation Report 2011 293
Introduction The ‘Little children are sacred’ report concluded that improving the quality of education provided the key to solving, or at least ameliorating, the incidence of child sexual abuse in Aboriginal communities. The report identified poor educational outcomes as being at the heart of the exclusion of Aboriginal people from confidently participating in either their own culture or mainstream culture.845 A number of specific issues were highlighted as being at the roots of a crisis in educational attainment in Aboriginal communities. They included inadequate access for Aboriginal children to early learning centres, in preparation for later years of schooling, a failure amongst the predominantly non-Aboriginal teaching workforce to communicate effectively with Aboriginal students (many of whom speak English only as a second or third language), and a failure of parents to take responsibility for sending their children to school. The NTER Review Board reported in 2008 that only around 27 per cent of children in remote communities attended school regularly, and only around 20 per cent of students achieved the national minimum standard in literacy and numeracy.846
It was estimated in 2008 that as many as 2,000 or 13 per cent of all school-aged Indigenous children in the Northern Territory (aged 5 to 14 years) are not enrolled in school at all.847
To ensure that Indigenous children in the Northern Territory received appropriate support to improve levels of educational achievement, the Australian Government introduced a range of education-related measures through the NTER. Five sub-measures address these concerns: four under the Enhancing Education measure and one under the Supporting Families measure.
Two years after the release of the ‘Little children are sacred’ report and after the introduction of the NTER, data were collected on the health and development of all Australian children. Data from the Australian Early Development Index (AEDI) provide recent support for concerns that many children entering school in the Northern Territory are at a distinct disadvantage when compared to other children across Australia.
This chapter examines data on the education-related measures, and is structured as follows:
• The first section describes the context in the NTER communities by examining data from the AEDI, which is a population measure of how young children are developing in Australian communities.
• The second section outlines the approach to the evaluation, including its scope and methodology, and methodological limitations.
• The third section describes progress that has been made in improving the quality of education services through the NTER sub-measures and other related programs and
845 P. Anderson & R. Wild, Ampe Akelyernemane Meke Mekarle: ‘Little children are sacred’, Report of the Northern Territory Board of Inquiry into the Protection of Aboriginal Children from Sexual Abuse, Northern Territory Government, Darwin, 2007, p. 148. 846 NTER Review Board, Northern Territory Emergency Response: Report of the NTER Review Board, NTER Review Board, Canberra, 2008, p.30. Information on students achieving national minimum standards was based on results of the Northern Territory’s assessment program. Beginning in 2008, national minimum standards for literacy and numeracy have been based on the National Assessment Program—Literacy and Numeracy (NAPLAN). 847 H. Bath, ‘Intervening in the Northern Territory’, invited opinion piece for Developing Practice (in press). The figure is also cited in FaHCSIA, Northern Territory Emergency Response: One Year On, Canberra, 2008, p. 23, although that figure is in relation to only the NTER communities. It is difficult to determine accurately the number of children who are not enrolled in school because of uncertainty about the population of Indigenous school-aged children in the Northern Territory. The quoted figures are based on an estimate by the Australian Bureau of Statistics of the number of school-aged (aged 5 to 14 years) children in the Northern Territory and administrative data on enrolments for the same cohort. The estimate should be viewed with caution, as the relative standard error associated with the estimate of the population of school-aged children is large, resulting in a confidence interval that may be as much as 2,000, suggesting that the ‘true’ number of non-enrolled children was between 1,000 and 3,000.

Enhancing education
294 Northern Territory Emergency Response: Evaluation Report 2011
their likely contribution to improved educational outcomes for children in the NTER communities.
• The final section assesses evidence of any improvements in educational outcomes.
Context The AEDI is a population measure of how Australian children are developing across five domains, using data on children collected during their first year of school. The first national data collection was conducted in 2009, with data collected for 93.5 per cent of eligible children in the Northern Territory. Analysis of the data by the Menzies School of Health Research and the Northern Territory Department of Education and Training (NT DET) showed that a greater percentage of Northern Territory children—compared to all Australian children—were considered ‘developmentally vulnerable’: they were considered to be more likely to experience some difficulty in making the transition to school. Indigenous children in the Northern Territory were reported to have ‘much higher rates of [developmental] vulnerability when compared to either non-Indigenous children in the NT or Indigenous children nationally’.848
In the language and cognitive skills domain, 60 per cent of Northern Territory children had scores that were ‘on track’, compared to 77 per cent of the wider population of Australian children. This pattern of lower representation in the ‘on track’ group for Northern Territory children was replicated across the other four domains of the AEDI. Children in the Northern Territory were also over-represented in the ‘developmentally vulnerable’ category of scores: almost 23 per cent of Northern Territory children were in this category in the language and cognitive skills domain, compared to 9 per cent of all Australian children.
In 2010, a follow-up data collection occurred in some areas to enable more results to be publicly available. These data were then added to the earlier, larger collection and the larger data file was used to report results for children in the communities. The data protocol for the AEDI does not allow for the reporting of data for children in extremely small communities. Data for those communities are grouped with data for other small communities that are geographically close and socioeconomically similar. This may result in some NTER communities being omitted from this group and some non-NTER communities being included. The figures reported here are averages across all of the communities and do not necessarily reflect the situation in any individual community. Nevertheless, when compared to the averages for all children in the Northern Territory, the differences are stark.
Within the NTER communities, where 95 per cent of children were identified as being of Aboriginal or Torres Strait Islander descent, rates of developmental vulnerability were even higher than for all children in the Northern Territory. Table 8.1 shows the percentage of children in the ‘vulnerable’ category of scores for each of the five AEDI domains, based on the original 2009 release of the AEDI. The second column displays those results for children from NTER communities, based on the 2010 data release.
848 S. Silburn, J. McKenzie & B. Moss. Northern Territory Results for the Australian Early Development Index 2009, Menzies School of Health Research & Northern Territory Department of Education and Training, Darwin, 2010, p. vii.

Enhancing education
Northern Territory Emergency Response: Evaluation Report 2011 295
Table 8.1 Percentage of children identified as ‘vulnerable’ on the AEDI in the Northern Territory and in the prescribed communities, 2009 and 2010
Domain
Percentage of ‘developmentally
vulnerable’ children in the Northern Territory
(2009)
Percentage of ‘developmentally
vulnerable’ children in the prescribed
communities (2010)
Number of children assessed in the
prescribed communities
(2010) Physical health and wellbeing • Physical readiness for school • Physical independence • Gross and fine motor skills
19 36 495
Social competence • Overall social competence • Responsibility and respect • Approaches to learning • Readiness to explore new things
18 37 493
Emotional maturity • Pro-social and helping behaviour • Anxious and fearful behaviour • Aggressive behaviour • Hyperactivity and inattention
16 30 471
Language and cognitive skills (school-based) • Basic literacy • Interest in literacy/numeracy and memory • Advanced literacy • Basic numeracy
23 62 495
Communication and general knowledge (there are no sub-domains under this domain)
18 47 495
One or more domains 38 79 491 Two or more domains 23 59 491 Note: All percentages are rounded to the nearest whole number. Data for the prescribed communities may include children from non-
prescribed communities (see text). Source: Figures for all Northern Territory children from S Silburn, J McKenzie & B Moss (2010); figures for children in prescribed
communities from AEDI data for the Northern Territory (URF, version 5, March 2011 release).
In all domains, the percentage of children with ‘vulnerable’ scores was higher in NTER communities than for the larger population of Northern Territory children. In particular, results for the language and cognitive skills domain showed that a much larger proportion of children in NTER communities were identified as developmentally vulnerable. Across the Northern Territory, more than one in five children (23%) were rated ‘developmentally vulnerable’ on two or more of the five AEDI domains, compared to 12 per cent of children of the same age across Australia849; in the prescribed communities, 59 per cent of children were rated ‘developmentally vulnerable’ on two or more domains.
Scope and methodology
Enhancing Education under the Northern Territory Emergency Response Since the NTER commenced in 2007, the scope and focus of education-related activities and funding arrangements have evolved. In 2009, NTER education sub-measures were incorporated into the Closing the Gap in the Northern Territory National Partnership
849 ibid., p. 8.
Enhancing education
296 Northern Territory Emergency Response: Evaluation Report 2011
Agreement, and the administration of some components was subsumed under the Smarter Schools National Partnership Agreements. Schools and early childhood centres serving the prescribed areas are also directly and indirectly supported by funding from intergovernmental agreements signed after the NTER commenced, including agreements to establish the Building the Education Revolution (BER) program, and the Closing the Gap: Indigenous Early Childhood Development agreement.850 The main areas of focus on strengthening education services under the original NTER agreement were:
• Improving school infrastructure, including the provision of additional classrooms under the NTER, as well as significant infrastructure developments funded through the BER program
• Enhancing literacy, by providing specialist teams to improve literacy and numeracy teaching practices851
• Improving the quality of teaching, by assisting schools to attract and retain good teachers and education staff and providing professional development for those already working in remote schools
• School nutrition program, which provides breakfast and lunch in schools in order to improve student attendance and engagement
• Improving children’s services and family support, by providing additional early childhood education and care services and new and upgraded crèches and childcare facilities.852
Figure 8.1 shows the program logic for improving educational attainment under the NTER, as developed for the Department of Families, Housing, Community Services and Indigenous Affairs (FaHCSIA).853 The program logic assumed that providing more teachers, additional teacher housing and infrastructure, and professional development for teachers would improve the quality of the teacher workforce. It was assumed that the provision of more classrooms would assist in creating a more positive school environment for students. It was also expected that children’s engagement with school would be improved by providing them with meals through the School Nutrition Program and by reducing absenteeism through community patrols. Actions under the school readiness measure (not included in the Enhancing Education logic)—specifically the provision of additional childcare services and upgraded facilities—were expected to help early learners prepare for their later years of schooling.
In combination with other NTER measures and other Northern Territory and Australian Government programs, it was expected that these measures would create, in the medium-term, a more positive and appropriate school environment for children living in the prescribed areas. In the long term, it was expected that they would result in improved student engagement with school, stronger community support for schools and improved educational attainment by children from prescribed areas, as measured by NAPLAN.
850 Ministerial Council for Federal Financial Relations, ‘National Partnerships—Education’, Available at: <http://www.federalfinancialrelations.gov.au/content/national_partnership_agreements/education.aspx>. 851 The Enhancing Literacy sub-measure was called ‘Accelerating Literacy’ in the original NTER. 852 This was introduced as a sub-measure under the ‘Supporting Families’ measure of the NTER. 853 ARTD Consultants & WestwoodSpice, Development of program logic options for the NTER, unpublished report prepared for FaHCSIA, 2010.

Northern Territory Emergency Response: Evaluation Report 2011 297
Enha
ncing
educ
ation
Figu
re 8
.1
NTE
R p
rogr
am lo
gic:
Impr
ovin
g ed
ucat
iona
l atta
inm
ent
Sour
ce:
ARTD
Con
sulta
nts &
Wes
twoo
dSpic
e, De
velop
men
t of p
rogr
am lo
gic o
ption
s for
the
NTER
, unp
ublis
hed r
epor
t pre
pare
d for
FaH
CSIA
, 201
0.
More
tea
cher
s
Scho
ol ha
s suff
icien
t &
appr
opria
te cla
ssro
oms
More
teac
her
hous
ing &
inf
rastr
uctur
e
Scho
ol pr
ovide
s mor
e pos
itive &
appr
opria
te en
viron
ment
•
stude
nts ha
ve po
sitive
expe
rienc
es, r
emain
enga
ged,
atten
d re
gular
ly •
suffic
ient s
killed
teac
hers
• mo
re te
ache
rs re
taine
d •
care
rs an
d com
munit
y are
satis
fied w
ith sc
hool
envir
onme
nt
Imm
ediat
e ou
tcom
es
Inte
rmed
iate
outco
mes
Teac
her w
orkfo
rce im
prov
ed
• po
sition
s fille
d •
teach
ers s
atisfi
ed w
ith ho
using
and
cond
itions
•
impr
oved
teac
her s
kills,
know
ledge
Child
ren p
erfor
m be
tter a
t sch
ool
• im
prov
ed lit
erac
y and
nume
racy
(NAP
LAN)
•
fully
enga
ged i
n sch
oolin
g •
stron
g com
munit
y sup
port
for sc
hool
Child
ren h
elped
to en
gage
wi
th sc
hool
•
adeq
uatel
y fed
•
taken
to sc
hool
More
cla
ssro
oms
Long
term
ou
tcom
es
Profe
ssion
al de
velop
ment
prog
ram
teach
ers
Scho
ol Nu
trition
Pr
ogra
m
Scho
ol re
adin
ess
(pro
gram
logic
4)
Com
mun
ity sa
fety
(p
rogr
am lo
gic 3)
He
alth
& nu
tritio
n (p
rogr
am lo
gic 5)
Ot
her i
nflu
ence
s NT
G cu
rricu
lum &
sc
hool
reso
urcin
g Ot
her A
G pr
ogra
ms fo
r sc
hools
Co
mmun
ity at
titude
s to
scho
oling
Te
ache
r wor
kforce
su
pply
NTER
/NPA
se
rvice
s &
reso
urce
s
Nigh
t patr
ols,
comm
unity
pa
trols

Enhancing education
298 Northern Territory Emergency Response: Evaluation Report 2011
Methodology
Assessment of NTER sub‐measures and other related programs
This assessment of the NTER education sub-measures was based on a desktop analysis of existing NTER evaluation documents, baseline and monitoring reports, survey material, administrative data and other related material. Within the scope of services and time allocated for the evaluation, fieldwork could not be undertaken. Consultation was limited to Australian Government departments, NT DET and the NTER evaluation advisory group, which provided feedback on drafts of the chapter.
Within those constraints, it was not possible to verify independently the quality of the NTER sub-measures or to explore administrative issues in detail. Where credible sources of evidence about the quality of measures, their acceptance within local communities and their impacts were available, that evidence is summarised in the chapter. Where evidence was lacking, that was noted and evidence was sought in the outside literature about the likely impact of NTER education sub-measures based on credible studies of similar programs elsewhere.
The primary focus of the evaluation was on the education sub-measures implemented under the NTER and was restricted to those sub-measures, even though new measures have been negotiated between the Northern Territory and Australian governments. However, consistent with the whole-of-government approach to the NTER evaluation, we have also attempted to give a broad account of the government policies and programs that have affected the provision of education services in the NTER communities.854 This approach recognises that efforts to improve educational outcomes in the NTER communities should be considered in the context of the historical, cultural and economic factors that have contributed to social and economic disadvantage and poverty in remote Indigenous communities in Australia, and that they are only some of the many influences on the levels of educational attainment in the NTER communities. Other direct influences are Northern Territory Government policies and curriculums, as well as policies and resources of the Australian Government, which often overlap, making it impossible to attribute outcomes to any single program. Indirectly, efforts to improve educational attainment are also affected by issues such as the safety and cohesion of communities, the adequacy of housing and community infrastructure, and levels of economic engagement855, which (among other things) are addressed by other NTER and government measures, and are discussed elsewhere in this report.
Assessment of educational achievement and engagement
The assessment of educational attainment in the NTER communities was based on three years of data collected through NAPLAN, which was introduced in all Australian schools in 2008. Tests are conducted in May each year for all students across Australia in Years 3, 5, 7 and 9. All students in the same year level are assessed on the same test items in the
854 For example, the terms of reference for the whole-of-government evaluation note that ‘[m]any government policy evaluations are program centred, that is, the measures and sub-measures are evaluated separately. For whole-of-government evaluations the intended target population is at the centre of the evaluation. In this “person centred” approach, the individuals affected by the NTER are at the centre of the policy issues, rather than addressed only as users of services within separate areas of program delivery’. 855 These are some of the many facets of community or neighbourhood social capital. For their relationship with education and the outcomes of schooling, see, for example, L. Tennent, C. Tayler & A. Farrell, ‘Social capital and sense of community: What do they mean for young children’s success at school?’, paper presented at the annual conference of the Australian Association for Research in Education, Sydney, 2005; S. Fullarton, Student engagement with school: Individual and school-level influences, LSAY Research Report no. 27, Australian Council for Educational Research, Victoria, 2002; D. Halpern, Social capital, Polity Press, Cambridge, 2005; Productivity Commission, Social capital: Reviewing the concept and its policy implications, AusInfo, Canberra, 2003.

Enhancing education
Northern Territory Emergency Response: Evaluation Report 2011 299
separate assessment domains of Reading, Writing, Spelling, Grammar and Punctuation, and Numeracy.856 Each year, over 1 million students sit the NAPLAN tests nationally.
NAPLAN results are reported using five national achievement scales, one for each of the five assessment domains. Each scale was established in 2008 with a mean of 500 and a standard deviation of 100. Scale scores maintain their meaning across year levels and time, but not across domains. Each full scale, which covers Year 3 to Year 9, consists of 10 achievement bands; six of the bands are used for reporting student achievement in each tested year level (for example, Bands 1–6 for Year 3 and Bands 5–10 for Year 9). Students who are in the lowest achievement band for the year level are considered to have performed below the national minimum standard for that year level. In this chapter, NAPLAN results for the domains of Reading, Numeracy and Writing only are reported as mean scale scores and as the percentage of students who achieved at or above the national minimum standard (identified in the tables as ‘Per cent AANMS’).
Statistical significance is not reported for the NAPLAN results, as it was not possible to calculate standard errors using the data provided. With the small numbers of students in many schools (and no students in some schools in some years), most tests of statistical significance would not reject the null hypothesis that there is no difference between means. The reported results should be treated cautiously, as trends may not be evident with data for only three years and low participation rates.
Participation can influence group results in NAPLAN, as students who are absent on the day of the test, including those intentionally withdrawn by their parents from testing, are not included in the calculations of scores and are not assigned achievement levels. Students with severe or complex disabilities or students from a non-English speaking background who have been learning English in Australia for less than one year are eligible for exemption from NAPLAN testing. However, this is not automatic and parents may choose for their child to participate. Exempted students are not included when calculating the mean scale score for a school, but are deemed not to have met the national minimum standard for their year level.857 Participation rates are based on the number of students who were assessed and the number of exempt students, as a percentage of the population of the schools (including absent and withdrawn students) for each year level. Participation rates are also reported in this chapter for NTER schools.
We recognise that NAPLAN is but one instrument that could be used to assess student achievement and that it may not be the most appropriate for use in schools serving the NTER communities. Tests are set in English only and are administered in the literacy and numeracy domains in Years 3, 5, 7 and 9 only. With NT DET focusing many of its efforts on teacher quality under the NTER and Closing the Gap agreements, student outcomes attributable to the NTER may not be readily observed in the first two years of NAPLAN results. Nevertheless, NAPLAN offers student performance data that can be compared with student performance data for children in all of the Northern Territory and all of Australia. In addition, NAPLAN results constitute the basis for determining reward payments under the National Partnership Agreement on Literacy and Numeracy.858
School engagement in the NTER communities was assessed using enrolment and attendance data collected by NT DET.
856 To avoid confusion in the reporting of NAPLAN results, we refer to two domains of Spelling and Grammar and Punctuation. The two domains are assessed together as Language Conventions, but are reported individually. They are not reported in this chapter. 857 ACARA/NAPLAN website, ‘Glossary page’, Available at: <http://www.nap.edu.au/Information/Glossary/index.html>. 858 For information on the achievement of performance targets and reward payments under the agreement, see COAG Reform Council, National Partnership Agreement on Literacy and Numeracy: Performance report for 2010, COAG, Sydney, 2011.

Enhancing education
300 Northern Territory Emergency Response: Evaluation Report 2011
Progress and challenges
Improving the quality of teaching Empirical studies on the performance of education systems have consistently identified strong links between levels of educational attainment and the quality of teaching.859 As such, improving educational outcomes for Indigenous students in very remote communities in the Northern Territory, including those in the prescribed areas, will depend in large part on having competent teachers to teach them. While teacher competency is difficult to quantify, teaching in regional and remote Indigenous communities requires skills in addition to those needed in most teaching contexts, including cross-cultural communication, an understanding of pedagogical approaches that suit Indigenous students, and the ability to teach English as a second language.860 According to the Commonwealth Grants Commission, English is a second, third or fourth language for about 70 per cent of Indigenous students.861 This, combined with systemic attendance problems and cultural differences, makes teaching in remote community schools very challenging, particularly for less experienced teachers.
The challenge associated with attracting and retaining quality teachers to work in very remote communities—in all states and territories of Australia—is widely recognised.862 The lack of services in remote communities means that it is difficult to fill positions in remote schools on a long-term basis and for all students to receive appropriate support, be they English as a second language learners or senior students attempting specialist subjects. Teaching positions in these schools are often filled by recent graduates or junior teachers who, being inexperienced, are often unprepared for the challenges of remote placements, including working with Indigenous students.863 More senior teachers tend to have families and find that the lack of a local secondary school is a barrier to taking up a teaching position in remote schools. These problems are compounded by a lack of quality affordable housing in remote communities.864 Together, they lead to high teacher turnover, which was highlighted by the NTER Review Board in 2008 when it observed that ‘The high turnover of teaching staff is clearly a critical problem that has a negative impact on school and community relationships.’865
Addressing this problem is particularly challenging. While an important part of the solution may be in increasing the number of local Indigenous teachers (who might be expected to stay in their roles for longer than those recruited from outside sources), the proportion of Indigenous teaching staff working in Northern Territory schools is substantially lower than the proportion of Indigenous people in the Northern Territory population. A review of NT DET in 2009 estimated that only around 3 per cent of teachers in the Northern Territory were of Indigenous origin, compared to almost one-third of the Northern Territory population. The
859 J. Hattie, J. Biggs & N. Purdie, ‘Effects of learning skills interventions on student learning: A meta-analysis’, Review of Educational Research, vol. 66, no. 2, 1996, pp. 99–136; S. Dinham, L. Ingvarson & E. Kleinhenz, Investing in teacher quality: Doing what matters most, paper prepared for the Business Council of Australia, Australian Council for Educational Research, 2008. 860 AESOC Senior Officials Working Party on Indigenous Education, Directions in Indigenous education 2005–2008, Ministerial Council on Education, Employment, Training and Youth Affairs, Melbourne. 861 Commonwealth Grants Commission, op. cit. 862 Improving the quality of teaching was a major focus of the recent independent review of NT DET, which observed that ‘[t]he professional development requirements of teachers and schools in [the Department of Education and Training] are substantial, in part due to high turn-over rates and in part due to the unique demands of the Territory. The depth of need in the professional development of its teachers means that a highly coordinated and consistent approach to professional development in curriculum, pedagogy and assessment is paramount. J. Ladwig & C. Sarra, Structural review of the Northern Territory Department of Education and Training: Delivering the goods, NT DET, 2009, p. 34. 863 G. Lock, ‘Preparing teachers for rural appointments: Lessons from Australia’, The Rural Educator, 2008, vol. 29, no. 2, pp. 24–30. 864 C. McClure, D. Redfield & P. Hammer, ‘Recruiting and retaining high-quality teachers in rural areas’, AEL Policy Brief, 2003. 865 Northern Territory Emergency Response Review Board, op. cit., p. 30.

Enhancing education
Northern Territory Emergency Response: Evaluation Report 2011 301
same review found that only four of the 150 principals in the Northern Territory were Indigenous.866
The low numbers of Indigenous teachers and principals means there is a strong reliance on recruiting teachers from outside those communities and the Northern Territory. Given the remoteness of these communities, this is very challenging, even when additional incentives are offered. The Northern Territory Government relies heavily on interstate recruitment to fill positions, because there are insufficient teachers graduating from Northern Territory higher education institutions to meet demand.867 Remote area positions are often filled by younger and less experienced teachers, and it is relatively rare for teachers in remote area schools to stay in their positions for long periods.
Figure 8.2 shows the distribution of teachers who were teaching in NTER schools during the first term of 2011 by length of service in their schools. Close to one-half (46%) of teachers working in schools serving the NTER communities at that time had been in their current schools for less than one year. In all Northern Territory schools, a little more than one-quarter (27%) of teachers were in their first year at their current schools. More importantly, however, one-third of teachers in Northern Territory schools have five or more years of teaching at the same school, compared to 13 per cent in NTER schools.868
There are many measures of teacher retention and turnover. One such measure is the percentage of teachers in a position in the first term of the school year who were in the same school in the first term of the previous year. Between 2008 and 2011, the retention rate at the beginning of each year has been approximately 62 per cent in NTER schools, compared to 73 per cent in all Northern Territory schools.869 It has been reported that, on average, the length of service of a teacher in a remote Northern Territory school is eight to nine months.870
Figures provided by NT DET for government schools in the NTER communities show that teacher retention within a school year—from the fourth week of Term 1 to the seventh week of Term 2—has fluctuated between 2007 and 2011 at around 90 per cent or above.871 These retention figures are only slightly lower than the rates for all Northern Territory Government schools, which have been around 93 per cent or above. The rates for 2011 are the highest among the five years in the series for both groups of schools, although there is very little change overall, as highlighted by Figure 8.3. More important, however, is that the rate for NTER schools in 2011 (94%) is only one percentage point lower than the rate for all Northern Territory Government schools (95%). The within-year retention rate for the recently introduced Remote Teaching Service program—which covers many of the NTER schools—is the same as the rate for NTER schools (94%).
866 J. Ladwig & C. Sarra, op. cit. 867 Commonwealth Grants Commission, General revenue grant relativities: Northern Territory workplace discussions, briefing notes, Commonwealth Grants Commission, 2008. 868 Unpublished data provided by the Northern Territory Department of Education and Training. (Staff length of service, NTER schools and all schools). Simply looking at the ‘average length of service’ and no other data could result in a misinterpretation of the situation. Schools have increased their teaching complement by employing new teachers. As a result, the average length of service has declined but there are more teachers in the schools. 869 Unpublished Data provided by NT DET (Staff retention year to year, NTER schools and all schools). 870 See for example, The Hon Peter Garrett MP, Minister for School Education, Early Childhood and Youth, 20 June 2011, media release, ‘New $5m scheme for teachers in remote communities’, Available at: <http://www.deewr.gov.au/ministers/garrett/media/releases/pages/article_110620_121325.aspx>; C. Milburn, ‘Wanted: teachers to go the distance’, The Age, 23 August 2010, Available at: <http://www.theage.com.au/national/education/wanted-teachers-to-go-the-distance-20100820-138ot.html#ixzz1SnuHvkqR>. 871 Unpublished Data provided by NT DET (Staff retention within semester 1, NTER time series and all schools).

Enhancing education
302 Northern Territory Emergency Response: Evaluation Report 2011
Figure 8.2 Length of service in their current schools of teachers working in schools in the NTER communities, 2011
0 5 10 15 20 25 30 35 40 45 50
0‐1 year
1‐2 years
2‐3 years
3‐4 years
4‐5 years
5+ years
Length of service
Per cent of teachers
Source: Derived from data provided by NT DET.
Figure 8.3 Percentage of teachers retained from Term 1 to Term 2 in Northern Territory government schools and government schools in NTER communities, 2007 to 2011
0%
10%
20%
30%
40%
50%
60%
70%
80%
90%
100%
2007 2008 2009 2010 2011
All NT government schools NTER government schools
Source: Derived from data provided by NT DET.
Under the framework of the Closing the Gap in the Northern Territory National Partnership Agreement, the NTER is supporting education providers to attract and retain good teachers in

Enhancing education
Northern Territory Emergency Response: Evaluation Report 2011 303
remote schools. NT DET has implemented a range of measures to improve the quality of teaching in the NTER communities, including the following:
• Professional development: a wide range of professional development opportunities were provided to remote Indigenous educators, including scholarships, on-the-job training, workshops, mentoring and online literacy and numeracy coaches.872
• Additional teachers: around 192 extra teachers funded by the Commonwealth had been deployed by Northern Territory education authorities to work in schools serving the NTER communities.873
• Additional teacher housing: using a mixture of Australian and Northern Territory government funding, a significant building program has been undertaken to address shortages in the availability of teacher housing.874 As a result, the teacher housing shortage in NTER communities was reduced from approximately 90–100 houses at the start of the NTER to 26 dwellings by the end of 2010.875
Outside the NTER, the Smarter Schools National Partnership for Improving Teacher Quality has allocated up to $5.4 million over five years to the Northern Territory to improve the quality of the teaching in Northern Territory schools. Under that agreement, the Northern Territory has received $1,148,000; the remaining $4,274,000 may be claimed—partially or fully—as reward funding, but the amount to be paid will not be determined until 2012 and 2013. The agreement includes, among others, initiatives to pilot improved reward structures for teachers and leaders who work in disadvantaged Indigenous rural/remote and hard-to-staff schools; to improve in-school support for teachers and leaders, particularly in disadvantaged Indigenous rural/remote and hard-to-staff schools; and to develop career pathways for Indigenous staff, including by increasing the number of Indigenous staff with education qualifications.876
Given the wide array of activities focusing on teacher quality that are being implemented and the different funding streams involved, it is difficult to gain a clear picture of which teacher quality measures are additional and which are pre-existing or relabelled programs or funding. Nevertheless, the available evidence suggests that there has been a significant focus on improving the quality of teaching in schools serving the NTER communities, including by addressing shortages in teacher housing, which poses a significant barrier to the recruitment of teachers to work in remote communities. It is anticipated that these reforms will reduce the rate of teacher turnover and improve the quality of the teaching staff in schools in the NTER communities, and therefore improve student outcomes. There is little evidence to date that those anticipated outcomes have occurred, although it is recognised that they will take some time to emerge.
Enhancing literacy Recognising that, in general, schools in remote areas are staffed by less experienced teachers, experience high staff turnover and are particularly challenging to teach in because of language and cultural differences, the NTER funded the establishment of specialist teams to work with teaching staff in those schools. The teams work with schools to plan and implement whole-of-school approaches to teaching both literacy and numeracy877 and
872 FaHCSIA, Closing the Gap in the Northern Territory whole of government monitoring report, January to June 2011, Part 2, FaHCSIA, 2011. 873 ibid. 874 ibid. 875 Northern Territory Department of Education and Training, 200 Additional Teachers Measure_2010 Annual Report: Attachment 1, unpublished internal report submitted to DEEWR, 2010. 876 Northern Territory Government, Smarter Schools National Partnerships Implementation Plan, 2009. 877 While initially conceived as a measure to improve literacy, the focus was broadened to include numeracy.

Enhancing education
304 Northern Territory Emergency Response: Evaluation Report 2011
approaches to classroom and behaviour management and student wellbeing, with a particular focus on students for whom English is a second language. This includes the provision of in-class support, mentoring and delivery of on-site and external professional development in the areas of literacy and numeracy.878 Some of the expertise was sourced from the NTER-funded teams, while other staff were brought in from existing core services, such as NT DET’s Curriculum and Student Services divisions, or were externally contracted where necessary. According to the Northern Territory Government’s final performance report for the measure, a total of 510 days of professional development for 110 Central Australian teachers were delivered in the areas of leadership and coaching; behaviour management; strategic planning by reviewing student needs; analysing student test results; English as a second language strategies; guided reading; and literacy and numeracy teaching approaches.879
These initial measures changed in subsequent agreements to support Northern Territory education providers in embedding good teaching practices at the local level. Ongoing efforts are being made to align targeted support for schools in NTER communities with broader NT DET strategic directions for the provision of remote area educational services.880
As emphasised by NT DET reporting on the implementation of the Enhancing Literacy sub-measures, the success of these measures will depend a great deal on the ability to ensure continuity in program delivery to children. This is particularly important where there are high numbers of students for whom English is not the first language, as is the case in all NTER communities, and where there are frequent changes in teaching staff. In combination with good school planning, part of the solution may lie in increasing the participation and capacity of local Indigenous teaching staff, who are more likely to stay in their roles for longer than teachers employed from outside sources.
Improving school infrastructure through additional classrooms and other measures While the precise impact of the quality of school facilities on learning outcomes is not well understood, there appears to be general agreement in the literature that sub-standard facilities have a negative impact. Overcrowding and poor ventilation and temperature control, acoustics and lighting have all been cited as having a negative impact on students’ academic performance, teacher turnover, school climate and community engagement with the school.881
The remoteness and resultant inaccessibility of the schools serving the NTER communities means that it is difficult for Northern Territory authorities to deal with routine maintenance requirements.882 An added difficulty is presented by the high mobility of Indigenous students, which often causes significant fluctuations in enrolments and makes it more difficult to anticipate future infrastructure requirements. In 2008, FaHCSIA reported that at least 10 schools in the NTER communities had an average student attendance that exceeded available classroom capacity and that classroom pressures were emerging in other schools.883
878 FaHCSIA, Submission of background material to the Northern Territory Emergency Response Review Board, Appendix 2, FaHCSIA, 2008. 879 Northern Territory Department of Education and Training, ‘Enhancing Literacy and Quality Teaching Package: Final Performance Report, unpublished report, 2009. 880 ibid. 881 For example, Victorian Department of Education and Early Childhood Development, Research into the connection between built learning spaces and student outcomes: Literature review, 2011; D. Ready, V. Lee & K. Welner, ‘Educational equity and school structure: School size, overcrowding, and schools-within-schools’, Teachers College Record, vol. 106, no. 10, 2004, pp. 1,989–2,014; C. Uline & M. Tschannen-Moran, ‘The walls speak: The interplay of quality facilities, school climate, and student achievement’, Journal of Educational Administration, vol. 46, no. 1, 2008, pp. 55–73; and G. Earthman, School facility conditions and student academic achievement, UCLA/IDEA, 2002. 882 The 1999 review of Indigenous education in the Northern Territory pointed to the frustrations of school principals and teachers in having routine maintenance issues dealt with and to challenges in catering for occasionally large increases in enrolments. NT Department of Education and Training, Learning lessons: An independent review of Indigenous education in the Northern Territory, 1999. 883 FaHCSIA, Northern Territory Emergency Response: One year on, op. cit., p. 23.

Enhancing education
Northern Territory Emergency Response: Evaluation Report 2011 305
In addition to problems with overcrowding in some schools, a further concern at the inception of the NTER was the capacity of existing infrastructure to cater for anticipated increases in enrolment.884
To address existing and anticipated pressures, the Australian Government allocated an initial $7.7 million to the education authorities to build a total of 14 new classrooms and a further $2.6 million in the 2008–09 Budget for the construction of six additional classrooms.885 In addition to these NTER measures, infrastructure funded under the BER program has had a major impact on school infrastructure in the prescribed areas. Around $79 million was allocated to 78 schools serving the prescribed areas under the Primary Schools for the 21st Century program, while an additional $18 million in funding was allocated under the National School Pride and Science and Language Centres components of the BER.886 Given the scale of the BER investments, they are likely to be of greater significance than the NTER infrastructure measures in improving the quality of schools in the prescribed areas.
Under the constraints of this evaluation, it was not possible to assess the quality of the infrastructure funded by either the BER or the NTER programs. However, at least for those schools that were suffering from overcrowding or had substandard facilities, it is reasonable to expect that the additional classrooms provided under the NTER have improved the amenity of the school and will help to improve learning. In terms of the scale of the investment, it is important to note that the BER programs had a much larger impact on schools serving the prescribed areas than the funding provided under the NTER. In combination, the BER and NTER programs have provided a substantial injection of funding into remote school facilities. Presumably, this has built on improvements, already noted by independent authorities, to NT DET’s capacity to manage education infrastructure in the Northern Territory.887
Improving attentiveness and attendance of schoolchildren through the school nutrition program The School Nutrition Program (SNP) was introduced in response to recommendation in the ‘Little children are sacred’ report that the Northern Territory Department of Employment, Education and Training (now NT DET) introduce a universal school meals program in Indigenous communities. The SNP began to be implemented in NTER communities in late 2007, shortly after the NTER was announced on 21 June 2007.888 By July 2008, the program had been established in 68 of the 73 NTER communities.889 Initially, $7.4 million was provided in the 2008–09 financial year890, and a further $37.5 million was provided in 2009–10 to extend the program for a further three years.891
884 To provide an indication of the potential scale of this problem, the Northern Territory Public Accounts Committee estimated in the mid-1990s that, if all enrolled students attended regularly, an additional $5 million for infrastructure would be required to meet their needs, and that the costs would be significantly higher if all school-aged children were enrolled. Legislative Assembly of the Northern Territory, Public Accounts Committee, Report on the Provision of school education services for remote Aboriginal communities in the Northern Territory, 1996. 885 FaHCSIA, Northern Territory Emergency Response: One year on, op. cit., p. 23. 886 Unpublished data supplied by DEEWR based on BER data as at 31 July 2011. 887 The 2009 independent review of the structure of NT Department of Education and Training observed that ‘[w]here past educational challenges facing the Northern Territory necessarily focused on basic construction of educational infrastructure and provision of personnel, the Territory is now in a position to raise its own systemic expectations and focus more on the quality of its performance as a system, with a more concerted and strategic focus on increasing the educational performance of its students.’ J.G. Ladwig & C. Sarra, op. cit., p. 11. 888 FaHCSIA, Submission of background material to the Northern Territory Emergency Response Review Board, op. cit. 889 Northern Territory Emergency Response Review Board, op. cit., Appendix 10, Table 13. 890 FaHCSIA, Submission of background material to the NTER Review Board, op. cit. 891 FaHCSIA, ‘Budget 2009-10, Closing the Gap—Northern Territory—enhancing education—school nutrition’, Available at: <http://www.fahcsia.gov.au/about/publicationsarticles/corp/BudgetPAES/budget09_10/Indigenous/Pages/32_NT_EnhancingEducation_SchoolNutrition.aspx>.

Enhancing education
306 Northern Territory Emergency Response: Evaluation Report 2011
The SNP aims to ‘contribute to improved school attendance and engagement by providing breakfast and lunch to school-aged children attending schools in NTER communities’.892 The rationale for interventions such as the SNP is that poor diets for young children can negatively affect many aspects of child health and development.893 By improving the nutritional status of children through the provision of meals at school, school feeding programs are expected to improve the attentiveness, cognitive functioning and attendance of students. Another potential benefit of the SNP is that it could support greater parental and community involvement in schools, which is commonly believed to be associated with higher student achievement.894
There is as yet no rigorous empirical assessment of the impact of the SNP on educational outcomes.895 Notwithstanding this gap, evidence collected by a number of independent observers suggests that the program’s main stakeholders have a generally positive perception of the program and its impacts. For example, a performance audit conducted by the Office of Evaluation and Audit in 2009 observed, on the basis of field visits and stakeholder consultations, that ‘in a number of communities there was significant acceptance of and support for SNP’ and that ‘in general, there is significant support for SNP from the school principals and staff’.896 Similarly, the NTER Review Board came to the conclusion that there was general support for the program from NTER communities.897
Those views are also borne out by the 2009 Department of Education, Employment and Workplace Relations (DEEWR) survey of parents, providers and principals to gauge their perceptions of the impacts of the program and aspects of its administration. While low response rates from some of the target groups (particularly principals) mean the results should be approached with caution, responses were generally favourable. For example, over 80 per cent of each group of respondents (parents, providers and school principals) reported that the SNP had had a positive impact on students’ general behaviour. Most respondents also reported that the SNP had supported an increase in parental engagement with schools.898
Respondents to DEEWR’s stakeholder survey were less confident about the impact the program had had on student enrolment and attendance (see Table 8.2). This was particularly evident in the case of school principals, who are presumably best placed to assess the impact of the SNP on student enrolment. While low response rates mean these results should be treated with caution (only one-quarter of principals from schools serving the NTER communities responded to the survey), only 29 per cent of the principals who responded to the survey considered the SNP had had a marked impact on enrolments. Similarly, and noting the difficulties of attributing changes in student behaviour to the SNP899, the Office of Evaluation and Audit reported in 2009:
892 DEEWR, School Nutrition Program: Operational guidelines, 1 January 2011 to 30 June 2012, 2010. 893 The Cochrane Collaboration, School feeding for improving the physical and psychosocial health of disadvantaged students, 2009. 894 A summary on community involvement in schools, with a focus on Australian studies, is provided in R. Simons, Schools in their communities, ACER Policy Briefs, 2011. 895 In 2008, the NTER Review Board made a basic attempt to assess the impact of the program in its early days. The board analysed the performance of the program by comparing 17 schools that had a school nutrition program for more than six months with 19 schools that had only just received it or where no such program had been established. On the basis of that analysis, the board observed:
Attendance had declined or was unchanged in two-thirds of the long exposure schools while in two-thirds of the short exposure schools it had increased. Clearly, school attendance is related to factors other than the availability of the school nutrition program.
The board concluded that ‘the available evidence on the school nutritional program indicates no link with increasing school attendance’. NTER Review Board, op. cit. 896 Office of Evaluation and Audit, Performance audit of the School Nutrition Program. 2009, p. 30. 897 NTER Review Board, op. cit. 898 DEEWR, Findings of the School Nutrition Program stakeholder survey, DEEWR, Canberra, 2009. 899 The Office of Evaluation and Audit observed that ‘[t]he number and relative importance of other factors impacting [on] school attendance and engagement makes it difficult for DEEWR to attribute any changes in student attendance and engagement specifically to the implementation of SNP.’ Office of Evaluation and Audit, op. cit., p. 15.

Enhancing education
Northern Territory Emergency Response: Evaluation Report 2011 307
Stakeholders were of the opinion that SNP was a minor factor impacting on student attendance and engagement in comparison with these other factors. This was particularly the case with school based stakeholders who dealt with children on a day to day basis.900
Table 8.2 Parents’, providers’ and principals’ comparative views on the impact of the School Nutrition Program on student enrolment
Extent to which the stakeholder believed the SNP made a positive impact (per cent)
Stakeholder group Number of responses None A little A lot
Providers 18 44.4 27.8 27.8 Parents 168 13.1 50.6 36.3 Principals 17 52.9 17.6 29.4 Source: DEEWR, Findings of the School Nutrition Program stakeholder survey.
A number of concerns about the operation of the SNP could not be addressed within the scope of the current review. Some are discussed by the NTER Review Board and the Office of Evaluation and Audit in their respective reviews of the program, including the impost on families; inconsistent contributions within the community; the quality of the data collected by DEEWR on how many children are receiving meals, who they are and how they have paid for their meals; and the long-term sustainability of the program.901 Another important concern is the extent to which ‘substitution’, which occurs when nutrient and energy gains from meals at school are offset by reduced feeding outside of school, may be reducing the impact of the SNP. Each of the three studies that assessed substitution considered by the Cochrane Collaboration found evidence that this was occurring. Specifically, they found that the net increases in energy intake were far lower than those resulting from school meals.902
On balance, it is reasonable to expect that the SNP, if well targeted, could have a small positive impact on school attendance and educational attainment. This assessment is supported by rigorous international studies, which suggest that well-targeted school feeding programs have a positive, if relatively small, impact on educational outcomes. In a systematic review of 19 well-designed studies of school feeding programs, the Cochrane Collaboration found that, in the highest quality (randomised control trial) studies in low-income countries, children fed in school gained 390 grams over 19 months when compared to control groups. School feeding also resulted in small increases in student attendance, amounting to an average increase of four to six days per year per child. Some improvements were also identified in cognitive outcomes, although the nature of those improvements differed from study to study.903
Improving school readiness through the children’s services and family support sub-measure All children deserve high-quality education and care to equip them for further schooling and for the challenges of the future. Research shows that participating in a quality early childhood education program can significantly increase positive educational and life outcomes for children, especially those from more disadvantaged backgrounds.904 Under the National Partnership Agreement on Early Childhood Education, all governments—including the
900 ibid., p. 15. 901 NTER Review Board, op. cit; Office of Evaluation and Audit, op. cit. 902 In a study of a program in Malawi, 77 per cent of children fed in school reported that they got less at home, and 82 per cent of caregivers confirmed that this was occurring. The Cochrane Collaboration, School feeding for improving the physical and psychosocial health of disadvantaged students, 2009. 903 The Cochrane Collaboration, op. cit. 904 C. J. Bourke, K. Rigby & J. Burden, Better practice in school attendance: Improving the school attendance of Indigenous students, report prepared for the Australian Government Department of Education, Training and Youth Affairs by Monash University, Clayton, Victoria, 2000.

Enhancing education
308 Northern Territory Emergency Response: Evaluation Report 2011
Northern Territory Government—have committed to providing access to quality early childhood education programs for all children by 2013, delivered by a university-trained early childhood teacher, for 15 hours a week, 40 weeks a year, in the year before full-time schooling.
The Northern Territory AEDI report noted that Northern Territory Indigenous children have substantially lower rates of participation in non-parental day-care or educational programs in the year before they commence school than other Australian children.905 At present, the remoteness of the NTER communities and their small populations mean that they lack access to mainstream early childhood services. Instead, they generally rely on non-mainstream services, which are funded by the Australian Government under the Budget Based Funding (BBF) Program. The program is an element of the Child Care Services Support Program, which aims to support the delivery of early childhood education and care programs where the market would otherwise fail to deliver.906 The Australian National Audit Office has estimated that around 70 per cent of BBF Multifunctional Aboriginal Children’s Services and crèches have substandard or unsafe infrastructure and that 50 per cent of carers have no formal qualifications, which reflects the difficulty of delivering early childhood services in remote locations.907
In recognition of the challenges that non-mainstream services face, the Australian Government is implementing the 2010 Budget BBF Quality Measure. The measure provides funding of $59.4 million over four years to improve the facilities from which centre-based BBF services operate, increase the number of qualified staff working in those services and improve governance. The measure aims to support centre-based BBF services to work towards meeting the key elements of the National Quality Framework and to improve service quality.908
Under the NTER Supporting Families measure, the ‘Children’s services and family support’ sub-measure aims to improve access to a range of early childhood education and care services for children, parents and carers. Under the measure, nine new crèches have been established in communities where there were few or no early childhood services, while 13 existing Australian Government funded crèches with urgent health and safety issues have also been upgraded (see Table 8.3). A further $859,000 was allocated to developing five playgroups, and $400,000 was allocated to extending existing parenting programs.909
According to the program logic, the impact of these initiatives will be threefold. The first and immediate outcome will be that eligible children will begin to engage with these services in the participating areas. In the medium term, positive experiences during early childhood will result in higher rates of participation, as shown in increased rates of enrolment, attendance and motivation to pursue educational goals. Parents and carers will have a greater awareness of their children’s developmental needs (for example, nutrition and school readiness), and community engagement with education will increase. The long-term outcome of the initiatives will be children who are well equipped physically and psychologically for school and who are supported by their community.910
905 S. Silburn, J. McKenzie & B. Moss, op. cit. 906 ANAO, Multifunctional Aboriginal Children’s Services (MACS) and crèches, Audit report no. 8, Canberra, 2010. 907 ibid. 908 Advice from DEEWR. 909 ibid. 910 ARTD Consultants & WestWood Spice, op. cit., p.26.

Enhancing education
Northern Territory Emergency Response: Evaluation Report 2011 309
Table 8.3 New and upgraded crèches, by year of completion
NTER crèches 2008 2009 2010 2011 New crèches Lajamanu(a) Areyonga
Kaltukatjara (Docker River) Papunya Robinson River Yarralin
Milikapiti Peppimenarti
Timber Creek
Crèche upgrades Nyrripi Gunbalanya (Oenpelli) Ntaria Santa Teresa
Maningrida Gapuwiyak Minjilang Minyerri Borroloola
Atitjere (Harts Range)
Wugularr (Beswick) Pirlangimpi Warruwi
a A classroom at the Lajamanu school was refurbished under the NTER measure for use as the Lajamanu crèche. The school subsequently required the use of the classroom for school purposes. Funding has been allocated for the construction of a new purpose-built crèche facility under the 2010 Budget BBF Quality Measure, and arrangements are underway to progress the construction.
The outcomes outlined in the NTER program logic are in line with research that suggests a welcoming environment for children, particularly for Indigenous children in the early years of education, helps to ensure greater engagement with education through the compulsory and post-compulsory school years.911 A recent paper produced for the Closing the Gap Clearinghouse also emphasised that educational growth will be facilitated by providing for the developmental needs of children in early childhood.912
In addition to providing new or upgraded infrastructure, initiatives of the sub-measure have included funding for preschool programs and playgroups to improve school readiness. Since October 2008, 15 communities have participated in these early childhood programs. Table 8.4 shows participation timelines for the 15 communities. Greyed cells indicate that a preschool program or playgroup was operating in this community at the time of the monitoring report.913
Table 8.4 Timelines of preschool program or playgroup participation
2008 2009 2010 2011 Community Dec Mar Jun Apr Jul Jan May Acacia Larrakia Areyonga Binjari Gapuwiyak Kaltukatjara Lajamanu Maningrida Milikapiti Milingimbi Mutitjulu Numbulwar Pirlangimpi Wadeye Wurrumiyanga Yuendumu Note: Although it is not clear in any of the available documentation, it is assumed that ‘early childhood service/program’ refers to a
preschool program unless otherwise indicated. The National Quality Framework for Early Childhood Education and Care covers preschool programs, long day care, family day care and outside of school hours care.
Sources: NTER monitoring reports; Closing the Gap monitoring reports.
911 C.J. Bourke, K. Rigby & J. Burden, op. cit. 912 N. Purdie & S. Buckley, School attendance and retention of Indigenous Australian students, Closing the Gap Clearinghouse issues paper no. 1, 2010. 913 Four additional situation reports were collected during the period between October 2008 and May 2011 (October 2008, October 2009, November 2009 and January 2010), but data were not collected for the children’s services and family support sub-measure.

Enhancing education
310 Northern Territory Emergency Response: Evaluation Report 2011
Intensive support playgroups914 have also been operating since 2007–08 in and around Katherine and Tennant Creek.915 In Katherine, the playgroups operated in the communities of Kalano, Rockhole and Binjari. An intensive support playgroup was also funded in Borroloola in June 2010 and began operating in December 2010.916 In addition to the intensive support playgroups, locational supported playgroups917 in Numbulwar, Milingimbi and Yuendumu began operating in mid-2009. While the nature of the playgroups varies according to local arrangements, they all aim to improve the early learning, safety and wellbeing of Indigenous children aged up to four years, build parent and carer knowledge and capacity, strengthen community connections and social networks, and act as a referral point, linking families to outside support services.918 The three intensive support playgroups and three locational supported playgroups fulfil the commitment made in 2008 to develop five playgroups as part of the NTER strategy.919 According to data compiled from FaHCSIA monitoring reports, as presented in Table 8.4, preschool and playgroup services supported by NTER funding were not sustained in seven of the 15 communities where they had been established.920
While reported community perceptions of the playgroups established by the NTER are positive, there has not been any systematic assessment of the NTER measures for early childhood services.921 One of the early childhood programs funded by the NTER—the Let’s Start! Exploring Together for Indigenous Preschools Program—which was recently evaluated by Charles Darwin University, provides some insight into the likely effectiveness of the NTER playgroups.922 Designed to assist the engagement of parents and children in various environments and support children’s transition to school, the Let’s Start program has encountered the usual challenges encountered in Indigenous communities in recruiting and retaining parents and carers. While the evaluation team observed that programs such as Let’s Start ‘can improve the capacity of parents to support children in negotiating the transition to school in both urban and remote settings’, the program’s capacity to do so was contingent on establishing effective and sustainable approaches.923 The evaluation concluded:
Structured, targeted early intervention services require continuing inputs of professional supervision and support. They cannot be based on simple handover of responsibility to community members with limited training, weak local agency support and subject to many competing local agendas.924
914 Intensive support playgroups are initiated and facilitated by skilled family support and early childhood workers delivering mobile playgroup services across a number of sites. They aim to promote positive early childhood development and contribute to increased child safety and wellbeing for particularly disadvantaged families and children who are experiencing insecure or inadequate housing. They are targeted at locations where the living arrangements of families (and often other circumstances) are adversely affecting the capacity of caregivers to parent effectively. FaHCSIA, ‘Playgroups’, Available at: <http://www.fahcsia.gov.au/sa/families/progserv/Pages/parenting-playgroups.aspx#supported2>. 915 FaHCSIA, Closing the Gap in the Northern Territory Monitoring Report, July to December 2010, Part 2, FaHCSIA, Canberra, p. 7. 916 ibid., p. 10. 917 Locational Supported Playgroups provide a safe and supportive environment for Indigenous families to gather in their communities. They are initiated and facilitated by paid coordinators and early childhood workers and are located in places, which encourages integration with other community services such as child care centres, preschools and community health centres. FaHCSIA, ‘Playgroups’, op. cit. 918 FaHCSIA, Closing the Gap in the Northern Territory Monitoring Report, July to December 2010, Part 2, op.cit., p. 10. 919 Northern Territory Emergency Response Review Board, op. cit., p. 32. 920 The monitoring reports refer to ‘early childhood services’ only and do not distinguish between preschool programs, playgroups or other types of early childhood education and care. 921 For example, a report on the intensive support playgroups in Tennant Creek observed: ‘The playgroup has had good parent/carer attendance, with parents/carers encouraged to come along to see how their child has developed and to see the activities they do. Two fathers have been attending the playgroup which they say they really enjoy.’ Similarly, for the Numbulwar program, the FaHCSIA monitoring report observed: ‘Children and adults are exposed to wide ranging developmental and cultural activities in a fun and relaxed way … One on one time playing together is encouraged and the adults have become more accustomed to doing this. Reading with children has been a particular focus over this period [January–July 2010] and all parents are now comfortable at sitting down with their child and reading with them, it may be interpreting pictures in their own language or reading the script.’ See FaHCSIA, Closing the Gap in the Northern Territory Monitoring Report, January to June 2010, Part 2, FaHCSIA, Canberra, pp. 9–10. 922 FaHCSIA, Closing the Gap in the Northern Territory Monitoring Report, July 2009 to December 2009, Part 2, Canberra, 2009, p. 12. 923 Charles Darwin University, School for Social and Policy Research, Institute of Advanced Studies, Let’s Start: Exploring Together—An early intervention program for Northern Territory children and families: Final evaluation report, Charles Darwin University, Casuarina, 2010, p. 13. 924 ibid., p. 102.

Enhancing education
Northern Territory Emergency Response: Evaluation Report 2011 311
Reflecting this finding, one ongoing concern about the NTER children’s support measure is the extent to which NTER activities could contribute to further fragmentation of early childhood services in the Northern Territory. An issues paper from the Menzies School of Health Research noted, for example, that ‘the NT Emergency Response has seen a proliferation of discrete, short-term funded initiatives, often overlapping in aim and purpose and not integrated with existing universal and targeted services’.925 A report on the Menzies School of Health Research ‘Making it Happen’ Parenting Symposium noted that many such initiatives had ‘very little prospect of sustainable integration with existing universal and targeted services’. As shown in Table 8.4, early childhood services supported by NTER funding were not sustained in seven of the 15 communities where they had been established.
To ensure the sustainability of existing programs and activities, it will be important that NTER and other Australian Government measures are effectively integrated with initiatives funded by other levels of government and the non-government sector.926
Educational outcomes A number of indicators are available to determine whether the NTER Enhancing Education measure, in combination with broader systemic initiatives, has met—or has begun to meet—its stated goals. Those indicators include student results from and participation in the national assessment program, school enrolments and student attendance. The data for this section were provided by NT DET; the analyses are the responsibility of the authors, and are described in the methodology section above.
NAPLAN Reading In NAPLAN Reading, results for students attending schools in the NTER communities have improved since 2008, although there was little change between 2009 and 2010. Table 8.5 shows results in NAPLAN Reading for NTER schools for each year from 2008 to 2010, and for each year level within those years. These results include the mean scale score, the percentage of students who were at or above the national minimum standard for the year level, the number of students who participated (as defined above) and the participation rate (as defined above). Results for NTER schools are compared with results for all Northern Territory schools and all Australian schools. Results for NTER schools are summarised in Figure 8.4 (mean scale score), Figure 8.5 (percentage of students at or above the national minimum standard) and Figure 8.6 (participation rate).
For NTER schools, the mean scale score in Year 3 Reading improved from 173 in 2008 to 205 in 2009, then improved again slightly to 208 in 2010. During the same period, the percentage of Year 3 students who were at or above the national minimum standard increased from 18 per cent in 2008 to 28 per cent in 2009 and 41 per cent in 2010. The patterns of improvement were similar, but a little smaller, in Year 5. In Year 7 and Year 9 Reading, the mean scale score for students increased by 26 and 14 scale score points, respectively, from 2008 to 2009, then increased again by 16 and 21 scale score points, respectively, from 2009 to 2010, resulting in net increases of 42 scale score points in Year 7 and 35 scale score points in Year 9 from 2008 to 2010. Nevertheless, the proportion of students in NTER schools who were at or above the national minimum standard in Year 7
925 Menzies School of Health Research, Early childhood development in the NT: Issues to be addressed, Early Childhood Series no. 1, Northern Territory Government, Darwin, 2011, p. 17. 926 Menzies School of Health Research, Effective integration of family & children’s services ‘Making it happen’ Parenting Symposium: Symposium report, Northern Territory Government, Darwin, 2010, p. 37.

Enhancing education
312 Northern Territory Emergency Response: Evaluation Report 2011
Reading increased from 15 per cent in 2008 to 19 per cent in 2010; in Year 9 Reading, the proportion increased from 8 per cent in 2008 to 9 per cent in 2009 and to 11 per cent in 2010.
For all schools in the Northern Territory, the mean scale score improved for Year 3 Reading each year, as did the percentage of students at or above the national minimum standard. For all of the Territory, 63 per cent of students were at or above the national minimum standard in 2008, 69 per cent in 2009 and 70 per cent in 2010. While the NTER schools have shown impressive improvement in Year 3 Reading, they remain far behind results for all Territory schools and for all students across Australia. Results for NTER schools are far behind those for all schools at Years 5, 7 and 9, as well. In 2010, the difference in the mean scale score was equivalent to around 2 standard deviations between NTER schools and the national mean, and between 1 and 1.5 standard deviations between NTER schools and the Northern Territory mean.
After low participation rates in 2008 of between 54 and 61 per cent in NTER schools, rates increased dramatically in 2009 to between 85 and 90 per cent in Years 3, 5 and 7. Participation rates then dropped between 2009 and 2010, but participation in 2010 was higher than in 2008, with more than 70 per cent of primary students (Year 3 and 5) and 69 per cent of Year 7 students participating. Year 9 participation rates have been much lower: just over one-half (53%) of students participated in 2010.
NAPLAN Numeracy Results for NAPLAN Numeracy are less impressive than results for NAPLAN Reading. Table 8.6 shows the results for NTER schools, all Northern Territory schools and all Australian schools, as shown for NAPLAN Reading. Results for NTER schools only are summarised in Figure 8.7 for mean scale scores, Figure 8.8 for the percentage of students in each year level at or above the national minimum standard and Figure 8.9 for participation rates.
Among students in Year 3, the mean scale score in the NAPLAN Numeracy assessments dropped from 248 in 2008 to 216 in 2009, then improved to 234 in 2010. For all schools in the Northern Territory, mean scale scores dropped from 338 in 2008 to 322 in 2009, then improved to 328 in 2010. The percentage of students at or above the national minimum standard followed the same pattern, with a decrease from 2008 to 2009, then an increase to 2010. This was the pattern for all of the Northern Territory and most jurisdictions in Australia. For the three years in which NAPLAN has been administered, Year 3 Numeracy results were highest in 2008.927
Among students in Year 5, the mean scale score for Numeracy improved slightly from 2008 to 2009, then decreased for 2010. Similarly, the percentage of students at or above the national minimum standard in 2009 was higher than in 2008, but then dropped again for 2010. This pattern of change is similar to that for all Northern Territory schools and all Australian schools, but the between-year differences were greater in NTER schools. Year 7 Numeracy has shown shallow decreases in both the mean scale score and the percentage of students at or above the national minimum standard in NTER schools, while in Year 9 the pattern is similar to that for Year 5.
927 Examination of Tables 5e.i and 5e.ii in the 2010 NAPLAN national report (ACARA, National Assessment Program—Literacy and Numeracy: Achievement in reading, writing, language conventions and numeracy, ACARA, Sydney, 2010) shows that the mean scale score for Year 3 Numeracy was lower in 2008 than in 2009 and 2010 in Queensland only, and the difference between 2008 and the other years was statistically significant. In all other jurisdictions, the mean scale score for Year 3 Numeracy was highest in 2008, although none of the differences is statistically significant.

Northern Territory Emergency Response: Evaluation Report 2011 313
Tabl
e 8.
5 A
ggre
gate
NA
PLA
N R
eadi
ng re
sults
for s
tude
nts
atte
ndin
g sc
hool
s in
the
NTE
R c
omm
uniti
es, a
ll N
orth
ern
Terr
itory
sch
ools
and
all
Aus
tral
ian
scho
ols,
200
8 to
20
10
NT
ER sc
hool
s
North
ern
Terri
tory
Aust
ralia
Year
leve
l Me
an sc
ale
scor
e 95
% C
I (+
/–)
Per c
ent
AANM
S St
uden
ts
parti
cipat
ing
Parti
cipat
ion
rate
Mean
scale
scor
e Pe
r cen
t AAN
MS
Me
an sc
ale
scor
e Pe
r cen
t AAN
MS
2008
Year
3 17
3.0
9.7
17.9
476
59.6
30
6.6
62.7
40
0.5
92.1
Year
5 26
2.5
8.7
5.4
446
61.2
40
5.1
62.5
48
4.4
91.0
Year
7 33
9.0
9.1
14.5
392
53.5
46
8.4
67.1
53
6.5
94.2
Year
9 36
9.3
12.5
7.7
196
45.0
52
4.2
69.9
57
8.0
92.9
2009
Year
3 20
5.3
7.8
27.9
692
86.8
32
2.2
68.5
41
0.8
93.7
Year
5 28
7.0
7.9
12.9
581
90.6
42
0.6
65.4
49
3.9
91.7
Year
7 36
5.1
7.8
17.0
423
85.1
48
3.0
70.9
54
1.1
94.0
Year
9 38
3.6
12.5
9.3
236
67.8
52
6.3
69.1
58
0.5
92.2
2010
Year
3 20
7.9
9.3
40.7
602
71.2
32
8.2
70.3
41
4.3
93.9
Year
5 28
7.4
9.3
14.3
568
73.6
41
2.0
64.6
48
7.3
91.3
Year
7 38
1.2
7.0
18.5
444
69.1
48
7.8
71.6
54
6.0
94.8
Year
9 40
4.2
11.1
10.5
267
52.9
52
3.5
68.2
57
3.6
90.7
AANM
S =
at or
abov
e the
natio
nal m
inimu
m sta
ndar
d No
te:
Partic
ipatio
n and
per c
ent a
t or a
bove
natio
nal m
inimu
m sta
ndar
d inc
ludes
exem
pt stu
dents
. The
se st
uden
ts ar
e not
includ
ed w
hen c
alcula
ting t
he m
ean s
cale
scor
e. So
urce
: Fig
ures
for N
TER
scho
ols fr
om N
T DE
T; fig
ures
for N
orthe
rn T
errito
ry an
d Aus
tralia
from
Aus
tralia
n Cur
riculu
m As
sess
ment
and R
epor
ting A
uthor
ity (A
CARA
), Na
tiona
l Ass
essm
ent P
rogr
am—
Liter
acy a
nd N
umer
acy:
Achie
vem
ent in
read
ing, w
riting
, lang
uage
conv
entio
ns a
nd n
umer
acy,
ACAR
A, S
ydne
y, 20
10.

314 Northern Territory Emergency Response: Evaluation Report 2011
Tabl
e 8.
6 A
ggre
gate
NA
PLA
N N
umer
acy
resu
lts fo
r stu
dent
s at
tend
ing
scho
ols
in th
e N
TER
com
mun
ities
, all
Nor
ther
n Te
rrito
ry s
choo
ls a
nd a
ll A
ustr
alia
n sc
hool
s, 2
008
to 2
010
NT
ER sc
hool
s
North
ern
Terri
tory
Aust
ralia
Year
leve
l Me
an sc
ale
scor
e 95
% C
I (+
/–)
Per c
ent
AANM
S St
uden
ts
parti
cipat
ing
Parti
cipat
ion
rate
Mean
scale
scor
e Pe
r cen
t AAN
MS
Me
an sc
ale
scor
e Pe
r cen
t AAN
MS
2008
Year
3 24
7.9
6.6
32.4
500
62.7
33
8.4
77.0
39
6.9
95.0
Year
5 32
7.6
5.7
19.6
470
64.5
41
6.3
69.1
47
5.9
92.7
Year
7 39
5.7
5.9
26.9
420
57.3
48
8.1
75.9
54
5.0
95.4
Year
9 42
6.3
9.0
16.6
193
44.3
53
2.6
74.1
58
2.2
93.6
2009
Year
3 21
6.3
7.3
25.6
667
83.7
32
2.4
70.4
39
3.9
94.0
Year
5 33
3.8
6.0
30.4
566
88.3
42
9.6
73.5
48
6.8
94.2
Year
7 39
0.7
6.6
24.7
425
85.5
48
5.2
74.8
54
3.6
94.8
Year
9 43
5.5
8.9
24.8
242
69.5
53
9.7
76.2
58
9.1
95.0
2010
Year
3 23
4.1
6.8
31.3
600
70.9
32
8.4
72.2
39
5.3
94.2
Year
5 32
5.3
6.6
21.7
543
70.3
42
1.4
69.5
48
8.7
93.6
Year
7 38
0.1
7.8
21.0
481
74.8
48
6.1
72.2
54
7.7
95.0
Year
9 43
1.8
7.6
16.2
253
50.1
53
0.0
71.2
58
4.9
93.1
AANM
S =
at or
abov
e the
natio
nal m
inimu
m sta
ndar
d No
te:
Partic
ipatio
n and
perce
ntage
at or
abov
e nati
onal
minim
um st
anda
rd in
clude
exem
pt stu
dents
. Tho
se st
uden
ts ar
e not
includ
ed w
hen c
alcula
ting t
he m
ean s
cale
scor
e. So
urce
: Fig
ures
for N
TER
scho
ols fr
om N
T DE
T; fig
ures
for N
orthe
rn T
errito
ry an
d Aus
tralia
from
Aus
tralia
n Cur
riculu
m As
sess
ment
and R
epor
ting A
uthor
ity (A
CARA
), Na
tiona
l Ass
essm
ent P
rogr
am—
Liter
acy a
nd N
umer
acy:
Achie
vem
ent
in re
ading
, writ
ing, la
ngua
ge co
nven
tions
and
num
erac
y, AC
ARA,
Syd
ney,
2010
.

Enhancing education
Northern Territory Emergency Response: Evaluation Report 2011 315
Figure 8.4 NAPLAN Reading: mean scale scores, by year level, NTER schools, 2008 to 2010
150
175
200
225
250
275
300
325
350
375
400
425
450
2008 2009 2010
Mean NAPLAN scale score
Year 9
Year 7
Year 5
Year 3
Figure 8.5 NAPLAN Reading: percentage of students at or above national minimum standard in NTER schools, by year level, 2008 to 2010
0
5
10
15
20
25
30
35
40
45
Year 3 Year 5 Year 7 Year 9
Percen
tage of stude
nts at or ab
ove na
tion
al
minim
um stan
dard
2008 2009 2010

Enhancing education
316 Northern Territory Emergency Response: Evaluation Report 2011
Figure 8.6 NAPLAN Reading: participation rates in NTER schools, by year level, 2008 to 2010
0
10
20
30
40
50
60
70
80
90
100
Year 3 Year 5 Year 7 Year 9
Percen
tage of stude
nts pa
rticipating in NAPLAN
2008 2009 2010
Figure 8.7 NAPLAN Numeracy: mean scale scores in NTER schools, by year level, 2008 to 2010
150
175
200
225
250
275
300
325
350
375
400
425
450
2008 2009 2010
Mean NAPLAN scale score
Year 9
Year 7
Year 5
Year 3

Enhancing education
Northern Territory Emergency Response: Evaluation Report 2011 317
Figure 8.8 NAPLAN Numeracy: percentage of students at or above national minimum standard in NTER schools, by year level, 2008 to 2010
0
5
10
15
20
25
30
35
40
45
Year 3 Year 5 Year 7 Year 9
Percen
tage of stude
nts at or ab
ove na
tion
al
minim
um stan
dard
2008 2009 2010
Figure 8.9 NAPLAN Numeracy: participation rates in NTER schools, by year level, 2008 to 2010
0
10
20
30
40
50
60
70
80
90
100
Year 3 Year 5 Year 7 Year 9
Percen
tage of stude
nts pa
rticipating in NAPLAN
2008 2009 2010

Enhancing education
318 Northern Territory Emergency Response: Evaluation Report 2011
NTER schools showed little change in NAPLAN Numeracy between 2008 and 2010. As identified for Reading, participation in the Numeracy tests increased dramatically between 2008 and 2009, then dropped in 2010.
NAPLAN Writing Students in NTER schools achieved much lower results in NAPLAN Writing than in Reading and Numeracy.928 Results for NAPLAN Writing are shown in Table 8.7, Figure 8.10, Figure 8.11 and Figure 8.12, following the pattern of the presentations for NAPLAN Reading and Numeracy.
For each of the four year levels assessed, there is very little difference between mean scale scores in Writing between 2008 and 2010, with some slight decreases in 2009 in Years 3, 5 and 9. The percentage of students at or above the national minimum standard was highest in 2010 for students in Year 3, Year 7 and Year 9. At all year levels, the mean scale score for students in NTER schools was more than three standard deviations below the Australian mean scale score.
NTER schools showed little improvement in NAPLAN Writing between 2008 and 2010, and their results are well below the results for all Northern Territory schools and all Australian schools. There have been small improvements in the percentage of students at or above the national minimum standard for all NAPLAN year levels, but when the numbers of students are taken into account those increases are negligible for Year 5 (six students), Year 7 (two students) and Year 9 (four students); in Year 3, the number of students at or above the national minimum standard has increased by about 18.
As for NAPLAN Reading and Numeracy, participation in the NAPLAN Writing task was highest in 2009.
NAPLAN participation NAPLAN participation rates were low in schools in the NTER communities compared to other schools. In the three years for which data are available, participation rates were highest in 2009 at between 80 and 90 per cent. Participation in 2010 was around 70 per cent. In all Northern Territory schools in 2010, participation rates ranged from 83 per cent among Year 9 students to 91 per cent among Year 7 students. Nationally in 2010, participation rates ranged from 93 per cent among Year 9 students to 96 per cent among Year 5 students.
With low participation rates and generally small cohorts in the NTER schools, results are subject to greater fluctuation between years than are results for all Northern Territory students and all Australian students.
928 Although scale scores are not directly comparable across domains, differences between the NTER means and Northern Territory and national means are much greater in Writing than in the other domains. Similarly, the national minimum standard for each domain is set independently, so the percentage of students at or above national minimum standard is not directly comparable across domains.

Northern Territory Emergency Response: Evaluation Report 2011 319
Enha
ncing
educ
ation
Tabl
e 8.
7 A
ggre
gate
NA
PLA
N W
ritin
g re
sults
for s
tude
nts
atte
ndin
g sc
hool
s in
the
NTE
R c
omm
uniti
es, a
ll N
orth
ern
Terr
itory
sch
ools
and
all
Aus
tral
ian
scho
ols,
200
8 to
20
10
NT
ER sc
hool
s
North
ern
Terri
tory
Aust
ralia
Year
leve
l Me
an sc
ale
scor
e 95
% C
I (+
/–)
Per c
ent
AANM
S St
uden
ts
parti
cipat
ing
Parti
cipat
ion
rate
Mean
scale
scor
e Pe
r cen
t AAN
MS
Me
an sc
ale
scor
e Pe
r cen
t AAN
MS
2008
Year
3 20
3.4
7.4
19.4
494
61.9
33
7.4
73.7
41
4.2
95.4
Year
5 26
0.3
8.4
7.8
462
63.4
41
0.9
66.3
48
6.5
92.6
Year
7 28
5.9
10.2
6.4
389
53.1
45
5.0
63.6
53
3.7
91.8
Year
9 29
5.6
14.0
3.1
191
43.8
52
4.2
63.3
57
8.0
87.2
2009
Year
3 19
6.6
6.6
20.8
712
89.3
33
7.7
74.0
41
4.5
95.7
Year
5 24
4.7
8.1
9.3
592
92.4
40
9.4
66.2
48
4.7
93.0
Year
7 28
2.9
9.7
6.3
445
89.5
45
8.7
66.7
53
2.4
92.5
Year
9 28
3.2
14.0
3.4
268
77.0
52
6.3
63.1
58
0.5
87.8
2010
Year
3 20
3.2
7.3
22.3
618
73.0
33
1.0
73.1
41
8.6
95.6
Year
5 25
0.5
8.6
8.8
560
72.5
39
8.5
64.0
48
5.2
93.1
Year
7 29
2.0
9.3
6.9
464
72.2
44
9.3
62.9
53
3.4
92.6
Year
9 29
9.9
14.5
5.4
260
51.5
52
3.5
60.3
57
3.6
87.2
AANM
S =
at or
abov
e the
natio
nal m
inimu
m sta
ndar
d No
te:
Partic
ipatio
n and
perce
ntage
at or
abov
e nati
onal
minim
um st
anda
rd in
clude
s exe
mpt s
tuden
ts. T
hose
stud
ents
are n
ot inc
luded
whe
n calc
ulatin
g the
mea
n sca
le sc
ore.
Sour
ce:
Figur
es fo
r NTE
R sc
hools
from
NT
DET;
figur
es fo
r Nor
thern
Ter
ritory
and A
ustra
lia fr
om A
ustra
lian C
urric
ulum
Asse
ssme
nt an
d Rep
ortin
g Auth
ority
(ACA
RA),
Natio
nal A
sses
smen
t Pro
gram
—Lit
erac
y and
Num
erac
y: Ac
hieve
men
t in
read
ing, w
riting
, lang
uage
conv
entio
ns a
nd n
umer
acy,
ACAR
A, S
ydne
y, 20
10.
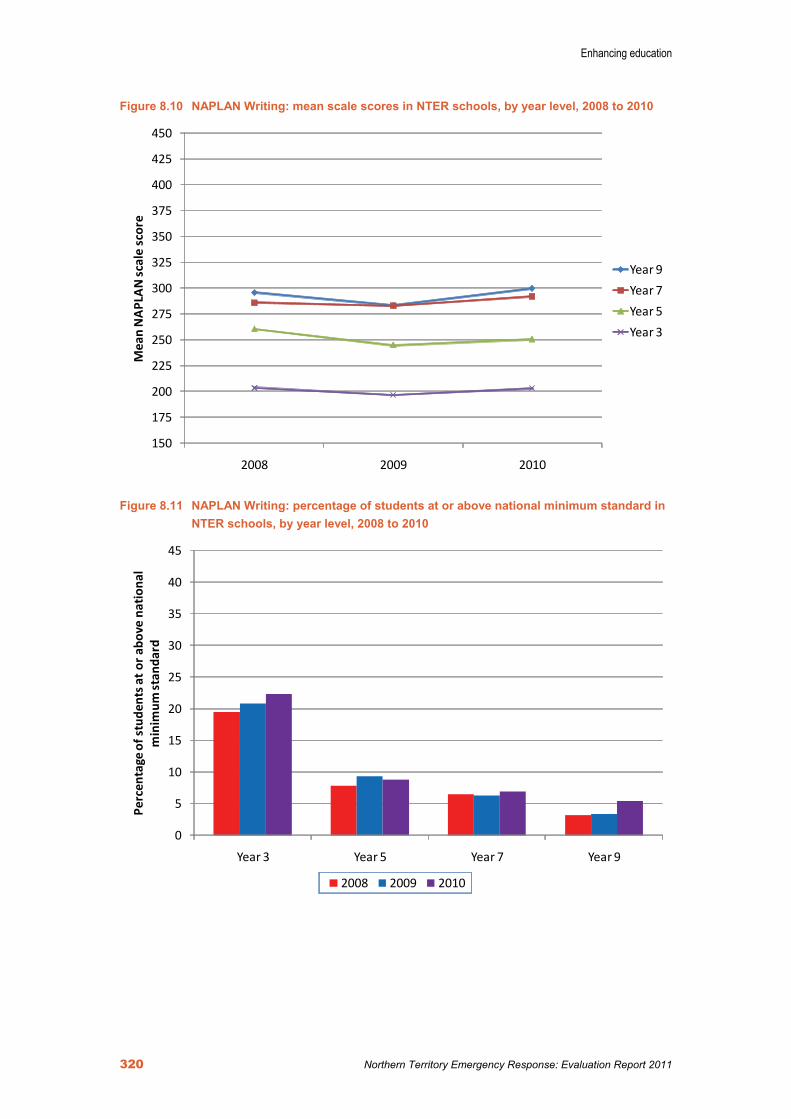
Enhancing education
320 Northern Territory Emergency Response: Evaluation Report 2011
Figure 8.10 NAPLAN Writing: mean scale scores in NTER schools, by year level, 2008 to 2010
150
175
200
225
250
275
300
325
350
375
400
425
450
2008 2009 2010
Mean NAPLAN scale score
Year 9
Year 7
Year 5
Year 3
Figure 8.11 NAPLAN Writing: percentage of students at or above national minimum standard in NTER schools, by year level, 2008 to 2010
0
5
10
15
20
25
30
35
40
45
Year 3 Year 5 Year 7 Year 9
Percen
tage of stude
nts at or ab
ove na
tion
al
minim
um stan
dard
2008 2009 2010

Enhancing education
Northern Territory Emergency Response: Evaluation Report 2011 321
Figure 8.12 NAPLAN Writing: participation rates in NTER schools, by year level, 2008 to 2010
0
10
20
30
40
50
60
70
80
90
100
Year 3 Year 5 Year 7 Year 9
Percen
tage of stude
nts pa
rticipating in NAPLAN
2008 2009 2010
Individual school results While there is evidence of improvement in NAPLAN results in the domain of Reading and little if any change in Numeracy and Writing, there are some schools in which NAPLAN results have shown improvement in more than one domain. It is important to recognise that because the majority of NTER schools have small enrolments, especially at any one year level, changes from one year to the next may appear extreme. Some of the results reported in this section should be treated with caution, although most schools cited had relatively large enrolments in the tested year levels.
In mean scale scores, only one school at one year level recorded continuous improvement from 2008 to 2009 and from 2009 to 2010 across the three NAPLAN domains of reading, numeracy and writing. The mean scale score of Year 3 students at Ramingining School improved in Reading from 43 to 282, in Numeracy from 206 to 264 and in Writing from 190 to 318. In 2010, 56 per cent of students were at or above the national minimum standard in Reading, 20 per cent in Numeracy and 78 per cent in Writing. The mean scale scores in 2010 for Ramingining Year 3 students were above the means for all NTER schools by close to one standard deviation, but still below the means for all Northern Territory schools.
In a number of other schools, there has been continuous improvement over the three years of NAPLAN testing, although not necessarily across all three domains. There is evidence of improvement in Reading in three year levels at Alcoota School, Ltyentye Apurte CEC, Mamaruni School, Maningrida School, Ngukurr School and Shepherdson College, and improvement in Writing in three year levels in Nganamarriyanga School. Schools in which there were smaller, less pronounced signs of improvement across domains and year levels include Yirrkala School, Bulla Camp School and Murray Downs School.
Of the schools identified above as showing continuous improvement in NAPLAN Reading, Numeracy and/or Writing, some had been targeted under the Enhancing Literacy sub-
Enhancing education
322 Northern Territory Emergency Response: Evaluation Report 2011
measure in 2008, but some were not.929 In addition, some schools eligible to participate in the Enhancing Literacy sub-measure showed no improvement in the NAPLAN tests.
Summary of NAPLAN results There has been some improvement over the period from 2008 to 2010 among students attending schools in the NTER communities in the NAPLAN Reading domain, but no real improvement in the Numeracy and Writing domains. The improvement in Reading is most evident among Year 3 students, who showed impressive improvements in the percentage of students at or above national minimum standard. It seems probable that the focus on early literacy—including under the sub-measure of Enhancing Literacy/Enhancing Education—has had a positive effect on student achievement at Year 3 in the NTER schools, and that the lack of focus on numeracy to date has led to little if any improvement in students’ numeracy.930
There is also a probability that results in Year 3 Numeracy have improved over the period from 2008 to 2010, notwithstanding the higher results in 2008. As noted above, results for Year 3 Numeracy in most jurisdictions of Australia were higher in 2008 than in subsequent years. In the NTER schools, however, from 2009 to 2010 the improvement was 18 scale score points and 6 percentage points at or above the national minimum standard, both of which were greater than the improvements for both the Northern Territory and Australia over the same two years.
Nevertheless, with relatively small numbers of students involved (around 600 in Year 3 and fewer in other year levels), NAPLAN results may vary with no explanation other than ‘volatility’. Combined with relatively low participation rates and only three years of data, the discussion of ‘trends’ is tentative at best. Data are required for subsequent years before more substantive conclusions about changes in NAPLAN results can be made.931
Effects of the NTER on school enrolments and attendance
School enrolments Although it is not possible to determine accurately the number of non-enrolled school-aged children in the NTER communities, it has been estimated for the Northern Territory as a whole that as many as 2,000, or 13 per cent, of Indigenous school-aged children (aged 5 to 14 years) are not enrolled in school.932 Such estimates must be viewed with caution, because while it is easy to know how many young people are enrolled at a point in time, it is difficult to establish the number of young people in the population at the same time. In this section, enrolments are discussed as absolute numbers rather than as percentages of the school-aged population because of the unavailability of reliable data on the numbers of school-aged children in each year level. The NTER monitoring reports took the same approach.
In schools serving the NTER communities, aggregate school enrolments in three levels—Primary (Transition to Year 6), Middle Years (Year 7 to Year 9) and Senior Years (Year 10 to
929 FaHCSIA, Submission of background material to the NTER Review Board, op. cit. 930 Over time, the Enhancing Literacy sub-measure, in both the NTER national agreement and the Closing the Gap National Partnership Agreement (under the Smarter Schools National Partnership), has included and excluded numeracy as a focus. The 2010 annual report on the Smarter Schools National Partnerships includes a focus on numeracy as well as literacy, particularly for students receiving English as a second language support. 931 A change in the genre used for the NAPLAN Writing task has resulted in a change in reporting, so that time series data on Writing are split into separate tables for Narrative Writing (2008–2010) and Persuasive Writing (2011). See ACARA, NAPLAN summary report 2011, Sydney, 2011. 932 H. Bath, op. cit.

Enhancing education
Northern Territory Emergency Response: Evaluation Report 2011 323
Year 12)—increased from 2006 to 2010.933 Table 8.8 shows that combined enrolments increased from 7,114 in 2006 to 7,861 in 2010, an increase of 11 per cent. Annual enrolments for each level are shown separately in Figure 8.13, as well as in Table 8.8. Since 2008, when Year 7 was re-grouped with the Middle Years, Primary level enrolments have increased from 5,409 to 5,597, a 3 per cent increase. Middle Years enrolments have been relatively steady from 2008 to 2010, increasing by only 37 students (2%). Enrolments in the Senior Years, however, decreased from 819 in 2008 to 744 in 2010, or 9 per cent. Some of the decrease in the senior years may be because parents are choosing to send students to schools outside their local communities, which involves boarding at either school-run facilities or independent accommodation, but that information is not available.
Figure 8.13 Enrolments in NTER schools, by school level, 2006 to 2010
0
1000
2000
3000
4000
5000
6000
7000
Primary (T‐6) Middle Years (7‐9) Senior Years (10‐12)
Num
ber of stude
nts en
rolled
2006 2007 2008 2009 2010
Source: NT DET.
Table 8.8 Enrolments in NTER schools, by level of schooling, 2006 to 2010
Level of schooling 2006 2007 2008 2009 2010 Primary (Transition–Year 6) 5,555 5,792 5,409 5,551 5,597 Middle Years (Years 7–9) 1,146 859 1,484 1,455 1,521 Senior Years (Years 10–12) 412 781 819 686 744 Total 7,114 7,432 7,712 7,692 7,861 Note: Enrolments are ‘average enrolments’ and are based on the current groupings of year levels. Columns may not sum to totals shown
because of rounding. Source: NT DET.
This decline may also reflect an Australia-wide trend identified by the Australian Bureau of Statistics, in that those who are not enrolled tend to be in the secondary years of school, when young people are more likely to disengage from school (or in the very early years of school, when parents choose to delay the start of school). For the Australian population as a
933 It should be noted that between 2007 and 2008 the grouping of year levels changed in Northern Territory schools: Year 7 was transferred from Primary to Middle Years (formerly Junior Secondary, Years 7–9), and Year 10 moved from Junior Secondary to Senior Years (formerly Senior Secondary, Years 11–12). Data from NT DET were provided using these current groupings (see Table).

Enhancing education
324 Northern Territory Emergency Response: Evaluation Report 2011
whole, Indigenous student enrolments in the early years of schooling tend to be less of a problem—the Australian Bureau of Statistics reported that in 2006 ‘the school enrolment rate for Indigenous children aged five to eight years (97%) was similar to that for non-Indigenous children (94%) [in all of Australia]’.934
Data on preschool enrolments are available for those preschools associated with schools in the NTER communities. Between 2006 and 2010, enrolments at those preschools decreased from a total of 986 to 837 (see Table 8.9). As with school enrolments, it is not possible to calculate an annual rate of participation because the precise number of children eligible for preschools (based on the estimated resident population each year) is unknown.
Table 8.9 Enrolments in preschools attached to schools serving NTER communities, by type of preschool, 2006 to 2010
Level of schooling 2006 2007 2008 2009 2010 Preschool 986 917 879 912 837 Source: NT DET.
Student attendance The Northern Territory Board of Inquiry into the Protection of Aboriginal Children from Sexual Abuse stated in the ‘Little children are sacred’ report that it was ‘dismayed at the miserable school attendance rates for Aboriginal children’.935 Attendance rates were around 64 per cent for Indigenous students in very remote areas of the Northern Territory in June 2007 and 62 per cent in June 2008.936 A 60 per cent attendance rate is equivalent to attending school three days per week, on average, but that is an average for all students in all schools. The reality is that there are some students who attend fairly regularly (more than 80% of the time) and some who are absent on most days (more than 60% of the time). By comparison, in South Australia in the late 1990s, attendance rates for Indigenous students were around 85 per cent in primary schools and 75–80 per cent in secondary schools, and those rates were much lower than attendance rates for non-Indigenous students. The South Australian analysis also showed that in those schools with low attendance rates and high proportions of Indigenous students—like the NTER schools—the lower attendance rates were a result of a number of individual students with extremely low attendance rates and absenteeism was not a problem for the majority of students.937
Data provided by NT DET show that there are differences in attendance rates by school level, as displayed in Table 8.10. The highest attendance rates are at the Primary level, with rates of 65 per cent in 2006 and 66 per cent in 2007 for NTER schools. In 2008, when Year 7 was moved from the Primary Years to the Middle Years, the attendance rate dropped 2 percentage points to 64 per cent. In 2010, the rate in the Primary Years was 60 per cent. Among students in the Middle Years, the rate was highest in 2006 (61%), relatively steady from 2007 to 2009, but then dropped 4 percentage points to 55 per cent in 2010. Attendance rates in the Senior Years dropped from 59 per cent in 2006 to 45 per cent in 2010.
934 ABS, Year Book Australia, 2008, cat. no. 1301.0, ABS, Canberra, 2008. 935 P. Anderson & R. Wild. op. cit., p. 18. 936 FaHCSIA, Northern Territory Emergency Response whole of government monitoring report, August 2007 to 30 June 2008, FaHCSIA, Canberra, 2008. 937 S. Rothman, ‘Student absence in South Australian schools’, The Australian Educational Researcher, vol. 29, no. 1, 2002, pp. 69–92. This analysis used data for only Term 2 in two different years, 1997 and 1999.

Enhancing education
Northern Territory Emergency Response: Evaluation Report 2011 325
Table 8.10 Student attendance rate in NTER schools, by level of schooling, 2006 to 2010
Level of schooling 2006 2007 2008 2009 2010 Primary (Transition–6) 64.6 65.7 63.6 64.0 60.3 Middle Years (7–9) 61.0 58.4 58.7 59.0 55.0 Senior Years (10–12) 59.4 53.8 47.8 48.4 44.7 Source: NT DET.
Figure 8.14 highlights the patterns in attendance during the period. At all levels, there was virtually no change between 2008 and 2009 after the realignment of year levels into the present arrangement of levels of schooling, but in 2010 there was another decrease in attendance rates of 4 percentage points at each level of schooling.
Figure 8.14 Student attendance rate in NTER schools, by school level, 2006 to 2010
0
10
20
30
40
50
60
70
Primary (T‐6) Middle Years (7‐9) Senior Years (10‐12)
Atten
dance rate (%
)
2006 2007 2008 2009 2010
Most of the NTER communities are in areas that can be severely affected by the weather. After many years of dry or average weather conditions in much of the Northern Territory, 2010 was extremely wet, and nearly all locations received above-average rainfall for the year. Much of the southern part of the Northern Territory, where many of the NTER communities are located, had rainfall considered ‘very much above average’ or ‘highest on record’ during the year: some locations recorded as much as 12 times the mean monthly rainfall during July, August, September and October in 2010.938 It is possible that the decreases in attendance rates in 2010 were associated with the extremely wet weather during that year, but the effects of rain may differ by community.939 More detailed analysis of attendance data—including reasons for absences—and weather data from 2011 will be required to determine the effects of extreme rainfall on student attendance, whether there has been a decline in student attendance and, if so, whether that decline is a perturbation in attendance rates.
938 Australian Bureau of Meteorology, Climate data online, Available at: <http://www.bom.gov.au/climate/data/index.shtml?bookmark=200>. 939 The relationship between weather patterns and school attendance is perplexing. In some remote communities, the inaccessibility caused by excessive rain means less mobility between communities; however, while this means that more children are in the communities, many may not attend during rainy periods. In other communities, attendance increases because of decreased mobility.

Enhancing education
326 Northern Territory Emergency Response: Evaluation Report 2011
Conclusion Provision of access to high-quality education services in remote communities poses a number of difficult challenges. They include difficulties in attracting and retaining qualified teaching staff, and access by tradespeople to address basic infrastructure maintenance. Road access can be limited during some times of the year, and during the wet season schools may be inaccessible for many children. Internet services, if they are available, are usually slow. Remote communities are typically small, and populations highly mobile. The Australian Bureau of Statistics reported that at the time of the 2006 census in the Northern Territory there were 559 discrete Indigenous communities in very remote locations, and that 80 per cent of them had populations of fewer than 50.940
The long-term goal of the Enhancing Education measure of the NTER is for children to perform better at school (see the program logic in Figure 8.1). That goal includes improved literacy and numeracy skills, full engagement in schooling and strong community support for school. A better qualified teaching staff, more stable teaching staff, improved infrastructure and adequately fed students are designed to result directly from the measures implemented under the NTER and to lead to the goal of improved student performance. This evaluation has examined progress on the immediate and intermediate outcomes and examined in-depth data on aspects of literacy and numeracy assessments to determine progress in attaining the long-term goal of improved student outcomes.
It is clear that the NTER and other Australian Government and Northern Territory Government programs have contributed to a substantial increase in resources allocated to schools serving the NTER communities. There have been increases in infrastructure, such as new classrooms and other facilities, as well as teacher housing, which is intended to attract teachers to remote schools and retain them longer; in teacher professional support, through specific literacy teaching initiatives and support for working with English as a second language learners; in preschool programs, which are intended to influence school readiness and early learning; and in support for student wellbeing, by providing healthy meals at school to ensure that children are adequately nourished each school day. What is not clear, however, is how each sub-measure has contributed to the long-term goal of improved student performance.
What can be said about each of the sub-measures individually is that new school buildings have been completed, as have many other school building projects under the BER program; teacher support programs are in place to further develop teaching staff in the NTER schools and to attract Indigenous people into teaching; early childhood programs have been implemented in a number of communities to prepare children for school, but it is not possible to determine what proportion of children are enrolled in those preschool programs; and school nutrition programs are feeding children at school, although in many cases the school nutrition program may be the only source of nutritious food for children during the day.
At this time, it is too early to determine the effects of efforts to improve the quality of teaching on student outcomes (there has been little opportunity as yet for new teachers to enter the NTER schools), for the effects of professional development to flow through to the classroom or for new teacher housing to influence teacher turnover or the quality of teaching. Similarly, it is not yet possible to determine if the school nutrition program and improved infrastructure have had any effect on student outcomes, as these have longer term, mediated effects rather than direct effects on learning.
940 ABS, Housing and infrastructure in Aboriginal and Torres Strait Islander communities, Australia, cat. no. 4710.0, ABS, Canberra, 2006.
Enhancing education
Northern Territory Emergency Response: Evaluation Report 2011 327
As for the long-term goal of improving student performance in literacy and numeracy, there is evidence of improvement already occurring among Year 3 students in the NTER schools. That improvement is greater than the improvement among Year 3 students in all Northern Territory schools and all Australian schools. Over the three years of NAPLAN testing in Australia, the mean scale score for Year 3 Reading in the NTER schools has improved, as has the overall percentage of students who are at or above the national minimum standard. While there is no definitive evidence of improvement in Numeracy or Writing, it is probable that results in Year 3 Numeracy also indicate improvement. And while there has been improvement in Reading at other year levels as well, it is not as pronounced as at Year 3. Considering the focus on education in the early years of schooling, and particularly on literacy, these results are not surprising. Data from subsequent years of NAPLAN testing are required to determine whether the improvements in Year 3 Reading continue and whether the results for Year 3 Numeracy represent sustained improvement. Other data on student performance, in addition to NAPLAN results, are also required.
School enrolments in the primary years have been increasing, although it is not currently possible to determine if the rate of enrolment has changed in the NTER communities. Increased engagement with schooling may have a negative effect on schools’ enrolments: as parents become more concerned about the quality of education for their children, they are more likely to send their children to schools in other locations. This is more likely to occur in the secondary years of schooling—particularly in Years 11 and 12—but there are no data available at this time to determine if the lack of improvement in senior secondary enrolments in the NTER schools is due to that phenomenon.
There has been no observable improvement in school attendance between 2006, before the NTER was introduced, and 2010, the last year for which data are available. There appears to have been a decline in attendance rates in 2010, but it is possible that the decline is related to the extremely wet conditions experienced over most of the Northern Territory during the year. It is also possible that the wet conditions accounted for only a part of the decline and that there has been a decline in attendance rates. Again, more data will be required to determine whether the decline in attendance rates is a disturbing trend or an anomaly resulting from above-average rainfall.
The ability of the NTER to contribute to continued improvement in young people’s educational outcomes will depend in large part on the ability to integrate the NTER measures with other initiatives in the Northern Territory. It is important that successful initiatives introduced through the NTER become mainstream. Teacher professional development programs should continue to focus on classroom practice and educational leadership; education providers should continue to focus on conditions that allow students and teachers to work effectively in the classroom; and preschool programs should continue to provide strategies for children and parents to prepare effectively for active participation in education. While it is not possible to determine the influence of any individual sub-measure on student outcomes, there is evidence of improvement during the short time that the NTER has been operating. And, as these measures are more fully integrated into Northern Territory education, it will be more difficult to ascertain the direct influence of the NTER on student outcomes.

Enhancing education
328 Northern Territory Emergency Response: Evaluation Report 2011
Bibliography Anderson, P and R Wild, Ampe Akelyernemane Meke Mekarle: ‘Little children are sacred’,
Report of the Northern Territory Board of Inquiry into the Protection of Aboriginal Children from Sexual Abuse, Northern Territory Government, Darwin, 2007.
ARTD Consultants & WestwoodSpice, Development of program logic options for the NTER, unpublished report prepared for FaHCSIA, 2010.
Australian Bureau of Statistics (ABS), Housing and infrastructure in Aboriginal and Torres Strait Islander communities, Australia, cat. no. 4710.0, ABS, Canberra, 2006.
Australian Bureau of Statistics (ABS), Year Book Australia, 2008, cat. no. 1301.0, ABS, Canberra, 2008.
Australian Curriculum Assessment and Reporting Authority (ACARA), National Assessment Program—Literacy and Numeracy: Achievement in reading, writing, language conventions and numeracy, ACARA, Sydney, 2010.
Australian Curriculum Assessment and Reporting Authority (ACARA), National Assessment Program—Literacy and Numeracy: NAPLAN summary report. Preliminary results for achievement in reading, writing, language conventions and numeracy, ACARA, Sydney, 2011.
Australian Education Systems Officials Committee, Senior Officials Working Party on Indigenous Education, Directions in Indigenous education 2005–2008, Ministerial Council on Education, Employment, Training and Youth Affairs, Melbourne.
Australian National Audit Office, Multifunctional Aboriginal Children’s Services (MACS) and crèches, ANAO audit report no. 8, Canberra, 2010.
Bath, H, ‘Intervening in the Northern Territory’, invited opinion piece for Developing Practice (in press).
Bourke, CJ, K Rigby & J Burden, Better practice in school attendance: Improving the school attendance of Indigenous students, report prepared for the Australian Government Department of Education, Training and Youth Affairs, Monash University, Clayton, Victoria, 2000.
Buckley, J, M Schneider and Y Shang, The effects of school facility quality on teacher retention in urban school districts, National Clearinghouse for Educational Facilities, Washington DC, 2004.
Charles Darwin University, School for Social and Policy Research Institute of Advanced Studies, Let’s Start: Exploring Together—An early intervention program for Northern Territory children and families: Final evaluation report, Darwin, 2010.
COAG, Closing the Gap in the Northern Territory National Partnership Agreement, Canberra, 2011.
COAG Reform Council, National Partnership Agreement on Literacy and Numeracy: Performance report for 2010, Sydney, 2011.
Cochrane Collaboration, School feeding for improving the physical and psychosocial health of disadvantaged students, 2009.

Enhancing education
Northern Territory Emergency Response: Evaluation Report 2011 329
Commonwealth Grants Commission, General revenue grant relativities: Northern Territory workplace discussions, briefing notes, Commonwealth Grants Commission, 2008.
DEEWR, Findings of the School Nutrition Program stakeholder survey, DEEWR, Canberra, 2009.
DEEWR, School Nutrition Program: Operational guidelines, 1 January 2011 to 30 June 2012, DEEWR, Canberra, 2010.
Dinham, S, L Ingvarson & E Kleinhenz, Investing in teacher quality: Doing what matters most, paper prepared for the Business Council of Australia by the Australian Council for Educational Research, 2008.
Earthman, G, School facility conditions and student academic achievement, UCLA’s Institute for Democracy, Education, & Access (IDEA), Los Angeles, 2002.
FaHCSIA, Northern Territory Emergency Response: One year on, FaHCSIA, Canberra, 2008.
FaHCSIA, Submission of background material to the Northern Territory Emergency Response Review Board, FaHCSIA, Canberra, 2008.
FaHCSIA, Closing the Gap in the Northern Territory monitoring report, July to December 2009, FaHCSIA, Canberra, 2009.
FaHCSIA, Closing the Gap in the Northern Territory monitoring report, July to December 2010, FaHCSIA, Canberra, 2011.
FaHCSIA, Closing the Gap in the Northern Territory monitoring report, January to June 2011, FaHCSIA, Canberra, 2011.
Fullarton, S, Student engagement with school: Individual and school-level influences, LSAY Research Report 27, Australian Council for Educational Research, Camberwell, Victoria, 2002.
Garrett, The Hon Peter, MP, Minister for School Education, Early Childhood and Youth, 20 June 2011, media release, ‘New $5m scheme for teachers in remote communities’, Available at: <http://www.deewr.gov.au/ministers/garrett/media/releases/pages/article_110620_121325.aspx>.
Halpern, D, Social capital, Polity Press, Cambridge, UK, 2005.
Hattie, J, J Biggs & N Purdie, ‘Effects of learning skills interventions on student learning: A meta-analysis’, Review of Educational Research, 1996, vol. 66, no. 2, pp. 99–136.
Ladwig, J & C Sarra, Structural review of the Northern Territory Department of Education and Training: Delivering the goods, Northern Territory Department of Education and Training, Darwin, 2009.
Lock, G, ‘Preparing teachers for rural appointments: Lessons from Australia’, The Rural Educator, vol. 29, no. 2, 2008.
McClure, C, D Redfield & P Hammer, ‘Recruiting and retaining high-quality teachers in rural areas’, AEL Policy Brief, 2003.

Enhancing education
330 Northern Territory Emergency Response: Evaluation Report 2011
Menzies School of Health Research, Early childhood development in the NT: Issues to be addressed, Northern Territory Government, Darwin, 2011
Menzies School of Health Research, ‘Effective integration of family & children’s services’, in ‘Making it Happen’ Parenting Symposium: Symposium report, Northern Territory Government, 2010.
Milburn, C, ‘Wanted: teachers to go the distance’, The Age, 23 August 2010, Available at: <http://www.theage.com.au/national/education/wanted-teachers-to-go-the-distance-20100820-138ot.html#ixzz1SnuHvkqR>.
Northern Territory Department of Education and Training (NT DET), Learning Lessons: An independent review of Indigenous education in the Northern Territory, NT DET, Darwin, 1999.
Northern Territory Department of Education and Training (NT DET), Enhancing Literacy and Quality Teaching Package: Final performance report, NT DET, Darwin, 2009
Northern Territory Emergency Response Review Board, Report of the NTER Review Board, NTER Review Board for FaHCSIA, Canberra, 2008.
Northern Territory Government, Smarter Schools Implementation Plan, Northern Territory Government, Darwin, 2009.
Northern Territory Public Accounts Committee, Report on the provision of school education services for remote Aboriginal communities in the Northern Territory, Darwin, 1996.
Office of Evaluation and Audit, Performance audit of the School Nutrition Program, Australian National Audit Office, Canberra, 2009.
Productivity Commission, Social capital: Reviewing the concept and its policy implications, AusInfo, Canberra, 2003.
Purdie, N & S Buckley, School attendance and retention of Indigenous Australian students, Closing the Gap Clearinghouse Issues Paper No. 1, 2010.
Ready, D, V Lee & K Welner, ‘Educational equity and school structure: School size, overcrowding, and schools-within-schools’, Teachers College Record, vol. 106, no. 10, 2004, pp. 1,989–2,014.
Rothman, S, ‘Student absence in South Australian schools’, The Australian Educational Researcher, vol. 29. no. 1, 2002, pp. 69–92.
Silburn, S, J McKenzie & B Moss, Northern Territory results for the Australian Early Development Index 2009, Menzies School of Health Research & Northern Territory Department of Education and Training, Darwin, 2010.
Simons, R, Schools in their communities, ACER Policy Briefs, Camberwell, Victoria, 2011.
Tennent, L, C Tayler & A Farrell, ‘Social capital and sense of community: What do they mean for young children’s success at school?’, paper presented at the annual conference of the Australian Association for Research in Education, Sydney, 2005.

Enhancing education
Northern Territory Emergency Response: Evaluation Report 2011 331
Uline, C & M Tschannen-Moran, ‘The walls speak: The interplay of quality facilities, school climate, and student achievement’, Journal of Educational Administration, vol. 46, no. 1, 2008, pp. 55–73.
Victorian Department of Education and Early Childhood Development, Research into the connection between built learning spaces and student outcomes: Literature review, Melbourne, 2011.


Welfare reform and employment
Northern Territory Emergency Response: Evaluation Report 2011 333
9 Welfare reform and employment
Colmar Brunton
Key findings This chapter evaluates the welfare reform and employment measures introduced under the Northern Territory Emergency Response (NTER) and the Closing the Gap in the Northern Territory National Partnership Agreement (NTNPA).
Welfare reform
Strengths/achievements
• There is some evidence suggesting welfare reform had some positive effects, such as strengthening communities and making them more sustainable and safer, particularly for women and children. However, given the limitations of the evaluations and consultations conducted to date, further research is necessary to confirm these findings.
• Income management may have also contributed to healthier children who have more access to food, enhanced community wellbeing with less humbugging (harassment for money) and less cash being available for gambling, cigarettes and substance abuse, and more spending by families on priority goods.
• The licensing of community stores resulted in a greater quantity and wider range of healthy foods being available for community members.
Limitations of outcomes
• Income management reduced some people’s access to travel and ability to contribute to cultural and family obligations. This was particularly evident in the early days of income management. Ongoing improvements to the program, such as the introduction of the BasicsCard, have mitigated these issues to some extent.
• There was much confusion during the implementation phase of income management due to the speed of implementation and a lack of adequate communication and consultation. Furthermore, determining a customer’s BasicsCard balance continues to be a major issue for many stores and people on income management.
• Prices in remote stores increased after the introduction of community stores licensing and there is a risk that these price increases may have reduced community members’ ability to access the greater quantity and wider range of healthy food that is now available. However, the cause of the price increases over this period is unclear and requires further investigation. It may be due to store licensing and/or may be a result of increased fuel prices and transport costs. In addition, taking over stores that were already in difficulty may have also contributed to the price increases rather than the licensing scheme itself.
• The compulsory nature of income management and its blanket imposition—in combination with other changes, such as local government reform, shire amalgamation and loss of local councils; changes to the Community Development Employment Projects (CDEP) program; the loss of the permit system; and changes in land tenure—are likely to have contributed to people’s feeling of a loss of freedom, empowerment and community control. This may have resulted in a generalised lack of engagement in many of the

Welfare reform and employment
334 Northern Territory Emergency Response: Evaluation Report 2011
programs and initiatives introduced under the NTER and NTNPA. This highlights the importance of moving away from a ‘one size fits all’ and/or a ‘fly in, fly out’ model towards an ‘on the ground’ presence that works with local authority structures, builds on approaches that are already working and encourages local Indigenous social and cultural ownership.
Employment measures
Strengths/achievements
• It is hard to assess the effectiveness of employment measures because of a lack of data on employment outcomes in prescribed areas due to program changes and changes in the way data were collected before and after the introduction of the new employment services from 1 July 2009. However, it is clear that the employment measures, particularly the conversion of CDEP jobs, has resulted in some gains in employment. Under the Northern Territory Jobs Package (NTJP), 2,241 ongoing jobs were created in Australian and Northern Territory government positions.
• In addition, between July 2007 to December 2010 more than 4,100 job placements were brokered via Job Network and Job Services Australia (JSA) providers in prescribed areas. In the six months from 1 July 2010 to 31 December 2010, 908 job placements were achieved, which was a 55 per cent increase compared to the same period in 2009.
• The recently completed Community Safety and Wellbeing Research Study (CSWRS) found that better employment opportunities were the most frequently cited reason for people feeling that their own lives were improving and that their community was on the way up.
Limitations of outcomes
• However, the economic sustainability of the CDEP job conversions is questionable, given that most are related to community services. Although public sector employment is valid and necessary and has important multiplier effects beyond the number of actual positions created, it very much depends on ongoing government funding. In addition, while it was assumed that training and work experience would enhance career mobility beyond the entry-level jobs created, limited employment opportunities combined with a lack of NTJP funding mean there is little chance of career progression or mobility.941 Conditions such as the provision of ongoing funding, Indigenous staff retention levels and continued pre- and post-employment support need ongoing monitoring to determine the long-term impact of these jobs on improving Indigenous economic participation.
• Whole-of-government coordination remains a key challenge in the delivery of employment services. An ‘on the ground’ presence with expert knowledge of employment and associated services is required to ensure effective service coordination and tailoring to the needs of local job seekers and communities.942
941 Australian National Audit Office (ANAO), Indigenous employment in government service delivery, audit report no.4 2011–12, p. 23. ‘Service providers also raised concerns that funding under the initiatives does not provide scope to advance employees to higher duties or recognise the skills obtained from the training component of the packages.’ 942 While Government Business Managers (GBMs) and Indigenous Engagement Officers (IEOs) provide an ‘on the ground’ presence in most communities, their role does not extend to this kind of whole-of-government coordination of employment and related services.

Welfare reform and employment
Northern Territory Emergency Response: Evaluation Report 2011 335
• Without sustainable economic development, the effectiveness of employment measures was always going to be limited in terms of reducing unemployment in prescribed areas. Sustainable economic development would require the removal of barriers to genuine commercial ventures, such as poor transport infrastructure, inadequate education/training services (which currently fail to engage people) and current land tenure arrangements (which fail to provide long-term leases necessary for organisations to be assured of a reasonable return on investment). Enabling initiatives would also be required, such as comprehensive mobility programs (that successfully engage job seekers), the enshrinement of the merit principle as the sole basis for employment, and Commonwealth procurement guidelines that relax mandatory procurement procedures for Indigenous-owned enterprises (note that this change to procurement practices is now in place).
Introduction This chapter evaluates the welfare reform and employment measures introduced under the NTER and the NTNPA. The overall aim is to assess outcomes relating to improving the sustainability of prescribed areas through employment pathways and welfare reforms by examining welfare reform and employment measures.943
Four sub-measures originally initiated under the welfare reform and employment measures are examined in depth in this chapter:
• Income management and licensing of community stores
• Increased participation opportunities for people on income support in NTER communities
• CDEP transition to jobs and employment services
• Establishment of Community Employment Brokers (CEBs).944
Methodology/approach The research for this chapter used a desktop methodology involving a review of 63 documents to inform the evaluation of welfare reform and employment measures introduced under the NTER and NTNPA. The documents reviewed (see Bibliography at the end of this chapter) were sourced online and with the help of the Department of Families, Housing, Community Services and Indigenous Affairs (FaHCSIA) and the Department of Education, Employment and Workplace Relations (DEEWR).
Background and overview This section examines the component parts and program logic945 of the welfare reform and employment measures. It also briefly examines how those measures evolved over time. As an adjunct to this section, more information can be found on how the measures evolved over time in Appendix 9.A, and more contextual information can be found in Appendix 9.B.
943 This chapter focuses on the period from July2007 to June 2010, when income management was part of the NTER. Changes associated with policies since July 2010 (e.g. the introduction of new income management) are out of scope. 944 NTER Review Board, Northern Territory Emergency Response Report of the NTER Review Board, 2008, p. 109. 945 Program logic refers to causal models that link program inputs and activities to a chain of intended outcomes. Program logic can provide a conceptual structure for an evaluation framework as well as highlighting key assumptions behind a particular program, initiative or range of measures. See ARTD Consultants & Westwood Spice, Development of program logic options for the NTER, unpublished report prepared for FaHCSIA, 2010, p. 5.

Welfare reform and employment
336 Northern Territory Emergency Response: Evaluation Report 2011
Readers who are unfamiliar with this material are strongly advised to read those appendices before reading the following sections of this chapter.
Welfare reform Income management and the licensing of community stores were part of a suite of measures (that also included law and order, alcohol restrictions, land lease and reform, coordinated service delivery and resetting the relationship with Indigenous communities) designed to enable and support stable community functioning and to promote personal responsibility and positive community norms. Those conditions in turn should have contributed to the desired NTER/NTNPA outcomes of enhanced safety, health and wellbeing of children and other vulnerable community members.946
Income management
Income management was one of the key welfare reforms introduced under the auspices of the NTER. Essentially, income management works by putting aside a portion of a welfare payment (usually 50% of most income support and family assistance payments and 100% of advances, lump-sum payments and the Baby Bonus) to ensure that this money is available for priority items such as food, clothing, rent, utilities and transport.947 Income-managed funds cannot be spent on excluded items such as alcohol, tobacco, pornography or gambling services.
There are alternative models of income management. For example, in Western Australia, income management can be made mandatory in cases involving child protection (where the Western Australian Government recommends income management based on an assessment that the person’s poor financial skills have contributed to child neglect), and can also be accessed on a voluntary basis. In Queensland’s Cape York, income management is used as a tool of last resort by the Family Responsibilities Commission where a person is assessed as failing to meet their personal and social responsibilities, for example to properly care for their children or pay rent. Each case is examined and individual income management arrangements are formulated on case-by-case basis.
In line with the NTER Emergency Response redesign consultations, which found that the majority of people wanted income management to continue, but with modifications such as exemptions for ‘responsible’ people, a non-discriminatory model and the introduction of voluntary income management948, a new income management scheme was introduced across the Northern Territory from 9 August 2010, replacing the NTER model of income management. The new scheme currently in operation applies to eligible customers across the entire Territory.
Participants include people aged 15 to 24 who have been in receipt of payments, including Newstart and Parenting Payment, for more than three of the last six months; people aged 25 and above on those same payments for more than one year in the last two years; people referred for income management by child protection authorities; and people assessed by Centrelink social workers as requiring income management due to vulnerability to financial crisis, domestic violence or economic abuse. These people have 50 per cent of their regular payments (rising to 70% in cases involving child protection), and 100 per cent of lump-sum payments, income managed. Customers who are no longer required to be part of the new scheme (who include those who receive either the age pension or a disability support
946 ARTD Consultants & Westwood Spice, op. cit., p. 9. 947 FaHCSIA, Submission of background material to the Northern Territory Emergency Response Review Board, 2008, p. 32. 948 FaHCSIA, Report on the Northern Territory Emergency Response redesign consultations, 2009, p. 25–29.

Welfare reform and employment
Northern Territory Emergency Response: Evaluation Report 2011 337
pension) may choose to participate under voluntary income management. Customers can also apply for exemption from the program if they meet a number of key criteria designed to demonstrate their financial management capacity and, if a parent, that they are discharging their parental responsibilities appropriately (such as ensuring that school-age children are attending school).
Under the new income management model, there are two types of incentives being offered to either encourage participation in the scheme on a voluntary basis, or facilitate better money management and savings habits among participants: a $250 incentive payment is available to those who choose to participate voluntarily under the income management scheme (‘voluntary income management’), should they stay on the program for 26 weeks continuously; and an individual who completes an approved money management course and has a pattern of savings over at least 13 weeks can apply to receive a ‘matched saving payment’ equal to the amount they have saved (up to a maximum of $500).
Licensing of community stores
The licensing of community stores was a necessary precondition for establishing and sustaining income management. It aimed to improve the range and quality of grocery items available. The licensing scheme also aimed to ensure that community stores were better managed and able to operate in accordance with the income management arrangements.949
Welfare reform program logic
In contrast to the development of other NTER measures and sub-measures, no specific program logic was developed for the welfare reform and employment sub-measures.950 However, a program logic was developed for income management in the Northern Territory in a recent evaluation by the Australian Institute of Health and Welfare (AIHW).951 In the AIHW study, the main short- to medium-term outcomes for income management were:
• more money spent on priority needs of the person, their partner, their children and other dependants
• improved food security (to ensure stores are well managed and able to take part in the income management arrangements) and food choices (to improve the range and quality of groceries available in communities)
• reduction in spending on excluded items or harmful behaviours (such as substance abuse, gambling and other antisocial conduct)
• improved money management
• reduction in humbugging (harassment for money), particularly for those most vulnerable, such as women and the elderly.
Longer term outcomes were:
• improved wellbeing of children and family members—promote socially responsible behaviour, particularly in relation to the care of children
• greater self-reliance and economic, social and community engagement
949 http://www.fahcsia.gov.au/sa/indigenous/pubs/nter_reports/closing_gap_NT_jul_dec_2009/Documents/Part2_Monitoring_Report/sec3.htm. 950 ARTD Consultants & Westwood Spice, op. cit. 951 Australian Institute of Health and Welfare (AIHW), Evaluation of income management in the Northern Territory, occasional paper no. 34, 2010, p. 8. In addition, a comprehensive evaluation framework and program logic has been developed for new income management. For more information see Social Policy Research Centre, Evaluation framework for New Income Management (NIM), Australian Institute of Family Studies, December 2010.
Welfare reform and employment
338 Northern Territory Emergency Response: Evaluation Report 2011
• stronger families and more resilient communities.
A more detailed description of the program logic developed by the AIHW for the welfare reform measures is presented in Table 9.1.
Essentially, income management works by reducing the amount of money available for excluded items such as alcohol, tobacco, pornography and gambling. It guarantees that more money is available for priority needs, and provides support to reduce financial stress and hardship. According to the program logic, this change in spending patterns should result in a number of positive outcomes for children, families and the wider community, such as reduced expenditure on alcohol (and, it is hoped, alcohol-fuelled violence), substance abuse and other risky behaviours. Money set aside for priority needs may also result in improved nutrition and increased spending on children’s clothing and school-related expenses. More spending on children’s needs may lead to improved health and educational attendance, which could also improve educational outcomes.952
Employment measures With the broad aim of increasing participation opportunities for working age people on income support payments, several changes in employment policy were introduced.953
Increased participation opportunities for working age people on income support
The aim of this measure was to improve the lives of people by promoting economic independence via increased participation and the take-up of employment, as well as providing employment services and programs for people not immediately job ready. Establishing a participation culture via attendance in employment programs and services with the ultimate outcome of gaining employment was a major focus.
Removal of remote area exemptions
The removal of remote area exemptions (RAEs) meant that job seekers in NTER remote communities were subject to the same participation requirements as those in regional and urban areas. They were now required to look for work or participate in work-related activities in order to receive income support payments. The removal of RAEs involved a process that ensured services were in place before participation requirements were imposed. As part of the NTER, an accelerated plan for removing RAEs was developed which included an up-front media-based communications strategy to inform individuals and communities about the initiative. In addition, RAE teams (comprising staff from DEEWR, Centrelink, employment service providers and job capacity assessors) were involved in a two-week process for removing RAEs in each community. This process included immediate referral of individuals to employment opportunities and/or appropriate programs, including Job Network, Work for the Dole (WfD), Personal Support Program, Disability Employment Network, Vocational Rehabilitation Services, the Structured Training and Employment Projects (STEP) and the Language, Literacy and Numeracy Program.954 A follow-up and compliance strategy for people who do not attend an interview was also introduced.
952 ARTD Consultants & Westwood Spice, op. cit., pp. 13–14. 953 FaHCSIA, Submission of background material to the Northern Territory Emergency Response Review Board, p. 34. 954 Over time, some of these programs, such as Job Network, the Personal Support Program and Structured Training and Employment Projects, have been replaced with other more suitable programs.

Northern Territory Emergency Response: Evaluation Report 2011 339
Tabl
e 9.
1 W
elfa
re m
easu
res
prog
ram
logi
c
Objec
tives
Ta
rget
gro
ups
Inpu
ts
Outp
uts/p
roce
sses
Sh
ort-t
erm
out
com
es
Medi
um-te
rm o
utco
mes
Lo
ng-te
rm o
utco
mes
Pr
omote
socia
lly re
spon
sible
beha
viour
En
sure
that
prior
ity ne
eds o
f fam
ilies a
re m
et Re
duce
the a
moun
t of c
ash i
n co
mmun
ities a
vaila
ble fo
r ex
clude
d item
s W
omen
, the e
lderly
and o
ther
vulne
rable
comm
unity
me
mber
s are
prov
ided w
ith
bette
r fina
ncial
secu
rity
Peop
le re
ceivi
ng in
come
su
ppor
t Pe
ople
living
in pr
escri
bed
area
s Ind
igeno
us A
ustra
lians
liv
ing in
the N
orthe
rn
Terri
tory
Budg
et fun
ding
Legis
lation
Po
licy g
uide
Staff
, inclu
ding s
kills
and
know
ledge
Ba
sicsC
ard
Infor
matio
n tec
hnolo
gy
syste
ms
Comm
unity
/stak
ehold
er
cons
ultati
ons
Comm
unica
tion s
trateg
y to
custo
mers
and s
ervic
e pro
vider
s Le
gislat
ive in
strum
ents
in pla
ce
Imple
menta
tion o
f limi
ted re
view
and
appe
al me
chan
isms
Corre
ct ad
minis
trativ
e dec
ision
s are
ma
de
Incom
e-ma
nage
d fun
ds ar
e all
ocate
d Co
ntinu
ed vi
sits t
o com
munit
ies an
d oth
er co
ntact
with
incom
e ma
nage
ment
custo
mers
Stor
es lic
ense
d and
/or si
gned
up to
Ba
sicsC
ard
Evalu
ation
repo
rts, in
cludin
g im
pleme
ntatio
n and
outco
mes
Mone
y spe
nt on
prior
ity
need
s Be
tter f
ood c
hoice
s Ab
ility t
o use
Bas
icsCa
rd
(stor
es av
ailab
le,
unde
rstan
ding h
ow to
oper
ate
card
, inclu
ding c
heck
ing
balan
ces)
Redu
ction
in sp
endin
g on
exclu
ded i
tems
Redu
ction
in hu
mbug
ging
Impr
oved
food
choic
es
Impr
oved
food
secu
rity,
includ
ing in
creas
ed
quan
tity an
d qua
lity of
he
althy
food
s Ab
ility t
o plan
for e
xpec
ted
expe
nses
(for
exam
ple,
car r
egist
ratio
n)
Redu
ction
in sp
endin
g on
harm
ful be
havio
urs
Redu
ction
in hu
mbug
ging
Beha
viour
al ch
ange
in th
e wa
y mon
ey is
distr
ibuted
an
d spe
nt am
ong f
amily
an
d com
munit
y mem
bers
Contr
ibutes
to fa
milie
s an
d chil
dren
havin
g gr
eater
choic
es an
d op
portu
nities
Co
ntribu
tes to
grea
ter
self-
relia
nce a
nd
econ
omic,
socia
l and
co
mmun
ity en
gage
ment
for In
digen
ous A
ustra
lians
Co
ntribu
tes to
stro
ng an
d re
silien
t com
munit
ies
Assu
mptio
ns:
Ther
e is a
comm
unity
stor
e or o
ther m
echa
nism
to pr
ovide
food
secu
rity in
each
comm
unity
. So
urce
: Au
strali
an In
stitut
e of H
ealth
and W
elfar
e (AI
HW),
Evalu
ation
of in
com
e m
anag
emen
t in th
e No
rther
n Te
rrito
ry, o
ccas
ional
pape
r no.
34, 2
010,
p. 73
.

Welfare reform and employment
340 Northern Territory Emergency Response: Evaluation Report 2011
Language, literacy and numeracy
Improving work readiness also necessitated the more intensive use of the Language, Literacy and Numeracy Program (LLNP). This program aimed to help job seekers participate more effectively and sustainably in the labour market and to pursue further education and training as required.955
Community Development Employment Program transition to jobs and employment services
The original objective of the former Australian Government was to replace CDEP with ‘real jobs’ (better pay and conditions—award rates of pay, superannuation and holiday pay) and training through the Indigenous Employment Program (IEP)—of which the STEP and the STEP—Employment and Related Services (STEP ERS) were component parts, as well as the Job Network and WfD. However, in December 2007, the current government placed a moratorium on the phasing out of CDEP and in April 2008 announced the reintroduction of CDEP as an interim measure, pending further reform.
Community Employment Brokers
CEBs were introduced in NTER communities to help coordinate the delivery of employment-related services and programs, create a participation culture, and create links between Job Network services and communities. CEBs were integral to the removal of RAEs, as they helped job seekers and the community in general to understand their participation requirements and their options after the lifting of RAEs and the CDEP transition (where it applied). CEBs also assisted with the implementation of community clean-up activities, pre-employment training, and the recruitment and retention of Indigenous people in jobs.
Employment measures program logic
Based on the objectives of the removal of RAEs, increased participation opportunities for working-age people on income support, CDEP transition to jobs and employment services, the introduction of CEBs (until June 2009), and Job Services Australia (from July 2009) and the LLNP, Colmar Brunton Social Research developed the following program logic.956
The main short- to medium-term outcomes are:
• establishing a participation culture via attendance in employment programs and services (that is, increased participation in mainstream and Indigenous employment programs)
• removal of disincentives for people to study, train or take up other work outside of CDEP
• improved skill acquisition
• stronger partnerships with business and the private sector
• employers of Indigenous workers are better supported
• people are encouraged to travel to work and for training.
Longer term outcomes are:
955 Department of Education, Employment and Workplace Relations (DEEWR), ‘Language, Literacy and Numeracy Program (LLNP): Overview of the NTER’, unpublished paper, 2011. 956 Unlike for other NTER measures, no formal program logic was developed for the employment measures. The program logic presented here is based on an assessment of the documents reviewed for this evaluation and as such has not been endorsed by the Australian Government.

Welfare reform and employment
Northern Territory Emergency Response: Evaluation Report 2011 341
• individuals and communities have the opportunity to benefit from the mainstream economy
• improved confidence, capacity, work readiness and employability
• greater self-reliance, personal responsibility and economic independence
• people find sustainable employment
• stronger families and more resilient communities.
A more detailed description of the program logic developed for employment measures is presented in Table 9.2.
According to the program logic, the removal of disincentives for job seekers to study, train or take up work outside of CDEP and increased attendance in employment programs and services should result in a number of positive outcomes for job seekers, families and the wider community, such as increased confidence, capacity, work readiness and employability, overcoming nonvocational barriers to work and improved skill acquisition. These outcomes in turn may lead to sustainable employment for community members as well as greater self-reliance, personal responsibility and economic independence, leading to stronger families and more resilient communities.
The assumption underlying this program logic model is that increasing participation and improving the skills of job seekers is worthwhile, as they will be better equipped to apply for and win local jobs. However, given the limited employment opportunities in remote communities, the employment measures were also very much about increasing participation in activities to engender greater social inclusion as well as helping people find jobs.957
Without sustainable economic development, the effectiveness of employment measures was always going to be limited in terms of reducing unemployment in prescribed areas.958 Sustainable economic development would require removing barriers to genuine commercial ventures, such as poor transport infrastructure, inadequate education/training services (which currently fail to engage people) and current land tenure arrangements (which fail to provide the long-term leases necessary for organisations to be assured a reasonable return on investment).959 Enabling initiatives would also be required, such as comprehensive mobility programs (that successfully engage job seekers), the enshrinement of the merit principle as the sole basis for employment960, and Commonwealth procurement guidelines that relax mandatory procurement procedures for Indigenous-owned enterprises (note that this change to procurement practices is now in place).
957 B O’Connor, Reform of employment services in Australia, speech, 2 September, 2008, <http://www.deewr.gov.au/Ministers/OConnor/Media/Speeches/Pages/Article_081007_125407.aspx>. See also Australian Government, The future of remote participation and employment servicing arrangements, discussion paper, August 2011, p. 4. 958 Australian Government, The future of remote participation and employment servicing arrangements, p. 9. 959 ibid., pp. 4, 9. 960 The merit principle as used here refers to the idea that an appointment, promotion or transfer should be based only on the capacity of the person to perform the job, having regard to the person’s knowledge, skills, qualifications and experience and the potential for future development of the person in employment.

342 Northern Territory Emergency Response: Evaluation Report 2011
Tabl
e 9.
2 Em
ploy
men
t mea
sure
s pr
ogra
m lo
gic
Objec
tives
Ta
rget
gro
ups
Inpu
ts
Outp
uts/p
roce
sses
Sh
ort-t
erm
out
com
es
Medi
um-te
rm o
utco
mes
Lo
ng-te
rm o
utco
mes
Ind
igeno
us pe
ople
have
the
depth
and b
read
th of
skills
an
d cap
abilit
ies re
quire
d for
the
21st-
centu
ry lab
our
marke
t Ind
igeno
us pe
ople
of wo
rking
ag
e par
ticipa
te eff
ectiv
ely in
all
secto
rs of
the la
bour
ma
rket
Wor
king-
age I
ndige
nous
pe
ople
in pr
escri
bed
area
s
Budg
et fun
ding
Remo
val o
f RAE
s Ch
ange
s to C
DEP
Jobs
Pac
kage
CE
Bs un
til Ju
ne 20
09
LLNP
Ce
ntreli
nk/Jo
b cap
acity
as
sess
ors
Staff
, inclu
ding s
kills
and
know
ledge
Job s
eeke
rs ful
fil ma
instre
am
lookin
g-for
-wor
k par
ticipa
tion
requ
ireme
nts
Comm
unity
clea
n-up
activ
ities
WfD
activ
ities
Job s
eeke
rs tra
nsfer
red t
o inc
ome
supp
ort p
ayme
nts
CEBs
resid
ent in
some
co
mmun
ities u
ntil J
une 2
009
JSA
from
July
2009
Ot
her w
ork e
xper
ience
optio
ns
prov
ided
More
tailo
ring o
f ser
vices
to m
eet
need
s of jo
b see
kers
(e.g.
Em
ploym
ent P
athwa
y Plan
) St
rong
er pa
rtner
ships
with
busin
ess
and t
he pr
ivate
secto
r Co
rrect
asse
ssme
nt of
job se
eker
s
Remo
val o
f disi
ncen
tives
for
job s
eeke
rs to
study
, tra
in or
take
up ot
her w
ork
outsi
de of
CDE
P Mo
re ‘re
al job
s’ (n
on-
CDEP
) are
avail
able
Incre
ased
atten
danc
e in
emplo
ymen
t pro
gram
s an
d ser
vices
(i.e.
incre
ased
partic
ipatio
n in
mains
tream
and
Indige
nous
emplo
ymen
t pr
ogra
ms)
Impr
oved
confi
denc
e, ca
pacit
y, wo
rk re
adine
ss an
d em
ploya
bility
Jo
b see
kers
over
come
no
nvoc
ation
al ba
rrier
s to
work
Impr
oved
skill
acqu
isitio
n Em
ploye
rs of
Indige
nous
job
seek
ers a
re be
tter s
uppo
rted
Job s
eeke
rs ar
e enc
oura
ged
to tra
vel to
wor
k and
for
traini
ng
Indivi
duals
and c
ommu
nities
ha
ve th
e opp
ortun
ity to
be
nefit
from
the m
ainstr
eam
econ
omy
Grea
ter se
lf-reli
ance
, pe
rsona
l resp
onsib
ility a
nd
econ
omic
indep
ende
nce
Peop
le fin
d sus
taina
ble
emplo
ymen
t St
rong
er fa
milie
s and
mor
e re
silien
t com
munit
ies
Estab
lishin
g a pa
rticipa
tion
cultu
re
Sour
ce:
A br
oad c
onsid
erati
on of
all d
ocum
ents
revie
wed.

Welfare reform and employment
Northern Territory Emergency Response: Evaluation Report 2011 343
What was done The first year of the NTER aimed to protect women and children and to make communities safer.961 Although all the measures and sub-measures broadly attempted to facilitate that outcome, some were more directly aimed at the outcome, especially welfare reform measures such as income management, licensing of community stores and the School Nutrition Program. With the change of government late in 2007, there was a renewed commitment to consolidate and build on these measures but with a new emphasis on consultation and engagement.962 One of the biggest changes in policy resulting from the change of government involved the CDEP program. This was abolished by the Howard Government and then reinstated by the Rudd government, causing considerable confusion and uncertainty amongst community members.963
Welfare reform and employment initiatives introduced under the NTER were refined and extended under the NTNPA. The NTNPA moved the intervention to a three-year development phase (until 30 June 2012) aimed at bolstering key NTER measures with a new emphasis on community engagement, working in partnerships and strengthening Indigenous community capability and leadership.964 More language, literacy and numeracy training places were also introduced to improve sustainable employment prospects by enhancing skills, including financial management skills to help individuals and families manage their income effectively.965
In 2009, the NTNPA welfare reform and employment measures were complemented with the Council of Australian Governments ‘building block’ of economic participation. This building block aims to ensure that individuals and communities have the opportunity to benefit from the mainstream economy. Economic participation extends to disadvantaged job seekers and welfare reform promotes active engagement, enhanced capability and positive social norms. The Australian Government developed specific employment packages in the Northern Territory, and also implemented nationwide reforms to the CDEP, the IEP and mainstream employment services so Indigenous people could acquire the skills they need to get and keep a job.966
961 FaHCSIA, Submission of background material to the Northern Territory Emergency Response Review Board, 2008, p. 1. 962 ARTD Consultants & Westwood Spice, op. cit., p. 6. 963 NTER Review Board, op. cit., p. 21. 964 Council of Australian Governments (COAG), Closing the Gap in the Northern Territory National Partnership Agreement, 2011, p. 3. 965 Council of Australian Governments, op. cit., p. 5. 966 FaHCSIA, Closing the Gap in the Northern Territory monitoring report, January 2009 to June 2009, Part 2, Canberra, 2009, p. 33.

Welfare reform and employment
344 Northern Territory Emergency Response: Evaluation Report 2011
Table 9.3 NTER welfare reform and employment measure timeline
2007 15 June ‘Little children are sacred’ report released 21 June NTER announced July Money management services and other financial management program service strategies are
announced to support welfare reform 14 July Welfare reform program announced 17 July Legislation passed and assented to (introduced 7 July 2007)—abolished CDEP and allowed for the
introduction of income management 21 July Cut-off date for residential eligibility for income management 20 August Community engagement before income management commenced 15 September Pornography and alcohol restrictions in place 17 September Rollout of income management commenced in stages to across prescribed areas 10 December Moratorium announced by the newly elected Rudd government on any further transition of CDEP
participants in the Northern Territory. By this time, 16 CDEP providers and more than 2,000 participants had been transitioned.
2008 January Funding provided to deliver short-term money management education and basic budgeting support to people on income management
30 April Announcement on CDEP reforms 6 June NTER Review Board announced 1 July CDEP restored in communities where it was previously removed. As at 31 December there were
5,500 CDEP participants in the Northern Territory, down from 8000 in July 2007(a) 8 September BasicsCard roll-out commenced 13 October Report of the NTER Review Board released 23 October Government released interim response to the NTER Review; income management extended for at
least 12 months 27 October Rollout of income management completed 15 December BasicsCard rollout completed 2009 18 March Full range of appeal rights introduced for people on income management 21 May Australian Government releases its final response to the review of the NTER: Future directions for
the Northern Territory Emergency Response Early June Consultations on future directions of NTER commenced 24 June Rights of review for individuals under income management introduced 1 July Toll-free phone number introduced for checking recipients’ BasicsCard balances New employment services commence Australia-wide. Job Services Australia (JSA) replaces Job
Network. The Structured Training and Employment Projects(STEP) and STEP Employment and Related Services (STEP ERS) are enhanced under the Indigenous Employment Program (IEP) and a reformed model of CDEP is reinstated in remote areas, with a greater emphasis on work readiness and training.
November Policy statement announces landmark reform to the welfare system, reinstatement of the Racial Discrimination Act, and strengthening of the NTER. The welfare reforms will eventually see the national rollout of a nondiscriminatory form of income management in disadvantaged regions(b)
(a) FaHCSIA, Northern Territory Emergency Response, Part 2, Monitoring report measuring progress of NTER activities, July 2008 – December 2008, p. 56.
(b) See Australian Government, Policy statement: Landmark reform to the welfare system, reinstatement of the Racial Discrimination Act and strengthening of the Northern Territory Emergency Response, November 2009.
Source: Adapted from the Australian Institute of Health and Welfare (AIHW), Evaluation of income management in the Northern Territory, occasional paper no. 34, 2010, p. 4.
Discussion This section investigates how successful the welfare reform and employment measures have been. Unintended consequences of the various measures are also examined.
Welfare reform—strengths/achievements There is some evidence that income management has resulted in more income being spent on priority needs and people buying more and better quality food. Between July 2007 and 31 December 2010, a total of $463,578,145 had been income managed and $461,034,303 had been spent. Most money was spent in stores that primarily sell food (68%), on housing costs (9%), in stores that primarily sell clothing and footwear (7%) and on store cards (which

Welfare reform and employment
Northern Territory Emergency Response: Evaluation Report 2011 345
worked like a voucher for a specified retail outlet—for example, for Coles or Woolworths) available for use at major supermarkets and department stores (2%). School nutrition programs accounted for 3 per cent of spending.967
It is also worth noting that, when given a choice, the majority of people who exited compulsory income management under the new model chose to participate in voluntary income management after they exited. Of the 7,877 NTER people who had exited income management by 31 December 2010, 59 per cent (or 4,653) chose to participate in voluntary income management.968
The most comprehensive evaluation of income management in the Northern Territory to date, conducted by the AIHW969, found evidence of improvements in child health, community wellbeing, expenditure patterns and money management skills. Admittedly, the sample sizes involved in that particular study were too small to make firm generalisations. However, the AIHW’s overall findings are consistent with a number of other studies, suggesting that we can have some confidence in their validity, as discussed below.
Improvements in child health
In interviews with people who were on income management, more than half of the parents felt their children were eating more (63%, or 30), weighed more (57%, or 27) and were healthier (52%, or 25). Stakeholders in focus groups also felt that children were healthier.970
The recently completed CSWRS, which was based on 1,343 community members in 16 NTER communities, provides further evidence of improvements to child health: 75 per cent of participants reported that children were being looked after better971; 69 per cent reported that children had more food972; 62 per cent reported that children were happier973; and 57 reported that children were healthier than three years ago.974 Of course, income management was only one factor at play in shaping those perceptions. Related and supporting measures such as stores licensing, the School Nutrition Program, children’s health checks, crèches, and better Centrelink services were also important. However, the contribution of income management was highlighted in the qualitative open-ended responses included in this research975:
967 FaHCSIA, Closing the Gap in the Northern Territory, July 2010 to December 2010, Whole of Government Monitoring Report, Part 2, ‘Progress by measure’, p. 36. It should be noted that the evidence presented above is based upon total sales and assumes that all food and items purchased fall into priority and better quality categories. However, without a breakdown of the categories of items and foods, it cannot be assumed that all food is healthy and that items bought are priority items. For example, if some people are using their income-managed funds to buy more sweetened soft drinks or fried food from takeaway shops, that would not be consistent with the objective of spending more money on priority items and making better food choices—a short-term outcome identified in the welfare reform program logic. 968 ibid., p. 36. ‘More recent Centrelink data indicates that 84 per cent of this group still remain on the voluntary income management measure.’ 969 AIHW, op. cit., p. v. The AIHW evaluation of income management used two main data sources; a client survey (face-to-face interviews with 76 people on income management in four locations) that collected quantitative data, and focus groups of key stakeholders (167 stakeholders, including community representatives from the same four locations, and a survey of community sector and government employees from a wider range of locations) that collected qualitative data. The report also drew on a telephone survey of 66 community store operators (out of a total of 84 licensed stores as at May 2009), an earlier survey of 49 GBMs working in 71 of the prescribed communities and an earlier qualitative report on community consultations in four other remote communities. The authors noted several limitations in their study. For example, much of the research relied on point-in-time descriptive surveys and qualitative research with relatively small sample sizes, which as the authors note ‘… sit towards the bottom of an evidence hierarchy’ (p. 16). The lack of a comparison group, or historical data, to measure what would have happened in the absence of income management was also a key problem. While the authors attempted to mitigate these issues by triangulating the findings of different studies and by looking for common issues and themes, ‘… the overall evidence about the effectiveness of income management was still not strong’ (p. vi). 970 ibid., p. vii. 971 G Shaw and P d’Abbs, Community Safety and Wellbeing Research Study consolidated report, FaHCSIA, Canberra, 2011, p. 26. 972 ibid., p. 84. 973 ibid., p. 90. 974 ibid., p. 83. 975 ibid., p. 32. Part of the CSWRS involved a participatory qualitative process in which participants were asked to vote on the top three changes that had occurred in their community over the last three years. Based on a weighted index of amalgamated votes across 13 communities, income management came in as the equal third most important change implemented over that period (pp. 30, 60).

Welfare reform and employment
346 Northern Territory Emergency Response: Evaluation Report 2011
The main reason given for the increase [in children eating more food than three years ago] is undoubtedly income management through the use of the BasicsCard.976
Improvements in community wellbeing
The AIHW evaluation also found that more than half of people on income management felt there was less gambling (63%, or 31), less drinking and alcohol abuse (61%, or 28) and less ‘humbugging’ (harassment for money) (52%, or 25). The focus groups suggested that community wellbeing was improving, with less humbugging, domestic violence, addictive behaviours and gambling.977 The 2009 Final stores post licensing monitoring report also found that community members, especially women, were telling store operators that they now had more control over their money and were better able to deal with humbugging.978
The CSWRS provides further evidence of improvements in community wellbeing: 72 per cent of participants reported that their community is safer than it was three years ago, and 57 per cent reported that people are drinking less alcohol than three years ago.979 In fact, the majority of participants in all communities surveyed agreed that there has been a reduction in the level of drinking in their community. Again, the contribution of income management to these outcomes was highlighted in the qualitative component of this research:
The majority of those who mentioned the BasicsCard made positive comments. In essence many people said they had found it useful in helping them to direct their income away from the purchase of alcohol, marijuana, and gambling, to spending on food and clothes. These observations capture the sense of the responses: ‘People used to spend their money buying grog and gambling, now since changes more people are buying food and kids clothes and saving money.’ And: ‘BasicsCard is good, as young mothers gamble all money away without it.’980
Reductions in humbugging were also noted:
Several older people also identify that having a BasicsCard reduces the amount of ‘humbug’, or pressure from younger family members. This old woman explains her satisfaction: ‘I like the BasicsCard because my family don’t humbug me for money anymore. I got a green BasicsCard and the red one. The red one is for the store card and we can use it only for the store here in our community and nowhere else. When family asks me for money I show them the green BasicsCard and then they just leave me alone. Yeah so it’s really good.’981
Improved expenditure patterns
The AIHW evaluation also found that three-quarters of people on income management (75%, or 55) felt they were spending more on food, and that half (50%, or 37) were purchasing more fruit and vegetables. More than two-thirds of store operators (68%, or 45) reported an increase in sales of fruit and vegetables and other healthy food.982
There was some inconsistent evidence that less money was being spent on excluded items. For example, the majority of store operators who answered the question (73%, or 22)
976 ibid. p. 85. 977 AIHW, op. cit., p. vii. 978 FaHCSIA, Final stores post licensing monitoring report, 2009, p. 1. This report was based on FaHCSIA interviews with 66 community stores in three rounds as part of routine monitoring during the first 18 months of store licensing. The finding that women (especially women who are caring for young children) are generally more supportive of income management than men has been reported elsewhere; for example, see Cultural and Indigenous Research Centre Australia (CIRCA), Community feedback on the Northern Territory Emergency Response (NTER) Research Report, FaHCSIA, September 2008 <http://www.fahcsia.gov.au/sa/indigenous/pubs/nter_reports/mon_report/Documents/p1_4_perceptions.html>. 979 G Shaw & P d’Abbs, op. cit., pp. 26, 64. 980 ibid., p. 59. 981 ibid., p. 60. 982 AIHW, op. cit., p. vii.

Welfare reform and employment
Northern Territory Emergency Response: Evaluation Report 2011 347
reported that cigarette sales were unchanged, and more than half of people on income management who answered the question (56%, or 39) said they were spending less of their discretionary income on cigarettes.983 Almost two-thirds of people on income management who answered the question (65%, or 42) reported spending less of their discretionary income on gambling. Most people on income management (51 out of 67 survey respondents) said the issue of alcohol was not relevant to them, but all who felt the question did apply to them (24%, or 16) felt they were spending less on alcohol.984
It should be noted that an article by Menzies School of Health researchers which examined purchasing patterns in 10 Arnhem Land Progress Aboriginal Corporation (ALPA) stores both before and after the introduction of income management found that ‘Income management independent of the government stimulus payment appears to have had no beneficial effect on tobacco and cigarette sales, soft drink fruit and vegetable sales.’985 However, there were a number of limitations with that study.986 Issues include concerns that the conclusions were not put into proper context for the statistical model structure chosen, the use of a convenience rather than a true random sample, the use of an interrupted time-series analysis, inconsistencies with the dates used to determine the switch-on time of income management for stores in the study (versus the actual switch-on dates) and differences between ALPA stores and other community stores, suggesting that the results are not easily generalisable to other stores. These issues aside, the type of analysis undertaken by the Menzies School of Health is needed to better understand spending patterns in stores and potential health benefits to communities.
Improvements in money management skills
The AIHW evaluation also found that just over half of the people on income management felt that paying rent (55%, or 41) or other bills (53%, or 38) was easier since they had started on income management. One-third of people on income management (33%, or 24) said they had bought big or expensive items such as whitegoods. Nearly four in 10 people (39%. or 29) reported saving money.987
The CSWRS provides further evidence of improvements in money management skills:
There is a wealth of comment that describes how people have changed the way they spend their money so that they have sufficient funds to buy food for themselves and their children. An older man gave this very honest self-appraisal: ‘I look after money better now because of the BasicsCard. I realised I was doing the wrong thing, gambling. It really helped and at the moment my family is living much better.’ One older woman describes how it has affected the way she spends her money: ‘Before Intervention my money would go in one day, now it lasts for two weeks.’ There was also some comment to the effect that being able to provide children with more food has influenced other aspects of parental care. One middle-aged man put it this way: ‘Kids generally doing better; parents worry more about kids. Drinking less, thinking more about kids. Parents using BasicsCard has helped.’988
983 This discrepancy may be due to information being compiled from different datasets, over differing periods and in different locations. For example, the income management client survey was conducted in four communities (Tennant Creek, Ngukurr, Gapuwiyak and Apatula) in 2009, whereas the stores data collection was conducted over many more communities (66 store operators were interviewed in three waves from February 2008 to May 2009). 984 AIHW, op. cit., p. vii. 985 J K Brimblecombe, J McDonnell, A Barnes, J Garnggulkpuy Dhurrkay, DP Thomas and RS Bailie, ‘Impact of income management on store sales in the Northern Territory’, Medical Journal of Australia, 192(10), 17 May 2010, p. 549. 986 See DSI Consulting Pty Ltd, A critique of the published statistical analysis in a study by the Menzies School of Medical Research, August 2010. 987 AIHW, op. cit., p. viii. 988 G Shaw & P d’Abbs, op. cit., p. 85.

Welfare reform and employment
348 Northern Territory Emergency Response: Evaluation Report 2011
Readers will note that one of the long-term program logic outcomes of income management is to promote socially responsible behaviour, particularly in relation to the care of children. The CSWRS study suggests that this may already be occurring.
Further evidence of the effectiveness of income management
Further evidence of the effectiveness of income management is found in the following sources.
The Report on the Northern Territory Emergency Response redesign consultations found that income management had delivered significant benefits, especially to the most vulnerable—children, women and older people—as well as parents and families more broadly:
The benefits included more money being spent on food, clothing and school-related expenses; assisting with saving for large purchases such as fridges and washing machines; less money being spent on alcohol, gambling, cigarettes and drugs; reduced levels of ‘humbugging’ (or harassment for money); and improved capacity for household budgeting.989
The Northern Territory Emergency Response Review Board found that many people:
believed that income management did provide a new opportunity to manage their income and family budgets in a way that they wanted to see continue. The testimony of many Aboriginal people, especially women, along with the observations of local clinicians, school teachers and storekeepers, supports the view that a substantial number of families and children have benefited from income management. The Board was told that greater quantities and better quality of food was being bought at community stores and that the sale of tobacco decreased. One of the benefits attributed to income management was that it enables some individuals such as pensioners and women to avoid or limit ‘humbugging’. The Board was also given many examples of people managing their income and saving for white goods and the like, which they had not done previously990.’
The board also found that some people linked income management with reductions in drinking, gambling and fighting.991
FaHCSIA’s Submission of background material to the Northern Territory Emergency Response Review Board found that ‘…community store managers have reported that … customers had changed their shopping habits considerably, buying more fresh fruit and vegetables, dairy goods, frozen vegetables and meat and that, in some stores, sales of cigarettes has [sic]halved.’992
A submission to the NTER Review Board by the Central Land Council based on research involving six Central Australian communities (Titjikala, Papunya, Yuendumu, Ali Curung, Kintore and Hermannsburg) and 141 community members, 51 key stakeholders and an examination of administrative data, found that the key benefits of income management were increased household expenditure on food and children, young men contributing to family
989 FaHCSIA, Report on the Northern Territory Emergency Response redesign consultations, 2009, p. 21. This research was based on four tiers. Tier 1 included 444 meetings of individuals, families and small groups providing feedback to GBMs. Tier 2 included 109 community meetings led by ICC managers and GBMs. Tier 3 involved six regional workshops of 2–3 days duration with people from the NTER communities and Indigenous leaders in particular regions (n = 176). Tier 4 involved five workshops with major Indigenous Northern Territory stakeholder organisations (n = 101). 990 NTER Review Board, op. cit., p. 21. 991 ibid., p. 85. 992 FaHCSIA, Submission of background material to the Northern Territory Emergency Response Review Board, 2008, p. 33.

Welfare reform and employment
Northern Territory Emergency Response: Evaluation Report 2011 349
shopping, and reductions in gambling and drinking.993 The same study found that survey participants were almost evenly divided between people in favour (51%) and opposed (46%) to income management. The key disadvantages of income management were less discretionary cash, restrictions on the use of managed money, blanket coverage being discriminatory, problems with accessing managed money, incompatibility with population mobility, difficulties for aged and disabled people, and perceived cost shifting (in terms of time and effort involved) to Indigenous people and community staff to deal with the new income management arrangements994 (for a more in detailed discussion of the key issues with income management see Welfare reform—limitations of outcomes below). The report also found that people reported improved quality of stock in their community stores following the NTER licensing processes. However, in almost all surveyed communities (except Kintore) the licensing of stores has been perceived to have been associated with increases in store prices.995 The report also found that people reported improved quality of stock in their community stores following the NTER licensing processes. However, in almost all surveyed communities (except Kintore) the licensing of stores has been perceived to have been associated with increases in store prices.996
Each year, the Northern Territory Government conducts a standard survey of a sample of stores in rural and remote locations in the Northern Territory to assess the cost of purchasing sufficient standard groceries to supply a family of six for a fortnight.997 Analysis of the survey results from 2007 to 2010 shows that the price of the food basket in the sampled community stores increased by 12 per cent.998 This compares with a 9.3 per cent rise in the Consumer price Index for Australia as a whole over the same period.999 In 2010 the cost of the basket of goods in community stores was 43 per cent higher than purchases the same goods in Darwin supermarkets.1000 The Northern Territory Market Basket Survey report also shows that the percentage of fortnightly income required to purchase the groceries in remote stores was 36 per cent in 2007 and in 2010.1001 However, the cause of the price increases over this period is unclear and requires further investigation. It may be due to store licensing and/or may be a result of increased fuel prices and transport costs. In addition, taking over stores that were already in difficulty may have also contributed to the price increases rather than licensing scheme itself.
A review of the NTER by the Cultural and Indigenous Research Centre Australia (CIRCA) based on 285 community members in four communities found that income management increased purchases of food and other essential items (this was a consistent finding across all four communities)1002; increased savings (although raised less often in Galiwin’ku, this was still a consistent finding across all communities)1003; reduced alcohol consumption and gambling (although this was not identified consistently across the research)1004; made it easier to pay
993 Central Land Council, Reviewing the Northern Territory Emergency Response: Perspectives from six communities, July 2008, p. 4. This research was based on a detailed participatory evaluation survey of Aboriginal residents in these communities. The survey questioned participants on their awareness of the NTER measures, their feelings about the measures and the effect of the measures on them and their community. The survey included a self-assessment scale. The community surveys were augmented by 51 semistructured interviews with other community-based employees or agencies, government agencies and GBMs in survey communities. Additional data were provided by the NTER Operations Centre, DEEWR and Centrelink. 994 ibid., p. 4. 995 ibid. 996 ibid. 997 Northern Territory Government, Northern territory Markey Based Survey, 2010 998 Ibid page 21. 999 Australian Bureau of Statistics 2010, Consumer Price Index, Australia (Cat. No. 6401.0), Australian Bureau of Statistics, Canberra. 1000 The cost difference in 2007 was 18 per cent. Prices in the Darwin supermarket sample dropped 7.8 per cent between 2007 and 2010. Northern Territory Government, Northern territory Markey Based Survey, 2010, p. 19 1001 Ibid p. 20 and 29. 1002 CIRCA, op. cit., p. 16. 1003 ibid., p. 18. 1004 ibid., p. 19.

Welfare reform and employment
350 Northern Territory Emergency Response: Evaluation Report 2011
bills (although again this benefit was mentioned less often)1005; and reduced family tension due to less humbugging (this benefit was only mentioned by a few, who were exclusively women).1006
More effective Centrelink servicing and claiming of entitlements
At 31 December 2010, the most common income support payments received by income management customers were Newstart Allowance (37.6%), Disability Support Pension (20.9%) and Parenting Payment Partnered (14%). Around a third (35.6%) of income management customers were also Family Tax Benefit customers.1007 The number of income support recipients in NTER communities rose by 15 per cent between December 2009 and December 2010. Over the same period, the number of Disability Support Pension recipients increased by 34 per cent, Carer Pension recipients increased by 26 per cent, Parenting Payment Partnered recipients increased by 15 per cent, Newstart recipients increased by 14 per cent and Youth Allowance recipients increased by 33 per cent.1008 Much of this growth in payments is the result of proper claiming of entitlements.
Previously low levels of access to information about income support payments, and low levels of on the ground contact with Centrelink, had reduced the claim rate among many groups, and saw many eligible recipients not on payment. Many of the new income support recipients have previously not been receiving any payment, rather than as a result of transfers between payments. Much of the increased on the ground service activity by Centrelink has been driven by the implementation of income management1009.
Further evidence of improved Centrelink servicing is provided by the CSWRS, which found that 81 per cent of the people surveyed felt that it was easier to get help from Centrelink than it was three years ago.1010
Given that Centrelink occupies a central position in remote communities as the ‘face of government’ and a common point of access to participation and employment services, improved Centrelink servicing is likely to have improved coordination and integration across a range of welfare and employment measures.1011
Stores licensing
During the period from 1 July 2007 to 31 December 2010, a total of 92 community stores were licensed and 176 visits were undertaken for assessments of the stores for licensing and case management visits to improve their operation and capacity.1012 The evidence for the effectiveness of stores licensing for promoting food security in NTER communities is very positive. The CIRCA evaluation of stores licensing found that it has enabled community members to have improved access to healthy food.1013 The evaluation also found that retail management practices have improved, which has had a positive impact on the quality of food
1005 ibid., p. 20. 1006 ibid., p. 20. 1007 FaHCSIA, Closing the Gap in the Northern Territory, July 2010 to December 2010, Whole of government monitoring report, Part 2 ‘Progress by measure’, 2010, p. 37. 1008 ibid. p. 40. 1009 ibid. p. 40–41. 1010 G Shaw and P d’Abbs, op. cit., p. 26. 1011 Australian Government, op. cit., p. 6. 1012 FaHCSIA, Closing the Gap in the Northern Territory, July 2010 to December 2010, Whole of government monitoring report, Part 2, ‘Progress by measure’, 2010, p. 35. 1013 CIRCA, op. cit., p. 11. This research included an analysis of data from a random selection of 32 stores, including assessment forms, in-depth interviews with key stakeholders (n = 15) and site visits to five communities to collect views from store operators, store committees, stakeholders and community members.

Welfare reform and employment
Northern Territory Emergency Response: Evaluation Report 2011 351
available, and also the security of food supplies for communities.1014 However, serious concerns were raised about high food prices and governance at some stores.1015
The Report on the Northern Territory Emergency Response redesign consultations also found that the licensing of community stores had resulted in significant improvements in the range and quality of food and household items, particularly fresh and healthy food such as fruit, vegetables and meat.1016 However, the report also noted that concerns were raised over the high prices of goods in remote community stores, relationships with store owners, and a lack of Indigenous employment and ownership of some stores.1017
FaHCSIA’s 2009 survey of 49 Government Business Managers (GBMs) working in 71 of the NTER communities found that food is available on a more regular basis (63% agree, 21% disagree, 16% don’t know); an improved (wider) range of food is available from the community store (57% agree, 15% disagree, 28% don’t know); and the quality of food has improved (55% agree, 16% disagree, 28% don’t know).1018
The Submission of background material to the Northern Territory Emergency Response Review Board found that:
Food security has been enhanced in all communities through store licensing where income management was implemented. The licensing of community stores, which is a necessary pre-condition for starting income management, has resulted in improvements in the quality and availability of fresh food.1019
The 2009 Final stores post licensing monitoring report1020 found that initial mistrust and confusion about income management had reduced over time; most store operators reported that people had a good understanding of income management; and many stores (64%) reported an increase in turnover, giving them more capacity to stock a wider range of products such as fresh fruit and vegetables. In addition, more certainty about future turnover gave store operators more confidence to order a larger range of goods. While the transition to income management was difficult for most stores, causing more work, the workload reduced over time as understanding improved and automated processes were put in place.
The CSWRS also provides evidence of improvements in the operation of stores: 76 per cent of participants reported that their community store was better than it was three years ago.1021
Store views of the BasicsCard
Eighty per cent of the 66 stores interviewed after the introduction of the BasicsCard stated that the BasicsCard is a good thing, as it enabled more portability between stores and locations for people on income management.1022 However, working out a customer’s BasicsCard balance was difficult for many stores. This was often burdensome because customers did not know their balances and tried to buy more than their balance allowed or used the store’s phone to try to get their balance from Centrelink. Although there has been a concerted effort to improve people’s ability to obtain a balance on their BasicsCard—including
1014 ibid., p. 14. 1015 ibid., p. 21. It should be noted that Arnhem Land Progress Aboriginal Corporation (ALPA) stores and some communities have a pricing policy that deliberately inflates prices for unhealthy items such as carbonated soft drinks and reduces mark-ups on water, fresh fruit and vegetables. 1016 FaHCSIA, Report on the Northern Territory Emergency Response redesign consultations, 2009, p. 11. 1017 ibid., p. 11. 1018 FaHCSIA, 2009 Survey of government business managers relating to the impact of the Northern Territory Emergency Response, February 2010, p. 25. 1019 FaHCSIA, Submission of background material to the Northern Territory Emergency Response Review Board, 2008 p. 33. 1020 FaHCSIA, Final stores post licensing monitoring report, 2009, p. 2. 1021 G Shaw and P d’Abbs, op. cit., p. 26. 1022 FaHCSIA, op. cit., p. 2.

Welfare reform and employment
352 Northern Territory Emergency Response: Evaluation Report 2011
by implementing purpose-built kiosks, hotline phones for people to get a balance and to transfer funds, internet access to their balance and a new option currently being trialled to provide a balance on receipts at some major stores—the sheer numbers of customers experiencing declined transactions suggests that obtaining a BasicsCard balance is still an issue for people on income management and that more assistance may be required. For example, since April 2010, when the second version of the BasicsCard was released, 22 per cent of transactions have failed; 70 per cent of failed transactions have been due to insufficient funds; the remainder failed because an invalid PIN was entered, the card was used on a terminal not activated for BasicsCard, a stolen card had been cancelled, or the transaction exceeded the daily withdrawal limit.1023
In a related issue, the 1800 telephone number for getting a BasicsCard balance and transferring funds to the BasicsCard is only toll free if called from a landline, and a separate call is required for each step. This impacts disproportionately on remote community customers because few have landlines and the majority use mobile phones:
This is an example of a policy, the use of toll free numbers to improve the accessibility of government services, which is not achieving its objective in remote Indigenous communities in the NT.1024
Welfare reform—limitations of outcomes The following issues have been reported in relation to the implementation of income management.
Sharing of resources—demand sharing or humbug?
Kinship obligations, such as sharing money and resources between immediate and extended family members, are a deeply embedded and valued Indigenous cultural trait. While there is evidence to suggest that income management has protected some people from humbugging, the AIHW found that it also had a negative impact on traditional cultural practices of sharing money within families.1025 This was due to there being less cash available to put towards shared expenses, such as travel or buying second-hand cars. There is also evidence that income management is making ‘sorry business’ harder for the same reasons.1026 It should be noted that these problems were more of an issue in the early days of income management and that subsequent changes have made it easier for payments to be made for specific purposes such as travel and or cultural obligations. For example, payments can be made directly to the income-managed person’s bank account or, with the person’s consent, to a third party. This enables part or all of the person’s income-managed funds to be available for their discretionary use. There are also more BasicsCard merchants available across Australia, and people can get a list of them from Centrelink or access the Centrelink website. While such changes have been helpful, they have not entirely solved this problem; for example, people travelling interstate will still find that many retailers do not accept the BasicsCard.1027
The AIHW also found that just over one-third of income management customers said they shared their BasicsCard with other people, even though this is technically not allowed under income management regulations. These customers did not see this as a problem, even
1023 FaHCSIA, Closing the Gap in the Northern Territory monitoring report, January 2010 to June 2010, Part 2, Canberra, 2010, p. 39. 1024 FaHCSIA, Closing the Gap in the Northern Territory monitoring report, July 2009 to December 2009, Part 2, Canberra, 2009, pp. 77–78. 1025 AIHW, op. cit., p. 57. 1026 ibid. pp. 62–63. See also CIRCA, op. cit., p. 25. 1027 AIHW, op. cit., p. 56.

Welfare reform and employment
Northern Territory Emergency Response: Evaluation Report 2011 353
though the same report found some evidence that carers or nominated people sometimes exploit this situation by using the income-managed funds of people in their care themselves.
Compulsory imposition did not recognise good behaviour
The AIHW also presents evidence from one study suggesting that around one-fifth of families (based on the four communities examined) were managing their finances well before income management was introduced.1028 In addition, qualitative evidence suggests that many people felt income management should not apply to them as they were already looking after their children. Placing these families on income management created considerable resentment and a feeling that they were being punished or discriminated against.1029 Furthermore, the compulsory imposition of income management across remote Indigenous communities in the Northern Territory resulted in bitter feelings, disillusionment, resentment and anger for many Indigenous community members. Those feelings were exacerbated in the implementation phase by inadequate communication and a lack of consultation:
People were required to master new, complex and often changing procedures with a minimum of information or explanation. This led to confusion and anxiety, especially because the vast majority of recipients speak English as a second or third language. The complaints received by the Commonwealth Ombudsman about income management reflect these concerns.1030
Issues with the store card and BasicsCard
Some income-management customers report feeling stigma when they use their store card or, more recently, the BasicsCard:
Some Aboriginal people living or shopping in the major regional centres (in Darwin and Alice Springs especially) have suffered frustration, embarrassment, humiliation and overt racism because of the difficulties associated with acquiring and using store cards. These major changes were compounded by the removal and then reinstatement of CDEP which resulted in an uncertainty or reduction of income for many individuals.1031
There are significant problems in relation to customers requesting new BasicsCards. Of the 149,962 BasicsCards that have been issued since September 2008, 103,077 were replacement cards. Of those, lost cards accounted for the majority (80%), followed by damaged (12%) and stolen cards (4%).
A number of complaints have been raised in relation to the difficulty in making transfers to the BasicsCard on weekends and after hours1032, although this issue was successfully addressed in 2010.
People’s interstate travel was made more difficult by income management, as they were required to contact Centrelink in advance if they wished to travel. Also, due to the small number of approved merchants, they needed to make special arrangements with Centrelink before they could leave for sorry business, hospitalisation or holidays.1033 It should be noted that restrictions on travel have become less of an issue over time as more stores have become approved merchants.
1028 ibid. p. 62. It should be noted that this still implies that 80 per cent of people were not managing their income well. 1029 ibid. pp. 62–63. 1030 NTER Review Board, op. cit., p. 20. 1031 ibid., p. 21. 1032 ibid. pp. 77–78. 1033 ibid. p. 78

Welfare reform and employment
354 Northern Territory Emergency Response: Evaluation Report 2011
It seems that the BasicsCard, while being an improvement on earlier methods of using income-managed funds, still tends to add to the difficulties and costs of paying for goods and services.1034 For example, many stores still do not accept the BasicsCard. This limits consumer choice in relation to where they shop and in finding the best price.1035
Communication issues
Key complaints raised in relation to inadequate communication include a lack of understanding by participants as to the purpose of the program or why they were on it; the need for a greater use of interpreters by Centrelink when explaining and discussing income management with customers; confusing or inadequate information provided in Centrelink letters; difficulty in understanding income management account statements; and difficulties in accessing balances, transferring funds and changing allocations, and concern that this stemmed from inadequate information about those processes.1036
Unintended consequences
The review of the NTER by CIRCA found that overall perceptions of the NTER were often shaped by only a few NTER initiatives, the key one being income management.1037 In this case, a lack of consultation and lack of community control were linked with the compulsory nature of income management. The study also found that the main criticisms of income management revolved around its compulsory nature, increased difficulties when travelling, exploitation of older people (as carers or nominees sometimes use income-managed funds for their own purposes), difficulties paying large bills and paying off existing debt from non-income-managed funds when 50 per cent of income is quarantined, and confusion due to a lack of communication and education about how income management works. Community members suggested improvements such as greater flexibility in how they could use income-managed funds in smaller outlets such as roadhouses when travelling, reduced complexity when allocating funds and accessing money in emergencies, more education, and consideration of existing debt contracts.1038
Employment measures—strengths/achievements
Increased participation opportunities and conversion of CDEP jobs
It is difficult to determine the effectiveness of employment measures introduced during the course of the NTER and NTNPA due to program changes and changes in the collection of data before and after the introduction of the new employment services from 1 July 2009. However, looking at the big picture, between July 2007 to December 2010 more than 4,100 job placements were brokered via Job Network and JSA providers in NTER communities, and 1,500 of those were created during the period from December 2009 to December 2010.1039 In the six months from 1 July 2010 to 31 December 2010, 908 job placements were achieved, which was a 55 per cent increase compared to the same period in 2009.
Furthermore, under the NTJP, between December 2008 and June 2010, 2,241 ongoing jobs in government service delivery (which previously relied on CDEP) were created in Australian
1034 FaHCSIA, Closing the Gap in the Northern Territory monitoring report, January 2010 to June 2010, Part 2, Canberra, 2010, p. 85. 1035 Stores which accept the BasicsCard are limited because approval is based on the percentage of priority goods sold in the store. 1036 FaHCSIA, Closing the Gap in the Northern Territory, July 2010 to December 2010, Whole of government monitoring report, Part 1, ‘Overview of measures’, 2010, p. 92. 1037 Central Land Council, op. cit., p. 7. 1038 ibid. p. 29–30. 1039 FaHCSIA, Closing the Gap in the Northern Territory, July 2010 to December 2010, Whole of government monitoring report, Part 2, ‘Progress by measure’, 2010 p. 41. See also Australian Government, op. cit., p. 6.

Welfare reform and employment
Northern Territory Emergency Response: Evaluation Report 2011 355
and Northern Territory government positions.1040 They included 1,755 Australian Government positions and 486 local government positions. At 20 August 2010, 2,233 of these positions were filled, giving 99 per cent occupancy.
CDEP converted jobs placed more than 200 people in child care, more than 350 in night patrols, and up to 95 at any one time in safe houses. More than 160 local people work in the School Nutrition Program, and there are more than 115 new jobs for Indigenous people as health, family and community workers. Locally recruited Indigenous Engagement Officers serve in 23 communities.1041 In addition, more than 182 rangers in 30 Northern Territory communities have been employed through key Indigenous organisations to work on country.1042
Most of these jobs went to former CDEP participants, and all went to Indigenous job seekers. As at 7 December 2009 (the most recent date for which data are available) between 74 per cent and 82 per cent of the Australian Government jobs created under the NTJP were occupied by former CDEP participants.1043 The CSWRS found that better employment opportunities were the most frequently cited reason for people feeling that their own lives were improving and that their community was on the way up.1044 The same study found that increasing employment opportunities and training was the second most important challenge (across the entire sample) required to be overcome to make communities safer and improve community wellbeing into the future.1045 In addition, having a proper job was rated as very important by 81 per cent of participants, although being close to family and friends (rated as very important by 92%) and having a strong connection to their culture and living traditionally, speaking language (rated as very important by 91%) were considered very important by more people overall.1046
Perceptions of safety and employment
Given the primacy of improving community safety as an overarching objective of the NTER and NTNPA, the relationship between employment and perceptions of community safety deserves a closer examination. The CSWRS found that most people think their lives have improved over the past three years, and qualitative feedback emphasised that employment was a key factor in this:
The benefits of employment are an improved income, but almost more importantly many people stress that they are busy and feel that they are contributing to their community. Some adults also comment that their children are happier because they see their parents go to work more often.1047
Employment was found to be:
the most frequently cited mechanism through which the destructive behaviour of some young people can be addressed1048 … There was significant comment that attributed employment and training as having produced important changes in young people’s attitudes. This middle-aged woman had noticed that: ‘More jobs meaning younger people are working which helps young people to start to think properly.’ Similarly this young woman commented that: ‘More people looking for work so less fighting and
1040 Australian Government, op. cit., p. 6. 1041 ibid. 1042 FaHCSIA, Closing the Gap in the Northern Territory, July 2010 to December 2010, Whole of government monitoring report, Part 1, ‘Overview of measures’, 2010, p. 16. 1043 Internal DEEWR reporting based on input provided by jurisdictions. 1044 G Shaw and P d’Abbs, op. cit., p. 2. 1045 ibid., p. 4. 1046 ibid., p. 138. 1047 ibid., pp. 7–8. 1048 ibid., p. 56.

Welfare reform and employment
356 Northern Territory Emergency Response: Evaluation Report 2011
trouble. Men who used to be fighting against each other now in jobs working together.’1049 There was also significant qualitative feedback suggesting that adults finding employment has improved the way they care for their children. ‘My life is good I got job feeding my families.’ ‘Got proper job with contractors and now with shop. Kids all going to school, and more food on the table.’ Several parents also commented that they felt better about their lives because their children were attending school. ‘Working now, sending kids to school and stopped being a violent person.’1050
Community Employment Brokers
While no formal evaluation of CEBs has been undertaken, the NTER Review Board reported that community members and key stakeholders questioned whether CEBs could make a difference to job availability in remote communities. The board concluded:
There is a high degree of scepticism within the communities we visited about the role of CEBs and the reliability of figures submitted. We came to the view that the role and worth of the CEB position was seriously questioned in enough communities to warrant an early reconsideration of the way in which a potentially valuable resource can be better aligned to the needs of the community.1051
Essentially, the CEBs were seen as potentially useful resources that were not being targeted effectively. The NTER Review Board recommended that CEBs focus on mentoring, case management and training support, especially with CDEP participants, undertake workplace assessments and coordinate activities between education and training providers and Job Network providers.
DEEWR asserts that CEBs were:
instrumental in developing an active participation culture in communities, in promoting awareness of employment and training opportunities, identifying local jobs and supporting local enterprise. They assisted with the removal of RAEs, the implementation of community clean-up activities and the creation of more than 2,000 jobs in government service delivery. They have worked with School Nutrition providers to embed the program in communities [and played an] important role in the coordination of changes to education, employment services and early childhood and the development of new partnerships and economic opportunities in prescribed communities. [They also used] their knowledge of communities to introduce new providers to key community stakeholders and share information on community interests and current and potential projects.1052
With the initial stage of the NTER in relation to employment being concluded and with JSA providing a more tailored service to disadvantaged job seekers, the role of CEBs was deemed no longer required beyond 30 June 2009. Clearly, there was a need for a coordinating presence in NTER communities to help facilitate the massive changes in employment policy that were occurring.
Language, Literacy and Numeracy Program
Given the low educational outcomes and/or limited school attendance in prescribed areas, language, literacy and numeracy support is essential to assist Indigenous job seekers to access sustainable employment.
1049 ibid., p. 61. 1050 ibid., pp. 91–92. 1051 NTER Review Board, op. cit., p. 23. 1052 DEEWR, unpublished presentation to NTER Review Board, September 2008.

Welfare reform and employment
Northern Territory Emergency Response: Evaluation Report 2011 357
Table 9.4 Literacy and numeracy
Period Number of referrals to LLNP in NTER communities 1 Aug 2007 – 31 Oct 2007 0 1 Nov 2008 – 31 Jan 2008 218 1 Feb 2008 – 30 Jun 2008 591 1 July 2008 – 31 Dec 2008 530 1 Jan 2009 – 30 Jun 2009 366 1 July 2009 – 31 Dec 2009 240 1 Jan 2010 – 30 Jun 2010 113 1 July 2010 – 31 Dec 2010 384 The 2009–10 referral data are not directly comparable with earlier periods, as LLNP training delivery, number of places and funding have changed substantially. Source: FaHCSIA, Closing the gap in the Northern Territory: Monitoring report, July 2010 to December 2010, Part 2, Canberra, 2010.
As illustrated in Table 9.4, there were increasing numbers of referrals from the baseline to December 2009. Referrals peaked in the reporting period ending June 2008. Between July 2010 and December 2010, there were 384 referrals to the LLNP. The total number of referrals to the LLNP during 2010 was 497; of those referrals, 54 eligible job seekers commenced training.
Table 9.5 Referral and commencement into LLNP as part of the NTER
FY Referrals(a) Commencements % Engagement Completions
Delivery of LLNP as part of NTER (1 July 2009 to 30 June 2012) 2010–11 637 142 22 0 2009–10 353 115 33 15 Total 990 257 Old service model (1 August 2007 to 30 June 2009) 2008–09 896 148(b) 17 –(c) 2007–08 809 134 (c) 17 –(c) Total 1,705 282 (a) The referral reporting period was restricted to 1 July 2010 to 30 June 2011; however, commencement data could include commencement
dates that surpass that reporting period. Providers have 8 weeks to commence a client in training, as stated in the LLNP guidelines. Data in the report are accurate as at 13 July 2011.
(b) Commencement data by financial year for 2007–08 and 2008–09 is not available at this stage, so the total commencement figure for 2007–08 and 2008–09 has been applied on a pro rata basis of referrals (as this breakdown was available).
(c) Completion data for 2007–08 and 2008–09 are not available at this stage. Source: DEEWR, Language, Literacy and Numeracy Program (LLNP), Overview of the NTER, 2011.
Table 9.5 demonstrates that the proportion of commencements to referrals has gone up under the new community-based engagement model (see Appendix 9.A for more details). However, the completion figures remain less than expected overall. The level of Indigenous engagement in the LLNP also decreased by 18 per cent during the first half of 2010–11 when compared to previous data (33% in 2009–10). A number of factors contributed to this decline, such as provider staff changes, community unrest in Yuendumu, cultural challenges for staff in Hermannsburg and a lack of training facilities and trainer accommodation in Galiwin’ku. Once those issues have been addressed, DEEWR expects that the level of engagement will improve again.1053
1053 DEEWR, Language, Literacy and Numeracy Program (LLNP): Overview of the NTER, 2011, p. 2.

Welfare reform and employment
358 Northern Territory Emergency Response: Evaluation Report 2011
Employment measures—limitations of outcomes The following issues have been reported in relation to the implementation of the employment measures.
Economic sustainability of CDEP job conversions
The economic sustainability of the CDEP job conversions under the NTJP is questionable, given that most are related to community services. Although public sector employment is valid, necessary and has important multiplier effects1054 beyond the number of actual positions created, it very much depends on ongoing government funding. There was also an assumption that training and work experience associated with these jobs would enhance career mobility beyond the entry-level jobs that were created.1055 However, given the limited employment opportunities in most remote communities combined with the fact that NTJP funding provides little scope for remunerating career progression, there appears to be little ongoing opportunity for career mobility. There are also a range of conditions (provision of ongoing funding, Indigenous staff retention levels, continued pre-and post-employment support) that need to be monitored to ascertain the long-term impact of these jobs and their contribution to improving Indigenous economic participation in NTER communities.1056
Another consideration is the counterfactual—that is, what would have been the opportunity cost of keeping the status quo and not making this investment in ‘real jobs’ in terms of more spending on unemployment benefits, and possibly more spending on health and the criminal justice system? This type of analysis is required to fully appreciate the social and economic value of the NTJP.
The speed of implementation, the quality of engagement and the management of ongoing relationships with service providers were crucial to the successful rollout of the NTJP. However, there is also evidence that the program placed an administrative burden on service providers to identify jobs and provide intensive training support to help staff adjust to full-time work. An information gap also remains on how service providers can link to other Australian Government employment programs to receive ongoing support for their new employees.1057
Issues with increased participation requirements
The preceding commentary needs to be qualified by recognising that the intention to reform CDEP predated the NTER1058, as CDEP was perceived to be becoming a destination in itself and a structural impediment to Indigenous people finding non-CDEP training and employment. It also gave a wage subsidy for many Indigenous people when they should have been properly employed and paid a real wage.1059 At the time of the NTER, CDEP’s abolition was also considered necessary to create a single welfare system and to facilitate the quarantining of welfare payments (that is, through income management).1060
1054 In economics, the multiplier effect results when an initial amount of spending (in this case spending on government employment) leads to increased consumption spending and so results in an increase in local income greater than the initial amount of spending. 1055 ANAO, op. cit., p. 18. 1056 ibid., p. 17. 1057 ibid., pp. 17, 18, 20. 1058 ANAO, op. cit., p. 35–36. The CDEP program had for over 30 years provided subsidised labour that supported a range of government services and businesses in remote Australia. CDEP participants doing this work were not receiving the complementary benefits of normal employment arrangements. The Australian Government committed to converting its own subsidised CDEP service delivery positions into real jobs and to assisting CDEP enterprises to become viable stand-alone businesses providing jobs for local people. See DEEWR, ‘RAEs in the NT’, internal briefing provided to Employment Management Committee, September 2007. 1059 FaHCSIA, Closing the Gap in the Northern Territory, July 2010 to December 2010, Whole of government monitoring report, Part 2, ‘Progress by measure’, 2010, p. 49. 1060 S Maddison, Black politics inside the complexity of Aboriginal political culture, Allen and Unwin, 2009, p. 14.

Welfare reform and employment
Northern Territory Emergency Response: Evaluation Report 2011 359
GBMs reported some negative impacts from the partial removal of CDEP, such as that municipal services were suffering, and the move from CDEP to ‘work for the dole’ was seen by some community members as punitive.1061 According to the GBM survey, feedback in relation to the abolition of CDEP was predominantly negative. For many job seekers, CDEP represented virtually the only opportunity to get work and achieve a sense of satisfaction by contributing to community wellbeing.1062 GBMs report that, as well as having negative effects on the individuals who were working under CDEP, the abolition had negatively affected their community overall.1063. It was also extremely stressful and confusing for people to be told that CDEP was going to be abolished and then to find out it was to be reinstated a few months later.1064
Similarly, the submission to the NTER Review Board by the Central Land Council found that most people (76%) supported the continued operation of CDEP, while only 22 per cent supported its abolition.1065 Community members reported there was now:
less incentive to work because of the ‘haphazard’ nature of breaching compared with CDEP ‘no work no pay’ rules, the lack of pay differentiation between Work for the Dole and welfare, and inability to earn top-up wages.1066
According to community members, these factors resulted in falling participation in WfD versus CDEP:
The implementation of alternative programs, such as WfD, has been haphazard across communities. While a number of people have been ‘breached’ for not meeting new work requirements (involving the loss of income for eight weeks), the enforcement of work requirements varies widely between communities.1067
Indeed, a lack of participation by job seekers in the new employment programs was an ongoing issue. Attendance rates for WfD under the NTER were around half compared to national attendance rates (30% versus 60%).1068 Attendance was encouraged by making activities more attractive to participants and relevant to their communities, as well as through the compliance system. Community consultation on the nature of the activity was found to be crucial in creating community ownership, and its benefits can be seen in those communities where attendance has been comparatively high. There is also some evidence that Centrelink is not penalising people who do not meet their mutual obligation requirements in remote
1061 FaHCSIA, Northern Territory Emergency Response (NTER) monitoring report, measuring progress of the NTER activities, August 2007 – June 2008, Part 1, Canberra, 2008, p. 19. 1062 NTER Review Board, op. cit., p. 22. 1063 FaHCSIA, Northern Territory Emergency Response (NTER) monitoring report, measuring progress of NTER activities, August 2007 – June 2008, Part 2, 2008, p. 42. 1064 NTER Review Board, op. cit., p. 85. 1065 Central Land Council, op. cit., p. 5. 1066 ibid., p. 5. 1067 ibid., p. 5. 1068 FaHCSIA, op. cit., p. 51. While service delivery is less effective than it could be in remote areas, commencement data demonstrate that JSA has improved over the former Job Network in connecting with job seekers and commencing them in services. Under the former Job Network ‘Remote Services Deeds’, a commencement rate of only around 50 per cent was achieved. The JSA commencement rate at 31 August 2011 for remote area job seekers who were available for services was 88 per cent (DEEWR, JSA internal briefing, September 2011. Note: The change from Job Network to JSA does not permit direct comparisons). The commencement rate refers to job seekers commencing in JSA services (that is, not employment but activities that are broader than working experience). Under JSA, job seeker monthly contact requirements are the same for remote and non-remote job seekers in Stream services (bi-monthly contacts for work experience phase job seekers). A joint interview pilot with JSA and Centrelink has been implemented since January 2011 for compliance and improved servicing of remote job seekers. Notwithstanding the improvement under JSA, DEEWR is working with providers to maximise job seeker engagement, especially in those areas where commencement rates are lower than the remote average.

Welfare reform and employment
360 Northern Territory Emergency Response: Evaluation Report 2011
communities, further undermining incentives to participate in employment programs or look for work.1069
It should be noted that a new job seeker compliance framework was also introduced from July 2009. The framework focused more on early intervention, using more immediate corrective action to keep job seekers on the right path. This replaced the previous system, which let job seekers fail repeatedly without penalty, only to end up with an eight-week non-payment period further down the track. The new system included more immediate and more proportionate penalties, such as ‘no show, no pay’ to influence participation early—if a person fails to participate for a day they do not get paid for it. This resulted in a small increase in the overall number of compliance penalties imposed on Indigenous job seekers, but a significant decrease in the number of eight-week penalties imposed.1070
The cost of delivering WfD in remote communities was initially underestimated, especially in relation to engaging supervisors, developing provider infrastructure, and delivering services and materials to remote communities. Those costs significantly impacted on the delivery of the WfD program.1071 Service providers also experienced difficulties in their capacity to deliver WfD activities due to the short lead times to set up activities, increased workloads and costs of delivering WfD activities under the NTER. This was due to an expectation that they would be able to roll out services quickly to geographically dispersed remote areas. A lack of accommodation for providers and their staff presented and continues to present an ongoing barrier to servicing job seekers in many NTER communities.1072
There is some evidence that the ‘fly in, fly out’ model adopted by many Job Network providers (and now JSA providers) is inadequate for meeting the complex needs of remote Indigenous job seekers. This results in only a superficial understanding and inadequate knowledge of job seeker capabilities and local employment opportunities.1073 Multiple providers operating under the employment services system also added to confusion and disengagement, at least until the advent of discrete servicing in the Northern Territory under the new JSA model introduced from July 2009.1074 An ‘on the ground’ presence with expert knowledge of employment and associated services is required to ensure effective service coordination and to better appreciate and tailor to the needs of local job seekers and communities1075:
Under the new employment arrangements, Indigenous people are supported by an Employment Pathway Plan that includes provision for access to literacy and numeracy programs, work experience, help with resumes, trade equipment and training and it is reasonable to expect closer ‘on the ground’ support than that currently being provided in many cases.1076
1069 Northern Territory Government, Northern Territory Coordinator General for Remote Services Report 4, December 2010 to May 2011, 2011 p.65. It should be noted that there has been a significant increase in the proportion of participation reports (the compliance tool for JSA’s reporting job seeker participation failures to Centrelink) applied in remote areas from July 2010 onward. 1070 FaHCSIA, Closing the Gap in the Northern Territory monitoring report, July 2010 to December 2010, Part 2, Canberra, 2010, pp. 45–46. 1071 FaHCSIA, Closing the Gap in the Northern Territory Monitoring Report, July 2009 to December 2009, Part 2, Canberra, 2009, p. 66. DEEWR recognises the additional cost to provide services in remote areas through the application of the 1.7 multiplier for service fees and EPF credits for JSA providers in remote areas. To support work experience providers’ capacity to deliver activities, DEEWR also made significant funds available through the ancillary payment mechanism, over and above what was available through work experience funding and service fees. 1072 ibid., p. 47. 1073 NTER Review Board, op. cit., p. 22. The frequency of JSA visiting will depend on the JSA provider’s site visiting schedule, geographic location and the accessibility of communities. While communities subject to outreach servicing will not have a permanent JSA presence, the JSA visiting schedule may vary among weekly, fortnightly and monthly contacts. A ‘fly in, fly out’ model is not ideal: the lack of time in the community, the frequency of visits and the lack of continuity in staff who visit the community make it more difficult and less effective. Some providers may attend once per month and others more frequently, with varying results in performance. 1074 ibid., p. 22. Currently, most of the Northern Territory is subject to areas of discrete servicing. Discrete service areas are remote areas where a single JSA provider provides JSA services to one or more communities in an agreed area of service. 1075 Department of Finance and Deregulation, Strategic review of Indigenous expenditure, February 2010, p. 169. 1076 ibid., p. 169.

Welfare reform and employment
Northern Territory Emergency Response: Evaluation Report 2011 361
there is currently a lack of appropriately skilled Australian Government presence ‘on the ground’ to monitor the performance of contracted providers. Until recently (30 June 2009) Community Employment Brokers (CEBs) were available in some NT communities to help coordinate employment related services. Whilst the Government Business Managers (GBM) operating in the same communities were seen as generalists, the CEBs acted as specialist relating to employment and training program, assisting to remove barriers for Indigenous people seeking access to these services. This ‘on the ground’ presence also provided a mechanism to monitor the performance of contracted providers, to ensure Indigenous clients where available to access services and to provide ‘on the ground’ intelligence to providers on any environmental or cultural events that would prevent community members from availing themselves to training to accessing services. As the role of the GBMs matures, it is possible for these officers or the associated Indigenous Engagement Officers to undertake this role. However, an ‘on the ground’ presence with a detailed knowledge of the intricacies of employment and associated services will be required to ensure that services are coordinated appropriately including to meet the needs and circumstance of local Indigenous individuals and communities. It is recommended that DEEWR and FaHCSIA review ‘on the ground’ staffing arrangements to address these service delivery issues.1077
The Australian Government’s recently released discussion paper, The future of remote participation and employment servicing arrangements, also notes some of these issues and raises others in relation to the current model of remote employment servicing. In particular, it highlights a lack of coordination between providers and programs (particularly CDEP and JSA), inflexible servicing that is unresponsive to local community needs, and confusion amongst job seekers caused by fragmented servicing arrangements:
The Government recognises that while the current market-driven employment services are suited to urban and regional Australia, they do not adequately address the issues specific to remote Australia. Services can be fragmented and their goals are not always aligned. Programs can be inflexible and unresponsive to community needs and aspirations. In some cases services within communities are delivered by several different providers. This can be confusing for the communities and the people living in them. There is also evidence of underutilisation of CDEP program places.1078
Removal of remote area exemptions
Some GBMs report issues with the removal of RAEs, arguing that in some communities there are few jobs to apply for. Issues raised include that looking for work to get payments is unrealistic in communities with limited employment opportunities (this issue is compounded when many job seekers face multiple barriers to finding and keeping a job).1079 Some GBMs feel that the introduction of fortnightly forms is difficult for people with low literacy skills. However, the removal of RAEs was seen as essential to encouraging active participation in work-related activities, reducing welfare dependency and ensuring that people living in remote areas had access to training and other work-related activities designed to improve their chances of gaining employment.1080 As the Northern Territory Coordinator General, Bob Beadman, points out, RAEs, while well-meaning in policy intent, delivered perverse incentives and a clear message in practice: ‘You never have to work again. The government will keep you for life.’1081
1077 ibid. 1078 Australian Government, op. cit., p. 7. 1079 Some of this may relate to misunderstandings, in that providers do not have to include job search as an activity if it has no relevance in a location. While people must have at least one compulsory activity, it could be an activity that does not require a job search component and can in fact be anything that the JSA provider and job seeker feel is relevant to the person’s goals and aspirations. 1080 Australian Government, Budget 2007–08 Indigenous Affairs: Enhancing opportunities for employment and participation in remote communities, 2007. 1081 Northern Territory Government, op. cit., p. 59.

Welfare reform and employment
362 Northern Territory Emergency Response: Evaluation Report 2011
The interplay between the employment and welfare systems in terms of the ease in which people can move in and out of work, high effective marginal tax rates for those transitioning to work1082 and the fact that ‘very few people living in remote areas who are reported for “failure to participate” are subsequently breached’1083, all combine to work against the original aims and intention of the removal of RAEs.
Conclusion This section discusses some of the findings and outcomes that flow from an examination of the welfare reform and employment measures implemented under the NTER and NTNPA.
Welfare reform There is some evidence suggesting that welfare reform had some positive effects, although the limitations of the evaluations and consultations conducted to date mean that further research is necessary to confirm those findings. In addition, income management has only been in place for four years and it may be too soon to be definitive about improvements and successes, as they can only be determined on the basis of a generational change supported by quantitative evidence rather than qualitative or anecdotal evidence. It should be noted that the new model of income management is currently being thoroughly evaluated and further modifications will be made to the program if it is demonstrated that changes are required.1084
Those qualifications aside, the evidence collected to date suggests that the welfare reforms may have strengthened communities, making them more sustainable and safer, particularly for women and children. Income management may also have contributed to healthier children who have more access to food. There is also some evidence of improvements in community wellbeing, with less humbugging and less cash being available for gambling, cigarettes and substance abuse, as well as more spending by families on priority goods. The licensing of community stores has also resulted in a greater quantity and wider range of healthy foods being available for community members.
However, income management may have also come at a cost of reducing some people’s access to travel and contribution to meeting cultural and family obligations.1085 This was particularly evident in the early days of income management. Ongoing improvements to the program—such as the introduction of the store card and later the BasicsCard, the introduction of security measures such as PIN codes, the introduction of a toll-free telephone number to check account balances, simplifying the process for customers making and changing their income-managed fund allocations, a wider range of stores and merchants that accept the BasicsCard or income-managed funds transfers—have mitigated these issues to some extent. There was also much confusion during the implementation phase of income management due to the speed of implementation and a lack of adequate communication and consultation. Furthermore, determining a customer’s BasicsCard balance continues to be a major issue for many stores and people on income management.
While the licensing of community stores has resulted in a wider range of healthy foods being available, there is a risk that price increases may have counteracted that benefit to some extent and reduced community members’ ability to access healthy items. However, the cause of the price increases over this period is unclear and requires further investigation.
1082 ibid., p. 11. 1083 ibid. 1084 For more information on the evaluation framework which will be used to test the effectiveness of new income management, see Social Policy Research Centre, op. cit.It should be noted that an evaluation of income management is currently occurring in Western Australia. 1085 FaHCSIA, Closing the Gap in the Northern Territory monitoring report, July 2009 to December 2009, Part 2, Canberra, 2009, pp. 77–78.

Welfare reform and employment
Northern Territory Emergency Response: Evaluation Report 2011 363
In addition, some community members’ negative perceptions of the NTER have been unduly influenced by one measure in particular—income management. The compulsory nature of income management and its blanket imposition (in combination with other changes, such as local government reform, shire amalgamations and losses of local councils; changes to CDEP; the loss of the permit system; and changes in land tenure) are likely to have contributed to people’s feeling of a loss of freedom, empowerment and community control.1086 This may have resulted in a generalised lack of engagement by community members in many of the programs and initiatives introduced under the NTER and NTPA and may partly explain the lack of engagement in work experience activities such as WfD, CDEP and the LLNP. This highlights the importance of moving away from a ‘one size fits all’ and/or a ‘fly in, fly out’ model towards an ‘on the ground’ presence that works with local authority structures, builds on approaches that are already working and encourages local Indigenous social and cultural ownership. As Senator Arbib recently said: ‘Remote communities and the people who live in them are extremely diverse. A new, tailored approach to participation and employment services for remote Australia needs to be able to respond to emerging local economic opportunities.’1087
Employment measures The employment measures, particularly the conversion of CDEP jobs, have resulted in some gains in employment. Under the NTJP, 2,241 ongoing jobs were created in Australian and Northern Territory government positions. In addition, between July 2007 and December 2010 more than 4,100 job placements were brokered via Job Network and JSA providers in prescribed areas.
The recently completed CSWRS found that better employment opportunities were the most frequently cited reason for people feeling that their own lives were improving and that their community was on the way up.
However, the economic sustainability of the CDEP job conversions is questionable, given that most are related to community services. Although public sector employment is valid and necessary and has important multiplier effects beyond the number of actual positions created, it very much depends on ongoing government funding. In addition, while it was assumed that training and work experience would enhance career mobility beyond the entry-level jobs created, limited employment opportunities combined with a lack of NTJP funding mean there is little chance of career progression or mobility.1088 Furthermore, conditions such as the provision of ongoing funding, Indigenous staff retention levels and continued pre- and post-employment support need ongoing monitoring to determine the long-term impact of these jobs on improving Indigenous economic participation.
Clearly, whole-of-government coordination remains a key challenge in the delivery of employment services. As the Australian Government’s recently issued discussion paper on remote participation and employment services states:
New remote participation and employment services arrangements, due to be in place by 1 July 2013, should be simpler, more integrated and more flexible than existing arrangements.1089
1086 G Shaw and P d’Abbs, op. cit., p. 77. 1087 J Macklin and M Arbib, ‘Discussion paper on remote participation and employment services’, joint media release, 16 August 2011. 1088 ANAO, op. cit., p. 23. ‘Service providers also raised concerns that funding under the initiatives does not provide scope to advance employees to higher duties or recognise the skills obtained from the training component of the packages.’ 1089 Australian Government, The future of remote participation and employment servicing arrangements, discussion paper, August 2011, p. 4.

Welfare reform and employment
364 Northern Territory Emergency Response: Evaluation Report 2011
There should be a review of the interactions and potential overlaps between the restructured Community Development Employment Projects (CDEP) program, the Indigenous Employment Program and Job Services Australia programs … to support more effective and integrated delivery of employment-related programs and services, responsibility for CDEP should be transferred from FaHCSIA to DEEWR.1090
Experience has shown that an ‘on the ground’ presence with expert knowledge of employment and associated services is also required to ensure effective service coordination and to better appreciate and tailor to the needs of local job seekers and communities.1091 A local presence would be ideally placed to work with service providers, tapping into their knowledge of communities and community aspirations to support better employment outcomes, including the capacity to identify untapped jobs and develop pathways for people to enter work and to achieve job advancement through training and other developmental activity.
Those points aside, in the absence of sustainable economic development the effectiveness of employment measures was always going to be limited in terms of reducing unemployment in NTER communities. Sustainable economic development would require removing barriers to genuine commercial ventures, such as poor transport infrastructure, inadequate education/training services (that currently fail to engage people) and current land tenure arrangements that fail to provide the long-term leases necessary for organisations to be assured a reasonable return on investment. Enabling initiatives would also be required, such as comprehensive mobility programs (that successfully engage job seekers), the enshrinement of the merit principle as the sole basis for employment, and Commonwealth procurement guidelines that relax mandatory procurement procedures for Indigenous-owned enterprises (note that this change to procurement practices is now in place).
1090 ibid., p. 21. 1091 Department of Finance and Deregulation, op. cit., p. 169.

Welfare reform and employment
Northern Territory Emergency Response: Evaluation Report 2011 365
Bibliography Altman, J & M Hinkson, Culture crisis: Anthropology and politics in Aboriginal Australia, 2010.
Altman, J, G Buchanan & N Biddle, ‘The real ‘real’ economy in remote Australia’, in Assessing the evidence on Indigenous socioeconomic outcomes: A focus on the 2002 NATSISS, Boyd Hunter (ed.), ANU E-press, Canberra, 2006.
Anderson, P & R Wild, Ampe Akelyernemane Meke Mekarle: ‘Little children are sacred’: Report of the Northern Territory Board of Inquiry into the Protection of Aboriginal Children from Sexual Abuse, Northern Territory Government, Darwin, 2007.
ARTD Consultants & Westwood Spice, Development of program logic options for the NTER, unpublished report prepared for FaHCSIA, 2010.
Australian Bureau of Statistics, Consumer Price Index, Australia (Cat. No. 6401.0), Australian Bureau of Statistics, Canberra, 2010.
Australian Government, Budget 2007–08: Indigenous Affairs: Enhancing opportunities for employment and participation in remote communities, 2007, <http://www.fahcsia.gov.au/about/publicationsarticles/corp/BudgetPAES/budget2007-08/Documents/07_indigenous_07.pdf>.
Australian Government, Policy statement: Landmark reform to the welfare system, reinstatement of the Racial Discrimination Act and strengthening of the Northern Territory Emergency Response, November 2009.
Australian Government, Stronger futures in the Northern Territory, discussion paper, June 2011.
Australian Government, The future of remote participation and employment servicing arrangements: Discussion paper, August 2011.
Australian Institute of Health and Welfare, Evaluation of income management in the Northern Territory, occasional paper no. 34, 2010.
Australian National Audit Office, Indigenous employment in government service delivery, audit report no. 4 2011–12, 2011.
Biddle, N, ‘Measures of Indigenous wellbeing and their determinants across the lifecourse’, 2011 CAEPR Online Lecture Series, Centre for Aboriginal Economic Policy Research, Australian National University, <http://caepr.anu.edu.au/population/lectures2011.php>.
Brimblecombe, JK, J McDonnell, A Barnes, J Garnggulkpuy Dhurrkay, DP Thomas & RS Bailie, ‘Impact of income management on store sales in the Northern Territory’, Medical Journal of Australia, 192(10), 17 May 2010.
Central Land Council, Reviewing the Northern Territory Emergency Response: Perspectives from six communities, July 2008.
Central Land Council, Submission into the inquiry into community stores in remote Aboriginal and Torres Strait Islander communities, February 2009.

Welfare reform and employment
366 Northern Territory Emergency Response: Evaluation Report 2011
COAG Reform Council, National Indigenous Reform Agreement: Baseline performance report for 2008–09, report to the Council of Australian Governments, April 2010.
Coggan, M, ‘Tensions fray over crime in Alice Springs’, ABC News, March 2011.
Council of Australian Governments, Closing the Gap in the Northern Territory National Partnership Agreement, 2011.
Cultural and Indigenous Research Centre Australia (CIRCA), Community feedback on the Northern Territory Emergency Response (NTER) Research Report, FaHCSIA, September 2008.
Cultural and Indigenous Research Centre Australia (CIRCA), Evaluation of the Community Stores Licensing Program, final report, May 2011,
Department of Education, Employment and Workplace Relations (DEEWR), ‘RAEs in the NT’, internal briefing provided to Employment Management Committee, September 2007.
——, unpublished presentation to NTER Review Board, September 2008.
——, Northern Territory Jobs Package in government services delivery status report, data current at 30 June 2010.
——, NTER internal briefing, February 2010.
——, JSA internal briefing, September 2011.
——, ‘Language, Literacy and Numeracy Program (LLNP): Overview of the NTER’, unpublished paper, 2011.
——, internal reporting based on input provided by jurisdictions.
Department of Families, Housing, Community Services and Indigenous Affairs (FaHCSIA), Northern Territory Emergency Response (NTER) monitoring report: Measuring progress of the NTER activities, August 2007 – June 2008, Part 1, Canberra, 2008.
——, Northern Territory Emergency Response (NTER) monitoring report: Measuring progress of the NTER activities, August 2007 – June 2008, Part 2, Canberra, 2008.
——, Northern Territory Emergency Response (NTER) monitoring report: Measuring progress of the NTER activities, July 2008 – December 2008, Part 1, Canberra, 2008.
——, Northern Territory Emergency Response (NTER) monitoring report: Measuring progress of the NTER activities, July 2008 – December 2008, Part 2, Canberra, 2008.
——, Closing the Gap in the Northern Territory monitoring report, January 2009 to June 2009, Part 1, Canberra, 2009.
——, Closing the Gap in the Northern Territory monitoring Report, July to December 2009, Part 2, <http://www.fahcsia.gov.au/sa/indigenous/pubs/nter_reports/closing_gap_NT_jul_dec_2009/Documents/Part2_Monitoring_Report/sec3.htm>.
——, Closing the Gap in the Northern Territory monitoring report, January 2009 to June 2009, Part 2, Canberra, 2009.

Welfare reform and employment
Northern Territory Emergency Response: Evaluation Report 2011 367
——, Closing the Gap in the Northern Territory monitoring report, July 2009 to December 2009, Part 1, Canberra, 2009.
——, Closing the Gap in the Northern Territory monitoring report, July 2009 to December 2009, Part 2, Canberra, 2009.
——, Final stores post licensing monitoring report, 2009.
——, Report on the Northern Territory Emergency Response redesign consultations, 2009.
——, ‘Northern Territory Emergency Response Whole-of-Government Evaluation Strategy in accordance with the Closing the Gap in the Northern Territory National Partnership Agreement’, unpublished report, FaHCSIA, Canberra, 2010.
——, 2009 Survey of government business managers relating to the impact of the Northern Territory Emergency Response, February 2010.
——, Closing the Gap in the Northern Territory monitoring report, January 2010 to June 2010, Part 1, Canberra, 2010.
——, Closing the Gap in the Northern Territory monitoring report, January 2010 to June 2010, Part 2, Canberra, 2010.
——, Closing the Gap in the Northern Territory monitoring report, July 2010 to December 2010, Part 1, Canberra, 2010.
——, Closing the Gap in the Northern Territory monitoring report, July 2010 to December 2010, Part 2, Canberra, 2010.
——, special data request, 2010.
——, Submission of background material to the Northern Territory Emergency Response Review Board, 2008.
Department of Finance and Deregulation, Strategic review of Indigenous expenditure, February 2010.
DSI Consulting Pty Ltd, A critique of the published statistical analysis in a study by the Menzies School of Medical Research, August 2010.
Heferen, R (FaHCSIA), Committee Hansard, 26 February 2010, p. 49.
Horn, A, ‘Intervention meeting hears of anger and frustration’, ABC News, 3 August 2011.
Howard, J, Lazarus rising: A personal and political autobiography, Harper Collins, 2010.
Johns, G, Aboriginal self-determination: The whiteman’s dream, Connorcourt Publishing, 2010.
Macklin, J & M Arbib, ‘Discussion paper on remote participation and employment services’, joint media release, 16 August 2011.
Macklin, J, media release, 22 June 2010.
Maddison, S, Black politics inside the complexity of Aboriginal political culture, Allen and Unwin, 2009.

Welfare reform and employment
368 Northern Territory Emergency Response: Evaluation Report 2011
National Museum of Australia, Collaborating for Indigenous rights, Equal wages 1963–66, <http://www.indigenousrights.net.au/section.asp?sID=6>.
Northern Territory Government, data collection, April 2010
Northern Territory Government, Northern Territory Coordinator General for Remote Services Report 4, December 2010 to May 2011, 2011.
NTER Review Board, Northern Territory Emergency Response Report of the NTER Review Board, 2008.
O’Connor, B, ‘Reform of employment services in Australia’, speech, 2 September 2008, <http://www.deewr.gov.au/Ministers/OConnor/Media/Speeches/Pages/Article_081007_125407.aspx>.
Pearson, N, ‘Our right to take responsibility’, in Up from the mission, Black Inc, 2009.
Shaw, G and P d’Abbs, Community Safety and Wellbeing Research Study consolidated report, FaHCSIA, Canberra, 2011.
Sisto, V, CDEP: Mutual obligation that works, Uniya briefing paper, March 2006, <http://www.uniya.org/research/mo_disisto_mar06.pdf>.
Social Policy Research Centre, Evaluation framework for New Income Management (NIM), Australian Institute of Family Studies, December 2010.
Sutton, P, The politics of suffering: Indigenous Australia and the end of the liberal consensus, Melbourne University Press, 2009.

Housing and land reform
Northern Territory Emergency Response: Evaluation Report 2011 369
10 Housing and land reform
KPMG
Key findings This report evaluates the Housing and Land Reform sub-measures under the Northern Territory Emergency Response (NTER) and Northern Territory National Partnership Agreement (NTNPA). These sub-measures are the introduction of five-year leases, changes to permits for accessing Aboriginal land, the Community Clean Up and Urgent Repairs to Infrastructure initiatives, and the provision of accommodation to Government Business Managers (GBMs). The key findings of the evaluation in relation to each sub-measure are summarised below.
Five-year Leases • The five-year leases acquired by the Australian Government provide the legal basis for
accessing particular NTER communities1092, and underpin short-term investments by providing the security of tenure necessary for undertaking urgent improvements to buildings and infrastructure, and the construction of new assets.
• Five-year leases have enabled repairs and upgrades to community housing and related infrastructure to occur, and provide a means of formalising government obligations as the landlord of public housing. As a result, they have been an enabler for a range of NTER measures which have contributed to significant positive impacts in these communities.
The extent to which five-year leases are promoting longer term security of tenure and economic development, however, is less clear. To demonstrate this relationship, it is necessary to observe a link between the five-year leases and the negotiation of longer term leases that can enable sustained investments to occur.
• Department of Families, Housing, Community Services and Indigenous Affairs (FaHCSIA) officers have observed that the five-year leases have formalised land dealings in NTER communities and have established practices and behaviours that are more conducive to leasing and the payment of rents. However, information provided by the Northern and Central land councils suggests that the majority of agencies and organisations that have been granted land use approvals under the five-year lease arrangements have, to date, not applied for long-term leases over assets subject to a land use approval under a five-year lease.
• Whilst there is evidence to show that Aboriginal community-controlled organisations and publicly funded non-government organisations (NGOs) have done so, local government has not applied for long term leases. With the exception of 10 long-term housing precinct leases negotiated by the Australian and Northern Territory governments in communities where major housing works are to be delivered, the Australian Government has also been slower to negotiate long-term leases for its assets. Where the Northern Territory Government has done so, this has at times been achieved through negotiations with land
1092 Five-year leases are held over 64 of the 73 NTER communities; the remainder are subject to alternative lease arrangements, including township leases.

Housing and land reform
370 Northern Territory Emergency Response: Evaluation Report 2011
councils on behalf of traditional owners, without first obtaining a land use approval under a five-year lease.
Permit Reforms • The primary benefit of exempting personnel involved in the delivery of the NTER from the
requirement to obtain a permit appears to have been administrative, in that it has reduced red tape in the approval process and therefore enabled a more streamlined deployment of NTER personnel.
• Since applications by public servants made under the Aboriginal Land Act (NT) were rarely rejected prior to the NTER, it cannot be concluded, however, that relaxing permit requirements for this class of persons has opened access to Aboriginal communities for public servants.
• Evidence regarding the broader impacts of amendments to the permit system, in terms of enabling access to communities for ‘beneficial purposes’, or inadvertently enabling access for ‘undesirable persons’, is inconclusive.
Community Clean Up and Urgent Repairs to Infrastructure • The available qualitative evidence suggests that all scheduled works under the
Community Clean Up and Urgent Repairs to Infrastructure sub-measures were undertaken and completed and that the objectives of the programs were met. Given the purpose and scope of these projects (to fix community housing and infrastructure), successfully completed works are likely to have led to improvements in local amenity and health and safety.
• The precise nature of the impacts of these projects is unable to be quantified. Data internal to these programs, identifying what work was completed and verified as meeting an approved minimum standard, as well as what outcomes were achieved, have not been synthesised on a whole-of-program basis for analysis by KPMG.
• Evidence of specific community impacts in terms of changes to health and wellbeing are inferred or anecdotal; there is also no comprehensive record of employment or training outcomes achieved by these measures.
Government Business Manager Accommodation • The available evidence suggests that the objectives of the GBM Accommodation project
were met, in that accommodation was provided in all communities requiring accommodation for NTER personnel. It is likely that the provision of accommodation has supported the requirement for GBMs to live and work full time in communities.
• However, the available data cannot conclusively demonstrate the extent to which the project has enabled GBMs to meet their broader objectives in the communities.

Housing and land reform
Northern Territory Emergency Response: Evaluation Report 2011 371
Introduction
The Northern Territory Emergency Response The Australian Government introduced the NTER in June 2007, in response to the release of the ‘Little children are sacred’ report.1093 The NTER targeted Indigenous communities and town camps in the Northern Territory and introduced a set of measures aimed at protecting children and making communities healthier and safer.
From July 2009, the NTER measures have been managed under the NTNPA, which expires in December 2012. The anticipated outcomes of the NTER, as documented in the agreement are:1094
• improved safety, health and wellbeing of Indigenous children
• improved school engagement and performance
• sustainable communities to support children and youth, including through education and employment pathways.
The NTNPA maintains and strengthens core NTER measures—around law and order, child and family health, supporting families, enhancing education, welfare reform and employment—while placing a greater emphasis on community engagement and partnerships, and building capability and leadership within Indigenous communities. The agreement also identifies ‘resetting the relationship between Governments and Indigenous peoples’ as an objective.1095
Housing and Land Reform sub‐measures
The five Housing and Land Reform sub-measures under the NTNPA are assessed in this chapter:
• The Five-year Leases sub-measure involved the compulsory acquisition of five-year leases over 64 NTER communities on Aboriginal Land Rights (Northern Territory) Act 1976 (Cwth) (ALRA) land, Northern Territory Crown Land, and Community Living Areas under the Pastoral Land Act (NT).1096 The objective of the acquisition was to ‘enable Government to provide prompt access for the delivery of services, repair of buildings and development of infrastructure in communities as part of the NTER’.1097
• Permit Reforms involved changes to permit requirements regulating access to Aboriginal land, shifting from the removal of particular permit requirements in 2007 to a stalled policy of reinstatement in 2008, while continuing to enable government and NTER personnel to access communities without the requirement to obtain a permit.
• Urgent Repairs to Infrastructure (URTI) involved immediate repairs to community infrastructure, including essential services and community facilities, to assist in addressing unmet infrastructure needs in communities and contribute to longer term improvements in the health and wellbeing of residents, while building the credibility of the NTER and GBMs.1098
1093 P Anderson and R Wild, Ampe Akelyernemane Meke Mekarle: ‘Little children are sacred’: Report of the Board of Inquiry into the Protection of Aboriginal Children from Sexual Abuse, Northern Territory Government, Darwin, 2007. 1094 Council of Australian Governments (COAG), Closing the Gap in the Northern Territory National Partnership Agreement (NTNPA), 2011. 1095 ibid. 1096 Department of Families, Housing, Community Services and Indigenous Affairs (FaHCSIA), ‘Five-year leases’ poster. 1097 Explanatory statement, NTER (land use approvals) guidelines, 2010. 1098 FaHCSIA, Submission of background material to the NTER Review Board, Canberra, 2008.

Housing and land reform
372 Northern Territory Emergency Response: Evaluation Report 2011
• The Community Clean Up (CCU) program was a one-off housing repairs and minor works initiative, to undertake urgent make-safe and minor repair works ahead of the Strategic Indigenous Housing and Infrastructure Program (SIHIP).1099
• Government Business Manager Accommodation aimed to provide accommodation for Australian Government personnel, to enable GBMs to live and work full time in NTER communities and carry out their responsibilities to improve community engagement and whole-of-government coordination in communities.1100
Purpose of the evaluation
In assessing the five Housing and Land Reform sub-measures, the aim is to evaluate the extent to which the measures have been enablers for development and contributed to improvements in the sustainability of NTER communities (defined as lasting, equitable and positive social and economic change).
To that end, three broad research themes are used in the analysis of individual sub-measures:
• identification, description and assessment of the implementation and outputs of each measure, in terms of the effectiveness of the measure’s resourcing, design, management and delivery
• consideration of how the measures have supported, or been supported by, other measures under the NTER, so that their impacts might be maximised and their efficacy enhanced
• description and assessment of the impacts of each measure on communities, in terms of affecting positive social and economic change, in conjunction with the meaningful participation of community members.
Approach to the evaluation
The evaluation of Housing and Land Reform sub-measures is constrained by the type and availability of program and project data relating to each initiative. Although a detailed evaluation framework was initially prepared, the scope of the analysis undertaken is constrained by the quality and type of secondary data available, and the scope of qualitative information provided.
In many instances the emergency nature of the initiative, which reportedly precluded comprehensive ongoing and systematic monitoring and data collection, has meant that limited ‘hard’ data are available, while many of the personnel originally involved in the implementation of the measures are no longer employed by the department and could not be interviewed as part of this process. The emergency nature and rapid implementation of the NTER have in many instances impacted on the quality of information available.
The initial scope of the evaluation was limited to a desk-based analysis of secondary material available on each measure, although this was later varied to include a small number of interviews with program staff and land council representatives, so that any gaps and limitations with the available data could, where possible, be addressed.
In undertaking the evaluation, the following research process was followed:
1099 ibid. 1100 FaHCSIA, Government Business Managers: Statement of roles and responsibilities, cited in Australian National Audit Office (ANAO), Government business managers in Aboriginal communities under the Northern Territory Emergency Response, performance audit report no.18 2010–11, p. 13.

Housing and land reform
Northern Territory Emergency Response: Evaluation Report 2011 373
• desktop review of existing publicly available qualitative and quantitative material, including measure evaluation documents, monitoring and other reports, survey material and administrative data
• development of an evaluation framework, including, to the extent possible, the construction of a baseline against which to measure changes since the NTER, and agreeing outcomes and indicators for assessment
• secondary analysis of existing databases, where they were available
• assessment of the content, extent and quality of available data and refinement of the evaluation framework
• qualitative assessment of material during interviews with available program staff and land council representatives, and collaboration with other NTER evaluation authors.
Assessment of each sub-measure was constrained specifically by the following gaps and caveats in relation to the quality and availability of data.
Five‐year Leases
There is no public register of approved land uses on five-year lease land, and there are a number of data quality issues associated with FaHCSIA’s database used to record land use approvals on five-year lease land. They include inconsistency in the terms used to describe approved uses and inconsistencies between dates of application and dates of approval. Moreover, an approved land use cannot necessarily be linked to a surveyed lot, since most remote communities in the Northern Territory have not undergone a formal land survey1101, or else land use approval has been granted on unserviced land for which a lot number has not been allocated.1102
It is therefore not possible, using this database, to link approved land uses with specific public investments in individual communities, and a comprehensive register of public and private investments made in five-year lease communities is not available. Nor is it possible to determine the prior land use, to assess whether a higher value land use has been approved, since records of prior uses, including unregistered leases, are not systematically made available to the Australian Government.1103
Permits
Permit data relating to the issue of permits to the public are collected by individual land councils. Prior to the NTER, government personnel applied for permits from the relevant Northern Territory Minister under the Aboriginal Land Act (NT), for which permit data are not available. There is no consolidated central public register of permit applications and approvals. The information made available for this study is recorded in a variety of formats and categories, preventing robust comparison.
Historical and current data on the number of NTER personnel visiting remote communities since the removal of permit requirements are recorded by the Australian Government in its Visiting Officer Notification (VON) system. These data provide only a partial record of total visits: the system is compulsory for Australian Government personnel, but voluntary for Northern Territory Government personnel and NGO staff.
1101 Record of interview with FaHCSIA Land Reform Branch, 28 July 2011. 1102 Comments by FaHCSIA Land Reform Branch, 6 September 2011. 1103 Comments by FaHCSIA Land Reform Branch, 12 August 2011.

Housing and land reform
374 Northern Territory Emergency Response: Evaluation Report 2011
Furthermore, in regard to the proposition that the revision of permit requirements for the public has limited opportunities for ‘suspect’ persons to be removed, there are no usable data available on the number of persons entering Aboriginal communities without a permit who have committed an offence, meaning that commentary on this issue is anecdotal.
Urgent Repairs to Infrastructure
No formal URTI program planning or design documentation was made available, and systems and criteria for identifying tasks could not be comprehensively assessed because of the absence of program documentation. Based upon extracts of URTI surveys conducted by FaHCSIA, tasks were identified on the basis of ‘kerbside’ observation, as opposed to a systematic assessment of infrastructure item by item. No benchmark therefore exists against which the efficacy of the URTI measure can be evaluated.
No verified data on the successful completion of projects or the time taken to complete from identification are available. The primary monitoring system used is the Grant Management System, which provides a record of funds acquitted by project, and not a record of verified completed works per se. Monitoring of individual projects occurred at a local level, and no such data are systematically collated across the program.
No comprehensive data on the involvement of Indigenous labour in the delivery of URTI projects are available. Although FaHCSIA’s Northern Territory office indicated that Community Development Employment Projects (CDEP) participation was encouraged and utilised where possible, further interviews with individual GBMs and CDEP managers would be required to explore these outcomes.
Community Clean Up
A ‘high level summary of activity’ provided in NTER monitoring reports is the principal source of information for external reporting purposes and provides the most comprehensive available picture of the CCU program (Appendix 10A).1104 It is not possible using the summary data to disaggregate and analyse the CCU program by category of works completed, by community.
The CCU program has no formal performance indicators in terms of the number of buildings or timeframe for completion of works. Individual community dwelling repair reports for each community provide the most comprehensive profile of the program. The hand coding required to prepare these reports for quantitative analysis has not, however, been undertaken, on the basis that the CCU initiative is a one-off program that has lapsed.1105
GBM Accommodation
Data linking the timing of the deployment of GBM accommodation with the deployment of GBMs and their occupation of the accommodation could not be provided. Records of the timing of installations were not available in a digital format for the department to release, and data on the date accommodation was actually occupied by GBMs (as opposed to the date they commenced in the role) were not obtainable.1106
Comprehensive data regarding the retention rates of GBMs by community were unavailable, and the summary data provided could not be used to analyse the link between the
1104 Data from FaHCSIA Indigenous Housing Policy Branch, 6 July 2011. 1105 Report from FaHCSIA Indigenous Housing Policy Branch, 6 July 2011. One example report provided shows the total value of minor repairs and major repairs approved for the community’s total housing stock, in addition to a breakdown of that work according to the trade area (electrical, plumbing or building works) and the area of the house in which the works were undertaken (kitchen, bathroom, living room). 1106 Record of interview with FaHCSIA Property Environment Procurement and Security Branch, 8 August 2011.

Housing and land reform
Northern Territory Emergency Response: Evaluation Report 2011 375
deployment of accommodation units and GBM retention. Specifically, data on the ‘reason for leaving’ could not be provided from exit interviews in a consolidated form.1107
Structure of this chapter This chapter is structured in four sections for each sub-measure under review:
• the background and policy context for the sub-measure
• an assessment of the effectiveness of the implementation of the sub-measure
• an assessment of whether the sub-measure has been an enabler, supporting the delivery of other NTER measures
• an assessment of the sub-measure’s impacts on communities.
The final section provides a summary of findings.
Five-year Leases
Background and policy context The introduction of compulsory five-year leases by the Australian Government was intended to provide both the legal basis for accessing and delivering services to communities, and the ‘breathing space’ for acquiring land access for public and private investments secured through longer term leases.1108 In the Australian Government’s response to the NTER Review, it committed to a staged transition from compulsory five-year leases over communities to longer term voluntary leasing arrangements.1109
Existing provisions for leases administered by land councils under the ALRA (known as section 19 leases) were regarded as an impediment to the timely implementation of the NTER and generally took lengthy periods of time to negotiate (reportedly around two years).1110 Furthermore, prior to five-year leases, the day-to-day regulation of land in townships was ad hoc: ‘lots’ were allocated by the then Northern Territory Department of Planning and Infrastructure despite the absence of any underlying legal right to occupy the land.1111
The formalisation of secure tenure arrangements is regarded as underpinning the long-term goals of raising service delivery standards and facilitating economic development. The Australian Government also expects that security of tenure through long-term leasing will enable the rights and obligations of tenants and landlords to be clarified and enforced, by giving housing authorities long-term access to and control over public housing assets.
More broadly, tenure reform on communally owned land in remote areas is intended to extend home-ownership opportunities and facilitate private sector investment by securing the property rights of individuals in order to encourage investment. Existing tenure arrangements in remote communities are understood by the Australian Government to impede home ownership and economic development opportunities, since community-title land lacks the tradeability necessary for prospective home owners to acquire and use an individual title, and the housing asset on it, as security against a loan.
1107 Email from FaHCSIA Workforce and Recruitment Strategies, 29 July 2011. 1108 FaHCSIA, Monitoring report measuring progress of NTER activities, July 2008 to December 2008, Canberra, 2008. 1109 Response to the Report of the NTER Review Board, May 2009. 1110 Record of interview with FaHCSIA Land Reform Branch, 29 July 2011. 1111 Comments provided by FaHCSIA Land Reform Branch, 12 Aug 2011.

Housing and land reform
376 Northern Territory Emergency Response: Evaluation Report 2011
A stated objective of the National Partnership Agreement on Remote Indigenous Housing is the progressive resolution of land tenure on Indigenous communal-title land, in order to ‘secure government and commercial investment, economic development opportunities and home ownership possibilities in economically sustainable communities’.1112
How effectively was the Five‐year Lease sub‐measure implemented?
On 1 July 2008, FaHCSIA implemented a new process for land use approval in five-year lease communities, in order to regularise land use allocations and provide greater certainty to users. In a mandatory leasing arrangement, the Australian Government sets the terms and conditions of five-year leases, including the grant of subsidiary interests (commonly known as ‘land use approvals’). The five-year leases give extensive access and use rights to the lessee, but do not affect the underlying tenure of the land or pre-existing interests, such as a lease.1113 Any improvements or fixtures built on five-year lease land revert to the owner of the land upon expiry of the five-year lease.1114
Given their compulsory nature, five-year leases were initially seen by Indigenous communities as ‘land grabs’, making people suspicious of dealings in land with government following a failure to consult with traditional owners prior to implementation.1115
This issue was compounded by the coincidental timing of the NTER with reforms to local government in the Northern Territory, which dissolved community government councils to replace them with regional shire councils. Although this process occurred independently of the NTER, the link between the compulsory acquisitions of leases and the abolition of community councils was set in the minds of communities, since both changes seemed to deprive landowners and residents of local decision-making power.1116
The design and initial implementation of the five-year lease initiative occurred over a period of weeks, and formal processes for the administration of land use approvals on five-year lease land were not in place until mid-2008.1117 In response to community feedback concerning a lack of community consultation, changes to the administration of the approvals process under five-year leases were made in 2010 following consultation with communities, land councils and expert land administrators.1118
These changes were reflected in the 2010 amendments to the Northern Territory National Emergency Response Act 2007 (NTNER) (Cwth), which clarify the objectives and permitted use of the five-year leases; require that the leases be administered in a way that respects Indigenous culture; and obligate the Australian Government to negotiate voluntary leases in good faith, if requested by the landowner. While the processes for approvals have no formal performance benchmarks, the guidelines provide for consultation with traditional owners, community leaders or other affected persons living on or near the land when reviewing land use applications.
All records of approved applications for a new or changed land use purpose on five-year lease land are maintained by FaHCSIA.1119 Over the period from July 2007 to July 2011,
1112 COAG, National Partnership Agreement on Remote Indigenous Housing, December 2008. 1113 Existing ALRA s. 19 leases are excluded from the five-year lease boundary. 1114 Human Rights and Equal Opportunity Commission, Native title report 2005, Chapter 2, 2005, <http://www.humanrights.gov.au/social_justice/nt_report/ntreport05/ch2.html#leases> accessed July 2011. 1115 NLC factsheet, 2008. 1116 Record of interview with Central Land Council (CLC), 21 July 2011. 1117 Record of interview with FaHCSIA Land Reform Branch, 29 July 2011. 1118 The Northern Territory National Emergency Response (Land Use Approvals) Guidelines 2010 were made under the Northern Territory National Emergency Response Act 2007, which came into effect in December 2010. 1119 Due to inconsistencies in the terms used, these descriptions were recoded by the authors into seven broad categories.

Housing and land reform
Northern Territory Emergency Response: Evaluation Report 2011 377
approximately 1,070 approvals were granted. The most common type of land use approval relates to housing tenancy agreements, for which 462 approvals were issued, although, as Table 10.1 shows, there were 109 requests where the category is unknown.1120
Table 10.1 Approved land use requests by re-coded category for 2009–10
Land use category Number of land use approvals Housing tenancy agreement 462 Other housing related 19 Infrastructure/services 204 Private investment 66 Staff accommodation 146 Miscellaneous 51 Unknown 109 Multiple uses 9 Total 1,066 Source: KPMG; adapted from FaHCSIA Land Reform Branch.
The time taken to approve requests varies according to the type of land use request and extent of consultation required in communities.1121 Tenancy agreement requests, or a request to change the occupier of an existing building, are generally quicker to approve than new land use requests.
How have five‐year leases been an enabler and supported the delivery of other NTER measures?
Five-year leases provide the legal basis for accessing and delivering services to 64 NTER communities and underpin investments in those communities made over the five-year period. The lease arrangements have enabled investments in community housing and related infrastructure repairs, maintenance and upgrades to occur. They have also provided an intermediate means of formalising the Northern Territory Government’s obligations as the manager of existing housing assets in remote communities, as part of new tenancy management arrangements. They have provided the legal basis for ensuring that the rights and obligations of both the tenant and the landlord (for example regarding the payment of rents, ongoing repairs and maintenance and the fair allocation of housing) are protected.
The five-year leases have therefore been an enabler for several specific NTER measures, and other initiatives, which have required short-term tenure to be secured in order to invest in the delivery of services over the period of the NTER. Those measures and initiatives include:
• implementation of legally enforceable tenancy agreements over community housing, whereby the Australian Government, as landlord, is obligated to maintain dwellings through an interagency agreement with NT Housing (or the Northern Territory Government, where housing precinct leases are in place), under which 3,000 occupancy and tenancy agreements are in place1122
• the GBM Accommodation project, Safe Houses, and the Community Stores Licensing and Aboriginal Benefit Account stores infrastructure project and other investments (such
1120 The relationship between these approvals and specific land uses on the ground is less clear, since—due to the lack of planning subdivision on remote Aboriginal communities in the Northern Territory—the base unit of analysis is a ‘request’ rather than ‘an area of land’ or ‘lot’. An individual request can therefore cover multiple lots spread over multiple communities, or it can be a single lot within one community. 1121 Record of interview with FaHCSIA Land Reform Branch, 29 July 2011. In the case of tenancy agreements, community consultation has already taken place through housing reference groups, and further consultation is not required by FaHCSIA’s Land Reform Branch. 1122 Record of interview with FaHCSIA Land Reform Branch, 29 July 2011.

Housing and land reform
378 Northern Territory Emergency Response: Evaluation Report 2011
as health centres), for which security of tenure is required prior to an investment being made1123
• CCU works and SIHIP refurbishments and upgrades, for which the leases have provided a right of access and obligated the Australian Government, as the landlord, to undertake make-safe repairs, including the removal of asbestos.1124
The five-year leases will continue to support the rollout of remaining SIHIP refurbishments to be completed in 56 communities, all subject to a mandatory five-year lease. However, given that at June 2011 only 64 per cent of the SIHIP program target of 2,500 housing refurbishments had been completed (1,592 refurbishments were completed and a further 68 were underway)1125, this leaves less than one year remaining to complete the outstanding refurbishment works before the expiry of the five-year leases.
Since August 2009, long-term housing precinct leases have been signed for 10 of the 12 five-year leased communities where major where housing construction is to occur, although leases are still being negotiated for Yirrkala and Yuendumu.1126 The Australian Government has also pursued voluntary s. 19a township leases in larger communities.
Voluntary long-term leases are also being progressively offered to other communities which currently remain under five-year lease arrangements.1127 This will be essential in ensuring that any outstanding SIHIP refurbishments—beyond August 2012—are completed with an appropriate level of tenure security.
What has been the impact of five‐year leases, in particular on NTER communities, since 1 July 2007?
FaHCSIA acknowledges that the compulsory nature of five-year leases may have ‘muddied the water’ on support for work to promote voluntary leasing, since 2008, under a policy of secure tenure.1128 However, five-year leases have nevertheless formalised dealings in land through the requirement to seek approval through FaHCSIA for land use and an agreement to pay rent, thereby changing the practice of permissive occupancy experienced prior to the NTER, and providing income for owners.1129
Traditional owners have always been able to grant leases on land under the ALRA using ‘section 19’ provisions, and the terms and conditions of such leases are set by negotiation. However, the argument that formalised occupancy could have occurred under existing s. 19 provisions is not persuasive, given their historically limited application.
Prior to the NTER, s. 19 leasing in towns was not common1130; there were few leases sought or granted in township areas on Aboriginal land, notwithstanding the occupancy of various government and other entities.1131 There was limited leasing activity undertaken to secure publicly funded facilities on Aboriginal land, and rents were generally not paid.1132 Prior to the
1123 Record of discussion with FaHCSIA Community Stores Licensing and Aboriginal Benefit Account stores infrastructure project officer, 18 July 2011. 1124 Record of interview with FaHCSIA Land Reform Branch, 29 July 2011. 1125 Northern Territory Government, SIHIP progress and remote housing framework, September 2011. 1126 The remaining four SIHIP communities where long-term tenure has also been secured are not subject to five-year leases. 1127 FaHCSIA, Northern Territory Emergency Response monitoring report: Measuring progress of NTER activities, July 2008 to December 2008. 1128 Record of interview with FaHCSIA Land Reform Branch, 29 July 2011. 1129 Record of interview with FaHCSIA Land Reform Branch, 29 July 2011. 1130 File note of discussion with NLC, 21 July 2011. 1131 Record of interview with FaHCSIA Land Reform Branch, 29 July 2011. 1132 File note of discussion with NLC PLO, 21 July 2011.

Housing and land reform
Northern Territory Emergency Response: Evaluation Report 2011 379
NTER, s. 19 leases were applied for and granted relatively infrequently, and only for small private investments such as shops.1133
Although rents are now paid by the Australian Government for five-year leases, in the majority of cases, however, traditional owners are yet to receive payments provided by FaHCSIA to land councils for distribution.1134 In these cases, the amount of rent to be paid is contested by the Northern Land Council (NLC) and Central Land Council (CLC), on the basis that five-year lease rents, as determined by the NT Valuer-General, have undervalued Indigenous land relative to s. 19 leases.1135
A limiting factor for the security of public investments made under five-year leases is that ownership of the asset will revert to traditional owners upon expiry of the lease. Since the Australian Government has committed not to renew or extend compulsory five-year leases1136—unless new lease terms are negotiated with traditional owners—the window of opportunity for transitioning directly to long-term leases will close at the end of the five-year lease period in August 2012. Although leases can be negotiated at any time, the Australian Government’s preference is that there be no ‘tenure gap’ which may put existing public housing and infrastructure investments at risk. It remains incumbent on the Australian Government to negotiate long-term leases for its assets following the expiry of the five-year leases, and where necessary to negotiate interim arrangements with traditional owners. According to FaHCSIA, the Australian Government is working with the Northern Territory Government and the land councils to negotiate long-term housing leases and leases for other government assets in those communities where leases are not currently in place.1137
While FaHCSIA has prioritised securing long-term tenure in the 12 five-year lease communities where major SIHIP capital investments are taking place, in those communities where long-term leases are not secured there is potential to undermine the tenancy management arrangements enacted.
To address this risk, some entities have begun to negotiate longer term leases on land subject to five-year leases directly with land councils on behalf of traditional owners, although there is clearly further progress to be made in implementing the government’s policy of secure tenure on Aboriginal land.
Data provided by the CLC and Northern Land Council NLC, linking land use approvals on five-year lease land with negotiations or agreements for longer term leases, confirm this (see Table 10.2).1138 The data show that, for the 61 five-year lease communities for which data were available1139, the majority of agencies and organisations that have been granted land use approvals have not applied for longer term leases over these assets. While the Northern Territory Government, several Aboriginal community-controlled organisations and publicly funded NGOs have done so, local government has not applied for leases. Moreover, with the exception of the 10 housing precinct leases entered into by the Northern Territory and Australian governments since 2009, the Australian Government has only recently applied for
1133 File note of first discussion with NLC PLO, 21 July 2011. 1134 Rent payments for two five-year leased communities on the Tiwi Islands (Milikapiti and Pirlangimpi) have been distributed to land owners. Rents paid with respect to the remaining 45 five-year leased communities on Aboriginal Land Rights (Northern Territory) Act 1976 land have not been distributed. Rent payments for an additional 16 Community Living Area communities have commenced for two of these communities. (FaHCSIA, Closing the Gap in the Northern Territory monitoring report, January – June 2011). 1135 File note of discussion with NLC, 21 July 2011. 1136 Comments received from FaHCSIA Land Reform Branch, 6 Sept 2011. 1137 Email received from FaHCSIA Land Reform Branch, 14 October 2011. 1138 Email from CLC, 8 August 2011, and email from NLC, 19 September 2011. 1139 It should be noted that in the CLC region 10 communities are Community Living Area communities for which leasing cannot occur, while one is subject to a land claim. In regards to the NLC region, validated data for Wadeye were unavailable due to the absence of the relevant staff member at the time the data were provided.

Housing and land reform
380 Northern Territory Emergency Response: Evaluation Report 2011
long-term leases over its assets in five-year lease communities, meaning that a gap in security of tenure may occur after August 2012, until long-term leases are negotiated.
Table 10.2 Relationship between land use approvals on five-year lease land and applications for leases
Organisation type Housing tenancy
agreement Other land use
approval Total approvals
Applications to CLC or NLC for longer
term lease Australian Government 0 7 7 0 NGO/Aboriginal community controlled organisation
0 159 159 54
Northern Territory Government 379 216 595 86 Private enterprise 0 70 70 2 Local government 2 146 148 0 Total 381 598 979 142 Source: KPMG; adapted from FaHCSIA Land Reform Branch, CLC and NLC.
The CLC and NLC also note that a number of agencies and organisations—also largely Northern Territory Government and publicly funded NGOs and Aboriginal community-controlled organisations—are in the process of negotiating long-term leases without first obtaining a land use approval under a five-year lease.1140 In the case of the Northern Territory Government, longer term leases, including 40-year ‘housing precinct’ leases and s. 19 leases, have been negotiated in increasing numbers since 2008–09, providing secure tenure for Northern Territory Government assets on Aboriginal land, on occasions independently of a land use approval pursuant to a five-year lease interest.1141 The Northern Territory Government’s current focus is on the negotiation of long-term leases for government assets in ‘Growth Towns’, where opportunities for economic development are greatest.1142
With the exception of some NGOs and Aboriginal community-controlled organisations, which are obligated to secure tenure as a requirement of funding from the Australian Government, there is therefore limited evidence to show that holders of land use approvals under the five-year lease arrangements are switching to s. 19 leases in order to secure tenure. Although all applicants are advised by FaHCSIA that they should approach the relevant land council to negotiate a lease at the time a land use approval is granted, the pattern of leasing observed suggests that a policy of secure tenure—linked to the funding of a proponent’s activities—rather than five-year leases, is responsible for an increase in long-term leasing activity.
There is also evidence to suggest that five-year leases have presented a blockage to the negotiation of longer term leases, since the grant of s. 19 leases on five-year lease land must first be approved by the Minister.1143 The NLC notes that the requirement for ministerial consent has created significant delays for the conversion of land use approvals under five-year leases to longer term arrangements.1144 Furthermore, since the approval of long-term leases (of 12 years or more) requires a compliant land survey under Northern Territory planning laws, the combined cost, time and uncertainty mean that at the commencement of
1140 Email from CLC, 8 August 2011, and record of interview with NLC, 21 July 2011. 1141 Email from CLC, 8 August 2011, and record of interview with NLC, 21 July 2011. According to the Northern Territory Government, it has, for the most part, obtained five-year lease approval for new infrastructure assets as part of the process of executing an s. 19 lease. Where that has not been the case, it has generally been with respect to approvals for assets that existed prior to the NTER, for which a land use approval under a five-year lease is not a formal requirement (comments received 11 October 2011). 1142 Comments from Northern Territory Government, 11 October 2011. The Territory Growth Towns are 20 priority communities that the government intends to ensure are properly planned and designed; have services, buildings and facilities like any other country town; and benefit from targeted investment in infrastructure. 1143 Record of interview with NLC, 21 July 2011. 1144 ibid. According to FaHCSIA Land Reform Branch (email, 14 October 2011), delays may occur because of a need for the Minister to be satisfied that those parties with an interest in the land are adequately consulted prior to the approval of a long-term lease—a process which land councils consider to be adequately managed under existing arrangements, since the traditional owners whom they represent are the primary interest holders.

Housing and land reform
Northern Territory Emergency Response: Evaluation Report 2011 381
the NTER there was little immediate incentive for occupants of five-year lease land to negotiate long-term tenure.1145
These concerns are confirmed by the Northern Territory Coordinator General for Remote Indigenous Services, who considers that progress in negotiating longer term leases on five-year lease land has been slow, suggesting that private investment, enterprise development and home ownership opportunities in remote communities will continue to be stalled unless secure tenure arrangements are in place for the majority of NTER communities.1146
More broadly, community views regarding the pace and nature of tenure reforms are mixed, particularly where reforms are seen as a stepping-stone to the division of communal title in order to secure the property rights of individuals and facilitate land markets. Specifically, not all communities agree that new housing investment must necessarily be underpinned by long-term government leases. Those with concerns remain wary of any reforms to change land tenure because of their strong connection to country and the non-material values they attach to land.1147
The criticism often made is that the causal link between tenure reform and social and economic development is largely overstated. Instead, it is argued that the mode of tenure is not the critical limiting factor, since most Indigenous communities in remote areas will remain poor so long as markets are weak, services are underprovided and incomes are low, and where land is of poor productive capacity.1148
In relation to larger communities with the greatest potential for economic development, FaHCSIA has noted the economic development and home ownership opportunities offered by s. 19A (whole of township) leases, through which tradeable sub-leases may be granted.1149 It considers s. 19A leases to be most appropriate for larger communities, particularly in the light of the streamlined administration process available through the Executive Director of Township Leasing, under an arrangement whereby the introductory payment made to traditional owners for the head lease is advanced from the Aboriginal Benefits Account and repaid through rental receipts out of which an administrative levy is taken.
Township leases are currently signed for Wurrumiyanga (Tiwi Islands) and the Groote Eylandt and Bickerton Island communities of Angurugu, Umbakumba and Milyakburra; the execution of a township lease for Milikapiti and Ranku (also on the Tiwi Islands) is expected in November 2011. Township leasing in the 12 remaining remote service delivery (RSD) communities will be pursued only where traditional owners initiate discussions. According to an October 2011 report, because of land council and traditional owner resistance, ‘township leasing is now being pursued as a longer-term priority, unless traditional owners initiate discussions.’1150 Where township leases are not in place, however, government will continue to deliver housing and other services to remote communities through individual long-term leases, subject to their negotiation.
The Government’s immediate priorities approaching the end of the five year leases is to secure housing outside the RSD communities to ensure property and tenancy management
1145 ibid. 1146 http://www.workingfuture.nt.gov.au/Overview/docs/Report%204/3.%20Obstacles%20to%20Closing%20the%20Gap.pdf 1147 Department of Finance and Deregulation, Strategic review of Indigenous expenditure, February 2010. 1148 See for example, JC Altman, C Linkhorn & J Clarke, Land rights and development reform in remote Australia, Centre for Aboriginal Economic Policy Research, Australian National University, Canberra, 2005. 1149 Amendments to the ALRA in July 2007 have enabled traditional owners to grant a lease of a township, and the Australian Government (or Northern Territory Government where an approved entity is established) to acquire such a lease, where the Minister consents. These are known as ‘township leases’, or ‘section 19A leases’. 1150 FaHCSIA, Northern Territory Emergency Response monitoring report: Measuring progress of NTER activities, January to June 2011, as reported in The Australian, Friday 14 October 2011, p. 8.

Housing and land reform
382 Northern Territory Emergency Response: Evaluation Report 2011
reforms continue, and negotiate leases over Australian Government assets in order to support continued service delivery.’1151
Permit Reforms
Background and policy context Under the ALRA, it is an offence for the public to enter or remain on Aboriginal land without a permit. The Aboriginal Land Act (NT) empowers land councils, traditional owners and the Northern Territory Government to issue and revoke permits. The permit system regulates access to Aboriginal land and sets rules for the use of the land by permit holders, generally through special conditions of entry regulating behaviours such as alcohol consumption, carrying firearms, fishing and hunting, as well as respecting the privacy of Aboriginal people.
As part of the implementation of the NTER in 2007, the Australian Government abolished the requirement for the public to obtain permits to access communal areas in major communities on Aboriginal land, on the basis that the permit system was causing already remote Indigenous communities to be further isolated and removed from the social and economic benefits that could flow from greater access.1152
These changes were made in two stages, first in August 2007 and then in February 20081153, and were permanent changes (except where identified below):1154
• All government workers and contractors were provided with a defence for entering and remaining on Aboriginal land.
• The Commonwealth Minister for Indigenous Affairs was granted the power to authorise a ‘class of persons’ to enter and remain on Aboriginal land for the five-year period of the NTER. This power was used to issue an authorisation allowing government workers, contractors and volunteers engaged by the NTER to enter and remain on Aboriginal land for the five-year period. The provision was aimed primarily at the medical profession and volunteers working as part of the NTER who may not have come under the category of government workers and contractors. This provision ‘sunsets’ at the end of the NTER period.
• Members of the public were no longer required to obtain a permit to access common areas of 52 major communities and to reach the 52 major communities by air, sea and public road. This access provision was subject to a ministerial determination specifying which private roads the public may use to access those communities.
• Further legislative changes included a provision that permits issued by either a land council or a traditional owner could only be revoked by the issuer of the permit rather than the other party, and a provision that permits are not required for members of the public to attend court hearings.
Legislation introduced in 2008 sought to amend these changes so as to reinstate the permit requirement for public access to major communities, while enabling the Minister to authorise access for certain people, such as journalists.1155
1151 FaHCSIA, Closing the Gap in the Northern Territory monitoring report, January – June 2011, p. 59. 1152 FaHCSIA submission to the NTER Review, 2008. 1153 The two further provisions were that a permit is no longer required for attendance at a court hearing and that permits issued by land councils or traditional owners can only be revoked by the issuer of the permit. 1154 FaHCSIA submission to the NTER Review, 2008. 1155 Explanatory Memorandum of the 2008 Bill.

Housing and land reform
Northern Territory Emergency Response: Evaluation Report 2011 383
The draft amending legislation sought to revise the ministerial power to authorise access to Aboriginal land to include ‘a class of persons’ to enable access to a limited geographical area (for example, major communities) and to reinstate the ability of land councils to revoke permits issued by traditional owners, and vice versa.1156 It was intended that the revised authorisation power would be used to provide access to major communities for journalists during the period of the NTER. The existing defence for government workers and contractors would remain and be extended to include candidates in local government elections.
The 2008 amending legislation did not, however, pass the Senate—leaving the 2007 legislative provisions in place—although with respect to public access to major communities, the Minister has declined to make a determination specifying which private roads can be used to gain access, thereby restricting public access to Aboriginal communities by road. The government encourages people wishing to access Aboriginal land to continue to contact the relevant land council regarding visits to Aboriginal communities.1157
In summary, the current status of the permit system is as follows:1158
• government employees and contractors do not require a permit to perform relevant duties
• all those involved in the NTER, including medical teams and volunteers, do not require a permit for the remaining period of the NTER
• the public can access the common areas of 52 major communities without a permit if entry is by air, sea or public road, but require permits for non-public roads outside the 52 major communities, as well as the vast majority of Aboriginal land.
How effectively were changes to the permit system implemented? Prior to the NTER, public servants applied for a ‘standing’ type permit for access to all Northern Territory communities under the Aboriginal Land Act (NT).1159 They therefore applied to the relevant ministerial delegate and not the land councils for permission to enter Aboriginal communities. Members of the public were required to apply for permits from land councils and traditional owners.1160
Although public perceptions of the operation of the permit system vary, the day-to-day operation of the permit system remains largely the same as it was before the NTER took effect.1161 The issue and revocation of permits for public access remain matters for land councils and traditional owners. The process for responding to a person in violation of the permit requirements is also unchanged: NT Police still have the power to remove persons in violation of permit requirements.
The Australian Government has encouraged people wishing to access Aboriginal land to continue to contact the relevant land council, even in relation to areas where a permit is not strictly required. However, representatives from the CLC stated that public confusion about whether permits were required to enter Aboriginal land may have caused an increase in illegal access.1162 Anecdotally, there is significant confusion amongst government workers and within
1156 FaHCSIA submission to the NTER Review, 2008. 1157 FaHCSIA website, ‘Permit system’, <http://www.fahcsia.gov.au/sa/indigenous/progserv/ntresponse/about_response/housing_land_reform/Pages/permit_system.aspx>. 1158 Extract from FaHCSIA, Closing the Gap in the Northern Territory monitoring report—December 2010 to May 2011. 1159 Record of interview with FaHCSIA Land Reform Branch, 29 July 2011. 1160 ibid. 1161 Comments provided by FaHCSIA Land Reform Branch, 12 Aug 2011. 1162 Record of interview with CLC, 2 August 2011.
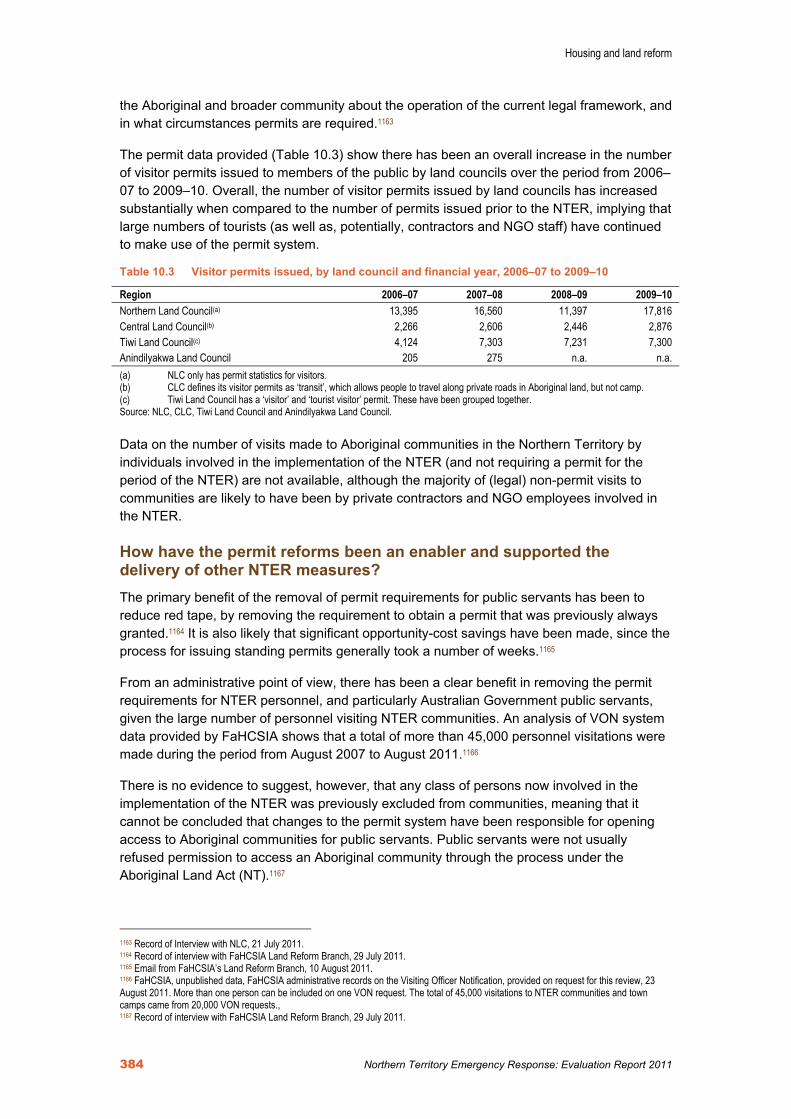
Housing and land reform
384 Northern Territory Emergency Response: Evaluation Report 2011
the Aboriginal and broader community about the operation of the current legal framework, and in what circumstances permits are required.1163
The permit data provided (Table 10.3) show there has been an overall increase in the number of visitor permits issued to members of the public by land councils over the period from 2006–07 to 2009–10. Overall, the number of visitor permits issued by land councils has increased substantially when compared to the number of permits issued prior to the NTER, implying that large numbers of tourists (as well as, potentially, contractors and NGO staff) have continued to make use of the permit system.
Table 10.3 Visitor permits issued, by land council and financial year, 2006–07 to 2009–10
Region 2006–07 2007–08 2008–09 2009–10 Northern Land Council(a) 13,395 16,560 11,397 17,816 Central Land Council(b) 2,266 2,606 2,446 2,876 Tiwi Land Council(c) 4,124 7,303 7,231 7,300 Anindilyakwa Land Council 205 275 n.a. n.a. (a) NLC only has permit statistics for visitors. (b) CLC defines its visitor permits as ‘transit’, which allows people to travel along private roads in Aboriginal land, but not camp. (c) Tiwi Land Council has a ‘visitor’ and ‘tourist visitor’ permit. These have been grouped together. Source: NLC, CLC, Tiwi Land Council and Anindilyakwa Land Council.
Data on the number of visits made to Aboriginal communities in the Northern Territory by individuals involved in the implementation of the NTER (and not requiring a permit for the period of the NTER) are not available, although the majority of (legal) non-permit visits to communities are likely to have been by private contractors and NGO employees involved in the NTER.
How have the permit reforms been an enabler and supported the delivery of other NTER measures? The primary benefit of the removal of permit requirements for public servants has been to reduce red tape, by removing the requirement to obtain a permit that was previously always granted.1164 It is also likely that significant opportunity-cost savings have been made, since the process for issuing standing permits generally took a number of weeks.1165
From an administrative point of view, there has been a clear benefit in removing the permit requirements for NTER personnel, and particularly Australian Government public servants, given the large number of personnel visiting NTER communities. An analysis of VON system data provided by FaHCSIA shows that a total of more than 45,000 personnel visitations were made during the period from August 2007 to August 2011.1166
There is no evidence to suggest, however, that any class of persons now involved in the implementation of the NTER was previously excluded from communities, meaning that it cannot be concluded that changes to the permit system have been responsible for opening access to Aboriginal communities for public servants. Public servants were not usually refused permission to access an Aboriginal community through the process under the Aboriginal Land Act (NT).1167
1163 Record of Interview with NLC, 21 July 2011. 1164 Record of interview with FaHCSIA Land Reform Branch, 29 July 2011. 1165 Email from FaHCSIA’s Land Reform Branch, 10 August 2011. 1166 FaHCSIA, unpublished data, FaHCSIA administrative records on the Visiting Officer Notification, provided on request for this review, 23 August 2011. More than one person can be included on one VON request. The total of 45,000 visitations to NTER communities and town camps came from 20,000 VON requests., 1167 Record of interview with FaHCSIA Land Reform Branch, 29 July 2011.

Housing and land reform
Northern Territory Emergency Response: Evaluation Report 2011 385
Not all land councils report on the number of applications rejected, or the reasons for non-approval. However, data provided by the CLC reveal that only three visitor applications were rejected in the whole of the 2006–07 to 2009–10 period.
What has been the impact of the permit reforms in the NTER communities since 1 July 2007? Evidence for the combined effects of changes to permit requirements and of their impacts on day-to-day community life is inconclusive, although there are reports that traditional owners are concerned that their right to exclude persons from accessing their land has been taken away.1168 According to one land council, Aboriginal community members have also raised concerns about the greater numbers of contractors and unidentified visitors passing through their communities, and have questioned whether such people have had appropriate security checks.1169
A related impact noted by the NLC with respect to (non-permit) visitations by NGO employees and contractors is that established local governance procedures for those visits have reportedly been undermined. Prior to the NTER, the land councils had the option to use their relationships with communities to contact traditional owners for approval to issue a permit. Where this procedure is not followed as a result of the NTER provisions, there has been a loss of empowerment regarding the community’s control over access and awareness of who enters their land.1170
Furthermore, land council representatives have raised concerns that the removal of the ability of a land council to revoke a permit issued by a traditional owner has affected policing powers, since a permit can no longer be revoked by a land council, in consultation with the police, in order to remove people.1171
Staff at FaHCSIA have, however, stated that changes to the permit system have been the subject of fewer recent complaints.1172 While there have been anecdotes of non-government personnel visiting areas illegally, those incidents are difficult to confirm and it is unclear whether such instances have increased.1173
A consistent finding in the CLC’s review of the NTER1174 and that of the NTER Review Board1175 is that community members do not believe that the permit system should be changed to facilitate greater access by non-Aboriginal people to Aboriginal communities.
1168 Record of interview with CLC, 2 August 2011. 1169 ibid. 1170 Record of interview with NLC, 21 July 2011. 1171 ibid. 1172 Record of interview with FaHCSIA Land Reform Branch, 29 July 2011. 1173 ibid. 1174 Central Land Council, Reviewing the Northern Territory Emergency Response: Perspectives from six communities, 2008. 1175 Extract from NTER Review Report, 2008.

Housing and land reform
386 Northern Territory Emergency Response: Evaluation Report 2011
Urgent Repairs to Infrastructure
Background and policy context The URTI program, which is also known as Tasks of Opportunity (TOO), covers urgent repairs and maintenance to community infrastructure and essential services, and addresses municipal services backlogs, such as car removals, waste dump improvements and dust control. Typical tasks have involved fencing or upgrading sewage ponds, repairing damaged airstrips, repairing or replacing bore water pumps, upgrading water tanks or installing fences around community waste dumps.1176
Funds for the provision of works were accessed through the Community Housing and Infrastructure Program, and the first tranche of funds was approved in August 2007.1177 All items funded were to be for the direct benefit of communities, rather than for the implementation of NTER enabling infrastructure (for instance, GBM Accommodation). Summary program information for URTI is provided as Appendix 10B.
How effectively was URTI implemented? Table 10.4 lists the TOO projects funded under the URTI and their estimated cost for each round. Total funding was $33.2 million, funded in 58 of the 64 five-year lease communities. Although all 64 communities were included in a works survey undertaken by the Australian Defence Force, some communities had no immediate need for urgent works, or else received support from alternative sources (under pre-existing Northern Territory Government programs).
Table 10.4 Summary data for Tasks of Opportunity projects
Round Funding
$ Number of
projects Communities involved Community
organisations involved 1 4,335,040 21 9 15 2 8,394,000 16 12 Not specified 3 20,465,000 74 42 26 Total 33,194,040 111 63(a) 41 (a) The number of communities involved represents a count of communities in receipt of TOO funded projects per round. It does not
equate to the total number of communities in receipt of TOO support since some communities received support across multiple rounds.
Source: FaHCSIA NT office, Housing and Infrastructure Branch.
A total of 111 TOO projects were started and completed. All projects identified and approved for funding were assessed by the local auspice organisation, or project management contractor and GBM. Although no program-wide second survey was undertaken to verify that tasks were completed, and to a specified industry standard, the available qualitative evidence suggests that the TOO project was implemented as intended, and that identified outputs were delivered.
FaHCSIA’s Northern Territory office confirmed that all projects recommended for funding were approved, the assumption being that funds acquitted equated to a project successfully completed. Funding approved for TOO activities was based on final estimates provided by FaHCSIA, using comparative cost estimates for the completion of similar works. The original estimate provided by the Australian Defence Force was often revised up.1178
1176 FaHCSIA, ‘NT regional TOO operations’, internal spreadsheet, 2008. 1177 FaHCSIA, ‘National Emergency Response Tasks of Opportunity’, internal memo, 2007. 1178 FaHCSIA, ‘NT regional TOO operations’, internal spreadsheet, 2008.

Housing and land reform
Northern Territory Emergency Response: Evaluation Report 2011 387
In most cases, TOO funding was channelled through local organisations and community councils. There were 41 instances of local organisation involvement in the implementation of minor projects through CDEP, although CDEP involvement was constrained by the type of task involved (activities deemed ‘technical’ were undertaken by contractors).
How has URTI been an enabler and supported the delivery of other NTER measures? FaHCSIA staff who administered the URTI program stated that, where urgent repairs were completed in a timely manner, projects contributed significantly to building the credibility of the NTER and the GBMs involved.
The fact of the program’s implementation and requirement to undertake works suggests that the funding boost provided was an opportunity for urgent repair works under existing Northern Territory Government programs to be brought forward, in effect providing gap funding and an emergency delivery response to address urgent unmet infrastructure needs. While the Northern Territory Government has historically had primary responsibility for essential services delivery to the NTER communities, at the time of the intervention it did not have the resources to fund these projects.1179
What has been the impact of URTI in the NTER communities since 1 July 2007? The available evidence suggests that URTI projects were completed. Where repairs and maintenance were undertaken to essential services, it can be assumed that functional improvements and repairs to the infrastructure are of benefit to communities.
Community involvement in terms of providing the labour to undertake TOO works was encouraged, and most minor works (constituting the majority of projects) involved local CDEP labour. This is considered to have provided community members with meaningful opportunities for work as well as producing financial efficiencies through the use of existing productive capacity.
Based upon the data provided by FaHCSIA, that has been the case for at least 37 per cent of all projects, although the actual proportion is likely to be greater (since no data on this variable were available for Round 2 of TOO projects).
Community Clean Up
Background and policy context Managed from FaHCSIA’s National Office, with total program funding of approximately $40 million over two years, the CCU program was designed as an intensive short-term housing repairs initiative, whereby tradespeople would visit remote communities for periods of one to ten days in order to carry out make-safe works on houses and community buildings, returning to undertake minor vital repairs to improve the utility of houses and buildings over a two- to five-week period.
1179 FaHCSIA, ‘National Emergency Response Tasks of Opportunity’, internal memo, 2007.

Housing and land reform
388 Northern Territory Emergency Response: Evaluation Report 2011
The objective of the CCU program was to support the objectives of the NTER by creating a safe and healthy living environment for Aboriginal children.1180 Implementation of the program involved the following areas of activity:1181
• detailed property assessments of individual buildings, resulting in the preparation of a property condition report and a schedule of repair works for each
• make-safe works involving an electrical, plumbing and gas survey, and essential urgent repairs to those systems made at the time of assessment (or else steps to ensure that the system be ‘locked out’ for further attention)
• minor vital repairs of up to $5,000 in labour costs and $5,000 in material costs per property, involving minor non-vital works (for example, fixing or replacing windows, doors, toilets, basins, sinks and showers)
• preparation of a community summary report to include an overview of all works undertaken in the community and to identify major repair works to be undertaken as part of SIHIP housing refurbishments.
Work that exceeded the available budget under the Community Clean Up program would then be considered as part of the ongoing housing repair and maintenance program delivered by the Northern Territory Government.
The National Indigenous housing guide developed by the Australian Government as a guide for meeting appropriate technical building standards in Indigenous communities was used as the basis for identifying works. Guidelines were also applied to determine which buildings fell within the scope of the CCU program (that is, community residential dwellings or community purpose facilities, but not privately owned buildings or property falling under the jurisdiction of a governing body other than FaHCSIA).1182 Repairs were undertaken on vacant and uninhabitable buildings only if the structure presented a hazard or could be made fit for habitation.
In total, 69 NTER communities were involved in the CCU program, either as part of the main CCU initiative covering 59 communities, or as part of a pilot operated by Indigenous Business Australia in the remaining 10 communities.1183 The four remaining communities were receiving or have recently received housing repairs under the Fixing Houses for Better Health program, which meant that the CCU program was not required. The CCU summary report for all communities is provided as Appendix 10A.
How effectively was the Community Clean Up initiative implemented? Over the duration of the CCU program, the total number of buildings surveyed was 3,274. Of those buildings, 2,801 had make-safe works undertaken, while 2,814 had minor vital works. Additionally, 1,367 buildings were painted.1184.
The cost of CCU works at the community level has not been reported by FaHCSIA but is understood to have varied across communities. Understanding the reason for any cost differences without detailed data is, however, problematic, although it is likely that the initial condition of housing in different communities, the number of houses requiring work, and the remoteness of the particular community would have had an effect on costs.
1180 Email from FaHCSIA Indigenous Housing Policy Branch, 2 August 2011. 1181 FaHCSIA, NTER monitoring reports. 1182 ibid. 1183 ibid. 1184 FaHCSIA, Northern Territory Emergency Response (NTER) monitoring report, December 2008.

Housing and land reform
Northern Territory Emergency Response: Evaluation Report 2011 389
The capital expenditure allowance per building was increased in the early stages of implementation from $5,000 to $10,000, recognising the cost of mobilising the trade companies and the significant level of works required in most communities. Any works that were considered necessary but exceeded the capital budget were considered on a case-by-case basis for approval by FaHCSIA, and this would also have led to higher costs in some communities.
According to the CLC, the cost of delivering the CCU is considered to be high relative to the Northern Territory’s own housing repairs and maintenance program for public housing. This is attributed to the high costs associated with contracting tradespeople at short notice to undertake works in remote locations.1185
CCU commenced and finished at various dates throughout 2007 and early 2009. The first CCU works started in July 2007, and the majority of work was completed by mid-2008. The final CCU works were completed in March 2009. The time taken to undertake the program in a community averaged approximately four months; most communities completed the work in one to six months, although in some communities where follow-up works were required, completion of the CCU program could take up to 12 to 15 months.
The National Indigenous housing guide1186 is referenced by FaHCSIA as the principal guide for contractors when identifying CCU works and undertaking repairs to a minimum standard. Building repair works were reported in the example community dwelling repair report provided to have been completed ‘to the standard specified in’ the scheduled repair works documentation for each building, which references the housing guide.
While project management companies were contracted to complete these reports and monitor trade services companies that undertook the work, the CLC has reported issues regarding the quality of reports in some cases. The CLC states that some of the properties in the communities in its region have undergone up to three property condition assessments, because the reports provided to SIHIP contractors through the CCU program were inadequately prepared.1187
How has Community Clean Up been an enabler and supported the delivery of other NTER measures? SIHIP, which utilised CCU data on future refurbishment requirements is focused on building new houses and refurbishing existing houses following the CCU ‘fix and make safe’ activities.1188 The CCU program was expected to assist SIHIP by identifying and reporting on major works required to bring individual dwellings up to ‘an acceptable living standard’ (for example, stainless steel kitchen benches, fences, vermin proofing) and minor non-vital works unable to be completed within the CCU budget.1189
The absence of an effective system for recording, monitoring and finalising repairs and maintenance requests has been a recurring issue in a number of complaints received by the Commonwealth Ombudsman.1190 FaHCSIA has noted that these issues are being addressed
1185 Record of interview with CLC, 2 August 2011. 1186 Online version only (not PDF) <http://www.fahcsia.gov.au/sa/indigenous/progserv/housing/Documents/default.htm>. 1187 Record of interview with CLC, 2 August 2011. 1188 FaHCSIA, NTER monitoring reports. 1189 ‘Example community summary report’ (for Acacia Larrakia). 1190 FaHCSIA, Closing the Gap in the NT monitoring report, January–June 2010, Appendix A: Report.

Housing and land reform
390 Northern Territory Emergency Response: Evaluation Report 2011
as part of the delivery of the ongoing housing repair and maintenance program delivered by the Northern Territory Government.1191
The assessment of asbestos-containing material in NTER communities was also part of the CCU, although asbestos removal works were not carried out through this program. An asbestos survey was conducted after tradespeople informed FaHCSIA of concerns about the presence of asbestos-containing material. As a consequence, all 73 NTER communities were inspected and surveyed for asbestos between November 2007 and September 2008. In May 2008, the Australian Government committed $17 million to the removal of asbestos-containing material from communities under the Asbestos Removal Program.
Surveys were conducted under challenging conditions, operating without a register of organisations or persons responsible for individual buildings. However, following the investigation of two complaints about a lack of communication regarding asbestos survey results, the Commonwealth Ombudsman’s office concluded that FaHCSIA’s approach to communication with Indigenous communities about the surveys was inadequate.1192 Although FaHCSIA had taken steps to communicate the results of the asbestos surveys to affected parties, more timely information to residents was required, given the health risk posed. A communication strategy to inform communities of the presence of the material and the process for identification and removal was not activated until August 2009, leaving a gap of more than one year in the case of most communities.
What has been the impact of Community Clean Up in the NTER communities since 1 July 2007? The Community Safety and Wellbeing Research Study identified ‘housing’ as a ‘very important’ issue for 83.5 per cent of respondents.1193 Reflecting that finding, it is unsurprising that the extent of community support for the CCU program was closely linked to the quality and efficacy of the repairs and maintenance undertaken.1194
As described in a CLC survey of six NTER communities where property condition assessments were completed in a reasonable timeframe and consistently, communities were supportive of the program, whereas in communities where numerous property condition assessments were undertaken without substantial repairs occurring people were dissatisfied with the program.
Where works were completed and make safe repairs undertaken, the relationship with health outcomes is assumed. The Council of Australian Governments has stated that the maintenance and repair of housing under the National Partnership Agreement on Remote Indigenous Housing should ‘contribute to improving environmental health’ by adopting the principles of nine ‘healthy living practices’1195, which are also used by the Fixing Houses for Better Health program.
Clearly, improving the ability of a house to support the healthy living practices by attending to the physical hardware necessary for healthy, hygienic living is beneficial. By making repairs to
1191 FaHCSIA comments received 3 November 2011. 1192 Commonwealth Ombudsman, FaHCSIA asbestos surveys: Communication issues, report no. 18/2009, December 2009. 1193 G Shaw and P d’Abbs, Community Safety and Wellbeing Research Study Consolidated Report, FaHCSIA, Canberra, 2011. 1194 Central Land Council, Reviewing the Northern Territory Emergency Response: Perspectives from six communities, July 2008. 1195 The nine environmental health elements are considered relevant to improving health in Indigenous communities by enabling households to have the ability to wash people, particularly children; the ability to wash clothes and bedding; removing waste safely from the house and immediate living environment; improving nutrition and the ability to store, prepare and cook food; reducing the negative effects of crowding; reducing the negative contact between people and animals, insects and vermin; reducing dust; controlling the temperature of the living environment; and reducing trauma, or minor injury, by removing hazards.

Housing and land reform
Northern Territory Emergency Response: Evaluation Report 2011 391
the water supply, sanitation and food preparation areas of a house, it is assumed that the CCU program contributed to safe and healthy housing in Indigenous communities.1196
CDEP, Work for the Dole and other community employment programs were drawn upon to supply the CCU labour requirements for rubbish removal, cleaning and painting of dwellings. A total of 920 participants are reported to have been involved through the program.1197
Although no formal training or certification was provided directly through the program to CDEP and Work for the Dole participants, seven apprentices were given the opportunity to receive formal trade qualifications through employment with a contracted trade team, and a total of 35 Indigenous people were employed as part of CCU teams.1198
According to the CLC survey, however, the impacts on community members in relation to employment and training opportunities were mixed. Staff in Titjikala and Ali Curung, for example, expressed frustration that building, repairs and maintenance work was being allocated to contract workers using predominantly non-Indigenous labour instead of utilising community-based work crews.1199 FaHCSIA notes that the requirement for a large-scale program of works to be delivered in a relatively short period of time impacted on the ability to maximise local employment in all instances.
Government Business Manager Accommodation
Background and policy context The GBM Accommodation project forms part of the NTER Staff Accommodation Project, the objectives of which were to provide accommodation in communities for NTER staff and to improve temporary accommodation standards to assist with the recruitment and retention of those staff.
The rationale for having GBMs live in communities was to provide an accessible point of contact for the Australian Government, enabling a response to community issues in a timely manner and a capacity to address community concerns about the stability and consistency of government engagement.1200
Prior to GBMs residing in communities full time, government project officers visited communities regularly, but ‘only long enough to conduct a particular item of business’.1201 There was little or no accommodation available in communities for government officers, and informal sleeping arrangements were generally the norm.1202
Throughout the installation period of the project, significant scope changes occurred. Initially, all 73 communities were identified for staff accommodation, although this was later reduced to 58 communities, since not all communities required a permanent government presence. The number of accommodation units required within each community was also varied.1203
Over the period of the program to 2008–09, a total of 303 containers and demountables were installed. Generally, southern and central community locations were provided with
1196 ANAO, Indigenous housing initiatives: The Fixing Houses for Better Health program, performance audit report no. 21 2011, 2011. 1197 ‘Example community summary report’ (for Acacia Larrakia), DocShare number 12,148,172, p. 28. 1198 FaHCSIA, NTER monitoring reports. 1199 Central Land Council, op. cit. 1200 ANAO, Government business managers in Aboriginal communities under the Northern Territory Emergency Response, performance audit report no. 18 2010–11, p. 50. 1201 ibid., p. 49. 1202 Email from FaHCSIA Property, Environment, Procurement and Security Branch, 3 August 2011. 1203 Background Brief Staff Accommodation v2.
Housing and land reform
392 Northern Territory Emergency Response: Evaluation Report 2011
demountable accommodation, while northern, coastal and island locations were provided with a combination of demountables and containers.1204 Appendix 10C shows the location of all NTER staff accommodation covered by the program (including both GBM and other NTER staff accommodation).
How effectively was GBM Accommodation implemented? The GBM Accommodation project objective was to establish staff accommodation in 58 NTER prescribed communities identified as requiring government staff accommodation, an objective which was achieved. No accommodation was provided in some locations because the GBM covered more than one community and did not require accommodation.1205
Under this program, FaHCSIA acquired 564 accommodation units as a short-term accommodation solution. The total cost of the units was $16,477,203, at an average cost (excluding transport and installation costs, for which no data were available) of just over $29,000 per unit.1206 Of the 564 accommodation units purchased, 460 were installed, gifted or transferred. The remainder of the units were written down.
Program managers have noted that when the GBM accommodation project started, the broader scope requirements for the NTER were still being developed, including the number and locations of GBMs and the extent of community engagement.1207 As such, the nature of the accommodation rollout did not allow for any specific targets, milestones or performance indicators to be specified.
A range of issues affected the location and installation of GBM accommodation in the designated communities, including access to the community; community agreement to establish the facility and agreement on the proposed location; planning approval; and the availability of materials and labour.1208
An investigation into the use of containers as GBM accommodation in the northern region of the Northern Territory was made in late 2007, in response to concerns raised by GBMs about the levels of formaldehyde found in units when tested by the provider. In April 2008, FaHCSIA directed that the containers be vacated.1209 Alternative accommodation was rolled out for GBMs in the north over a period of two to four weeks.1210 The Blunn Report, which reported on this issue, made a number of findings in relation to the implementation of GBM accommodation.
The Blunn Report found that, in part as a result of the handling of the occupational health and safety issues with the accommodation, there was a ‘serious loss of confidence in management amongst the GBM network’. It found that a major issue for a number of GBMs, which limited their willingness to extend the period of their posting to the community, was that the accommodation effectively precludes their partners from accompanying them.1211 The
1204 Email from FaHCSIA Property, Environment, Procurement and Security Branch, 3 August 2011. 1205 Record of interview with FaHCSIA Property, Environment, Procurement and Security Branch, 8 August 2011. 1206 Asset Information—GBM accommodation spreadsheet, and Background Brief Staff Accommodation v2. These costs cover only the acquisition of the units and do not include transport and installation costs. 1207 Email from FaHCSIA Property, Environment, Procurement and Security Branch, 3 August 2011. 1208 ibid. 1209 AS Blunn, Review of issues related to the acquisition and management of container accommodation in the Northern Territory and the management of ACMS on prescribed communities for the Department of Families, Housing Community Services and Indigenous Affairs, 2008, pp. 21–22. As a consequence, some officers were not residing in their respective communities and therefore were travelling long distances to fulfil their roles, until such time as alternative accommodation could be provided. 1210 Record of interview with FaHCSIA Property, Environment, Procurement and Security Branch, 8 August 2011. 1211 AS Blunn, op. cit., p. 6.

Housing and land reform
Northern Territory Emergency Response: Evaluation Report 2011 393
report also highlighted the advantages of retaining the services of effective GBMs for extended periods (such as three years).1212
FaHCSIA agreed to address all of the recommendations made in the Blunn Report and has implemented a range of measures to that end, including arrangements for medical checks for all personnel affected and weekly meetings between FaHCSIA and the NTER Operations Centre working group then active (until 2010) to resolve issues relating to the provision of services and support to GBMs.1213
In all locations requiring accommodation to house GBMs, accommodation was provided. Although changes to the implementation of the program were made, such flexibility is arguably inevitable given the need to respond to local circumstances and the issues associated with containers.
How has GBM Accommodation been an enabler and supported the delivery of other NTER measures? Since information from GBM exit interviews is unavailable, it is not known to what extent issues specific to the deployment of accommodation have contributed to those leaving service, although according to FaHCSIA accommodation was rarely a primary cause of leaving.1214 Deployment data analysed by the Australian National Audit Office, however, show that most communities have been supported by the same GBM for at least 12 months at a time, and that in approximately one in three communities there has only been a single GBM handover since the commencement of the NTER.
Furthermore, there were very few gaps between GBM deployments and, where gaps occurred, they were for a limited duration (typically days and occasionally several weeks). Overall, these data suggest that FaHCSIA has been able to maintain a desired level of coverage across communities and has been able to maintain a consistent presence in most of the NTER communities serviced by GBMs.1215 The existence of accommodation is assumed to have contributed to and been an enabler of this outcome.
What has been the impact of GBM Accommodation in the NTER communities since 1 July 2007? The installation of government accommodation was technically enabled by the five-year leases which provided the legal basis for action. However, policy with respect to staff accommodation was to gain the agreement of the community rather than act on the basis of the leases. In only two cases was the supply of accommodation boycotted by a community: the supply of containers to Ski Beach, where demountables were later provided; and, because of a planning approval rejection by the Northern Territory Government in the case of Nyirripi, due to community objections—although approval was eventually provided.1216
The use of local Aboriginal labour in the provision of the containers and demountables was not a stated objective of the program, and time and cost factors were cited as reasons for not using more local Aboriginal labour during installation.1217
1212 ibid., pp. 8–9. 1213 FaHCSIA, Implementation of actions in response to the recommendations of the Blunn review report. 1214 Comments provided by FaHCSIA Northern Territory office, 14 September 2011. 1215 ANAO, op. cit., p. 69. 1216 Record of interview with FaHCSIA Property, Environment, Procurement and Security Branch, 8 August 2011. 1217 ibid.

Housing and land reform
394 Northern Territory Emergency Response: Evaluation Report 2011
Summary of findings
Five-year Leases The five-year leases acquired by the Australian Government provide the legal basis for accessing particular NTER communities, and underpin emergency investments by providing the security of tenure necessary for specific NTER sub-measures. The sub-measures include:
• the implementation of legally enforceable tenancy agreements over community housing
• the GBM Accommodation project, Safe Houses, and the Community Stores Licensing and Aboriginal Benefit Account stores infrastructure project
• CCU works and SIHIP refurbishments and upgrades, including the removal of asbestos.
In the case of SIHIP refurbishments, the Australian and Northern Territory governments have until August 2012 to complete all remaining works before the expiry of five-year leases, or else finalise the negotiation of further leases in communities where works are outstanding.
The extent to which five-year leases are promoting longer term security of tenure and economic development, however, is less clear. While there is evidence to suggest that five-year leases have formalised land dealings in NTER communities—by establishing practices and behaviours that are more conducive to leasing and the payment of rents—there has been limited progress to date in securing long-term leases for public investments in five-year lease communities.
Data provided by the CLC and NLC linking land use approvals on five-year lease land with negotiations or agreements for longer term leases confirm that the relationship between land use approvals and the negotiation of longer term leases is limited. In the 61 NTER communities for which data were available, the majority of agencies and organisations that have been granted land use approvals have not applied for longer term leases. While several Aboriginal community-controlled organisations and publicly funded NGOs have done so (driven by a requirement to secure funding), local government has not.
The evidence suggests that the Australian Government has also been slower to negotiate long-term leases, but has recently commenced negotiations with land councils for leases over its assets and is working to negotiate long-term housing leases in those five-year lease communities where housing precinct leases are not already in place. Section 19a ‘township leases’ will be negotiated only where land councils, on behalf of traditional owners, initiate discussions.
Permit Reforms The primary benefit of the removal of permit requirements has been to reduce red tape by removing the requirement for public servants to obtain a permit that was previously always granted. It is also likely that significant opportunity-cost savings have been made, since the process for issuing standing permits generally took a number of weeks. Given the large number of personnel visiting NTER communities, including more than 45,000 Australian Government personnel visitations made during the period from August 2007 to August 2012, there are likely to have been significant opportunity-cost savings.
There is no evidence to suggest, however, that any class of persons now involved in the implementation of the NTER was previously excluded from communities, meaning that it cannot be concluded that changes to the permit system have been responsible for opening access to Aboriginal communities for public servants.

Housing and land reform
Northern Territory Emergency Response: Evaluation Report 2011 395
Urgent Repairs to Infrastructure Total URTI funding of $33.2 million was spent in 58 of the 64 five-year lease communities, covering a total of 111 projects. Although no program-wide second survey was undertaken to verify that tasks were completed, and to a specified industry standard, the available qualitative evidence suggests that the TOO project was implemented as intended, and that identified outputs were delivered. All projects identified and approved for funding were assessed by the local auspice organisation, or project management contractor and GBM.
FaHCSIA staff who administered the URTI program stated that, where urgent repairs were completed in a timely manner, the projects contributed significantly to building the credibility of the NTER and the GBMs involved. Where repairs and maintenance to essential services were undertaken, it can be assumed that functional improvements and repairs to the infrastructure would have been of significant benefit to communities.
Community Clean Up By making repairs to the water supply, sanitation and food preparation areas of houses, the CCU program has clearly contributed to safe and healthy housing in Indigenous communities. The total number of buildings surveyed during the CCU program was 3,274, of which 2,801 had make-safe works, while 2,814 had minor vital works.
Concerns regarding the robustness of project reporting processes have, however, been raised, and it is not possible to verify that all works were completed to a specified minimum standard. Although project management companies were contracted to oversight CCU works, the CLC has reported issues regarding the quality of community summary reports in some cases. FaHCSIA has acknowledged that, whilst the reporting solution developed to capture detailed information on dwellings allowed for ease of data entry, it was not robust in terms of quality assurance.
Whilst it is not possible using the information provided to assess the cost-effectiveness of the program, concerns regarding the high costs of the program are attributed to the costs associated with contracting tradespeople at short notice to undertake works in remote locations.
GBM Accommodation GBM accommodation was provided in all communities requiring accommodation for that purpose. Since FaHCSIA has maintained a desired level of GBM coverage across all communities, it is assumed that the existence of accommodation has contributed to the planned outcome by providing GBMs with a permanent accommodation base.
Because information from GBM exit interviews is unavailable, it is not definitively known to what extent issues specific to the deployment of accommodation have contributed to those leaving service. Deployment data analysed by the Australian National Audit Office, however, show that most communities have been supported by the same GBM for at least 12 months at a time, and that in approximately one in three communities there has only been a single GBM handover since the commencement of the NTER.
Related Documents