Enhancing brick-and-mortar store shopping experience with an augmented reality shopping assistant application using personalized recommendations and explainable artificial intelligence Robert Zimmermann, Daniel Mora, Douglas Cirqueira, Markus Helfert, Marija Bezbradica, Dirk Werth, Wolfgang Jonas Weitzl, Ren e Riedl and Andreas Auinger (Information about the authors can be found at the end of this article.) Abstract Purpose – The transition to omnichannel retail is the recognized future of retail, which uses digital technologies (e.g. augmented reality shopping assistants) to enhance the customer shopping experience. However, retailers struggle with the implementation of such technologies in brick-and-mortar stores. Against this background, the present study investigates the impact of a smartphone-based augmented reality shopping assistant application, which uses personalized recommendations and explainable artificial intelligence features on customer shopping experiences. Design/methodology/approach – The authors follow a design science research approach to develop a shopping assistant application artifact, evaluated by means of an online experiment (n 5 252), providing both qualitative and quantitative data. Findings – Results indicate a positive impact of the augmented reality shopping assistant application on customers’ perception of brick-and-mortar shopping experiences. Based on the empirical insights this study also identifies possible improvements of the artifact. Research limitations/implications – This study’s assessment is limited to an online evaluation approach. Therefore, future studies should test actual usage of the technology in brick-and-mortar stores. Contrary to the suggestions of established theories (i.e. technology acceptance model, uses and gratification theory), this study shows that an increase of shopping experience does not always convert into an increase in the intention to purchase or to visit a brick-and-mortar store. Additionally, this study provides novel design principles and ideas for crafting augmented reality shopping assistant applications that can be used by future researchers to create advanced versions of such applications. Enhancing brick-and- mortar shopping experience © Robert Zimmermann, Daniel Mora, Douglas Cirqueira, Markus Helfert, Marija Bezbradica, Dirk Werth, Wolfgang Jonas Weitzl, Ren e Riedl and Andreas Auinger. Published by Emerald Publishing Limited. This article is published under the Creative Commons Attribution (CC BY 4.0) licence. Anyone may reproduce, distribute, translate and create derivative works of this article (for both commercial and non-commercial purposes), subject to full attribution to the original publication and authors. The full terms of this licence may be seen at http://creativecommons.org/licences/by/4.0/legalcode This research is a part of the European Training Network project PERFORM that has received funding from the European Union’s Horizon 2020 research and innovation program under the Marie Sklodowska-Curie grant agreement No [765395]; and supported, in part, by Science Foundation Ireland grant [13/RC/2094_P2]. This research reflects only the authors’ view, the European Commission is not responsible for any use that may be made of the information it contains. Data Availability: The qualitative and quantitative data used to support the findings of this study have been deposited in the Zenodo repository [DOI: 10.5281/zenodo.4723468]. The current issue and full text archive of this journal is available on Emerald Insight at: https://www.emerald.com/insight/2040-7122.htm Received 25 September 2021 Revised 12 December 2021 13 February 2022 13 March 2022 Accepted 13 March 2022 Journal of Research in Interactive Marketing Emerald Publishing Limited 2040-7122 DOI 10.1108/JRIM-09-2021-0237

Welcome message from author
This document is posted to help you gain knowledge. Please leave a comment to let me know what you think about it! Share it to your friends and learn new things together.
Transcript

Enhancing brick-and-mortar storeshopping experience with anaugmented reality shoppingassistant application using
personalized recommendationsand explainable
artificial intelligenceRobert Zimmermann, Daniel Mora, Douglas Cirqueira, Markus Helfert,Marija Bezbradica, Dirk Werth, Wolfgang Jonas Weitzl, Ren�e Riedl
and Andreas Auinger(Information about the authors can be found at the end of this article.)
Abstract
Purpose – The transition to omnichannel retail is the recognized future of retail, which uses digitaltechnologies (e.g. augmented reality shopping assistants) to enhance the customer shopping experience.However, retailers struggle with the implementation of such technologies in brick-and-mortar stores. Againstthis background, the present study investigates the impact of a smartphone-based augmented reality shoppingassistant application, which uses personalized recommendations and explainable artificial intelligence featureson customer shopping experiences.Design/methodology/approach – The authors follow a design science research approach to develop ashopping assistant application artifact, evaluated by means of an online experiment (n5 252), providing bothqualitative and quantitative data.Findings – Results indicate a positive impact of the augmented reality shopping assistant application oncustomers’ perception of brick-and-mortar shopping experiences. Based on the empirical insights this studyalso identifies possible improvements of the artifact.Research limitations/implications – This study’s assessment is limited to an online evaluation approach.Therefore, future studies should test actual usage of the technology in brick-and-mortar stores. Contrary to thesuggestions of established theories (i.e. technology acceptance model, uses and gratification theory), this studyshows that an increase of shopping experience does not always convert into an increase in the intention topurchase or to visit a brick-and-mortar store. Additionally, this study provides novel design principles andideas for crafting augmented reality shopping assistant applications that can be used by future researchers tocreate advanced versions of such applications.
Enhancingbrick-and-
mortar shoppingexperience
© Robert Zimmermann, Daniel Mora, Douglas Cirqueira, Markus Helfert, Marija Bezbradica, DirkWerth, Wolfgang Jonas Weitzl, Ren�e Riedl and Andreas Auinger. Published by Emerald PublishingLimited. This article is published under the Creative Commons Attribution (CC BY 4.0) licence. Anyonemay reproduce, distribute, translate and create derivative works of this article (for both commercial andnon-commercial purposes), subject to full attribution to the original publication and authors. The fullterms of this licence may be seen at http://creativecommons.org/licences/by/4.0/legalcode
This research is a part of the European Training Network project PERFORM that has receivedfunding from the European Union’s Horizon 2020 research and innovation program under the MarieSklodowska-Curie grant agreement No [765395]; and supported, in part, by Science Foundation Irelandgrant [13/RC/2094_P2]. This research reflects only the authors’ view, the European Commission is notresponsible for any use that may be made of the information it contains.
Data Availability: The qualitative and quantitative data used to support the findings of this studyhave been deposited in the Zenodo repository [DOI: 10.5281/zenodo.4723468].
The current issue and full text archive of this journal is available on Emerald Insight at:
https://www.emerald.com/insight/2040-7122.htm
Received 25 September 2021Revised 12 December 2021
13 February 202213 March 2022
Accepted 13 March 2022
Journal of Research in InteractiveMarketing
Emerald Publishing Limited2040-7122
DOI 10.1108/JRIM-09-2021-0237
Practical implications – This paper demonstrates that a shopping assistant artifact provides a goodopportunity to enhance users’ shopping experience on their path-to-purchase, as it can support customers byproviding rich information (e.g. explainable recommendations) for decision-making along the customershopping journey.Originality/value – This paper shows that smartphone-based augmented reality shopping assistantapplications have the potential to increase the competitive power of brick-and-mortar retailers.
Keywords Digital retail, Digital shopping assistant, Recommender systems, Explainable artificial
intelligence, Retail sales
Paper type Research paper
1. IntroductionWith department store revenue declining since 2001 (Bureau, 2018; ICSC, 2018; Wolf, 2018)and e-commerce revenue continually growing (Cirqueira et al., 2020a; Statista, 2018),today’s retailers face a significant challenge in staying competitive. In particular, traditionalbrick-and-mortar retail faces significant challenges (Berman, 2018). In the US alone, 9,879stores declared bankruptcy in 2019 (Loeb, 2020). The COVID-19 pandemic has aggravatedthis problematic trend (Nicola et al., 2020).
In these troublesome times, it is even more important for retailers to understand how theycan enhance customers’ offline shopping experiences (von Briel, 2018). As a response to thesechallenges, retailers are engaging in a new form of retail referred to as “digital retail”, whichuses information and communication technologies (e.g. smartphones) to engage customers,drive sales and offer unique shopping experiences that are superior to pure online shopping(Lemon and Verhoef, 2016). At the same time, customer expectations have been risingcontinuously (Parise et al., 2016) including the preference for an omnichannel experience(Briedis et al., 2020). In this regard, personalization and interactivity are key elements forcreating a positive experience, leading to positive changes in customers’ behaviors andintentions toward retail (Parise et al., 2016). Therefore, traditional retailers need to developnew systems that can provide a more customized and immersive shopping experience forcustomers in brick-and-mortar stores. Particularly since such a shopping experience maypositively affect purchase intention and actual sales (Arora et al., 2021; Zimmermannet al., 2019).
Contemporary marketing strategies integrate new technologies to create meaningfulinteractions with customers (Wang, 2021). It is argued that the use of smartphones canprovide an augmented and personalized customer shopping experience, driving sales inbrick-and-mortar stores (Eriksson et al., 2018; Juaneda-Ayensa et al., 2016; Parise et al., 2016;Zimmermann and Auinger, 2020). A particular use case of such smartphone-basedtechnology is an augmented reality shopping assistant application (hereafter ARSAA),which uses augmented reality (AR) to display content (e.g. tailor-made offers, productcomparison and recommendations) by leveraging machine learning techniques (e.g.recommender systems) and explainable artificial intelligence (XAI). This technologyenables a personalized and online-like shopping experience for customers in brick-and-mortar stores. Importantly, the usage of ARSAA in brick-and-mortar stores enables retailersto blur customers’ perception of online and offline channels (Carroll and Guzman, 2013).Furthermore, it provides higher levels of interactivity, which is a primary area of futureresearch in interactive marketing (Wang, 2021).
However, since the introduction of such technologies is expensive (Berman, 2018), retailersneed to know if an ARSAA is a useful tool to deliver an augmented and personalizedshopping experience. Unfortunately, current marketing literature does neither provideguidance on how to develop AR applications which provides personalized shoppingexperiences nor does it provide evaluation studies which empirically examined the impact ofsuch applications on shopping experience.
JRIM

Against the background of the presented research deficit and considering the need ofcorresponding research results for informed decision-making in practice (e.g. by retailmanagers and interactivemarketing practitioners), the present study addresses the followingresearch questions:
RQ1. How does a customer’s shopping experience with an ARSAA differ from ashopping experience without an ARSAA in brick-and-mortar stores?
RQ2. How can the presented ARSAA prototype be improved to further enhance theshopping experience of brick-and-mortar store customers?
To answer these questions, we follow a design science research methodology. Here, anARSAA is developed and evaluated by means of an online experiment. Thus, the presentstudy addresses both phases of a design science research project: build and evaluate (Hevneret al., 2004; March and Smith, 1995).
The paper is structured as follows: Section 2 presents the background of our study byproviding a literature review, the conceptual background of our study and a conceptualframework. Section 3 outlines the researchmethodology. Section 4 provides the study results.Section 5 discusses the results and main findings and outlines the theoretical contributions,practical implications, limitations and future research opportunities. Section 6 presents ourconclusion.
2. Literature review and conceptual background2.1 Literature reviewA systematic literature reviewwas conducted to illuminate the state of research in the field ofpersonalized recommendations provided byAR applications. In accordancewith vomBrookeet al. (2009), our literature review is extensive as we reviewed all literature found on this topic.To cover an extensive field of literature we used the following search string in the Scopusdatabase:
(TITLE-ABS-KEY (“brick andmortar”OR “brick-and-mortar”) ORTITLE-ABS-KEY (“retail”)) AND(TITLE-ABS-KEY (“augmented reality” OR “AR”) AND TITLE-ABS-KEY (“personalization” OR“personalisation” OR “recommendations” OR “recommender system”))
The literature search resulted in 23 papers from the Scopus database that were screenedfor relevant information about recommender systems, which provide personalizationin AR applications. A total of 16 papers did not contain such information and wereexcluded from the review. The remaining seven papers’ contributions to literature in thefield of personalized recommendations in AR are summarized in Table 1. Interestingly,no publication investigated the impact of personalized recommendations on shoppingexperience, although an explicit call for corresponding research exits (Lavoyeet al., 2021).
Thus, based on the previous approaches in deploying recommender systems in physicalstores, we identify the use of a smartphone-based ARSAA as a particularly promising, yetunder researched tool to provide personalized recommendations in brick-and-mortar stores.
2.2 Conceptual backgroundTo conceptualize the impact of ARSAA on shopping experience we also reviewed the trendsin retailing, providing details on the emerging field of digital retail and its potential influenceon shopping experience in brick-and-mortar stores, the use of recommender systems in brick-and-mortar stores and their impact on purchase intention, and the potential to increase trustin recommender systems by using XAI.
Enhancingbrick-and-
mortar shoppingexperience

2.2.1 Digital retail shopping experience in brick-and-mortar stores. Digital retail makes use ofstate-of-the-art technologies that allow retailers to use a variety of different customertouchpoints such as smartphones and social media to offer unique shopping experiences.Consequently, retailers have started targeting customers across different channels, givingbirth to multi-channel retailing. This approach is morphing into omnichannel retailing today,which merges all channels and touchpoints into a single seamless shopping experience(Verhoef et al., 2015).
Putting shopping experience at the center of their business model and deploying digitaltechnologies to enhance this experience (Parise et al., 2016; Rigby, 2011) retailers can makeuse of personalized advertising and promotion via increasingly ubiquitous devices(MacKenzie et al., 2013). Smartphones represent the archetype of these devices (Pimenidiset al., 2018) as they get continuously updated with technologies that are predicted torevolutionize the retail sector, such as AI and AR (von Briel, 2018).
Considering these developments, and in line with Lavoye et al. (2021), ARSAA is assumedto positively influence customers’ perception of shopping experience in brick-and-mortarstores by boosting hedonic (e.g. enjoyment) and utilitarian value (e.g. usefulness,informativeness). However, it must be noted that the use of AR can create media irritation,potentially diminishing this effect (Yim and Park, 2019). Hence, for assessing the overallquality of shopping experiences, this research includes the concepts of “Usefulness”,“Entertainment”, “Informativeness” (Pantano et al., 2017) and “Irritation” to capture thespecifics of AR shopping experience.
“Perceived Usefulness” (PU) and “Perceived Ease of Use” (PEOU) are the key componentof the technology acceptance model (TAM) (Davis, 1989). PU describes the degree to which auser believes that using a specific technology enhances the user’s performance. PEOUdescribes how easy to use a system or application is. As PEOU was found to have a muchweaker effect on behavioral intentions compared to PU (Venkatesh and Morris, 2000), thisstudy focuses on PU only. In this regard, previous studies have shown (Chen andWells, 1999;Song and Zinkhan, 2003) that, for websites, specific design features (e.g. menus, icons, colorsand graphics) make websites fun, attractive and appealing thus increasing PU. As ARSAAuses similar design features to present information to users (e.g. interactive buttons, iconsand graphics; see also Chapter 3.2), we hypothesize:
Source Type of study Contribution to literature*
L€ochtefeld et al. (2013) Empirical –Experiment
Evaluated the effectiveness of personalizedrecommendations in augmented reality applications inthe context of increasing paper leaflet views
Hiranandani et al. (2017),Tanmay and Ayush (2019)
Empirical –Experiment
Improved visual representation of personalizedrecommendations in augmented reality applications
Cruz et al. (2019) Empirical –Experiment
Tested the general applicability of personalizedrecommendations in augmented reality applications
M�arquez and Ziegler (2020) Empirical –Experiment
Evaluated the acceptance of personalizedrecommendations in augmented reality applicationswhen shopping for home appliances
Joerβ et al. (2021) Empirical –Experiment
Evaluated the effectiveness of personalizedrecommendations in augmented reality applicationsshifting customer product choice to sustainableproducts
Lavoye et al. (2021) Conceptual –Literature Review
Highlighted lack of studies addressing personalizedrecommendations in augmented reality applications
Note(s): *Regarding personalized recommendations in augmented reality applications
Table 1.Literature reviewsummary
JRIM

H1. ARSAA assisted brick-and-mortar shopping is perceived as more useful thanunassisted brick-and-mortar shopping.
The perceptual constructs “Entertainment”, “Informativeness”, and “Irritation” are the mostrobust constructs in uses and gratifications theory (UGT) (Katz et al., 1973; Luo, 2002). UGThas been shown to be a promising theory for explaining user behavior and perception of newmedia, especially in the area of interactive information and communication technologies(Baabdullah et al., 2022; Lee et al., 2020;McLean andOsei-Frimpong, 2019; Pelletier et al., 2020;Qin, 2020).
“Entertainment” describes the extent to which amedia is fun and entertaining for users byfulfilling the need for escapism, diversion, esthetic enjoyment or emotional release (Ducoffe,1996; Luo, 2002). A higher entertainment value motivates users to use specific media moreoften than others. This, for example, stimulates their purchase intention and informationseeking behavior in e-commerce (Huang, 2008). “Informativeness” describes the extent towhich media provide resourceful and helpful information to users (Chen and Wells, 1999;Ducoffe, 1995). Gathering information for goods and services is one of the most prominentreasons for consumers to use the Internet (Capgemini, 2020; Central Statistics Office, 2020;Statistisches Bundesamt, 2020).
As the ARSAA designed for this study uses multiple design elements to increase“Entertainment” (e.g. live interaction with a physical product on the smartphone) and“Informativeness” (e.g. displaying product information, giving recommendations), we hypothesize:
H2. ARSAA assisted brick-and-mortar shopping is perceived as more entertaining thanunassisted brick-and-mortar shopping.
H3. ARSAA assisted brick-and-mortar shopping is perceived as more informative thanunassisted brick-and-mortar shopping.
“Irritation” describes the extent to which using media bothers users because of annoying,offensive, confusing, distracting or messy design choices (Chen and Wells, 1999; Ducoffe,1996). Previous studies show that disorganized websites can generate negative advertisingvalue and diminish the intention to return (Hausman and Siekpe, 2009). Additionally, Ducoffe(1996) notes that irritating banner adsmay increase user anxiety, distract customers and thusdilute customer shopping experiences. AlthoughARSAA, as presented in this study, does notuse banner ads, it still uses personalized recommendations to provide additional informationto its users that might be perceived as similarly irritating. It is thus crucial to investigate theamount of irritation caused by ARSAA. Accordingly, we hypothesize:
H4. ARSAA assisted brick-and-mortar shopping is perceived as more irritating thanunassisted brick-and-mortar shopping.
2.2.2 Recommender systems in brick-and-mortar stores. In the past decades, recommendersystems have helped e-commerce to provide customers with more personalized experiences,creating a positive impact on sales and customer retention (Amatriain and Basilico, 2015;MacKenzie et al., 2013). Modern recommender systems work as an information filter based onmachine learning techniques to determine user preferences. These preferences are thefoundation for the generation of a ranked list of relevant products, typically based on acustomer’s past behavior, similarities to other customers and patterns in item information(Mora et al., 2020a). These systems allow companies to understand how they can targetcustomers throughout the customer journey (Mora et al., 2020a). Recommender systemsprovide utilitarian value for users by improving their efficiency during information searchand product comparison (Pimenidis et al., 2018).
For in-store recommendations, applications on smartphones are currently the most popularapproach (Mora et al., 2020a; Piotrowicz and Cuthbertson, 2014). Their main advantages are
Enhancingbrick-and-
mortar shoppingexperience

the access to data inputs, personal user information (e.g. historical transactions associatedwithan app account), and integrated sensors. An early example of this approach was a smartphone-based recommender system for shoppingmalls that implicitly captured customer’s preferencesfor stores by tracking their positions (Fang et al., 2012). Compared to conventionalrecommender systems, which do not consider a customer’s context; this approach resulted inhigher recommendation accuracy and customer satisfaction. Additionally, the system wasperceived asmore useful and easier to use. Recommender systems are also used in omnichannelcontexts. Here, Carnein et al. (2019) developed a system that gathers and integrates data fromdifferent online channels, but without in-store context awareness—an important requirementin a brick-and-mortar application (Parise et al., 2016).
Additionally, one should note that ubiquitous devices other than smartphoneshave been hardly used in brick-and-mortar retailing for enhancing shopping experience.This might be a result of the limited availability of the used devices (e.g. MicrosoftHoloLens). In comparison, the smartphone is the ideal device for an ARSAA, which can userecommender systems to ease the customers’ path-to purchase. In particular,recommender systems in ARSAA can stimulate multiple motivators of mobile shopping(Huang and Zhou, 2018). As such, it can increase convenience, lead to money saving andbargain hunting and can offer a greater product variety, by giving access to additionalinformation based on interactive product recommendations acknowledging customerpreferences. Additionally, ARSAA can display product reviews made by others, thusfostering social interaction, which has been shown to have a significant impact oncustomer behavior (Dennis et al., 2009). Also, using ARSAA and exploring its productrecommendations can motivate users to buy additional products (Ganesh et al., 2010). Wetherefore hypothesize:
H5. ARSAA assisted brick-and-mortar shopping leads to a higher purchase intentionthan unassisted brick-and-mortar shopping.
2.2.3 Explainable artificial intelligence in recommender systems. Recommender systems usingAI and machine learning models are trained to understand shoppers’ behavior forproviding useful recommendations (Fern�andez-Garc�ıa et al., 2019). However, with the ever-increasing amount of transaction data and complexity of AI, these recommender systemshave often turned into black boxes for their users (Adadi and Berrada, 2018; Omar et al.,2018). This affects users overall trust in services using recommender systems (Fu et al.,2020).When shoppers receive recommendations, they typically do not know the reasons forthese product suggestions, likely affecting consumers’ reactions to such proposals.Therefore, XAI research now focuses on making AI predictions more understandable bydeveloping transparent AI models and explanation methods (Adadi and Berrada, 2018).Indeed, explanations have the potential to support user decision-making, enhance customershopping experience, increase trust, acceptance and adoption of AI-based technologies(Cirqueira et al., 2020b).
Explanations in recommender systems aim to enhance shopping experience throughhigh-quality, interactive and intuitive suggestions, while keeping the recommendationseasy to understand for consumers (Wang et al., 2018). In particular, explainablerecommendations give the user reasons for the given recommendation (Wang andBenbasat, 2008). Here, evidence indicates that explanations can significantly impactcustomers’ purchase intentions (Chen et al., 2019). This corresponds to Gefen et al. (2003)who showed that trust (in the context of TAM) influences customers’ purchase intentionduring online shopping. Based on a meta-analysis, Kim and Peterson (2017) alsodemonstrated that trust is a robust indicator for purchase intention. However, althoughexisting literature provides valuable insights into recommender systems andcorresponding use cases (e.g. Cheng et al., 2019; He et al., 2015; Huang et al., 2019),
JRIM

a combination of explainable recommendations with AR has not yet been explored in aphysical retail context. This motivates this research to hypothesize:
H6. ARSAA assisted shopping using explainable recommendations is perceived asmore trustworthy compared to ARSAA assisted shopping not using explainablerecommendations.
H7. ARSAA assisted shopping using explainable recommendations is superior in termsof perceived shopping experience and purchase intention compared to ARSAAassisted shopping not using explainable recommendations.
2.3 Conceptual frameworkIn this research, we compare the effects of different brick-and-mortar shopping scenarios onperceived shopping experience, purchase intention and trust in technology of ARSAA users.Three shopping scenarios are investigated: a regular shopping scenario (RSS) that does notfeature the use of anARSAA in a brick-and-mortar store, anAR shopping scenario (ARSS), inwhich the user is supported by anARSAA in a brick-and-mortar store, and anARSS inwhichthe user is supported by an ARSAA in a brick-and-mortar store, but that additionally usesexplainable recommendations (XARSS).
Figure 1 summarizes the research hypotheses in a conceptual framework. In detail,Hypotheses 1-4 and 7 investigate the differences in user perception of shopping experienceand Hypotheses 5 and 6 evaluate the differences in user intention and technology evaluation.In brief, Hypotheses 1-5 address the differences between all shopping scenarios, andHypotheses 6 and 7 specifically assess the differences between ARSS and XARSS.
3. MethodologyThis chapter describes how the study was guided by the design science methodology (3.1),how our ARSAA prototype is designed (3.2) and how it was evaluated (3.3).
3.1 Design science researchThis research follows a design science methodology originating from information systemsresearch (Gregor and Hevner, 2013). This approach focuses on the development of an artifactthat “solves identified organizational problems” (Hevner et al., 2004, p. 77). This methodology
Figure 1.Conceptual framework
Enhancingbrick-and-
mortar shoppingexperience

allows us to analyze a problem space, extract requirements for a desired problem-solvingartifact and match the requirements to design an instantiated prototype. The design scienceresearch framework (Hevner et al., 2004; Prat et al., 2014) involves six steps (see Figure 2).
3.1.1 Problem identification and motivation. We started by investigating the problemenvironment, based on the current state of research, and discussions with practitionerswithin the PERFORM network, which is a European project and a consortium composed ofretailers and universities (Perform-Network.eu, 2022). We clarified the problem as the lack ofunderstanding as to whether ARSAA, with recommender systems and explainablerecommendations, can enhance customer shopping experience in brick-and-mortar stores.We found that this lack of understanding creates a barrier for retailers to invest in suchtechnologies in their physical stores.
3.1.2 Definition of the objectives for a solution. The research objective was focused ondeveloping an ARSAA as an artifact and assessing its influence on customer brick-and-mortarstore shopping experience. The scope of the research centers on personalized recommendationsthat retailers can provide to their customers by deploying an in-store based recommendersystem leveraged by a smartphone-based application. These tailored suggestions build arounda particular product with which the customer is interacting, in the form of productrecommendations, comparisons and offers. From our literature review and discussions withpractitioners, we extracted and categorized the requirements of the ARSAA (see Table 2).
3.1.3 Design and development. This research adopted the framework of Ge and Helfert(2014) to mitigate threats to the validity of the study regarding artifact development,experiment and data analysis. Therefore, to guarantee its validity, we first had to establish thekernel theory, which governs the development of the artifact. We investigated extanttaxonomies of explanation methods to select explanation types for AI recommendations tocustomers (Arrieta et al., 2020; Arya et al., 2019;Mueller et al., 2019; Sokol andFlach, 2020). Here,the focus was on local explanations to clarify the reasons for a particular recommendation.
Requirements DescriptionSolution insection
R1 Device The retailer needs to select the device to be used to enable theshopping assistant application
3.2
R2 Personalized experience The app is required to provide recommendations of productsto the users based on authorized personal information
3.2
R3 Brick-and-Mortar focus The shopping assistant application should be context-awareto enable recommendations for shoppers in physical stores
3.2
R4 Explainablerecommendations
The application should provide real-time explanations of theunderlying decision-making for the items recommended
3.2
R5 Artifact evaluation The shopping assistant application should be evaluatedbased on potential customers
5
Figure 2.Design scienceresearch methodologyin this study
Table 2.Identifiedrequirements of theartifact (the ARSAA)
JRIM

3.1.4 Demonstration. The ARSAA and recommendations were implemented by followingthe artifact design by Mora et al. (2020b), which represents a former iteration of this designscience project. The authors developed a shopping assistant application and identified theuser requirements for such an in-store assistant. The application also focused on the design ofrecommender systems as the underlying system to provide personalized recommendationsand presents product comparisons based on items with which the customer is interacting.This research was inspired by the artifact design of Mora et al. (2020a) to develop the mobile-based ARSAA artifact and user interface mockups.
3.1.5 Evaluation.The evaluation of our artifact aimed at testing the formulated hypothesisand hence contributes to solving the identified problem. We followed the framework of Pratet al. (2014) to conduct the evaluation of the ARSAA artifact. Specifically, a user experimentwithin three scenarios and an online survey were conducted.
3.1.6 Communication. This study further clarified the evaluation design and resultsobtained. This demonstrated the varying impact of an ARSAA artifact on the shoppingexperience of customers in-store. We presented practical and theoretical implications ofour study.
3.2 Augmented reality shopping assistant applicationThe proposed artifact was developed as an application running on an android-basedsmartphone (R1). In the scenarios, the app was deployed by the retailer and the devicewas owned by the customer. Hence, it had access to personal information that was requiredto provide tailored recommendations (e.g. social media, historical purchase data).We conceptualized the artifact to provide augmented content. Anchored around theproduct of interest, the application displayed recommendations, offers, a comparison of itemsand a buy button on the smartphone. The artifact provided support to the customer throughthe shopping journey. As an example, the shopping assistant application could identify theproduct with which the customer was interacting (see Figure 3) and provide tailoredcontent (R2).
During this stage of the prototype development, the ARSAAused a smartphone camera todetect a customer’s object of interest (product). By doing so, the application could monitor thecamera’s field of view, to determine which product the user was examining at each point intime and to track the item in the physical space while the customer interacts with the product(R3). The involved object recognition was performed using software development kits, e.g.Vuforia (He et al., 2015). When the application recognized the product, it displayed multipledigital buttons anchored around the product that can be triggered by the customer to displayrelevant content using AR.
The user interface provided support to the customer through the shopping journey byidentifying the product with which the customer interacted to provide tailored suggestions.The user interface provided easy navigation and intuitive visualization (see Figure 4).
Figure 3.Demonstration of theapplication (left) and a
prototype interfacescreenshot (right)
Enhancingbrick-and-
mortar shoppingexperience

To provide explainable recommendations (R4), we adopted Zhang and Chen’s (2020)classification of explanationmethods in the context of recommender systems: (1) user or item-based; (2) feature-level; (3) textual; (4) visual; and (5) social. The impact of XAI types on theARSAA interface is summarized in Table 3.
Following the taxonomy of Ge and Helfert (2014), we implemented the five explanationmethods into our ARSAA as the kernel theory governing the design of the artifact. Eachmethod provided users with an explanation type to support them during the brick-and-mortar shopping journey.
3.3 Evaluation designThe evaluation design of our study was based on an online experiment. In this phase of theproject, the artifact has not been evaluated in the real context of the problem or environment(i.e. in-store) because of the early stage of the artifact. Therefore, study participants interactedwith an online version andmockup of the ARSAA. This was followed by an evaluationwhichincluded an online survey with a quantitative and qualitative assessment of the shoppingexperience, purchase intention and trust (R5).
3.3.1 Participants. Participants of the within-subject experiment were recruited using thecrowdsourcing provider Clickworkercom (2020a). This provider was chosen as it ensured ahigh level of qualification of the study participants by requiring the use of real personal data,
XAI types Impact on ARSAA interface
User or Item-Based
Explains that other customers frequently buy certain products together or that a set ofitems are similar to each other
Feature-Level Relevant features of an item are displayed, e.g. a nutritional table from a cookie
Textual A box appears in the interface next to the recommendations with an explanation in text
Visual The customer perceives important features on the representation of a product highlighted
Social The explanations are visualized by a friend’s or social media comment or by anaggregated rating
Figure 4.Screenshot of theinterface of thefunctional prototype.In this example, booksuggestions areprovided with a socialexplanation based onfriends’ reviews
Table 3.Explanation methodsfor recommendationsand their impact on theARSAA interface
JRIM
testing of writing and language qualifications and a constant evaluation of their members’response patterns (Clickworkercom, 2020b).
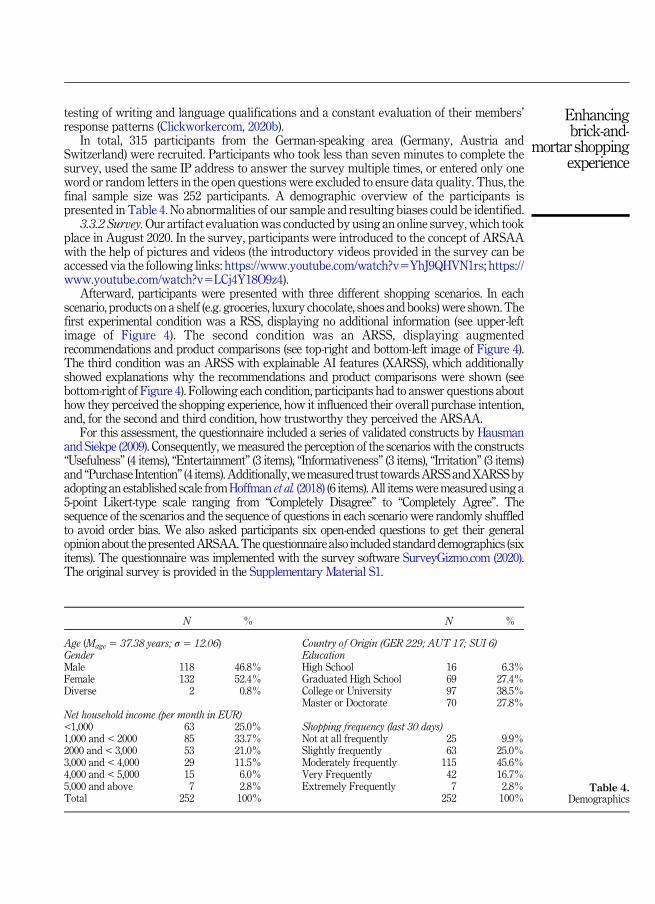
In total, 315 participants from the German-speaking area (Germany, Austria andSwitzerland) were recruited. Participants who took less than seven minutes to complete thesurvey, used the same IP address to answer the survey multiple times, or entered only oneword or random letters in the open questions were excluded to ensure data quality. Thus, thefinal sample size was 252 participants. A demographic overview of the participants ispresented in Table 4. No abnormalities of our sample and resulting biases could be identified.
3.3.2 Survey.Our artifact evaluationwas conducted by using an online survey, which tookplace in August 2020. In the survey, participants were introduced to the concept of ARSAAwith the help of pictures and videos (the introductory videos provided in the survey can beaccessed via the following links: https://www.youtube.com/watch?v5YhJ9QHVN1rs; https://www.youtube.com/watch?v5LCj4Y18O9z4).
Afterward, participants were presented with three different shopping scenarios. In eachscenario, products on a shelf (e.g. groceries, luxury chocolate, shoes and books) were shown.Thefirst experimental condition was a RSS, displaying no additional information (see upper-leftimage of Figure 4). The second condition was an ARSS, displaying augmentedrecommendations and product comparisons (see top-right and bottom-left image of Figure 4).The third condition was an ARSS with explainable AI features (XARSS), which additionallyshowed explanations why the recommendations and product comparisons were shown (seebottom-right of Figure 4). Following each condition, participants had to answer questions abouthow they perceived the shopping experience, how it influenced their overall purchase intention,and, for the second and third condition, how trustworthy they perceived the ARSAA.
For this assessment, the questionnaire included a series of validated constructs by Hausmanand Siekpe (2009). Consequently, we measured the perception of the scenarios with the constructs“Usefulness” (4 items), “Entertainment” (3 items), “Informativeness” (3 items), “Irritation” (3 items)and “Purchase Intention” (4 items).Additionally,wemeasured trust towardsARSSandXARSSbyadopting an established scale fromHoffman et al. (2018) (6 items). All itemsweremeasured using a5-point Likert-type scale ranging from “Completely Disagree” to “Completely Agree”. Thesequence of the scenarios and the sequence of questions in each scenario were randomly shuffledto avoid order bias. We also asked participants six open-ended questions to get their generalopinion about the presentedARSAA.Thequestionnaire also included standarddemographics (sixitems). The questionnaire was implemented with the survey software SurveyGizmo.com (2020).The original survey is provided in the Supplementary Material S1.
N % N %
Age (Mage 5 37.38 years; σ 5 12.06) Country of Origin (GER 229; AUT 17; SUI 6)Gender EducationMale 118 46.8% High School 16 6.3%Female 132 52.4% Graduated High School 69 27.4%Diverse 2 0.8% College or University 97 38.5%
Master or Doctorate 70 27.8%Net household income (per month in EUR)<1,000 63 25.0% Shopping frequency (last 30 days)1,000 and < 2000 85 33.7% Not at all frequently 25 9.9%2000 and < 3,000 53 21.0% Slightly frequently 63 25.0%3,000 and < 4,000 29 11.5% Moderately frequently 115 45.6%4,000 and < 5,000 15 6.0% Very Frequently 42 16.7%5,000 and above 7 2.8% Extremely Frequently 7 2.8%Total 252 100% 252 100%
Table 4.Demographics
Enhancingbrick-and-
mortar shoppingexperience

3.3.3 Validity and reliability. To assess validity and reliability of the constructs used, aconfirmatory factor analysis was used to test the measurement models in each shoppingscenario. It became apparent that in all scenarios one “Usefulness” item showed amisspecified error covariance, indicating a systematic measurement error for this item.Therefore, following Byrne (2010), we excluded the item. Additionally, in the ARSS andXARSS scenarios one trust item did not load on the “Trust” construct and two additionaltrust items were cross-loading on the factor “Usefulness”. Consequently, we also excludedthese items from the measurement models (Byrne, 2010). All three final models showed anappropriate fit:
RSS: X2 (94) 5 174.833, RMSEA 5 0.059, CFI 5 0.969, SRMR 5 0.045; ARSS: X2
(137)5 175.585, RMSEA5 0.033, CFI5 0.990, SRMR5 0.028; XARSS: X2 (137)5 168.461,RMSEA 5 0.030, CFI 5 0.993, SRMR 5 0.022.
All items displayed sufficient item to construct loadings (Hair et al., 2008) ranging from0.609 to 0.926 (see Table 5). Establishing reliability, all constructs showed good Cronbach’s αcoefficients in all scenarios (Konting et al., 2009), ranging from 0.773 to 0.934 (see Table 6).Verifying convergent validity, composite reliability (>0.7) and average variance extracted(>0.5) exceeded the desired thresholds (Fornell andLarcker, 1981) in all scenarios (seeTable 6).As the square root of the average variance extracted for each construct was greater than itshighest correlation with any other construct (Hair et al., 2008), discriminant validity wasestablished in the RSS and ARSS scenario. In the XARSS scenario, a violation(difference 5 0.06) of discriminant validity could be detected between the construct“Irritation” and “Entertainment”. However, because the violation is minimal, these constructs
Scale ItemFactor loading
RSS ARSS XARSS
Usefulness This scenario can improve my shopping performance 0.842 0.885 0.920This scenario can increase my shopping productivity 0.866 0.892 0.882This scenario can increase my shopping effectiveness 0.860 0.886 0.895
Entertainment The shown scenario is enjoyable 0.839 0.885 0.897The shown scenario is pleasing 0.820 0.839 0.884This scenario is entertaining 0.762 0.817 0.756
Informativeness The shown scenario offers a good source of productinformation
0.863 0.865 0.854
This scenario supplies relevant information 0.786 0.888 0.862This scenario is informative concerning the shown products 0.880 0.817 0.834
Irritation The shown scenario is annoying 0.650 0.776 0.759The shown scenario is frustrating 0.896 0.870 0.841This scenario is irritating 0.609 0.857 0.864
PurchaseIntention
I would definitely buy products in this scenario 0.774 0.846 0.821I would intend to purchase products in this scenario in thenear future
0.830 0.897 0.876
If it would exist today, it is likely that I would purchaseproducts in this scenario in the near future
0.899 0.913 0.926
I would expect to purchase products in this scenario in thenear future if it would exist today
0.868 0.873 0.901
Trust I am confident in the application. I feel that it works well N/A 0.807 0.855The application seems very reliable N/A 0.788 0.840I feel safe that when I rely on the application, I get the rightinformation
N/A 0.774 0.835
Note(s): RSS (Regular Shopping Scenario), ARSS (Augmented Reality Shopping Scenario), XARSS(Augmented Reality Shopping Scenario with Explainable Artificial Intelligence)
Table 5.Item to constructloadings
JRIM

have been validated by other researchers (e.g. Hausman and Siekpe, 2009; Hoffman et al., 2018),and the RSS and ARSS scenarios did not indicate any violation, we consider discriminantvalidity as established.
3.3.4 Analysis. As the survey contained more than 30 participants, according to the centrallimit theorem (Bortz and Schuster, 2010; K€ahler, 2004; Tavakoli, 2013), this was sufficient toassume normal distribution, allowing parametric testing. Therefore, we analyzed participants’perceptions of the conditions (“Usefulness”, “Entertainment”, “Informativeness”, “Irritation”)and their “Purchase Intention” using a repeated measurement analysis of variance analysis(rmANOVA). The differences in trust towardsARSS andXARSSwere analyzed using a pairedsample t-test. When statistically significant differences were identified, we used Bonferroniadjusted post-hoc tests to highlight the differences between the scenarios. Subsequently, wetested the effect size of the discovered differences using Cohen’s d. The software SPSS 26(IBM.com, 2020) was used to analyze the survey data except for the open questions, whichweremanually reviewed and coded.
4. ResultsWe present, the quantitative results based on rmANOVA and paired sample t-test (seeTable 7) together with the Bonferroni-adjusted post-hoc analyzes and effect sizes (seeTable 8). Also, we show the participants’ qualitative responses by screening the openquestions for observable patterns and general sentiments (see Table 9).
4.1 Quantitative resultsBased on the rmANOVA, and the paired sample t-test (see Table 7), significant differences inthe perceptions of the three shopping scenarios were identified: “Usefulness” (p < 0.001),
Constructs α CR AVE 1 2 3 4 5 6
RSS1. Purchase Intention 0.907 0.908 0.712 0.8442. Usefulness 0.891 0.892 0.733 0.623 0.8563. Entertainment 0.844 0.849 0.652 0.651 0.792 0.8084. Informativeness 0.881 0.881 0.712 0.574 0.745 0.679 0.8445. Irritation 0.773 0.768 0.532 �0.453 �0.434 �0.505 �0.449 0.729
ARSS1. Purchase Intention 0.934 0.934 0.779 0.8832. Usefulness 0.917 0.918 0.788 0.768 0.8883. Entertainment 0.884 0.884 0.718 0.719 0.794 0.8474. Informativeness 0.891 0.892 0.735 0.640 0.743 0.695 0.8575. Irritation 0.873 0.874 0.698 �0.617 �0.681 �0.674 �0.588 0.8356. Trust 0.833 0.833 0.624 0.741 0.758 0.786 0.759 �0.670 0.790
XARSS1. Purchase Intention 0.933 0.933 0.778 0.8822. Usefulness 0.926 0.927 0.808 0.856 0.8993. Entertainment 0.883 0.884 0.719 0.811 0.837 0.8484. Informativeness 0.886 0.887 0.723 0.772 0.830 0.763 0.8505. Irritation 0.863 0.862 0.677 �0.697 �0.742 �0.829 �0.692 0.8236. Trust 0.881 0.881 0.711 0.778 0.793 0.793 0.771 �0.671 0.843
Note(s): α (Cronbach’s alpha), CR (Composite reliability), AVE (Average Variance Extracted), RSS (RegularShopping Scenario), ARSS (Augmented Reality Shopping Scenario), XARSS (Augmented Reality ShoppingScenario with Explainable Artificial Intelligence). Figures on the diagonal represent the square root of theaverage variance extracted of the corresponding factor
Table 6.Construct reliability
and validity
Enhancingbrick-and-
mortar shoppingexperience
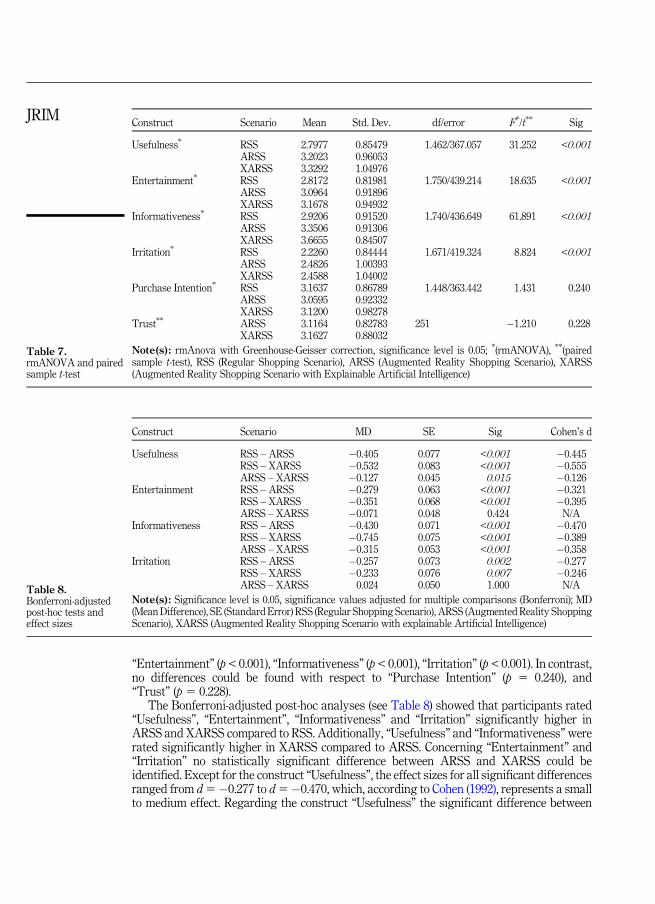
“Entertainment” (p< 0.001), “Informativeness” (p< 0.001), “Irritation” (p< 0.001). In contrast,no differences could be found with respect to “Purchase Intention” (p 5 0.240), and“Trust” (p 5 0.228).
The Bonferroni-adjusted post-hoc analyses (see Table 8) showed that participants rated“Usefulness”, “Entertainment”, “Informativeness” and “Irritation” significantly higher inARSS and XARSS compared to RSS. Additionally, “Usefulness” and “Informativeness”wererated significantly higher in XARSS compared to ARSS. Concerning “Entertainment” and“Irritation” no statistically significant difference between ARSS and XARSS could beidentified. Except for the construct “Usefulness”, the effect sizes for all significant differencesranged from d5�0.277 to d5�0.470, which, according to Cohen (1992), represents a smallto medium effect. Regarding the construct “Usefulness” the significant difference between
Construct Scenario Mean Std. Dev. df/error F*/t** Sig
Usefulness* RSS 2.7977 0.85479 1.462/367.057 31.252 <0.001ARSS 3.2023 0.96053XARSS 3.3292 1.04976
Entertainment* RSS 2.8172 0.81981 1.750/439.214 18.635 <0.001ARSS 3.0964 0.91896XARSS 3.1678 0.94932
Informativeness* RSS 2.9206 0.91520 1.740/436.649 61.891 <0.001ARSS 3.3506 0.91306XARSS 3.6655 0.84507
Irritation* RSS 2.2260 0.84444 1.671/419.324 8.824 <0.001ARSS 2.4826 1.00393XARSS 2.4588 1.04002
Purchase Intention* RSS 3.1637 0.86789 1.448/363.442 1.431 0.240ARSS 3.0595 0.92332XARSS 3.1200 0.98278
Trust** ARSS 3.1164 0.82783 251 �1.210 0.228XARSS 3.1627 0.88032
Note(s): rmAnova with Greenhouse-Geisser correction, significance level is 0.05; *(rmANOVA), **(pairedsample t-test), RSS (Regular Shopping Scenario), ARSS (Augmented Reality Shopping Scenario), XARSS(Augmented Reality Shopping Scenario with Explainable Artificial Intelligence)
Construct Scenario MD SE Sig Cohen’s d
Usefulness RSS – ARSS �0.405 0.077 <0.001 �0.445RSS – XARSS �0.532 0.083 <0.001 �0.555ARSS – XARSS �0.127 0.045 0.015 �0.126
Entertainment RSS – ARSS �0.279 0.063 <0.001 �0.321RSS – XARSS �0.351 0.068 <0.001 �0.395ARSS – XARSS �0.071 0.048 0.424 N/A
Informativeness RSS – ARSS �0.430 0.071 <0.001 �0.470RSS – XARSS �0.745 0.075 <0.001 �0.389ARSS – XARSS �0.315 0.053 <0.001 �0.358
Irritation RSS – ARSS �0.257 0.073 0.002 �0.277RSS – XARSS �0.233 0.076 0.007 �0.246ARSS – XARSS 0.024 0.050 1.000 N/A
Note(s): Significance level is 0.05, significance values adjusted for multiple comparisons (Bonferroni); MD(MeanDifference), SE (Standard Error) RSS (Regular Shopping Scenario), ARSS (Augmented Reality ShoppingScenario), XARSS (Augmented Reality Shopping Scenario with explainable Artificial Intelligence)
Table 7.rmANOVA and pairedsample t-test
Table 8.Bonferroni-adjustedpost-hoc tests andeffect sizes
JRIM

Q S No.M Code No.M Example statement
Q1 Yes 109 ProductInformation
50 “Yes, like the detailed nutritional information, calories, etc.. . ..”
Price Comparison 32 “Comparison with other stores for price”Personalization 14 “Customizability of the app, change appearance, sizes of
the UI elements”No 131 All fine 126 “No, I don’t miss any features”
Overloaded 8 “No, it’s already quite overloaded with information.”Q2 Yes 141 App Design 63 “The design of the tiles that pop up around the product
could be improved”Missing Features 31 “Calculator for food waste reduction”App Functionality 26 “Internet connection in some malls is very bad”
No 90 N/A N/A N/AQ3 Yes 124 Less need to touch 49 “Yes, because you don�t need to touch everything”
Less need tointeract
37 “Yes, because I do not need to talk to the shop assistant”
Effective Shopping 25 “Yes, because then my shopping would be faster”No 106 No Benefit 73 “No, because I still have to go to the store”
Time Waste 16 “No, even worse because I would stay in the shop forlonger”
Q4 Yes 95 Information 44 “Yes, because I can get more Information easily”Fun 19 “Yes, fun to use”Faster 8 “Yes, it makes shopping faster”
No 117 Don’t need this 34 “No because in-store I get enough information”Online Shopper 21 “No, Online shopping would still be easier”Time Waste 16 “No, it would take too much time while using the
application”Q5 Yes 191 Get Information 40 “Yes, because it shows what I want to know about the
product”Ease of Use 29 “Yes, they were clear and easy to understand”Recommendations 10 “I find the explanations helpful because they make the
recommendations lucid for me”No 38 Unnecessary 10 “I do not really want to see what my friends think about a
specific product”Overloaded 7 “It’s too much information”
Q6 N/A Electronics 108 “Probably electronics because it’s not always easy to findthe relevant information for these products”
Groceries 72 “Grocery. I like to check the ingredients. Sometime I have tolook up E-numbers . . ..”
Clothing 38 “I guess I would most likely use that app for shoppingclothing (shoes) in order to check for the sizes andmeasurements”
Would not use it 31 “I would not use this application”All Scenarios 18 “In all retail shopping situations”Luxury 13 “I would use it for more expensive products and for
products which I buy not very often”Books 6 “Books, seeing my friends and other peoples
recommendations”
Note(s): Q (Question), S (Sentiment), No. M (Number of Mentions); Q1. Looking at the presented application,are there features you aremissing?; Q2. Do you see any issues or room for improvement when using this app? Ifyes, could you give examples?; Q3.Would this application help to make your shopping trip more secure duringCOVID19? If yes, why and if no, why not?; Q4.Would this applicationmotivate you to shop in-store? If yes, whyand if no, why not?; Q5. Did you find the explanations given by the application helpful? If yes, why and if no,why not?; Q6. In which shopping scenario (grocery/electronics/luxury/clothing/etc.) would you most likely usesuch an application?
Table 9.Qualitative results
(open question review)
Enhancingbrick-and-
mortar shoppingexperience

RSS and ARSS signaled a small to medium effect (d 5 �0.445), the difference between RSSand XARSS showed a medium to large effect (d5�0.555) and the difference between ARSSand XARSS suggested a small effect (d 5 �0.126).
Regarding H1, H2 and H3, we conclude that ARSAA had a positive influence on perceivedshopping experience, as the constructs “Usefulness”, “Entertainment” and “Informativeness”were all significantly higher in the ARSAA assisted shopping conditions (ARSS and XARSS)than in the unassisted condition (RSS). However, this positive effect might indeed bediminished as the ARSAA assisted shopping scenarios also showed a significantly higherlevel of consumer “Irritation” supporting H4.
H5 was not supported as no significant differences were found between participants’“Purchase Intention” across the different scenarios. Similarly, H6was not supported. Here thedata did not reveal a significant difference in the “Trust”-level for the two ARSAA assistedshopping scenarios.
H7 was partially supported as “Usefulness” and “Informativeness” were ratedsignificantly higher in ARSAA assisted shopping scenarios using explainablerecommendations than in ARSAA assisted shopping scenarios not using explainablerecommendations. However, for the constructs “Entertainment” and “Irritation” nosignificant influence of explainable recommendation could be observed.
4.2 Qualitative resultsAnswers from the qualitative questions were coded by patterns (i.e. recurring sentiments)given in the answers entered in the free text field. Results from qualitative data analysis aresummarized in Table 9. It presents the general sentiment, most frequent patterns (defined asmore than five text passages with a specific sentiment) and an example statement for eachpattern.
5. DiscussionOur study revealed significant differences between the evaluated shopping scenarios (R5). Inparticular, participants evaluate RSS significantly lower in terms of “Usefulness”,“Entertainment”, “Information” and “Irritation” when compared to ARSS and XARSS.These results demonstrate that ARSAA is indeed able to positively influence the customershopping experience. The observed effect sizes range from small to medium. This should beconsidered when interpreting the results. However, the difference between RSS and XARSSshowed a large effect regarding “Usefulness”, which demonstrates that using ARSAA canindeed strongly support customers during shopping. Considering that PU is the keydeterminant of technology acceptance decisions (see the results of meta-analyses andreviews, e.g. King and He, 2006; Lee et al., 2003), this finding is of paramount importance.
As a complement to the quantitative data, our qualitative data provide evidence for thepositive effects of ARSAA on shopping experience. Drawing from the results of Q6, mostparticipants could imagine using ARSAA during one of their shopping scenarios and only aminority had no interest at all. Additionally, we observed that nearly half the participants ofour survey would be motivated by ARSAA to visit a brick-and-mortar store (Q4). The mainreasons being the availability of additional information, the fun of using the interactiveapplication and the increase in shopping speed. Furthermore, most participants stated thatARSAA could make their shopping trip more secure (Q3) as it would require touching fewerthings, interactingwith fewer people and possibly speeding up their shopping trip. Q1 andQ2demonstrate that the presented ARSAA can be improved by design and functionalitychanges, and by including features like in-depth product information, price comparison andpersonalization options which could further increase effectiveness.
JRIM

In contrast to previous research (Hilken et al., 2017; Javornik, 2016; Poushneh andVasquez-Parraga, 2017; Yim et al., 2017), our study could not detect a statistically significantdifference in “Purchase Intention” when comparing RSS, ARSS and XARSS. However, weargue that the cumulative effect of increased usefulness, entertainment and information,added to the positive sentiment expressed in the open questions Q3 and Q4 and thedemonstrated confidence of using ARSAA in various shopping scenarios in Q6, providesnotable evidence that ARSAA can be used to influence in-store shopping experiencepositively. Additionally, we argue that the strength of these effects could even be improvedby future versions of ARSAA, if the participants’ feedback (see Q1 and Q2) is taken intoconsideration.
Analyzing the impact of explainable recommendations on “Trust”, in contrast toprevious studies (Chen et al., 2019; Cirqueira et al., 2020b), no significant difference betweenXARSS and ARSS could be observed. However, partly in line with Cirqueira et al. (2020b),our study found further evidence that explainable recommendations can increaseshopping experience as XARSS rated significantly higher in terms of “Usefulness” and“Entertainment”. This is also supported by the sentiment expressed in Q5, which showsthat the explainable recommendations were perceived as helpful by the majority ofparticipants.
Summarizing, in response to RQ1, it is evident that ARSAA can influence a customer’sshopping experience by significantly influencing perceived “Usefulness”, “Entertainment”,“Information” and “Irritation”. In response to RQ2, it became apparent that improving thedesign and functionality, while including features like in-depth product information, pricecomparison and personalization options, would improve the overall satisfactionwithARSAAand, therefore, enhance its influence on shopping experience.
5.1 Theoretical contributionsThis study offers theoretical contributions to advance the state of research in the field ofpersonalized recommendations provided by an AR application in brick-and-mortar stores.Our literature review shows that no previous studies have evaluated the impact of such anapplication on in-store shopping experience. Hence, our results widen this understanding byproviding experimental results. Therefore, this study demonstrates that ARSAA assistedshopping is perceived as more useful, entertaining and informative than unassistedshopping. Contrary to TAM studies (e.g. Gefen et al., 2003; Hausman and Siekpe, 2009) andUGT studies (e.g. E. Huang, 2008; Luo, 2002), our examination shows that this increase incustomer shopping experience neither converted into an increase of purchase intention norinto intention to visit the store. Interestingly, although an increase of “Irritation” could beobserved, its impact on shopping experience was not strong enough to cause an overalldecrease in shopping experience, as suggested by previous studies (Chen and Wells, 1999;Ducoffe, 1996). Thus, this study provides evidence that, in the domain of “augmented realityapplications used in digital retail”, classical theories such as TAM and UGT do notsufficiently account for the specific circumstances (e.g. connection of online and offlinecustomer journey through smartphone applications) typical for digital retail to adequatelydescribe the influence of the investigated perceptual constructs on customer shoppingexperience and purchase intention. This is line with recent research (for a recent review, seeSindermann et al., 2020), which suggests that, e.g. user personality has a significant impact ontechnology acceptance particularly in the more modern retailing contexts such as onlineshopping and omnichannel shopping (Hermes et al., 2022; Hermes andRiedl, 2021). Therefore,our study contributes to the further development of TAM and UGT by highlighting shortcomings of these theories, specifically concerning the interaction of customer experience,purchase intention and customer irritation in the omnichannel domain.
Enhancingbrick-and-
mortar shoppingexperience

From a methodological perspective, the study illustrates the benefits of using designscience methodology for solving real-world problems by designing an artifact with justifiedrequirements that were extracted from an extensive literature review and discussions withretail experts. Hence, this research provides design principles and practices for developing anARSAA. Scholars and practitioners, especially from the field of interactive marketing, canuse this artifact to create advanced versions of ARSAA that can further increase shoppingexperience. Additionally, the study facilitates the need for user-centric experiments, whichevaluate the impact of ARSAA artifacts in real world scenarios.
5.2 Practical implicationsARSAA provides an opportunity for retailers to enhance their customers’ shoppingexperience, as it provides a more useful, entertaining and informative experience.Additionally, this study shows that ARSAA using explainable recommendations (XARSS)can increase the customers perceived “Usefulness” and “Informativeness” even further.Therefore, implementing explainable recommendations into AR applications isrecommended.
Interestingly, explainable recommendations did not increase “Trust” in ARSAA.Consequently, we cannot advise retailers to implement explainable recommendations iftheir only goal is to increase trust in their AR application. Furthermore, in line with (Yim andPark, 2019), the results also show that an ARSAA can increase “Irritation”, which must beconsidered by retailers who want to implement such technology. To decrease irritation,retailers should focus on their customers’ needs, requirements and capabilities whendeveloping ARSAA. Therefore, they should put emphasis on optimizing the features andfunctionalities of ARSAA to ensure the creation of a smooth and easy-to-use application(Apple, 2022; Google, 2022).
Additionally, our study could not detect a significant, direct impact of ARSAA onpurchase intention. However, as ARSAA positively influences shopping experience, animportant part of the path to purchase, we still recommend that retailers who seek to increasetheir sales implement this technology.
Strategically, we recommend digital retailers to provide ARSAA to their brick-and-mortarcustomers as it has the potential to increase competitive power against online pure players. Inparticular, digital retailers could use explainable recommendations to initiate cross-selling orup-selling directly at the point of sale by giving customers the chance to access the entireproduct portfolio in a useful, entertaining, informative and interactive way. In this regard, themarketing department of a company must deliver the right interactive experience bypresenting the correct product recommendations on customers’ smartphones.
5.3 Limitations and future researchAswith all research, our study has limitations, which provide avenues for future research.Werestricted our assessment to an online evaluation approach. Therefore, future studies shouldtest actual usage of the technology in a real brick-and-mortar store thereby increasingexternal validity and allowing the evaluation of additional constructs that requireparticipants to use the technology in a real-life setting (e.g. flow). Importantly, “flow” hasshown to have a strong influence on purchase intention (Hausman and Siekpe, 2009; Huangand Liao, 2017; Javornik, 2016). Thus, we call for future studies assessing the impact onimportant outcome variables (e.g. purchase intention) eventually complemented by furtherdownstream variables such as actual purchase behavior. Such a future endeavor should alsoincorporate the knowledge gained from this study. The insights fromQ1 and Q2 in particularcan be used to improve the design of the ARSAA. Additionally, the fact that XARSS isperceived as much more useful than RSS should inspire future research to investigate the
JRIM

benefits of providing XARSS in brick-and-mortar stores. In this regard, it should also benoted that, according to the results of this study, theories like TAMandUGTmight not give acomplete picture of the impact of the investigated constructs on purchase intention orcustomer experience in the context of AR applications in the digital retail domain. Thus,future researchmight advance these theories tomake them applicable in the emerging field ofAR. In this regard, future research should especially consider personality as a directdeterminant, or as moderator variable, in studies on ARSAA in brick-and-mortar stores as ithas shown to have a significant influence technology acceptance (Hermes et al., 2022; Hermesand Riedl, 2021).
Additionally, we did not measure the impact of privacy concerns on shopping experienceor actual usage behavior. However, especially for European retailers who must comply withthe General Data Protection Regulations, this is an important area to be investigated byfuture research.
6. ConclusionIn this study, we followed a design science research methodology and tested the influence ofan ARSAA artifact on consumers’ in-store shopping experience. The results illustrate thatusing an ARSAA that uses personalized recommendations and XAI features can indeedincrease the shopping experience by providing higher levels of interactivity, making it animportant avenue of future research in the field of interactive marketing.
To conclude, as the retail sector moves forward and most brick-and-mortar retailers facechallenges to remain competitive, this study can serve as a foundation when assessing theinfluence of an ARSAA on shopping experience and the design of such an application. It willbe rewarding to see what insights future design science initiatives will reveal.
References
Adadi, A. and Berrada, M. (2018), “Peeking inside the black-box: a survey on explainable artificialintelligence (XAI)”, IEEE Access, Vol. 6, pp. 52138-52160, doi: 10.1109/ACCESS.2018.2870052.
Amatriain, X. and Basilico, J. (2015), “Recommender systems in industry: a Netflix case study”, inRecommender Systems Handbook, 2nd ed., Springer, Boston, doi: 10.1007/978-1-4899-7637-6.
Apple (2022), “Human interface guidelines - design - apple developer”, available at: https://developer.apple.com/design/human-interface-guidelines/.
Arora, N., Liu, W.W., Robinson, K., Stein, E., Ensslen, D., Fiedler, L. and Sch€uler, G. (2021), “The valueof getting personalization right or wrong is multiplying”, McKinsey & Company, available at:https://www.mckinsey.com/business-functions/marketing-and-sales/our-insights/the-value-of-getting-personalization-right-or-wrong-is-multiplying.
Arrieta, A.B., D�ıaz-Rodr�ıguez, N., Ser, J.D., Bennetot, A., Tabik, S., Barbado, A., Garcia, S., Gil-Lopez, S.,Molina, D., Benjamins, R., Chatila, R. and Herrera, F. (2020), “Explainable Artificial Intelligence(XAI): concepts, taxonomies, opportunities and challenges toward responsible AI”, InformationFusion, Vol. 58 No. 1, pp. 82-115.
Arya, V., Bellamy, R.K.E., Chen, P.Y., Dhurandhar, A., Hind, M., Hoffman, S.C., Houde, S., Vera Liao, Q.,Luss, R., Mojsilovi�c, A., Mourad, S., Pedemonte, P., Raghavendra, R., Richards, J., Sattigeri, P.,Shanmugam, K., Singh, M., Varshney, K.R., Wei, D. and Zhang, Y. (2019), One ExplanationDoes Not Fit All: A Toolkit and Taxonomy of Ai Explainability Techniques, IBM Research -ArXiv, available at: https://arxiv.org/abs/1909.03012.
Baabdullah, A.M., Alsulaimani, A.A., Allamnakhrah, A., Alalwan, A.A., Dwivedi, Y.K. and Rana, N.P.(2022), “Usage of augmented reality (AR) and development of e-learning outcomes: an empiricalevaluation of students’ e-learning experience”, Computers and Education, Vol. 177, p. 104383,doi: 10.1016/j.compedu.2021.104383.
Enhancingbrick-and-
mortar shoppingexperience

Berman, B. (2018), “Flatlined: combatting the death of retail stores”, Business Horizons, Vol. 62 No. 1,doi: 10.1016/j.bushor.2018.08.006.
Bortz, J. and Schuster, C. (2010), Statistik f€ur Human- und Sozialwissenschaftler, Springer BerlinHeidelberg, doi: 10.1007/978-3-642-12770-0.
Briedis, H., Kronschnabl, A., Rodriguez, A. and Ungerman, K. (2020), Adapting to the Next Normal inRetail: the Customer Experience Imperative, McKinsey & Company, available at: http://dln.jaipuria.ac.in:8080/jspui/bitstream/123456789/1510/1/Adapting-to-the-next-normal-in-retail-the-customer-experience-imperative.pdf.
Byrne, B. (2010), Structural Equation Modeling with AMOS: Basic Concepts, Applications, andProgramming, 2nd ed., pp. 114-118, available at: https://www.amazon.com/Structural-Equation-Modeling-Barbara-Byrne/dp/B01CNWB3N0.
Bureau, U.S.C. (2018), “Department store sales (excluding leased departments) in the United Statesfrom 1992 to 2016”, in billion U.S. dollars, available at: https://www.statista.com/statistics/197712/annual-department-store-sales-in-the-us-since-1992/.
Capgemini (2020), “Share of global online population who say they are comfortable doing selectactivities online as of February 2020”, Statista, available at: https://www.statista.com/statistics/1132228/share-offline-population-worldwide-comfort-using-internet/.
Carnein, M., Homann, L., Trautmann, H. and Vossen, G. (2019), “A recommender system based onOmni-channel customer data”, 2019 IEEE 21st Conference on Business Informatics (CBI),pp. 65-74, doi: 10.1109/CBI.2019.00015.
Carroll, D. and Guzman, I. (2013), “The new omni-channel approach to serving customers”, Accenture,pp. 1-16, available at: https://scholar.google.com/scholar?cluster518038375230090677065&hl5de&as_sdt50,5.
Central Statistics Office (2020), “Type of internet activities - CSO - Central Statistics Office”, CSO,available at: https://www.cso.ie/en/releasesandpublications/ep/p-isshh/informationsocietystatistics-households2020/typeofinternetactivities/.
Chen, Q. and Wells, W.D. (1999), “Attitude toward the site”, Journal of Advertising Research, Vol. 39No. 5, pp. 27-38, available at: https://go.gale.com/ps/i.do?id5GALE%7CA111508662&sid5googleScholar&v52.1&it5r&linkaccess5abs&issn500218499&p5AONE&sw5w&userGroupName5anon∼26a3659a.
Chen, X., Zhang, Y. and Qin, Z. (2019), “Dynamic explainable recommendation based on neuralattentive models”, Proceedings of the AAAI Conference on Artificial Intelligence, Vol. 33,pp. 53-60, doi: 10.1609/aaai.v33i01.330153.
Cheng, Z., Chang, X., Zhu, L., Kanjirathinkal, R.C. and Kankanhalli, M. (2019), “MMalfM: explainablerecommendation by leveraging reviews and images”, ACM Transactions on InformationSystems, Vol. 37 No. 2, doi: 10.1145/3291060.
Cirqueira, D., Hofer, M., Nedbal, D., Helfert, M. and Bezbradica, M. (2020a), “Customer purchasebehavior prediction in e-commerce: a conceptual framework and research agenda”, inLecture Notes in Computer Science (Including Subseries Lecture Notes in ArtificialIntelligence and Lecture Notes in Bioinformatics), 11948 LNAI, pp. 119-136, doi: 10.1007/978-3-030-48861-1_8.
Cirqueira, D., Nedbal, D., Helfert, M. and Bezbradica, M. (2020b), “Scenario-based requirementselicitation for user-centric explainable AI”, Lecture Notes in Computer Science, Vol. 12279,pp. 321-341, doi: 10.1007/978-3-030-57321-8_18.
Clickworker.com (2020a), “AI training data and other data management services”, available at: https://www.clickworker.com/.
Clickworker.com (2020b), “Our crowd - the clickworkers”, available at: https://www.clickworker.com/clickworker-crowd/.
Cohen, J. (1992), “A power primer”, Psychological Bulletin, Vol. 112 No. 1, pp. 155-159, doi: 10.1037/0033-2909.112.1.155.
JRIM
Cruz, E., Orts-Escolano, S., Gomez-Donoso, F., Rizo, C., Rangel, J.C., Mora, H. and Cazorla, M. (2019),“An augmented reality application for improving shopping experience in large retail stores”,Virtual Reality, Vol. 23 No. 3, pp. 281-291, doi: 10.1007/s10055-018-0338-3.
Davis, F.D. (1989), “Perceived usefulness, perceived ease of use, and user acceptance of informationtechnology”, MIS Quarterly, Vol. 13 No. 3, p. 319, doi: 10.2307/249008.
Dennis, C., Merrilees, B., Jayawardhena, C. and Tiu Wright, L. (2009), “E-consumer behaviour”,European Journal of Marketing, Vol. 43 Nos 9/10, pp. 1121-1139, doi: 10.1108/03090560910976393.
Ducoffe, R.H. (1995), “How consumers assess the value of advertising”, Journal of Current Issues andResearch in Advertising, Vol. 17 No. 1, pp. 1-18, doi: 10.1080/10641734.1995.10505022.
Ducoffe, R.H. (1996), “Advertising value and advertising on the web”, Journal of Advertising Research,Vol. 36 No. 5, pp. 21-32, available at: https://slidelegend.com/advertising-value-and-advertising-on-the-web-blog-management_5a85ffde1723dd53ce733391.html.
Eriksson, N., Rosenbr€oijer, C.-J. and Fagerstrøm, A. (2018), “Smartphones as decision support in retailstores – the role of product category and gender”, Procedia Computer Science, Vol. 138,pp. 508-515, doi: 10.1016/j.procs.2018.10.070.
Fang, B., Liao, S., Xu, K., Cheng, H., Zhu, C. and Chen, H. (2012), “A novel mobile recommender systemfor indoor shopping”, Expert Systems with Applications, Vol. 39 No. 15, pp. 11992-12000, doi: 10.1016/j.eswa.2012.03.038.
Fern�andez-Garc�ıa, A.J., Iribarne, L., Corral, A., Criado, J. and Wang, J.Z. (2019), “A recommendersystem for component-based applications using machine learning techniques”, Knowledge-Based Systems, Vol. 164, pp. 68-84, doi: 10.1016/j.knosys.2018.10.019.
Fornell, C. and Larcker, D.F. (1981), “Evaluating structural equation models with unobservablevariables and measurement error”, Journal of Marketing Research, Vol. 18 No. 1, p. 39, doi: 10.2307/3151312.
Fu, Z., Xian, Y., Gao, R., Zhao, J., Huang, Q., Ge, Y., Xu, S., Geng, S., Shah, C., Zhang, Y. and de Melo, G.(2020), Fairness-Aware Explainable Recommendation over Knowledge Graphs, pp. 69-78, ArXiv.
Ganesh, J., Reynolds, K.E., Luckett, M. and Pomirleanu, N. (2010), “Online shopper motivations, ande-store attributes: an examination of online patronage behavior and shopper typologies”,Journal of Retailing, Vol. 86 No. 1, pp. 106-115, doi: 10.1016/j.jretai.2010.01.003.
Ge, M. and Helfert, M. (2014), “A design science oriented framework for experimental research ininformation quality”, pp. 145-154, doi: 10.1007/978-3-642-55355-4_15.
Gefen, D., Krahanna, E. and Straub, D.W. (2003), “Trust and TAM in online shopping: an integratedmodel”, MIS Quarterly, Vol. 27 No. 1, p. 51, doi: 10.2307/30036519.
Google (2022), “Design for android j android developers”, available at: https://developer.android.com/design.
Gregor, S. and Hevner, A.R. (2013), “Positioning and presenting design science research for maximumimpact”, MIS Quarterly, Vol. 37 No. 2, pp. 337-355.
Hair, J.F., Black, W.C., Babin, B.J. and Anderson, R.E. (2008), in Multivariate Data Analysis: GlobalEdition, 7th ed., Pearson Education, Upper Saddle River, available at: https://lib.ugent.be/catalog/rug01:001321386.
Hausman, A.V. and Siekpe, J.S. (2009), “The effect of web interface features on consumer online purchaseintentions”, Journal of Business Research, Vol. 62 No. 1, pp. 5-13, doi: 10.1016/j.jbusres.2008.01.018.
He, X., Chen, T., Kan, M.Y. and Chen, X. (2015), “TriRank: review-aware explainable recommendationby modeling aspects”, International Conference on Information and Knowledge Management,Proceedings, Vol. 19-23, pp. 1661-1670, Oct-2015, doi: 10.1145/2806416.2806504.
Hermes, A. and Riedl, R. (2021), “Influence of personality traits on choice of retail purchasing channel:literature review and research agenda”, Journal of Theoretical and Applied Electronic CommerceResearch, Vol. 16 No. 7, pp. 3299-3320, doi: 10.3390/jtaer16070179.
Enhancingbrick-and-
mortar shoppingexperience

Hermes, A., Sindermann, C., Montag, C. and Riedl, R. (2022), “Exploring online and in-store purchasewillingness: associations with the big five personality traits, trust, and need for touch”,Frontiers in Psychology. doi: 10.3389/fpsyg.2022.808500 (in press).
Hevner, A.R., Esearch, S.Y.R., March, S.T., Park, J. and Ram, S. (2004), “Design science in informationsystems research”, MIS Quarterly, Vol. 28 No. 1, pp. 75-105.
Hilken, T., de Ruyter, K., Chylinski, M., Mahr, D. and Keeling, D.I. (2017), “Augmenting the eye of thebeholder: exploring the strategic potential of augmented reality to enhance online serviceexperiences”, Journal of the Academy of Marketing Science, Vol. 45 No. 6, pp. 884-905, doi: 10.1007/s11747-017-0541-x.
Hiranandani, G., Ayush, K., Varsha, C., Sinha, A., Maneriker, P. and Maram, S.V.R. (2017), “[POSTER]enhanced personalized targeting using augmented reality”, 2017 IEEE International Symposiumon Mixed and Augmented Reality (ISMAR-Adjunct), Vol. 69–74, doi: 10.1109/ISMAR-Adjunct.2017.34.
Hoffman, R.R., Mueller, S.T., Klein, G. and Litman, J. (2018), “Metrics for explainable AI: challengesand prospects”, available at: http://arxiv.org/abs/1812.04608.
Huang, E. (2008), “Use and gratification in e-consumers”, Internet Research, Vol. 18 No. 4, pp. 405-426,doi: 10.1108/10662240810897817.
Huang, T.-L. and Liao, S.-L. (2017), “Creating e-shopping multisensory flow experience throughaugmented-reality interactive technology”, Internet Research, Vol. 27 No. 2, pp. 449-475, doi: 10.1108/IntR-11-2015-0321.
Huang, J. and Zhou, L. (2018), “Timing of web personalization in mobile shopping: a perspective fromUses and Gratifications Theory”, Computers in Human Behavior, Vol. 88, pp. 103-113, doi: 10.1016/j.chb.2018.06.035.
Huang, X., Fang, Q., Qian, S., Sang, J., Li, Y. and Xu, C. (2019), “Explainable interaction-driven usermodeling over knowledge graph for sequential recommendation”, MM 2019 - Proceedings ofthe 27th ACM International Conference on Multimedia, pp. 548-556, doi: 10.1145/3343031.3350893.
IBM.com (2020), “IBM SPSS Statistics 26”, available at: https://www.ibm.com/support/pages/downloading-ibm-spss-statistics-26.
ICSC (2018), “Sales growth of department stores in Western Europe from 2012 to 2017, by country”,available at: https://www.statista.com/statistics/911107/department-store-sales-growth-western-europe/.
Javornik, A. (2016), “It’s an illusion, but it looks real!’ Consumer affective, cognitive and behaviouralresponses to augmented reality applications”, Journal of Marketing Management, Vol. 32Nos 9–10, pp. 987-1011, doi: 10.1080/0267257X.2016.1174726.
Joerß, T., Hoffmann, S., Mai, R. and Akbar, P. (2021), “Digitalization as solution to environmentalproblems? When users rely on augmented reality-recommendation agents”, Journal of BusinessResearch, Vol. 128, pp. 510-523, doi: 10.1016/j.jbusres.2021.02.019.
Juaneda-Ayensa, E., Mosquera, A. and Murillo, Y.S. (2016), “Omnichannel customer behavior: keydrivers of technology acceptance and use and their effects on purchase intention”, Frontiers inPsychology, Vol. 7, pp. 1-11, doi: 10.3389/fpsyg.2016.01117.
K€ahler, W.-M. (2004), Statistische Datenanalyse, ViewegþTeubner Verlag, Wiesbaden, doi: 10.1007/978-3-663-11498-7.
Katz, E., Blumler, J.G. and Gurevitch, M. (1973), “Uses and gratifications research”, Public OpinionQuarterly, Vol. 37 No. 4, p. 509, doi: 10.1086/268109.
Kim, Y. and Peterson, R.A. (2017), “A meta-analysis of online trust relationships in E-commerce”,Journal of Interactive Marketing, Vol. 38, pp. 44-54, doi: 10.1016/j.intmar.2017.01.001.
King, W.R. and He, J. (2006), “A meta-analysis of the technology acceptance model”, Information andManagement, Vol. 43 No. 6, pp. 740-755, doi: 10.1016/j.im.2006.05.003.
JRIM

Konting, M.M., Kamaruddin, N. and Man, N.A. (2009), “Quality assurance in higher educationinstitutions: exist survey among Universiti Putra Malaysia graduating students”, InternationalEducation Studies, Vol. 2 No. 1, doi: 10.5539/ies.v2n1p25.
Lavoye, V., Mero, J. and Tarkiainen, A. (2021), “Consumer behavior with augmented reality in retail: areview and research agenda”, The International Review of Retail, Distribution and ConsumerResearch, Vol. 31 No. 3, pp. 299-329, doi: 10.1080/09593969.2021.1901765.
Lee, Y., Kozar, K.A. and Larsen, K.R.T. (2003), “The technology acceptance model: past, present, andfuture”, Communications of the Association for Information Systems, Vol. 12, doi: 10.17705/1cais.01250.
Lee, H., Jung, T.H., tom Dieck, M.C. and Chung, N. (2020), “Experiencing immersive virtual reality inmuseums”, Information and Management, Vol. 57 No. 5, p. 103229, doi: 10.1016/j.im.2019.103229.
Lemon, K.N. and Verhoef, P.C. (2016), “Understanding customer experience throughout thecustomer journey”, Journal of Marketing, Vol. 80 No. 6, pp. 69-96, available at: https://citavistorageredirector.azurewebsites.net/containerRedirect/14d7500d-73db-499d-bc8e-cf69d65ce21d?projectKey5gjyc1syvgnq5g62mey5wp4d8tyozfd4o80i62x7hsw&containerName5gjyc1syvgnq5g62mey5wp4d8tyozfd4o80i62x7hsw&permissions59&expiry52020-08-21T23:57:2.
L€ochtefeld, M., B€ohmer, M., Daiber, F. and Gehring, S. (2013), “Augmented reality-based advertisingstrategies for paper leaflets”, Proceedings of the 2013 ACM Conference on Pervasive andUbiquitous Computing Adjunct Publication, pp. 1015-1022, doi: 10.1145/2494091.2496010.
Loeb, W. (2020), “More than 13,800 stores are closing in 2020 so far—a number that will surely rise”,Forbes, available at: https://www.forbes.com/sites/walterloeb/2020/07/06/9274-stores-are-closing-in-2020–its-the-pandemic-and-high-debt–more-will-close/.
Luo, X. (2002), “Uses and gratifications theory and E-consumer behaviors”, Journal of InteractiveAdvertising, Vol. 2 No. 2, pp. 34-41, doi: 10.1080/15252019.2002.10722060.
M�arquez, �A.J.O. and Ziegler, J. (2020), “Store augmented reality-enabled product comparison andrecommendation”, Fourteenth ACM Conference on Recommender Systems, pp. 180-189, doi: 10.1145/3383313.3412266.
MacKenzie, I., Meyer, C. and Noble, S. (2013), How Retailers Can Keep up with Consumers, McKinsey &Company, available at: https://files.mtstatic.com/site_3770/472/0?Expires51649004406&Signature5uhuaW7PscwRq1LCBhrP7AZT210mKdtI7kt∼CAKWP5Y00-PQvHsLO901NOkcIRkw4TwGAkBF2dPXwxoyZ∼z0Aa7f8V5FBFV3vEwx9PQ-RN0zb0xVb4Q7ZZcmlqaihZfMhnN4mlQfTdbohSMbj2K6∼zO2QVwAz1lgQ4hIZ6E4vYes_&Key-Pair-Id5APKAJ5Y6AV4GI7A555NA.
March, S.T. and Smith, G.F. (1995), “Design and natural science research on information technology”,Decision Support Systems, Vol. 15, pp. 251-266.
McLean, G. and Osei-Frimpong, K. (2019), “Hey Alexa . . . examine the variables influencing the use ofartificial intelligent in-home voice assistants”, Computers in Human Behavior, Vol. 99, pp. 28-37,doi: 10.1016/j.chb.2019.05.009.
Mora, D., Jain, S., Nalbach, O. and Werth, D. (2020a), “Holographic recommendations in brick-and-mortar stores”, 26th Americas Conference on Information Systems, AMCIS2020, pp. 1-10.
Mora, D., Zimmermann, R., Cirqueira, D., Bezbradica, M., Helfert, M., Auinger, A. and Werth, D.(2020b), “Who wants to use an augmented reality shopping assistant application?”, Proceedingsof the 4th International Conference on Computer-Human Interaction Research and Applications -WUDESHI-DR, doi: 10.5220/0010214503090318.
Mueller, S.T., Hoffman, R.R., Clancey, W., Emrey, A. and Klein Macrocognition, G. (2019),Explanation in Human-AI Systems: A Literature Meta-Review Synopsis of Key Ideas andPublications and Bibliography for Explainable AI, ArXiv Preprint ArXiv:1902.01876,February 2019.
Enhancingbrick-and-
mortar shoppingexperience

Nicola, M., Alsafi, Z., Sohrabi, C., Kerwan, A., Al-Jabir, A., Iosifidis, C., Agha, M. and Agha, R.(2020), “The socio-economic implications of the coronavirus pandemic (COVID-19): areview”, International Journal of Surgery, Elsevier, Vol. 78, pp. 185-193, doi: 10.1016/j.ijsu.2020.04.018.
Omar, J., M�arquez, �A. and Ziegler, J. (2018), “Augmented reality based recommending in the physicalworld”, Mensch und Computer 2018-Workshopband, September 2018, doi: 10.18420/muc2018-ws07-0461.
Pantano, E., Rese, A. and Baier, D. (2017), “Enhancing the online decision-making process by usingaugmented reality: a two country comparison of youth markets”, Journal of Retailing andConsumer Services, Vol. 38, pp. 81-95, doi: 10.1016/j.jretconser.2017.05.011.
Parise, S., Guinan, P.J. and Kafka, R. (2016), “Solving the Crisis of Immediacy: how digital technologycan transform the customer experience”, Business Horizons, Vol. 59 No. 4, pp. 411-420, doi: 10.1016/j.bushor.2016.03.004.
Pelletier, M.J., Krallman, A., Adams, F.G. and Hancock, T. (2020), “One size doesn’t fit all: a uses andgratifications analysis of social media platforms”, Journal of Research in Interactive Marketing,Vol. 14 No. 2, pp. 269-284, doi: 10.1108/JRIM-10-2019-0159.
Perform-Network.eu (2022), “PERFORM consortium”, available at: https://www.perform-network.eu/consortium/.
Pimenidis, E., Polatidis, N. and Mouratidis, H. (2018), “Mobile recommender systems: identifyingthe major concepts”, Journal of Information Science, Vol. 45 No. 3, doi: 10.1177/0165551518792213.
Piotrowicz, W. and Cuthbertson, R. (2014), “Introduction to the special issue information technology inretail: toward omnichannel retailing”, International Journal of Electronic Commerce, Vol. 18No. 4, pp. 5-16, doi: 10.2753/jec1086-4415180400.
Poushneh, A. and Vasquez-Parraga, A.Z. (2017), “Discernible impact of augmented reality on retailcustomer’s experience, satisfaction and willingness to buy”, Journal of Retailing and ConsumerServices, Vol. 34, pp. 229-234, doi: 10.1016/j.jretconser.2016.10.005.
Prat, N., Comyn-Wattiau, I. and Akoka, J. (2014), “Artifact evaluation in information systems design-science research-a holistic view”, Proceedings PACIS, Vol. 23.
Qin, Y.S. (2020), “Fostering brand–consumer interactions in social media: the role of social media usesand gratifications”, Journal of Research in Interactive Marketing, Vol. 14 No. 3, pp. 337-354,doi: 10.1108/JRIM-08-2019-0138.
Rigby, D.K. (2011), “The future of shopping”, Harvard Business Review, Vol. 89 No. 12, pp. 64-75,available at: https://hbr.org/2011/12/the-future-of-shopping.
Sindermann, C., Riedl, R. and Montag, C. (2020), “Investigating the relationship betweenpersonality and technology acceptance with a focus on the smartphone from a genderperspective: results of an exploratory survey study”, Future Internet, Vol. 12 No. 7, p. 110,doi: 10.3390/fi12070110.
Sokol, K. and Flach, P. (2020), “Explainability fact sheets”, Proceedings of the 2020 Conference onFairness, Accountability, and Transparency, pp. 56-67, doi: 10.1145/3351095.3372870.
Song, J.H. and Zinkhan, G.M. (2003), “Features of web site design, perceptions of web site quality, andpatronage behavior”, ACME 2003 Proceedings, Vol. 106–114, available at: http://www.acme-fbd.org/Proceedings/ACME_2003_Proceedings.pdf#page5114.
Statista (2018), “eCommerce - worldwide 2020 j Statista market forecast”, available at: https://www.statista.com/outlook/243/100/ecommerce/worldwide?currency5eur.
Statistisches Bundesamt (2020), “Share of internet users going online for the following activities inGermany in 2020”, Statista, available at: https://www.statista.com/statistics/1188488/internet-activities-germany/.
SurveyGizmo.com (2020), Enterprise Online Survey Software and Tools - SurveyGizmo.
JRIM
Tanmay, K. and Ayush, K. (2019), “Augmented reality based recommendations based on perceptualshape style compatibility with objects in the viewpoint and color compatibility with thebackground”, 2019 IEEE/CVF International Conference on Computer Vision Workshop(ICCVW), pp. 3361-3367, doi: 10.1109/ICCVW.2019.00418.
Tavakoli, H. (2013), A Dictionary of Research Methodology and Statistics in Applied Linguistics, Rahnam�a,Tehran, available at: https://books.google.at/books?hl5de&lr5&id5-UcbDQAAQBAJ&oi5fnd&pg5PP1&dq5Aþdictionaryþofþresearchþmethodologyþandþstatisticsþinþappliedþlinguistics&ots52dIcwiyklz&sig5jzU9mMrFN_-_YJGJEfNgcEb30tI&redir_esc5y#v5onepage&q5A%20dictionary%20of%20research%20methodology%20and%20statistics%20in%20applied%20linguistics&f5false.
Venkatesh, V. and Morris, M.G. (2000), “Why don’t men ever stop to ask for directions? Gender, socialinfluence, and their role in technology acceptance and usage behavior”, MIS Quarterly, Vol. 24No. 1, p. 115, doi: 10.2307/3250981.
Verhoef, P.C., Kannan, P.K. and Inman, J.J. (2015), “From multi-channel retailing to omni-channelretailing. Introduction to the special issue on multi-channel retailing”, Journal of Retailing,Vol. 91 No. 2, pp. 174-181, doi: 10.1016/j.jretai.2015.02.005.
Vom Brocke, J., Simons, A., Niehaves, B., Niehaves, B., Reimer, K., Brocke, J., Vom, Simons, A.,Niehaves, B., Niehaves, B., Reimer, K., Plattfaut, R. and Cleven, A. (2009), “Reconstructing thegiant: on the importance of rigour in documenting the literature search PROCESS”, ECIS 2009Proceedings, Vol. 161, available at: https://aisel.aisnet.org/ecis2009/161.
von Briel, F. (2018), “The future of omnichannel retail: a four-stage Delphi study”, TechnologicalForecasting and Social Change, Vol. 132, pp. 217-229, doi: 10.1016/j.techfore.2018.02.004.
Wang, C.L. (2021), “New frontiers and future directions in interactive marketing: inaugural Editorial”,Journal of Research in Interactive Marketing, Vol. 15 No. 1, pp. 1-9, doi: 10.1108/JRIM-03-2021-270.
Wang, W. and Benbasat, I. (2008), “Attributions of trust in decision support technologies: a study ofrecommendation agents for e-commerce”, Journal of Management Information Systems, Vol. 24No. 4, pp. 249-273, doi: 10.2753/MIS0742-1222240410.
Wang, N., Wang, H., Jia, Y. and Yin, Y. (2018), “Explainable recommendation via multi-task learning inopinionated text data”, 41st International ACM SIGIR Conference on Research and Developmentin Information Retrieval, SIGIR 2018, doi: 10.1145/3209978.3210010, pp. 165-174.
Wolf, R. (2018), “Here’s which brick-and-mortar retailers are getting hit the hardest”, available at:https://www.businessinsider.com/brick-and-mortar-retailers-getting-hit-the-hardest-2018-5?IR5T.
Yim, M.Y.C. and Park, S.Y. (2019), “I am not satisfied with my body, so I like augmented reality (AR)”,Journal of Business Research, Vol. 100, pp. 581-589, doi: 10.1016/j.jbusres.2018.10.041.
Yim, M.Y.C., Chu, S.C. and Sauer, P.L. (2017), “Is augmented reality technology an effective tool forE-commerce? An interactivity and vividness perspective”, Journal of Interactive Marketing,Vol. 39, pp. 89-103, doi: 10.1016/j.intmar.2017.04.001.
Zhang, Y. and Chen, X. (2020), “Explainable recommendation: a survey and new perspectives”, inFoundations and Trends in Information Retrieval, Now Publishers, Vol. 14 No. 1, pp. 1-101,doi: 10.1561/1500000066.
Zimmermann, R. and Auinger, A. (2020), “Identifying brand-owned touchpoints along the digital retailcustomer journey – a practical approach”, in Gronau, N., Heine, M., Poustcchi, K. and Krasnova, H.(Eds), WI2020 Community Tracks, GITO Verlag, pp. 291-305, TS-CrossRef, doi: 10.30844/wi_2020_y2-zimmermann.
Zimmermann, R., Auinger, A. and Riedl, R. (2019), “Smartphones as an opportunity to increase sales inbrick-and-mortar stores: identifying sales influencers based on a literature review”, in LectureNotes in Computer Science (Including Subseries Lecture Notes in Artificial Intelligence andLecture Notes in Bioinformatics), pp. 82-98, 11588 LNCS, doi: 10.1007/978-3-030-22335-9_6.
Enhancingbrick-and-
mortar shoppingexperience

Supplementary MaterialsThe supplementary file is available online for this article.
Author AffiliationsRobert Zimmermann, Digital Business Institut, University of Applied Sciences Upper Austria, Steyr,Austria
Daniel Mora, Artificial Intelligence Lab, AWS-Institute for Digitized Products and Processes,Saarbr€ucken, Germany
Douglas Cirqueira, School of Computing, Dublin City University, Dublin, Ireland; School of Business,Lero – the Science Foundation Ireland Research Centre for Software, Dublin, Ireland
Markus Helfert, School of Business, Lero – the Science Foundation Ireland Research Centre for Software,Dublin, Ireland and Innovation Value Institute, Maynooth University, Maynooth, Ireland
Marija Bezbradica, School of Computing, Dublin City University, Dublin, Ireland and School of Business,Lero – the Science Foundation Ireland Research Centre for Software, Dublin, Ireland
Dirk Werth, Artificial Intelligence Lab, AWS-Institute for Digitized Products and Processes,Saarbr€ucken, Germany
Wolfgang Jonas Weitzl, Digital Business Institut, University of Applied Sciences Upper Austria, Steyr,Austria
Ren�e Riedl, Institute of Business Informatics – Information Engineering, Johannes Kepler UniversityLinz, Linz, Austria
Andreas Auinger, Digital Business Institut, University of Applied Sciences Upper Austria, Steyr,Austria
Corresponding authorRobert Zimmermann can be contacted at: [email protected]
For instructions on how to order reprints of this article, please visit our website:www.emeraldgrouppublishing.com/licensing/reprints.htmOr contact us for further details: [email protected]
JRIM
Related Documents