Applied Catalysis A: General 477 (2014) 159–171 Contents lists available at ScienceDirect Applied Catalysis A: General jou rn al hom ep age: www.elsevier.com/locate/apcata Enhanced pyrolysis and oxidation of asphaltenes adsorbed onto transition metal oxides nanoparticles towards advanced in-situ combustion EOR processes by nanotechnology Negahdar Hosseinpour a,b , Yadollah Mortazavi a , Alireza Bahramian b , Leila Khodatars a , Abbas Ali Khodadadi a,∗ a Catalysis and Nanostructured Materials Research Lab, School of Chemical Engineering, College of Engineering, University of Tehran, P.O. Box: 11155/4563, Tehran, Iran b Institute of Petroleum Engineering, College of Engineering, University of Tehran, P.O. Box: 11155/4563, Tehran, Iran a r t i c l e i n f o Article history: Received 14 December 2013 Received in revised form 25 February 2014 Accepted 12 March 2014 Available online 20 March 2014 Keywords: Asphaltenes Oxidation Metal oxide nanoparticles In-situ upgrading Reservoir oil a b s t r a c t The effects of redox activity of transition metal oxides nanoparticles on the kinetics of pyrolysis and oxi- dation of asphaltenes adsorbed onto the metal oxides surfaces were studied. Co 3 O 4 , NiO, CuO, Mn 2 O 3 , Fe 2 O 3 , and WO 3 nanoparticles were synthesized and characterized by BET, XRD, FESEM, HRTEM, H 2 -TPR, and O 2 -TPD techniques. Asphaltenes were extracted from a heavy oil sample and adsorbed onto the metal oxides and fumed silica. The asphaltenes adsorption capacity (in mg/m 2 ) of the nanoparticles decreases in the order of NiO > Fe 2 O 3 > WO 3 > Mn 2 O 3 > CuO > Co 3 O 4 > silica. The off gases of temperature programmed pyrolysis and oxidation (TPP and TPO, respectively) of the adsorbed asphaltenes were analyzed by an on-line FTIR equipped with a gas cell. TPP of the adsorbed asphaltenes on NiO with the highest adsorp- tion capacity indicates that the coke formation increases by 11%, as compared to virgin asphaltenes, improving in-situ combustion process. TPO profiles of the asphaltenes, either virgin or adsorbed onto the surfaces, exhibit a low- and a high-temperature peak. The spreading role of the silica surface lowers the TPO low-temperature peak by about 100 ◦ C, compared to that of the virgin asphaltenes. While catalytic oxidation of the asphaltenes by the metal oxides shifts both low- and high-temperature TPO peaks by about 100–150 ◦ C to lower temperatures. Furthermore, kinetics of carbon oxides evolution during TPO of the asphaltenes was formulated by power-law grain model. The calculated activation energy for the asphaltenes oxidation over the nanoparticles increases in the order of Co 3 O 4 < NiO < CuO ≈ Mn 2 O 3 < Fe 2 O 3 <WO 3 . The higher the redox activity of the metal oxides, the lower is the activation energy. © 2014 Elsevier B.V. All rights reserved. 1. Introduction Large quantities of heavy oil reserves exist in the world but their production and recovery are often accompanied by severe diffi- culties. Heavy oils are categorized by their high viscosities (higher than 100 mPa s) and low API gravities (lower than 20 ◦ API) [1]. The high viscosity of heavy oils arises primarily from intermolecular interactions of especially large molecules such as asphaltenes, the heaviest and most polar components of heavy oils [2]. Owing to their high viscosities, the effective recovery of heavy oils by the conventional techniques suitable for light crude oils exploitation is not possible. Both primary production (pressure depletion) and sec- ondary techniques (water flooding) together recover around 40% ∗ Corresponding author. Tel./fax: +98 21 66967793. E-mail address: [email protected] (A.A. Khodadadi). of the original-oil-in-place of a petroleum reservoir [3]. In order to recover heavy oils especially from partially-depleted reservoirs, tertiary enhanced oil recovery (EOR) techniques were developed. Highly efficient heat utilization and displacement drive mecha- nism of heavy oils are the characteristics of in-situ combustion as a tertiary EOR process [4]. Successful in-situ combustion pro- cesses could recover almost up to 85% of the original-oil-in-place of a heavy oil-bearing reservoir and result in an upgrading of 5–7 API points for the reservoir oils [5]. In-situ combustion/fire flooding within a reservoir is induced by injection of air/enriched air and burning of a small portion of the reservoir oil in order to drive and thus recover the unburned fraction [6]. Exothermic oxidation reactions between hydrocarbons and oxygen result in a great increase in the temperature of heavy oils which leads to a significant decrease in the viscosity of the oils and thereby a considerable decline in the fluids flow resis- tances within the reservoirs [4–7]. The combustion front is very http://dx.doi.org/10.1016/j.apcata.2014.03.017 0926-860X/© 2014 Elsevier B.V. All rights reserved.

Welcome message from author
This document is posted to help you gain knowledge. Please leave a comment to let me know what you think about it! Share it to your friends and learn new things together.
Transcript

Etc
NAa
Tb
a
ARRAA
KAOMIR
1
pcthihtcno
h0
Applied Catalysis A: General 477 (2014) 159–171
Contents lists available at ScienceDirect
Applied Catalysis A: General
jou rn al hom ep age: www.elsev ier .com/ locate /apcata
nhanced pyrolysis and oxidation of asphaltenes adsorbed ontoransition metal oxides nanoparticles towards advanced in-situombustion EOR processes by nanotechnology
egahdar Hosseinpoura,b, Yadollah Mortazavia, Alireza Bahramianb, Leila Khodatarsa,bbas Ali Khodadadia,∗
Catalysis and Nanostructured Materials Research Lab, School of Chemical Engineering, College of Engineering, University of Tehran, P.O. Box: 11155/4563,ehran, IranInstitute of Petroleum Engineering, College of Engineering, University of Tehran, P.O. Box: 11155/4563, Tehran, Iran
r t i c l e i n f o
rticle history:eceived 14 December 2013eceived in revised form 25 February 2014ccepted 12 March 2014vailable online 20 March 2014
eywords:sphaltenesxidationetal oxide nanoparticles
n-situ upgradingeservoir oil
a b s t r a c t
The effects of redox activity of transition metal oxides nanoparticles on the kinetics of pyrolysis and oxi-dation of asphaltenes adsorbed onto the metal oxides surfaces were studied. Co3O4, NiO, CuO, Mn2O3,Fe2O3, and WO3 nanoparticles were synthesized and characterized by BET, XRD, FESEM, HRTEM, H2-TPR,and O2-TPD techniques. Asphaltenes were extracted from a heavy oil sample and adsorbed onto the metaloxides and fumed silica. The asphaltenes adsorption capacity (in mg/m2) of the nanoparticles decreases inthe order of NiO > Fe2O3 > WO3 > Mn2O3 > CuO > Co3O4 > silica. The off gases of temperature programmedpyrolysis and oxidation (TPP and TPO, respectively) of the adsorbed asphaltenes were analyzed by anon-line FTIR equipped with a gas cell. TPP of the adsorbed asphaltenes on NiO with the highest adsorp-tion capacity indicates that the coke formation increases by 11%, as compared to virgin asphaltenes,improving in-situ combustion process. TPO profiles of the asphaltenes, either virgin or adsorbed onto thesurfaces, exhibit a low- and a high-temperature peak. The spreading role of the silica surface lowers theTPO low-temperature peak by about 100 ◦C, compared to that of the virgin asphaltenes. While catalytic
oxidation of the asphaltenes by the metal oxides shifts both low- and high-temperature TPO peaks byabout 100–150 ◦C to lower temperatures. Furthermore, kinetics of carbon oxides evolution during TPOof the asphaltenes was formulated by power-law grain model. The calculated activation energy for theasphaltenes oxidation over the nanoparticles increases in the order of Co3O4 < NiO < CuO ≈ Mn2O3 < Fe2O3<WO3. The higher the redox activity of the metal oxides, the lower is the activation energy.
. Introduction
Large quantities of heavy oil reserves exist in the world but theirroduction and recovery are often accompanied by severe diffi-ulties. Heavy oils are categorized by their high viscosities (higherhan 100 mPa s) and low API gravities (lower than 20◦ API) [1]. Theigh viscosity of heavy oils arises primarily from intermolecular
nteractions of especially large molecules such as asphaltenes, theeaviest and most polar components of heavy oils [2]. Owing toheir high viscosities, the effective recovery of heavy oils by the
onventional techniques suitable for light crude oils exploitation isot possible. Both primary production (pressure depletion) and sec-ndary techniques (water flooding) together recover around 40%∗ Corresponding author. Tel./fax: +98 21 66967793.E-mail address: [email protected] (A.A. Khodadadi).
ttp://dx.doi.org/10.1016/j.apcata.2014.03.017926-860X/© 2014 Elsevier B.V. All rights reserved.
© 2014 Elsevier B.V. All rights reserved.
of the original-oil-in-place of a petroleum reservoir [3]. In orderto recover heavy oils especially from partially-depleted reservoirs,tertiary enhanced oil recovery (EOR) techniques were developed.Highly efficient heat utilization and displacement drive mecha-nism of heavy oils are the characteristics of in-situ combustionas a tertiary EOR process [4]. Successful in-situ combustion pro-cesses could recover almost up to 85% of the original-oil-in-placeof a heavy oil-bearing reservoir and result in an upgrading of 5–7API points for the reservoir oils [5].
In-situ combustion/fire flooding within a reservoir is inducedby injection of air/enriched air and burning of a small portion ofthe reservoir oil in order to drive and thus recover the unburnedfraction [6]. Exothermic oxidation reactions between hydrocarbons
and oxygen result in a great increase in the temperature of heavyoils which leads to a significant decrease in the viscosity of theoils and thereby a considerable decline in the fluids flow resis-tances within the reservoirs [4–7]. The combustion front is very
1 talysis
ttrltzwcigVfapcctotocds
cpiritaaavpbtrmioepzetatsobo
ouoomoogcaaaT
60 N. Hosseinpour et al. / Applied Ca
hin, no more than several inches, within which oxygen reacts withhe solid carbonaceous residues (coke) deposited on the reservoirock giving rise to temperatures of up to 700 ◦C [4]. The coke-ike residue is designated as the fuel for in-situ combustion and ishe product of hydrocarbons pyrolysis in the cracking/vaporizationone formed just downstream of the combustion front in a for-ard in-situ combustion [7]. Under the effect of heat, in the
racking/vaporization zone, pyrolysis reactions including crack-ng, dehydrogenation, and condensation lead to evolution of lightases and formation of the fuel [4,5]. According to the report byerkoczy [8], asphaltenes have a significant contribution to the fuel
ormation during in-situ combustion process. When heated in thebsence of oxygen, asphaltenes aggregates swell up and decom-ose leading to the formation of the coke-like deposits. A stableombustion front is one of the characteristics of a successful in-situombustion process. The stability of the combustion front is con-rolled strongly by the reactivity of the deposited fuel and the ratef fuel deposition in the cracking/vaporization zone downstream ofhe combustion front [5,7]. In order to optimize the deposition ratef the coke-like residues and conduct a stable high-temperatureombustion front, adsorptive removal followed by enhanced oxi-ation of asphaltenes by nanomaterials seems to be a feasibleolution.
The development of an advanced in-situ combustion EOR pro-ess by nanotechnology is of significant importance since it hasotential applications to efficient production and in-situ upgrad-
ng of the oil trapped within the whole spectrum of heavy oileservoirs. The size of asphaltenes aggregates in the reservoir oilss within 5–20 nm depending on the composition of the oils andhe reservoir conditions [9]. Nanomaterials are found to offer anppropriate activity and selectivity towards adsorption and cat-lytic conversion of the asphaltenes nanoaggregates [10–14]. Inddition, nanoparticles are much smaller than pore spaces of reser-oir rocks; thus they are found to be effectively transportable inorous media [15]. Upon adsorption of asphaltenes, nanoparticlesecome more stably suspended in reservoir oils and are expectedo readily flow within the reservoirs. More recently, the adsorptiveemoval of asphaltenes from heavy oil model solutions by acid/baseetal oxides nanoparticles was reported to be feasible [10]. Utiliz-
ng their lattice oxygen, transition metal oxides are supposed toxidize/gasify a considerable portion of the adsorbed asphaltenesven in the absence of gas-phase oxygen and at relatively low tem-eratures, similar to the conditions of the cracking/vaporizationone formed in a successful in-situ combustion process. In addition,nhanced oxidation of the pyrolyzed asphaltenes on the surface ofhe metal oxides is expected in the presence of gas-phase oxygennd at high temperatures, typical of the combustion front condi-ions. Therefore, the metal oxides nanoparticles, with high oxygentorage capacities, are expected to involve in oxidation/gasificationf adsorbed asphaltenes in the cracking/vaporization zone and thene re-oxidized in the combustion front and accelerate the completexidation of the coke-like residues.
Asphaltenes adsorption and gasification/oxidation over metalxides nanoparticles were reported to be effective for in-situpgrading of reservoir oils [11,12]. The activity of transition metalxides for asphaltenes adsorption/oxidation decreases in the orderf NiO > Co3O4 > Fe3O4 [13]. Nassar et al. investigated the isother-al oxidation of asphaltenes adsorbed onto commercial metal
xides and observed diminished activation energies and enhancedxidation rates over the nanoparticles compared to those for vir-in asphaltenes [14]. There is not a general consensus about theatalytic effects of metal oxides nanoparticles on the oxidation of
dsorbed asphaltenes [16,17]. Several reports attributed the lowerctivation energy for oxidation of adsorbed asphaltenes to the cat-lytic role played by the metal oxides [11–14,16]. However, Abuarboush and Husein ascribed the oxidation features of adsorbedA: General 477 (2014) 159–171
asphaltenes to the spreading role played by the nanoparticles sur-faces, providing enhanced exposure of the adsorbed asphaltenesto gas-phase oxygen [17]. Thermogravimetry, without analysis ofreleased gases, is the widely-used technique by the researchersin the field of asphaltenes oxidation, making the differentiationbetween the catalytic effects and surface roles of metal oxidesalmost unfeasible.
In this work, temperature-programmed oxidation (TPO) cou-pled with Fourier transform infrared spectroscopy analysis ofreleased gases is employed for the first time to study the oxida-tion kinetics of asphaltenes adsorbed onto transition metal oxidesnanoparticles. Asphaltenes are extracted and their thermal oxida-tion is studied. The asphaltenes are then adsorbed onto the surfacesof transition metal oxides (with redox activity) and fumed silica(with no redox activity) and oxidation of the adsorbed asphaltenesis investigated. Furthermore, the asphaltenes, either virgin oradsorbed, are pyrolyzed in Ar and then their post-pyrolysis oxi-dation features are studied. Finally, carbon oxides evolution duringoxidation of the asphaltenes is formulated.
2. Experimental
2.1. Synthesis and characterization of metal oxides nanoparticles
Six different types of transition metal oxides comprising Co3O4,NiO, CuO, Mn2O3, Fe2O3, and WO3 were synthesized by a sim-ple precipitation method. Aqueous solutions containing 0.05 M ofCo(NO3)2·6H2O, Ni(NO3)2·6H2O, Cu(NO3)2·3H2O, Mn(NO3)2·4H2O,Fe(NO3)3·9H2O, or Na2WO4·2H2O (all high purity salts from Merck)were prepared. Each metal cation was titrated under vigorousmixing by dropwise addition of stoichiometric quantities of 5.0 Mammonia solution (Merck) for 40 min. For precipitation of (WO4)2−
anion, 5.0 M nitric acid solution (Merck) was employed and the syn-thesis reaction proceeded with the molar ratio of (WO4)2−/H+ = 1/2.The precipitation syntheses were conducted at 60 ◦C with continu-ous stirring at 400 rpm for 12 h in a sealed beaker. The syntheses pHwas fixed at 10 except for WO3 which was synthesized at pH = 1;therefore, during the syntheses, extra amounts of the ammonia ornitric acid solution were added whenever the pH was required tobe adjusted. After complete precipitation, the solutions were left tocool down, and then centrifuged at 5000 rpm for 10 min. The pre-cipitates were washed with plenty of DI water and centrifuged toachieve neutral pH. Finally, the samples were washed with ethanol(Merck), dried at 80 ◦C overnight, and then calcined at 500 ◦C in airfor 4 h.
The crystalline structure of the nanoparticles was determinedwith x-ray powder diffraction (XRD) by a X’Pert Philips Diffrac-tometer using Cu K�1 (� = 1.54056 A) radiation in the 2� range of5–80◦ and at a scanning rate of 1.5◦ (2�)/min. The recorded XRDpatterns were compared with JCPDS reference data for phase iden-tification. Field emission scanning electron microscopy (FESEM)was done by a Hitachi S-4160 instrument to investigate the particlesize and morphology of the nanoparticles. High resolution trans-mission electron microscopy (HRTEM) imaging was performedby JEOL JEM-2100 microscope. Brunauer–Emmett–Teller (BET)surface area measurement, hydrogen temperature-programmedreduction (H2-TPR) and oxygen temperature-programmed desorp-tion (O2-TPD) tests were carried out using a QuantachromeCHEMBET-3000 apparatus equipped with a TCD detector. BET sur-face areas were measured at the liquid nitrogen temperature by N2adsorption, using the single point method. Prior to the BET mea-
surements, the nanoparticles were evacuated at 400 ◦C for 3 h under20 sccm N2 flow. H2-TPR experiments were performed on 25 mg ofthe metal oxides in 10 sccm of 7.0% H2 in Ar. Prior to reduction,all the metal oxides were treated at 500 ◦C for 3 h in 10 sccm air
talysis
flhFati2ftu
2
htwarccfiawot
lsio8o
an[
2
2tst[stsaqm3upnIDtoafOr
N. Hosseinpour et al. / Applied Ca
ow and allowed to cool. The samples were then flushed with pureelium for 30 min to ensure the absence of physisorbed oxygen.inally, temperature was increased from 50 up to 1000 ◦C with
heating rate of 10 ◦C/min. The consumption of H2 was quan-itatively measured by time integration of the TPR profiles. Thentensity of the TCD signal was calibrated by the H2-TPR profile of0 mg Ag2O. Following the same pre-treatment conditions adoptedor the H2-TPR tests, O2-TPD experiments were done on 150 mg ofhe nanoparticles at a heating rate of 10 ◦C/min from 50 to 1000 ◦Cnder 10 sccm flow of He.
.2. Asphaltenes extraction and characterization
Asphaltenes were extracted by precipitation in an excess of n-eptane from a dead sample of an Iranian heavy oil field accordingo the modified ASTM 2007-03 standard [18]. The heavy oil sample,ith the API gravity of 18.3◦, was mixed with n-heptane (Merck)
t the ratio of 1/40 g/mL and left mixing at 650 rpm for 24 h atoom temperature. After decanting the supernatant, the black pre-ipitate was washed with fresh n-heptane at a 1/4 g/mL ratio andentrifuged at 5000 rpm for 30 min. The resultant precipitate wasltered through a 2.5 �m filter paper (Whatman No. 42, England)nd washed with fresh n-heptane until shiny black asphaltenesere obtained. The resultant asphaltenes were dried at 60 ◦C in an
ven for 24 h, powdered and stored in a desiccator. The asphalteneshus obtained are designated as virgin asphaltenes.
Elemental composition of the asphaltenes was determined fol-owing the ASTM D5291 (for C, H, and N) and UOP 864 (for S)tandards. Oxygen content of the asphaltenes was measured bynfrared detection of CO2, CO, COS and SO2 generated by pyrolysisf the asphaltenes up to 1150 ◦C in a quartz tube microreactor under0 sccm Ar feed. Prior to be fed, the Ar flow was passed through anxygen trap.
The molecular structure and functional groups of thesphaltenes were determined by FTIR spectroscopy and XRD tech-ique following the procedure described in our previous report10].
.3. Adsorption of the asphaltenes onto the nanoparticles
The solid asphaltenes were dissolved in toluene to prepare000 mg/L of the asphaltenes–toluene as the heavy oil model solu-ion for batch adsorption experiments. At this concentration, theize of asphaltenes aggregates in toluene is reported to be smallerhan 15 nm, typical of asphaltenes aggregates sizes in reservoir oils19]. The nanoparticles were added to 5 mL of the heavy oil modelolution in tightly sealed vials. The weight ratio of the nanopar-icles to the initial asphaltenes contained within the 2000 mg/Lolution was adjusted at 10 g/g. The samples were shaken at 25 ◦Cnd 200 rpm in an incubator (NB-205 N-Biotek, Korea) for 24 h ade-uate to achieve equilibrium, i.e. the adsorption stops, over all theetal oxides. The mixtures were then centrifuged at 5000 rpm for
0 min followed by UV–vis spectroscopy of the supernatant liq-ids and temperature-programmed oxidation (TPO) analysis of therecipitated solids. The asphaltenes concentration in the super-atant liquids was analyzed by a T90+ UV–vis spectrometer (PG
nstruments, Ltd., England) and toluene was used as the blank.etailed description of the usual procedure for the UV–vis spec-
roscopy analysis of the supernatant liquids has been presented inur previous report [10]. For comparison, the asphaltenes were also
dsorbed onto fumed silica following the same procedure describedor the adsorption onto the metal oxides. The fumed silica (CAB--SIL M-5) was purchased from CABOT Corporation and used aseceived.
A: General 477 (2014) 159–171 161
2.4. Asphaltenes oxidation and pyrolysis
Oxidation of the asphaltenes, either virgin or adsorbed ontothe surfaces of fumed silica and the transition metal oxides,was studied by temperature-programmed oxidation (TPO) tech-nique. In addition, the virgin and adsorbed asphaltenes weresubjected to temperature-programmed pyrolysis (TPP) and TPO ofthe post-pyrolysis asphaltenes was also investigated. The TPP of theasphaltenes and subsequent TPO of the resulting coke are similar tothe cracking/vaporization zone and combustion front of successfulin-situ combustion processes, respectively. TPO of the asphaltenes(non-pyrolyzed) may represent a marginal condition for the com-bustion front especially at the start-up when no pyrolysis is stillunderway.
2.4.1. Temperature-programmed oxidation (TPO) of theasphaltenes
The nanoparticles containing adsorbed asphaltenes were driedat 60 ◦C in an oven for 24 h to remove any remaining toluene. Thesolid samples were then subjected to TPO analysis to estimatethe adsorbed amounts of the asphaltenes and evaluate the activ-ity of the metal oxides for oxidation of the adsorbed asphaltenes.The samples were heated from room temperature up to 700 ◦Cat a ramp rate of 10 ◦C/min in a quartz tube microreactor under80 sccm of air (20.5 vol% O2/N2) and the reactor effluents wereanalyzed instantaneously by an online Fourier transform infrared(FTIR) instrument. FTIR measurements were performed by a BrukerVector22 spectrometer equipped with a gas cell with KBr win-dows. The FTIR was used in transmission mode with a resolutionof 5 cm−1 in the range of 4000–400 cm−1. For comparison, thevirgin asphaltenes were also subjected to TPO analysis followingthe same procedure described above. CO2, CO, COS, SO2, hydro-carbons, and water were the only species detected in the TPOeffluent gases. No evolution of hydrocarbons was observed in theTPO of the asphaltenes adsorbed onto the transition metal oxidessurfaces. An example of the spectrum collected by the FTIR instru-ment during analysis of the effluent gases in TPO of the virginasphaltenes is illustrated in Fig. S1, Supplementary data. COS showsan intense absorption band centered at 2061 cm−1 which overlapsthe absorption peak at 2143 cm−1 assigned to CO. Following decon-volution of the overlapped absorption bands, peak areas in therange of 2235–2030 and 2136–2022 cm−1 were used to measureCO and COS evolutions, respectively. The 3141–2808, 2393–2280,and 1183–1100 cm−1 absorption peak areas were also employedfor measuring the evolution of hydrocarbons, CO2, and SO2, respec-tively. Carbon balance was used to determine the total amount ofhydrocarbons released.
2.4.2. Temperature-programmed pyrolysis (TPP) of theasphaltenes
The TPP tests were conducted in a quartz tube microreac-tor under 80 sccm Ar flow to investigate the level of formationof coke-like residues (fuel) and the possibility of thermal crack-ing/oxidation of the asphaltenes during pyrolysis. The asphaltenes,either virgin or adsorbed onto the metal oxides surfaces, weresubjected to heat treatment under the Ar flow at 10 ◦C/min upto 500 ◦C, at which the samples continued pyrolysis for almost1 h and the effluent gases were analyzed instantaneously bythe FTIR instrument. TPO analysis of the pyrolyzed samples was
carried out following the same procedure described in Section2.4.1.The experimental procedure followed in this study is summa-rized in Fig. S2, Supplementary data.

162 N. Hosseinpour et al. / Applied Catalysis
Fig. 1. X-ray diffraction patterns of the synthesized metal oxides nanoparticles cal-c
3
3
ncapNphc7TmdTWb
iostticdS
5+ 4+
ined at 500 ◦C for 4 h.
. Results and discussion
.1. Characterization of the nanoparticles
The XRD patterns of the as synthesized transition metal oxidesanoparticles, calcined at 500 ◦C for 4 h, are given in Fig. 1. Therystalline structures of the metal oxides are well-developedfter the calcination treatment as the highly resolved diffractioneaks are observed in their diffractograms. The synthesized Co3O4,iO, CuO, Mn2O3, Fe2O3, and WO3 samples exhibit diffractioneaks corresponding to cubic Co3O4 (JCPDS 09-0418), rhombo-edral NiO (JCPDS 22-1189), monoclinic CuO (JCPDS 80-1916),ubic Mn2O3 (JCPDS 02-0896), rhombohedral �-Fe2O3 (JCPDS2-0469), and orthorhombic WO3 (JCPDS 71-0131), respectively.he average crystallite size (dXRD) of the metal oxides, deter-ined by applying the Scherrer’s equation on the most intense
iffraction peaks in the XRD patterns, is reported in Table 1.he crystallites of the samples become smaller in the order ofO3 > Co3O4 > Mn2O3 > NiO > Fe2O3 > CuO, concomitant with the
roadness of the diffraction peaks in the XRD patterns.The BET specific surface area of the nanoparticles is listed
n Table 1. The samples have the surface areas in the rangef 3.2–26.4 m2/g. Metal oxides nanoparticles are essentially con-idered nonporous since their pore volume is extremely low,hus the external surface of the particles contributes mostly toheir BET specific surface area [20]. Assuming nonporous spher-
cal loose particles, average particle size of the metal oxidesould be estimated from surface area measurement using equationBET = 6000/(SBET × �), where dBET is the average particle size (nm),BET is BET surface area (m2/g) and � is skeletal density (g/cm3). AsA: General 477 (2014) 159–171
reported in Table 1, the average particle size of the nanoparticles(dBET) is calculated to be within the range of 44–297 nm. Signifi-cant differences between dBET and dXRD for the nanoparticles mayindicate the presence of certain degrees of polycrystallinity in thestructure of the metal oxides [21].
H2-TPR and O2-TPD are the conventional techniques employedto investigate the redox properties of transition metal oxides. TheH2-TPR profiles of the synthesized metal oxides are presented inFig. 2a and H2 uptakes of the catalysts are summarized in Table 1.The CuO, NiO, and Co3O4 samples exhibit the highest degrees ofreduction up to 600 ◦C as the ending oxidation temperature of thevirgin asphaltenes (explained further down). As listed in Table 1,except for CuO and NiO, the total amount of hydrogen consumed isslightly higher than the stoichiometric values for complete reduc-tion of metal cations to the lowest possible oxidation states inthe TPR tests. This may be attributed to the amount of hydrogenadsorbed by the reduced metal centers formed on the surface of themetal oxides crystallites when the reduction is extending deeplyinto the bulk of the crystallites. The H2-TPR profile of Co3O4 exhibitsa slight reduction peak at around 200 ◦C and two main hydro-gen consumptions at 385 and 440 ◦C. The low-temperature peak isprobably due to the reduction of surface oxygen species. The secondreduction peak at 385 ◦C may be ascribed mostly to the reduction ofCo3+ to Co2+; while the significant H2 uptake at 440 ◦C arises fromthe reduction of Co2+ to Co0 [22]. However, it is generally acceptedthat, during the reduction of metal oxides, the most outer layers oftheir crystallites are firstly reduced (surface reduction) and then thereduction is deeply extended into the inner layers of the crystallites(bulk reduction) [23]. Therefore, the reduction peaks may be a com-plex interpretation of the reduction of the metal cations and somehydrogen adsorbed by the partially reduced oxides formed duringthe reduction process. For the NiO sample, a single intense hydro-gen consumption peak at 452 ◦C is observed; this reduction featureis attributed to the reduction of NiO to metallic Ni [24]. Similar tothat observed in the profile of Co3O4, the slight H2 uptake at around250 ◦C in the H2-TPR profile of NiO may be ascribed to the reduc-tion of surface oxygen species [22]. The reduction of CuO showsa broad and relatively low-temperature peak centered at 355 ◦C,ascribed to the reduction of Cu2+ to Cu0 [25]. The TPR spectrum ofMn2O3 exhibits a significant H2 consumption at 370 ◦C, an intenseH2 uptake at 468 ◦C, and a trivial high-temperature reduction peakat 930 ◦C.
The reduction of Mn2O3 is reported to follow the order ofMn2O3 → Mn3O4 → MnO and, due to thermodynamic limitations,the reduction of MnO to metallic Mn may be possible only at tem-peratures above 800 ◦C [24]. Therefore, the first H2 uptake at 370 ◦Cis due to the reduction of Mn2O3 to Mn3O4, the second peak at468 ◦C is ascribed to the reduction of Mn3O4 to MnO, and theinsignificant hydrogen consumption at 930 ◦C may be associatedwith either bulk reduction of some large crystallites of the sam-ple or reduction of some surface Mn2+ to Mn0 [26]. A significantH2 uptake at 434 ◦C, a reduction shoulder at 660 ◦C and a consid-erably broad H2 consumption centered at 882 ◦C are observed inthe TPR profile of Fe2O3. The reduction feature characterizes tworeduction steps, i.e. Fe3+ → Fe2+ → Fe0, and is consistent with the lit-erature data [27]. The lower-temperature peak may be attributedto the reduction of ferric oxide to magnetite (Fe3O4) and the broadhigher-temperature H2 uptake is due to the subsequent reductionof magnetite ultimately to metallic iron [27,28]. The pronouncedH2 uptakes of WO3 are located at 456, 765, 887, and extendsbeyond 950 ◦C. According to the literature reports [29], the com-plex reduction feature is associated with the stepwise reduction
in tungsten oxides species firstly forming W , then W and theultimate apparent oxidation number for the tungsten species isreported to be 2+. Considering the degree of reducibility and reduc-tion peak temperatures, the reducibility characteristics of the metal
N. Hosseinpour et al. / Applied Catalysis A: General 477 (2014) 159–171 163
F ◦C foi . Amo
oC
tmpigTOdlpaattCs�or
r
TT
ig. 2. (a) H2-TPR profiles of the metal oxides nanoparticles after calcination at 500n Ar. (b) O2-TPD profiles of the metal oxides nanoparticles calcined at 500 ◦C for 4 h
xides in hydrogen atmosphere become worsen in the order ofuO > Co3O4 > NiO > Mn2O3 > Fe2O3 > WO3.
Fig. 2b gives the O2-TPD profiles of the synthesized transi-ion metal oxides nanoparticles. The metal oxides exhibit different
obility of oxygen, as inferred from the shape of their O2-TPDrofiles and the temperatures of the profiles maxima. As reported
n the literature [30–35], �- and �-oxygen are two types of oxy-en usually observed in O2-TPD profiles of transition metal oxides.he �-oxygen is attributed to adsorbed oxygen bound mostly as−2 and/or O− to anion vacancies on the surface of metal oxides andesorbed below 400 ◦C [30,31]. The �-type oxygen species are those
iberated from the lattice systems of the bulk metal oxides at tem-eratures above 400 ◦C which replenish the surface lattice oxygent high temperatures [32,33]. The Co3O4 and NiO samples present
well-resolved �-oxygen peak centered at 210 and 290 ◦C, respec-ively. This is in-line with the low-temperature H2 uptakes ascribedo the reduction of surface oxygen species in the H2-TPR profiles ofo3O4 and NiO (see Fig. 2a). The O2-TPD profile of Mn2O3 shows amall overlapped peak in the �-oxygen region and a more intense-oxygen peak. The CuO, Fe2O3, and WO3 samples exhibit main �-
xygen peaks with no significant desorption peaks in the �-oxygenegion, in agreement with the reports in the literature [33–35].Numerical integration of the O2-TPD profiles shows that theatio of �-/�-oxygen for the metal oxides decreases in the order
able 1extural, structural, and reducibility features of the nanoparticles.
Transition metaloxide nanoparticles
BET specific surfacearea (m2/g)
Particle size, i.e.dBET, (nm)
Co3O4 14.0 70
NiO 23.5 45
CuO 3.2 297
Mn2O3 9.1 69
Fe2O3 26.4 44
WO3 6.1 137
a The degree of reduction up to 600 ◦C is presented in parentheses.
r 4 h. Amount of sample = 25 mg; heating rate = 10 ◦C/min under 10 sccm of 7.0% H2
unt of sample = 150 mg; heating rate = 10 ◦C/min under 10 sccm flow of He.
of Co3O4 > NiO > Mn2O3 > Fe2O3 > CuO > WO3, different from thereducibility order of the metal oxides (see Fig. 2a). The �-/�-oxygenratio is considered as a good representative of the oxygen mobil-ity of the metal oxides [32]. The participation of surface oxygenin oxidation reactions over metal oxides through the suprafacialmechanism is reported to be strongly dependent on the redox activ-ity of transition metal oxides [30]. Redox behavior of metal oxidesreflects a complex interplay between surface oxygen reactivity andreducibility of the metal cations. Facile electron transfer betweenoccupied orbitals in lattice oxygen and empty states in metal cen-ters leads to a high redox activity for a given metal oxide [36].Therefore, a combination of the reducibility and oxygen mobilitygives the order of redox capability of the metal oxides. Among thescreened samples, CuO exhibits the best reducibility but the mobil-ity of oxygen in the CuO structure is not as good as its reducibility.As a result, the redox capability of the metal oxides is proposed todiminish in the order of Co3O4 > NiO > Mn2O3 ≈ CuO > Fe2O3 > WO3.
3.2. Characterization of the asphaltenes
The elemental composition of the asphaltenes is 82.58, 7.93,1.00, 6.98, and 1.51 wt% for carbon, hydrogen, nitrogen, sulfur,and oxygen, respectively. Carbon and hydrogen are the main ele-ments of the asphaltenes structure. The value of hydrogen to carbon
Crystal size, i.e.dXRD, (nm)
H2 uptake (mol H2/mol nanoparticles) (±6%)
Peak temperature (PT) ≤ 600 ◦C Total
28 3.99 (97.3%)a 4.1024 0.91 (98.7%) 0.9219 1.00 (100%) 1.0028 0.80 (79.1%) 1.0223 0.53 (17.4%) 3.0332 0.15 (7.3%) 2.02

164 N. Hosseinpour et al. / Applied Catalysis
Fig. 3. (a) FTIR spectra of stearic acid and the solid asphaltenes. (b) X-ray diffractionpattern of the asphaltenes. Scanning speed: 1.0◦ (2�)/min. Inset: Gaussian decon-vS
(tayS
atorambio1aifotTc
osd
togram shifted to about 20 nm larger values.
olution of lower angle peaks (for details on the definition of La, Lc, dm, and M, seeection S4, Supplementary data).
H/C) molar ratio for the asphaltenes is 1.14, slightly higher thanhe H/C = 1 for a single benzene ring. The oxygen content of thesphaltenes was determined by temperature-programmed pyrol-sis (TPP) technique coupled with FTIR spectroscopy (see Fig. S3,upplementary data).
The molecular structure and functional groups of thesphaltenes in bulk solid-state were characterized by FTIR spec-roscopy and XRD technique, as illustrated in Fig. 3. For the sakef comparison, the FTIR spectrum of stearic acid (Merck) was alsoecorded. The asphaltenes spectrum (see Fig. 3a) exhibit a smallbsorption peak at 3048 cm−1 corresponding to C–H vibrationode in aromatic double bonds (=C–H) and two sharp absorption
ands at 2922 and 2852 cm−1 associated with C–H stretching moden CH3 and CH2 of aliphatic groups [37]. The stretching vibrationsf C=C aromatic bonds make a wide absorption peak centered at595 cm−1 [38]. The low-intensity absorption band at 1704 cm−1 isssigned to the stretching vibration of –C=O in carboxyl groups, ast gains a high intensity in the spectrum of stearic acid [39]. Exceptor the peaks arisen from aromatic rings and ether/ester groupsf the asphaltenes, the remaining peaks are identical in the spec-ra of the asphaltenes and stearic acid as a saturated fatty acid.his reveals the presence of aromatic rings, aliphatic chains andarboxylic functional groups in the structure of the asphaltenes.
Three broad diffraction peaks are observed in the diffractogram
f the asphaltenes, indicating the asphaltenes stacking forms atructure with a high degree of short-range order (see Fig. 3b). The �iffraction peak at 2� = 20.4◦ is related to the asphaltenes aliphaticA: General 477 (2014) 159–171
moieties while the polycyclic aromatic sheets of the asphaltenesproduce the (0 0 2) and (1 0) peaks at 2� = 25.5 and 44.1◦, respec-tively [40]. By applying the Warren’s and Bragg’s equations on the(1 0) diffraction peak, the average diameter of the asphaltenes poly-cyclic aromatic sheet is estimated to be 1.29 nm, in close agreementwith the size of ≈1 nm obtained by several techniques in the lit-erature [41]. Therefore, the presence of polycyclic aromatic sheetand peripheral substituents in the structure of the asphaltenesmolecules is confirmed by both FTIR and XRD techniques (for fur-ther details, see Section S4, Supplementary data).
3.3. Adsorption of the asphaltenes onto the nanoparticles
The amount of asphaltenes adsorbed onto the metal oxides sur-faces is listed in Table S2, Supplementary data. Fe2O3 shows thehighest and CuO the lowest adsorbed mass ratio (Q ′
e in mg/g) ofthe asphaltenes and the Q ′
e values over the metal oxides followthe order of Fe2O3 > NiO > Co3O4 > Mn2O3 > WO3 > CuO. In order toshed light on the level of involvement of the nanoparticles sur-face sites in the asphaltenes adsorption, the equilibrium adsorbedmass density (Qe) of the asphaltenes is defined as another param-eter to better interpret the adsorption data. Qe (in mg/m2) is theequilibrium adsorbed mass of the asphaltenes per unit surface areaof the adsorbents and is obtained when Q ′
e is divided by the BETspecific surface area of the metal oxides. The BET surface area is uti-lized as a good representative of the surface area of the adsorbentsaccessible to the asphaltenes, as reported in the literature [10–14].The value of Qe over the nanoparticles decreases in the orderof NiO > Fe2O3 > WO3 > Mn2O3 > CuO > Co3O4. All the asphaltenesadsorption experiments were repeated for at least three times andthe adsorption data is reliable within a maximum experimentaluncertainty of ±5%.
The average diameter of the polycyclic aromatic sheet andthe molecular mass of asphaltenes are reported to be 1 nm and750 g/mol, respectively [41]. Therefore, the adsorbed moleculardensity (Q ∗
e ) of the asphaltenes is calculated to be in the rangeof 1.9–2.8 molecules/nm2, fairly suggesting monolayer coverage ofthe surfaces with at least the asphaltenes dimers. Asphaltenes maybe adsorbed onto surfaces as colloidal aggregates, micelles, dimersand even monomers. The type and strength of the interactionsbetween asphaltenes and surface sites depend on the chemistryand charge of the solid surfaces as well as the functional groupsand charge of the asphaltenes, as reported in details in our previouswork [10].
As reported in Table S2, Supplementary data, NiO, Fe2O3, andWO3 exhibit the upper limits of the adsorbed mass densities of theasphaltenes. Therefore, FESEM imaging was employed to analyzethe morphology of the asphaltenes adsorbed onto the surfaces ofthese samples. The FESEM micrographs of the nanoparticles of NiOand WO3 before and after asphaltenes adsorption are illustrated inFig. S4, Supplementary data.
Fig. 4 presents the FESEM micrographs, particle size distributionhistograms, and HRTEM micrographs of the Fe2O3 nanoparticlesbefore and after adsorption of the asphaltenes. The surface of Fe2O3(Fig. 4a) is composed of almost distinct sphere-like nanoparti-cles with the sizes in the range of 30–80 nm, averaged at around50 nm close to the dBET for spherical Fe2O3 (see Table 1). Afterthe adsorption of the asphaltenes onto the Fe2O3 sample (Fig. 4b),the nanoparticles become even more distinct with more dis-cernible surface boundaries, on which 10–20 nm aggregates of theasphaltenes are observed. Adsorption of the asphaltenes onto theFe2O3 surface results in a broader particle size distribution his-
The structure and particle size of the Fe2O3 nanoparticles werefurther characterized by HRTEM. The lattice fringes of the crys-talline Fe2O3 with the lattice spacing of 0.27 nm is clearly observed

N. Hosseinpour et al. / Applied Catalysis A: General 477 (2014) 159–171 165
F m of (H
idpntHatdppnc
3
afpaptldat5i
ig. 4. FESEM micrograph and the corresponding particle size distribution histograRTEM micrographs of the samples are also inscribed.
n Fig. 4a, inset, indicating that the crystalline structure is well-eveloped. The calculated lattice spacing from the (1 0 4) diffractioneak at 2� = 32.9◦ in the XRD pattern of the synthesized Fe2O3anoparticles (see Fig. 1) is 0.26 nm, in close agreement withhe spacing observed in the HRTEM image of the sample. TheRTEM image of the Fe2O3 nanoparticles containing the adsorbedsphaltenes is inscribed in Fig. 4b. The particle sizes discerned inhe HRTEM image are in the range of 30–40 nm, in agreement withBET but significantly higher than the dXRD obtained from the XRDattern of Fe2O3 (see Table 1). This may indicate a high degree ofolycrystallinity in the structure of the Fe2O3 sample [21]. The 5–20m-sized phases observed on the particles in the inset of Fig. 4b mayorrespond to the adsorbed nanoaggregates of the asphaltenes.
.4. Oxidation of the asphaltenes
The evolution of gaseous products during TPO of thesphaltenes, either virgin or adsorbed onto the fumed silica sur-ace, is illustrated in Fig. 5a and b, respectively. The evolutionrofiles of all gaseous components released in TPO of the virginnd adsorbed asphaltenes exhibit a low- and a high-temperatureeak. The TPO profiles are similar to the TGA mass loss curve withwo well-defined peaks for virgin asphaltenes, as reported in theiterature [12,13]. The beginning (260 ◦C) and ending (600 ◦C) oxi-ation temperatures are identical in TPO profiles of the virgin and
dsorbed asphaltene. For the virgin asphaltenes, the low- and high-emperature TPO peaks are well-resolved and centered at 460 and20 ◦C, respectively. When adsorbed onto the surface of fumed sil-ca, asphaltenes TPO exhibits two overlapped peaks at 360 and
a) fresh Fe2O3 and (b) Fe2O3 nanoparticles after adsorption of the asphaltenes. The
500 ◦C. Upon adsorption, around 0.4 asphaltene molecules/nm2 arespread out over the silica surface. Therefore, spreading over thesurface of fumed silica lowers the first and second TPO peaks ofthe asphaltenes by about 100 and 20 ◦C. In addition, compared tothose of the virgin asphaltenes, higher amounts of carbon and sul-fur contents of the adsorbed asphaltenes over the silica surfaceundergo complete oxidation to form CO2 and SO2. These evidencesindicate that oxidation of the asphaltenes adsorbed onto the fumedsilica surface is relatively enhanced compared to that of the vir-gin asphaltenes. Since fumed silica has no redox activity, this levelof enhancement may be ascribed to the spreading role played bythe silica surface providing enhanced exposure of the asphaltenesto gas-phase oxygen, designated as surface effects in the litera-ture [17]. Based on XRD analysis, the stacked clusters of the virginasphaltenes are found to be composed of more than 9 asphaltenemolecules (see Section S4, Supplementary data). Therefore, com-pared to the adsorbed asphaltenes, a diminished accessibility togas-phase oxygen is anticipated for the asphaltene molecules inthe stacking structure of the virgin asphaltenes.
The first peak in TPO profiles of the virgin and adsorbedasphaltenes is proposed to be associated mostly with the oxida-tion/combustion of the asphaltenes aliphatic moieties; while thesecond peak is expected to arise from high-temperature oxidationof the condensed polynuclear aromatic sheets of the asphaltenes.Asphaltenes react with gas-phase oxygen through numerous reac-
tions depending on the oxidation temperature. At temperatureslower than 260 ◦C, low-temperature oxidation is dominant whereoxygen is chemisorbed on the exposed active sites (i.e. carbon andheteroatoms) of the asphaltenes. This leads mostly to the formation
166 N. Hosseinpour et al. / Applied Catalysis A: General 477 (2014) 159–171
F he virs
oeajsbc
ositTaaeltrlsmtafo
oapt
ataip
ig. 5. CO2, CO, hydrocarbons, COS, and SO2 evolution during TPO of (a) 10 mg of turface. Heating rate = 10 ◦C/min under 80 sccm of air flow.
f labile oxides in the asphaltenes structure and, to some extent,volution of carbon oxides, i.e. CO2 and CO [3,42]. The H/C ratio ofsphaltenes is found to be decreased as the asphaltenes are sub-ected to the low-temperature oxidation [42]. This suggests thatome aliphatic moieties of the asphaltenes are oxidized to form car-on oxides during low-temperature oxidation; thus the aliphaticontent of asphaltenes is more reactive than aromatic sheets.
At low temperatures, during TPO of the virgin asphaltenes,xygen is chemisorbed only on the surface active sites of thetacked clusters owing to diffusion limitations. As the temperaturencreases, bond scission becomes easy and the volatile content ofhe asphaltenes are driven off as light hydrocarbons (see Fig. 5).his results in further condensation of the stacked clusters; therebyn immediate enhanced exposure to gas-phase oxygen for theliphatic active sites in the bulk of the clusters is provided. Thenhanced exposure, together with the easiness of bond scission,eads to rapid evolution of oxidation products at the relatively highemperature of 460 ◦C, indicating the occurrence of combustioneactions during oxidation [13]. Therefore, the narrow and intenseower-temperature peak in TPO profiles of the virgin asphalteneseems to arise from rapid oxidation (combustion) of less-refractoryoieties in the asphaltenes structure. Owing to enhanced exposure
o gas-phase oxygen, no rapid oxidation occurs during TPO of thesphaltenes adsorbed onto the silica surface and a placid transferrom the oxidation of less-refractory moieties to aromatic sheets isbserved.
The CO2 and CO evolution in TPO of the asphaltenes adsorbednto the surfaces of the transition metal oxides is given in Fig. 6and b, respectively, and the results are summarized in Table S3, Sup-lementary data. The TPO profiles of the adsorbed asphaltenes overhe metal oxides exhibit two peaks, either distinct or overlapped.
The CO2 evolution profile during TPO of the adsorbedsphaltenes onto the Co3O4 surface exhibits a sharp low-
◦ ◦
emperature peak at 280 C and a minor peak at 370 C. For thesphaltenes adsorbed onto NiO, the CO2 evolution presents anntense low-temperature peak at 300 ◦C followed by a small broadeak centered at 400 ◦C. The significant CO2-release peak in TPOgin asphaltenes and (b) 12.3 mg of the asphaltenes adsorbed onto the fumed silica
of the adsorbed asphaltenes over CuO is located at 320 ◦C. A trivialshoulder peak at 310 ◦C and a significant peak at 330 ◦C are observedin CO2 evolution profile during TPO of the asphaltenes adsorbedonto Mn2O3. A broad CO2-release peak at 350 ◦C and a shoul-der at 400 ◦C are perceivable in TPO of the adsorbed asphaltenesover the Fe2O3 nanoparticles. The CO2 evolution profile in TPOof the asphaltenes adsorbed onto the WO3 surface exhibits asignificant low-temperature peak at 340 ◦C and a more intensehigh-temperature peak at 420 ◦C. In general, compared to oxida-tion of the virgin asphaltenes, catalytic oxidation of the asphaltenesadsorbed onto the transition metal oxides surfaces shifts bothlow- and high-temperature TPO peaks by about 100–150 ◦C tolower temperatures. However, the surface effects of the fumedsilica with no redox activity could not exhibit a significant shiftfor the high-temperature TPO peak of the adsorbed asphaltenes(see Fig. 5b). This confirms the idea that the metal oxides cat-alyze the oxidation of the adsorbed asphaltenes and the spreadingrole of the surfaces is not the only parameter controlling theasphaltenes oxidation, in agreement with the reports in the lit-erature [11–14,16]. Based on the TPO profiles of the adsorbedasphaltenes, it is concluded that the activity of the metal oxidesnanoparticles for oxidation of the asphaltenes decreases in theorder of Co3O4 > NiO > CuO ≈ Mn2O3 > Fe2O3 > WO3, similar to theredox activity order of the metal oxides inferred from the H2-TPRand O2-TPD tests (see Fig. 2). Therefore, the higher the redox capa-bility of the metal oxides, the greater is their activity for oxidationof the adsorbed asphaltenes. Nassar et al. reported that the activ-ity of commercial transition metal oxides for oxidation of adsorbedasphaltenes follows the order of NiO > Co3O4 > Fe3O4 [13]. The com-plete oxidation of benzene over transition metal oxides is enhancedas their redox properties are improved [43].
Unlike the TPO profile of the adsorbed asphaltenes over theother samples, a sharp low-temperature peak is observed in TPO
of the asphaltenes adsorbed onto the Co3O4 and NiO nanoparticles,indicating a rapid oxidation of the less-refractory moieties of theasphaltenes. The rapid evolution of the oxidation products may beaccommodated by the participation of the �-oxygen on the surface
N. Hosseinpour et al. / Applied Catalysis A: General 477 (2014) 159–171 167
F sitionu
obaoCimsiacl
althtagCetot(tbgoaeosdoia
3
piaw
ig. 6. CO2 and CO evolution during TPO of the asphaltenes adsorbed onto the trannder 80 sccm of air flow. (a) CO2 and (b) CO.
f the Co3O4 and NiO samples, the presence of which is confirmedy the O2-TPD tests (see Fig. 2b). Therefore, during oxidation of thedsorbed asphaltenes, it is proposed that oxygen from the metalxides surface reacts with the asphaltenes active sites to form labileO2 as carbonates on the surface. Decomposition of the carbonates
s then fueled by gas-phase oxygen which causes reoxidation of theetal oxides structure. Thus a redox cycle (change of the oxidation
tate of the metal cations with releasing/bonding of surface oxygen)s suggested to be taking place during oxidation of the adsorbedsphaltenes. The oxidation of carbonaceous residues through redoxycle over metal oxides solid solutions is well-documented in theiterature [44].
In addition to CO2 evolution, CO is also formed in TPO of thedsorbed asphaltenes, as depicted in Fig. 6b. The CO and CO2 evo-ution profiles over each metal oxide are similar in shape andheir peak temperatures. The rate of CO2 evolution, especially atigher temperatures, increases at the maximum-release tempera-ures of CO. It may indicate that a portion of the liberated CO isdsorbed and oxidized to CO2 by the metal oxides surface oxy-en. This is more obvious for oxidation of the asphaltenes overo3O4 and WO3 at higher temperatures where a low-rate of COvolution is observed although oxidation of the asphaltenes con-inues and produces mostly CO2. Furthermore, the total amountf CO released in TPO of the adsorbed asphaltenes increases withhe adsorbed molecular density of the asphaltenes on the surfacessee Tables S2 and S3, Supplementary data). It may be attributedo the occupation of the surface active sites of the metal oxidesy the adsorbed asphaltenes. At higher temperatures where oxy-en mobility of the metal oxides is increased and a large portionf the adsorbed asphaltenes is oxidized, the surface active sitesre more exposed to gas-phase CO; thereby oxidation of the lib-rated CO is enhanced. The oxidation of CO on transition metalxides is suggested to follow a so-called suprafacial mechanism,trongly dependent on the redox activity and CO-adsorption/CO2-esorption capability of the metal oxides [45]. The surface oxygenf the metal oxides oxidizes the adsorbed CO and the resulting CO2s desorbed from the catalyst when gaseous O2 is dissociativelydsorbed on the surface cations.
.5. Asphaltenes pyrolysis and post-pyrolysis oxidation
Visualization of the metal oxides effects on the asphaltenes
yrolysis and post-pyrolysis oxidation under the conditions of ann-situ combustion process is of primary importance. Accordingly, series of temperature-programmed pyrolysis (TPP) coupledith TPO tests were designed to best simulate the conditions of
metal oxides nanoparticles. Amount of sample = 150 mg; heating rate = 10 ◦C/min
cracking/vaporization zone and combustion front of a successfulforward in-situ combustion process with no oxygen breakthrough.The TPP tests were conducted to investigate the level of formationof coke-like residues (fuel) and the possibility of thermal crack-ing/oxidation of the asphaltenes during pyrolysis. The asphaltenes,either virgin or adsorbed onto NiO, were subjected to heat treat-ment under the Ar flow at 10 ◦C/min up to 500 ◦C, at which thesamples continued pyrolysis for almost 1 h. TPO analysis of thepyrolyzed samples was carried out to find the level of condensationof the asphaltenes and study the oxidation of the fuel formed. Fuelformation tendency is defined as the weight ratio of the coke-likeresidues formed per starting asphaltenes.
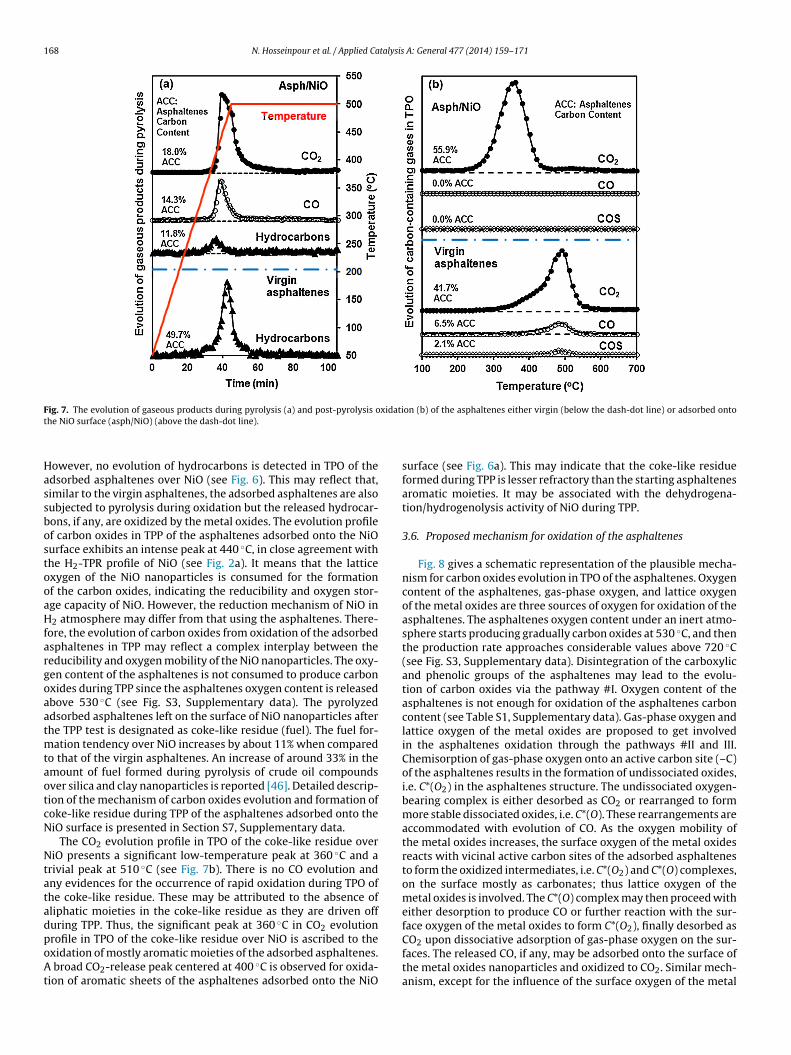
The evolution of hydrocarbons and carbon oxides in TPP ofthe asphaltenes, either virgin or adsorbed onto the NiO surface,and TPO profiles of the pyrolyzed asphaltenes are illustrated inFig. 7a and b, respectively. All the TPP and TPO profiles arepresented as a fraction of the carbon content of the startingasphaltenes. The evolution profile of hydrocarbons during theTPP (Fig. 7a) and TPO (Fig. 5a) of the virgin asphaltenes is simi-lar. In addition, TPO profiles of the pyrolyzed-virgin asphaltenes,depicted in Fig. 7b, exhibit only a high-temperature peak cen-tered at 500 ◦C. However, TPO profiles of the virgin asphaltenes,shown in Fig. 5a, present an intense low-temperature peak at460 ◦C followed by a significant high-temperature peak at 520 ◦C.The absence of the sharp low-temperature peak indicates thatthere is no rapid oxidation (combustion) in TPO of the pyrolyzed-virgin asphaltenes since the asphaltenes less-refractory moietiesare driven off as hydrocarbons during TPP, the profile of whichis given in Fig. 7a. Furthermore, the high-temperature peak inTPO of the virgin and pyrolyzed-virgin asphaltenes is centeredat almost the same temperature. This may arise from the samerefractoriness of the condensed polynuclear aromatic moieties ofthe asphaltenes and thus the aromatic sheets of the asphaltenesundergo similar level of condensation during TPP and TPO. As aresult, irrespective of the atmosphere of oxidation, pyrolysis is aprimary step in oxidation of the asphaltenes, during which theasphaltenes volatile content is released and the remaining con-densed aromatic sheets subsequently react with oxygen, similarto what reported in the literature [42]. In the presence of oxy-gen, the outer most layers of the condensed aromatic sheets areoxidized first and then inner layers start reacting with oxygen atrelatively higher temperatures, thus the extent of exposure to oxy-
gen is one of the parameters controlling the asphaltenes oxidation[17].A small release of hydrocarbons is observed in TPP of theasphaltenes adsorbed onto the NiO surface, as depicted in Fig. 7a.
168 N. Hosseinpour et al. / Applied Catalysis A: General 477 (2014) 159–171
F xidatit
HassbostooaHfargoaatmtaotcN
NtatadpoAt
ig. 7. The evolution of gaseous products during pyrolysis (a) and post-pyrolysis ohe NiO surface (asph/NiO) (above the dash-dot line).
owever, no evolution of hydrocarbons is detected in TPO of thedsorbed asphaltenes over NiO (see Fig. 6). This may reflect that,imilar to the virgin asphaltenes, the adsorbed asphaltenes are alsoubjected to pyrolysis during oxidation but the released hydrocar-ons, if any, are oxidized by the metal oxides. The evolution profilef carbon oxides in TPP of the asphaltenes adsorbed onto the NiOurface exhibits an intense peak at 440 ◦C, in close agreement withhe H2-TPR profile of NiO (see Fig. 2a). It means that the latticexygen of the NiO nanoparticles is consumed for the formationf the carbon oxides, indicating the reducibility and oxygen stor-ge capacity of NiO. However, the reduction mechanism of NiO in2 atmosphere may differ from that using the asphaltenes. There-
ore, the evolution of carbon oxides from oxidation of the adsorbedsphaltenes in TPP may reflect a complex interplay between theeducibility and oxygen mobility of the NiO nanoparticles. The oxy-en content of the asphaltenes is not consumed to produce carbonxides during TPP since the asphaltenes oxygen content is releasedbove 530 ◦C (see Fig. S3, Supplementary data). The pyrolyzeddsorbed asphaltenes left on the surface of NiO nanoparticles afterhe TPP test is designated as coke-like residue (fuel). The fuel for-
ation tendency over NiO increases by about 11% when comparedo that of the virgin asphaltenes. An increase of around 33% in themount of fuel formed during pyrolysis of crude oil compoundsver silica and clay nanoparticles is reported [46]. Detailed descrip-ion of the mechanism of carbon oxides evolution and formation ofoke-like residue during TPP of the asphaltenes adsorbed onto theiO surface is presented in Section S7, Supplementary data.
The CO2 evolution profile in TPO of the coke-like residue overiO presents a significant low-temperature peak at 360 ◦C and a
rivial peak at 510 ◦C (see Fig. 7b). There is no CO evolution andny evidences for the occurrence of rapid oxidation during TPO ofhe coke-like residue. These may be attributed to the absence ofliphatic moieties in the coke-like residue as they are driven offuring TPP. Thus, the significant peak at 360 ◦C in CO2 evolution
rofile in TPO of the coke-like residue over NiO is ascribed to thexidation of mostly aromatic moieties of the adsorbed asphaltenes.broad CO2-release peak centered at 400 ◦C is observed for oxida-ion of aromatic sheets of the asphaltenes adsorbed onto the NiO
on (b) of the asphaltenes either virgin (below the dash-dot line) or adsorbed onto
surface (see Fig. 6a). This may indicate that the coke-like residueformed during TPP is lesser refractory than the starting asphaltenesaromatic moieties. It may be associated with the dehydrogena-tion/hydrogenolysis activity of NiO during TPP.
3.6. Proposed mechanism for oxidation of the asphaltenes
Fig. 8 gives a schematic representation of the plausible mecha-nism for carbon oxides evolution in TPO of the asphaltenes. Oxygencontent of the asphaltenes, gas-phase oxygen, and lattice oxygenof the metal oxides are three sources of oxygen for oxidation of theasphaltenes. The asphaltenes oxygen content under an inert atmo-sphere starts producing gradually carbon oxides at 530 ◦C, and thenthe production rate approaches considerable values above 720 ◦C(see Fig. S3, Supplementary data). Disintegration of the carboxylicand phenolic groups of the asphaltenes may lead to the evolu-tion of carbon oxides via the pathway #I. Oxygen content of theasphaltenes is not enough for oxidation of the asphaltenes carboncontent (see Table S1, Supplementary data). Gas-phase oxygen andlattice oxygen of the metal oxides are proposed to get involvedin the asphaltenes oxidation through the pathways #II and III.Chemisorption of gas-phase oxygen onto an active carbon site (–C)of the asphaltenes results in the formation of undissociated oxides,i.e. C*(O2) in the asphaltenes structure. The undissociated oxygen-bearing complex is either desorbed as CO2 or rearranged to formmore stable dissociated oxides, i.e. C*(O). These rearrangements areaccommodated with evolution of CO. As the oxygen mobility ofthe metal oxides increases, the surface oxygen of the metal oxidesreacts with vicinal active carbon sites of the adsorbed asphaltenesto form the oxidized intermediates, i.e. C*(O2) and C*(O) complexes,on the surface mostly as carbonates; thus lattice oxygen of themetal oxides is involved. The C*(O) complex may then proceed witheither desorption to produce CO or further reaction with the sur-face oxygen of the metal oxides to form C*(O2), finally desorbed as
CO2 upon dissociative adsorption of gas-phase oxygen on the sur-faces. The released CO, if any, may be adsorbed onto the surface ofthe metal oxides nanoparticles and oxidized to CO2. Similar mech-anism, except for the influence of the surface oxygen of the metal
N. Hosseinpour et al. / Applied Catalysis A: General 477 (2014) 159–171 169
es ev
oMc
3
pi
−
wtsoaotvtaptrdXwiw
r
wepb
eoeote
of the metal oxides increases. This is confirmed by consideringthe values of the order of the oxidation reactions with respect tothe gas-phase oxygen, i.e. m, over the metal oxides, as listed inTable 2. The value of m almost decreases with an increase in the
Fig. 8. Proposed scheme for carbon oxid
xides and oxygen content of the asphaltenes, was proposed by Leinh et al. for combustion of carbonaceous residues on cracking
atalysts surfaces by gas-phase oxygen [47].
.7. Kinetics of carbon oxides evolution
The oxidation of the asphaltenes carbon content by the gas-hase oxygen in the TPO tests, through the pathway #II depicted
n Fig. 8, is modeled by:
r[C(t)] = −d[C(t)]dt
= ko exp(−Ea
RT
)[O2]mf ([C(t)]) (1)
here [O2] is the partial pressure of the gas-phase oxygen, [C(t)] ishe residual carbon at a certain time t on the surface, and f([C(t)]) is aurface function indicating the impacts of the available surface arean the oxidation process. Considering sphere-like nanoparticlesnd topochemically shrinkage of the particles as the asphaltenesxidation proceeds, the mass conversion and, in turn, shrinkage ofhe nanoparticles is expected to be proportional to the carbon con-ersion of the asphaltenes. It is assumed that mass conversion ofhe asphaltenes equals carbon conversion since carbon is the mostbundant atom in the asphaltenes structure (see Table S1, Sup-lementary data). The characteristic length of the nanoparticles ishus proportional to (1 - X(t))1/3, where X(t) is the conversion of theesidual carbon on the surface. Therefore, f([C(t)]) is proposed to beescribed by the power-law grain model, i.e. f([C(t)]) ≈ f([X(t)]) = (1-(t))n, in which, n is the parameter of the model and X(t) = 1 − [C(t)]
[Co]here [Co] is the initial concentration of carbon on the surface
n g-carbon/g-nanoparticles. For the virgin asphaltenes, [Co] is theeight fraction of carbon in the asphaltenes.
Substituting f([C(t)]), dXdt = 1
[Co]−d[C(t)]
dt , and dTdt = in Eq. (1) and
ecasting gives:
dX
dT= ko
ˇ[Co]exp
(−Ea
RT
)[O2]m(1 − X)n (2)
here, is the heating ramp rate in the TPO experiments. Larachit al. employed several surface sensitive models, including theower-law grain model, to study the kinetics of oxidation of the car-onaceous residues deposited on phenol oxidation catalysts [48].
Finally, Levenberg–Marquardt’s optimization algorithm wasmployed to solve the non-convex model and derive rigorousptimal values for the adjustable kinetic parameters, i.e. the pre-
xponential factor (ko), the activation energy (Ea), the order of thexidation reactions with respect to oxygen (m), and the parame-er of the model (n). Minimization of the residuals between thexperimental (Xi) and predicted (X�) values for the carbon oxidesolution in oxidation of the asphaltenes.
evolution, i.e. Eq. (3), was used as the objective function for theoptimization:
�2 = 1N
∑N
i=1(Xi − X�)
2(3)
where, N is the number of the measured data.The experimental data and the best fit of the power-law grain
model for conversion of the asphaltenes carbon content are illus-trated in Fig. 9 and the optimized kinetic parameters of the modelare summarized in Table 2. The model describes properly the evo-lution of carbon oxides in TPO of the asphaltenes either virgin oradsorbed onto the metal oxides and fumed silica surfaces. However,the success of the model in predicting the asphaltenes oxidationover the Co3O4 and NiO nanoparticles is relatively lower than thatobserved over the other samples. This may imply that the latticeoxygen of the Co3O4 and NiO samples becomes involved signifi-cantly in the oxidation of the adsorbed asphaltenes.
The model directly expresses the contribution of the gas-phaseoxygen in the asphaltenes oxidation; however, it could imply theparticipation of the lattice oxygen of the metal oxides. Therefore,it is expected that the degree of compatibility of the model predic-tions with the experimental values decreases as the redox activity
Fig. 9. Experimental and simulated conversion of the asphaltenes carbon contentinto carbon oxides during the TPO tests. The symbols are experimental data andsolid lines are the optimized forms of the power-law grain model.

170 N. Hosseinpour et al. / Applied Catalysis A: General 477 (2014) 159–171
Table 2Kinetic parameters for oxidation of the asphaltenes either virgin or adsorbed onto the nanoparticles.
Sample Asphaltenes content (mg) Ea (kJ/mol) ko m n
Co3O4 4.8 78.6 5.5 × 10⁵ 0.67 1.63NiO 11.3 81.0 7.8 × 10⁵ 0.84 2.00CuO 1.2 88.6 1.2 × 10⁶ 1.16 1.80Mn2O3 3.7 89.2 8.2 × 10⁵ 0.73 1.71Fe2O3 12.0 95.2 3.5 × 10⁶ 0.63 1.68
100 6
106109
rtaloTomtditaasocftTttcctm
otbeCasmoiHao
4
sFrdTousmi
[
[[[[
WO3 2.9
Fumed silica 12.3
Virgin asphaltenes 10.0
edox activity of the metal oxides, indicating a diminished par-icipation of the gas-phase oxygen in oxidation of the adsorbedsphaltenes. The parameter of the model, i.e. n in Table 2, corre-ates well with the molecular density of the asphaltenes adsorbednto the metal oxides surfaces (see Table S2, Supplementary data).his may reflect the impacts of the surface area of the nanoparticlesn the oxidation process, as reported in the literature [48]. The mosteaningful data obtained by the model is the activation energy of
he asphaltenes oxidation. The calculated activation energy for oxi-ation of the asphaltenes adsorbed onto the metal oxides increases
n the order of Co3O4 < NiO < CuO ≈ Mn2O3 < Fe2O3 < WO3, lowerhan that of the virgin asphaltenes oxidation. The higher the redoxctivity of the metal oxides, the lower is the activation energy. Inddition, compared to the oxidation of the virgin asphaltenes, thepreading role of the fumed silica surface enhances the oxidationf the adsorbed asphaltenes by lowering the activation energy. Thealculated molecular density of the asphaltenes adsorbed onto theumed silica surface (i.e. 0.4 molecules/nm2) is significantly lowerhan that on the metal oxides surfaces (1.9–2.8 molecules/nm2 (seeable S2, Supplementary data)). However, the activation energy forhe adsorbed asphaltenes oxidation over the fumed silica is higherhan that over the metal oxides. Therefore, it may lead to the con-lusion that the spreading role of the surfaces is not the only factorontrolling the oxidation of the adsorbed asphaltenes. As a result,he catalytic oxidation of the asphaltenes in the presence of the
etal oxides is confirmed [13,14,16].The dependency on the gas-phase oxygen for the asphaltenes
xidation over the fumed silica surface is higher than that for oxida-ion of the virgin asphaltenes (see values of m in Table 2). This maye ascribed to the spreading role of the silica surface which providesnhanced exposure of the asphaltenes to the gas-phase oxygen.ompared to the virgin asphaltenes, gas-phase oxygen is simplydsorbed on a higher number of the active sites of the asphaltenespread out over the fumed silica surface and the oxidized inter-ediates are mostly desorbed as CO2 (see Fig. 5). Therefore, the
xidation of the asphaltenes adsorbed onto the fumed silica surfaces strongly dependent on the availability of the gas-phase oxygen.owever, spreading role of the fumed silica surface, with no redoxctivity, can slightly lower the activation energy of the asphaltenesxidation.
. Conclusions
The kinetics of oxidation of asphaltenes adsorbed onto theurfaces of transition metal oxides, i.e. Co3O4, NiO, CuO, Mn2O3,e2O3, and WO3, with different redox activities were studied. Theedox capability of the metal oxides nanoparticles is found toiminish in the order Co3O4 > NiO > Mn2O3 ≈ CuO > Fe2O3 > WO3.he asphaltenes, extracted from a heavy oil sample, were adsorbednto the surfaces of the metal oxides and fumed silica. The molec-
lar density of the asphaltenes adsorbed onto the fumed silicaurface (0.4 molecules/nm2) is significantly lower than that on theetal oxides surfaces (1.9–2.8 molecules/nm2). However, a dimin-shed oxidation of the asphaltenes over the fumed silica surface
[[
[
.4 4.5 × 10 2.00 1.22
.0 6.7 × 10⁶ 1.11 1.80
.1 8.3 × 10⁶ 0.27 1.02
with lower asphaltene molecular density is observed when com-pared to that over the surfaces of the metal oxides. This reflectsthat the spreading role of the surfaces is not the only factor con-trolling the oxidation of the adsorbed asphaltenes and confirms thecatalytic oxidation of the asphaltenes in the presence of the metaloxides. In addition, formulation of the oxidation kinetics of theasphaltenes indicates that the higher the redox activity of the metaloxides, the lower is the activation energy, irrespective of the sur-face density of the adsorbed asphaltenes. Furthermore, asphaltenespyrolysis and post-pyrolysis oxidation of the resulting coke underthe conditions similar to in-situ combustion (ISC) processes wasstudied. It is found that NiO nanoparticles enhance both pyrolysisof the asphaltenes and complete oxidation of the resulting coke,thereby could improve the efficiency of ISC. Finally, the transitionmetal oxides nanoparticles have the potential to be employed asadditives to reservoir oils to enhance the stability and propaga-tion of in-situ combustion fronts leading to efficient productionand even in-situ upgrading of the oil trapped within the reservoirs.
Acknowledgements
Iran’s National Elites Foundation (INEF) is gratefully acknowl-edged for awarding the first author (N. Hosseinpour) a merit-basedfour-year scholarship during his PhD program. The first authorthanks Iran’s Nanotechnology Initiative Council (INTIC) for partiallyfunding of this research work.
Appendix A. Supplementary data
Supplementary data associated with this article can befound, in the online version, at http://dx.doi.org/10.1016/j.apcata.2014.03.017.
References
[1] J.G. Speight, Chemistry and Technology of Petroleum, Fourth ed., Marcel DekkerInc, New York, 2006.
[2] P. Luo, Y. Gu, Fuel 86 (2007) 1069–1078.[3] P. Murugan, N. Mahinpey, T. Mani, Fuel Process. Technol. 90 (2009) 1286–1291.[4] L.M. Castanier, W.E. Brigham, J. Petrol. Sci. Eng. 39 (2003) 125–136.[5] T.X. Xia, M. Greaves, A.T. Turta, C. Ayasse, Trans. IChemE 81 (2003) 295–304.[6] A. Turta, in: J. Sheng (Ed.), Enhanced Oil Recovery Field Case Studies, Gulf Pro-
fessional Publishing, San Francisco, 2013, pp. 447–541.[7] A.A. Mailybaev, J. Bruining, D. Marchesin, Combust. Flame 158 (2011)
1097–1108.[8] B. Verkoczy, J. Can. Petrol. Technol. 32 (1993) 25–33.[9] M.R. Gray, From Black to Gold: Nanotechnology in Upgrading of Heavy
Asphaltic Crude Oils, SPE Distinguished Lecturer Program, Alaska, Oct. 2010,USA.
10] N. Hosseinpour, A.A. Khodadadi, A. Bahramian, Y. Mortazavi, Langmuir 29(2013) 14135–14146.
11] N.N. Nassar, A. Hassan, P. Pereira-Almao, Energ. Fuels 25 (2011) 1566–1570.12] N.N. Nassar, A. Hassan, P. Pereira-Almao, Energ. Fuels 25 (2011) 1017–1023.13] N.N. Nassar, A. Hassan, P. Pereira-Almao, Colloid. Surf. A 384 (2011) 145–149.14] N.N. Nassar, A. Hassan, G. Luna, P. Pereira-Almao, Catal. Today 207 (2013)
127–132.15] A. Zamani, B. Maini, P. Pereira-Almao, Energ. Fuels 24 (2010) 4980–4988.16] N.N. Nassar, A. Hassan, G. Luna, P. Pereira-Almao, Appl. Catal. A 462–463 (2013)
116–120.17] B.J. Abu Tarboush, M.M. Husein, Appl. Catal. A 445–446 (2012) 166–171.

talysis
[[[[[[
[[[[[
[
[
[
[
[
[
[[[[
[[
[[
[[
[
N. Hosseinpour et al. / Applied Ca
18] P. Luo, X. Wang, Y. Gu, Fluid Phase Equilibr. 291 (2010) 103–110.19] J. Eyssautier, D. Frot, L. Barre, Langmuir 28 (2012) 11997–12004.20] J. Zhou, S. Yang, J. Yu, Colloid. Surf. A 379 (2011) 102–108.21] R.O. Fuentes, J.D. Woollins, R.T. Baker, J. Alloy. Compd. 495 (2010) 565–569.22] L. Xue, C. Zhang, H. He, Y. Teraoka, Appl. Catal. B 75 (2007) 167–174.23] H.H. Kung, Transition Metal Oxides: Surface Chemistry and Catalysis, First ed.,
Elsevier Science Publishers, Amsterdam, 1989.24] Y. Zhang, Z. Qin, G. Wang, et al., Appl. Catal. B 129 (2013) 172–181.25] M.-F. Luo, P. Fang, M. He, Y.-L. Xie, J. Mol. Catal. A 239 (2005) 243–248.26] A. Sultana, M. Sasaki, H. Hamada, Catal. Today 185 (2012) 284–289.27] A. Venugopal, M.S. Scurrell, Appl. Catal. A 258 (2004) 241–249.28] N.R.E. Radwan, E.A. El-Sharkawy, A.M. Youssef, Appl. Catal. A 281 (2005)
93–106.29] B. Solsona, J.M. Lopez Nieto, P. Concepcion, A. Dejoz, F. Ivars, M.I. Vazquez, J.
Catal. 280 (2011) 28–39.30] L.F. Liotta, M. Ousmane, G. Di Carlo, G. Pantaleo, et al., Appl. Catal. A 347 (2008)
81–88.
31] J.-H. Li, C.-C. Wang, C.-J. Huang, Y.-F. Sun, W.-Z. Weng, H.-L. Wan, Appl. Catal. A382 (2010) 99–105.32] J. Luo, H. Xu, Y. Liu, W. Chu, C. Jiang, X. Zhao, Appl. Catal. A 423–424 (2012)
121–129.33] M.R. Morales, B.P. Barbero, L.E. Cadus, Appl. Catal. B 67 (2006) 229–236.
[[[
A: General 477 (2014) 159–171 171
34] S. Wagloehner, D. Reichert, D. Leon-Sorzano, P. Balle, B. Geiger, S. Kureti, J. Catal.260 (2008) 305–314.
35] F.J.P. Schott, P. Balle, J. Adler, S. Kureti, Appl. Catal. B 87 (2009) 18–29.36] K. Chen, A.T. Bell, E. Iglesia, J. Catal. 209 (2002) 35–42.37] Y. Chen, Y. Wang, J. Lu, C. Wu, Fuel 88 (2009) 1426–1434.38] H. Parra-Barraza, D. Hernandez-Montiel, J. Lizardi, J. Hernandez, R.H. Urbina,
M.A. Valdez, Fuel 82 (2003) 869–874.39] Y. Wang, T.D. Xia, H. Zheng, H.X. Feng, Energ. Buildings 43 (2011) 2365–2370.40] Y. Bouhadda, D. Bormann, E. Sheu, D. Bendedouch, A. Krallafa, M. Daaou, Fuel
86 (2007) 1855–1864.41] O.C. Mullins, Energ. Fuels 24 (2010) 2179–2207.42] P. Murugan, T. Mani, N. Mahinpey, K. Asghari, Fuel Process. Technol. 92 (2011)
1056–1061.43] S. Zuo, F. Liu, J. Tong, C. Qi, Appl. Catal. A 467 (2013) 1–6.44] N. Hosseinpour, A.A. Khodadadi, Y. Mortazavi, A. Bazyari, Appl. Catal. A 353
(2009) 271–281.45] M. Jin, J.-N. Park, J.K. Shon, J.H. Kim, Z. Li, Y.-K. Park, J.M. Kim, Catal. Today 185
(2012) 183–190.46] M. Rezaei, M. Schaffie, M. Ranjbar, Fuel 113 (2013) 516–521.47] C. Le Minh, R.A. Jones, I.E. Craven, T.C. Brown, Energ. Fuels 11 (1997) 463–469.48] F. Larachi, K. Belkacemi, S. Hamoudi, A. Sayari, Catal. Today 64 (2001)
163–177.
Related Documents


![Td Adsorbed (Tetanus and Diphtheria Toxoids …products.sanofi.ca/en/td-adsorbed.pdfTd ADSORBED [Tetanus and Diphtheria Toxoids Adsorbed], is a sterile, cloudy, white, uniform suspension](https://static.cupdf.com/doc/110x72/5e5ed39d07f6e0285b51c50f/td-adsorbed-tetanus-and-diphtheria-toxoids-td-adsorbed-tetanus-and-diphtheria.jpg)