Wind Turbine Design Project San Jose State University Charles W. Davidson College of Engineering E10 Introduction to Engineering Cali Ferrari, Josh Crummy, Rex Doreza, Ryan Honrado, Tony Do, Milaud Nik-Ahd. E10 Section: 19, Team Number: 2 Instructor: Winston Wang October 22, 2014

Welcome message from author
This document is posted to help you gain knowledge. Please leave a comment to let me know what you think about it! Share it to your friends and learn new things together.
Transcript

Wind Turbine Design Project
San Jose State University
Charles W. Davidson College of Engineering
E10 Introduction to Engineering
Cali Ferrari, Josh Crummy, Rex Doreza,
Ryan Honrado, Tony Do, Milaud Nik-Ahd.
E10 Section: 19, Team Number: 2
Instructor: Winston Wang
October 22, 2014

i
Abstract:
Given the global strain on the planet’s natural resources, many nations are beginning to
invest more on the development, research, and exploitation of various types of alternative
energies. Specifically, this experiment was focused wind energy. Each group was construct a
unique model-size wind turbine, consisting of an original support structure and custom airfoil
design. Outside materials were permitted in the design of the support structure. The
completed wind turbine was then massed and tested for both stiffness and power generation.
The goal was to create the strongest, lightest and most powerful wind turbine possible.
Particularly, the group discussed in this lab report focused on the application of triangles
when creating the support structure and aerodynamics when designing the airfoil. This group
did use outside materials (yellow pine dowels) when constructing the tower. The turbine
weighed in at 280 grams. In the group’s testing results, an exceptional stiffness was observed
(0.11 mm deflection under a 4.5 Kg load!), whereas rather insufficient power was generated
(780 mW). These results imply that the material choice increased both the mass and stiffness
of the final wind turbine.
The group was able to conclude that the lack of power was due to the design of the
airfoil. By referencing some lab results from an experiment done by aerospace engineering
students UIUC, it is observed the airfoil the group designed was better fit for an aircraft than a
wind turbine, which resulted in the low power generation. Understanding this, the group
suggested that in the future it would be beneficial to be more careful when determining the lift-
to-drag ratio and to assure the optimal angle of attack is reached with respect to the structure
being created.

ii
Figure 1 - Completed wind turbine for this project (Doreza, 2014)
Table 1 (Ferrari, 2014)
Height 16 5/8 inch Mass 935 grams Max Output Power 780 mW Theoretical Power 4.2 W Stiffness 36.957 Kg/mm

iii
Table of Contents
Description: Page:
Abstract i
Table of Contents iii
1) Introduction 1
(1.1) Background on Wind Turbines Page 1
(1.2) The Project Page 2
(1.3) Specifications Page 2
2) Theory 3
(2.1) Definitions Page 3
(2.2) Equations Page 3
(2.3) Ideas Page 4
Strength of triangles and pyramids Page 4
Material Page 4
Airfoil and Optimum Angle of Attack Page 6
3) Design and Construction 7
(3.1) Tower Page 7
(3.2) Airfoil Page 9
4) Experimental Setup and Procedure 11
(4.1) Strength and Stiffness Page 11
(4.2) Peak Power Output and Max Efficiency Page 12
Activity 1 Page 12
Activity 2 Page 13

iv
5) Experimental Results 13
6) Conclusion and Recommendations 16
7) References 19
8) Appendices 20
Appendix A Page 20
Appendix B Page 21

- 1 -
Introduction:
1.1: Background on Wind Turbines
Over the past few decades, there has been an increased focus on the conservation of
Earth’s natural resources. This has motivated many industries to make transitions from
traditional methods of energy production to more environmentally friendly and renewable
sources of energy. Among these alternate methods is a structure that converts wind energy
into electrical energy, more commonly known as a wind turbine. A typical wind turbine is
shown in Figure 1, and its components are further detailed in Figure 2.
Figure 2 - Wind turbines in eastern Oregon Figure 3 - Basic wind turbine components
A typical wind turbine consists of a tower, an airfoil (turbine blade structure), and a
motor which the airfoil is connected to. The ideal wind turbine has an infinite number of very
thin blades and is extremely tall and light. As long as the blades don’t obstruct one another, a
larger number of thinner blades will result in a higher conversion rate of wind energy to usable
energy. Realistically, if a blade is too thin, it will break under the pressure of the wind.
Additional blades also equal additional weight which affects the performance of the wind
turbine in a negative way. There is a give and take connected to every choice made in the
design process, and these must be thoughtfully analyzed and balanced to produce the highest
possible power.

- 2 -
1.2: The Project
The intention of this project was to create the lightest, stiffest and most powerful wind
turbine possible with the resources given. This lab was aimed more towards education than
practicality, and for this reason the turbines created were on a model scale. The class was split
into groups of 5--6 people. Each group was then responsible for creating their own airfoil
design, designing and constructing an original support structure, massing their completed wind
turbine, and testing the turbine’s power and stiffness. Motors were provided and a 3-D printer
was used to materialize each group’s airfoil design. The group discussed in this report focused
on the usage of triangles in the turbine structure, and aerodynamics in the blade design. Figure
3 describes the general setup of the turbine structure. There were some specification
pertaining to the project that are described in the following section
Figure 4 - Diagram visualizing support structure specifications (Youseffi, 2014)
1.3: Specifications:
1) Upper and Lower support plates of the tower were provided.
2) Outside materials could be used to create the support structure.
3) The upper and lower support plate must be attached to the support structure by
reasonable means, but any other modifications to the upper and lower support
plate were prohibited.
4) The overall structure had to measure 17 inches high (give or take 1/16 of an
inch). The height constraint stems from the goal of placing the airfoil at the
location where the wind will hit it most effectively, allowing for optimum power
generation.

- 3 -
Theory:
2.1 Definitions:
1) Truss: “a set of straight members or elements pinned together at their ends, with forces
applied only at the joints” (Mets 2010).
2) Static object: An object at rest; an object with a net force of zero in all directions. In other
words, ∑Fx=0 N, ∑Fy=0 N, and ∑Fz=0 N.
3) Axial load: “resultant longitudinal internal component of force which acts perpendicular to
the cross section of a structural member and at its centroid, producing uniform stress” (Great
Hobbies)
4) A pyramid: “a polyhedron that has a base, which can be any polygon, and three or more
triangular faces that meet at a point called the apex” (File:Mathematical Pyramid).
5) Airfoil: The blade component of the wind turbine
6) Betz Limit/Betz Law: By the very nature of wind turbines, it is impossible to generate a wind
turbine efficiency that is greater than 59.3 %. However, It is rare for this maximum efficiency to
be reached. A much more typical efficiency is somewhere between 35 and 45 percent.
2.2 Equations:
Equation 1. Newton’s Law of Motion.
𝐹(𝑁) = 𝑚 (𝑔) ∗ 𝑎 (𝑚
𝑠2)
𝑎 = 𝐺𝑟𝑎𝑣𝑖𝑡𝑎𝑡𝑖𝑜𝑛𝑎𝑙 𝐶𝑜𝑛𝑠𝑡𝑎𝑛𝑡 = 9.8𝑚
𝑠2
𝑚 = 𝑚𝑎𝑠𝑠 (𝑔𝑟𝑎𝑚𝑠)
Equation 2. Elasticity Module. (Youseffi, 2013).
𝐸𝑙𝑎𝑠𝑡𝑖𝑐𝑖𝑡𝑦 = 𝐸 =𝐹𝐿3
3𝑦𝐼
𝐹 = 𝐹𝑜𝑟𝑐𝑒 (𝑁𝑒𝑤𝑡𝑜𝑛𝑠) 𝐼 = 𝐴𝑟𝑒𝑎 𝑚𝑜𝑚𝑒𝑛𝑡 𝑜𝑓 𝐼𝑛𝑒𝑟𝑡𝑖𝑎 𝐿 = 𝐿𝑒𝑛𝑔𝑡ℎ 𝑜𝑓 𝐿𝑒𝑣𝑒𝑟 𝑦 = 𝑑𝑖𝑠𝑡𝑎𝑛𝑐𝑒 𝑜𝑓 𝑑𝑒𝑓𝑙𝑒𝑐𝑡𝑖𝑜𝑛

- 4 -
Equation 3: Ohm’s Law (Anagnos, 2013)
𝑉 = 𝐼𝑅 ⇔ 𝑅(𝛺) =𝑉
𝐼 𝑃 = 𝑉𝐼 ⇔ 𝑃 = 𝐼2 ∗ 𝑅
V = Volts P = Power
I = current
R = resistance
Equation 4: Theoretical Power of a Wind Turbine (Youseffi, 2013)
Power = ½ (ρ)(A)(V)3
P = power A = the area swept p = density of air V = velocity of the wind.
Equation 5: Derivation of Stiffness Constant (Youseffi, 2013)
Where k = stiffness constant Meaning stiffness constant is equal to the slope of a deflection vs. load graph
Figure 5 – Trigonometric applications of the triangle
2.3 Ideas: Strength of triangles and pyramids
By applying the equations for the definition of a static object to the wind turbine
support structure, we can prove the members of a truss are axial load members. This means
deflection
load k

- 5 -
that if the members have a force acting on them, the force is either compression or tension as
figure 5 illustrates.
Figure 6 – trusses with load applied
Many engineers and architects select triangles for construction purposes and there is a
good reason why; triangles do not deform much. Considering the information from the above
paragraph, we can recall that each member of a truss is in either compression or tension. In the
case of tension, there is a pull on the member (see figure 7). In the case of compression there
is a push on the triangle (see figure 8).
Figure 7 – tension on a triangle Figure 8 – compression on a triangle
Both figure 6 and 7 illustrate something very important; the triangle has nowhere to
shift or deform. The triangle keeps its rigidity, no matter if it is in tension or compression.
How Stuff Works states that, “[pyramids are] the most structurally stable shape” (ref 2).
Pyramidal structures have been utilized since antiquity; take the pyramids of ancient Egypt for
example. These pyramids, built many thousands of years ago, are still standing today: a
testament of the stability of pyramidal structure as well as the triangles it is composed of.

- 6 -
Materials
Table 2 – Yellow pine Dowels
As shown in Table 2, yellow pine is heavier but also stronger than balsa wood.
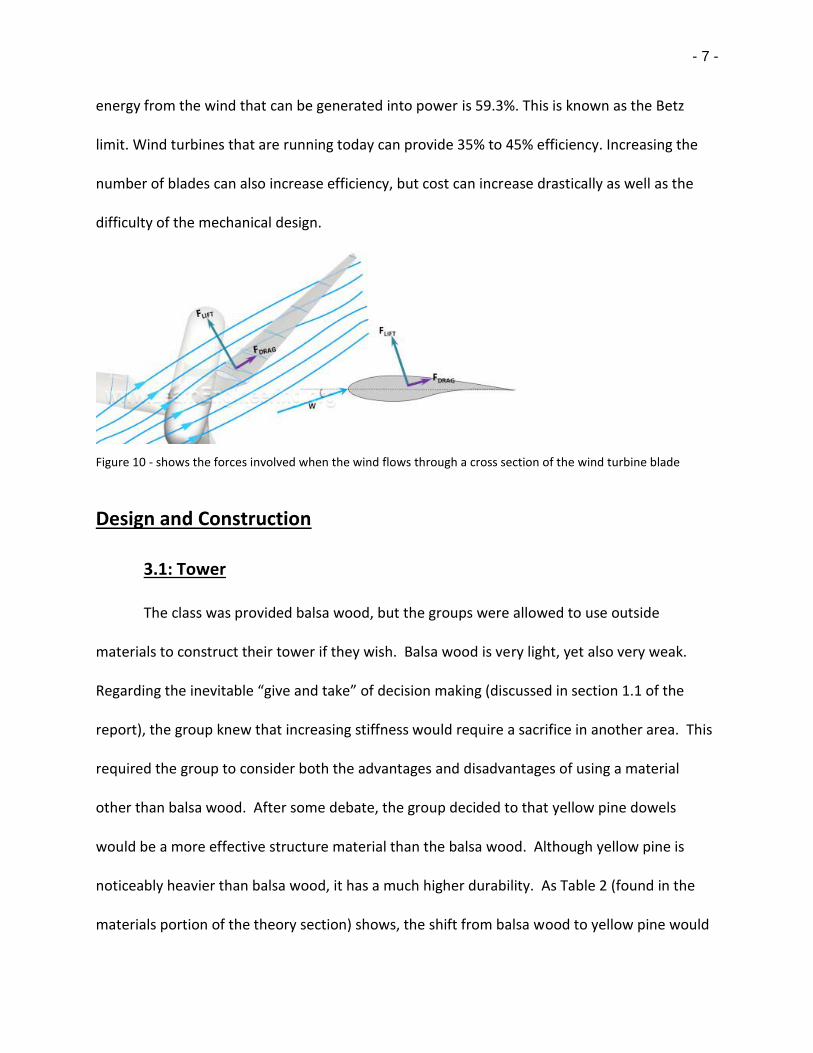
Airfoil and Optimum Angle of Attack
The objective of designing a wind turbine blade is to maximize aerodynamic efficiency as
well as power that can be extracted from the wind. The driving force of a wind turbine is the lift
that the blade can generate from the wind. Notice how a wind turbine blade is made up of
cross sections of airfoils from the root to tip in Figure 8. Airfoils are efficient in generating a lift
in the wind turbine blades by creating a difference in pressure at the top and bottom of the
blade. Since the top of the airfoil is curved substantially more than the bottom, the wind travels
a much longer distance at the top of the blade. This will cause the velocity of the wind to be
lower at the top, thus causing the pressure to be lower. This produces a lift on the blade
perpendicular to the direction of the wind. Generally, lift forces, as well as drag forces, increase
with angle of attack. Drag forces are parallel to the direction of the wind and can slow the blade
down or cause it to stall. Therefore, an optimal angle of attack is required to give the blade
maximum performance by providing a maximum lift to minimum drag ratio. The best angle of
attack is when the blade is streamline (in the direction of the wind) considering it provides the
least drag.
Since the blade generates energy from slowing the wind down, slowing the wind down
100% would cause the air to be still which will not generate power. Generally, the maximum
Weight Stiffness
Balsa 10 100
Yellow Pine 28 222
- 7 -
energy from the wind that can be generated into power is 59.3%. This is known as the Betz
limit. Wind turbines that are running today can provide 35% to 45% efficiency. Increasing the
number of blades can also increase efficiency, but cost can increase drastically as well as the
difficulty of the mechanical design.
Figure 10 - shows the forces involved when the wind flows through a cross section of the wind turbine blade
Design and Construction
3.1: Tower
The class was provided balsa wood, but the groups were allowed to use outside
materials to construct their tower if they wish. Balsa wood is very light, yet also very weak.
Regarding the inevitable “give and take” of decision making (discussed in section 1.1 of the
report), the group knew that increasing stiffness would require a sacrifice in another area. This
required the group to consider both the advantages and disadvantages of using a material
other than balsa wood. After some debate, the group decided to that yellow pine dowels
would be a more effective structure material than the balsa wood. Although yellow pine is
noticeably heavier than balsa wood, it has a much higher durability. As Table 2 (found in the
materials portion of the theory section) shows, the shift from balsa wood to yellow pine would

- 8 -
cause a 64.29% increase in the mass of the structure, but a 54.95% gain in the stiffness of the
structure. The group decided that the additional stiffness was worth a little more weight.
Drawing from the strength and rigidity of the triangular shape, the group chose to
design a tower in the shape of a four sided pyramid (see figure 9). Note not only the triangular
sides, but the right triangle composed within the interior of the pyramid as well.
Figure 9 – a four sided pyramid
Designing the tower relied heavily on applications of the Pythagorean Theorem. Two
questions arose; how long should the leg be? And what angle to attach the legs? The first task
was to derive the base leg’s length. The first issue that arose was finding the angles to cut the
tips of each leg in order to attach them flush onto the top and bottom base Figure 11.
Figure 11 - Cut-out view of the attaching point for each leg to the top base. (Doreza, 2014)
Horizontal
Struts

- 9 -
To find the angle in Figure 11, Group 2 needed the length of the leg and the length of the triangle
the leg formed with the bottom base. In Figure 12, the dimensions used to calculate the base of
the mentioned triangle are shown
Figure 12- Cut-out top view of the structure design with measurements. (Doreza, 2014)
With the application of the properties of triangles the group was able to calculate the base at
5.03 inches shown in green in Figure 12. Obtaining the measurement of the base in this
triangle, and the using the specified height of the support structure minus the thickness of the
top and bottom boards, simple trigonometry along with further application of triangle
properties yields an angle of 72o that the ends of the structure’s legs should be cut at. This was
the main hurdle during the support structure build. From this point, the rest of the build
entailed measuring symmetry for each horizontal trusses shown on figure 11, then attaching
the diagonal trusses.
3.2: Airfoil
Using Solidworks, we designed our wind turbine blade as a result of these theories.
Notice that the top is curved more extensively than the bottom of the blade in figure 13. The

- 10 -
reason is to create a pressure difference to allow the force of lift to generate, as discussed
previously. Also notice how the cross section toward the root is bigger and slightly angled
compared to the cross section toward the tip, which is smaller and aligned with the hub. This
will cause the blade to twist and provide an optimal angle of attack at each cross section. The
length of the cross section of the blade is 0.845 inches to provide as much pressure difference
as possible while allowing enough room for 3 blades to be evenly spaced around the hub.
Figure 14 shows our final product which was printed by a 3D printer. To minimize drag and
create steady wind flow, sandpaper was used to create a smooth surface on the blades.
Figure 13 - Dimensions and design of a cross section of the wind turbine blade at the root.
Figure 14 - The wind turbine blade printed by a 3D printer.

- 11 -
Experimental setup and procedure:
This phase of the lab is divided into two main tasks. The first task is to determine the
strength and stiffness of the designed wind turbine structure, and the second task is to
determine the maximum power generated based on the airfoil design.
4.1 Strength and stiffness.
In order to determine the strength and stiffness of the Group 2’s design, the structure
was subject to a cantilever deflection test as shown in Figure 9. This test measures the amount
of a structure deflects in relation to its base with a given amount of force applied to it.
Figure 10 - Cantilever deflection experiment setup
(Doreza, 2014).
In the Figure 10, the readings reported by the deflection meter equates to the
deflection variable Y in equation 2. This exercise has multiple trials. In each trial, the amount of
force is incrementally increased until the maximum amount of force is achieved before failure
of the structure. From the given data, stiffness can be calculated using the following equations:
Deflection Meter
Mass (grams)
Structure

- 12 -
4.2 Peak Output and Max Efficiency.
The second task of this experiment, is to determine the peak power output and
maximum efficiency of the group’s airfoil design. To setup the experiment, each group is given
a small electric motor in tandem with the blade structure the groups designed two weeks prior
to the testing phase. This task is divided into two activities.
Activity 1:
The first activity is intended to establish the power generation capability of the airfoil by
measuring the relationship between a set of variables. Specifically: Total power in (watts);
total electric potential energy in (volts); total current in (Amps), and Resistance in Ohms (Ω). The
relationship between these components can be defined by Ohm’s Law.
To measure the turbine’s power output, the device is connected to a power meter that
is able to give instantaneous measurements of Watts, Volts, and Amps (appendix A). This
circuit is then connected to a variable load meter called a potentiometer (appendix A), (PoT), to
simulate different load resistance to the generating motor. Data gathered from this exercise
can be used to generate a graph showing the relationship between voltage vs current, and
power vs current. Figure 10 shows examples of these graphical relationships.
3.9A 3.9A

- 13 -
Figure 10 - These graphs highlight the relationship between Power and current,
and Voltage and Current. These example graphs indicate that at 3.9
amps, the system is at its peak power and energy output. 5v and
2.9watts. (Doreza, 2014)
Activity 2:
The second activity is more qualitative, than quantitative. All the second portion of the
experiment deals with is the question, does the turbine produce enough power to light up a
series of light bulbs. Instead of a PoT, a load box with a series of 6 mini light bulbs and
accompanying switches per light bulb is connected. The purpose of this exercise is to determine
the total number of bulbs the turbine system will be able to power. As each switch is closed
and bulb energized, more load is being put to the system.
At this stage of the exercise, all the data have been gathered and it is possible to
calculate the system’s efficiency. Doing so requires the utilization of the baseline data gathered
in the calibration portion of the experiment. These calculations, graphs, and analysis are
discussed in the next section.
Experimental Results
The group’s blade design didn’t provide the anticipated results, but it still performed
relatively well. The design was slightly angled to cause a twist in the blade that would project
optimal angles at each cross section, so that it could generate the most power from the wind.
The 3-D printer that was used to materialize the blade printed the airfoil design a little rough,
so it was necessary to sand it down for optimum power generation. As shown in Figure 11, with
the wind blowing at 25 mph, our blade was able to give a maximum power of 780 milliWatts
and the blade spun at 4000 RPM. To find the theoretical power we used the formula Power = ½
(ρ)(A)(V)3, with ρ being equal to air density which is 1.2 kg/m3, A being the swept area, which is

- 14 -
pi times the radius of the blade squared, and V being the winds velocity. When including our
values, Power = ½(1.2 kg/m3)(pi(0.0123192 m)(25)3, which came out to 4.2 Watts.
The structural design of the wind turbine produced extremely good results. The choice
to use yellow pine dowels as opposed to the given balsa wood made a noticeable difference
both in the stiffness and weight of the structure. This is because yellow pine is much stronger
and much more durable than the balsa wood, and therefore did a better job of keeping its
shape when being put under the pressure of the weight applied to it. However, yellow pine is
also heavier, and a greater mass was also observed in the results of this
experiment. Considering the stability of the completed structure in comparison to the
increased in weight, it seems as though the choice of yellow pine was a positive one. The
overall weight of the structure came out to be about 280 grams. The choice to use trusses in
the design of the tower structure contributed positively the stiffness of the structure. The
trusses helped to minimize the load being applied to the rest of the structure. Lastly, small
holes were drilled into the base and the legs of the tower were then glued into the base to
increase stability. The results of this experiment were a displacement of 0.11mm under a 4.5 Kg
load. Due to the limited number of weights available, 4.5 Kg highest load that could applied at
the time, but it is likely that the structure could have supported a lot more weight. When
measuring the stiffness we used the formula k = load/deflection, with the load being 44.13
Newton’s and the deflection being 0.11 millimeters, which equaled 36.957 kg/mm.

- 15 -
Figure 11 – Group 2’s graphs from data
Mechanical and Structural Measurements a. Tower Height: 16 ⅝ in b. Tower Net Weight: 280 g (Total Assembly(935 g) - Top/Bottom Boards(655 g))
Table 3: Stiffness Measurements
Data Points: Load (Kg) Load (N) Displacement (mm)
1 1 9.81 .02
2 2 19.61 .06
3 3 24.52 .07
4 3 29.42 .09
5 4.5 44.13 .11
2.0 Power Measurements a. Blade to Fan Distance: 430 mm b. Wind Speed: 26.3 mph

- 16 -
Table 4: Progressive Power Measurements
Light Bulb # (ON)
Voltage Volts (V)
Current I (mAmps)
Power P (mWatts)
Blade Speed (RPM)
0 3.35 236 780 4000
1 3.08 192 580 4738
2 3.26 153 480 4990
3 3.49 112 370 5138
4 2.70 263 690 4390
5 3.64 53 170 5315
6 3.41 84 270 5193
Conclusion and Recommendations
This experiment has shown the importance of understanding the fundamentals of wind
turbines. Through the stiffness of the structure, the design of the airfoil, and materials used, a
better understanding has been instilled to the students who conducted this lab experiment.
After designing and creating the wind turbine, data has shown great stiffness through
the use of yellow pine dowels. By following the pyramid design, the stiffness of the structure
was able to withstand 4.5 Kg of weight while weighing about 280 grams.

- 17 -
FIGURE 12 - UIUC Maximum Lift-to-Drag Graph.
FIGURE 13 - UIUC Airfoil Design Based on Application.
The power produced by the wind turbine was below average (780 mW). This was due to
the design of the airfoil. The graph made by aerospace engineers of UIUC showed that the
airfoil design was similar to an aircraft’s airfoil (See Figure 13). The lift-to-drag ratio of an
aircraft, designed to move at very high velocities, is very different from the airfoil of a wind
turbine, designed to move at much lower velocities. As Figure 12 shows, an optimal design to
get a maximum lift-to-drag ratio is represented by SG6042 and SG6043.
As a recommendation, one should create a blade design that is a closer match to
SG6042 or SG6043. By following these dimensions, a higher power output will be produced.
Combined with a very strong structure and an airfoil design which maximizes lift-to-drag ratio,
an exceptionally powerful wind turbine can be created.
As of March 5, 2014, the American Wind Energy Association has stated that the wind
power has generated 4.13 percent of all electricity in the America in 2013. Elizabeth Salerno,
Vice President of Industry Data and Analysis for the American Wind Energy Association has
stated that electricity generated from wind power has more than tripled since 2008. As society

- 18 -
embraces these forms of energy, we can see that renewable energy sources are the way of the
future. The further we investigate and perfect these alternate methods of energy production,
the better results we will create. With determination, society can slowly shy away from foreign
oil.

- 19 -
Reference.
American wind power reaches major power generation milestones in 2013. (n.d.). Retrieved from http://www.awea.org/MediaCenter/pressrelease.aspx?ItemNumber=6184
Anagnos, T. Solar Project | Engineering 10. Retrieved from
http://engineering.sjsu.edu/e10/labs/solar/
Bailey, R., & Johnson, V. (n.d.). Wind powered electric generator design project. Retrieved from
http://academic.engr.arizona.edu/instructor/projects/windmill.htm
Doreza, R. Cantilever Deflection Test. 2014 Created using Solidworks SE and GIMP [JPG].
Doreza, R. Example PvC and VvC Graphs. 2014 Created using Microsoft Excel [XLSX].
File:Mathematical Pyramid.svg - Wikipedia, the free encyclopedia. (n.d.). Retrieved October 22,
2014, from http://en.wikipedia.org/wiki/File%3AMathematical_Pyramid.svg
Great Hobbies Technical Articles. Retrieved from
http://www.greathobbies.com/technical/tech_balsa_1.php
Mets, M. (2010, June 10). Ask MAKE: How do trusses work? | MAKE. Retrieved from
http://makezine.com/2010/06/10/ask-make-how-do-trusses-work/
Section 4: Sine And Cosine Rule. (n.d.). Retrieved from
http://www.cimt.plymouth.ac.uk/projects/mepres/step-up/sect4/index.htm
Straws and Pins—Building Up. Retrieved from
http://www.exploratorium.edu/scale/straws.html
University of Illinois at Urbana-Champaign. (n.d.). Camberline: Newsletter of the UIUC Low-
Speed Airfoil Tests. Retrieved from http://m-
selig.ae.illinois.edu/uiuc_lsat/lsat_5bulletin.html
Wind power in Oregon - Wikipedia, the free encyclopedia. (n.d.). Retrieved October 22, 2014,
from http://en.wikipedia.org/wiki/Wind_power_in_Oregon
Youseffi, K. Energy and Power. 2014 [PowerPoint slides]. Retrieved from Lectures Online
Website: http://engineering.sjsu.edu/e10/lectures/.

- 20 -
Appendix A:
Figure A.1 Power Meter used in measuring instantaneous Power, Voltage, and Current in activity 1. (Anagnos, 2013)
From
source To load
Connect to a
power adapter
ON/OFF
switch
This number is the
power flows from
the source to the
load in W.
Voltage Current
Binding
posts
Switch
Up: 0.2 w max
Down: 2 w max
Figure A.2 Schematic view of Power Meter including I/O for source and load, and display annotations. (Anagnos, 2013)
Figure A.3 Image of a standard potentiometer. (Anagnos, 2013)

- 21 -
Appendix B: Team Evaluation.
i. Who worked on each aspect of the project?
a. Rex Doreza.
1. Theory collaboration.
2. Materials collaboration.
3. Support structure build.
4. Experimentation.
5. Solidworks Diagrams.
b. Ryan Honrado.
1. Experimentation.
2. Data Verification.
3. Airfoil Design.
4. Structure Recommendation.
c. Tony Do.
1. Wind Turbine Blade Design.
2. Support Structure Build.
3. Blade Finishing.
d. Josh Crummy.
1. Theory collaboration.
2. Materials collaboration.
3. Support structure build.
4. Experimentation.
e. Milaud Nik-Ahd.
1. Recorded data.
2. Experimental setup.
3. Support structure build.
f. Cali Ferrari.
1. Geometrically found angles and base leg lengths of structure
2. Support structure build
3. Experimentation
ii. Who contributed to each section of the report?
a. Rex Doreza.
1. Title Page.
2. Build.
3. Experimentation and Setup.
4. References.
b. Ryan Honrado.
1. Conclusion and Recommendation.
2. References.
c. Tony Do.
1. Airfoil and Angle of Attack Theory.
d. Josh Crummy.

- 22 -
1. Theory (tower).
2. Build tower (part).
3. Reference Page (part).
e. Milaud Nik-Ahd.
1. Experimental Results.
f. Cali Ferrari.
1. Abstract
2. Introduction
3. Table of Contents
4. Revision
iii. Describe one challenge the team faced, how the team resolved it, and a lesson the team
learned from that experience.
a. During the report writing portion of the project, we switched to Dropbox rather
than Google Drive to do our group collaboration. This was problematic because
Dropbox does not allow for real time sync of documents open by multiple users
simultaneously. During the presentation, we used Google Drive to create the
PowerPoint presentation, and the collaboration was much better. Only problems
encountered with Google Drive was the necessity for an internet connection to
access the presentation, and format conversion to Microsoft PowerPoint.
iv. Use the table below to rank (on a scale of 5 to 1) your team performance in the following
six areas. (5= we all did this all of the time to 1= did not do this at all )
Teamwork Skill Performance
Level
1) open and honest communication among members 5
2) each individual carried his/her own weight 5
3) collaboration in decision making 5
4) team set goals and milestones 5
5) people listened to each other 5
Related Documents