TECHNICAL ENGINEERING FIELD NOTES TECHNICAL REPORTS DATA RETRIEVAL MANAGEMENT INFORMATION PROFESSIONAL DEVELOPMENT VOLUME SYSTEM -7 10 NUMBER 4 Government Field Notes Liability Graphic Display Method For Comparing Alternate Routes Washington Office News L FOREST SERVICE APRIL 1978 r151 5rdct US Ylra.crý U.S. DEPARTMENT OF AGRICULTURE

Welcome message from author
This document is posted to help you gain knowledge. Please leave a comment to let me know what you think about it! Share it to your friends and learn new things together.
Transcript
TECHNICALENGINEERING
FIELD NOTES TECHNICAL REPORTSDATA RETRIEVAL MANAGEMENT
INFORMATION PROFESSIONAL DEVELOPMENT
VOLUME
SYSTEM-7
10 NUMBER 4
Government
Field NotesLiability
Graphic DisplayMethodFor Comparing Alternate Routes
Washington Office News
LFOREST SERVICE APRIL 1978
r1515rdct
USYlra.crý
U.S. DEPARTMENT OF AGRICULTURE


UýS
ENGINEERING FIELD NOTES
Volume 10 Number 4
Information contained in this publication has been developed for guidance of employeesof the United States Department of Agriculture-Forest Service its contractors and its
cooperating Federal and State agencies. The Department of Agriculture assumes norespon-sibilityfor the interpretation or use of this information by other than its own employees.
The use of trade firm or corporation names in this publication is for the information and
convenience of the reader. Such use does not constitute an official endorsement or approval
of any product or service by the United States Department of Agriculture to the exclusion
of others that may be suitable.
The text in the publication represents the personal opinions of the respective author andmust not be construed as recommended or approved procedures mandatory instructions
or policy except by FSM references. Because of the type of material in the publication all
engineers and engineering technicians should read each issue however this publication is
not intended exclusively for engineers.
FOREST SERVICEU.S. DEPARTMENT OF AGRICULTURE
Washington D.C. 20013

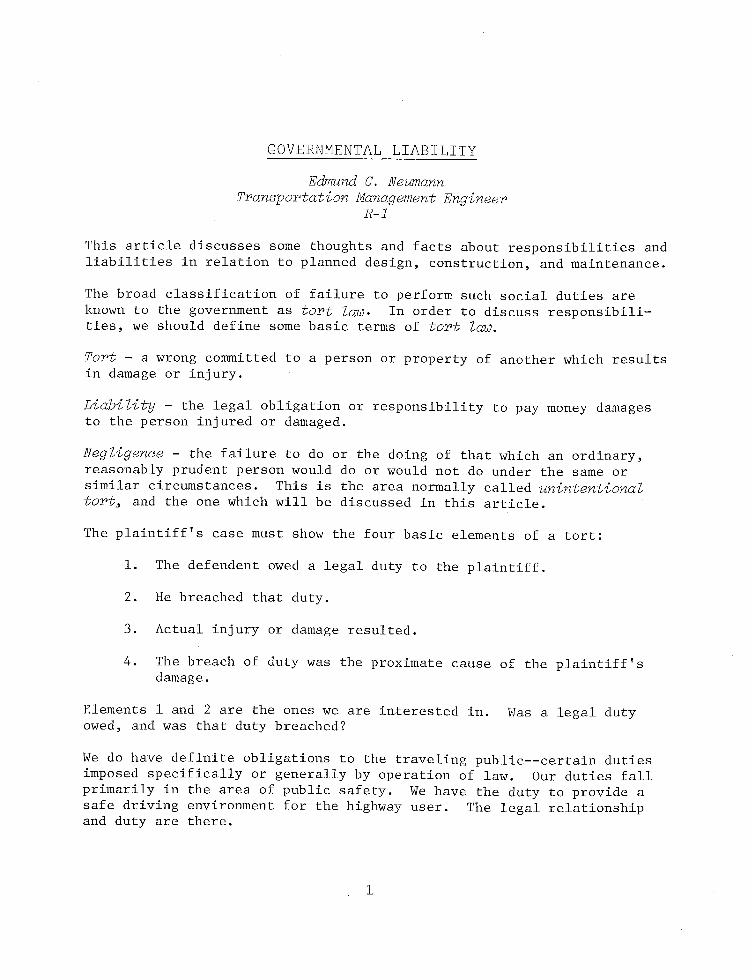
GOVERNMENTAL LIABILITY
Edmund C. NeumannTransportation Management Engineer
R-Z
This article discusses some thoughts and facts about responsibilities andliabilities in relation to planned design construction and maintenance.
The broad classification of failure to perform such social duties areknown to the government as tort law. In order to discussresponsibili-tieswe should define some basic terms of tort law.
Tort - a wrong committed to a person or property of another which resultsin damage or injury.
Liability - the legal obligation or responsibility to pay money damagesto the person injured or damaged.
Negligence - the failure to do or the doing of that which an ordinaryreasonably prudent person would do or would not do under the same orsimilar circumstances. This is the area normally called unintentionaltort and the one which will be discussed in this article.
The plaintiffs case must show the four basic elements of a tort
1. The defendent owed a legal duty to the plaintiff.
2. He breached that duty.
3. Actual injury or damage resulted.
4. The breach of duty was the proximate cause of the plaintiffsdamage.
Elements 1 and 2 are the ones we are interested in. Was a legal dutyowed and was that duty breached
We do have definite obligations to the traveling public--certain dutiesimposed specifically or generally by operation of law. Our duties fall
primarily in the area of public safety. We have the duty to provide asafe driving environment for the highway user. The legal relationshipand duty are there.
1

Years ago we could exercise sovereign immunitybut since the Federal
Tort Claims Act of 1946 the government is liable for its actions.
The central provision of this Act affirms that a suit may be broughtagainst the United States
for injury or loss of property or personal injury or
death caused by the negligent or wrongful act or omission of
any employee of the Government while acting within the scopeIII of his office or employment under circumstances where the
United States if a private person would be liable to the
claimant in accordance with the law of the place where the act
or omission occurred.
28 U.S.C. 1346b
A section of the Act provides that the government will not be liable for
damages arising from its agents discretionary acts. These are acts
involving the determination of policy or exercise of judgment such as
planning or design activities. These are differentiated fromministe-rialacts which only involve obedience to orders or the performance of
a duty in which the government or_officer involved is left no choice of
his own.
Even after the passage of the Federal Tort Claims Act we were notsub-jectedto many claims on our road system because the language of the Act
establishing Forest roads 23 U.S.C.. Our authority to construct and
maintain roads was and still is void of any mention of safety or
safety obligations.
However in August of 1973 the Department of Transportation DOT issueda regulation which directed each Federal agency to implement the HighwaySafety Program Standards. In 1975 agreements were reached between the
Forest Service and DOT which specifically identified those applicablestandards.
The net result wasthat we lost much of our discretionary immunity and
most of our activities were placed in a ministerial role. There are
safety standards and guidelines that we are obligated to adhere to and
no longer can we decide administratively for ourselves.
The erosion of the sovereign immunity principle has had a marked effect
on governmental agencies. For example the State of California in 1961
had one attorney assigned to claims. The records show that as of July 11976 there were $1.2 billion in claims and active suits against theCalifornia Department of Transportation. The Department has increased
2

its legal staff for handling claims to 40 full-time attorneys with 18
full-time investigators.
At the present time claims against the Forest Service exceed $20 millionten years ago claims were less than $1 million. This supports thefind-ingsof a Forest Service study that indicated an annual increase of 58
percent in tort claims.
This brings us to a discussion of our duty and the avoidance of
liability. The logical way to do this is to examine each step in a
project.
PLANNING
Planning of a facility is a purely discretionary act because it involvesevaluation of alternatives and -- based upon such consideration -- the
exercise of independent judgment in arriving at a decision or in choosinga course of action. There are no hard and fast rules for deciding the
appropriate course of action. Therefore the planning activity is immunefrom liabilityunder the Federal Tort Claims Act.
DESIGN
The design of a facility has long been considered discretionary and as
such has been immune from liability. This has been severely challengedin recent years and courts have held that there are exemptions to designimmunity. Where there is room for policy judgment and decision there is
discretion. Conversely where there are official directions manualsetc. that dictate minimum standards or procedures and we fail to adhereto such directions we may find that we have shifted from thediscretion-aryto the ministerial function.
The exceptions to design immunity that have been identified in court cases
are
1. Where the approval. of a plan or design was arbitraryunreason-ableor made without adequate consideration.
2. Where a plan or design was prepared without adequate care.
3. Where a plan or design contained in inherent manifestlydanger-ousdefect or was defective from the very beginning of actualuse.
4. Where changed conditions demonstrate the need for additional orremedial action.
3
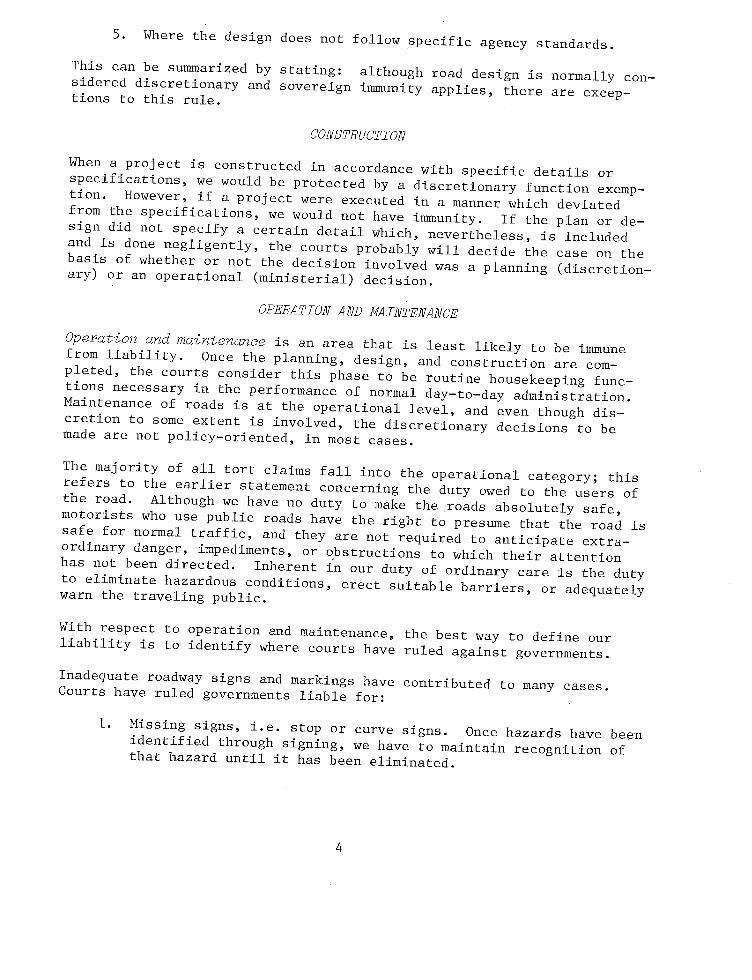
5. Where the design does not follow specific agency standards.
This can be summarized by stating although road design is normallycon-sidereddiscretionary and sovereign immunity applies there areexcep-tionsto this rule.
CONSTRUCTION
When a project is constructed in accordance with specific details or
specifications we would be protected by a discretionary functionexemp-tion.However if a project were executed in a manner which deviatedfrom the specifications we would not have immunity. If the plan orde-signdid not specify a certain detail which nevertheless is includedand is done negligently the courts probably will decide the case on the
basis of whether or not the decision involved was a planningdiscretion-aryor an operational ministerial decision.
OPERATION AND MAINTENANCE
Operation and maintenance is an area that is least likely to be immunefrom liability. Once the planning design and construction arecom-pletedthe courts consider this phase to be routine housekeepingfunc-tionsnecessary in the performance of normal day-to-day administration.
Maintenance of roads is at the operational level and even thoughdis-cretionto some extent is involved the discretionary decisions to be
made are not policy-oriented in most cases.
The majority of all tort claims fall into the operational category this
refers to the earlier statement concerning the duty owed to the users of
the road. Although we have no duty to make the roads absolutely safemotorists who use public roads have the right to presume that the road is
safe for normal traffic and they are not required to anticipateextra-ordinarydanger impediments or obstructions to which their attentionhas not been directed. Inherent in our duty of ordinary care is the dutyto eliminate hazardous conditions erect suitable barriers or adequatelywarn the traveling public.
With respect to operation and maintenance the best way to define our
liability is to identify where courts have ruled against governments.
Inadequate roadway signs and markings have contributed to many cases.Courts have ruled governments liable for
1. Missing signs i.e. stop or curve signs. Once hazards have beenidentified through signing we have to maintain recognition of
that hazard until it has been eliminated.
4

2. Failure to install signs or hazard markers. Policies andguide-lineshave been written on signing and courts have ruled that
failure to follow written direction is considered negligence.
3. The use of nonstandard signs which contribute to or cause an
accident.
4. Improper or mislocated striping.
Roadway maintenance has also been the subject of numerous cases.Examp-lesof roadway conditions which have resulted in government liabilityare as follows
1. Standing water mud rocks or other debris on roads especiallyif we have knowledge of the condition and do nothing to correct
it. For example if an employee of the government notices these
conditions and does nothing to report or correct them the
courts have ruled that knowledge by an individual constitutesknowledge by the government.
2. Slick road surfaces such as ice road oils asphalts or evenplain dirt.
3. A road closed by earth barriers that is not posted with other
warnings creates a liability. One case involved an earthbar-rierblocking an old road from which the culverts had beenremoved. Over a period of time the barriers had all butdis-appearedwhen an accident occurred on that road the governmentwas held liable.
The decision as to when to install a guardrail along a road is normallyconsidered discretionary unless past accidents or other sources havepointed out a hazardous condition. Once a guardrail is installed we are
obligated to maintain it as it was designed to function. Blunt ends on
guardrails when accepted standards are otherwise are consideredhazard-ousand we are liable if an accident occurs.
An improper or missing bridge rail which contributed to an accident wasthe basis for a decision against the government. Here again is a case
in which we have definite standards and failure to adhere to these
standards is strictly ministerial.
In one case a plugged drainage system which caused damage to privateproperty resulted in government liability.
Bridge inspections and restricted weights although not the subject ofany particular case could cause a liability on our part. The bridge
5
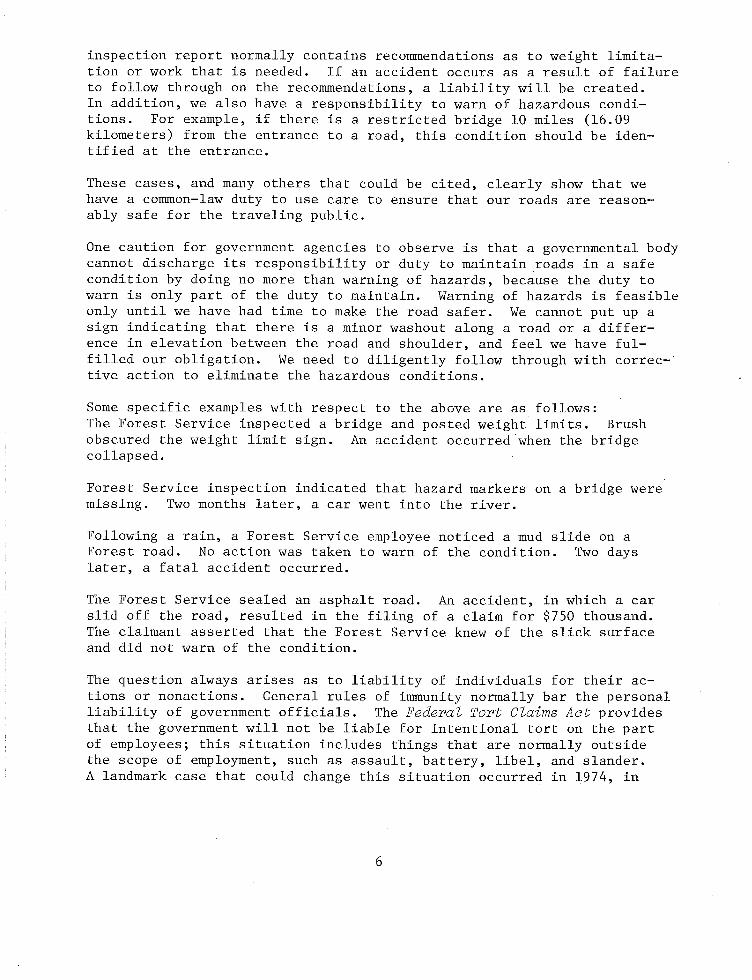
inspection report normally contains recommendations as to weightlimita-tionor work that is needed. If an accident occurs as a result of failureto follow through on the recommendations a liabilitywill be created.In addition we also have a responsibility to warn of hazardouscondi-tions.For example if there is a restricted bridge 10 miles 16.09kilometers from the entrance to a road this condition should beiden-tifiedat the entrance.
These cases and many others that could be cited clearly show that wehave a common-law duty to use care to ensure that our roads arereason-ablysafe for the traveling public.
One caution for government agencies to observe is that a governmental bodycannot discharge its responsibility or duty to maintain roads in a safe
condition by doing no more than warning of hazards because the duty towarn is only part of the duty to maintain. Warning of hazards is feasibleonly until we have had time to make the road safer. We cannot put up a
sign indicating that there is a minor washout along a road or adiffer-encein elevation between the road and shoulder and feel we haveful-filledour obligation. We need to diligently follow through withcorrec-tiveaction to eliminate the hazardous conditions.
Some specific examples with respect to the above are as followsThe Forest Service inspected a bridge and posted weight limits. Brushobscured the weight limit sign. An accident occurred when the bridgecollapsed.
Forest Service inspection indicated that hazard markers on a bridge weremissing. Two months later a car went into the river.
Following a rain a Forest Service employee noticed a mud slide on aForest road. No action was taken to warn of the condition. Two days
later a fatal accident occurred.
The Forest Service sealed an asphalt road. An accident in which a carslid off the road resulted in the filing of a claim for $750 thousand.
The claimant asserted that the Forest Service knew of the slick surfaceand did not warn of the condition.
The question always arises as to liability of individuals for theirac-tionsor nonactions. General rules of immunity normally bar the personalliability of government officials. The Federal Tort Claims Act providesthat the government will not be liable for intentional tort on the partof employees this situation includes things that are normally outsidethe scope of employment such as assault battery libel and slander.A landmark case that could change this situation occurred in 1974 in
6

which the Supreme Court ruled that a government employee was personallyliable and the court stated that officials are liable when they fail tomake decisions when needed or who do not act to implement decisionsthat are made. This could have far-reaching effects on us asindividu-alsif we fail to faithfully perform the duties assigned to us.
This discussion is intended to give you a better realization of our
responsibilities as public employees. Everything discussed is a matterof record in the courts and the courts operate on the principle of the
kiZZy-Zoo bird--the bird that insisted on flying backwards because itdidnt care where it was going but was only interested in where it hadbeen. Most court decisions are made in this manner. Past cases formthe framework for the decisions they make today and there are sufficientpast cases in tort liability to know where we stand today.
7

A GRAPHIC DISPLAY METHOD FOR COMPARING
ALTERNATE ROUTES
Wallace R. Cox Peter WongTransportation Planner Civil EngineerGifford Pinchot N.F.
R-6
INTRODUCTION
Frequently the transportation analyst is faced with the problem ofse-lectingone road or proposed road over another. This usually does not
present a difficult problem since many selections requirestraight-for-wardanalysis. However transportation analysts sometimes do a somewhatshort-range or financial analysis rather than dig into a detailedeco-nomicanalysis. The financial analysis ordinarily gives good results.
However it does not fully meet FSM requirements for economic analysisbecause it does not portray what is really happening to the investmentof construction and operating costs.
What appears to be a simple problem of deciding whether to construct anew road or to reconstruct an old road can become quite complicated.This is especially true if stage construction is used to keep costs to a
minimum when the amount of benefits or costs directly related to theroad is not clear.
One approach for evaluating future effects of costs and benefits is to
use graphic methods to provide a picture of the situation. A personexperienced in graphic analysis can create many illustrations thatpro-videinformation which is easy for the decision-maker to understand andfor an analyst to interpret. This article presents a graphic approachfor analyzing alternatives in construction scheduling stageconstruc-tion.Graphic analysis has also been used by Forest transportationanalysts to evaluate the sensitivity of the solution to different ratesof interest. We hope this article will encourage creative use ofgraph-icsas a means to evaluate such problems.
THE PROBLEM
To demonstrate let us set up a problem and go through the process. In
figure 1 we show the problem of constructing Road 1-20 orreconstruct-ingRoad N-19 for the Iron King Timber Sale. Road 1-20 costs $160
8

A t
FUTURE ýSALES
W\ \ý PROPOSED
SALE
\ý \I20
\ ýý ýýý Ley
MI LL
Figure 1. Construction of Road -T-20 vs Reconstruction of N-19.
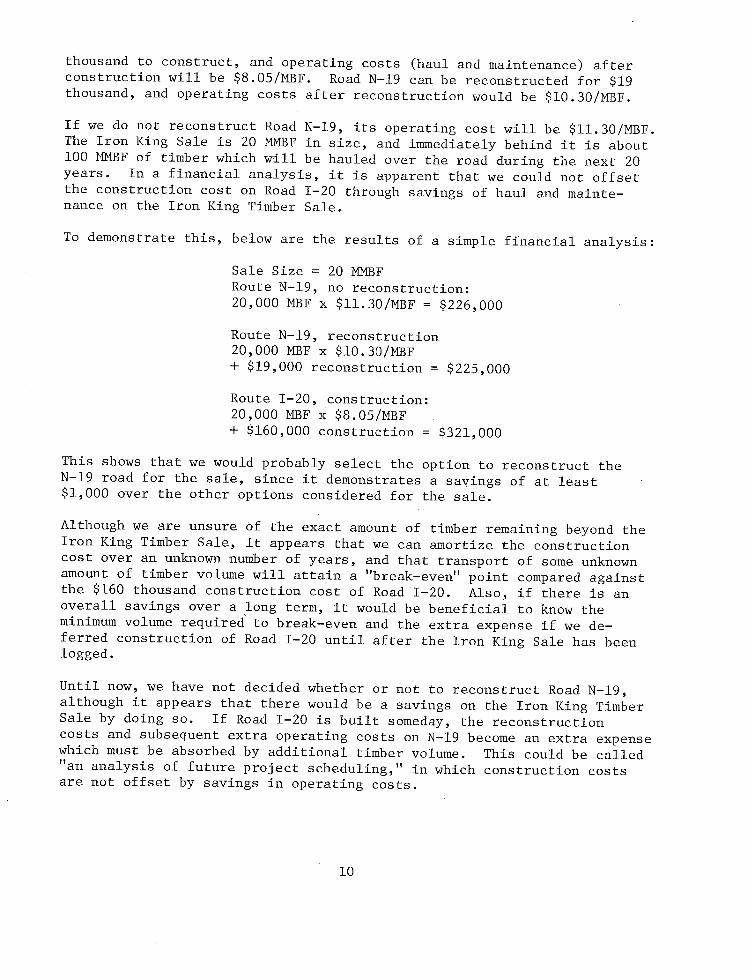
thousand to construct and operating costs haul and maintenance afterconstruction will be $8.05/MBF. Road N-19 can be reconstructed for $19
thousand and operating costs after reconstruction would be $10.30/MBF.
If we do not reconstruct Road N-19 its operating cost will be $11.30/MBF.The Iron King Sale is 20 MMBF in size and immediately behind it is about
100 IMF of timber which will be hauled over the road during the next 20
years. In a financial analysis it is apparent that we could not offset
the construction cost on Road 1-20 through savings of haul andmainte-nanceon the Iron King Timber Sale.
To demonstrate this below are the results of a simple financial analysis
Sale Size 20 MMBFRoute N-19 no reconstruction20000 MBF x $11.30/MBF $226000
Route N-19 reconstruction20000 MBF x $10.30/MBF$19000 reconstruction $225000
Route 1-20 construction20000 MBF x $8.05/MBF$160000 construction $321000
This shows that we would probably select the option to reconstruct the
N-19 road for the sale since it demonstrates a savings of at least
$1000 over the other options considered for the sale.
Although we are unsure of the exact amount of timber remaining beyond the
Iron King Timber Sale it appears that we can amortize the constructioncost over an unknown number of years and that transport of some unknownamount of timber volume will attain a break-even point compared againstthe $160 thousand construction cost of Road 1-20. Also if there is an
overall savings over a long term it would be beneficial to know the
minimum volume required to break-even and the extra expense if wede-ferredconstruction of Road 1-20 until after the Iron King Sale has been
logged.
Until now we have not decided whether or not to reconstruct Road N-19although it appears that there would be a savings on the Iron King TimberSale by doing so. If Road 1-20 is built someday the reconstructioncosts and subsequent extra operating costs on N-19 become an extra expensewhich must be absorbed by additional timber volume. This could be calledan analysis of future project scheduling in which construction costsare not offset by savings in operating costs.
10

All costs portrayed within the analysis may also be shown as the result
of inflation at the year they are expended and then discounted back to
present worth inflation rates are optional and may be set equal to zero.
Also a variety of interest rates should be studied. An array of costs
using different interest rates is useful in deciding between alternatives.
It is not the intent of this article to advocate the use of inflationrates in an economic analysis since there is controversy among economistson that point. Users of this technique should understand that the ForestService policy is not to use inflation in economic analysis we haveincluded inflation to illustrate how it might be used in this process to
develop a sensitivity to the effect of inflation on future cost factors.
THE ANALYSIS
Four basic route alternatives are considered for this study in whicheach alternative is studied for two different levels of timber harvest
over a 20-year period. The two levels of harvest for the 20-year periodare 100 MMBF and 50 MMBF.
The four route alternatives are as follows
Alternate I - Use existing route N-19 throughout the period.
Alternate II - Use existing route 1-20 throughout the period.
Alternate III - Use existing route N-19 the first 5 years then
reconstruct and use reconstructed route N-19 during the last
three 5-year periods.
Alternate IV - Use existing route N-19 the first 5-year periodthen use existing route 1-20 during the last three 5-year periods.
The first step is to divide the overall time of the study into study
periods the 20-year time horizon was divided into four 5-year studyperiods.
The second step is for the analyst to calculate the accumulative cost at
various points within the study period for each alternative. Todemon-stratehow we would determine a cost at a given point let us solve for
the present worth of costs at 20 years for Alternative IV. Let the
discount and inflation rates be 10% and 7% respectively the presentworth of an amount c expended in year t due to the combined effect
of these two rates is
c x 1.07/1.101 c x 0.97271
11

In this calculation operating cost and construction cost are assumed tobe incurred at the last and first year of each period respectively. For100 MMBF total Alternate I we assume that 25 MMBF is harvested in eachtime period as shown in Table 1. The present worth of costs iscalculat-edas
Present Worth of Costs discounted - inflated hauling cost for 25 MMBFover existing Road N-19 at year 5.
discounted - inflated constructioncost for Road 1-20 at year 6.
discounted - inflated cost for 25MMBF over Road 1-20 at year 10.
discounted - inflated hauling costfor 25 MMBF over Road 1-20 at year15.
discounted - inflated hauling costfor 25 MMBF over Road 1-20 at year20.
25000 x 11.30 x 0.9727516000 x 0.97276
25000 x 8.05 x 0.97271025000 x 8.05
x 0.972715 25000 x 8.05 x0.9727 20 - $783000
The same method is used to obtain the accumulative costs for other routealternatives and for the 12.5 MMBF logged each period for alternatives.
12

Table 1.--Cumulative Costs for the Alternatives
Timber MMBF Cumulative Present Worth of Cost at Indicated YearEach Period thousands of dollars
Alt. Current 5 6 10 15 20
25 0 246 246 460 647 809I
12.5 0 123 123 230 323 405
25 156 331 331 484 616 732
II12.5 156 243 243 320 386 444
25 0 246 262 457 627 776III
12.5 0 123 139 237 322 396
25 0 246 382 534 667 783
IV12.5 0 123 259 335 401 459
discount ratel0% inflation rate7%
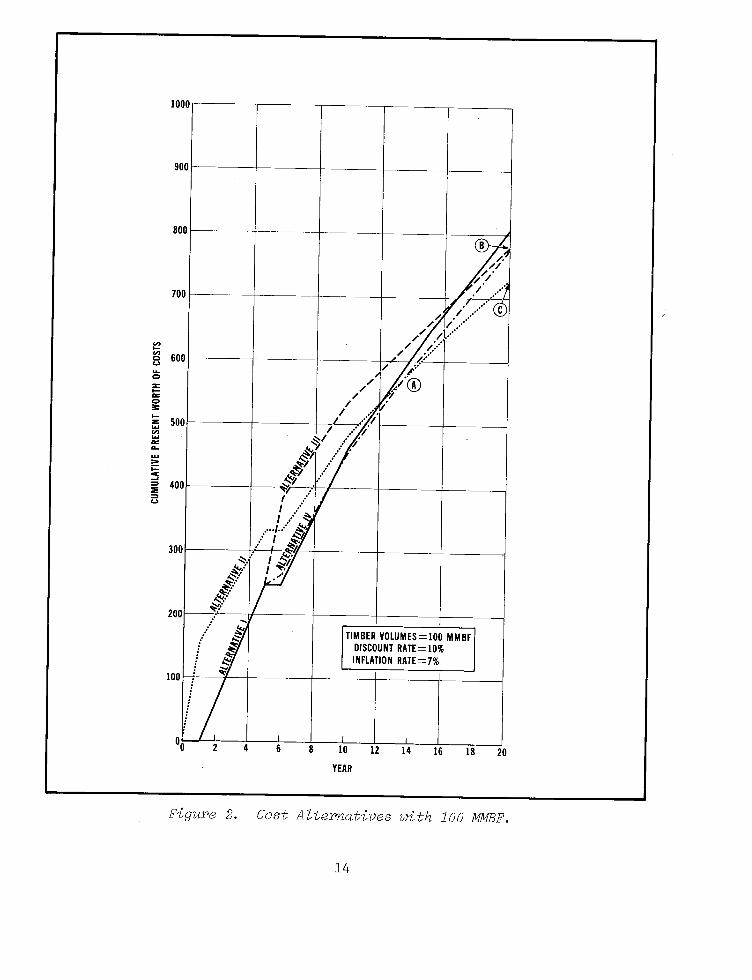
The next step is to plot the points given in Table 1 on graph papers asshown in Figures 2 and 3. At this time the analyst can start comparingalternatives directly from the graphs. For illustration the circledletters A B and C in Figure 2 identify certain meaningful situations
A - shows break-even point in the first period in which constructionbecomes less expensive than using existing Road N-19.
B - shows that at the end of the design life both construction and
reconstruction costs in the second period become nearly equaland that both are less expensive than using existing Road N-19.
C - shows that construction in the first period is the leastexpen-siveif no less than 100 MMBF is to be logged in the 20-yearperiod. If construction were delayed until the second periodthe loss would be the difference in costs for Point B minusPoint C.
Figure 3 graphically shows the results of the same alternatives if only50 MMBF of timber is to be logged over the design life. Letters D andE identify certain meaningful situations
13
1000
900
800 -- -- -B
700
600
3 /500
J400 417
UI
.
300
200
TIMBER VOLUMES100 MMBFZQ DISCOUNT RATE10%W INFLATION RATE7%
100
001 4 6 8 10 12 14 16 18 20
YEAR
Figure 2. Cost Alternatives with 100 MMBF.
14

500
450/
400/
350
300
W OCD
250
WI /
200
ml Q
__TIM BER VOLUMES50 MMBF
DISCOUNT RATE 10%INFLATION RATE7h
50
0
0 2 4 6 8 10 12 14 16 18 20
YEAR
Figure 3. Cost Alternatives with 50 MMBF.
15
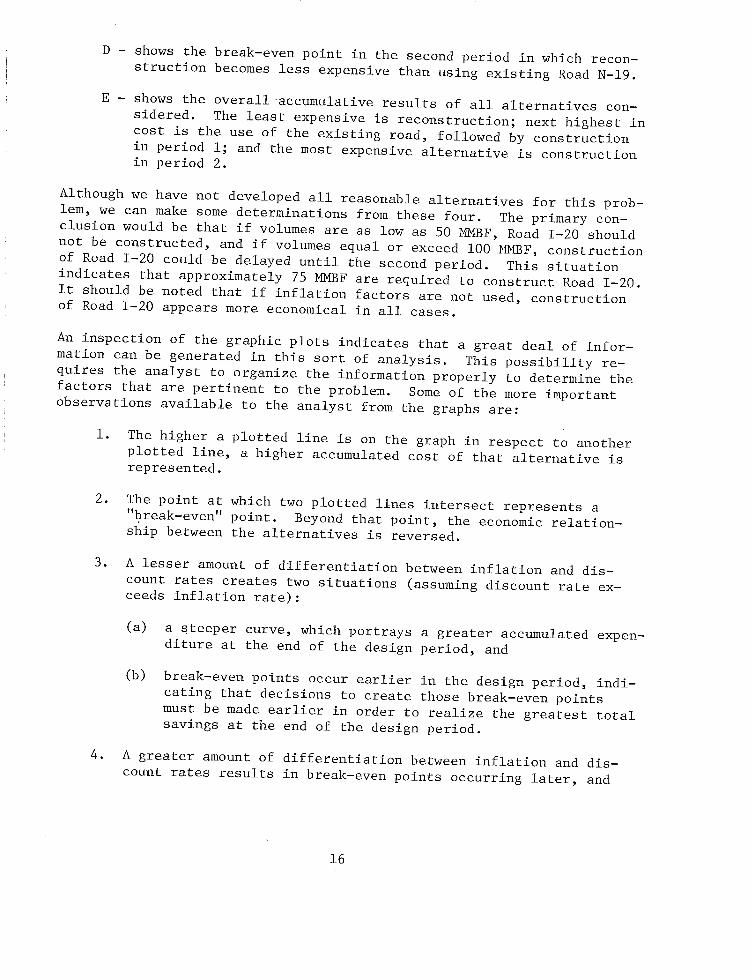
D - shows the break-even point in the second period in whichrecon-structionbecomes less expensive than using existing Road N-19.
E - shows the overall accumulative results of all alternativescon-sidered.The least expensive is reconstruction next highest incost is the use of the existing road followed by constructionin period 1 and the most expensive alternative is constructionin period 2.
Although we have not developed all reasonable alternatives for thisprob-lemwe can make some determinations from these four. The primarycon-clusionwould be that if volumes are as low as 50 MMBF Road 1-20 shouldnot be constructed and if volumes equal or exceed 100 MMBF constructionof Road 1-20 could be delayed until the second period. This situationindicates that approximately 75 MMBF are required to construct Road 1-20.
It should be noted that if inflation factors are not used constructionof Road 1-20 appears more economical in all cases.
An inspection of the graphic plots indicates that a great deal ofinfor-mationcan be generated in this sort of analysis. This possibilityre-quiresthe analyst to organize the information properly to determine the
factors that are pertinent to the problem. Some of the more importantobservations available to the analyst from the graphs are
1. The higher a plotted line is on the graph in respect to another
plotted line a higher accumulated cost of that alternative is
represented.
2. The point at which two plotted lines intersect represents abreak-even point. Beyond that point the economicrelation-shipbetween the alternatives is reversed.
3. A lesser amount of differentiation between inflation anddis-countrates creates two situations assuming discount rateex-ceedsinflation rate
a a steeper curve which portrays a greater accumulatedexpen-ditureat the end of the design period and
b break-even points occur earlier in the design periodindi-catingthat decisions to create those break-even points
must be made earlier in order to realize the greatest total
savings at the end of the design period.
4. A greater amount of differentiation between inflation anddis-countrates results in break-even points occurring later and
16
there is less cost difference if decisions that result in suchbreak-even points are delayed.
5. A greater total timber volume for the entire design periodre-sultsin earlier occurrence of break-even points because the
greater volume occurs early in the design period.
6. A lesser total timber volume makes early decisions morecriti-calsince few break-even points occur.
7. If there is a greater total timber volume a late decision maybe made and a break-even point may occur however delay inmaking a decision can cause a substantial increase in cost.
8. Break-even points occur earliest if there is a combination oflesser differentiation between inflation rate and discountrates with a greater amount of timber volume and the greatestcost differences between alternatives at the end of the designperiod result from that situation.
9. Break-even points occur late and are scarce if there is acom-binationof greater differentiation between inflation rate anddiscount rates with a lesser amount of timber volume and lesscost differences between alternatives are noted in that situation.
CONCLUSION
The graphic analysis of alternatives in developing construction schedulesprovides the decision-maker with an array of costs and relationships whichmay occur as a result of changes in scheduling selection of projects andtimber volumes. By recognizing the array extremes the decision-maker canestablish a range of feasibility and desirability limits as a basis formaking a decision.
17
IWASHINGTON OFFICE NEWS
CONSULTATION AND STANDARDS
Walter E. FurenAssistant Director
CADASTRAL ENGINEERING
As a result of recommendation of the Regional Engineers Meeting held
November 1-2 1977 a work group met in Washington D.C. January 16-19to develop an action plan to respond to the increasing cadastral funding.
The work group consisted of four Regional Directors of Engineering or
their Assistants three Regional Directors of Lands or their Assistants
two Regional Land Surveyors and several staff members from WashingtonOffice in Lands and Engineering.
The cadastral program has increased from $4.9 million in FY 1977 to $13.8
million in FY 1978 with further increases expected in the future. The
groups findings and recommendations will be out in the form of a Forest
Service Cadastral Survey Action Plan very soon.
The major action items will be
1. Staffing to accomplish the program.2. Training for short- and long-term needs.
3. Providing a career ladder for personnel in cadastral work.
4. Policy direction to re-emphasize the landline program.5. Cooperation with adjoiners.6. Awareness of cadastral engineering needs and educationassis-tancefor field personnel at all levels.
The RPA backlog coupled with a Cadastral Engineering Audit Report
60315-1-SF July 20 1977 has highlighted the need for accelerated
action in these areas.
The new Amendment No. 45 of FSM Section 7150 September 1977 should be
helpful in supporting an increased program. A Land Surveying Handbook
FSH 7109.15 has been started but it will not be available until about
the middle of FY 1979.
18
A joint FS/BLM Survey Equipment Seminar was planned for the weeks of
March 13-24 1978 to acquaint cadastral engineering personnel on how tobest involve new equipment and survey systems in the increased program.New survey technology is developing very fast and it is felt that thisfactor could become one of our biggest program assets in the next fewyears. We are continuing to monitor such development and will publishinformation as it becomes available.
19
OPERATIONS
Harold L. StricklandAssistant Director
RESOURCE INFORMATION DISPLAY SYSTEM RIDS
The goals of RIDS Project and its planned development were outlined inthe July 1977 issue of Field Notes.
A work plan which outlines the complete RIDS Project has been developedand on September 26 1977 was approved by Deputy Chief T.C. Nelson.Copies were sent to all Regional Foresters Station Directors AreaDirectors and WO Staff Directors.
As outlined in our first report in Field Notes the RIDS short rangeobjective consists of analyzing the existing seven grid and three polygonsystems and assemblying a system with an option to use either the GRIDor POLYGON method. Both methods are needed because of the differentaccuracy requirements for various types studied and the difference incost between the two methods. The GRID method is cheaper to use but isnot as accurate as the POLYGON method.
The RIDS team chose to investigate the seven grid systems first sincethey are the most widely used. User needs criteria which were definedat a users workshop in May 1977 was used along with existing user andsystem documentation to eliminate all but two of the currently usedsystems. A list of the seven grid systems and the percent of user needsprovided by each are as follows
MIADS2 - 53 percentLIM - 60 percentR3MAP - 38 percentR10MAP - 43 percentMAPIT - 60 percentCONGRID - 79 percentRAP - 87 percent
A plan was prepared to test and evaluate CONGRID and RAP the two systemswhich met most of the user needs. The plan consisted of test methods andcriteria as well as test evaluation criteria. These were developed bythe RIDS team with assistance from the Land Management Planning Staff
20
Unit of the Washington Office. The two systems were tested at the same
time and the team attempted to produce the same results from the two
systems. Time and cost figures were recorded for each run to be used in
the system evaluation. A detailer from Region 2 familiarwith the
needs of the land use planning activity reviewed the teams testing
procedures and evaluation criteria to assure that no major items had beenoverlooked. When all of the tests had been run and evaluations made the
Resource Analysis Procedure RAP system was chosen as the best ForestService grid type system available to meet existing user needs.
An evaluation report which contains recommendations for the Systems
Coordinating Council and for Deputy Chief T.C. Nelson is in rough draft
form. The RIDS team will make the recommendation that RAP be adopted as
the Service-wide grid type processing system.
The RAP system is currently being used by SPF in Region 4 and in the
Northeastern Area but the original user instructions are very difficultto understand. A revised users manual has been prepared by the RIDSteam and is being finalized for distribution. In order to test there-visedusers manual the RIDS team is working with Region 9 on a projecta 200000-acre planning unit on the Green Mountain National Forest. This
project which consists of six layers of information will be completelyprocessed at the Forest level using the new user instruction andmoni-toredby the RIDS team.
The RIDS team has just begun to investigate the three polygon systems
WRIS PLOT COMLUP. Only two of these systems WRIS and PLOT arecur-rentlyrunning on Service-wide equipment so the selection of the polygonprocessor will be somewhat simpler.
A projected date for completion of the RIDS short range phase is late
August 1978. With the addition of William Ubbens a Computer Specialistto the RIDS team the team should be able to meet this scheduled target
completion date. If you are interested in being kept posted on the
progress of the RIDS project or have comments suggestions orques-tionsplease contact the Project Leader Tom George at FTS 235-2306.
21

INVITATION TO READERS OFFIELD NOTES
Every reader is a potential author of an article for Field Notes. If you have a news item or
short article you would like to share with Service engineers we invite you to send it for
publication in Field Notes.
Material submitted to the Washington Office for publication should be reviewed by the
respective Regional Office to see that the information is current timely technicallyaccu-rateinformative and of interest to engineers Service-wide FSM 7113. The length of
material submitted may vary from several short sentences to several typewritten pageshowever short articles or news items are preferred. All material submitted to theWashing-tonOffice should be typed double-spaced all illustrations should be original drawings or
glossy black and white photos.
Field Notes is distributed from the Washington Office directly to all Regional Station and
Area Headquarters Forests and Forest Service retirees. If you are not currently on the
mailing list ask your Office Manager or the Regional Information Coordinator to increase
the number of copies sent to your office. Copies of back issues are also available from the
Washington Office.
Each Region has an Information Coordinator to whom field personnel should submit both
questions and material for publication. The Coordinators are
R-I Melvin Dittmer R-4 Ted Wood R-9 Fred Hintsala
R-2 Royal M. Ryser R-5 Jim McCoy R-10 F. W. Baxandall
R-3 Juan Gomez R-6 Kjell Bakke WO Al ColleyR-8 Bob Bowers
Coordinators should direct questions concerning format editing publishing dates and other
problems to
USDA Forest Service
Engineering Staff Rm. 1108 RP-E
Attn Gordon L. Rome or Rita E. Wright
P.O.Box2417Washington D.C. 20013
Telephone Area Code 703-235-8198
U.S. GOVERNMENT PRINTING OFFICE 1978 0-211-474/FS-42


Related Documents