Newnes Engineering Materials Pocket Book W. Bolton Heinemann Newnes

Welcome message from author
This document is posted to help you gain knowledge. Please leave a comment to let me know what you think about it! Share it to your friends and learn new things together.
Transcript

Newnes Engineering Materials Pocket Book W. Bolton
Heinemann Newnes

Heinemann Newnes An imprint of Heinemann Professional Publishing Ltd Halley Court, Jordan Hill, Oxford 0X2 8EJ
OXFORD LONDON MELBOURNE AUCKLAND SINGAPORE IBADAN NAIROBI GABORONE KINGSTON
First published 1989
©W. Bolton 1989
British Library Cataloguing in Publication Data ISBN 0 434 90113 X Bolton, W. (William) 1933-
Newnes engineering materials pocket book. 1. Materials I. Title 620.1Ί
ISBN 0 434 90113
Typeset by Electronic Village Ltd, Richmond Printed by Courier International
Preface The main aim of this book is to provide engineers and students with a concise, pocket-size, affordable guide to the full range of materials used in engineering: ferrous and non-ferrous metals, polymeric materials, ceramics and composites. It is seen as being particularly useful to students engaged on project work. Obviously no book this size, or even any single book, can be completely exhaustive and so the selection of materials has been restricted to those most commonly encountered in engineering and those details of properties most relevant to the general use of the materials. The book is not intended to replace the more detailed specifications given by the national and international standards groups.
To aid in interpreting the information given for the properties of materials, Chapter 1 gives a brief description of the main terms likely to be encountered, Chapter 2 gives an outline of the main testing methods and the Appendix lists conversion factors and tables for the various forms of units used to describe properties. The bulk of the book, Chapters 3 to 11, is devoted to the main engineering materials: ferrous, aluminium, copper, magnesium, nickel and titanium alloys, polymeric, ceramic and composite materials. In most cases, the chapters are broken down into five sections: a discussion of the materials, details of coding systems and composi-tions, heat treatment information, the properties of the materials, and typical uses to which they have been put. The codes and data given are for both American and British standards. To aid in selec-tion, Chapter 12 gives comparisons of the properties of the different materials.
The book is essentially concerned with properties and there is only a very brief indication of the science of materials. For further infor-mation on materials science the reader is referred to textbooks, such as:
Anderson, J.C., Leaver, K.D., Rawlings, R.D. and Alex-ander, J.M. (1985). Materials Science. (3rd Ed. Van Nostrand.) Bolton, W. (1989). Engineering Materials Technology. (Heinemann.) Mills, N.N. (1986). Plastics: Microstructure, Properties and Applications. (Arnold.) Smith, W.F. (1981) Structure and Properties of Engineering Alloys. (McGraw-Hill.)
The data used in this book have been obtained from a wide variety of sources. The main sources are:
The publications of the British Standards Institution The publications of the American Society of Metals Materials Manufacturers Trade Associations
The interpretations and presentation of the data are however mine and should not be deemed to be those of any other organisation. For full details of standards, the reader is advised to consult the appropriate publications of the standards setting group.
W. Bolton

Acknowledgements Extracts from British Standards are reproduced with the permission of BSI. Complete copies of the documents can be obtained by post from BSI Sales, Linford Wood, Milton Keynes, Bucks MK14 6LE.

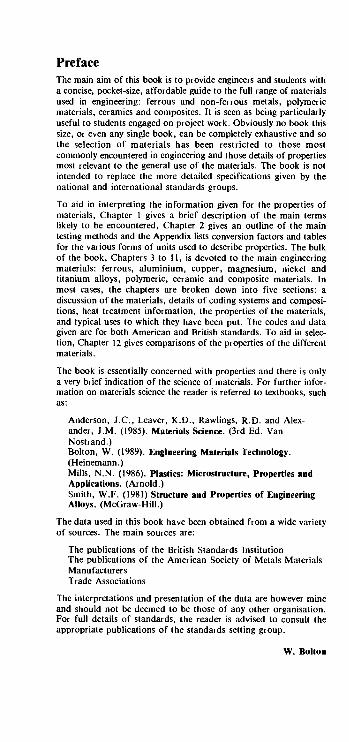
1 Terminology The following, in alphabetical order, are definitions of the common terms used in engineering in connection with the properties of materials. Additives. Plastics and rubbers almost invariably contain, in addi-tion to the polymer or polymers, other materials, i.e additives. These are added to modify the properties and cost of the material. Ageing. This term is used to describe a change in properties that occurs with certain metals at ambient or moderately elevated temperatures after hot working, a heat treatment process or cold working. The change is generally due to precipitation occurring, there being no change in chemical composition. Alloy. This is a metallic material composed of two or more elements of which at least one is a metal. Amorphous. An amorphous material is a non-crystalline material, i.e. it has a structure which is not orderly. Annealing. This involves heating to, and holding at, a temperature which is high enough to result in a softened state for a material after a suitable rate of cooling, generally slowly. In the case of ferrous alloys the required temperature is the upper critical temperature. The purpose of annealing can be to facilitate coid working, improve machinability, improve mechanical properties, etc. Anodizing. This term is used to describe the process, generally with aluminium, whereby a coating is produced on the surface of the metal by converting it to an oxide. A tactic structure. A polymer structure in which side groups, such as CH3, are arranged randomly on either side of the molecular chain. Austempering. This is a heat treatment used with ferrous alloys. The material is heated to austenizing temperature and then quenched to the Ms temperature at such a rate that ferrite or pearlite is not formed. It is held at the Ms temperature until the transformation to bainite is complete. Austenite. This term describes the structure of a solid solution of one or more elements in a face-centred cubic iron crystalline struc-ture. It usually refers to the solid solution of carbon in the face-centred iron. Austenitizing. This is when a ferrous alloy is heated to a temperature at which the transformation of its structure to austenite occurs. Bainite. This describes a form of ferrite-cementite structure consisting of ferrite plates between which, or inside which, short cementite rods form, and occurs when ferrous alloys are cooled from the austenitic state at an appropriate rate of cooling. It is a harder structure than would be obtained by annealing but softer than martensite. The process used is called austempering. Bend, angle of. The results of a bend test on a material are specified in terms of the angle through which the material can be bent without breaking (Figure 1.1). The greater the angle the more ductile the material. See Bend test, Chapter 2.
180° bend Close bend
Figure 1.1 The angle of bend
Brinell number. The Brinell number is the number given to a material as a result of a Brinell test (see Hardness measurement, Chapter 2) and is a measure of the hardness of a material. The

2
larger the number the harder the material. Brittle failure. With brittle failure a crack is initiated and propagates prior to any significant plastic deformation. The fracture surface of a metal with a brittle fracture is bright and granular due to the reflection of light from individual crystal surfaces. With polymeric materials the fracture surface may be smooth and glassy or somewhat splintered and irregular. Brittle material. A brittle material shows little plastic deformation before fracture. The material used for a china teacup is brittle. Thus because there is little plastic deformation before breaking, a broken teacup can be stuck back together again to give a cup the same size and shape as the original. Carburizing. This is a form of case hardening which results in a hard surface layer being produced with ferrous alloys. The treatment involves heating the alloy to the austenitic state in a carbon-rich atmosphere so that carbon diffuses into the surface layers, then quenching to convert the surface layers to martensite. Case hardening. This term is used to describe processes in which by changing the composition of surface layers of ferrous alloys a hardened surface layer can be produced. See Carburizing and Nitriding. Cementite. This is a compound formed between iron and carbon, often referred to as iron carbide. It is a hard and brittle material. Charpy test value. The Charpy test, see Impact tests Chapter 2, is used to determine the response of a material to a high rate of loading and involves a test piece being struck a sudden blow. The results are expressed in terms of the amount of energy absorbed by the test piece when it breaks. The higher the test value the more ductile the material. Cis structure. A polymer structure in which a curved carbon backbone is produced by bulky side groups, e.g. CH3, which are grouped all on the same side of the backbone. Compressive strength. The compressive strength is the maximum compressive stress a material can withstand before fracture. Copolymer. This is a polymeric material produced by combining two or more monomers in a single polymer chain. Corrosion resistance. This is the ability of a material to resist deterioration by chemical or electrochemical reaction with its immediate environment. There are many forms of corrosion and so there is no unique way of specifying the corrosion resistance of a material. Creep. Creep is the continuing deformation of a material with the passage of time when it subject to a constant stress. For a particular material the creep behaviour depends on both the temperature and the initial stress, the behaviour also depending on the material concerned. See Creep tests, Chapter 2. Creep modulus. The initial results of a creep test are generally represented as a series of graphs of strain against time for different levels of stress. From these graphs values, for a particular time, of strains at different stresses can be obtained. The resulting stress-strain values can be used to give a stress-strain graph for a particular time, such a graph being referred to as an isochronous stress-strain graph. The creep modulus is the stress divided by the strain, for a particular time. The modulus is not the same as the tensile modulus. See Creep tests, Chapter 2. Creep strength. The creep strength is the stress required to produce a given strain in a given time. Crystalline. This term is used to describe a structure in which there is a regular, orderly, arrangement of atoms or molecules. Damping capacity. The damping capacity is an indicator of the

3
ability of a material to suppress vibrations. Density. Density is mass per unit volume. Dielectric constant. See permittivity. Dielectric strength. The dielectric strength is a measure of the highest potential difference an insulating material can withstand without electric breakdown.
rv . . . . .. breakdown voltage Dielectric strength -- - - .
insulator thickness
Ductile failure. With ductile failure there is a considerable amount of plastic deformation prior to failure. With metals the fracture shows a typical cone and cup formation and the fracture surfaces are rough and fibrous in appearance. Ductile materials. Ductile materials show a considerable amount of plastic deformation before breaking. Elastic limit. The elastic limit is the maximum force or stress at which, on its removal, the material returns to its original dimen-sions. For many materials the elastic limit and the limit of propor-tionality are the same, the limit of proportionality being the maximum force for which the extension is proportional to the force or the maximum stress for which the strain is proportional to the stress. See Tensile tests, Chapter 2. Electrical conductivity. The electrical conductivity is a measure of the electrical conductance of a material, the bigger the conductance the greater the current for a particular potential difference. The elec-trical conductivity is defined by
length conductivity =
resistance x cross-sectional area '
1 conductance =
resistance Conductance has the unit of ohm- 1 or mho, conductivity has the unit Ω-1 m- 1 . The I ACS specification of conductivity is based on 100%, corresponding to the conductivity of annealed copper at 20°C; all other materials are then expressed as a percentage of this value. Electrical resistivity. The electrical resistivity is a measure of the elec-trical resistance of a material, being defined by
. . ., resistance x cross-sectional area resistivity = . length
Resistivity has the unit Ω m. Endurance. The endurance is the number of stress cycles to cause failure. See Fatigue tests, Chapter 2. Endurance limit. The endurance limit is the value of the stress for which a test specimen has a fatigue life of N. cycles. See Fatigue tests, Chapter 2. Equilibrium diagram. This diagram is, for metals, constructed from a large number of experiments, in which cooling curves are deter-mined for the whole range of alloys in a group, and provides a forecast of the states that will be present when an alloy of a specific composition is heated or cooled to a specific temperature. Expansion, coefficient of linear. The coefficient of linear expansion is a measure of the amount by which a unit length of a material will expand when the temperature rises by one degree. It is defined by
change in length linear expansivity = .
length x temperature change It has the unit 0C"1 or K"1.

4
Expansivity, linear. This is an alternative name for the coefficient of linear expansion. Fatigue life. The fatigue life is the number of stress cycles to cause failure. See Fatigue tests, Chapter 2. Fatigue limit. The fatigue limit is the value of the stress below which the material will endure an infinite number of cycles. See Fatigue tests, Chapter 2. Fatigue strength. The fatigue strength at N cycles is the value of the stress under which a test specimen has a life of TV cycles. See Fatigue tests, Chapter 2. Ferrite. This is a solid solution of one or more elements in body-centred cubic iron. It is usually used for carbon in body-centred cubic iron. Ferrite is comparatively soft and ductile. Fracture toughness. The plane strain fracture toughness or opening-mode fracture toughness, Kjc, represents a practical lower limit of fracture toughness and is an indicator of whether a crack will grow or not. Friction, coefficient of. The coefficient of friction is the maximum value of the frictional force divided by the normal force. In the situation where an object is to be started into motion, the maximum frictional force is the force needed to start the object sliding. Where an object is already in motion, the frictional force is that needed to keep it moving with a constant velocity. This is less than the fric-tional force needed to start sliding and so there are two coefficients of friction, a static coefficient and a dynamic coefficient, with the static coefficient larger than the dynamic coefficient. Full hard. This term is used to describe the temper of alloys. It corresponds to the cold-worked condition beyond which the material can no longer be worked. Glass transition temperature. The glass transition temperature is the temperature at which a polymer changes from a rigid to a flexible material. The tensile modulus shows an abrupt change from the high value typical of a glass-like material to the low value of a rubber-like material. Half hard. This term is used to describe the temper of alloys. It corresponds to the cold-worked condition half-way between soft and full hard. Hardenability. The term hardenability of a material is used as a measure of the depth of hardening introduced into a material by quenching (see Hardenability, Chapter 2). Hardening. This describes a heat treatment by which hardness is increased. Hardness. The hardness of a material may be specified in terms of some standard test involving indentation, e.g. the Brinell, Vickers and Rockwell tests, or scratching of the surface of the material, the Moh test. See Hardness measurement, Chapter 2. Heat distortion/deflection temperature. This is the temperature at which a strip of polymeric material under a specified load shows a specified amount of deflection. Heat-resisting alloy. This is an alloy developed for use at high temperatures. Homopolymer. This describes a polymer that has molecules made up of just one monomer. Hooke's law. When a material obeys Hooke's law its extension is directly proportional to the applied stretching forces. See Tensile tests in Chapter 2. impact properties. See Charpy test value and Izod test value, also Impact tests in Chapter 2. Isochronous stress-strain graph. See the entry on Creep modulus. Isotactic structure. A polymer structure in which side groups of
5
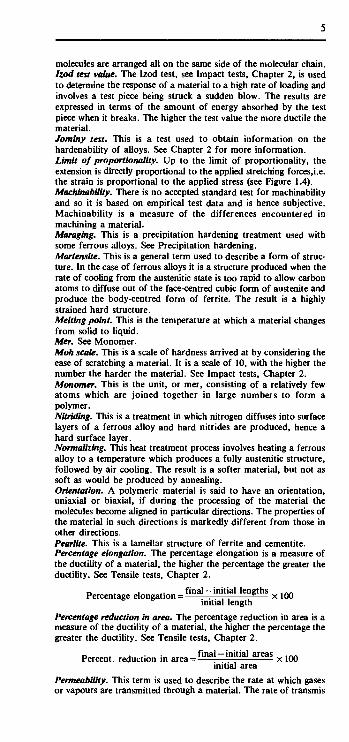
molecules are arranged all on the same side of the molecular chain. hod test value. The Izod test, see Impact tests, Chapter 2, is used to determine the response of a material to a high rate of loading and involves a test piece being struck a sudden blow. The results are expressed in terms of the amount of energy absorbed by the test piece when it breaks. The higher the test value the more ductile the material. Jominy test. This is a test used to obtain information on the hardenability of alloys. See Chapter 2 for more information. Limit of proportionality. Up to the limit of proportionality, the extension is directly proportional to the applied stretching forces,i.e. the strain is proportional to the applied stress (see Figure 1.4). Machinability. There is no accepted standard test for machinability and so it is based on empirical test data and is hence subjective. Machinability is a measure of the differences encountered in machining a material. Maraging, This is a precipitation hardening treatment used with some ferrous alloys. See Precipitation hardening. Martensite. This is a general term used to describe a form of struc-ture. In the case of ferrous alloys it is a structure produced when the rate of cooling from the austenitic state is too rapid to allow carbon atoms to diffuse out of the face-centred cubic form of austenite and produce the body-centred form of ferrite. The result is a highly strained hard structure. Melting point. This is the temperature at which a material changes from solid to liquid. Mer. See Monomer. Moh scale. This is a scale of hardness arrived at by considering the ease of scratching a material. It is a scale of 10, with the higher the number the harder the material. See Impact tests, Chapter 2. Monomer. This is the unit, or mer, consisting of a relatively few atoms which are joined together in large numbers to form a polymer. Nitriding. This is a treatment in which nitrogen diffuses into surface layers of a ferrous alloy and hard nitrides are produced, hence a hard surface layer. Normalizing. This heat treatment process involves heating a ferrous alloy to a temperature which produces a fully austenitic structure, followed by air cooling. The result is a softer material, but not as soft as would be produced by annealing. Orientation. A polymeric material is said to have an orientation, uniaxial or biaxial, if during the processing of the material the molecules become aligned in particular directions. The properties of the material in such directions is markedly different from those in other directions. Pearlite. This is a lamellar structure of ferrite and cementite. Percentage elongation. The percentage elongation is a measure of the ductility of a material, the higher the percentage the greater the ductility. See Tensile tests, Chapter 2.
_ Λ . 4. final - initial lengths 1ΛΛ Percentage elongation = . . . , , -*— x 100 initial length
Percentage reduction in area. The percentage reduction in area is a measure of the ductility of a material, the higher the percentage the greater the ductility. See Tensile tests, Chapter 2.
„ „ . .. . final -initial areas w 1ΛΛ Percent, reduction in area = . . . . x 100 initial area Permeability. This term is used to describe the rate at which gases or vapours are transmitted through a material. The rate of transmis

6
sion per unit surface area of the material is given by: rate of transmission/area = P (p\ -pj)/L
where P is the permeability coefficient, p\ and p2 the pressures on each side of the material and L the material thickness. A variety of units are used for permeability values. In some the pressure is quoted in centimetres of mercury, in others in Pa or N m~2. The time might be in days or seconds. The rate may be quoted in terms of volumes in cubic centimetres (cm3) or mass in moles or kilograms (kg) or grams (g). Permittivity. The relative permittivity eT, or dielectric constant, of a material can be defined as the ratio of the capacitance of a capacitor with the material between its plates compared with that of the same capacitor with a vacuum.
where e is the absolute permittivity and eo the permittivity of free space, i.e. a vacuum. Plane strain fracture toughness. See fracture toughness. Poisson's ratio. Poisson's ratio is the ratio (transverse strain)/(longitudinal strain). Precipitation hardening. This is a heat treatment process which results in a precipitate being produced in such a way that a harder material is produced. Proof stress. The 0.2% proof stress is defined as that stress which results in a 0.2% offset,i.e. the stress given by a line drawn on the stress-strain graph parallel to the linear part of the graph and passing through the 0.2% strain value (Figure 1.2). The 0.1% proof stress is similarly defined. Proof stresses are quoted when a material has no well defined yield point. See Tensile tests, Chapter 2.
Proof 0.2% stress 0.1 %
1)
55
/ ' /
/ < ; /
/ ; / / / / L I i
0 0.1% 0.2% Strain
Figure 1.2 Determination of proof stress
Quenching. This is the method used to produce rapid cooling. Recovery, fractional. The fractional recovery is defined as the strain recovered divided by the creep strain, when the load is removed. Recrystallization. This is generally used to describe the process whereby a new, strain free grain structure is produced from that existing in a cold-worked metal by heating. Refractive index. The refractive index of a material is the ratio (speed of light in a vacuum)/(speed of light in the material). For some materials the speed of light depends on the direction through the material the light is traversing and so the refractive index varies with direction. Relative permeability. This is a measure of the magnetic properties
7
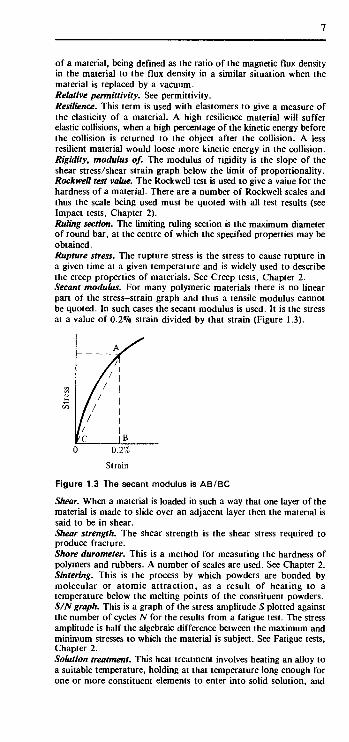
of a material, being defined as the ratio of the magnetic flux density in the material to the flux density in a similar situation when the material is replaced by a vacuum. Relative permittivity. See permittivity. Resilience. This term is used with elastomers to give a measure of the elasticity of a material. A high resilience material will suffer elastic collisions, when a high percentage of the kinetic energy before the collision is returned to the object after the collision. A less resilient material would loose more kinetic energy in the collision. Rigidity, modulus of. The modulus of rigidity is the slope of the shear stress/shear strain graph below the limit of proportionality. Rockwell test value. The Rockwell test is used to give a vaiue for the hardness of a material. There are a number of Rockwell scales and thus the scale being used must be quoted with all test results (see Impact tests, Chapter 2). Ruling section. The limiting ruling section is the maximum diameter of round bar, at the centre of which the specified properties may be obtained. Rupture stress. The rupture stress is the stress to cause rupture in a given time at a given temperature and is widely used to describe the creep properties of materials. See Creep tests, Chapter 2. Secant modulus. For many polymeric materials there is no linear part of the stress-strain graph and thus a tensile modulus cannot be quoted. In such cases the secant modulus is used. It is the stress at a value of 0.2% strain divided by that strain (Figure 1.3).
re jB 0 0.2%
Strain
Figure 1.3 The secant modulus is AB/BC
Shear. When a material is loaded in such a way that one layer of the material is made to slide over an adjacent layer then the material is said to be in shear. Shear strength. The shear strength is the shear stress required to produce fracture. Shore durometer. This is a method for measuring the hardness of polymers and rubbers. A number of scales are used. See Chapter 2. Sintering. This is the process by which powders are bonded by molecular or atomic attraction, as a result of heating to a temperature below the melting points of the constituent powders. S/N graph. This is a graph of the stress amplitude S plotted against the number of cycles N for the results from a fatigue test. The stress amplitude is half the algebraic difference between the maximum and minimum stresses to which the material is subject. See Fatigue tests, Chapter 2. Solution treatment. This heat treatment involves heating an alloy to a suitable temperature, holding at that temperature long enough for one or more constituent elements to enter into solid solution, and
8
then cooling rapidly enough for these to remain in solid solution. Specific gravity. The specific gravity of a material is the ratio of its density compared with that of water.
c . f . u density of material Specific gravity = —-—' 1 . density of water Specific heat capacity. The amount by which the temperature rises for a material, when there is a heat input depends on its specific heat capacity. The higher the specific heat capacity the smaller the rise in temperature per unit mass for a given heat input.
heat input Specific heat capacity = ; .
mass x change in temperature Specific heat capacity has the unit J kg -1 K"1. Spheroidizing. This is a treatment used to produce spherical or globular forms of carbide in steel. Strain. The engineering strain is defined as the ratio (change in length)/(original length) when a material is subject to tensile or compressive forces. Shear strain is the ratio (amount by which one layer slides over another)/(separation of the layers). Because it is a ratio, strain has no units, though it is often expressed as a percen-tage. Shear strain is usually quoted as an angle in radians. Strain hardening. This is an increase in hardness and strength produced as a result of plastic deformation at temperatures below the recrystallization temperature, i.e. cold working. Strength. See Compressive strength, Shear strength and Tensile strength. Stress. In engineering tensile and compressive stress is usually defined as (force)/(initial cross-sectional area). The true stress is (force)/(cross-sectional area at that force). Shear stress is the (shear force)/(area resisting shear). Stress has the unit Pa (pascal) or N m - 2
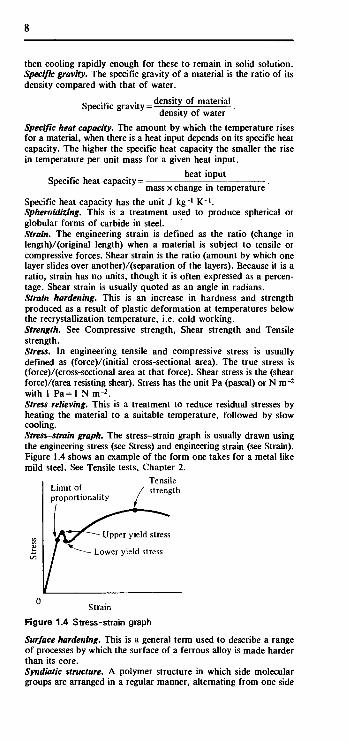
with 1 P a = l N m"2. Stress relieving. This is a treatment to reduce residual stresses by heating the material to a suitable temperature, followed by slow cooling. Stress-strain graph. The stress-strain graph is usually drawn using the engineering stress (see Stress) and engineering strain (see Strain). Figure 1.4 shows an example of the form one takes for a metal like mild steel. See Tensile tests, Chapter 2.
Tensile Limit of / strength proportionality
- Upper yield stress
Lower yield stress
Strain
Figure 1.4 Stress-strain graph
Surface hardening. This is a general term used to describe a range of processes by which the surface of a ferrous alloy is made harder than its core. Syndiatic structure. A polymer structure in which side molecular groups are arranged in a regular manner, alternating from one side

9
to the other of the molecular chain. Temper. This term is used with non-ferrous alloys as an indication of the degree of hardness/strength, with expressions such as hard, half-hard, three-quarters hard being used. Tempering. This is the heating of a previously quenched material to produce an increase in ductility. Tensile modulus. The tensile modulus, or Young's modulus, is the slope of the stress-strain graph over its initial straight-line region (Figure 1.5). See Tensile tests, Chapter 2.
/ A / l
/ ' / ' 4- 4 c B
Strain
Figure 1.5 The tensile modulus is AB/BC
Tensile strength. This is defined as (maximum force before breaking)/ (initial cross-sectional area). See Figure 1.4. See Tensile tests, Chapter 2. Thermal conductivity. The rate at which energy is transmitted as heat through a material depends on a property called the thermal conductivity. The higher the thermal conductivity the greater the rate at which heat is conducted. Thermal conductivity is defined by
rate of transfer of heat thermal conductivity = ; — .
cross-sectional area x temp, gradient Thermal conductivity has the unit W m - 2 K-1. Thermal expansivity. See Expansion, coefficient of linear. Transmission factor, direct. The direct transmission factor is the ratio (transmitted light flux)/(incident light flux). It is usually expressed as a percentage. Because the transmission factor depends on the thickness of the material, results are usually standardized to a thickness of 1 mm. For some materials this can mean a transmis-sion factor of virtually 0 °/o for 1 mm when they are not completely opaque for smaller thicknesses. Transition temperature. The transition temperature is the temperature at which a material changes from giving a ductile failure to giving a brittle failure. Trans structure. A polymer structure in which a relatively straight stiff carbon backbone is produced by CH3 groups alternating from one side to the other of the backbone. Vickers' test results. The Vickers test is used to give a measure of hardness (see Hardness measurement, Chapter 2). The higher the Vickers hardness number the greater the hardness. Water absorption. This is the percentage gain in weight of a polymeric material, after immersion in water for a specified amount of time, under controlled conditions. Wear resistance. This is a subjective comparison of the wear resistance of materials. There is no standard test. Weldability. The weldability of a particular combination of metals indicates the ease with which sound welds can be made. Work hardening. This is the hardening of a material produced as a

10
consequence of working, subjecting it to plastic deformation at temperatures below those of recrystallization. Yield point. For many metals, when the stretching forces applied to a test piece are steadily increased, a point is reached when the exten-sion is no longer proportional to the applied forces and the exten-sion increases more rapidly than the force, until a maximum force is reached. This is called the upper yield point. The force then drops to a value called the lower yield point before increasing again as the extension is continued (see Figure 1.4). See Tensile tests, Chapter 2. Young's modulus. See Tensile modulus.
2 Test methods The following are some of the more common test methods used to determine the properties of materials used in engineering.
Bend tests The bend test is a simple test of ductility. It involves bending a sample of the material through some angle and determining whether the material is unbroken and free from cracks after such a bend. The results of such a test are specified in terms of the angle of bend (see Figure 1.1).
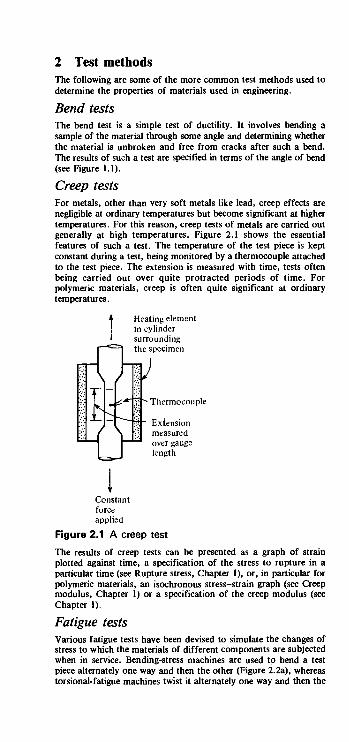
Creep tests For metals, other than very soft metals like lead, creep effects are negligible at ordinary temperatures but become significant at higher temperatures. For this reason, creep tests of metals are carried out generally at high temperatures. Figure 2.1 shows the essential features of such a test. The temperature of the test piece is kept constant during a test, being monitored by a thermocouple attached to the test piece. The extension is measured with time, tests often being carried out over quite protracted periods of time. For polymeric materials, creep is often quite significant at ordinary temperatures.
Heating element in cylinder surrounding the specimen
Thermocouple
Constant force applied
Figure 2.1 A creep test
The results of creep tests can be presented as a graph of strain plotted against time, a specification of the stress to rupture in a particular time (see Rupture stress, Chapter 1), or, in particular for polymeric materials, an isochronous stress-strain graph (see Creep modulus, Chapter 1) or a specification of the creep modulus (see Chapter 1).
Fatigue tests Various fatigue tests have been devised to simulate the changes of stress to which the materials of different components are subjected when in service. Bending-stress machines are used to bend a test piece alternately one way and then the other (Figure 2.2a), whereas torsional-fatigue machines twist it alternately one way and then the

12
opposite way (Figure 2.2b). Another type of machine is used to produce alternating tension and compression by direct stressing (Figure 2.2c). The tests can be carried out with stresses which alter-nate about zero stress (Figure 2.2d), apply a repeated stress which varies from zero to some maximum value (Figure 2.2e) or apply a stress which varies about some stress value and does not reach zero at all (Figure 2.20- The aim of the test is to subject the material to the types of stresses to which it will be subjected in service.
Z^ZT
/ /
'4
* <■
y yi
'//
y\
ΖΛ
/\ ZJ
-Z l_
(a)
= = £ (b)
f
1
(c)
1 cycle Stress amplitude
Time I Stress range
Stress amplitude
Mean T Stress stress 1 range
1 cycle Stress amplitude \ - r rK /K y T-
Mean Stress stress! r a n g e
Figure 2.2 Fatigue testing (a) Bending, (b) torsion, (c) direct stress, (d) alternating stress, (e) repeated stress, (f) fluctuating stress
Fatigue test results can be expressed as an S/N graph (see Chapter 1), a specification of the fatigue limit (see Chapter 1) or the endurance limit for TV cycles (see Chapter 1).
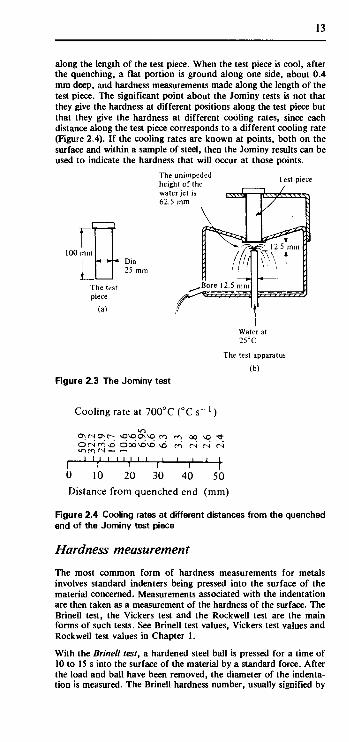
Hardenability Hardenability is measured by the response of a standard test piece to a standard test, called the Jominy test. This involves heating the steel test piece to its austenitic state, fixing it in a vertical position and then quenching the lower end by means of a jet of water (Figure 2.3). This method of quenching results in different rates of cooling
13
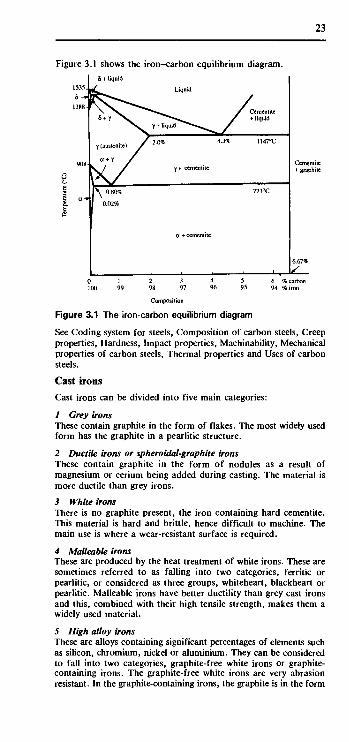
along the length of the test piece. When the test piece is cool, after the quenching, a flat portion is ground along one side, about 0.4 mm deep, and hardness measurements made along the length of the test piece. The significant point about the Jominy tests is not that they give the hardness at different positions along the test piece but that they give the hardness at different cooling rates, since each distance along the test piece corresponds to a different cooling rate (Figure 2.4). If the cooling rates are known at points, both on the surface and within a sample of steel, then the Jominy results can be used to indicate the hardness that will occur at those points.
The unimpeded height of the water jet is I«AV<SJ 62.5 mm
Test piece
Ll Dia 25 mm
The test piece
(a)
The test apparatus
(b) Figure 2.3 The Jominy test
Cooling rate at 700°C (°C s 1 )
CPsrNOsr- VOMDOSO ro m oo vo J" O r J CO O ÖOOMDVO VO CO ( N ( N ( N v n c o ΓΝΙ —i —<
I 1 I l l l I I I I I I I
10 20 30 0 10 20 30 40 50
Distance from quenched end (mm)
Figure 2.4 Cooling rates at different distances from the quenched end of the Jominy test piece
Hardness measurement
The most common form of hardness measurements for metals involves standard indenters being pressed into the surface of the material concerned. Measurements associated with the indentation are then taken as a measurement of the hardness of the surface. The Brinell test, the Vickers test and the Rockwell test are the main forms of such tests. See Brinell test values, Vickers test values and Rockwell test values in Chapter 1.
With the Brinell test, a hardened steel ball is pressed for a time of 10 to 15 s into the surface of the material by a standard force. After the load and ball have been removed, the diameter of the indenta-tion is measured. The Brinell hardness number, usually signified by

14
HB, is obtained by dividing the size of the force applied, by the spherical area of the indentation. This area can be obtained by calculation or the use of tables which relate the area to the diameter of the ball and the diameter of the indentation.
applied force Hardness = —-—:— ——-—
spherical surface area of indent
The units used for the area are mm2 and for the force kgf (1 kgf=9.8 N). The diameter D of the ball used and the size of the applied force F are chosen to give F/D2 values of 1, 5, 10 or 30, the diameters of the balls being 1, 2, 5 or 10 mm. In principle, the same value of F/D2 will give the same hardness value, regardless of the diameter of the ball used.
The Brinell test cannot be used with very soft or very hard materials. In the one case the indentation becomes equal to the diameter of the ball, and in the other case there is either no or little indentation on which measurements can be made. The thickness of the material being tested should be at least ten times the depth of the indenta-tion, if the results are not to be affected by the thickness of the sample.
The Vickers test uses a diamond indenter which is pressed for 10 to 15 s into the surface of the material under test. The result is a square-shaped impression. After the load and indenter are removed, the diagonals of the indentation are measured. The Vickers' hardness number, signified by HV, is obtained by dividing the size of the force applied by the surface area of the indentation. The surface area can be calculated, the indentation being assumed to be a right pyramid with a square base and a vertex angle of 136°, this being the vertex angle of the diamond. Alternatively, tables can be used to relate the diagonal values with the area.
The Vickers test has the advantage over the Brinell test of the increased accuracy that is possible in determining the diagonals of a square, as opposed to the diameter of a circle. Otherwise it has the same limitations as the Brinell test.
The Rockwell test uses either a diamond cone or a hardened steel ball as the indenter. A force of 90.8 N is applied to press the indenter into contact with the surface. A further force is then applied and causes an increase in depth of indenter penetration into the material. The additional force is then removed, and there is some reduction in the depth of the indenter due to the deformation of the material not being entirely plastic. The difference in the final depth of the indenter and the depth before the additional force was applied, is determined. This is the permanent increase in penetration (e) due to the additional force.
Hardness = E-e
where E is a constant determined by the form of the indenter. For the diamond cone indenter, E is 100; for the steel ball, E is 130.
There are a number of Rockwell scales, the scale being determined by the indenter and the additional force used. Table 2.1 indicates the scales and the types of materials for which each is typically used. In any reference to the results of a Rockwell test, signified by HR, the scale letter must be quoted. The B and C scales are probably the most commonly used for metals.

15
Table 2.1 Rockwell scales and typical applications Scale
A
B
C
D
E
F
G
H K
L M P R S V
Indenter
Diamond
Ball 1.588 mm dia.
Diamond
Diamond
Ball 3.175 mm dia.
Ball 1.588 mm dia.
Ball 1.588 mm dia.
Ball 3.175 mm dia. Ball 3.175 mm dia.
Ball 6.350 mm dia. Ball 6.350 mm dia. Ball 6.350 mm dia. Ball 12.70 mm dia. Ball 12.70 mm dia. Ball 12.70 mm dia.
Force Typical applications (kN)
0.59 Thin steel and shallow case-hardened steel
0.98 Copper alloys, aluminium alloys, soft steels
1.47 Steel, hard cast irons, deep case-hardened steel
0.98 Thin steel and medium case-hardened steel
0.98 Cast iron, aluminium, magnesium and bearing alloys
0.59 Annealed copper alloys, thin soft sheet metals, brass
1.47 Malleable irons, gun metals, bronzes, copper-nickel alloys
0.59 Aluminium, lead, zinc 1.47 Aluminium and magnesium
alloys 0.59 Plastics 0.98 Plastics 1.47 0.59 Plastics 0.98 1.47
For most commonly used indenters with the Rockwell test, the size of the indentation is rather small. Thus localized variations of struc-ture and composition can affect the result. However, unlike the Brinell and Vickers tests flat, polished surfaces are not required for accurate measurements.
The standard Rockwell test cannot be used with thin sheet; however a variation of the test, known as the Rockwell superficial hardness test, can be used. Smaller forces are used and the depth of inden-tation is determined with a more sensitive device, as much smaller indentations are used. An initial force of 29.4 N is used instead of 90.8 N. Table 2.2 lists the scales given by this test.
Table 2.2 Rockwell scales for superficial hardness Scale Indenter Additional force (kN)
0.14 0.29 0.44 0.14 0.29 0.44
The Brinell, Vickers and Rockwell tests can be used with polymeric materials. The Rockwell test, with its measurement of penetration, rather than surface area of indentation, is more widely used. Scale R is a commonly used scale.
The Shore durometer is used for measuring the hardness of polymers and elastomers, giving hardness values on a number of Shore scales. For the A scale, a truncated cone indenter is pressed against the material surface by a load of 8 N. The depth of the penetration of the indenter is measured. This must be done
15-N 30-N 45-N 15-T 30-T 45-T
Diamond Diamond Diamond Ball 1.588 mm dia. Ball 1.588 mm dia. Ball 1.588 mm dia.

16
immediately the load is applied since the value will change with time. For scale D, a rounded tip cone is used with a load of 44.5 N.
One form of hardness test is based on assessing the resistance of a material to being scratched. The Moh scale consists of ten materials arranged so that each one will scratch the one preceding it in the scale, but not the one that succeeds it.
1 2 3 4 5 6 7
Talc Gypsum Calcspar Fluorspar Apatite Felspar Quartz
8 Topaz 9 Corundum 10 Diamond
Ten styli of the materials in the scale are used for the test. The hardness number of a material under test is one number less than that of the substance that just scratches it.
Figure 2.5 shows the general range of hardness values for different materials when related to the Vickers, Brinell, Rockwell and Moh hardness scales. There is an approximate relationship between hardness values and tensile strengths. Thus for annealed steels the tensile strength in MPa (MN m-2) is about 3.54 times the Brinell hardness value, and for quenched and tempered steel 3.24 times the Brinell hardness value. For brass the factor is about 5.6, and for aluminium alloys about 4.2.
1000-
500-
200·
gj 100-c
•I 50 :± " 20-
10 -
5
1000 1-
500 \
200 I
1 10°
15o
20
10
L 5 J
120-
I 80
ä 60 40
0 1
x 130 = 120
| 100
o 80
* 40
υ 8 0i
| 60-
15 40 o a.
20
0
140
120
2 10° Ϊ 80
| 60
* 40
20-
Cutting tools
Cast irons
I Nitrided r steels
Easily machined steels
Brasses Aluminium alloys Magnesium alloys
Figure 2.5 Hardness scales and typical values
Impact tests There are two main forms of impact test, the Izod and Charpy tests (see Charpy test value and Izod test value, Chapter 1). Both tests involve the same type of measurement but differ in the form of the test piece. Both involve a pendulum swinging down from a specified height to hit the test piece (Figure 2.6). The height to which the

17
pendulum rises after striking and breaking the test piece, is a measure of the energy used in the breaking. If no energy were used, the pendulum would swing up to the same height as it started from. The greater the energy used in the breaking, the lower the height to which the pendulum rises. Both the American and British specifica-tions require the same standard size test pieces.
Test piece Knife edge to strike test piece
Figure 2.6 The principle of impact testing
With the Izod test the energy absorbed in breaking a cantilevered test piece (Figure 2.7) is measured. The test piece is notched on one face and the blow is struck on the same face, at a fixed height above the notch. The test pieces are, for metals, either 10 mm square or 11.4 mm diameter if they conform to British Standards. Figure 2.8 shows the details of the 10 mm square test piece. For polymeric materials, the standard test pieces are either 12.7 mm square (Figure 2.9) or 12.7 mm by 6.4 to 12.7 mm, depending on the thickness of the material concerned. With metals the pendulum strikes the test piece at a speed between 3 and 4 ms"1, with polymeric materials the speed is 2.44 m s_1.
Striking knife
edge
, Notch
Test piece clamped at base
Figure 2.7 Form of the Izod test piece

18
10 mm square
1 t
ε ε 00
' «d 2 mm
22.5°
Figure 2.8 Standard Izod test piece for a metal
12.7 mm square
ε ε °°.
_ <j
Figure 2.9 Standard Izod test piece for a polymeric material
With the Charpy test the energy absorbed in breaking a beam test piece (Figure 2.10) is measured. The test piece is supported at each end and is notched in the middle, the notch being on the face directly opposite to where the pendulum strikes the test piece. For metals, the British Standard test piece has a square cross-section of side 10 mm and a length of 55 mm. Figure 2.11 shows the details of the standard test piece and the three forms of notch that are possible. The results obtained with the different forms of notch cannot be compared, thus for the purpose of comparison between metals the same type of notch should be used. The test pieces for polymeric materials are tested either in the notched or unnotched state. A standard test piece is 120 mm long, 15 mm wide and 10 mm thick in the case of moulded polymeric materials. Different widths and thicknesses are used with sheet polymeric materials. The notch is produced by milling a slot across one face. The slot has a width of 2 mm and a radius of less than 0.2 mm at the corners of the base and walls of the slot. With metals, the pendulum strikes the test piece at a speed between 3 and 5.5 m s_1, with polymeric materials, the speed is between 2.9 and 3.8 m s~'.

19
^ # η Striking knife edge
Figure 2.10 Form of the Charpy test piece
10 mm square
n 27.5 mm ι
i l Tesi piece
-Ί r
^
U - notch
Radius 1.0 mm
55 mm 3 or 5 r m:
Radius 1.0 mm
Keyhole notch
22.5° 22.5°
2 mm Radius 0.25 mm
Figure 2.11 Standard Charpy test piece for a metal
The results of impact tests need to specify not only the type of test, i.e. Izod or Charpy, but the form of notch used. In the case of metals, the results are expressed as the amount of energy absorbed by the test piece when it breaks. In the case of polymeric materials, the results are often given as absorbed energy divided by either the cross-sectional area of the unnotched test piece, or the cross-sectional area behind the notch in the case of notched test pieces.
Tensile test In the tensile test, measurements are made of the force required to extend a standard size test piece at a constant rate, the elongation of a specified gauge length of the test piece being measured by some form of extensometer. In order to eliminate any variations in data obtained from the test, due to differences in shapes of test pieces, standard shape and size test pieces are used. Figure 2.12 shows the forms of two standard test pieces, one being a flat test piece and the other a round test piece. The dimensions of such standard test pieces are given in Table 2.3. These apply to all metals other than cast irons. An important feature of the dimensions is the radius given for the shoulders of the test pieces. Variations in the radii can markedly affect the data obtained from a test.

20
Width b
Cross-sectional area A
Minimum parallel length
(a) Round test piece
II t ' I \ L« \
Gauge length
'" Lc
Minimum parallel
Minimum total length
(b) Flat test piece
Figure 2.12 (a) Round and (b) flat tensile test pieces
Table 2.3 pieces
Dimensions of standard tensile test
Flat test pieces: American Standards b (mm)
40 12.5 6.25
Lo (mm)
200 50 25
Lc (mm) Lt
225 60 32
Flat test pieces: British Standards b (mm)
25 12.5 6 3
Round test d (mm)
12.50 8.75 6.25 4.00 2.50
Lo (mm)
100 50 24 12
Lc (mm) Lt
125 63 30 15
pieces: American Standards Lo (mm)
50 35 25 16 10
Note: the gauge length Lo
Round test A (mm2)
400 200 150 100 50 25 12.5
Lc (mm) r
60 45 32 20 16
= 4d.
pieces: British Standards d (mm)
22.56 15.96 13.82 11.28 7.98 5.64 3.99
Lo (mm) Lc
113 80 69 56 40 28 20
(mm)
450 200 100
(mm)
300 200 100 50
(mm)
10 6 5 4 2
(mm)
124 88 76 62 44 31 21
r (mm)
25 13 6
r (mm)
25 25 12 6
r (mm)
23.5 15 13 10 8 5 4
Note: The minimum radius r is doubled for cast non-ferrous materials. The gauge length Lo is 5.65V<Ao- The 400 mm2 is specified only for steel specimens.

21
The immediate output from a tensile test is a force-extension graph. This can be converted into a stress-strain graph (see Chapter 1) when coupled with data on the initial gauge length and the cross-sectional dimensions of the test piece in its gauge length. From such a graph the limit of proportionality (see Chapter 1), the yield stress (see Chapter 1), the tensile modulus (see Chapter 1) and the tensile strength (see Chapter 1) can be determined. Other data can also be obtained during a tensile test if after the test, when the test piece has been broken, the pieces are fitted together and the final gauge length measured. This will give the percentage elongation (see Chapter 1). Measurements of the initial cross-sectional area and the smallest cross-sectional area at fracture, will give the percentage reduction in area (see Chapter 1).

3 Ferrous alloys 3.1 Materials Alloys The term ferrous alloys is used for all those alloys having iron as the major constituent. Pure iron is a relatively soft material and is hardly of any commercial use in that state. Alloys of iron with carbon are classified according to their carbon content as shown in Table 3.1. Table 3.1 Alloys of iron with carbon Material Percentage carbon
Wrought iron 0 to 0.05 Steel 0.05 to 2 Cast iron 2 to 4.3
The term carbon steel is used for those steels in which essentially just iron and carbon are present. The term alloy steel is used where other elements are included. Stainless steels are one form of alloy steel which has high percentages of chromium in order to give it a high resistance to corrosion. The term tool steels is used to describe those steels, carbon or alloy, which are capable of being hardened and tempered and have suitable properties for use as a tool material.
The following is an alphabetical listing of the various types of ferrous alloys. Alloy steels
The term low alloy is used for alloy steels when the alloying addi-tions are less than 2%, medium alloy between 2 and 10% and high alloy when over 10%. In all cases the amount of carbon is less than 1%. Common elements that are added are aluminium, chromium, cobalt, copper, lead, manganese, molybdenum, nickel, phosphorus, silicon, sulphur, titanium, tungsten and vanadium. There are a number of ways in which the alloying elements can have an effect on the properties of the steel. The main effects are to: 1 Solution harden the steel 2 Form carbides 3 Form graphite 4 Stabilize austenite or ferrite 5 Change the critical cooling rate 6 Improve corrosion resistance 7 Change grain growth 8 Improve machinability See Coding system for steels, Composition of alloy steels, Creep properties, Machinability, Oxidation resistance , Mechanical properties of alloy steels, Thermal properties and Uses of alloy steels.
Carbon steels
The term carbon steel is used for those steels in which essentially just iron and carbon are present. Such steels with less than 0.80% carbon are called hypo-eutectoid steels, those with between 0.80% and 2.0% carbon being hyper-eutectoid steels. Steels with between 0.10% and 0.25% carbon are termed mild steels, between 0.20% and 0.50% x medium-carbon steels and more than 0.50% high carbon steels.
23
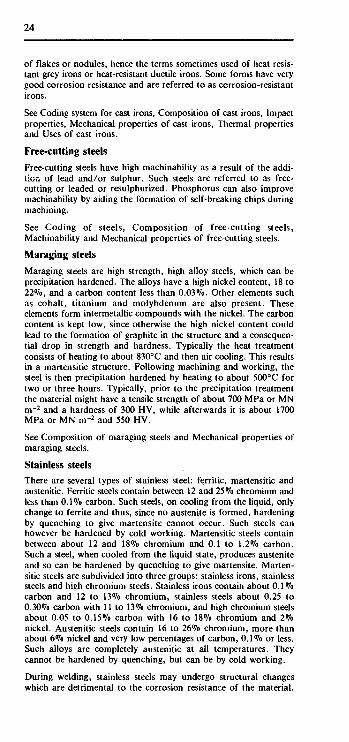
Figure 3.1 shows the iron-carbon equilibrium diagram. δ + liquid
Liquid
4.3% H47°C
a + cementitc
Ccmcntitc + graphite
6.67%
0 1 2 3 4 5 6 % carbon 100 99 98 97 96 95 94 % iron
Composition
Figure 3.1 The iron-carbon equilibrium diagram
See Coding system for steels, Composition of carbon steels, Creep properties, Hardness, Impact properties, Machinability, Mechanical properties of carbon steels, Thermal properties and Uses of carbon steels.
Cast irons
Cast irons can be divided into five main categories:
/ Grey irons These contain graphite in the form of flakes. The most widely used form has the graphite in a pearlitic structure.
2 Ductile irons or spheroidal-graphite irons These contain graphite in the form of nodules as a result of magnesium or cerium being added during casting. The material is more ductile than grey irons.
3 White irons There is no graphite present, the iron containing hard cementite. This material is hard and brittle, hence difficult to machine. The main use is where a wear-resistant surface is required.
4 Malleable irons These are produced by the heat treatment of white irons. These are sometimes referred to as falling into two categories, ferritic or pearlitic, or considered as three groups, whiteheart, blackheart or pearlitic. Malleable irons have better ductility than grey cast irons and this, combined with their high tensile strength, makes them a widely used material.
5 High alloy irons These are alloys containing significant percentages of elements such as silicon, chromium, nickel or aluminium. They can be considered to fall into two categories, graphite-free white irons or graphite-containing irons. The graphite-free white irons are very abrasion resistant. In the graphite-containing irons, the graphite is in the form
24
of flakes or nodules, hence the terms sometimes used of heat resis-tant grey irons or heat-resistant ductile irons. Some forms have very good corrosion resistance and are referred to as corrosion-resistant irons.
See Coding system for cast irons, Composition of cast irons, Impact properties, Mechanical properties of cast irons, Thermal properties and Uses of cast irons.
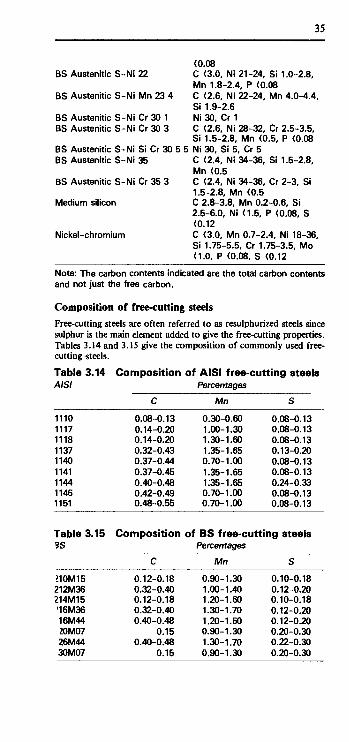
Free-cutting steels
Free-cutting steels have high machinability as a result of the addi-tion of lead and/or sulphur. Such steels are referred to as free-cutting or leaded or resulphurized. Phosphorus can also improve machinability by aiding the formation of self-breaking chips during machining.
See Coding of steels, Composition of free-cutting steels, Machinability and Mechanical properties of free-cutting steels.
Maraging steels
Maraging steels are high strength, high alloy steels, which can be precipitation hardened. The alloys have a high nickel content, 18 to 22%, and a carbon content less than 0.03%. Other elements such as cobalt, titanium and molybdenum are also present. These elements form intermetallic compounds with the nickel. The carbon content is kept low, since otherwise the high nickel content could lead to the formation of graphite in the structure and a consequen-tial drop in strength and hardness. Typically the heat treatment consists of heating to about 830°C and then air cooling. This results in a martensitic structure. Following machining and working, the steel is then precipitation hardened by heating to about 500°C for two or three hours. Typically, prior to the precipitation treatment the material might have a tensile strength of about 700 MPa or MN m - 2 and a hardness of 300 HV, while afterwards it is about 1700 MPa or MN m"2 and 550 HV.
See Composition of maraging steels and Mechanical properties of maraging steels.
Stainless steels
There are several types of stainless steel: ferritic, martensitic and austenitic. Ferritic steels contain between 12 and 25% chromium and less than 0.1% carbon. Such steels, on cooling from the liquid, only change to ferrite and thus, since no austenite is formed, hardening by quenching to give martensite cannot occur. Such steels can however be hardened by cold working. Martensitic steels contain between about 12 and 18% chromium and 0.1 to 1.2% carbon. Such a steel, when cooled from the liquid state, produces austenite and so can be hardened by quenching to give martensite. Marten-sitic steels are subdivided into three groups: stainless irons, stainless steels and high chromium steels. Stainless irons contain about 0.1% carbon and 12 to 13% chromium, stainless steels about 0.25 to 0.30% carbon with 11 to 13% chromium, and high chromium steels about 0.05 to 0.15% carbon with 16 to 18% chromium and 2% nickel. Austenitic steels contain 16 to 26% chromium, more than about 6% nickel and very low percentages of carbon, 0.1% or less. Such alloys are completely austenitic at all temperatures. They cannot be hardened by quenching, but can be by cold working.
During welding, stainless steels may undergo structural changes which are detrimental to the corrosion resistance of the material.

25
The effect is known as weld decay and results from the precipita-tion of chromium rich carbides at grain boundaries. One way to overcome this is to stabilize the steel by adding other elements, such as niobium and titanium, which have a greater affinity for the carbon than the chromium and so form carbides in preference to the chromium. See Coding system for stainless steels, Composition of stainless steels, Creep properties, Oxidation resistance, Mechanical properties of stainless steels, Thermal properties and Uses of stainless steels.
Tool steels
Plain carbon steels obtain their hardness from their high carbon content, the steels needing to be quenched in cold water to obtain maximum hardness. Unfortunately they are rather brittle, lacking toughness, when very hard. Where medium hardness with reasonable toughness is required, a carbon steel with about 0.7% carbon can be used. Where hardness is the primary consideration and toughness is not important, a carbon steel with about 1.2% carbon can be used.
Alloy tool steels are made harder and more wear resistant by the addition to the steel of elements that promote the production of stable hard carbides. Manganese, chromium, molybdenum, tungsten and vanadium are examples of such elements. A manganese tool steel contains from about 0.7 to 1.0% carbon and 1.0 to 2.0% manganese. Such a steel is oil quenched from about 780-800°C and then tempered. The manganese content may be partially replaced by chromium, such a change improving the toughness. Shock-resistant tool steels are designed to have toughness under impact conditions. For such properties, fine grain is necessary and this is achieved by the addition of vanadium. Tool steels designed for use with hot-working processes need to maintain their properties at the temperatures used. Chromium and tungsten, when added to steels, form carbides which are both stable and hard, hence main-taining the properties to high temperatures. Steels used at high machining speeds are called high speed tool steels. The high speed results in the material becoming hot. Such steels must not be tempered by the high temperatures produced during machining. The combination of tungsten and chromium is found to give the required properties, the carbides formed by these elements being particularly stable at high temperatures.
See Coding of tool steels, Composition of tool steels, Tool steel properties and Uses of tool steels.
3.2 Codes and compositions Coding system for carbon steels
See Coding system for steels. Coding system for cast irons
The codes given to cast irons tend to relate to their mechanical properties. Thus grey cast irons, according to British Standards (BS), are designated in seven grades: 150, 180, 220, 260, 300, 350 and 400. These numbers are the minimum tensile strengths in MPa or MN m-2 or N mm-2 in a 30 mm diameter test bar. The American stan-dards, American Society for Testing Materials (ASTM), use the minimum strengths in k.s.i. (klb in-2). Malleable cast irons are specified, according to British Standards,

26
by a letter B, P or A to indicate whether blackheart, pearlitic or whiteheart, followed by a number to indicate the minimum requirements for section sizes greater than 15 mm of the tensile strength in MPa or MN m-2 or N mm-2 and a number to indicate the percentage elongation. Thus, for example, B340/12 is a blackheart cast iron with a minimum tensile strength of 340 MPa and a percentage elongation of 12%. In American standards, the specification of malleable cast irons is in terms of two numbers to indicate the yield stress in 102 p.s.i. followed by the percentage elongation.
Ductile irons, according to British Standards, are specified by two numbers, the first representing the minimum tensile strength in MPa or MN m-2 or N mm-2 and the second the percentage elongation, e.g. 420/12. In American standards, ductile irons are specified by three numbers, the first representing the minimum tensile strength in k.s.i, the second the yield stress in k.s.i., the third the percentage elongation, e.g. 60-40-18. Alloy cast irons, according to British Standards, are specified for graphite-free white irons by a number, 1, 2 or 3, to indicate the type of alloy (1 is low alloy, 2 is nickel-chromium, 3 is high chromium), followed by a letter to indicate the specific alloy. For graphite containing irons, austenitic irons containing flaky graphite are designated by the letter L and spheroidal graphite by S. This is followed by numbers and letters indicating the percentages of the main alloying elements. Ferritic high silicon, graphite containing alloys are designated by the main alloying elements and their percen-tages, e.g. Si 10.
Coding system for stainless steels
The British Standard system of coding these steels is linked to the American Iron and Steel Institute (AISI) system. In general, the first three digits of the British system relate to the three digits used for the AISI system. The British system then follows these three digits by the letter S and then a further two digits in the range 11 to 99. These indicate variants of the steel specified by the first three digits. The range of numbers used for the first three digits, on the British system, is 300 to 499. See Composition of stainless steels for direct equivalents. Coding system for steels: American
The AISI-SAE system (American Iron and Steel Institute, Society of Automotive Engineers) uses a four-digit code. The first two numbers indicate the type of steel, with the first digit indicating the grouping by major alloying element and the second digit in some instances indicating the approximate percentage of that element. The third and fourth numbers are used to indicate 100 times the percen-tage of carbon content. Table 3.2 outlines the AISI-SAE code system.
Table 3.2 AISI-SAE code system Number series Form of steel Examples of series
subdivision
1000 Carbon steel 10XX Plain carbon with maximum of 1 % manganese 11XX Resulphurized 12XX Resulphurized and rephosphorized

2000
3000
Manganese steels
Nickel steels
Nickel-chromium
4000
5000
6000
7000
8000
9000
Molybdenum steels
Chromium-molybdenum steels
Nickel-chromium-molybdenum steels
N ickel - molybdenu m steels
Chromium steels
Chromium-vanadium steels
Tungsten-chromium
Nickel-chromium-molybdenum steels
Silicon-manganese steels
Nickel-chromium-molybdenum
15XX Plain carbon with 1.00 to 1.65% manganese 73XXhas 1.75% manganese 23XX has 3.5% nickel 25XX has 5.0% nickel 37XXhas 1.25% nickel, 0.65% or 0.80% chromium 32XXhas 1.75% nickel, 1.07% chromium 33XX has 3.50% nickel, 1.50% or 1.57% chromium 34XX has 3.00% nickel, 0.77% chromium 40XX has 0.20 or 0.25% molybdenum 44XX has 0.40 or 0.52% molybdenum 47XX has 0.50%, 0.80% or 0.95% chromium, 0.12%, 0.20%, 0.25% or 0.30% molybdenum 43XX has 1.82% nickel, 0.50% or 0.80% chromium, 0.25% molybdenum S47XX has 1.05% nickel, 0.45% chromium, 0.20% or 0.35% molybdenum 46XX has 0.85% or 1.82% nickel, 0.20% or 0.25% molybdenum 50XX has 0.27%, 0.40%, 0.50% or 0.65% chromium 57XX has 0.80%, 0.87%, 0.92%, 0.95%, 1.00% or 1.05% chromium 67XX has 0.60%, 0.80% or 0.95% chromium, 0.10% or 0.15% min. vanadium 72XX has 1.75% tungsten, 0.75% chromium 87XX has 0.30% nickel, 0.40% chromium, 0.12% molybdenum 86XX has 0.55% nickel, 0.50% chromium, 0.20% molybdenum 87XX has 0.55% nickel, 0.50% chromium, 0.25% molybdenum 88XX has 0.55% nickel, 0.50% chromium, 0.35% molybdenum 92XX has 1.40% or 2.00% silicon, 0.65%, 0.82% or 0.85% manganese, 0.00% or 0.65% chromium 93XX has 3.25% nickel, 1.20% chromium, 0.12% molybdenum
27

28
94XX has 0.45% nickel, 0.40% chromium, 0.12% molybdenum 97XX has 0.55% nickel, 0.20% chromium, 0.20% molybdenum 38XXhas 1.00% nickel, 0.80% chromium, 0.25% molybdenum
To illustrate the use of the code in Table 3.2, consider a steel 1040. The first digit is 1 and so the steel is a carbon steel. The 10 indicates that it is a plain carbon steel with a maximum content of 1.00% manganese. The last pair of digits is 40 and so the steel contains 0.40% carbon.
There are also some specifically specified steels which have modified SAE numbers, a letter being included between the first pair and second pair of numbers (Table 3.3).
Table 3.3 Additional letters in SAE code Code Significance of letter
XXBXX The B denotes boron intensified steels. XXLXX The L denotes leaded steels.
In addition to the four SAE digits, various letter prefixes and suffixes are given to provide additional information (Table 3.4).
Table 3.4 Letter prefixes and suffixes for SAE code Prefix Significance of prefix
A Alloy steel made in an acid-hearth furnace B Carbon steel made in a Bessemer furnace C Carbon steel made in a basic open-hearth furnace D Carbon steel made in an acid open-hearth furnace E Made in an electric furnace X Composition varies from normal limits
Suffix Significance of suffix
H Steel will reach hardenability criteria
The American Society for Testing Materials (ASTM) and the American Society of Mechanical Engineers (ASME) also issue stan-dards covering steels. Many of their grades are based on the AISI-SAE grades. Also see Coding system for stainless steels.
Coding system for steels: British
In Great Britain the standard codes for the specification of steels are specified by the British Standards Institution. The following codes are for wrought steels:
(1) The first three digits of the code designate the type of steel.
000 to 199 Carbon and carbon-manganese types, the number being 100 times the manganese content.
200 to 240 Free-cutting steels, the second and third numbers being approximately 100 times the mean sulphur content.
250 Silicon-manganese spring steels

29
300 to 499 Stainless and heat resistant valve steels 500 to 999 Alloy steels
(2) The fourth symbol is a letter.
A The steel is supplied to a chemical composition determined by chemical analysis.
H The steel is supplied to hardenability specification. M The steel is supplied to mechanical property specification. S The steel is stainless.
(3) The fifth and sixth digits correspond to 100 times the mean percentage carbon content of the steel.
To illustrate the above code system, consider a steel with the code 070M20. The first three digits 070 are between 000 and 199 and so the steel is a carbon or carbon-manganese type. The 070 indicates that the steel has 0.70% manganese. The fourth digit is M and so the steel is supplied to mechanical property specification. The fifth and sixth digits are 20 and so the steel has 0.20% carbon.
The first three digits used for alloy steels are subdivided, as shown in Table 3.5, according to the main alloying elements.
Table 3.5 Coding system for BS alloy steels Digits
500-519 520-539 540-549 550-569 570-579 580-589 590-599 600-609 610-619 620-629 630-659 660-669 670-679 680-689 690-699 700-729 730-739 740-749 750-759 760-769 770-779 780-789 790-799 800-839 840-849 850-859 860-869 870-879 880-889 890-899 900-909 910-919 920-929 930-939 940-949
Main alloying elements
Ni Cr Mo V, Ti, AI, Nb Si-Ni, Si-Cr, Si-Mo, Si-V Mn-Si, Mn-Ni Mn-Cr Mn-Mo Mn-V Ni-Si, Ni-Mn Ni-Cr Ni-Mo Ni-V, Ni-X Cr-Si, Cr-Mn Cr-Ni Cr-Mo Cr-V Cr-X Mo-Cr, Mo-V, Mo-X Si-Mn-Cr Mn-Ni-Cr Mn-Ni-Mo — Ni-Cr-Mo Ni-Cr-V, Ni-Cr-X Ni-Mo-V, Ni-Cr-X — Cr-Ni-Mo — Cr-Mo-V Cr-AI-Mo _ Si-Mn-Cr-Mo — Mn-Ni-Cr-Mo

30
950-969 970-979 Ni-Cr-Mo-V 980-999
Note: In the above table, where elements are separated by a dash, e.g. Mo-Cr, then those are all present as main alloying elements. Where elements, or groups of elements, are separated by a comma, e.g. Mo-Cr, Mo-V, Mo-X, then each alone has a number in the specified range of digits. Where the symbol X is specified then this means some element other than those already specified.
To give an illustration from Table 3.5, 805M20 is a Ni-Cr-Mo alloy since the first three digits fall within the 800-839 category.
Steels are frequently specified to mechanical properties. This is usually according to the tensile strength in the hardened and tempered condition. A code letter can be used to indicate the tensile strength range in which a steel falls when in this condition. The letter is said to refer to the condition of the steel. Table 3.6 gives the condition codes.
Table 3.6 Condition codes Condition code Tensile strength range (MPa or MN m~2)
P 550 to 700 Q 629 to 770 R 700 to 850 S 770 to 930 T 850 to 1000 U 930 to 1080 V 1000 to 1150 W 1080 to 1240 X 1150 to 1300 Y 1240 to 1400 Z 1540 minimum
Also see Coding system for stainless steels.
Coding system for fool steels
The British coding for tool steels is based on that of the AISI, the only difference being that in the British code the American codes are prefixed by the letter B (Table 3.7).
Table 3.7 AISI BS
W O A D
H M T S P L F
BW BO BA BD
BH BM BT BS BP BL BF
Coding system for tool steels Material
A water-hardening tool steel Oil-hardening tool steel for cold work Medium alloy hardening for cold work High-carbon and high-chromium content for cold
work Chromium or tungsten base for hot work Molybdenum base, high speed steel Tungsten base, high speed steel Shock-resisting tool steel Mould steels Low alloy tool steel for special applications Carbon-tungsten steels
Note: The tool steel code letters are followed by a number to denote a particular steel composition.

31
Composition of alloy steels
Tables 3.8 and 3.9 give the compositions of commonly used alloy steels. Table 3.8 gives compositions in relation to AISI-SAC alloy steel specification, BS equivalents being given where appropriate. Table 3.9 gives compositions of BS steels, AISI equivalents being given where appropriate.
Table 3.8 AISI -SAE composition of commonly used alloy steels AISI BS Mean percentages
C Mn
Manganese steels 1330 0.30 1.75 1340 0.40 1.75 Molybdenum steels 4037 0.38 0.80 Chromium-molybdenum steels 4130 0.30 0.50 4140 708/9M40 0.40 0.88
Cr
0.95 0.95
Nickel-chromium-molybdenum steels 4320 0.20 0.55 4340 817M40 0.40 0.70 Nickel-molybdenum steels 4620 0.19 0.53 4820 0.19 0.60 Chromium steels 5130 530A30 0.30 0.80 5140 530M40 0.40 0.80 5160 0.60 0.88 Chromium-vanadium steels 6150 735A50 0.50 0.80
0.50 0.80
0.95 0.80 0.80
0.95 Nickel-chromium-molybdenum steels 8620 805M20 0.20 0.75 8630 0.30 0.75 8640 0.40 0.88 8650 0.50 0.88 8660 0.60 0.88 Silicon steels 9260 250A58 0.60 0.88
0.50 0.50 0.50 0.50 0.50
Mo
0.25
0.20 0.20
0.25 0.25
0.25 0.25
0.20 0.20 0.20 0.20 0.20
Ni Other
1.83 1.83
1.83 3.50
0.15 V
0.55 0.55 0.55 0.55 0.55
2.0 Si
Note: Most of the steels contain about 0.15 to 0.30 Si, and less than 0.035 P and 0.040 S.
Table 3.9 BS Composition of alloy steels BS AISI Mean percentages
Mn Cr Mo Ni Other
Manganese steels 120M19 120M28 120M36 1039 150M19 150M28 150M36 1039 Silicon manganese 250A53 250A58 9260
0.19 0.28 0.36 0.19 0.28 0.36
steels 0.53 0.58
1.20 1.20 1.20 1.50 1.50 1.50
0.85 0.85
Si 1.9 Si 1.9
c

32
Chromium steels 526M60 0.60 0.65 0.65 530M40 5140 0.40 0.75 1.05 Manganese-molybdenum steels 605M36 0.36 1.50 0.27 606M36 0.36 1.50 0.27 P <0.06
S 0.15-0.25 608M38 0.38 1.50 0.50 Nickel-chromium steels 653M31 0.31 0.60 1.00 3.00 Chromium-molybdenum steels 708M40 4137/40 0.40 0.70 0.90 0.20 709M40 4140 0.40 0.60 0.90 0.30 <0.40 722M24 0.24 0.45 3.00 0.55 Nickel-chromium-molybdenum steels 817M40 4340 0.40 0.55 1.20 0.30 1.50 826M40 0.40 0.55 0.65 0.50 2.55 835M30 0.30 0.55 1.25 0.27 4.10 Manganese-nickel-chromium-molybdenum steels 945M38 0.38 1.40 0.50 0.20 0.75
Composition of carbon steels
Tables 3.10 and 3.11 give the compositions of commonly used carbon steels. Table 3.10 gives the AISI compositions, with BS equivalents where appropriate. Table 3.11 gives the BS composi-tions, with AISI equivalents where appropriate.
Table 3.10 AISI -SAE composition of common carbon steels
Percentages
AISI
1006 1010 1015 1020 1025 1030 1035 1040 1045 1050 1055 1060 1065 1070 1075 1080 1085 1090 1095
BS
070M20
080M36 080A40
060A62
060A96
C
0.08 max 0.08-0.13 0.13-0.18 0.18-0.23 0.22-0.28 0.28-0.34 0.32-0.38 0.37-0.44 0.43-0.50 0.48-0.55 0.50-0.60 0.55-0.66 0.60-0.70 0.65-0.75 0.70-0.80 0.75-0.88 0.80-0.93 0.85-0.98 0.90-1.03
Mn
0.25-0.40 0.30-0.60 0.30-0.60 0.30-0.60 0.30-0.60 0.60-0.90 0.60-0.90 0.60-0.90 0.60-0.90 0.60-0.90 0.60-0.90 0.60-0.90 0.60-0.90 0.60-0.90 0.40-0.70 0.60-0.90 0.70-1.00 0.60-0.90 0.30-0.50
Note: There is a maximum of 0.040% phosphorus and 0.05% sulphur.

33
Table 3.11 BS composition of common carbon steels BS
070M20 070M26 080M30 080M36 080M40 080M46 080M50 070M55
AISI
1020
1035 1043 1043
Mean percentages
C
0.20 0.26 0.30 0.36 0.40 0.46 0.50 0.55
Mn
0.70 0.70 0.80 0.80 0.80 0.80 0.80 0.70
Composition of cast irons
Table 3.12 shows, in general terms, the compositions of the various forms of unalloyed cast iron.
Table 3.12 Composition ranges of unalloyed cast irons Cast iron Percentages
C Si Mn S P
Grey Ductile White Malleable
2.5-4.0 3.0-4.0 1.8-3.6 2.0-2.6
1.0-3.0 1.8-2.8 0.5-1.9 1.1-1.6
0.25-1.00 0.10-1.00 0.25-0.80 0.20-1.00
0.02-0.25 0.03 max. 0.06-0.20 0.04-0.18
0.05-1.00 0.10 max. 0.06-0.18 0.18 max.
The addition of elements, such as nickel, chromium, or molybdenum to unalloyed white cast iron, can change its pearlitic structure to martensite, bainite or austenite to give what is often termed abrasion-resistant white irons. Corrosion-resistant irons are produced if high percentages of silicon, or chromium or nickel are used. Heat-resistant grey and ductile cast irons are produced if silicon, chromium, nickel, molybdenum or aluminium are added. Table 3.13 shows the compositions of a selection of these alloy cast irons.
Table 3.13 Composition of alloy cast irons Material Composition (%)
Abrasion-resistant white BS low alloy, 1A, 1B, 1C C 2.4-3.4, Si 0.5-1.5, Mn
0.2-0.8, Cr <2.0. BS nickel-chromium, 2A-E C 2.7-3.6, Si 0.3-2.2, Mn
0.2-0.6, Ni 3.0-6.0, Cr 1.5-10.0.
BS high chromium, 3A-E C 2.4-3.2, Si <1.0, Mn 0.5-1.5, Cr 14.0-17.0, Mo <3.0, Ni <1.0, Cu <1.2.
Martensitic nickel-chromium C 3.00-3.60, Si 0.40-0.70, Mn 0.40-0.70, Cr 1.40-3.50, Ni 4.00-4.75, P <0.40, S <0.15.
High chromium white C 2.25-2.85, Si 0.25-1.00, Mn 0.50-1.25, Cr 24.0-30.0, P <0.40, S <0.15.
Ni hard, 3.5 Ni Cr C 2.8-3.6, Ni 2.5-4.75, Cr 1.2-1.35, Si 0.4-0.7, Mn
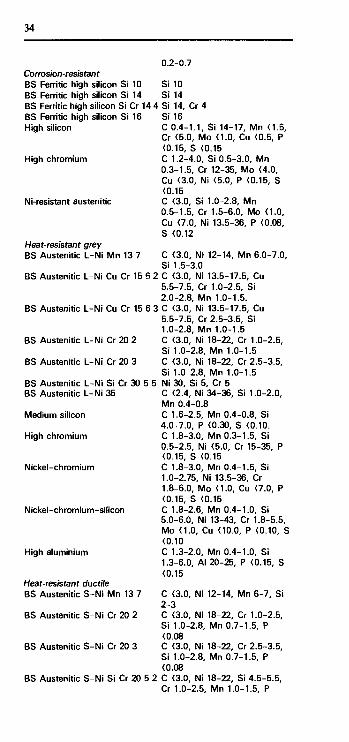
34
0.2-0.7 Corrosion-resistant BS Ferritic high silicon Si 10 Si 10 BS Ferritic high silicon Si 14 Si 14 BS Ferritic high silicon Si Cr 14 4 Si 14, Cr 4 BS Ferritic high silicon Si 16 Si 16 High silicon C 0.4-1.1, Si 14-17, Mn <1.S,
Cr <5.0, Mo <1.0, Cu <0.5, P <0.15, S <0.15
High chromium C 1.2-4.0, Si 0.5-3.0, Mn 0.3-1.5, Cr 12-35, Mo <4.0, Cu <3.0, Ni <5.0, P <0.15, S <0.15
Ni-resistant austenitic C <3.0, Si 1.0-2.8, Mn 0.5-1.5, Cr 1.5-6.0, Mo <1.0, Cu <7.0, Ni 13.5-36, P <0.08, S <0.12
Heat-resistant grey BS Austenitic L-Ni Mn 13 7 C <3.0, Ni 12-14, Mn 6.0-7.0,
Si 1.5-3.0 BS Austenitic L-Ni Cu Cr 15 6 2 C <3.0, Ni 13.5-17.5, Cu
5.5-7.5, Cr 1.0-2.5, Si 2.0-2.8, Mn 1.0-1.5.
BS Austenitic L-Ni Cu Cr 15 6 3 C <3.0, Ni 13.5-17.5, Cu 5.5-7.5, Cr 2.5-3.5, Si 1.0-2.8, Mn 1.0-1.5
BS Austenitic L-Ni Cr 20 2 C <3.0, Ni 18-22, Cr 1.0-2.5, Si 1.0-2.8, Mn 1.0-1.5
BS Austenitic L-Ni Cr 20 3 C <3.0, Ni 18-22, Cr 2.5-3.5, Si 1.0-2.8, Mn 1.0-1.5
BS Austenitic L-Ni Si Cr 30 5 5 Ni 30, Si 5, Cr 5 BS Austenitic L-Ni 35 C <2.4, Ni 34-36, Si 1.0-2.0,
Mn 0.4-0.8 Medium silicon C 1.6-2.5, Mn 0.4-0.8, Si
4.0-7.0, P <0.30, S <0.10. High chromium C 1.8-3.0, Mn 0.3-1.5, Si
0.5-2.5, Ni <5.0, Cr 15-35, P <0.15, S <0.15
Nickel-chromium C 1.8-3.0, Mn 0.4-1.5, Si 1.0-2.75, Ni 13.5-36, Cr 1.8-6.0, Mo <1.0, Cu <7.0, P <0.15, S <0.15
Nickel-chromium-silicon C 1.8-2.6, Mn 0.4-1.0, Si 5.0-6.0, Ni 13-43, Cr 1.8-5.5, Mo <1.0, Cu <10.0, P <0.10, S <0.10
High aluminium C 1.3-2.0, Mn 0.4-1.0, Si 1.3-6.0, AI 20-25, P <0.15, S <0.15
Heat-resistant ductile BS Austenitic S-Ni Mn 13 7 C <3.0, Ni 12-14, Mn 6-7, Si
2-3 BS Austenitic S-Ni Cr 20 2 C <3.0, Ni 18-22, Cr 1.0-2.5,
Si 1.0-2.8, Mn 0.7-1.5, P <0.08
BS Austenitic S-Ni Cr 20 3 C <3.0, Ni 18-22, Cr 2.5-3.5, Si 1.0-2.8, Mn 0.7-1.5, P <0.08
BS Austenitic S-Ni Si Cr 20 5 2 C <3.0, Ni 18-22, Si 4.5-5.5, Cr 1.0-2.5, Mn 1.0-1.5, P
35
<0.08 BS Austenitic S-Ni 22 C <3.0, Ni 21-24, Si 1.0-2.8,
Mn 1.8-2.4, P <0.08 BS Austenitic S-Ni Mn 23 4 C <2.6, Ni 22-24, Mn 4.0-4.4,
Si 1.9-2.6 BS Austenitic S-Ni Cr 30 1 Ni 30, Cr 1 BS Austenitic S-Ni Cr 30 3 C <2.6, Ni 28-32, Cr 2.5-3.5,
Si 1.5-2.8, Mn <0.5, P <0.08 BS Austenitic S-Ni Si Cr 30 5 5 Ni 30, Si 5, Cr 5 BS Austenitic S-Ni 35 C <2.4, Ni 34-36, Si 1.5-2.8,
Mn <0.5 BS Austenitic S-Ni Cr 35 3 C <2.4, Ni 34-36, Cr 2-3, Si
1.5-2.8, Mn <0.5 Medium silicon C 2.8-3.8, Mn 0.2-0.6, Si
2.5-6.0, Ni <1.5, P <0.08, S <0.12
Nickel-chromium C <3.0, Mn 0.7-2.4, Ni 18-36, Si 1.75-5.5, Cr 1.75-3.5, Mo <1.0, P <0.08, S <0.12
Note: The carbon contents indicated are the total carbon contents and not just the free carbon.
Composition of free-cutting steels
Free-cutting steels are often referred to as resulphurized steels since sulphur is the main element added to give the free-cutting properties. Tables 3.14 and 3.15 give the composition of commonly used free-cutting -steels.
Table 3.14 Composition of AISI free-cutting steels AISI Percentages
1110 1117 1118 1137 1140 1141 1144 1146 1151
Table 3.15 3S
C
0.08-0.13 0.14-0.20 0.14-0.20 0.32-0.43 0.37-0.44 0.37-0.45 0.40-0.48 0.42-0.49 0.48-0.55
Mn
0.30-0.60 1.00-1.30 1.30-1.60 1.35-1.65 0.70-1.00 1.35-1.65 1:35-1.65 0.70-1.00 0.70-1.00
S
0.08-0.13 0.08-0.13 0.08-0.13 0.13-0.20 0.08-0.13 0.08-0.13 0.24-0.33 0.08-0.13 0.08-0.13
Composition of BS free-cutting steels
c Percentages
Mn S
J10M15 0.12-0.18 0.90-1.30 0.10-0.18 212M36 0.32-0.40 1.00-1.40 0.12-0.20 214M15 0.12-0.18 1.20-1.60 0.10-0.18 Ί6Μ36 0.32-0.40 1.30-1.70 0.12-0.20 16M44 0.40-0.48 1.20-1.50 0.12-0.20 20M07 0.15 0.90-1.30 0.20-0.30 26M44 0.40-0.48 1.30-1.70 0.22-0.30 30M07 0.15 0.90-1.30 0.20-0.30

36
Composition of maraging steels
Table 3.16 shows the compositions of typical maraging steels. See Maraging steels.
Table 3.16 Composition of maraging steels Grade Percentages
200 250 300 350
Ni
18 18 18 18
Co
8 8 9
12
Mo
3.2 5.0 5.0 4.0
AI
0.1 0.1 0.1 0.1
Ti
0.2 0.4 0.6 1.8
C (max.)
0.03 0.03 0.03 0.01
Composition of stainless steels
Tables 3.17 and 3.18 give the compositions of typical stainless and heat resisting steels. The stainless steels owe their high resistance to corrosion to the inclusion of higher percentages of chromium in the composition of the alloys. A minimum of 12% chromium is required. Stainless steels are divided into three main categories according to their microstructure, these being austenitic, ferritic and martensitic. Table 3.17 gives the steels in terms of AISI codes, with equivalent BS steels being indicated where appropriate. Table 3.18 gives BS codes with equivalent AISI codes being indicated.
Table 3.17 Composition of AISI stainless steels AISI BS Percentages
Austenitic 201 301 302 304
309 316
321
Ferritic 405 409 430 442 446
302S31 304S15 304S16,
316S16 316S18, 321S12 321S18,
405S17
430S15
Martensitic 403 410
420 431 440C
420S29 410S21 410S27
C
0.15 0.15 0.15 0.08 S18, 0.20 0.08 S25, 0.08 S22,
0.08 0.08 0.12 0.20 0.20
0.15 0.15
420S37 >0.15 431S29 0.20
1.07
Cr
17 17 18 19
S25, S40 23 17
S26, S30 18
S27, S31
13 11 17 20.5 25.0
12.2 12.5
12 16 17
Ni
4.5 7 9 9.5
13.5 12 , S33, 10.5 , S40,
1.8
Mn
6.0 2.0 2.0 2.0
2.0 2.0
S40, S41 2.0
S49, S50,
1.0 1.0 1.0 1.0 1.5
1.0 1.0
1.0 1.0 1.0
Other
T i 5 x % C S59, S87
AI 0.20 T i6x%C
Note: There is also generally a maximum of 0.030% S, 0.040% Pand 1.00% Si.

37
Table 3.18 Composition of BS stainless steels BS AISI Percentage
Austenitic 302S31 303S31 304S31 310S31 316S33 321S31 Ferritic 403S17 430S17
302 303 304
316 321
430 Martensitic 410S21 416S21 420S29 420S37 431S29
410 416 403 420 431
C
0.12 0.12 0.07 0.15 0.07 0.08
0.08 0.08
0.12 0.12 0.17 0.24 0.16
Cr
18 18 18 25 17 18
13 17
12.5 12.5 12.5 13 16.5
Ni
9 9 9.5
20.5 12.5 10.5
0.5 0.5
1.0 1.0 1.0 1.0 2.5
Mn
2.0 2.0 2.0 2.0 2.0 2.0
1.0 1.0
1.0 1.5 1.0 1.0 1.0
Other
2.8 Mo 5CTi
Note: Generally all the steels contain about 0.05% P, 0.03% S and 1.0% Si.
Composition of tool steels
Table 3.19 gives the composition of commonly used tool steels. In addition to steel, sintered carbides (see Chapter 10), ceramics (see Chapter 10) and cobalt-chromium-tungsten-molybdenum alloys are used. The identification codes used are those of the AISI; the BS codes are the same but just preceded by the letter B.
Table 3.19 Composition of tool steels AISI Percentage
W Mo Cr Other
Water-hardening W1 0.6-1.4 W2 0.6-1.4 W5 1.10 Shock-resisting 51 0.50 2.50 52 0.50 S5 0.55 S7 0.50 Oil-hardening 01 0.90 0.50 02 0.90 06 1.45 07 1.20 Air-hardening A2 A3 A4 A6 A7 A8 A9 A10
1.00 1.25 1.00 0.70 2.25 0.55 0.50 1.35
1.00 1.25
0.50
1.50
0.25
0.50 0.40 1.40 3.25
0.50
0.25 1.75 0.75
1.00 Si 0.80 Mn, 2.00 Si
1.00 Mn 1.60 Mn
0.80 Mn, 1.00 Si
1.00 5.00 1.00 5.00 1.00 1.00
1.00
1.25 1.00 1.25 1.40 1.50
1.00 5.25 4.75 5.00 5.00 1.00
2.00 Mn 2.00 Mn
W optional
1.50 Ni 1.80 Mn, 1.25 Si, 1.80 Ni
c V

38
High carbon-high chromium steels D2 D3 D4 D5 D7
1.50 2.25 2.25 1.50 2.35
1.0012.00 12.00
1.0012.00 1.0012.00 1.0012.00
Hot-work (chromium) steels H10 H11 H12 H13 H14 H19
0.40 0.35 0.35 0.35 0.40 0.40
1.50
5.00 4.25
2.50 1.50 1.50 1.50
Hot-work (tungsten) steels H21 H22 H23 H24 H25 H26
0.35 9.00 0.3511.00 0.30 12.00 0.4515.00 0.2515.00 0.5018.00
Hot-work molybdenum H42 0.60 6.00 High-speed tungsten T1 T2 T4 T5 T6
0.7518.00 0.8018.00 0.7518.00 0.8018.00 0.8020.00
5.00
High-speed molybdenum M1 M2 M4 M6 M7 M10 M30 M33 M34 M36 M41 M42 M43 M44 M46 M47
0.85 0.85/1.00
1.30 0.80 1.00
0.85/1.00 0.80 0.90 0.90 0.80 1.10 1.10 1.20 1.15 1.25 1.10
1.50 6.00 5.50 4.00 1.75
2.00 1.50 2.00 6.00 6.75 1.50 2.75 5.25 2.00 1.50
8.50 5.00 4.50 5.00 8.75 8.00 8.00 9.50 8.00 5.00 3.75 9.50 8.00 6.25 8.25 9.50
3.25 5.00 5.00 5.00 5.00 4.25
3.50 2.00
12.00 3.00 4.00 4.00
4.00
4.00 4.00 4.00 4.00 4.50
4.00 4.00 4.00 4.00 4.00 4.00 4.00 4.00 4.00 4.00 4.25 3.75 3.75 4.25 4.00 3.75
1.00
4.00
0.40 0.40 0.40 1.00
2.00
1.00
2.00
1.00 2.00 1.00 2.00 1.50
1.00 2.00 4.00 1.50 2.00 2.00 1.25 1.15 2.00 2.00 2.00 1.15 1.60 2.00 3.20 1.25
3.00 Co
4.25 Co
5.00 Co 8.00 Co
12.00 Co
12.00 Co
5.00 Co 8.00 Co 8.00 Co 8.00 Co 5.00 Co 8.00 Co 8.25 Co
12.00 Co 8.25 Co 5.00 Co
33 Heat treatment Annealing
Tables 3.20 and 3.21 give the annealing temperatures appropriate for a range of AISI and BS carbon and alloy steels. Table 3.22 gives the annealing temperatures for stainless steels. Data specific to particular steels are given, together with the consequential properties, in the section Mechanical properties.

39
Table 3.20 Annealing temperatures for AISI carbon and alloy steels AISI Annealing temperature °C
Carbon steels 1020 855-900 1025 855-900 1030 845-885 1035 845-885 1040 790-970 1045 790-870 1050 790-870 1060 790-845 1070 790-845 1080 790-845 1090 790-830 1095 790-830 Alloy steels 1330 845-900 1340 845-900 4037 815-855 4130 790-845 4140 790-845 4340 790-845 5130 790-845 5140 815-870 5160 815-870 6150 845-900 8630 790-845 8640 815-870 8650 815-870 8660 815-870 9260 815-870
Table 3.21 Annealing temperatures for BS carbon and alloy steels BS Annealing temperature (°C)
Carbon steels 070M20 880-910 080M30 860-890 080M40 830-860 080M50 810-840 070M55 810-840 Alloy steels 120M36 840-870 150M19 840-900 150M36 840-870 530M40 810-830 605M36 830-860 606M36 830-860 708M40 850-880 817M40 820-850 826M40 820-850 835M30 810-830
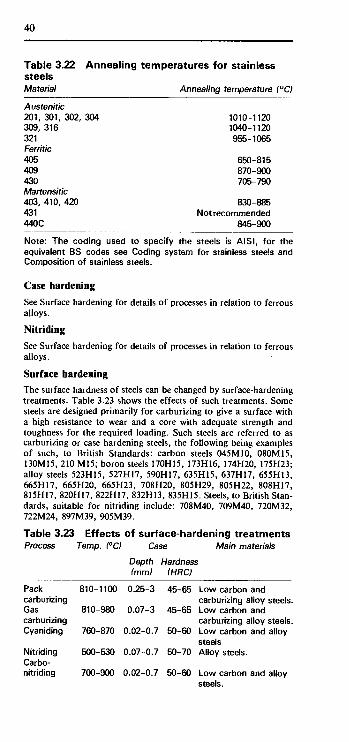
40
Table 3.22 Annealing temperatures for stainless steels Material Annealing temperature (°C)
Austenitic 201, 301, 302, 304 309, 316 321 Ferritic 405 409 430 Martensitic 403, 410, 420 431 440C
1010-1120 1040-1120 955-1065
650-815 870-900 705-790
830-885 Not recommended
845-900
Note: The coding used to specify the steels is AISI, for the equivalent BS codes see Coding system for stainless steels and Composition of stainless steels.
Case hardening
See Surface hardening for details of processes in relation to ferrous alloys.
Nitriding
See Surface hardening for details of processes in relation to ferrous alloys.
Surface hardening
The surface hardness of steels can be changed by surface-hardening treatments. Table 3.23 shows the effects of such treatments. Some steels are designed primarily for carburizing to give a surface with a high resistance to wear and a core with adequate strength and toughness for the required loading. Such steels are referred to as carburizing or case hardening steels, the following being examples of such, to British Standards: carbon steels 045M10, 080M15, 130M15, 210 M15; boron steels 170H15, 173H16, 174H20, 175H23; alloy steels 523H15, 527H17, 590H17, 635H15, 637H17, 655H13, 665H17, 665H20, 665H23, 708H20, 805H29, 805H22, 808H17, 815H17, 820H17, 822H17, 832H13, 835H15. Steels, to British Stan-dards, suitable for nitriding include: 708M40, 709M40, 720M32, 722M24, 897M39, 905M39.
Table 3.23 Effects of surface-hardening treatments Process Temp. (°C) Case Main materials
Depth Hardness (mm) (HRC)
Pack 810-1100 0.25-3 45-65 Low carbon and carburizing carburizing alloy steels. Gas 810-980 0.07-3 45-65 Low carbon and carburizing carburizing alloy steels. Cyaniding 760-870 0.02-0.7 50-60 Low carbon and alloy
steels Nitriding 500-530 0.07-0.7 50-70 Alloy steels. Carbo-nitriding 700-900 0.02-0.7 50-60 Low carbon and alloy

41
Flame 850-1000 Up to 0.8 55-65 0.4 to 0.7% carbon hardening steels. Induction 850-1000 0.5-5 55-65 0.4 to 0.7% carbon hardening steels.
Tempering
Tempering is the name given to the process in which a steel, hardened as a result of quenching, is reheated to a temperature below the A i critical temperature in order to modify the martensitic structure of the steel. After quenching the tensile strength is a maximum and the toughness a minimum. In general, the higher the tempering temperature the lower the resulting tensile strength and the higher the toughness. Figure 3.2 shows the type of changes in properties produced for an alloy steel (0.40% carbon, 0.70% manganese, 1.8% nickel, 0.80% chromium and 0.25% molybdenum).
200 300 400 500 600 700 Temperature (°C)
S 600 X ^ 500 GO
c 400 V S3 300 EC
200
_ ^SN*** N<IIII
1 1 1 l . . _ l 200 300 400 500 600 700
Temperature (°C)
Tensile strength
200 300 400 500 600 700 Temperature (°C)
Figure 3.2 The effect of tempering on the properties of a steel
See the data given with Tensile properties for the effects of tempering on the properties of a range of steels.

42
3.4 Properties Creep properties
The approximate high temperature limits of use of ferrous alloys, set by creep (rupture stress falling below about 50 MPa or MN m - 2
in 100 000 hours) are given in Table 3.24. Table 3.25 gives values of rupture stresses at different temperatures for some typical steels.
Table 3.24 High temperature limits of ferrous alloys Material High temp, limit
Cast irons 350°C Carbon steels 450°C Chromium-molybdenum steels 550°C 18% chromium-10% nickel steel 600°C 25% chromium-20% nickel steel 750°C
Table 3.25 Rupture stresses for steels Composition (% main elements) Rupture stress (MPa or MN m~2)
Heat treated condition
0.2 C, 0.75 Mn Norm. 920°C, Temp. 600°C 0.17 C, 1.3 Mn Norm. 920°C, Temp. 600°C 5 Cr, 0.5 Mo Annealed
9 Cr, 1 Mo Norm. 990°C, Temp. 750°C 18 Cr, 8 Ni Air cool 1050°C
18 Cr, 12 Ni, 2 Mo
1 000h 10 000 h
100 000 h 1 000h
10 000 h 100 000 h
1 000h 10 000 h
100 000 h 1 000h
10 000 h 100 000 h
1 000h 10 000 h
100 000 h 1 000h
Norm.1050°C,aircool10 000 h
25 Cr, 20 Ni 100 000 h
1 000h 1000/1150°C air cool/10 000 h quench
Density
See Specific gravity.
100 000 h
Electrical resistivity
AO0°C 5Q0°C 600°C 7O0°C 800°C
295 225 147 310 235 167 230 200 170 275 260 240 354 336 323 477 462 430
118 59 30
118 67 30
130 100 75
200 170 130 262 231 200 385 338 293
100 75 54
146 100 70
230 185 139 175 135 42
54 31 20
108 70 46 88 58 17
35 22 11 39 20 6
Table 3.26 shows the electrical resistivities that are typical of different types of ferrous alloys at 20°C.
Table 3.26 Electrical resistivities of ferrous alloys Material Resistivity μΩ m
Mild steel 0.16 Medium carbon steel 0.17 Manganese steel 0.23 Free-cutting steel 0.17

43
Nickel-manganese steel 0.23-0.39 Chromium steels 0.22 Chromium-molybdenum steel 0.22 Nickel-chromium-molybdenum steel 0.25-0.27 Stainless, austenitic 0.69-0.78 Stainless, ferritic 0.60 Stainless, martensitic 0.55-0.70
Note: Resistivities are affected by the heat treatment that a metal has undergone.
Fatigue
The endurance limit for most ferrous materials is approximately 0.4 to 0.6 times the tensile strength. Values in practice do however very much depend on the surface conditions of the component concerned. Hardness
For hardness values of steels see the tables given in this chapter under Mechanical properties or, in the case of tool steels, under Tool steels properties. Impact properties
See the tables with Mechanical properties for values of impact energies for various steels. The values are given for temperatures of the order of 20°C. However, most steels become brittle at lower temperatures and this shows as a marked decrease in the impact energy of a material. For some steels this ductile-brittle transition occurs at about 0°C, for others it may be as low as -60°C or -80°C.
Machinability
The machinability of a steel is affected by its composition, its microstructure and its hardness. The machinability of an alloy is improved by the addition of sulphur and/or lead, whereas elements such as aluminium and silicon can reduce the machinability. Leaded and resulphurized steels are thus known as free-cutting steels because of their good machinability. The addition of sulphur and/or lead to an alloy does give some slight reduction in mechanical properties and welding is not generally recommended. Machinability is also affected by the microstructure. Thus, for example, ferritic steels have better machinability than martensitic steels.
A machinability index is used to give a measure of the ease of machining for materials. In the AISI system an index of 100% is specified for 1212 steel and all others are rated in relation to it. In the British Standards system the metal used is 070M20. 1212 is a resulphurized, rephosphorized steel while 070M20 is just a carbon steel. Tables 3.27 and 3.28 give typical values of this index for various ferrous materials.
Table 3.27 AISI machinability index values for steels Material AISI machinability index (%)
Carbon steels 1010 55 1015 60 1020 65 1030 70 1040 60

44
1050 45 Resulphurized and rephosphorized carbon steels 1211 1212 1213 Alloy steels 1340 4130 4320 5140 6150 8640 8660
94 100 136
50 70 60 65 55 65 55
Table 3.28 BS machinability index values for steels Material
Carbon Steels 070M20 080M30 080M40 080M50 070M55 Alloy steels 120M36 150M19 150M36 530M40 605M36 708M40 722M24 817M40 Free-cutting steels 210M15 212M36 214M15 220M07
BS machinability index (%)
100 70 70 50 50
65 70 65 40 50 40 35 35
200 70
140 200
Mechanical properties of alloy steels
Tables 3.29 and 3.30 give the tensile properties of typical alloy steels, Table 3.29 according to American steel specifications and Table 3.30 to British Standards. The compositions of these steels can be seen in the section (in this chapter), Composition of alloy steels. Also included with the tensile properties are hardness and impact energies. The tensile modulus for all steels is about 200 to 207 GPa or GN
Table 3.29 Mechanical properties of AISI -SAE alloy steels AISI Condition Tensile Yield Elong- Hard- Impact
strength stress ation ness Izod (MPa) (MPa) (%) (BH) (J)
Manganese steels 1330 Q, T 200°C
Q, T 650°C 1340 Q, T 200°C
Q, T 650°C
1600 730
1800 800
1450 570
1600 620
9 23 11 22
460 216 500 250
m-2.

N870°C A800°C
Molybdenum steels 4037 Q, T 200°C
Q, T 650°C
840 700
1030 700
560 440
760 420
Chromium-molybdenum steels 4130 Q, T 200°C
Q, T 650°C N870°C A860°C
4140 Q, T 200°C Q, T 650°C N870°C A 815°C
1630 810 670 560
1770 760
1020 660
1460 700 440 360
1640 650 660 420
Nickel-chromium-molybdenum steels 4320 N895°C
A850°C 4340 Q, T 200°C
Q, T 650°C N870°C A 810°C
790 580
1880 970
1280 745
Nickel-molybdenum steels 4620 N900°C
A855°C 4820 N860°C
A 815°C Chromium steels 5130 Q. T 200°C
Qf T 650°C 5140 Q, T 200°C
Q, T 650°C N870°C A830°C
5160 Qf T 200°C Qf T 650°C N855°C A 812°C
575 510 750 680
1610 795
1790 760 790 570
2200 900 960 720
Chromium-vanadium steels 6150 Q, T 200°C
Q, T 650°C N870°C A 815°C
1930 945 940 670
460 610
1680 860 860 470
365 370 485 465
1520 690
1640 660 470 290
1790 800 530 275
1690 840 615 410
Nickel-chromium-molybdenum steels 8620 N915°C
A870°C 8630 Q, T 200°C
Q, T 650°C N 870°C A840°C
8640 Q, T 200°C Q, T 650°C
8650 Q, T 200°C Q, T 650°C N870°C A800°C
8660 Q, T 425°C Q, T 650°C
630 535
1640 770 650 560
1860 900
1940 970
1020 720
1630 965
360 385
1500 690 430 370
1670 800
1680 830 690 390
1550 830
22 26
6 29
10 22 26 28 8
22 18 26
21 29 10 19 12 22
29 31 24 22
10 20 9
25 23 29 4
20 18 17
8 17 22 23
26 31 9
23 24 29 10 20 10 20 14 23 13 20
250 200
310 220
470 245 200 155 510 230 300 200
235 160 520 280 360 220
175 150 230 200
475 245 490 235 230 170 630 270 270 200
540 280 270 200
185 150 465 240 190 155 505 280 525 280 300 210 460 280
90 70
85 60
23 54
73 110 28 50 8
50
130 94
110 93
38 40
11 10
36 27
100 110
73 95 95
90
13 30 22 81
45

46
Silicon steels 9260 Q, T 425°C
Q, T 650°C 1780 980
1500 815
Note: Q = quenched, T = tempered, N =
8 20
470 295
= normalized, A = annealed.
Table 3.30 Mechanical properties of BS alloy steels BS Condition
Manganese steels 120M19 Q, T
N 120M28 Q, T
N 120M36 Q, T
N 150M19 Q, T
N 150M28 Q, T
N 150M36 Q, T
N Chromium steels 526M60 Q, T 530M40 Q, T
Tensile strength
(MPa)
550-700 460
620-770 530
620-770 570
550-700 510
620-770 560
620-770 600
850-1000 700-850
Yield stress (MPa)
355 265 415 330 415 340 340 295 400 325 400 355
620 525
Manganese-molybdenum steels 605M36 Q, T 606M36 Q, T 608M38 Q, T
700-900 700-850 770-930
Nickel-chromium steels 653M31 Q, T 770-930 Chromium-molybdenum steels 708M40 Q, T 709M40 Q, T 722M24 Q, T
700-850 770-930
850-1000
585 525 555
585
525 555 650
Nickel-chromium-molybdenum steels 817M40 Q, T 826M40 Q, T 835M30 Q, T
850-1000 930-1250
1540
650 740
1235
Elong-ation
(%)
18 19 16 16 18 16 18 17 16 16 18 15
11 17
15 15 13
15
17 13 13
13 12 7
Hard-ness (BH)
150-210 140-190 180-230 150-210 180-230 170-220 150-210 150-210 180-230 170-220 180-230 180-230
250-300 200-260
200-255 200-255 220-280
220-280
200-260 220-280 250-300
250-300 270-330
440 Manganese-nickel-chromium-molybdenum steels 945M38 Q, T 700-850 495 15 200-260
Impact Izod (J)
40 34 40 34 40
54 40 47 34 47
54
40 40 34
20
54 27 27
40 34 20
34
Note: Q = quenched, T = tempered, N = normalized. All properties refer to ruling sections up to about 250 mm.
Mechanical properties of carbon steels
Tables 3.31 and 3.32 show the mechanical properties of carbon steels. The tensile modulus of all the steels can be taken as being about 200 to 207 GPa or GN mr2. Figure 3.3 shows how the mechanical properties depend on the percentage of carbon in the alloy, and hence the microstructure present.
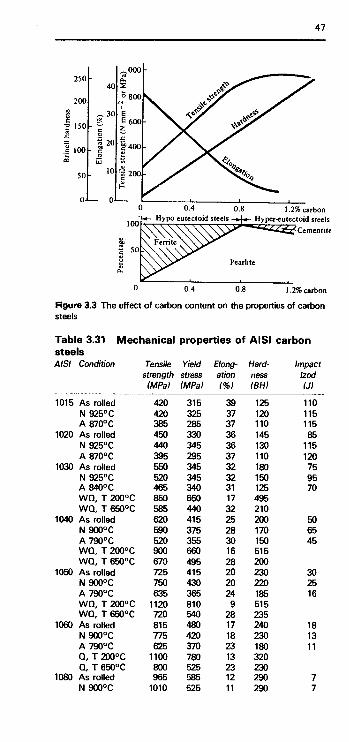
47
250
200 8
Ή 150
8 ιοο CQ
50
0-
40
~ 3 0
^ ο « 20
ο ω
10
— oJ 0 0.4 0.8 1.2% carbon
Hypo eutectoid steels »|« Hyper-eutectoid steels ^Cementite
1.2% carbon
Figure 3.3 The effect of carbon content on the properties of carbon steels
Table 3.31 Mechanical properties of AISI carbon steels AISI Condition
1015 As rolled N 925°C A 870°C
1020 As rolled N 925°C A 870°C
1030 As rolled N 925°C A840°C WQ, T 200°C WQ, T 650°C
1040 As rolled N900°C A790°C WQ, T 200°C WQ, T 650°C
1050 As rolled N900°C A790°C WQ, T 200°C WQ, T 650°C
1060 As rolled N900°C A790°C Q, T 200°C Q, T 650°C
1080 As rolled N900°C
Tensile strength (MPa)
420 420 385 450 440 395 550 520 465 850 585 620 590 520 900 670 725 750 635
1120 720 815 775 625
1100 800 965
1010
Yield stress (MPa)
315 325 285 330 345 295 345 345 340 650 440 415 375 355 660 495 415 430 365 810 540 480 420 370 780 525 585 525
Elong-ation
(%) 39 37 37 36 36 37 32 32 31 17 32 25 28 30 16 28 20 20 24 9
28 17 18 23 13 23 12 11
Hard-ness (BH)
125 120 110 145 130 110 180 150 125 495 210 200 170 150 515 200 230 220 185 515 235 240 230 180 320 230 290 290
Impact Izod U)
110 115 115 85
115 120 75 95 70
50 65 45
30 25 16
18 13 11
7 7
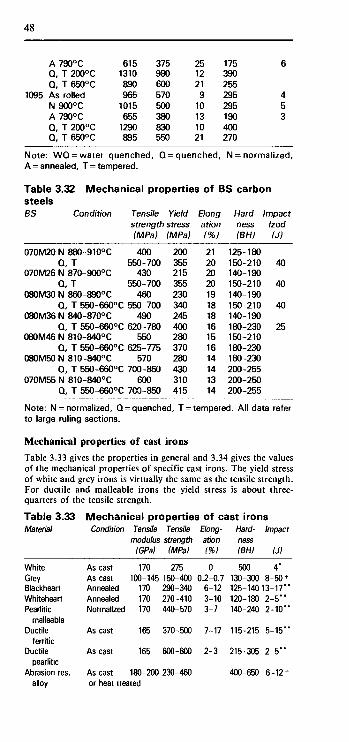
48
A790°C Q, T 200°C Q, T 650°C
1095 As rolled N900°C A790°C Q, T 200°C Q, T 650°C
615 1310 890 965
1015 655
1290 895
375 980 600 570 500 380 830 550
25 12 21 9
10 13 10 21
175 390 255 295 295 190 400 270
6
4 5 3
Note: W Q = water quenched, Q = quenched, N = normalized, A = annealed, T = tempered.
Table 3.32 Mechanical properties of BS carbon steels BS Condition Tensile Yield Elong- Hard- Impact
strength stress ation ness Izod (MPa) (MPa) (%) (BH) (J)
070M20 N 880-910°C Q, T
070M26 N 870-900°C Q, T
080M30 N 860-890°C
400 550-700
430 550-700
460 Q, T 550-660°C 550-700
080M36 N 840-870°C 490 Q, T 550-660°C 620-780
080M46 N 810-840°C 550 Q, T 550-660°C 625-775
080M50 N 810-840°C 570 Q, T 550-660°C 700-850
070M55 N 810-840°C 600 Q, T 550-660°C 700-850
200 355 215 355 230 340 245 400 280 370 280 430 310 415
21 20 20 20 19 18 18 16 15 16 14 14 13 14
125-180 150-210 140-190 150-210 140-190 150-210 140-190 180-230 150-210 180-230 180-230 200-255 200-250 200-255
40
40
40
25
Note: N = normalized, Q = quenched, T = tempered. All data refer to large ruling sections.
Mechanical properties of cast irons
Table 3.33 gives the properties in general and 3.34 gives the values of the mechanical properties of specific cast irons. The yield stress of white and grey irons is virtually the same as the tensile strength. For ductile and malleable irons the yield stress is about three-quarters of the tensile strength.
Table 3.33 Mechanical properties of cast irons Material Condition Tensile Tensile Bong- Hard- Impact
modulus strength ation ness (GPa) (MPa) (%) (BH) (J)
White Grey Blackheart Whiteheart Pearlitic
malleable Ductile
ferritic Ductile
pearlitic Abrasion res.
alloy
As cast 170 275 0 500 4* As cast 100-145 150-400 0.2-0.7 130-300 8-50 + Annealed 170 290-340 6-12 125-14013-17* Annealed 170 270-410 3-10 120-180 2 - 5 " Normalized 170 440-570 3-7 140-240 2-10*
As cast 165 370-500 7-17 115-215 5-15"
As cast 165 600-800 2-3 215-305 2-5**
As cast 180-200 230-460 400-650 6-12 + or heat treated
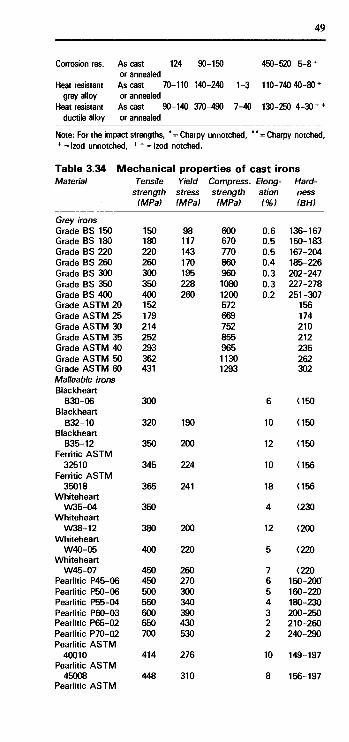
49
Corrosion res. As cast 124 90-150 450-520 5-8+
or annealed Heat resistant As cast 70-110 140-240 1-3 110-740 40-80 +
grey alloy or annealed Heat resistant As cast 90-140 370-490 7-40 130-250 4-30+ +
ductile alloy or annealed
Note: For the impact strengths, ' + = Izod unnotched,
' = Charpy unnotched, + + = Izod notched.
Table 3.34 Mechanical properties of < Material
Grey irons Grade BS 150 Grade BS 180 Grade BS 220 Grade BS 260 Grade BS 300 Grade BS 350 Grade BS 400 Grade ASTM 20 Grade ASTM 25 Grade ASTM 30 Grade ASTM 35 Grade ASTM 40 Grade ASTM 50 Grade ASTM 60 Malleable irons Blackheart
B30-06 Blackheart
B32-10 Blackheart
B35-12 Ferritic ASTM
32510 Ferritic ASTM
35018 Whiteheart
W35-04 Whiteheart
W38-12 Whiteheart
W40-05 Whiteheart
W45-07 Pearlitic P45-06 Pearlitic P50-06 Pearlitic P55-04 Pearlitic P60-03 Pearlitic P65-02 Pearlitic P70-02 Pearlitic ASTM
40010 Pearlitic ASTM
45008 Pearlitic ASTM
Tensile strength
(MPa)
150 180 220 260 300 350 400 152 179 214 252 293 362 431
300
320
350
345
365
350
380
400
450 450 500 550 600 650 700
414
448
Yield stress (MPa)
98 117 143 170 195 228 260
190
200
224
241
200
220
260 270 300 340 390 430 530
276
310
Compress. strength
(MPa)
600 670 770 860 960 1080 1200 572 669 752 855 965 1130 1293
# , = Charpy notched,
cast irons Elong-ation
(%)
0.6 0.5 0.5 0.4 0.3 0.3 0.2
6
10
12
10
18
4
12
5
7 6 5 4 3 2 2
10
8
Hard-ness (BH)
136-167 150-183 167-204 185-226 202-247 227-278 251-307
156 174 210 212 235 262 302
<150
<150
<150
<156
<156
<230
<200
<220
<220 150-200 160-220 180-230 200-250 210-260 240-290
149-197
156-197
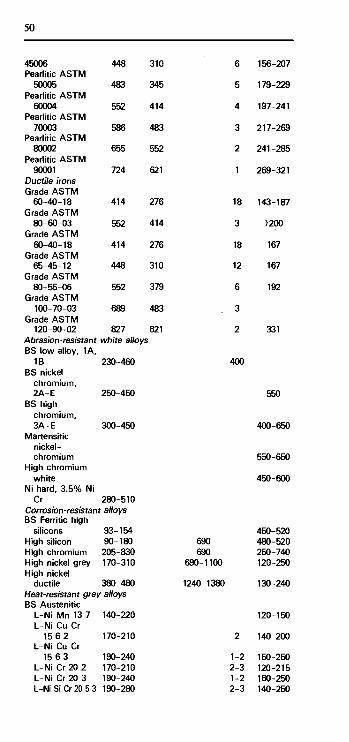
50
45006 Pearlitic ASTM
50005 Pearlitic ASTM
60004 Pearlitic ASTM
70003 Pearlitic ASTM
80002 Pearlitic ASTM
90001 Ductile irons Grade ASTM
60-40-18 Grade ASTM
80-60-03 Grade ASTM
60-40-18 Grade ASTM
65-45-12 Grade ASTM
80-55-06 Grade ASTM
100-70-03 Grade ASTM
120-90-02
448
483
552
586
655
724
414
552
414
448
552
689
827 i Abrasion-resistant white alloys BS low alloy, 1A,
1B BS nickel-
chromium, 2A-E
BS high chromium, 3A-E
Martensitic nickel-chromium
High chromium white
Ni hard, 3.5% Ni Cr
230-460
250-450
300-450
280-510 Corrosion-resistant alloys BS Ferritic high
silicons High silicon High chromium High nickel grey High nickel
ductile
93-154 90-180 205-830 170-310
380-480 Heat-resistant grey alloys BS Austenitic
L-Ni Mn 13 7 L-Ni Cu Cr
15 6 2 L-Ni Cu Cr
15 6 3 L-Ni Cr 20 2 L-Ni Cr 20 3
140-220
170-210
190-240 170-210 190-240
310 6 156-207
345 5 179-229
414 4 197-241
483 3 217-269
552 2 241-285
621 1 269-321
276 18 143-187
414 3 >200
276 18 167
310 12 167
379 6 192
483 3
621 2 331
400
550
400-650
550-650
450-600
450-520 690 480-520 690 250-740
690-1100 120-250
1240-1380 130-240
120-150
140-200
L-Ni Si Cr 20 5 3 190-280
1-2 2-3 1-2 2-3
150-250 120-215 160-250 140-250
2

51
L-Ni Cr 30 3 L-Ni Si Cr 30 5 5 L-Ni 35
Medium silicon grey
High chromium grey
High nickel grey Ni-Cr-Si grey High aluminium
190-240 170-240 120-180
170-310
210-620 170-310 140-310 235-620
Heat-resistant ductile alloys BS Austenitic
S-Ni Mn 13 7 S-Ni Cr 20 2 S-Ni Cr 20 3
390-460 210-260 370-470 210-250 390-490 210-260
S-Ni Si Cr 20 5 2 370-430 210-260 S-Ni 22 S-Ni Mn 23 4 S-Ni Cr 30 1 S-Ni Cr 30 3
370-440 170-250 440-470 210-240 370-440 210-270 370-470 210-260
S-Ni Si Cr 30 5 5 390-490 240-310 S-Ni 35 S-Ni Cr 35 3
Medium silicon ductile
High Ni (20) ductile
370-410 210-240 370-440 210-290
415-690
380-415
620- 1040
690 690- 1100 480-690
1240
1-3
1-3
I
I
15-25 7-20 7-15 10-18 20-40 25-45 13-18 7-18 1-4
20-40 7-10
-1380
120-215 150-210 120-140
170-250
250-500 130-250 110-210 180-350
130-170 140-200 150-255 180-230 130-170 150-180 130-190 140-200 170-250 130-180 140-190
140-300
140-200
Note: the values quoted for yield stress for grey irons are the 0.1% proof stress, for all other irons for which values are given the 0.2% proof stress.
Mechanical properties of free-cutting steels
Tables 3.35 and 3.36 give the mechanical properties of free-cutting/ resulphurized and rephosphorized steels.
Table 3.35 Mechanical properties of AISI resulphurized and rephosphorized steels Material Condition Tensile Yield Elong- Hard- Impact
strength stress ation ness Izod (MPa) (MPa) (%) (BHI (J)
1117
1118
1137
1141
1144
As rolled N900°C A855°C As rolled N 925°C A790°C As rolled N900°C A790°C WQ, T 200°C WQ, T 650°C As rolled N900°C A790°C Q, T 200°C Q, T 650°C As rolled N900°C
490 470 430 520 480 450 630 670 585
1500 650 675 710 600
1630 710 700 670
305 300 280 320 320 285 380 400 345
1165 530 360 405 350
1210 590 420 400
33 34 33 32 34 35 28 23 27 5
25 22 23 26 6
23 21 21
140 140 120 150 140 130 190 200 170 415 190 190 200 160 460 220 210 200
80 85 94
110 103 106 83 64 50
11 53 34
53 43

52
Q, T 200°C Q, T 650°C
880 720
630 500
17 23
280 220
Note: Q = oil quenched, WQ = water quenched, T = tempered, N = normalized, A = annealed.
Table 3.36 Mechanical properties of BS free-cutting steels Material Condition Tensile Yield Elong- Hard- Impact
strength stress ation ness Izod (MPa) (MPa) (%) (BH) (J)
212M36 Q, T 550-660°C 214M15Q 216M36 Q, T 550-660°C 216M44 Q, T 550-660°C 220M07 N 900-930°C 226M44 Q, T 550-660°C 230M07 N 900-930°C
550-700 590
550-700 700-850
360 700-850
360
340
380 450 215 450 215
20 13 15 15 22 16 22
150-210
150-210 200-255
>103 200-255
>103
25 35 25 15
20
Note: Q=oil quenched, T = tempered, N = normalized.
Mechanical properties of maraging steels
Table 3.37 gives the mechanical properties of maraging steels, see Composition of maraging steels for clarification of the grades.
Table 3.37 Mechanical properties of maraging steels Grade Tensile 0.2% Elong- Hard-
strength proof ation ness (MPa) (MPa) (%) (HV)
200 250 300
1390 1700 1930
1340 1620 1810
11 9 7
450 520 570
Mechanical properties of stainless steels
Tables 3.38 and 3.39 give the mechanical properties of typical stainless and heat resisting steels. The tensile modulus of all the steels is about 200 to 207 GPa or GN m"2.
Table 3.38 Mechanical properties of AISI stainless steels AISI
Austenitic 201 301
302 304
309 316 321
Condition
A A 1/2 H A A 1/2 H A A A
Tensile strength
(MPa)
790 760
1450 620 580
1100 620 580 620
Yield stress (MPa)
380 280
1310 310 290
1000 310 290 240
Elong-ation
(%)
55 60 15 50 55 10 45 50 45

53
Ferritic 405 409 430 442 446 Martensitic 403 410 420
431
440C
A A A A A
A A A T200°C T650°C A T200°C T650°C A T300°C
480 470 520 550 550
520 520 655
1760 790 860
1410 870 760
1970
275 275 345 310 345
275 275 345
1380 585 655
1070 655 480
1900
20 20 25 20 20
30 30 25 10 20 20 15 20 13 2
Note: A = annealed, 1/2 H = half hard as a result of being cold worked, FH = fully hard, T = tempered. The yield stress is the 0.2% proof stress.
Table 3.39 Mechanical properties of BS stainless steels BS Condition Tensile Yield Elong Yield
strength stress (MPa) (MPa)
ation (%)
Hard-ness (BH)
Impact Izod (J)
Austenitic 302S31 Soft 303S31 Soft 304S31 Soft 310S31 Soft 316S33 Soft 321S31 Soft Ferritic 403S17 AC 740°C 430S15 AC 780°C Martensitic 410S21 OQ
OQ, T 750°C 416S21 OQ, T 750°C 420S29 OQ, T 400°C
OQ, T 700°C 431S29 OQ, T650°C
510 510 490 510 510 510
415 430
1850 570 700
1500 760 880
190 190 195 205 205 200
280 280
1190 370 370
1360 630 695
40 40 40 40 40 35
20 20
3 33 15 18 26 22
183 183 183 207 183 183
170 170
350 170 205 455 220 260
7 130 25 16 95 34
Note: Soft = softened by heating to about 1000-1100°C, OQ = oil quenched, AC = air cooled, T = tempered.
Oxidation resistance
A factor limiting the use of materials at high temperatures is surface attack, i.e. scaling, due to oxidation. Materials with good oxidation resistance are those that develop an adherent, impervious, oxide layer which can resist the further movement of oxygen. Table 3.40 gives a general idea of the oxidation limits placed on the use of various steels.

54
Table 3.40 Oxidation limits of steels Material Oxidation limit (°C)
Carbon steels 450 0.5% molybdenum steel 500 1% Cr, 0.5% Mo steel 550 12% Cr, Mo, V steel 575 18% Cr, 8% Ni steel 650 19% Cr, 11% Ni, 2% Si steel 900 23% Cr, 20% Ni 1100
Ruling section
The mechanical properties of a steel depend on the size of the cross-section of the material. For this reason, properties are often quoted in terms of the size of the cross-section. The limiting ruling section is the maximum diameter of round bar at the centre of which the specified properties may be obtained. The reason for a difference of mechanical properties occurring for different size bars of the same steel is that during the heat treatment different rates of cooling occur at the centres of the bars due to their differences in size. This results in differences in microstructure and hence differences in mechanical properties. In general, the larger the limiting ruling section the smaller the tensile strength and the greater the percentage elonga-tion. Table 3.41 shows some typical values.
Table 3.41 Effect of ruling section on properties Material Ruling Tensile Yield Elong- Impact
section strength stress ation Izod (mm) (MPa) (MPa) (%) (J)
Carbon steel
Ni-Cr-Mo steel
29 152 29 152
770 700 1100 1000
590 490 930 850
25 25 20 20
60 40 68 68
Specific gravity
The specific gravity of pure iron at 20°C is 7.88. The addition of alloying elements changes this value by relatively small amounts. For example, carbon, manganese, chromium and aluminium decrease this value, while nickel, molybdenum, cobalt and tungsten increase it. The specific gravity of carbon steels thus tends to be about 7.80, alloy steels about 7.81, ferritic and martensitic stainless steels about 7.7 and austenitic stainless steels about 8.0. Thermal properties
The thermal properties, i.e. specific heat capacity, thermal conduc-tivity and linear thermal expansivity (or coefficient of linear expan-sion) vary with temperature. Table 3.42 thus gives average values for temperatures in the region of 20°C. Table 3.42 Thermal properties of ferrous alloys Material Specific Thermal Thermal
ht. cap. conduct. expans. U kg~1 °C~1) (W m-1 °C~1) (10-6 °C~1)
Alloy steel 510 37 12 Carbon steel 480 47 15 Cast iron, grey 265-460 53-44 11

55
Stainless, ferritic 510 26 11 Stainless, martensitic 510 25 11 Stainless, austenitic 510 16 16
Note: To convert J kg - 1 °C"1 to cal g~1 °C_1 multiply by 2.39X10"4. To convert W rrr1 ° C 1 to cal cm-1 °C~1 s~1 multiply by 2.39X10⁻³.
Tool steel properties
Tool steels can be compared on the basis of their hardening and behaviour in use characteristics. Hardening characteristics are the depth of hardening (as a measure of hardenability), the risk of cracking during the hardening operation, the amount of distortion during the hardening operation, and resistance to decarburization (when the steel is heated to hardening temperatures there can be a loss of carbon from surface layers, such a loss leading to a softer surface). Behaviour in use characteristics are resistance to heat softening at temperatures attained during use of the tool, wear resistance, toughness and machinability. Table 3.43 shows a comparison of these properties for tool steels. Table 3.44 gives values of cold and hot hardness for tool steels typical of each type of material. In general, D and O tool steels are subject to less distor-tion than other grades, though distortion can be kept low with O grade. S grade steels have toughness under impact conditions. H steels are designed for use at elevated temperatures. The high speed steels have red hardness, i.e. they retain their hardness and hence cutting edge when cutting at speed and hence becoming hot.
See Coding system for tool steels, Composition of tool steels and Uses of tool steels.
Table 3.43 Comparison of tool steel properties AISI Quench Depth Risk Dist- Resis. Resis. Wear Tough- Machin·
medium of of onion to to resis. ness ability hard, crack. decarb. soft.
Nater hardening W1 W W2 W W5 W
P P P
ihock-resisting S1 0 S2 W S5 0 S7 A
Ytl-hardening 01 O 02 O 06 0 07 0
\ir-hardening A2 A A3 A A4 A A6 A A7 A A8 A A9 A A10 A
M M M G
M M M M
G G G G G G G G
H H H
L H L
VL
L L L L
VL VL VL VL VL VL VL VL
H H H
M H M L
L L L L
VL VL VL VL VL VL VL VL
VH VH VH
M L L M
H H H H
M M
M/H M/H
M M M
M/H
L L L
M L L H
L L L L
H H M M H H H M
F F F
F F F F
M M M M
G VG G G
VG F/G F/G G
H H H
VG VG VG VG
M M M M
M M M M L H H M
VG VG VG
F F F F
G G
VG G
F F
P/F P/F P F F
F/G

56
High carbon-high chromium steels D2 A G VL VL M H VG L P D3 0 G L VL M H VG L P D4 A G VL VL M H VG L P D5 A G VL VL M H VG L P D7 A G VL VL M H VG L P
Hot-work chromium steels H10 A G VL VL M H F G F/G H11 A G VL VL M H F VG F/G H12 A G VL VL M H F VG F/G H13 A G VL VL M H F VG F/G H14 A G VL L M H F G G H19 A G L L M H F/G G G
Hot-work tungsten steels H21 A/0 G L L M H F/G G G H22 A/0 G L L M H F/G G G H23 A/0 G L L M VH F/G F G H24 A/0 G L L M VH G F G H25 A/0 G L L M VH F G G H26 A/0 G L L M VH G F G
Hot-work mqlybdenum steels H42 A/0 G L L M VH G F G
High-speed tungsten steels T1 0 G L M H VH VG L F T1 A/S G L L H VH VG L F T2 0 G L M H VH VG L F T2 A/S G L L H VH VG L F T4 0 G M M M VH VG L F T4 A/S G M L M VH VG L F T5 0 G M M L VH VG L F T5 A/S G M L L VH VG L F T6 0 G M M L VH VG L P/F T6 A/S G M L L VH VG L P/F
High-speed molybdenum steels M1 0 G M/H M L VH VG L F M1 A/S G M/H L L VH VG L F M2 0 G M/H M M VH VG L F M2 A/S G M/H L M VH VG L F M4 0 G M/H M M VH VG L P/F M4 A/S G M/H L M VH VG L P/F M6 0 G M/H M L VH VG L F M6 A/S G M/H L L VH VG L F M7 0 G M/H M L VH VG L F M7 A/S G M/H L L VH VG L F M10 0 G M/H M L VH VG L F M10 A/S G M/H L L VH VG L F M30 0 G M/H M L VH VG L F M30 A/S G M/H L L VH VG L F M33 0 G M/H M L VH VG L F M33 A/S G M/H L L VH VG L F M34 0 G M/H M L VH VG L F M34 A/S G M/H L L VH VG L F M36 0 G M/H M L VH VG L F M36 A/S G M/H L L VH VG L F M41 0 G M/H M L VH VG L F M41 A/S G M/H L L VH VG L F M42 0 G M/H M L VH VG L F M42 A/S G M/H L L VH VG L F M43 0 G M/H M L VH VG L F M43 A/S G M/H L L VH VG L F

57
M44 M44 M46 M46 M47 M47
0 A/S
0 A/S
0 A/S
G G G G G G
M/H M/H M/H M/H M/H M/H
M L M L M M
L L L L L L
VH VH VH VH VH VH
VG VG VG VG VG VG
L L L L L L
F F F F F F
Note: Quench media; W = water, O = oil, A = air, S = salt. Depth of hardness; G = good depth, M = medium depth, P = poor depth. Risk of cracking; H = high risk, M = medium risk, L = low risk. Distortion during hardening; H = high amount, M = medium amount, L = low amount, VL = very low amount. Resistance to decarburization; VH = very high resistance, H = high resistance, M = medium resistance, L = low or little resistance. Resistance to the softening effects of heat; VH = very high resistance, H = high resistance, M = medium resistance, L = low resistance. Wear resistance; VG = very good, G = good, M = medium, F = fair, L = low or little. Toughness; VH= very high, H = high, M = medium, L = low. Machinability; VG = very good, G = good, F = fair, P = poor.
Table 3.44 Hardness values of tool steels Type of tool steel AI SI Hardness Rc
at 20°C at 560°C
Water-hardening Shock-resisting Oil-hardening Air-hardening High C-High Cr High speed tungsten High speed molybdenum
3.5 Uses
W1 S1 01 A2 D2 T1
M10
63 60 63 63 62 66 65
10 20 20 30 35 52 52
Uses of alloy steels Tables 3.45 and 3.46 give some typical uses of a range of the more commonly used alloy steels.
Table 3.45 Uses of BS alloy steels Material Typical uses
Manganese steels 150M19 Makes good welds and used where tensile strengths
up to about 540 MPa are required, e.g. large diameter shafts, lifting gear.
150M36 Less weldable than 150M19 but tensile strength up to about 1000 Pa in small sections. Used for axles, levers, gun parts.
Chromium steels 530M40 A commonly used alloy steel where tensile strengths
less than 700 MPa are required, e.g. crankshafts, axles, connecting rods.
Manganese-molybdenum 605M36 Widely used where tensile strengths up to 850 MPa
are required, e.g. heavy duty shafts, high tensile studs and bolts, connecting rods.

58
608M38 Tensile strength requirements up to about 1000 MPa, e.g. differential shafts, connecting rods, high-tensile studs and bolts.
Nickel-chromium 653M31 Components requiring tensile strengths up to about
900 MPa, e.g. differential shafts, high-tensile studs and bolts, connecting rods.
Chromium-molybdenum 708M40 Widely used where tensile strengths up to about 850
MPa in large sections and 930 MPa in small sections are required.
709M40 Has similar applications to 605M36 but in larger sections. Has good wear resistance. Used for high tensile bolts, track pins.
722M24 Can be nitrided to give a surface hardness of 900 HV. Tough. Used for heavy duty crankshafts, machine tool parts.
Nickel- chromium - molybdenum 817M40 Used where tensile strengths up to 1000 MPa are
required in large sections and 1500 MPa in small sections and where good shock and fatigue properties are necessary, e.g. gears.
826M40 Can be used for components requiring tensile strengths up to 1400 MPa.
835M30 Used where tensile strengths up to 1500 MPa are required.
Manganese-nickel-chromium-molybdenum 945M38 An alternative to 817M40.
Table 3.46 Uses of AISI alloy steels Material Uses
Manganese steels 1330 Used where higher strengths than carbon steels are
required, e.g. axles, shafts, tie rods. 1340 Similar uses to 1330. Molybdenum steels 4037 Used for rear axle drive pinions and gears. Chromium-molybdenum 4130 Has increased hardenability, strength and wear
resistance when compared with comparable carbon steel. Can be oil-quenched instead of water-quenched. Used for aircraft structural parts, car axles, pressure vessels.
4140 Similar uses to 4130. Nickel-molybdenum steels 4620 Used for transmission gears, shafts, roller bearings. 4820 Similar uses to 4620. Chromium steels 5130 Carburizing steel. 5140 Has increased hardenability, strength and wear
resistance when compared with comparable carbon steel.
5160 Used as a spring steel. Nickel-chromium-molybdenum 4340 Has higher elastic limit, impact strength, fatigue
resistance and hardenability than comparable carbon steel. Used for heavy duty, high strength parts, e.g. landing gears.

59
8620 Carburizing steel. 8630 Used for shafts and forgings requiring high strengths. 8650 Similar uses to 8630. Silicon steels 9260 Used for leaf springs.
Uses of carbon steels
Low carbon sheet steel, with about 0.06 to 0.12% carbon, is widely used for car body work and tin plate. It is easily formed and welded and is cheap. It has sufficient strength for such applications, high strength not being a requirement. Such steels are non-heat-treatable and the final condition is as a result of temper-rolling.
Hardenable carbon steels can be considered to fall into three groups: low carbon steels with 0.10 to 0.25% carbon; medium carbon steels with 0.25 to 0.55% carbon and high carbon steels with 0.55 to 1.00% carbon. Low carbon steels are not usually quenched and tempered but may be carburized or case hardened. Such steels are used for engine fans, pulley wheels.and other lightly stressed parts. Medium carbon steels offer a range of properties after quenching and tempering. They have a wide range of uses, e.g. as shafts, or parts in car transmissions, suspensions and steering. High carbon steels are more restricted in their uses since they have poor formability and weldability, as well as being more costly. They are used in the quenched and tempered state and have applications such as clutch cams.
Uses of cast irons
Table 3.47 outlines some of the uses made of cast irons. Grey irons have very good machinability and stability, good wear resistance but poor tensile strength and ductility. They have good strength in compression but poor impact properties. White iron has excellent abrasion resistance and is very hard. It is however virtually unmachinable and so has to be cast to its final shape. Malleable irons have good machinability and stability with higher tensile strengths and ductility than grey irons, also better impact properties. Ductile irons have high tensile strength with reasonable ductility. Their machinability and wear characteristics are good but not as good as those of grey irons.
Table 3.47 Uses of cast irons Material Uses
Grey irons Water pipes, motor cylinders and pistons, machine castings, crankcases, machine tool beds, manhole covers
White iron Wear-resistant parts, such as grinding mill parts and crusher equipment
Malleable irons Wheel hubs, pedals, levers, general hardware, bicycle and motor-cycle frame fittings
Ductile irons Heavy duty piping, crankshafts Abrasion Abrasive materials handling equipment, ore
resistant white crushing jaws Corrosion Uses requiring resistance to oxidizing acids,
resistant alloy High silicon content results in very brittle material which is difficult to machine
Heat resistant High resistance to heat and some resistance grey alloy to corrosion. Ni Mn 13 7 is non-magnetic.
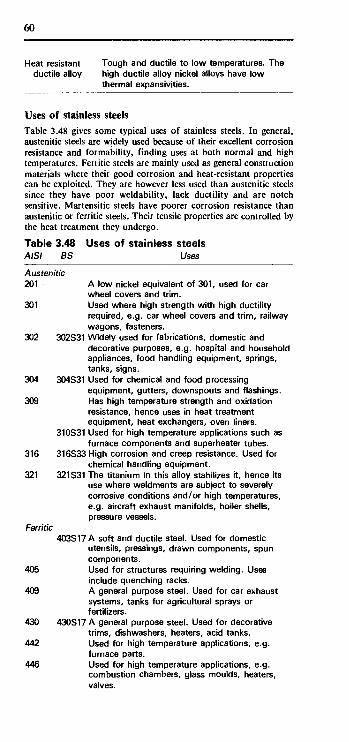
60
Heat resistant Tough and ductile to low temperatures. The ductile alloy high ductile alloy nickel alloys have low
thermal expansivities.
Uses of stainless steels
Table 3.48 gives some typical uses of stainless steels. In general, austenitic steels are widely used because of their excellent corrosion resistance and formability, finding uses at both normal and high temperatures. Ferritic steels are mainly used as general construction materials where their good corrosion and heat-resistant properties can be exploited. They are however less used than austenitic steels since they have poor weldability, lack ductility and are notch sensitive. Martensitic steels have poorer corrosion resistance than austenitic or ferritic steels. Their tensile properties are controlled by the heat treatment they undergo.
Table 3.48 Uses of stainless steels AISI BS Uses
Austenitic 201 A low nickel equivalent of 301, used for car
wheel covers and trim. 301 Used where high strength with high ductility
required, e.g. car wheel covers and trim, railway wagons, fasteners.
302 302S31 Widely used for fabrications, domestic and decorative purposes, e.g. hospital and household appliances, food handling equipment, springs, tanks, signs.
304 304S31 Used for chemical and food processing equipment, gutters, downspouts and flashings.
309 Has high temperature strength and oxidation resistance, hence uses in heat treatment equipment, heat exchangers, oven liners.
310S31 Used for high temperature applications such as furnace components and superheater tubes.
316 316S33 High corrosion and creep resistance. Used for chemical handling equipment.
321 321S31 The titanium in this alloy stabilizes it, hence its use where weldments are subject to severely corrosive conditions and/or high temperatures, e.g. aircraft exhaust manifolds, boiler shells, pressure vessels.
Ferritic 403S17 A soft and ductile steel. Used for domestic
utensils, pressings, drawn components, spun components.
405 Used for structures requiring welding. Uses include quenching racks.
409 A general purpose steel. Used for car exhaust systems, tanks for agricultural sprays or fertilizers.
430 430S17 A general purpose steel. Used for decorative trims, dishwashers, heaters, acid tanks.
442 Used for high temperature applications, e.g. furnace parts.
446 Used for high temperature applications, e.g. combustion chambers, glass moulds, heaters, valves.
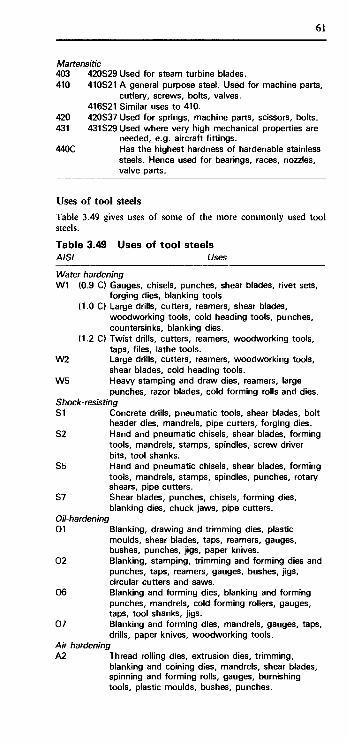
Martensitic 403 420S29 Used for steam turbine blades. 410 410S21 A general purpose steel. Used for machine parts,
cutlery, screws, bolts, valves. 416S21 Similar uses to 410.
420 420S37 Used for springs, machine parts, scissors, bolts. 431 431S29 Used where very high mechanical properties are
needed, e.g. aircraft fittings. 440C Has the highest hardness of hardenable stainless
steels. Hence used for bearings, races, nozzles, valve parts.
Uses of tool steels
Table 3.49 gives uses of some of the more commonly used tool steels. Table 3.49 Uses of tool steels AISI Uses
Water-hardening W1 (0.9 C) Gauges, chisels, punches, shear blades, rivet sets,
forging dies, blanking tools (1.0 C) Large drills, cutters, reamers, shear blades,
woodworking tools, cold heading tools, punches, countersinks, blanking dies.
(1.2 C) Twist drills, cutters, reamers, woodworking tools, taps, files, lathe tools.
W2 Large drills, cutters, reamers, woodworking tools, shear blades, cold heading tools.
W5 Heavy stamping and draw dies, reamers, large punches, razor blades, cold forming rolls and dies.
Shock-resisting 51 Concrete drills, pneumatic tools, shear blades, bolt
header dies, mandrels, pipe cutters, forging dies. 52 Hand and pneumatic chisels, shear blades, forming
tools, mandrels, stamps, spindles, screw driver bits, tool shanks.
S5 Hand and pneumatic chisels, shear blades, forming tools, mandrels, stamps, spindles, punches, rotary shears, pipe cutters.
S7 Shear blades, punches, chisels, forming dies, blanking dies, chuck jaws, pipe cutters.
Oil-hardening 01 Blanking, drawing and trimming dies, plastic
moulds, shear blades, taps, reamers, gauges, bushes, punches, jigs, paper knives.
02 Blanking, stamping, trimming and forming dies and punches, taps, reamers, gauges, bushes, jigs, circular cutters and saws.
06 Blanking and forming dies, blanking and forming punches, mandrels, cold forming rollers, gauges, taps, tool shanks, jigs.
07 Blanking and forming dies, mandrels, gauges, taps, drills, paper knives, woodworking tools.
Air hardening A2 Thread rolling dies, extrusion dies, trimming,
blanking and coining dies, mandrels, shear blades, spinning and forming rolls, gauges, burnishing tools, plastic moulds, bushes, punches.
61

62
A3 As A2. A4 Blanking, forming and trimming dies, punches,
shear blades, mandrels, forming rolls, gauges, punches.
A6 Blanking, forming, coining and trimming dies, punches, shear blades, mandrels, plastic moulds.
A7 Liners for shot blasting equipment, forming dies, gauges, drawing dies.
A8 Blanking, coining and forming dies, shear blades. A9 Cold heading dies, coining dies, forming dies and
rolls, hot-working tools such as punches, mandrels, extrusion tools, hammers.
A10 Blanking and forming dies, gauges, punches, forming rolls, wear plates.
High carbon-high chromium steels D2 Blanking, drawing and cold-forming dies, thread
rolling dies, shear blades, burnishing tools, punches, gauges, broaches, mandrels, cutlery.
D3 Blanking, drawing and cold-forming dies, thread rolling dies, shear blades, burnishing tools, punches, gauges, crimping dies.
D4 Blanking dies, thread rolling dies, wire drawing dies, forming tools and rolls, punches, dies for deep drawing.
D5 Blanking, coining and trimming dies, shear blades, cold forming dies, shear blades, punches, quality cutlery.
D7 Wire drawing dies, deep drawing dies, ceramic tools and dies, sand-blasting liners.
Hot-work chromium steels H10 Hot extrusion and forging dies, mandrels, punches,
hot shears, die holders and inserts. H11 Die-casting dies for light alloys, forging dies,
punches, piercing tools, sleeves, mandrels. H12 Extrusion dies, punches, mandrels, forging die inserts. H13 Die-casting dies and inserts, extrusion dies, forging
dies and inserts. H14 Aluminium and brass extrusion dies, forging dies
and inserts, hot punches. H19 Extrusion dies and inserts, forging dies and inserts,
mandrels, hot punch tools. Hot-work tungsten steels H21 Mandrels, hot blanking dies, hot punches,
extrusion dies and die-casting dies for brass, gripper dies, hot headers.
H22 Mandrels, hot blanking dies, hot punches, extrusion dies, gripper dies.
H23 Extrusion and die-casting dies for brass. H24 Hot blanking and drawing dies, trimming dies, hot
press dies, hot forming dies, hot heading dies, extrusion dies.
H25 Hot forming dies, die-casting and forging dies, shear blades, gripper dies, mandrels, punches, hot swaging dies.
H26 Hot blanking dies, hot punches, hot trimming dies, gripper dies, extrusion dies for brass and copper.
Hot-work molybdenum steels H82 Cold trimming dies, cold header and extrusion dies
and die inserts, hot upsetting dies, hot punches, mandrels.

63
High-speed tungsten steels T1 Drills, taps, reamers, hobs, broaches, lathe and
planer tools, punches, burnishing dies, milling cutters.
T2 Lathe and planer tools, milling cutters, broaches, reamers.
T4 Lathe and planer tools, boring tools, drills, milling cutters, broaches.
T5 Lathe and planer tools, heavy duty tools requiring red hardness.
T6 Heavy duty lathe and planer tools, drills, milling cutters.
High-speed molybdenum steels M1 Drills, taps, reamers, milling cutters, hobs,
punches, lathe and planer tools, form tools, broaches, saws, routers, woodworking tools.
M2 Drills, taps, reamers, milling cutters, hobs, lathe and planer tools, form cutters, broaches, saws, cold forming tools.
M4 Heavy duty broaches, reamers, milling cutters, lathe and planer tools, form cutters, blanking dies and punches, swaging dies.
M6 Lathe and planer tools, form tools, milling cutters, boring tools.
M7 Drills, taps, reamers, routers, saws, milling cutters, lathe and planer tools, woodworking tools, punches, hobs.
M10 As M7. M30 Lathe tools, milling cutters, form tools. M33 Drills, taps, lathe tools, milling cutters. M34 As M33. M36 Heavy duty lathe and planer tools, milling cutters,
drills. M41 Drills, milling cutters, lathe tools, hobs, broaches,
form cutters. M42 AsM41. M43 As M41. M44 AsM41. M46 AsM41. M47 AsM41.

4 Aluminium Alloys 4.1 Materials Aluminium
Pure aluminium is a weak, very ductile, material. The mechanical properties depend not only on the purity of the aluminium but also upon the amount of work to which it has been subject. A range of tempers is thus produced by different amounts of work hardening. It has an electrical conductivity about two-thirds that of copper but weight for weight is a better conductor. Aluminium has a great affinity for oxygen and any fresh metal in air rapidly oxidizes to give a thin layer of the oxide on the metal surface. This layer is not penetrated by oxygen and so protects the metal from further attack.
Aluminium alloys
Aluminium alloys can be divided into two groups, wrought alloys and cast alloys. Each of these can be divided into two further groups: those alloys which are not heat treatable and those which can be heat treated. The non-heat-treatable alloys have their properties controlled by the extent of the working to which they are subject. A range of tempers is thus produced. The heat-treatable alloys have their properties controlled by heat treatment. Like aluminium, the alloys have a low density, good electrical and thermal conductivity and a high corrosion resistance. The corrosion resistance properties of sheet alloy are improved by cladding it with layers of unalloyed aluminium.
The main alloying elements used with aluminium are copper, iron, manganese, magnesium, silicon and zinc. Table 4.1 shows the main effects of such elements. Table 4.1 Alloying elements used wi th aluminium Element Main effects
Copper Up to about 12% increases strength. Precipitation hardening possible. Improves mach inability.
Iron Small percentages increase strength and hardness and reduce chances of hot cracking in castings.
Manganese Improves ductility. Improves, in combination with iron, the castability.
Magnesium Improves strength. Precipitation hardening becomes possible with more than 6%. Improves corrosion resistance.
Silicon Improves castability, giving an excellent casting alloy. Improves corrosion resistance.
Zinc Reduces castability. Improves strength when combined with other alloying elements.
Cast alloys
An alloy for use in the casting process must flow readily to all parts of the mould and on solidifying it should not shrink too much and any shrinking should not result in fractures. The choice of alloy is affected by the casting process used. In sand casting the cooling rate is relatively slow, while with die casting when the metal is injected under pressure it is much faster. The cooling rate affects the strength of the finished casting. Thus an aluminium alloy that might be suitable for sand casting may not be the most appropriate one for die casting.
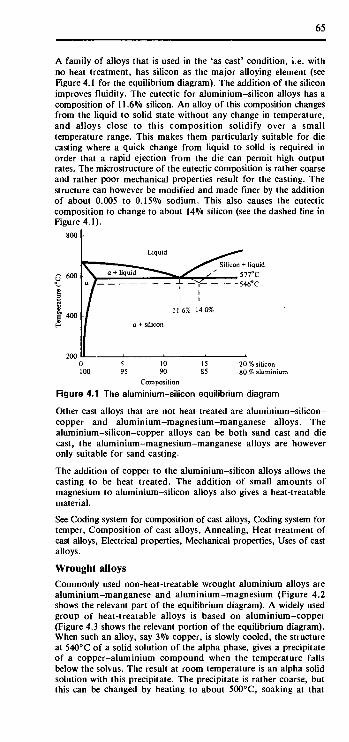
65
A family of alloys that is used in the 'as cast' condition, i.e. with no heat treatment, has silicon as the major alloying element (see Figure 4.1 for the equilibrium diagram). The addition of the silicon improves fluidity. The eutectic for aluminium-silicon alloys has a composition of 11.6% silicon. An alloy of this composition changes from the liquid to solid state without any change in temperature, and alloys close to this composition solidify over a small temperature range. This makes them particularly suitable for die casting where a quick change from liquid to solid is required in order that a rapid ejection from the die can permit high output rates. The microstructure of the eutectic composition is rather coarse and rather poor mechanical properties result for the casting. The structure can however be modified and made finer by the addition of about 0.005 to 0.15% sodium. This also causes the eutectic composition to change to about 14% silicon (see the dashed line in Figure 4.1).
800 I-
0 100
5 95
10 90
15 85
20 % silicon 80 % aluminium
Composition Figure 4.1 The aluminium-silicon equilibrium diagram
Other cast alloys that are not heat treated are aluminium-silicon-copper and aluminium-magnesium-manganese alloys. The aluminium-silicon-copper alloys can be both sand cast and die cast, the aluminium-magnesium-manganese alloys are however only suitable for sand casting.
The addition of copper to the aluminium-silicon alloys allows the casting to be heat treated. The addition of small amounts of magnesium to aluminium-silicon alloys also gives a heat-treatable material.
Coding system for composition of cast alloys, Coding system for per, Composition of cast alloys, Annealing, Heat treatment of
See Coding system for composition of cast alloys, Coding system temper, Composition of cast alloys, Annealing, Heat treatment cast alloys, Electrical properties, Mechanical properties, Uses of c allovs.
cast alloys.
Wrought alloys
Commonly used non-heat-treatable wrought aluminium alloys are aluminium-manganese and aluminium-magnesium (Figure 4.2 shows the relevant part of the equilibrium diagram). A widely used group of heat-treatable alloys is based on aluminium-copper (Figure 4.3 shows the relevant portion of the equilibrium diagram). When such an alloy, say 3% copper, is slowly cooled, the structure at 540°C of a solid solution of the alpha phase, gives a precipitate of a copper-aluminium compound when the temperature falls below the solvus. The result at room temperature is an alpha solid solution with this precipitate. The precipitate is rather coarse, but this can be changed by heating to about 500°C, soaking at that

66
temperature, and then quenching to give a supersaturated solid solu-tion, just alpha phase with no precipitate. This treatment is known as solution treatment and is an unstable situation. With time a fine precipitate is produced. Heating to about 165°C for 10 hours hastens this process. This is called aging and the entire process precipitation hardening, since the result is a stronger, harder material.
800 r-
Liquid
5 10 15
% Magnesium
Figure 4.2 Equilibrium diagram for aluminium-magnesium alloys
600
precipitate
o copper 94% aluminimum 98 94 yn-Λ aiumimmum Structure with
Composition slow cooling Figure 4.3 Figure 4.3 Equilibrium diagram for aluminium-coppei alloys
Other heat-treatable wrought aluminium alloys are aluminium-copper-magnesium-silicon alloys with precipitates forming of an aluminium-copper compound and an aluminium-copper-magnesium compound. Other alloys are based on aluminium-magnesium-silicon and aluminium-zinc-magnesium-copper.
See Coding system for composition of wrought alloys, Coding system for temper, Annealing, Heat treatment of wrought alloys, Electrical properties, Fabrication properties, Mechanical properties, Thermal properties, Forms of material, Uses of wrought alloys.

67
4.2 Codes and compositions Coding system for composition of cast alloys
The Aluminium Association system used for the coding of cast aluminium alloys uses four digits, with the last digit separated from the other three by a decimal point. The first digit represents the prin-cipal alloying element (see Table 4.2). The second and third digits identify specific alloys within the group. The fourth digit indicates the product form, a 0 indicating a casting and a 1 an ingot. A modification of the original composition is indicated by a letter before the numerical code.
Table 4.2 Coding system for cast alloy composition: Aluminium Association Digits Principal alloying element(s)
1XX.X Aluminium of 99.00% minimum purity 2XX.X Copper 3XX.X Silicon plus copper or magnesium 4XX.X Silicon 5XX.X Magnesium 6XX.X Unused series of digits 7XX.X Zinc 8XX.X Tin 9XX.X Other element
In the British Standards (BS) cast alloys are specified according to BS 1490 and the code used consists of the letters LM followed by a number. The number is used to indicate a specific alloy. Table 4.3 indicates the relationship between BS cast alloys and those of the Aluminium Association (AA) for those alloys commonly used and referred to later in this chapter.
Table 4.3 Equivalence of BS and AA numbers for cast alloys BS AA
LM4 319.0 LM5 514.0 LM9 A360.0 LM10 520.0 LM12 222.0 LM13 336.0 LM16 355.0 LM18 443.0 LM20 413.0 LM21 319.0 LM24 A380.0 LM25 356.0 LM30 390.0
Coding system for composition of wrought alloys
The coding system used for composition of wrought aluminium alloys is that of the Aluminium Association. The system uses four digits with the first digit representing the principal alloying element (see Table 4.4). The second digit is used to indicate modifications to impurity limits. The last two digits, for the 1XXX alloys, indicate the aluminium content above 99.00% in hundredths. For alloys in other series of digits, the last two digits are used purely to iden

68
specific alloys.
Table 4.4 Coding system for wrought alloy composition Digits Principal alloying element(s)
1XXX Aluminium of 99.00% minimum purity 2XXX Copper 3XXX Manganese 4XXX Silicon 5XXX Magnesium 6XXX Magnesium and silicon 7XXX Zinc 8XXX Other elements 9XXX Unused series of digits
Coding system for temper
The complete specification of an alloy, cast or wrought, requires a specification of the temper, i.e. degree of cold work or heat treat-ment, in conjunction with the composition specification. Table 4.5 shows the basic designations used according to the American system. The British system is a variation of this and is shown in Table 4.7. The basic letter designations can have numbers after them to indicate degrees of cold working or heat treatment, Table 4.6 showing the more commonly used ones. The full specification thus consists of the alloy composition codes followed by a dash and then the temper designation, e.g. 1060-H14.
Table 4.5 Basic American temper codes Code Temper
F As fabricated. 0 Annealed. H Strain hardened, wrought products only. T Heat treated to produce stable tempers other than those
specified by O or H. W Solution heat treated. Used only with those alloys that
naturally age harden.
Table 4.6 Subdivisions of temper codes Subdivision Temper
Strain hardened H1 Strain hardened only, no heat treatment. The
degree of hardening is indicated by a second digit 1 to 8. 1 indicates the least amount of hardening, 8 the most. H12 is quarter hard, H14 half hard, H16 three-quarters hard, H18 full hard.
H2 Strain hardened and partially annealed. The degree of hardening, after the annealing, is indicated by a second digit 1 to 8, as with H1
H3 Strain hardened and stabilized by a low temperature heat treatment. The degree of hardening, before the stabilization, is indicated by a second digit 1 to 8, as with H1.
Heat treated T1 Cooled from an elevated temperature shaping
process and naturally aged. T2 Cooled from an elevated temperature shaping

69
process, cold worked, and naturally aged T3 Solution heat treated, cold worked and naturally
aged. T4 Solution heat treated and naturally aged. T42
indicates the material is solution treated from the 0 or F temper.
T5 Cooled from an elevated temperature shaping process and then artificially aged.
T51 Stress relieved by stretching, after solution treatment or cooling from an elevated temperature shaping. T510 are products that receive no further straightening after stretching, T511 is where some minor straightening may occur.
T52 Stress relieved by compressing, after solution treatment or cooling from an elevated temperature shaping.
T54 Stress relieved by combined stretching and compressing.
T6 Solution heat treated and then artificially aged. T62 indicates the material is solution heat treated from the 0 or F temper.
T7 Solution heat treated and stabilized. T8 Solution heat treated, cold worked, and artificially
aged. T9 Solution heat treated, artificially aged and then
cold worked. T10 Cooled from an elevated temperature shaping
process,cold worked and then artificially aged.
Table 4.7 British (BS) temper codes BS Code American Temper
equivalent
M 0 H
F 0 H
As manufactured. Annealed. Strain hardened. Followed by a number 1 to 8 to indicate degree of hardening, as with the American codes.
TB T4 Solution treated and naturally aged. No cold work after heat treatment, other than possibly some slight flattening or straightening.
TB7 T7 Solution treated and stabilized. TD T3 Solution heat treated, cold worked and
naturally aged. TE T10 Cooled from an elevated temperature
shaping process and precipitation hardened.
TF T6 Solution heat treated and precipitation hardened.
TF7 Solution treated, precipitation hardened and stabilized.
TH T8 Solution heat treated, cold worked and then precipitation hardened.
TS T Thermally treated to improve dimensional stability.

70
Composition of cast alloys Table 4.8 shows the compositions of commonly used Aluminium Association aluminium cast alloys, and Table 4.9 those for British Standards.
Table 4.8 Composition of AA cast alloys AA no. Process
Si
Non-heat-treatable Aluminium-copper alloys 208.0 S* 3.0 213.0 S, P 2.0
Composition percentages
Cu
4.0 7.0
Aluminium-silicon-copper/magi 308.0 S, P 5.5 319.0 S, P* 6.0 360.0 D 9.5 A360.0 D 9.5 380.0 D 8.5 Aluminium-silicon alloys 413.0 D 12.0 C443.0 D 5.2 Heat-treatable Aluminium-copper alloys 222.0 S, P 242.0 S, P 295.0 P 0.8
4.5 3.5
3.5
<0.6
10.0 4.0 4.5
Mg
lesium
0.50 0.50
0.25 1.5
Aluminium-silicon-magnesium alloys 355.0 S, P 5.0 356.0 S, P 7.0 357.0 S, P 7.0
1.2 (0.25
<0.50 0.32 0.50
Mn
alloys
<0.35
Other
<0.6 Fe,
<2.0 Fe <1.3 Fe <2.0 Fe
<2.0 Fe <2.0 Fe
2.0 Ni
<0.35 Zn
Note: Process S = sand casting, P = permanent mould casting, D = die casting. With S and P the metal is poured into the mould under gravity, with D it is under pressure. D gives the fastest cooling rate, S the slowest. " = heat treatment is optional.
Table 4.9 Composition of BS cast alloys BS Process Mean composition percentages
LM4 LM5 LM6 LM9 LM10 LM12 LM13 LM16 LM18 LM20 LM21 LM24 LM25 LM30
S, C S, C S,C S, C
s, c C s, c S, C S, C C S, C C s, c C
Si
5.0 <0.3 11.5 11.5
<0.25 <2.5 11.0 5.0 5.3
11.5 6.0 8.0 7.0
17.0
Cu
3.0 <0.1 <0.1 <0.1 <0.1 10.0 0.9 1.3 0.1
<0.4 4.5 3.5
<0.1 4.5
Mg
<0.15 4.5
<0.1 0.4
10.2 0.3 1.2 0.5
<0.1 <0.2 0.2
<0.3 0.4 0.6
Mn Other
0.4 <1.0Fe, <0.3Ni, <0.5Zn 0.5 <0.6 Fe, <0.3 Ni, <0.1 Zn
<0.5 <0.6 Fe, <0.1 Ni, <0.1 Zn 0.5 <0.6 Fe, <0.1 Ni, <0.1 Zn
<0.1 <0.35 Fe, <0.1 Ni, <0.1 Zn <0.6 <1.0Fe, <0.5Ni, <0.8 Zn <0.5 <1.0Fe, <1.5Ni, <0.5Zn <0.5 <0.6 Fe, <0.1 Zn, <0.25 Ni 0.5 0.6 Fe, <0.1 Ni, <0.1 Zn
<0.5 <1.0Fe, <0.1 Ni, <0.2 Zn 0.4 <1.0Fe, <0.3Ni, <2.0 Zn
<0.5 <1.3Fe, <0.5Ni, <0.1 Zn <0.3 <0.5Fe, <0.1 Ni,<0.1 Zn <0.3 <1.1 Fe, <0.1 Ni, <0.2 Zn
Note: All the alloys also contain about 0.1-0.3 Pb, 0.05-0.10 Sn and 0.2 Ti. S = sand casting, C = chill casting, i.e. where the die causes a more rapid cooling than sand casting.

71
Composition of wrought alloys
Table 4.10 shows the composition of commonly used wrought alloys specified to the Aluminium Association codes.
Table 4.10 Composition of wrought alloys AA Composition percentages no. AI Mn
Non-heat-treatable Unalloyed aluminium 1050 1060 1100 1200
>99.50 >99.60 >99.00 >99.00
Mg Cu
0.12
Aluminium-manganese alloys 3003 3004 3105
98.6 1.2 97.8 1.2 1.0 99.0 0.55 0.50
0.12
Aluminium-magnesium alloys 5005 5050 5052 5083 5086 5154 5252 5454 5456
99.2 98.6 97.2 94.7 0.7 95.4 0.4 96.2 97.5 96.3 0.8 93.9 0.8
Heat-treatable
0.8 1.4 2.5 4.4 4.0 3.5 2.5 2.7 5.1
Aluminium-copper alloys 2011 2014 2024 2219 2618
93.7 93.5 0.8 93.5 0.6 93.0 0.3 93.7
0.5 1.5
1.6
5.5 4.4 4.4 6.3
Si
0.8
2.3 0.18
Cr
0.25 0.15 0.15 0.25
0.12 0.12
Other
Cu, Si, Fe Cu, Si, Fe
Si, Fe Cu, Si, Fe
0.4 Bi, 0.4 Pb
0.06 Ti, 0.1 V, 0.18 Zr 1.1 Fe, 1.0 Ni0.07Ti
Aluminium - magnesium-silicon alloys 6061 97.9 1.0 0.28 0.6 0.2 6063 98.9 0.7 0.4 6151 98.2 0.6 0.9 0.25 6262 96.8 1.0 0.28 0.6 0.09 Aluminium-zinc-magnesium-copper alloys 7075 90.0 2.5 1.6 0.23 7178 88.1 2.7 2.0 0.26
0.6 Bi, 0.6 Pb
5.6 Zn 6.8 Zn
4.3 Heat treatment Annealing
Typical annealing temperatures and procedures for Aluminium Association specification wrought alloys to bring them to the O temper are as follows. For the 1XXX, 3XXX, 5XXX series a temperature of 345°C with both the soaking time and cooling rate not being important. 3003 is an exception to this, requiring a temperature of 415°C. The 2XXX and 6XXX series require temperatures of 415°C with a soaking time of 2 to 3 hours and a cooling rate of about 30°C/h to 260°C. An exception to this is 2036 with a temperature of 385°C. The 7XXX series requires a temperature of 415°C and a soaking time of 2 to 3 hours. There is then uncontrolled cooling to about 200°C followed by reheating to

72
230°C for 4 hours. An exception to this is 7005 which requires a temperature of 345 °C, a soaking time of 2 to 3 hours followed by a cooling rate of 30°C/h or less to 200°C.
Heat treatment for cast alloys
Table 4.11 shows typical heat treatments, solution heat treatment and aging, for commonly used Aluminium Association cast alloys. The solution heat treatment is generally followed by quenching in water at 65 to 100°C. Table 4.12 shows similar data for British Stan-dard cast alloys.
Table 4.11 Heat treatment for AA cast alloys AA no. Cast. Solution h.t. Aging h.t. Temper
222.0
242.0
295.0
355.0
356.0
357.0
type
S S P S S S/P
s s s S/P
s P
s P S/P
s P
s P
s P
temp. °C
510
515 515 515 515
525 525 525 525
540 540 540 540 540 540
time h
12
4-12 12 12 12
12 4-12
12 4-12
12 4-12
12 4-12 10-12
8
temp. °C
315 155 170 345 205
205-230
155 260 225 155 155 225 225 225 155 155 205 225 155 175
time h
3 11
16-22 3 8
3-5
3-6 4-6 7-9 3-5 2-5 3-5 3-9 7-9 3-5 2-5 3-5 7-9
10-12 6
O T61 T551 O T571 T61 T4 T6 T7 T51 T6 T6 T7 T7 T51 T6 T6 T7 T7 T61 T6
Note: S = sand casting, P = permanent mould casting.
Table 4.12 Heat treatment for BS cast alloys BS Solution h.t. Quench Precipitation h.t. Temper
LM4 LM9
LM10 LM13
LM16
LM25
LM30
temp.°C
505-520
520-535 425-435
515-525 515-525 520-530 520-530 525-545
525-545
time h
6-16
2-8 8
8 8 12 12
4-12
4-12
meaium . 0~ temp. °C
W 70-80 150-170 150-170
W 150-170 O 160m
160-180 W 70-80 160-180 W 70-80 200-250 W 70-80 W 70-80 160-170 W 70-80 250
155-175 W 70-80 155-175
175-225
time h
6-18 16 16
4-16 4-16 4-16
8-10 2-4
8-12 8-12
8
TF(T10) TE(T6) TF(T6) TB(T4) TE(T10) TF(T6) TF7 TB(T4) TRT6) TB7(T7) TE(T10) TF(T6) TS(T)
Note: Quench medium; W = water, W 70-80 = water at 70 to 80°C, 0 160m = oil at a maximum of 160°C.

73
Heat treatment for wrought alloys
Table 4.13 gives the solution heat treatment and precipitation heat treatment temperatures, with the resulting tempers for commonly used wrought alloys to the Aluminium Association specification. The tempers produced depend on the product form, e.g. whether it is flat sheet or extruded bar, and any other treatments carried out between solution and precipitation treatments. The table can thus only give an indication of possible outcomes. After solution treat-ment the alloys are quenched in water at room temperature.
Table 4.13 Solution and precipitation heat treatments AA Solution h.t. Precipitation h.t.
temp. °C
Aluminium - copper 2011 525
2014 500
2024 495
2219 535
temper temp.° C
alloys T4(TB) + CW
T3(TD) T4(TB)
+ CW T3(TD) T4(TB)
+ CW T3(TD)
+ CW T3KTD) T42(TB)
160 160
160
190
190 190
A luminium - magnesium -silicon alloy 6061 530
6063 520
6151 515 6262 540
T4(TB) T42(TB) T4(TB)
T42(TB) T4(TB) T4(TB)
T42ITB)
160 160 175 175 170 170 170
time h
14 10/18
18
12
18 36
18 18 8 8
10 8 8
Aluminium-zinc-magnesium-copper alloys 7075 480 W
+ SR W51 120 120
24 24
temper
T8(TH) T6(TF)
T6(TF)
+ CWT8KTH)
+ CWT8KTH) T62(TF)
T6(TF) T62(TF) T6(TF)
T62ITF) T6(TF) T6(TF)
T62(TF)
T6(TF) T651
Note: CW = cold worked, SR = stress relieved. Where possible the nearest equivalent BS temper has been given in parentheses.
4 A Properties Density
The density of aluminium at 20°C is 2.69 g cm*3 and the alloys have values between about 2.6 and 2.8 g cm-3. Electrical properties
Tables 4.14 and 4.15 show, for a temperature of 20°C, the electrical resistivities in units of Ω m and electrical conductivities on the IACS scale. This scale expresses conductivities as a percentage of the conductivity of an annealed copper standard at 20°C, this having a resistivity of 1.7241 x 10~8 Ω m.
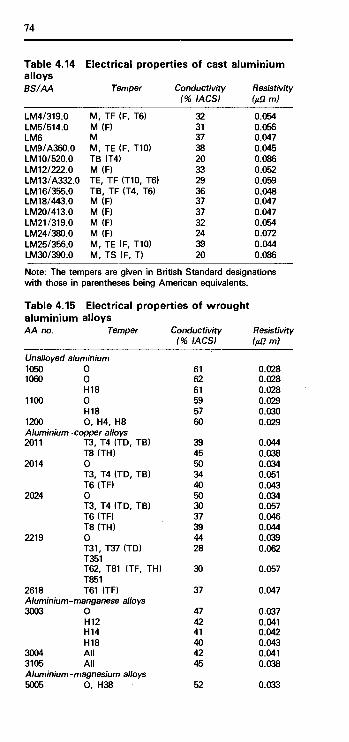
74
Table 4.14 Electrical properties of cast aluminium alloys BS/AA Temper Conductivity Resistivity
(% IACS) (μΩ m)
LM4/319.0 LM5/514.0 LM6 LM9/A360.0 LM10/520.0 LM12/222.0 LM13/A332.0 LM16/355.0 LM18/443.0 LM20/413.0 LM21/319.0 LM24/380.0 LM25/356.0 LM30/390.0
M, TF (F, T6) M (F) M M, TE (F, T10) TB (T4) M (F) TE, TF (T10, T6) TB, TF (T4, T6) M (F) M(F) M (F) M (F) M, TE (F, T10) M, TS (F, T)
32 31 37 38 20 33 29 36 37 37 32 24 39 20
0.054 0.056 0.047 0.045 0.086 0.052 0.059 0.048 0.047 0.047 0.054 0.072 0.044 0.086
Note: The tempers are given in British Standard designations with those in parentheses being American equivalents.
Table 4.15 Electrical properties of wrought aluminium alloys AA no. Temper Conductivity
(% IACS) Resistivity (μΩ m)
Unalloyed aluminium 1050 1060
1100
1200 Aluminium 2011
2014
2024
2219
2618 Aluminium 3003
3004 3105 Aluminium 5005
0 0 H18 0 H18 0, H4, H8
-copper alloys T3, T4 (TD, TB) T8 (TH) 0 T3, T4 (TD, TB) T6 (TF) 0 T3, T4 (TD, TB) T6 (TF) T8 (TH) 0 T31, T37 (TD) T351 T62, T81 (TF, TH) T851 T61 (TF)
-manganese alloys 0 H12 H14 H18 All All
-magnesium alloys 0, H38
61 62 61 59 57 60
39 45 50 34 40 50 30 37 39 44 28
30
37
47 42 41 40 42 45
52
0.028 0.028 0.028 0.029 0.030 0.029
0.044 0.038 0.034 0.051 0.043 0.034 0.057 0.046 0.044 0.039 0.062
0.057
0.047
0.037 0.041 0.042 0.043 0.041 0.038
0.033
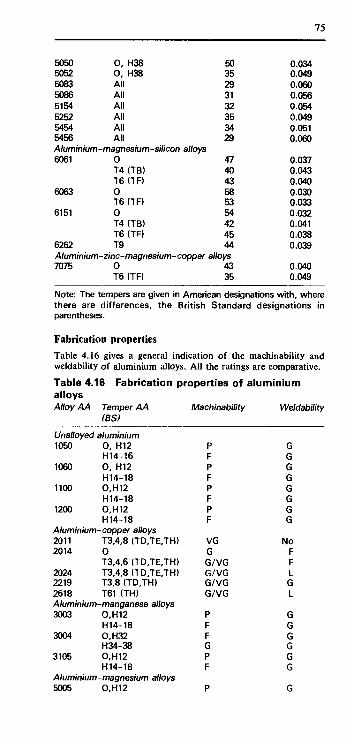
75
5050 5052 5083 5086 5154 5252 5454 5456 Aluminium-6061
6063
6151
6262 Aluminium 7075
0, H38 0, H38 All All All All All All
-magnesium-silicon alloys 0 T4 (TB) T6 (TF) 0 T6 (TF) 0 T4 (TB) T6 (TF) T9
-zinc-magnesium-copper 0 T6 (TF)
50 35 29 31 32 35 34 29
47 40 43 58 53 54 42 45 44
alloys 43 35
0.034 0.049 0.060 0.056 0.054 0.049 0.051 0.060
0.037 0.043 0.040 0.030 0.033 0.032 0.041 0.038 0.039
0.040 0.049
Note: The tempers are given in American designations with, where there are differences, the British Standard designations in parentheses.
Fabrication properties
Table 4.16 gives a general indication of the machinability and weldability of aluminium alloys. All the ratings are comparative. Table 4.16 Fabrication properties of aluminium alloys Alloy AA Temper AA Machinability Weldability
(BS)
Unalloyed aluminium 1050 0, H12
H14-16 1060 0, H12
H14-18 1100 0,H12
H14-18 1200 0,H12
H14-18 Aluminium-copper alloys 2011 T3,4,8 (TD,TE,TH) 2014 0
T3,4,6 (TD,TE,TH) 2024 T3,4,8 (TD,TE,TH) 2219 T3,8 (TD,TH) 2618 T61 (TH) Aluminium-manganese alloys 3003 0,H12
H14-18 3004 0,H32
H34-38 3105 0,H12
H14-18 Aluminium-magnesium alloys 5005 0,H12
P F P F P F P F
VG G G/VG G/VG G/VG G/VG
P F F G P F
G G G G G G G G
No F F L G L
G G G G G G

76
5050
5052
5083
5086
5154
5252
5454
5456
Aluminium 6061
6063
6262 Aluminium 7075
H14-18 F 0 P H32-38 F/G 0,H32 F H34-38 G 0,H111 F H323 F 0,H32 F H34-38 G 0,H32 F H34-38 G H24 F H25-28 G 0,H32 F H34 G 0 F H111,321 F
)-magnesium-silicon alloys 0 F T4, T6 (TBJF) G T1, T4 (TB) F T5, T6 (TF) G T6, T9 (TF) G/VG
)-zinc-magnesium-copoer alloys 0 F T6 (TF) G/VG
G G G G G F F F F F F G G F F F G
G G G G G
No No
Note: Machinability; VG = very good, giving an excellent finish, G = good, giving a good finish, F = fair, giving a satisfactory finish, P = poor, care is needed to obtain a satisfactory finish. Weldability; G = good, readily weldable by all techniques, F = fair, weldable well by most techniques, L = limited weldability, not all techniques possible, No = not recommended for welding.
Tempers are given on the American system and where the British system differs the equivalent tempers are given in parentheses.
Fatigue properties
The fatigue strength, at 50 x 106 cycles, of aluminium alloys tends to be about 0.3 to 0.5 times the tensile strength. The value for a particular alloy depends on the temper.
Machinability
See Fabrication properties.
Mechanical properties of cast alloys Tables 4.17 and 4.18 give the mechanical properties of cast aluminium alloys. The modulus of elasticity of all the alloys is about 71 GPa or GN m -2 , with the exception of those alloys with high percentages of silicon (greater than about 15%) when the modulus is about 80 to 88 GPa or GN m -2 , the higher the percentage of silicon the higher the modulus.
Table 4.17 Mechanical properties of AA cast aluminium alloys AA Process Temper Tensile Yield Elong-
strength stress ation (MPa) (MPa) (%)
208.0 S F(M) 145 97 2.5

77
242.0
295.0
308.0 319.0
355.0
356.0
360.0 A360.0 380.0 413.0 C443.0
S S S P P S S P S S P P S S P P S S P P D D D D S
T21 T571 T77 T571 T61 T4(TB) T6(TF) F(M) F(M) T6(TF) F(M) T6(TF) T6(TF) T7 T6(TF) T7 T6(TF) T7 T6(TF) T7 F(M) F(M) F(M) F(M) F(M)
185 220 205 275 325 220 250 195 185 250 235 280 240 265 290 280 230 235 265 220 325 320 330 300 130
125 205 160 235 290 110 165 110 125 165 130 185 175 250 190 210 165 210 185 165 170 165 165 140 55
1 0.5 2 1 0.5 8.5 5 2 2 2 2.5 3 3 0.5 4 2 3.5 2 5 6 3 5 3 2.5 8
Note: S = sand casting, P = permanent mould casting, D = die casting. The values quoted for the yield stress are the 0.2% proof stress. The temper values quoted are American designations with those in parentheses British Standard designations.
Table 4.18 Mechanical properties of BS cast aluminium alloys BS Process Temper Tensile Elong-
strength ation (MPa) (%)
LM4
LM5
LM6
LM9
LM10
LM12 LM13
LM16
S S C C S C S C S S C C C S C C S S C C C S S
M(F) TF(T6) M(F) TF(T6) M(F) M(F) M(F) M(F) ΤΕ(ΠΟ) TF(T6) M(F) TE(T10) TF(T6) TB(T4) TB(T4) M(F) TF(T6) TF7(T7) TE(T10) TF(T6) TF7 TB(T4) TF(T6)
140 230 160 280 140 170 160 190 170 240 190 230 295 280 310 170 170 140 210 280 200 170 230
3 5 5 7 1.5
3 2
8 12
2
2
2

78
LM18
LM20 LM21
LM24 LM25
LM30
C C S C C S C C S S S S C C C C C
TB(T4) TRT6) M(F) M(F) M(F) M(F) M(F) M(F) M(F) TE(T10) TB7(T7) TF(T6) M(F) TE(T10) TB7(T7) TF(T6) M(F)
230 280 120 140 190 150 170 180 130 150 160 230 160 190 230 280 150
3 4 5 1 1 1.5 2 1 2.5
3 2 5 2
Note: S = sand casting, C = chill casting where a higher rate of cooling occurs than with sand casting, e.g. as with die casting. The tempers are given to British Standard designations with those in parentheses being American designations.
Mechanical properties of wrought alloys
Table 4.19 shows typical mechanical properties of wrought Aluminium Association alloys. The properties will vary to some extent according to the form of the material, e.g. sheet or forging, so the properties must only be regarded as indicative of what might obtain. The modulus of elasticity for all the wrought alloys is about 69 to 74 GPa or GN m~2.
Table 4.19 Mechanical properties of wrought alloys AA no. Temper
Unalloyed aluminium 1050 0
H14 H18
1060 O H12 H18
1100 0 H12 H18
1200 0 H12 H18
Tensile strength
(MPa)
76 110 160 69 83
130 90
110 165 87
108 150
Aluminium-copper alloys 2011 T3(TD)
T8 (TH) 2014 0
T4 (TB) T6 (TF)
2014Clad O T4 (TB) T6 (TF)
2024 0
380 405 185 425 485 170 420 470 185
Yield stress (MPa)
28 105 145 28 76
125 34
105 150
295 310 97
290 415 69
255 415 76
Elong-ation (%)
43 16 6
35 12 5
30 8 4
15* 15" 18' 20" 13' 21 22 10 20
Hard-ness (HB)
19 23 35 23 28 44
95 100 45
105 135
47
3

2024Clad
2219
2618
T3 (TD) T4 (TB) 0 T4 (TB) T8KTH) 0 T42(TB) T62(TF) T8KTH) All
Aluminium-manganese 3003
3004
3105
Aluminiut 5005
5050
5083
5086
5154
5252
5454
5456
0 H12 H18 0 H32 H38 0 H12 H18
n-magnesium 0 H12 H18 H34 0 H32 H38 0 H112 H34 0 H32 H34 0 H32 H38 H25 H28 0 H32 H38 0 H111 H321
Aluminium-magnesium 6061
6061 Clad
6063
6151 6262
0 T4 (TB) T6 (TF) 0 T4 (TB) T6 (TF) 0 T4 (TB) T6 (TF) T6 (TF) T9
485 470 180 440 450 170 360 415 455 440
» alloys 110 130 200 180 215 285 115 150 215
i alloys 125 140 200 160 145 170 220 290 305 345 260 290 325 240 270 330 235 285 250 275 370 310 325 350
345 325 76
290 415 76
185 290 350 370
42 125 185 69
170 250 55
130 195
41 130 195 140 55
145 200 145 195 285 115 205 244 115 205 270 170 240 115 205 310 160 230 255
i -silicon alloys 125 240 310 115 230 290 90
170 240 220 400
55 145 275 48
130 255 48 90
215 195 380
Aluminium-zinc-magnesium - copper alloys 7075 0
T6 (TF) 230 570
105 505
18 20 20 19 6
18 20 10 10 10
30 10 4
20 10 5
24 7 3
25 10 4 8
24 9 5
22* 16* 9*
22 12 10 27 15 10 11 5
22 10 8
24* 18* 16*
25 22 12 25 22 12 25 22 12 15 10*
17 11
120 120
28 35 55 45 52 77
28
41 36 46 63
67 80 68 75 62 73
90
30 65 95
73 71
120
60 150
79
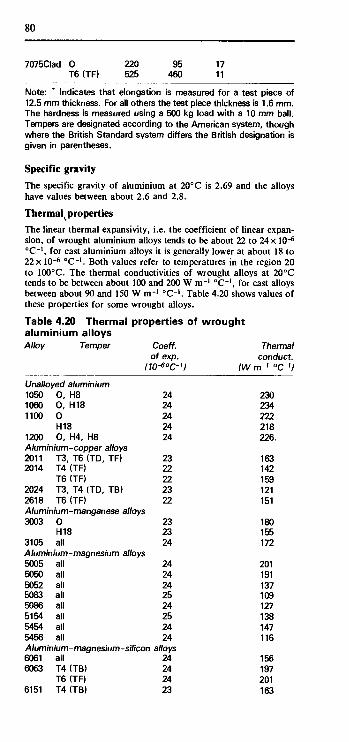
80
7075Clad 0 220 95 17 T6(TF) 525 460 11
Note: * Indicates that elongation is measured for a test piece of 12.5 mm thickness. For all others the test piece thickness is 1.6 mm. The hardness is measured using a 500 kg load with a 10 mm ball. Tempers are designated according to the American system, though where the British Standard system differs the British designation is given in parentheses.
Specific gravity
The specific gravity of aluminium at 20°C is 2.69 and the alloys have values between about 2.6 and 2.8.
Thermal v properties
The linear thermal expansivity, i.e. the coefficient of linear expan-sion, of wrought aluminium alloys tends to be about 22 to 24 x 10-6
°C~l, for cast aluminium alloys it is generally lower at about 18 to 22 x 10"6 °C~l. Both values refer to temperatures in the region 20 to 100°C. The thermal conductivities of wrought alloys at 20°C tends to be between about 100 and 200 W m~l 0C"1, for cast alloys between about 90 and 150 W nH °C-1. Table 4.20 shows values of these properties for some wrought alloys. Table 4.20 Thermal properties of wrought aluminium alloys Alloy Temper Coeff. Thermal
of exp. conduct. (10-6°C-1) (W m-> °C~1)
Unalloyed aluminium 1050 0, H8 1060 0, H18 1100 0
H18 1200 0, H4, H8 Aluminium - copper 2011 T3, T6(TD, 2014 T4 (TF)
T6 (TF) 2024 T3, T4 (TD, 2618 T6 (TF)
alloys TF)
TB)
Aluminium-manganese alloys 3003 0
H18 3105 all Aluminium-magnesium alloys 5005 all 5050 all 5052 all 5083 all 5086 all 5154 all 5454 all 5456 all
24 24 24 24 24
23 22 22 23 22
23 23 24
24 24 24 25 24 25 24 24
Aluminium-magnesium-silicon alloys 6061 all 6063 T4 (TB)
T6 (TF) 6151 T4 (TB)
24 24 24 23
230 234 222 218 226.
163 142 159 121 151
180 155 172
201 191 137 109 127 138 147 116
156 197 201 163

81
T6 (TF) 23 175 Aluminium-zinc-magnesium-copper alloys 7075 T6(TF) 24 130
Note: Tempers are given in the American system and where the British system differs the British values are given in parentheses.
Weldability
See Fabrication properties.
4.5 Uses Forms of material
Table 4.21 shows the normal product forms of wrought material to the Aluminium Association specification.
Uses of cast alloys
Table 4.22 shows typical uses of cast aluminium alloys. The aluminium-silicon alloys with some copper and/or magnesium are very widely used. They have the advantages over the aluminium-
Table 4.21 Forms of wrought alloy AA Sheet Plate Extruded
no. r.b.w. shape
Unalloyed aluminium 1050 1060 1100 1200 Aluminium-copper alloys 2011 2014 2024 2219 2618 Aluminium-manganese alloys 3003 3004 3105 Aluminium-magnesium alloys 5005 5050 5052 5083 5086 5154 5252 5454 5456
# *
* * * *
* * * * * * *
* * * *
* * *
* * * * * *
* # * * *
Aluminium-magnesium-silicon alloys 6061 6063 6151 6262 A luminium-zinc - magnesium -7075 7178
* * *
*
tube
# * * *
* * * *
* *
* # *
* *
* *
*
Cold finished Drawn r.b.w.
* * * * * *
* · · ** * *
* * *
* * * * # * * * * *
* *
* *
* copper alloys
* * *
* * * *
tube
* * * »
* * *
* *
* *
* *
*
* *
*
*
Forgings
*
* *
*
* *
*
*
* *
*
*
* *
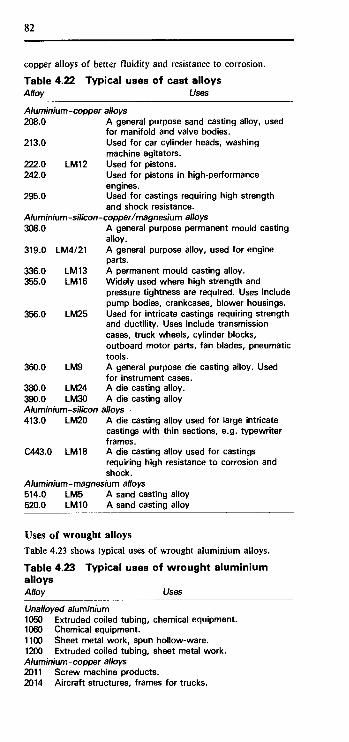
82
copper alloys of better fluidity and resistance to corrosion. Table 4.22 Typical uses of cast alloys Alloy Uses
Aluminium-copper alloys 208.0 A general purpose sand casting alloy, used
for manifold and valve bodies. 213.0 Used for car cylinder heads, washing
machine agitators. 222.0 LM12 Used for pistons. 242.0 Used for pistons in high-performance
engines. 295.0 Used for castings requiring high strength
and shock resistance. Aluminium-silicon-copper/magnesium alloys 308.0 A general purpose permanent mould casting
alloy. 319.0 LM4/21 A general purpose alloy, used for engine
parts. 336.0 LM13 A permanent mould casting alloy. 355.0 LM16 Widely used where high strength and
pressure tightness are required. Uses include pump bodies, crankcases, blower housings.
356.0 LM25 Used for intricate castings requiring strength and ductility. Uses include transmission cases, truck wheels, cylinder blocks, outboard motor parts, fan blades, pneumatic tools.
360.0 LM9 A general purpose die casting alloy. Used for instrument cases.
380.0 LM24 A die casting alloy. 390.0 LM30 A die casting alloy Aluminium-silicon alloys 413.0 LM20 A die casting alloy used for large intricate
castings with thin sections, e.g. typewriter frames.
C443.0 LM18 A die casting alloy used for castings requiring high resistance to corrosion and shock.
Aluminium-magnesium alloys 514.0 LM5 A sand casting alloy 520.0 LM10 A sand casting alloy
Uses of wrought alloys
Table 4.23 shows typical uses of wrought aluminium alloys. Table 4.23 Typical uses of wrought aluminium alloys Alloy Uses
Unalloyed aluminium 1050 Extruded coiled tubing, chemical equipment. 1060 Chemical equipment. 1100 Sheet metal work, spun hollow-ware. 1200 Extruded coiled tubing, sheet metal work. Aluminium-copper alloys 2011 Screw machine products. 2014 Aircraft structures, frames for trucks.

83
2024 Aircraft structures, truck wheels. 2219 Used for high strength welds in structures at
temperatures as high as 315°C, e.g. aircraft parts. 2618 Aircraft engine parts. Aluminium-manganese alloys 3003 Has a wide general use, e.g. cooking utensils, sheet
metal work, builders' hardware, storage tanks, pressure vessels, chemical equipment.
3004 Sheet metal work, storage tanks. 3105 Builders' hardware, sheet metal work. Aluminium-magnesium alloys 5005 Electrical conductors, architectural trims, general
utensils. 5050 Builders' hardware, coiled tubes. 5052 Sheet metal work, hydraulic tubes. 5083 Welded pressure vessels, marine, car and aircraft parts. 5086 As 5083. 5154 Welded structures, storage tanks, pressure vessels. 5252 Car and appliance trims. 5454 Welded structures, pressure vessels, marine applications. 5456 Where high strength, welded structures are required.
Storage vessels, pressure vessels, marine applications. Aluminium-magnesium-silicon alloys 6061 Heavy duty structures where good corrosion resistance
is required, e.g. truck and marine applications, pipelines, furniture.
6063 Architectural extrusions, pipes, furniture. 6151 Where moderate strength, intricate forgings are
required, e.g. car and machine parts. 6262 Screw machine products. Aluminium-zinc-magnesium-copper alloys 7075 Hydraulic fittings, aircraft structures. 7178 As 7075.
5 Copper 5.7 Materials Copper
Copper has very high electrical and thermal conductivity and can be manipulated readily by either hot or cold working. Pure copper is very ductile and relatively weak. Working increases the tensile strength and hardness but decreases ductility. It has a good corro-sion resistance, due to reactions at the surface between the copper and the oxygen in air to give a thin protective oxide layer.
Copper is widely used for electrical conductors in a number of high purity grades and with the addition of very small amounts of arsenic, phosphorus, silver, sulphur or tellurium. Very pure copper can be produced by an electrolytic refining process, the pure copper forming at the cathode of the electrolytic cell and so being referred to as cathode copper. It has a purity greater than 99.99%, being mainly used as the raw material for the production of alloys, with some use also being made of it as a casting material. Electrolytic tough pitch high-conductivity copper is produced from cathode copper which has been melted and cast into billets, and other suitable shapes, for working. It contains a small amount of oxygen, present in the form of cuprous oxide, which has little effect on the electrical conductivity. This type of copper should not be heated in an atmosphere where it can combine with hydrogen, because the hydrogen can diffuse into the metal and combine with the cuprous oxide to generate steam and hence crack the copper. Fire refined tough pitch high-conductivity copper is produced from impure copper by a fire refining process in which the impure copper is melted in an oxidizing atmosphere. The impurities react with the oxygen to give a slag which is removed. The resulting copper has an electrical conductivity almost as good as the electrolytic tough high-pitch high-conductivity copper. Oxygen-free high-conductivity copper can be produced if, when cathode copper is melted and cast into billets, there is no oxygen present in the atmosphere. Such copper can be used in atmospheres containing hydrogen. Another method of producing oxygen-free copper is to add phosphorus during the refining. The effect of small amounts of phosphorus is a very marked decrease in electrical conductivity. Such copper is known as phosphorus deoxidized copper and it can give good welds, unlike other forms of copper. The addition of small amounts of arsenic to copper increases its tensile strength, but greatly reduces its electrical conductivity. Such copper is called arsenical copper.
See Codes for composition, Codes for temper, Composition of casting alloys, Composition of wrought alloys, Annealing, Creep properties, Hardness, Mechanical properties of cast alloys, Mechanical properties of wrought alloys, Solderability, Thermal properties, Weldability, Forms, Uses of cast alloys, Uses of wrought alloys.
Copper alloys
Table 5.1 shows the main groups of copper alloys and their main alloying elements. The relevant portions of the binary alloy equilibrium diagrams are given in Figures 5.1, 5.2, 5.3, 5.4, 5.5 and 5.6. Many of the alloys within alloy groups are given specific names.
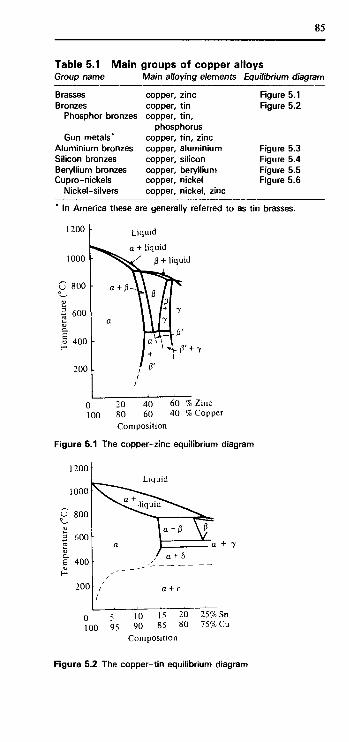
85
Table 5.1 Main groups of copper alloys Group name Main alloying elements Equilibrium diagram
Brasses Bronzes
Phosphor bronzes
Gun metals* Aluminium bronzes Silicon bronzes Beryllium bronzes Cupro-nickels
Nickel-silvers
copper, zinc Figure 5.1 copper, t in Figure 5.2 copper, t in ,
phosphorus copper, t in , zinc copper, aluminium Figure 5.3 copper, silicon Figure 5.4 copper, beryllium Figure 5.5 copper, nickel Figure 5.6 copper, nickel, zinc
" In America these are generally referred to as tin brasses.
1200 1
1000
u 800
<υ
1 600
1 400 H
200
0
Liquid
^ ^ ^ α + liquid
a + M
. a
/ /
20 100 80
β + liquid
t\ß L \ \ Fi 1 1 l +
1 \ (7 1 U— l a \ v
7
-β' 1
1 S r + T / * Iß'
40 60 % Zinc 60 40 % Copper
Composition
Figure 5.1 The copper-zinc equilibrium diagram
1200
1000
G 800
2 600
ε 400 ω H
200
Liquid
^•v^^hquid ^ " ^ ^ ^ ^
n \ n
/ α + δ
/ a + e /
0 5 100 95
10 90
15 20 25% Sn 85 80 75% Cu
Composition
Figure 5.2 The copper-tin equilibrium diagram

86
1200
1000
υ 8θο
Tem
pera
ture
(°
t». en
o
o o
o
200
Liquid
""■ .
a
a + liquid 1 rc W
\ 3 \ /
a + y2
0 2 4 6 8 10 12% Al 100 98 96 94 92 90 88% Cu
Composition
Figure 5.3 The copper-aluminium equilibrium diagram
1100
1000
900
U
800
E £ 700
600
Liquid
500
400 JL 0 2 4 6
% Silicon
Figure 5.4 The copper-silicon equilibrium diagram

87
α / <* + Υι
Liquid
Yl Yl+Y2
α + Υ2
2 4 6 ί % Beryllium
Figure 5.5 The copper-beryllium equilibrium diagram
1400
U
1200
1000
800
Liquid
_!_ JL 0 20 40 60 80 100
% Nickel
Figure 5.6 The copper-nickel equilibrium diagram.
Brasses
The brasses are copper-zinc alloys containing up to about 43% zinc. Brasses with less than 35% zinc solidify as single phase alpha brasses. These brasses have high ductility and can readily be cold worked. A brass with 15% zinc is known as gilding brass, one with 30% zinc as cartridge brass or 70/30 brass.
At between 35 and 45% zinc, the brasses solidify as a mixture of

88
two phases. These brasses are easier to hot work but harder to cold work. These brasses are known as alpha-beta or duplex brasses. The name Muntz metal is given to a brass with 40% zinc. The addition of lead to Muntz metal considerably improves the machining properties.
Brasses are available in both casting and wrought forms.
See Codes for composition, Codes for temper, Composition of casting alloys, Composition of wrought alloys, Annealing, Creep properties, Hardness, Mechanical properties of cast alloys, Mechan-cial properties of wrought alloys, Solderability, Thermal properties, Weldability, Forms, Uses of cast alloys, Uses of wrought alloys.
Bronzes
Up to about 10% tin the structure that occurs with normal cooling from the liquid state is a single phase alpha structure, such a phase giving a ductile material. Higher percentage tin alloys will invariable include a significant amount of delta phase. This is a brittle intermetallic compound. Alpha bronzes with up to about 8% tin can be cold worked to give high mechanical properties. High tin contents of about 10%, or higher, make the bronze unworkable but such alloys are used for casting.
The addition to a copper-tin bronze of up to 0.4% phosphorus gives an alloy called phosphor bronze. The term gunmetal is used for copper-tin bronzes when zinc is also present. Lead may be added to a gunmetal to give a leaded gunmetal with good machining properties.
Bronzes are available in both casting and wrought forms.
See Codes for composition, Codes for temper, Composition of casting alloys, Composition of wrought alloys, Annealing, Creep properties, Hardness, Mechanical properties of cast alloys, Mechanical properties of wrought alloys, Solderability, Thermal properties, Weldability, Forms, Uses of cast alloys, Uses of wrought alloys.
Aluminium bronzes
Copper-aluminium alloys with up to about 9% aluminium give single phase alpha aluminium bronzes. These alloys can be readily cold worked, particularly when they have less than about 7% aluminium. Duplex, alpha-beta, alloys contain about 9 to 10% aluminium and are mainly used for castings. The cast aluminium bronzes, and many of the wrought aluminium bronzes, also contain iron and sometimes nickel and manganese.
Aluminium bronzes are available in both casting and wrought forms.
See Codes for composition, Codes for temper, Composition of casting alloys, Composition of wrought alloys, Annealing, Quen-ching and tempering, Creep properties, Hardness, Mechanical properties of cast alloys, Mechanical properties of wrought alloys, Solderability, Thermal properties, Weldability, Forms, Uses of cast alloys, Uses of wrought alloys.
Silicon bronzes
Silicon bronzes are copper-silicon alloys, generally containing between about 1 and 4% silicon and giving a single phase alpha structure. The alloys have a high corrosion resistance, very good
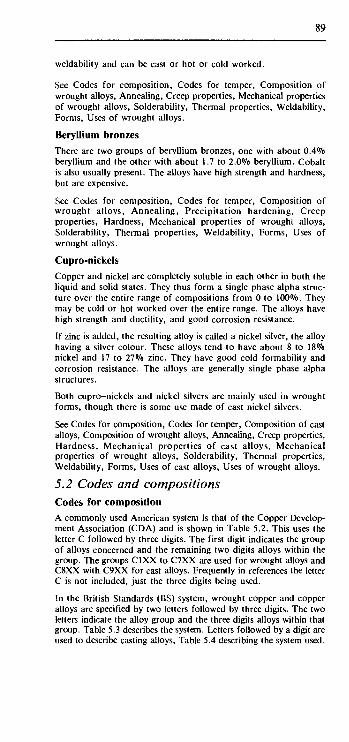
89
weldability and can be cast or hot or cold worked.
See Codes for composition, Codes for temper, Composition of wrought alloys, Annealing, Creep properties, Mechanical properties of wrought alloys, Solderabihty, Thermal properties, Weldability, Forms, Uses of wrought alloys.
Beryllium bronzes
There are two groups of beryllium bronzes, one with about 0.4% beryllium and the other with about 1.7 to 2.0% beryllium. Cobalt is also usually present. The alloys have high strength and hardness, but are expensive.
See Codes for composition, Codes for temper, Composition of wrought alloys, Annealing, Precipitation hardening, Creep properties, Hardness, Mechanical properties of wrought alloys, Solderabihty, Thermal properties, Weldability, Forms, Uses of wrought alloys.
Cupro-nickels
Copper and nickel are completely soluble in each other in both the liquid and solid states. They thus form a single phase alpha struc-ture over the entire range of compositions from 0 to 100%. They may be cold or hot worked over the entire range. The alloys have high strength and ductility, and good corrosion resistance. If zinc is added, the resulting alloy is called a nickel silver, the alloy having a silver colour. These alloys tend to have about 8 to 18% nickel and 17 to 27% zinc. They have good cold formability and corrosion resistance. The alloys are generally single phase alpha structures. Both cupro-nickels and nickel silvers are mainly used in wrought forms, though there is some use made of cast nickel silvers. See Codes for composition, Codes for temper, Composition of cast alloys, Composition of wrought alloys, Annealing, Creep properties, Hardness, Mechanical properties of cast alloys, Mechanical properties of wrought alloys, Solderabihty, Thermal properties, Weldability, Forms, Uses of cast alloys, Uses of wrought alloys.
5.2 Codes and compositions Codes for composition
A commonly used American system is that of the Copper Develop-ment Association (CDA) and is shown in Table 5.2. This uses the letter C followed by three digits. The first digit indicates the group of alloys concerned and the remaining two digits alloys within the group. The groups C1XX to C7XX are used for wrought alloys and C8XX with C9XX for cast alloys. Frequently in references the letter C is not included, just the three digits being used. In the British Standards (BS) system, wrought copper and copper alloys are specified by two letters followed by three digits. The two letters indicate the alloy group and the three digits alloys within that group. Table 5.3 describes the system. Letters followed by a digit are used to describe casting alloys, Table 5.4 describing the system used.

90
Table 5.2 CDA codes for copper and its alloys CDA code Alloy group
Wrought alloys C1XX Coppers with a minimum of 99.3% Cu, high-copper
alloys with between 96 and 99.3% Cu. C2XX Copper-zinc alloys, i.e. brasses. C3XX Copper-zinc-lead alloys, i.e. leaded brasses. C4XX Copper-zinc-tin alloys, i.e. tin brasses. C5XX Copper-tin alloys, i.e. bronzes/phosphor bronzes. C6XX Copper-aluminium alloys, i.e. aluminium bronzes,
Copper-silicon alloys, i.e. silicon bronzes, and miscellaneous copper-zinc alloys.
C7XX Copper-nickel alloys, i.e. cupro-nickels, Copper-nickel-zinc alloys, i.e. nickel silvers.
Cast alloys C8XX Cast coppers, high-copper alloys, brasses of various
types, manganese-bronze alloys, copper-zinc-silicon alloys.
C9XX Cast copper-tin alloys, copper-tin-lead alloys, copper-tin-nickel alloys, copper-aluminium-iron alloys, copper-nickel-iron alloys, copper-nickel-zinc alloys.
Table 5.3 BS Codes for wrought copper and its alloys BS code Alloy group
C Copper and low-copper alloys. CA Copper-aluminium alloys, i.e. aluminium bronzes. CB Copper-CN Copper-
-beryllium alloys, i.e. beryllium bronzes. -nickel alloys, i.e. cupro-nickels.
CS Copper-silicon alloys, i.e. silicon bronzes. CZ Copper-NS Copper-PB Copper
-zinc alloys, i.e. brasses. -zinc-nickel alloys, i.e. nickel silvers. -tin-phosphorus, i.e. phosphor bronzes.
Table 5.4 BS Codes for cast copper and its alloys BS code
AB1, AB2, AB3 CMA1 CN1 CN2 CT1 CT2 DCB1, DCB3 G1 G3, G3-TF HCC1 HTB1, HTB3 LB1 LB2 LB4 LB5 LG1 LG2
Alloy
Aluminium bronze Copper-manganese-aluminium Copper-nickel-chromium Copper-nickel-niobium Tin bronze for general purposes Tin bronze with nickel Brass for gravity die casting 80/10/2 Admiralty gunmetal Nickel gunmetal High conductivity copper High tensile brass 79/9/0/15 Leaded bronze 80/10/0/10 Leaded bronze 85/5/0/10 Leaded bronze 75/5/0/20 Leaded bronze 83/3/9/5 Leaded gunmetal 85/5/5/5 Leaded gunmetal

91
LG4 87/7/3/3 Leaded gunmetal LPB1 Leaded phosphor bronze PB1, PB4 Phosphor bronze for bearings PB2 Phosphor bronze for gears PCB1 Brass for pressure die casting SCB1, SCB3 Brass for general purposes SCB4 Naval brass for sand casting SCB6 Brazable quality brass
Codes for tempers
The American Society for Metals have over a hundred designations of temper for copper alloys. Considerably fewer designations are used with the British Standards' system. Table 5.5 shows the basis of both systems and their interrelationship.
Table 5.5 A S T M and BS codes for tempers BS ASTM
Code
0
H
1ΛΗ ^ Η
H EH SH ESH
M
Temper condition
Annealed
Code
010-082
050 070
Temper condition
Annealed to produce specific properties, e.g. Light annealed Dead soft annealed
OS005-OS200Annealed to produce
Cold worked to hardnesses, e.g.
Quarter hard Half hard
Hard Extra hard Spring hard Extra spring hard
As manufactured.
OS005 OS200
H00-H14
H00 H01 H02 H03 H04 H06 H08 H10 H12 H13 H14
H50-H86
H50
specific grain size, e.g. Average size 0.005 mm Average size 0.200 mm
Cold worked to hardnesses, e.g. One-eighth hard One-quarter hard Half hard Three-quarter hard Hard Extra hard Spring hard Extra spring Special spring Ultra spring Super spring Cold worked via specific processes, e.g. Extruded and drawn
HR01-HR50 Cold worked and stress
HR01 HT04-HT08
HT04
M01-M45 M01 M02 M20 M30
relieved, e.g. H01 and stress relieved.
: Cold worked and order strengthened, e.g. H04 and order heat treated
As manufactured, e.g. As sand cast As centrifugal cast As hot rolled As hot extruded
W Solution treated. ΤΒ00 Solution heat treated

92
W{xH)
W(1/4H) W(%H)
W(H)
WP
Sol.tr. and cold worked to temper
To 1/4 hard To 1/2 hard
To full hard
Sol.tr. and prec. hardened
TD00-TDO4
TDOO TD01 TD02 TD03 TD04
TFOO
Sol.tr. and cold worked to temper TBOOto 1/8 hard TBOOto 1/4 hard TBOOto 1/2 hard TBOO to 3/4 hard TBOO to full hard
TBOO and precipitation hardened
W(xH)P Sol.tr., c.w. and TL01-TL04 Sol.tr., cold worked prec. hardened and prec. hardened
TLOO TFOO c.w. to 1/8 hard W( % H)P C.w. to 1 /4 hard TL01 TFOO c.w. to 1 /4 hard W( %H)P C.w. to 1 / 2 hard TL02 TFOO c.w. to 112 hard W(H)P C.w. to full hard TL04 TFOO c.w. to full hard
TR01-TR04 TL and stress relieved TR01 TL01 and stress relieved TR02 TL02 and stress relieved TR04 TL04 and stress relieved
TH01-TH04 TD and prec. hardened
Wm
TH01
TH02
TH03
TH04
TD01 and prec. hardened TD02 and prec. hardened TD03 and prec. hardened TD04 and prec. hardened
Mill hardened TM00-TM08 Mill hardened to various
TQ00-TQ75
TQOO TQ50
TQ75
tempers.
Quench hardened tempers Quench hardened Quench hardened and temper annealed Interrupted quench hardened
Tempers of welded tubes
WH00-WH01 Welded and drawn WM00-WM50As welded from Hxx
strip. WO50 Welded and light anneal
WR00-WR01 WMOO/01 drawn and stress relieved.
Composition of casting alloys
Table 5.6 shows the composition of commonly used British Stan-dards and Table 5.7 the Copper Development Association specified casting alloys. Where there is a common name for an alloy it is given in addition to the BS or CD A code. In British Standards casting alloys are grouped into three categories:
Group A: Alloys in common use and preferred for general purposes.

93
Group B: Special purpose alloys for which particular properties are required.
Group C: Alloys in limited production.
These categories are indicated in the table for those alloys to British Standards.
Table 5.6 Composition of BS casting alloys Name BS code Group Nominal Composition %
Copper High conductivity Brasses Sand cast brass Sand cast brass Sand cast naval brass Brazable sand cast brass
Gravity die cast brass
Gravity die cast naval
Pressure die cast brass
High tensile brass
High tensile brass
Bronzes Tin bronze Phosphor bronze Phosphor bronze Phosphor bronze Leaded phosphor bronze
Leaded br. 76 -9 -0 -15
Leaded br. 80-10-0-10 Leaded br. 85 -5 -0 -10
Leaded br. 75 -5 -0 -20
Gunmetals Admiralty gunmetal Nickel gunmetal Leaded g.m 8 3 - 3 - 9 - 5 Leaded g.m 8 5 - 5 - 5 - 5 Leaded g.m 8 7 - 7 - 3 - 3 Aluminium bronzes Aluminium bronze Aluminium bronze C u - M n - A I Nickel-silvers
HCC1
SCB1 SCB3 SCB4 SCB6
DCB1
DCB3
PCB1
HTB1
HTB3
CT1 PB1 PB2 PB4 LPB1
LB1
LB2 LB4
LB5
G1 G3 LG1 LG2 LG4
AB1 AB2 CMA1
B
A A C A
A
A
A
B
B
B B B A A
C
A A
C
C C B A A
B B B
Cu >99.9 Cu Sn
70-77 1-3 63-66
Zn Other : rem 2 -5 Pb
rem 1-3 Pb 60-631-1.5 rem 83-88
59-62
58-62
57-60
>57.0
>55.0
Cu Sn 90 10
rem 0.05-0.2 As
rem 0.25-0.5 AI
rem 0.5-2.5 Pb,0.2-0.8 AI
rem 0.5-2.5 Pb
rem 0.7-2.0 Fe, 0.1-3.0 Mn , 0.5-2.5 AI
rem 1.0 Ni, 1.5-4.0 Mn , 1.5-3.25 Fe, 3.0-6.0 AI
Other 0.05 P
89 10-11 0.6-1.0 P 88 11-13 0.25-0.60 P 89 >9.7 87 7.5
76 9
80 10 85 5
75 5
Cu Sn 88 10 86 7 83 3 85 5 87 7 Cu AI 88 9.5 80 9.5 73 9 Cu Ni
' >0.5 P 3 Pb, >0.4 P, 1.0 Ni 15 Pb, 0.50 Sb 10 Pb, 0.50 Sb 10 Pb, 0.50 Sb 20 Pb, 0.50 Sb
Zn Pb Other 2 2 0.3 5.5 Ni 9 5 5 5 3 3 Fe Ni Mn 2.5 5 5 3 3 13 Fe Mn Nb

94
Cu-Cu-
-Ni--Ni-
-Cr -Nb
CN1 CN2
C C
67 66
31 30
0.7 1.2
0.8 1.3 1.3
Note: rem = remainder. For clarification of the group symbols see the note preceding this table.
Table 5.7 Composition of CDA casting alloys Name CDA Nominal composition %
Copper
High copper alloys
Brasses Leaded red brass Leaded red brass Leaded semi-red brass Leaded semi-red brass Leaded yellow brass Leaded yellow brass Leaded naval brass Leaded yellow brass Manganese bronzes Manganese bronze Manganese bronze Tin bronzes Tin bronze Tin bronze Tin bronze
C801 C811
Cu > 99.95 >99.70
Cu Co C817>94.25 0.9 C821 97.7
C836 C838 C844 C848 C852 C854 C857 C858
C862 C863
C903 C905 C911
Steam bronze/valve bronze C922 Leaded tin bronze High-lead tin bronze High-lead tin bronze High-lead tin bronze High-lead tin bronze Nickel-tin bronze Aluminium bronzes Aluminium bronze Aluminium bronze Nickel aluminium bronze Nickel aluminium bronze Silicon bronzes/brasses Silicon brass Nickel-silvers Nickel-silver Nickel-silver Nickel-silver
C923 C932 C937 C938 C943 C947
C952 C953 C955 C958
C875
C973 C976 C978
Cu 85 83 81 76 72 67 63 58
Cu 64 63 Cu 88 88 85 88 87 83 80 78 70 88 Cu 88 89 81 81 Cu 82 Cu 56 64 66
0.9 Sn 5 4 3 3 1 1 1 1
Zn 26 25
Sn 8 10 14 6 8 7 10 7 5 5 AI 9 10 11 9
Zn 14 Sn 2 4 5
Ni 0.9 1 0.9 Zn 5 7 9 15 24 29 35 40
Fe AI 3 4 3 6
Zn 4 2 1
4.5 4 3
I I
2 Fe 3 1 4 4 Si 4
Zn 20 8 2
Other Ag Ag
Other I Ag, Be 0.5 Be ! Pb Other 5 6 7 6 3 3 1 0.3 AI 1 Mn 3 3
Pb
1.5 1 7 10 15 25
Ni
4 5
Pb 10 4 2
Pb
Ni
5 Mn
1
Ni 12 20 25
Composition of wrought alloys
Tables 5.8 and 5.9 show the compositions of commonly used British Standard and Copper Development Association wrought alloys.
Table 5.8 Composition of BS wrought alloys Name BS Nominal composition %
Copper Cu Other Elec. tough pitch h.c. Cu C101 >99.90 0 2

95
Oxygen free h.c. copper Tough pitch arsenical Cu Phosphorus deoxidized Ci Phosphorus deox. ars. Cu Oxygen free h.c. copper High copper alloys Copper-cadmium Brasses Gilding metal (90/10 br.) Red brass (85/15 br.) 70/30 arsenical brass
C103 >99.95 C105 >99.20
j C106 >99.85 C107 >99.20 C110 >99.99
Cu C108 99.0
Cu S CZ101 90 CZ102 85 CZ105 72
Deep drawing brass (70/30) CZ106 70 Basis or common brass Muntz metal (60/40 br.) Aluminium brass Admiralty brass Naval brass High tensile brass High tensile soldering br. High tensile brass Leaded brass (clock br.) Leaded Muntz metal Phosphor bronzes 4% Phosphor bronze 5% Phosphor bronze 7% Phosphor bronze Aluminium bronzes 7% Aluminium bronze 9% Aluminium bronze 10% Aluminium bronze Aluminium br.(alloy E) Aluminium br.(alloy D) Silicon bronze Copper silicon Beryllium bronzes Copper-beryllium Cupro-nickels 95/5 Cupro-nickel 90/10 Cupro-nickel 80/20 Cupro-nickel 75/25 Cupro-nickel 70/30 Cupro-nickel Special 70/30 Cupro-nick. Nickel silvers Leaded nickel brass 10% nickel silver 12% nickel silver 15% nickel silver 18% nickel silver 18% nickel silver 20% leaded nickel brass
CZ108 63 CZ109 60 CZ110 76 CZ111 70 ' CZ112 62 '
n Zn 10 15 28 30 37 40 22
I 29 I 37
CZ114 58 0.6 37 CZ11557.5 0.9 38 CZ116 66 CZ118 64 CZ123 60
Cu PB101 96 PB102 95 PB103 93
Cu CA102 93 CA103 87 CA104 80 CA105 81 CA106 90
Cu CS101 96
Cu CB101 98
Cu CN101 93 CN102 87.5 CN104 80 CN105 75 CN107 68 CN108 66
Cu NS101 45 NS103 63 NS104 63 NS105 63 NS106 63 NS107 55 NS111 60
27 35 39
AI 7
AI
2
As P
As, P
Other 1.0 Cd
Fe Mn Oth.
As
As As
< 1.5 0.85 1.5 Pb <0.2 0.85 1.5 Pb 4.5 0.75 1.5
Sn 4.0 5.0 7.0 Fe
Pb Pb
P 0.02-0.40 0.02-0.40 0.02-0.40 Ni Mn
9 4.0 + Ni 10 9
7.2
5 2.0 2.7 Si
5 5.5 1.2
Mn 2.7-3.5 0.75-1.25
Ni 5.5 10.5 20 25 31 30
Ni Zr 10 43 10 27 12 24 15 21 18 1S 18 27 10 28
Be 1.7
Co + Ni 0.20-0.60
Fe Mn 1.2 0.5 1.5 0.75
0.30 0.2 1.0
2.0 2.0 \ Pb Mn t 1 1
\
) 1 1
-2 0.2-0.5 0.05-0.3 0.05-0.3 0.05-0.5 0.05-0.5
0.05-0.35 -2 0.1-0.5
Table 5.9 Composition of CDA wrought alloys Name CDA Nominal composition %
Copper Oxygen free electronic Oxygen free copper Electrolytic tough pitch
C101 C102 C110
Cu 99.99 99.95 99.90
Other
0.04 02, 0.01 Cd
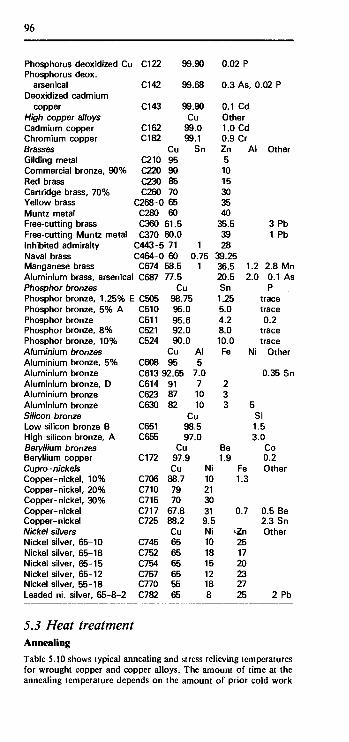
96
Phosphorus deoxidized Cu Phosphorus deox.
arsenical Deoxidized cadmium
copper High copper alloys Cadmium copper Chromium copper Brasses Gilding metal Commercial bronze, 90% Red brass Cartridge brass, 70% Yellow brass Muntz metal Free-cutting brass Free-cutting Muntz metal Inhibited admiralty Naval brass Manganese brass Aluminium brass, arsenica Phosphor bronzes
i C122
C142
C143
C162 C182
C210 C220 C230 C260
99.90
99.68
99.90 Cu
99.0 99.1
Cu Sn 95 90 85 70
C268-0 65 C280 C360 C370
60 61.5 60.0
C443-5 71 1 C464-0 60 0.75 C674
I C687
Phosphor bronze, 1.25% E C505 Phosphor bronze, 5% A Phosphor bronze Phosphor bronze, 8% Phosphor bronze, 10% Aluminium bronzes Aluminium bronze, 5% Aluminium bronze Aluminium bronze, D Aluminium bronze Aluminium bronze Silicon bronze Low silicon bronze B High silicon bronze, A Beryllium bronzes Beryllium copper Cupro-nickels Copper-nickel, 10% Copper-nickel, 20% Copper-nickel, 30% Copper-nickel Copper-nickel Nickel silvers Nickel silver, 65-10 Nickel silver, 65-18 Nickel silver, 65-15 Nickel silver, 65-12 Nickel silver, 55-18 Leaded ni. silver, 65-8-2
C510 C511 C521 C524
C608
58.5 1 77.5
Cu 98.75 95.0 95.6 92.0 90.0
Cu AI 95 5
C613 92.65 7.0 C614 C623 C630
C651 C655
C172
C706 C710 C715 C717 C725
C745 C752 C754 C757 C770 C782
91 7 87 10 82 10
Cu 98.5 97.0
Cu 97.9 Cu Ni
88.7 10 79 21 70 30
67.8 31 88.2 9.5 Cu Ni 65 10 65 18 65 15 65 12 55 18 65 8
0.02 P
0.3 As,
0.1 Cd Other 1.0 Cd 0.9 Cr
0.02 P
Zn AI Other 5 10 15 30 35 40
35.5 39 28
39.25
3 Pb 1 Pb
36.5 1.2 2.8 Mn 20.5 2.0 0.1 As Sn 1.25 5.0 4.2 8.0 10.0
P trace trace 0.2
trace trace
Fe Ni Other
2 3 3 I
Be 1.9
Fe 1.3
0.7
-Zn 25 17 20 23 27 25
0.35 Sn
Si 1.5 3.0
Co 0.2 Other
0.5 Be 2.3 Sn Other
2 Pb
5.3 Heat treatment Annealing
Table 5.10 shows typical annealing and stress relieving temperatures for wrought copper and copper alloys. The amount of time at the annealing temperature depends on the amount of prior cold work
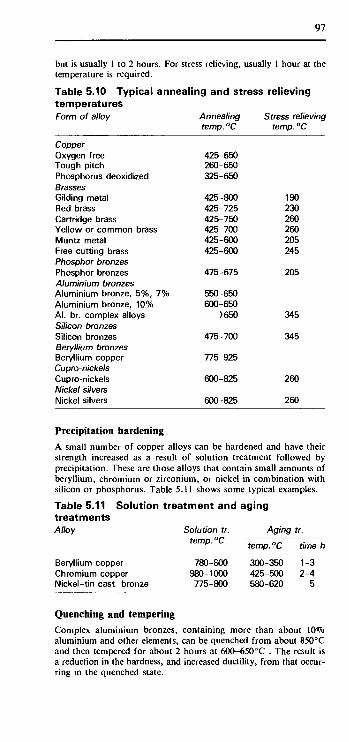
97
but is usually 1 to 2 hours. For stress relieving, usually 1 hour at the temperature is required.
Table 5.10 Typical annealing and stress relieving temperatures Form of alloy Annealing Stress relieving
temp. °C temp. °C
Copper Oxygen free Tough pitch Phosphorus deoxidized Brasses Gilding metal Red brass Cartridge brass Yellow or common brass Muntz metal Free cutting brass Phosphor bronzes Phosphor bronzes Aluminium bronzes Aluminium bronze, 5%, 7% Aluminium bronze, 10% AI. br. complex alloys Silicon bronzes Silicon bronzes Beryllium bronzes Beryllium copper Cupro-nickels Cupro-nickels Nickel silvers Nickel silvers
425-650 260-650 325-650
425-800 425-725 425-750 425-700 425-600 425-600
475-675
550-650 600-650
>650
475-700
775-925
600-825
600-825
190 230 260 260 205 245
205
345
345
260
260
Precipitation hardening
A small number of copper alloys can be hardened and have their strength increased as a result of solution treatment followed by precipitation. These are those alloys that contain small amounts of beryllium, chromium or zirconium, or nickel in combination with silicon or phosphorus. Table 5.11 shows some typical examples.
Table 5.11 Solution treatment and aging treatments Alloy
Beryllium copper Chromium copper Nickel-tin cast, bronze
Solution tr. temp. °C
780-800 980-1000 775-800
Aging tr.
temp. °C time h
300-350 1-3 425-500 2-4 580-620 5
Quenching and tempering
Complex aluminium bronzes, containing more than about 10% aluminium and other elements, can be quenched from about 850°C and then tempered for about 2 hours at 600-650°C . The result is a reduction in the hardness, and increased ductility, from that occur-ring in the quenched state.

98
Stress relief
See Annealing.
5 A Properties Brazing
See Solderability.
Creep properties
The upper temperature limit of use of copper and its alloys is deter-mined in most instances by creep becoming too pronounced. Table 5.12 shows the upper service temperatures.
Table 5.12 Upper service temperatures for copper alloys Alloys Upper service temp. °C
Coppers Brasses, cast Brasses, wrought Gunmetals, cast Aluminium bronzes, cast Aluminium bronzes,
wrought Manganese bronzes Phosphor bronzes, wrought Silicon bronze Cupro-nickels, wrought Nickel silvers, wrought Nickel silvers, cast
120 150
180-200 180
250-400
300-350 200 150 180 200 200 150
Density
Copper has a density of 8.96x 10³ kg m~3 at 20°C. Coppers and high alloy copper have densities of about 8.90 x 10³ kg m-3, brasses vary from about 8.40 to 8 .90x l0 3 kg m - 3 , e.g. gilding metal 8.86X10³ kg m-3, yellow brass 8 . 47x l0 3 kg m"3, red brass 8.75 x 10³ kg m~3, Muntz metal 8.39x 10³ kg irr3, and Naval brass 8.41 x lO 3 kg m"3, phosphor bronzes 8.80 to 8 .90xl03 kg m"3, aluminium bronzes about 7 . 6 0 x l 0 3 kg m - 3 , cupro-nickels 8.94x 10³ kg m-3, and nickel silvers about 8.70x 10³ kg m~3.
Electrical conductivity
Copper and high copper alloys have electrical conductivities of the order of 100% I ACS, unleaded brasses between about 55 and 25% (the lower the percentage of zinc the higher the conductivity, also the harder the temper the lower the conductivity), leaded brasses about 30 to 25%, phosphor bronzes about 17 to 13%, aluminium bronzes 15 to 7%, silicon bronzes about 7%, cupro-nickels about 12 to 4% and nickel silvers about 10 to 5%.
See the tables with Mechanical properties of cast alloys and Mechanical properties of wrought alloys for specific values of conductivities.
Fatigue properties
The endurance limit of copper and its alloys at about 107 cycles is generally between about 0.4 and 0.6 times the tensile strength.

99
Hardness
The hardness, and other mechanical properties, of a wrought alloy depend on its temper. Table 5.13 shows hardness values, for different tempers, that are typical of the different types of copper alloy. Since the values also depend on the form of the material, the data refer to just sheet or strip. Table 5.13 Hardness values for different tempers Alloy Hardness (HV) values for tempers
Coppers Brasses Phosphor bronzes Cupro-nickels Nickel silvers
Beryllium bronze
M
50
W ΤΒ00
110
0
60 80 85 90
100 W(8H)
TD02 210
%H H02
80 110 160
125 W(H) TD04
250
H H04
90 130 180
160 W(P)W(y2H)PW(H)P TF00 TL02 TL04
380 400 420
Impact properties At 20°C, annealed tough pitch copper has an Izod value of 47 J, annealed deoxidized copper 61 J. Hard drawn 4% phosphor bronze has an Izod value of 62 J, 7% annealed aluminium bronze 32 J, annealed 80/20 cupro-nickel 104 J. Annealed naval brass has a Charpy value of 82 J, annealed silicon bronze 90 J, annealed 70/30 cupro-nickel 90 J, annealed nickel silver (30% Ni) 108 J.
Machinability
Copper and its alloys can be considered to fall into three groups with regard to machining. Group 1: Free cutting, with machinability rating greater than
70%. Group 2 Readily machinable, with machinability rating greater
than 30% but less than 70%. Group 3 Difficult to machine, with machinability rating less
than 30%. On the British Standards system free machining brass (CZ121) is given a rating of 100%, on the Copper Development Association system free cutting brass (C360) is rated as 100%. Machinability ratings according to the above groups are given in the tables relating to mechanical properties. See Mechanical properties of cast alloys and Mechanical properties of wrought alloys. Mechanical properties of cast alloys
Tables 5.14 and 5.15 show typical properties of commonly used cast copper and its alloys. The tensile modulus of copper and high copper alloys is 120 GPa, for cast brasses 90-100 GPa, cast tin bronzes 70-80 GPa, cast gunmetals 80 GPa, cast aluminium bronzes 100-120 GPa (increasing with increasing alloy content), cast cupro-nickels 120-150 GPa (increasing with increasing nickel) and cast nickel silvers 120-137 GPa (increasing with increasing nickel).
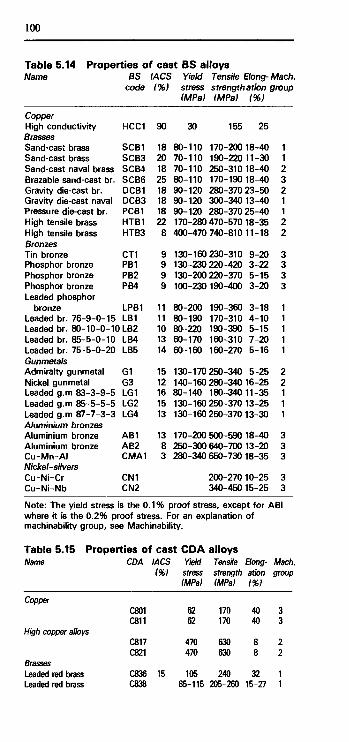
100
Table 5.14 Properties of cast BS alloys Name BS I ACS Yield Tensile Elong- Mach,
code (%) stress strengthation group (MPa) (MPa) (%)
Copper High conductivity Brasses Sand-cast brass Sand-cast brass Sand-cast naval brass Brazable sand-cast br. Gravity die-cast br. Gravity die-cast naval Pressure die-cast br. High tensile brass High tensile brass Bronzes Tin bronze Phosphor bronze Phosphor bronze Phosphor bronze Leaded phosphor
bronze Leaded br. 76-9-0-15
HCC1
SCB1 SCB3 SCB4 SCB6 DCB1 DCB3 PCB1 HTB1 HTB3
CT1 PB1 PB2 PB4
LPB1 LB1
Leaded br. 80-10-0-10 LB2 Leaded br. 85-5-0-10 Leaded br. 75-5-0-20 Gunmetals Admiralty gunmetal Nickel gunmetal Leaded g.m 83-3-9-5 Leaded g.m 85-5-5-5 Leaded g.m 87-7-3-3 Aluminium bronzes Aluminium bronze Aluminium bronze Cu-Mn-AI Nickel-silvers Cu-Ni-Cr Cu-Ni-Nb
LB4 LB5
G1 G3 LG1 LG2 LG4
AB1 AB2 CMA1
CN1 CN2
90
18 20 18 25 18 18 18 22 8
9 9 9 9
11 11 10 13 14
15 12 16 15 13
13 8 3
30 155 25
80-110 170-20018-40 70-110 190-220 11-30 70-110 250-31018-40 80-110 170-19018-40 90-120 280-370 23-50 90-120 300-34013-40 90-120 280-370 25-40 170-280 470-57018-35 400-470 740-81011-18
130-160 230-310 130-230 220-420 130-200 220-370 100-230 190-400
80-200 190-360 80-190 170-310 80-220 190-390 60-170 160-310 60-160 160-270
130-170 250-340
9-20 3-22 5-15 3-20
3-18 4-10 5-15 7-20 5-16
5-25 140-160 280-34016-25 80-140 180-34011-35 130-160 250-370 13-25 130-160 250-370 13-30
170-200 500-590 18-40 250-300 640-700 13-20 280-340 650-730 18-35
200-270 10-25 340-450 15-25
1 1 2 3 2 1 1 2 2
3 3 3 3
1 1 1 1 1
2 2 1 1 1
3 3 3
3 3
Note: The yield stress is the 0.1% proof stress, except for ABI where it is the 0.2% proof stress. For an explanation of machinability group, see Machinability.
Table 5.15 Properties of cast CD A alloys Name CDA IACS Yield Tensile Elong- Mach.
(%) stress strength ation group (MPa) (MPa) (%)
Copper
High copper alloys
Brasses Leaded red brass Leaded red brass
C801 C811
C817 C821
C836 1S C838
62 62
470 470
> 105 85-115
170 170
630 630
240 205-260
40 40
8 8
32 15-27
3 3
2 2
1 1
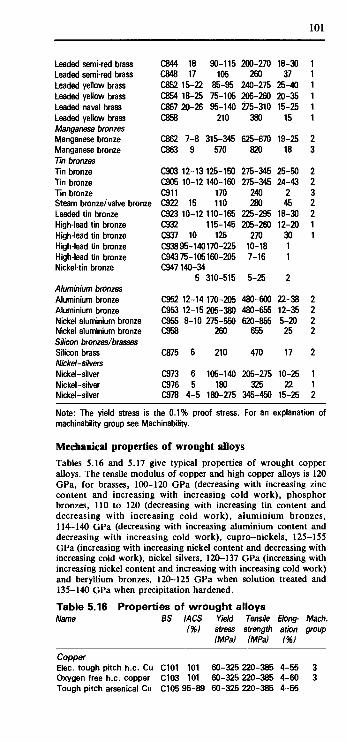
101
Leaded semi-red brass Leaded semi-red brass Leaded yellow brass Leaded yellow brass Leaded naval brass Leaded yellow brass Manganese bronzes Manganese bronze Manganese bronze Tin bronzes Tin bronze Tin bronze Tin bronze Steam bronze/valve bronze Leaded tin bronze High-lead tin bronze High-lead tin bronze High-lead tin bronze High-lead tin bronze Nickel-tin bronze
Aluminium bronzes Aluminium bronze Aluminium bronze Nickel aluminium bronze Nickel aluminium bronze Silicon bronzes/brasses Silicon brass Nickel-silvers Nickel-silver Nickel-silver Nickel-silver
C844 18 90-115 C848 17 105 C852 15-22 85-95
200-270 260
240-275 C854 18-25 75-105 205-260 C857 20-26 95-140 C858 210
C862 7-8 315-345 C863 9 570
C903 12-13 125-150 C905 10-12 140-160 C911 170 C922 15 110 C923 10-12110-165 C932 115-145 C937 10 125 C938 95-140170-225 C943 75-105160-205 C947140-34
5 310-515
C952 12-14 170-205 C953 12-15 205-380 C955 8-10 275-550 C958 260
C875 6 210
C973 6 105-140 C976 5 180 C978 4-5 180-275
275-310 380
625-670 820
275-345 275-345
240 280
225-295 205-260
270 10-18 7-16
5-25
480-600 480-655 620-855
655
470
205-275 325
345-450
18-30 37
25-40 20-35 15-25
15
19-25 18
25-50 24-43
2 45
18-30 12-20
30 1 1
2
22-38 12-35 5-20 25
17
10-25 22
15-25
1 1 1 1 1 1
2 3
2 2 3 2 2 1 1
2 2 2 2
2
1 1 2
Note: The yield stress is the 0.1% proof stress. For an explanation of machinability group see Machinabilrty.
Mechanical properties of wrought alloys
Tables 5.16 and 5.17 give typical properties of wrought copper alloys. The tensile modulus of copper and high copper alloys is 120 GPa, for brasses, 100-120 GPa (decreasing with increasing zinc content and increasing with increasing cold work), phosphor bronzes, 110 to 120 (decreasing with increasing tin content and decreasing with increasing cold work), aluminium bronzes, 114-140 GPa (decreasing with increasing aluminium content and decreasing with increasing cold work), cupro-nickels, 125-155 GPa (increasing with increasing nickel content and decreasing with increasing cold work), nickel silvers, 120-137 GPa (increasing with increasing nickel content and increasing with increasing cold work) and beryllium bronzes, 120-125 GPa when solution treated and 135-140 GPa when precipitation hardened.
Table 5.16 Properties of wrought alloys Name BS IACS Yield Tensile Bong- Mach.
(%) stress strength ation group (MPa) (MPa) (%)
Copper Elec. tough pitch h.c. Cu C101 101 60-325 220-385 4-55 3 Oxygen free h.c. copper C103 101 60-325 220-385 4-60 3 Tough pitch arsenical Cu C105 95-89 60-325 220-385 4-55
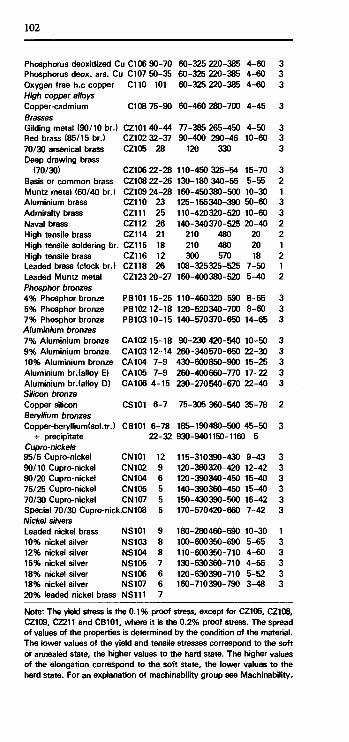
102
Phosphorus deoxidized Cu C106 90-70 60-325 220-385 4-60 3 Phosphorus deox. ars. Cu C107 50-35 60-325 220-385 4-60 3 Oxygen free h.c copper C110 101 60-325 220-385 4-60 3 High copper alloys Copper-cadmium C108 75-90 60-460 280-700 4-45 3 Brasses Gilding metal (90/10 br.) Red brass (85/15 br.) 70/30 arsenical brass Deep drawing brass
(70/30) Basis or common brass Muntz metal (60/40 br.) Aluminium brass Admiralty brass Naval brass High tensile brass High tensile soldering br High tensile brass Leaded brass (clock br.) Leaded Muntz metal Phosphor bronzes 4% Phosphor bronze 5% Phosphor bronze 7% Phosphor bronze Aluminium bronzes 7% Aluminium bronze 9% Aluminium bronze 10% Aluminium bronze Aluminium br. (alloy E) Aluminium br.(alloy D) Silicon bronze Copper silicon Beryllium bronzes Copper-be ryllium(sol.tr.)
+ precipitate Cupro-nickels 95/5 Cupro-nickel 90/10 Cupro-nickel 80/20 Cupro-nickel 75/25 Cupro-nickel 70/30 Cupro-nickel
CZ101 40-44 CZ102 32-37 CZ105 28
CZ106 22-28 CZ108 22-26 CZ109 24-28 CZ110 23 CZ111 25 CZ112 26 CZ114 21
. CZ115 18 CZ116 12 CZ118 26 CZ123 20-27
77-385 265-450 4-50 90-400 290-46 10-60
120 330
110-450 325-54 15-70 130-180 340-55 5-55 160-450380-500 10-30 125-155340-390 50-60 110-420320-520 10-60 140-340370-525 20-40
210 480 20 210 480 20 300 570 18
108-325325-525 7-50 160-400380-520 5-40
PB101 15-25 110-460320-590 8-55 PB102 12-18 PB103 10-15
CA102 15-18
120-520340-700 8-60 140-570370-650 14-65
90-230 420-540 10-50 CA103 12-14 260-340570-650 22-30 CA104 7-9 CA105 7-9 CA106 4-15
CS101 6-7
CB101 6-78
430-600850-900 15-25 260-400660-770 17-22 230-270540-670 22-40
75-305 360-540 35-78
185-190480-500 45-50 22-32 930-9401150-1160 5
CN101 12 CN102 9 CN104 6 CN105 5 CN107 5
Special 70/30 Cupro-nick.CN108 5 Nickel silvers Leaded nickel brass 10% nickel silver 12% nickel silver 15% nickel silver 18% nickel silver 18% nickel silver 20% leaded nickel brass
NS101 9 NS103 8 NS104 8 NS105 7 NS106 6 NS107 6 NS111 7
115-310390-430 9-43 120-380320-420 12-42 120-390340-450 15-40 140-390360-450 15-40 150-430390-500 16-42 170-570420-660 7-42
180-280460-590 10-30 100-600350-690 5-65 110-600350-710 4-60 130-630360-710 4-55 120-630390-710 5-52 160-710390-790 3-48
3 3 3
3 2 1 3 3 2 2 1 2 1 2
3 3 3
3 3 3 3 3
2
3
3 3 3 3 3 3
1 3 3 3 3 3
Note: The yield stress is the 0.1% proof stress, except for CZ105, CZ108, CZ109, CZ211 and CB101, where it is the 0.2% proof stress. The spread of values of the properties is determined by the condition of the material. The lower values of the yield and tensile stresses correspond to the soft or annealed state, the higher values to the hard state. The higher values of the elongation correspond to the soft state, the lower values to the hard state. For an explanation of machinability group see Machinability,
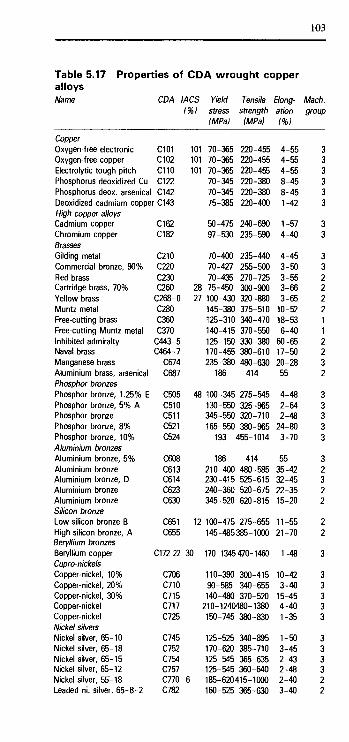
103
Table 5.17 Properties of CDA wrought copper alloys Name CDA I ACS Yield Tensile Bong- Mach.
(%) stress strength ation group (MPa) (MPa) (%)
Copper Oxygen-free electronic C101 Oxygen-free copper C102 Electrolytic tough pitch C110 Phosphorus deoxidized Cu C122 Phosphorus deox. arsenical C142 Deoxidized cadmium copper C143 High copper alloys Cadmium copper C162 Chromium copper C182 Brasses Gilding metal C210 Commercial bronze, 90% C220 Red brass C230 Cartridge brass, 70% C260 Yellow brass C268-0 Muntz metal C280 Free-cutting brass C360 Free-cutting Muntz metal C370 Inhibited admiralty C443-5 Naval brass C464-7 Manganese brass C674 Aluminium brass, arsenical C687 Phosphor bronzes Phosphor bronze, 1.25% E C505 Phosphor bronze, 5% A C510 Phosphor bronze C511 Phosphor bronze, 8% C521 Phosphor bronze, 10% C524 Aluminium bronzes Aluminium bronze, 5% C608 Aluminium bronze C613 Aluminium bronze, D C614 Aluminium bronze C623 Aluminium bronze C630 Silicon bronze Low silicon bronze B C651 High silicon bronze, A C655 Beryllium bronzes Beryllium copper C172 22 Cupro-nickels Copper-nickel, 10% C706 Copper-nickel, 20% C710 Copper-nickel, 30% C715 Copper-nickel C717 Copper-nickel C725 Nickel silvers Nickel silver, 65-10 C745 Nickel silver, 65-18 C752 Nickel silver, 65-15 C754 Nickel silver, 65-12 C757 Nickel silver, 55-18 C770 Leaded ni. silver, 65-8-2 C782
101 101 101
70-365 70-365
70-365
70-345
70-345
75-385
50-475
97-530
220-455 220-455
220-455
220-380
220-380
220-400
240-690
235-590
4-55 4-55
4-55
8-45
8-45
1-42
1-57
4-40
3 3 3 3 3 3
3 3
70-400 235-440
70-427 255-500
70-435 270-725 28 75-450 300-900
27 100-430 320-880
145-380 375-510
125-310 340-470
140-415 370-550
125-150 330-380 170-455 380-610
235-380 480-630
186 414
4-45
3-50
3-55 3-66
3-65
10-52
18-53
6-40
60-65 17-50
20-28
55
3 3 2 2 2 2 1 1 2 2 3 2
48 100-345 275-545 4-48 3 130-550 325-965 2-64 3 345-550 320-710 2-48 3 165-550 380-965 24-80 3
193 455-1014 3-70 3
186 414 55 3
210-400 480-585 35-42 2 230-415 525-615 32-45 3 240-360 520-675 22-35 2
345-520 620-815 15-20 2
12 100-475 275-655 11-55 2
145-485385-1000 21-70 2
1-48 3
10-42
3-40
15-45 4-40
1-35
1-50
3-45 2-43 2-48 2-40
3-40
3 3 3 3 3
3 3 3 3 2 2
-30 170-1345 470-1460
110-390 300-415
90-585 340-655 140-480 370-520
210-1240480-1380 150-745 380-830
125-525 340-895 170-620 385-710 125-545 365-635 125-545 360-640
6 185-620415-1000 160-525 365-630

104
Note: The yield stress values are for 0.1% proof stress. The range of values correspond to the range of tempers from soft to hard. The low values of yield and tensile strength correspond to the soft or annealed condition, the high values to the hard condition. Conversely, the low values of the elongation correspond to the hard condition and the high values to the soft condition. For an explanation of machinability group, see Machinability.
Solderability
Table 5.18 indicates the relative effectiveness of brazing and soldering of copper and its alloys.
Table 5.18 Brazing and soldering of copper alloys Alloy Soldering Brazing
Copper Oxygen free VG Deoxidized VG Tough pitch VG Brasses Red VG Yellow VG Leaded VG Admiralty VG Bronzes Phosphor VG Leaded phosphor VG Aluminium bronzes Aluminium bronzes P Silicon bronzes Silicon bronzes VG Beryllium bronzes Beryllium copper G Cupro-nickels Cupro-nickels VG Nickel silvers Nickel silvers VG
Note: VG = verv good, G = good, P = poor.
Thermal properties
Table 5.19 shows typical values of linear thermal expansivity, i.e. coefficient of expansion, and thermal conductivity of copper and its alloys at about 20°C.
Table 5.19 Thermal properties of copper alloys Material Thermal Thermal
conduct. expansiv. (Wm-1 °C-1) (10-6 °C-1)
Wrought alloys Copper High copper alloys Gilding metal Red brass Cartridge brass Yellow, common, brass Muntz metal Naval brass High tensile brass
VG VG G
VG VG G
VG
VG G
P
VG
G
VG
VG
390 340-370 190 160 120 120 125 113 88
17 18 18 19 20 21 21 21 20

105
Phosphor bronze, 7% Aluminium bronze, 7% Aluminium bronze, 9% Aluminium bronze, 10% Aluminium bronze, alloy D Copper-beryllium Cupro-nickel, 95/10 Cupro-nickel, 90/10 Cupro-nickel, 80/20 Cupro-nickel, 70/30 Leaded 10% nickel brass 10% nickel silver 12% nickel silver 15% nickel silver Cast alloys Copper, high conductivity Brass Gunmetal Leaded gunmetal Tin bronze Phosphor bronze Aluminium bronze
60 70 42 46 65 120 67 50 38 29 46 37 30 27
370 80-90
50 50-80
50 47
42-60
19 17 17 17 16 18 17 17 17 16 19 16 16 16
18 19-21
18 18 18
18-19 16-17
Weldability
Table 5.20 shows the relative weldability of copper and its alloys. Table 5.20 Weldability of copper and its alloys Alloy Arc welding Resistance welding
Coppers Oxygen free Deoxidized Tough pitch Brasses Red brass Yellow brass Leaded brass Admiralty brass Bronzes Phosphor Leaded
phosphor
Gas met. or tung.
G VG
P
G P
No G
G
No Aluminium bronzes Aluminium
bronze Silicon bronzes Silicon bronze Cupro-nickels 10% cupro-
nickel 30% cupro-
nickel Nickel silvers
VG
VG
VG
P P
Submer. arc
No No No
No No No No
No
No
No
No
No
No No
Shield. metal
No No No
No No No
P
P
No
G
P
G
P No
Spot
No No No
P G
No G
G
No
G
VG
G
VG G
Seam
No No No
No No No
P
P
No
G
VG
G
VG P
Proj.
No No No
P G
No G
G
No
G
VG
G
VG G
Flash
G G G
G G P G
VG
P
G
VG
VG
VG G
Note: VG = very good, G = good, P = poor, restricted use, No = not to be used.

106
5.5 Uses Forms
Tables 5.21 and 5.22 show the forms of wrought copper and alloys that are normally available.
Table 5.21 Forms of BS copper and alloys Name BS Forms
Bar Sheet Plate Tube Wire Rod
Copper Elec. tough pitch h.c. Cu Oxygen free h.c. copper Tough pitch arsenical Cu Phosphorus deoxidized Cu Phosphorus deox. ars. Cu Oxygen free h.c. copper High copper alloys Copper-cadmium Brasses Gilding metal (90/10 br.) Red brass (85/15 br.) 70/30 arsenical brass Deep drawing brass
(70/30) Basis or common brass Muntz metal (60/40 br.) Aluminium brass Admiralty brass Naval brass High tensile brass High tensile soldering br. High tensile brass Leaded brass (clock br.) Leaded Muntz metal Phosphor bronzes 4% Phosphor bronze 5% Phosphor bronze 7% Phosphor bronze Aluminium bronzes 7% Aluminium bronze 9% Aluminium bronze 10% Aluminium bronze Aluminium br. (alloy E) Aluminium br.(alloy D) Silicon bronze Copper silicon Beryllium bronzes Copper-beryllium Cupro-nickels 95/5 Cupro-nickel 90/10 Cupro-nickel 80/20 Cupro-nickel 75/25 Cupro-nickel 70/30 Cupro-nickel Special 70/30 Cupro-nick. Nickel silvers Leaded nickel brass 10% nickel silver
C101 C103 C105 C106 C107 C110
C108
CZ101 CZ102 CZ105
CZ106 CZ108 CZ109 CZ110 CZ111 CZ112 CZ114 CZ115 CZ116 CZ118 CZ123
PB101 PB102 PB103
CA102 CA103 CA104 CA105 CA106
CS101
CB101
CN101 CN102 CN104 CN105 CN107 CN108
NS101 NS103

107
12% nickel silver 15% nickel silver 18% nickel silver 18% nickel silver 20% leaded nickel brass
NS104 NS105 NS106 NS107 NS111
Table 5.22 Forms of CDA copper and alloys Name CDA Forms
Flat Rod Wire Tube Pipe Shape
Copper Oxygen free electronic C101 Oxygen free copper C102 Electrolytic tough pitch C110 Phosphorus deoxidized Cu C122 Phosphorus deox.
arsenical C142 Deoxidized cadmium
copper C143 High copper alloys Cadmium copper C162 Chromium copper C182
Gilding metal C210 Commercial bronze, 90% C220 Red brass C230 Cartridge brass, 70% C260 Yellow brass C268-0 Muntz metal C280 Free-cutting brass C360 Free-cutting Muntz metal C370 Inhibited admiralty C443-5 Naval brass C464-7 Manganese brass C674 Aluminium brass, arsenical C687 Phosphor bronzes Phosphor bronze, 1.25% E C505 Phosphor bronze, 5% A Phosphor bronze Phosphor bronze, 8% Phosphor bronze, 10% Aluminium bronzes Aluminium bronze, 5% Aluminium bronze Aluminium bronze, D Aluminium bronze Aluminium bronze Silicon bronze Low silicon bronze B High silicon bronze, A Beryllium bronzes Beryllium copper Cupro-nickels Copper-nickel, 10% Copper-nickel, 20% Copper-nickel, 30%
C510 C511 C521 C524
C608 C613 C614 C623 C630
C651 C655
C172
C706 C710 C715

108
Copper-nickel Copper-nickel Nickel silvers Nickel silver, 65-10 Nickel silver, 65-18 Nickel silver, 65-15 Nickel silver, 65-12 Nickel silver, 55-18
C717 C725
C745 C752 C754 C757 C770
Leaded ni. silver, 65-8-2 C782
Uses of cast alloys
Table 5.23 gives typical uses of BS and CDA cast copper and alloys.
Table 5.23 Uses of BS and CDA cast copper alloys Name BS Cast. Uses
CDA form
Copper High conductivity
High copper alloys
Brasses Leaded red brass
Leaded red brass
HCC1 S,C C801 S,C,T C811 S,C,T
C817 S,C,T
C821 S,C,T
C836 S,C,T
C838 S,C,T
Leaded semi-red brass C844 S,C,T
Leaded semi-red brass C848 S,C Sand cast brass SCB1 S,D
Leaded yellow brass C852 C,T
Sand cast brass SCB3 S,D
Leaded yellow brass C854 S,C,T
Leaded naval brass C857 S,C
Sand cast naval brass SCB4 S
Brazable sand cast br. SCB6 S,D
Gravity die cast br. DCB1 GD,C
Gravity die cast naval DCB3 GD,C
Leaded yellow brass C858 D Pressure die cast br. PCB1 D Manganese bronzes
Electrical components. As above. As above.
Electrical components, stronger and harder than coppers. As above.
Plumbing items, valves, flanges, pump parts. Plumbing items, low-pressure valves, pump parts. General hardware, plumbing items, low-pressure valves. As above. Hardware, pressure tight valves and fittings. Plumbing fittings, hardware, valves, ornamental items. Plumbing, gas fittings, electrical components. General purpose hardware. Hardware, ornamental items. Marine fittings, pumps, heat exchangers. Items to be brazed, marine fittings. Accurate castings for cars, plumbing fittings, etc. Accurate castings, good machinability. As above. As above.
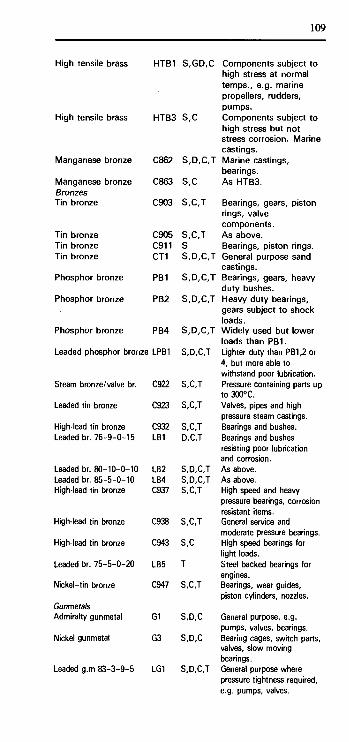
High tensile brass HTB1
High tensile brass HTB3
Manganese bronze C862
Manganese bronze C863 Bronzes Tin bronze C903
Tin bronze Tin bronze Tin bronze
Phosphor bronze
Phosphor bronze
C905 C911 CT1
PB1
PB2
Phosphor bronze PB4
Leaded phosphor bronze LPB1
Steam bronze/valve br. C922
Leaded tin bronze C923
High-lead tin bronze C932 Leaded br. 76-9-0-15 LB1
Leaded br. 80-10-0-10 LB2 Leaded br. 85-5-0-10 LB4 High-lead tin bronze C937
High-lead tin bronze C938
High-lead tin bronze C943
Leaded br. 75-5-0-20 LB5
Nickel-tin bronze C947
Gunmetals Admiralty gunmetal G1
Nickel gunmetal G3
Leaded g.m 83-3-9-5 LG1
S,GD,C Components subject to high stress at normal temps., e.g. marine propellers, rudders, pumps.
S,C Components subject to high stress but not stress corrosion. Marine castings.
S,D,C,T Marine castings, bearings.
S,C As HTB3.
S,C,T Bearings, gears, piston rings, valve components.
S,C,T As above. S Bearings, piston rings. S,D,C,T General purpose sand
castings. S,D,C,T Bearings, gears, heavy
duty bushes. S,D,C,T Heavy duty bearings,
gears subject to shock loads.
S,D,C,T Widely used but lower loads than PB1.
S,D,C,T Lighter duty than PB1,2 or 4, but more able to withstand poor lubrication.
S,C,T Pressure containing parts up to 300°C.
S,C,T Valves, pipes and high pressure steam castings.
S,C,T Bearings and bushes. D,C,T Bearings and bushes
resisting poor lubrication and corrosion.
S,D,C,T As above. S,D,C,T As above. S,C,T High speed and heavy
pressure bearings, corrosion resistant items.
S,C,T General service and moderate pressure bearings.
S,C High speed bearings for light loads.
T Steel backed bearings for engines.
S,C,T Bearings, wear guides, piston cylinders, nozzles.
S,D,C General purpose, e.g. pumps, valves, bearings.
S,D,C Bearing cages, switch parts, valves, slow moving bearings.
S,D,C,T General purpose where pressure tightness required, e.g. pumps, valves.
109

110
Leaded g.m 85-5-5-5 LG2 S,D,C,T As LG1, but better pressure tightness.
Leaded g.m 87-7-3-3 Aluminium bronzes Aluminium bronze
Aluminium bronze
Aluminium bronze
Aluminium bronze Cu-Mn-AI
Nickel aluminium br.
Nickel aluminium br. Silicon bronzes/brasses Silicon brass
Nickel-silvers Cu-Ni-Cr
Cu-Ni-Nb Nickel-silver Nickel-silver
Nickel-silver
LG4
AB1
C952
C953
AB2 CMA1
C955
C958
C875
CN1
CN2 C973 C976
C978
S,D,C,T
S,GD,C
S,C,T
S(C,T
S,GD,C,1
As LG1, but better strength.
High strength, high corrosion resistance items, e.g. pumps, marine items. Die cast items for cars. Bearings, gears, bushes, valve seats, acid-resisting pumps. Gears, marine equipment, nuts, pickling baskets. Higher temp, use than AB1.
S,GD,C,T Heavy, intricate items with
S,C,T
S,C,T
S,C,D
S
S S S
S
high resistance to corrosion and wear. Corrosion resistant items, agitators, gears, aircraft valve guides and seats. Corrosion resistant items.
Bearings, gears, rocker arms, impellers.
Ornamental and hardware items. As above. As above. Marine castings and ornamental items. Valves and valve seats, musical instrument components, ornamental items.
Note: S = sand cast, C = centrifugal cast, D = die cast, GD = gravity die cast, T = continuously cast.
Uses of wrought alloys
Table 5.24 gives typical uses of BS and CDA wrought copper and alloys.
Table 5.24 Uses of wrought copper and alloys Name BS CDA Uses
Copper Elec. tough pitch h.c. Cu C101 C110C/H working. Electrical
wires, busbars, heat exchangers, roofing.
Oxygen free h.c. copper C103 C102 C/H working. Electronic components, waveguides, busbars.
Tough pitch arsenical Cu C105 C/H working. General engineering work.
Phosphorus deoxidized Cu C106 C122 C/H working. Plumbing piping, chemical plant, heat exchangers.
Phosphorus deox. ars. Cu C107 C142C/H working. Heat exchanger and
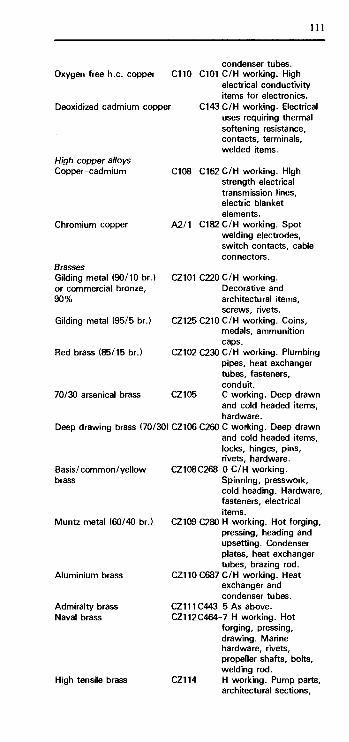
in
Oxygen free h.c. copper C110 C101
Deoxidized cadmium copper C143
High copper alloys Copper-cadmium
condenser tubes. C/H working. High electrical conductivity items for electronics. C/H working. Electrical uses requiring thermal softening resistance, contacts, terminals, welded items.
C108 C162 C/H working. High strength electrical transmission lines, electric blanket elements.
Chromium copper A2/1 C182 C/H working. Spot welding electrodes, switch contacts, cable connectors.
Brasses Gilding metal (90/10 br.) CZ101 C220 or commercial bronze, 90%
Gilding metal (95/5 br.) CZ125 C210
Red brass (85/15 br.) CZ102 C230
70/30 arsenical brass CZ105
Deep drawing brass (70/30) CZ106 C260
Basis/common/yellow CZ108C268 brass
Muntz metal (60/40 br.) CZ109 C280
Aluminium brass
Admiralty brass Naval I
High tensile brass
CZ110C687
CZ111C443 CZ112C464
CZ114
C/H working. Decorative and architectural items, screws, rivets. C/H working. Coins, medals, ammunition caps. C/H working. Plumbing pipes, heat exchanger tubes, fasteners, conduit. C working. Deep drawn and cold headed items, hardware. C working. Deep drawn and cold headed items, locks, hinges, pins, rivets, hardware. -0 C/H working. Spinning, presswork, cold heading. Hardware, fasteners, electrical items. H working. Hot forging, pressing, heading and upsetting. Condenser plates, heat exchanger tubes, brazing rod. C/H working. Heat exchanger and condenser tubes. -5 As above. ■7 H working. Hot forging, pressing, drawing. Marine hardware, rivets, propeller shafts, bolts, welding rod. H working. Pump parts, architectural sections,
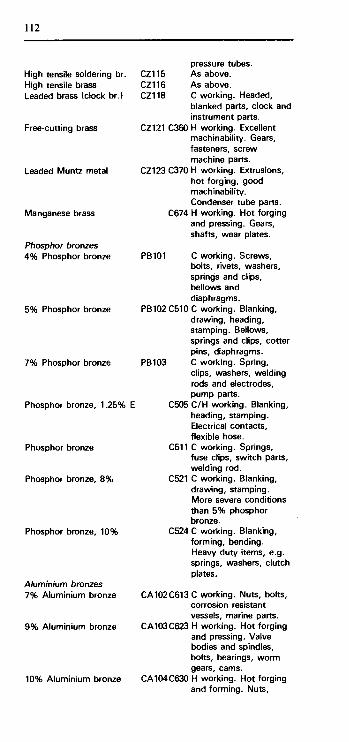
112
High tensile soldering br. High tensile brass Leaded brass (clock br.)
Free-cutting brass
Leaded Muntz metal
Manganese brass
CZ115 CZ116 CZ118
pressure tubes. As above. As above. C working. Headed, blanked parts, clock and instrument parts.
CZ121 C360 H working. Excellent machinability. Gears, fasteners, screw machine parts.
CZ123 C370 H working. Extrusions,
'
hot forging, good machinability. Condenser tube parts.
C674 H working. Hot forging and pressing. Gears, shafts, wear plates.
Phosphor bronzes 4% Phosphor bronze
5% Phosphor bronze
7% Phosphor bronze
Phosphor bronze, 1.25% E
Phosphor bronze
Phosphor bronze, 8%
Phosphor bronze, 10%
Aluminium bronzes 7% Aluminium bronze
9% Aluminium bronze
10% Aluminium bronze
PB101 C working. Screws, bolts, rivets, washers, springs and clips, bellows and diaphragms.
PB102 C510 C working. Blanking, drawing, heading, stamping. Bellows, springs and clips, cotter pins, diaphragms.
PB103 C working. Spring, clips, washers, welding rods and electrodes, pump parts.
C505 C/H working. Blanking, heading, stamping. Electrical contacts, flexible hose.
C511 C working. Springs, fuse clips, switch parts, welding rod.
C521 C working. Blanking, drawing, stamping. More severe conditions than 5% phosphor bronze.
C524 C working. Blanking, forming, bending. Heavy duty items, e.g. springs, washers, clutch plates.
CA102C613C working. Nuts, bolts, corrosion resistant vessels, marine parts.
CA103C623 H working. Hot forging and pressing. Valve bodies and spindles, bolts, bearings, worm gears, cams.
CA104C630 H working. Hot forging and forming. Nuts,

113
Aluminium br.(alloy E) Aluminium br. (alloy D) Aluminium bronze, 5%
Silicon bronze Copper silicon or low-silicon bronze B
High silicon bronze, A Beryllium bronzes Copper-beryllium
Cupro-nickels 95/5 Cupro-nickel
90/10 Cupro-nickel 80/20 Cupro-nickel
75/25 Cupro-nickel
70/30 Cupro-nickel
Special 70/30 Cupro-nick.
Copper-nickel Copper-nickel
Nickel silvers Leaded nickel brass
10% nickel silver
12% nickel silver 15% nickel silver 18% nickel silver 18% nickel silver
bolts, valve seats and guides, pump shafts.
CA105 As above. CA106C614 As above. CA101C608 C working. Condenser
and heat exchanger tubes.
CS101 C651 C/H working. Blanking, or drawing, heading, hot forging and pressing. Chemical plant, marine hardware, bolts, cable clamps, hot water tanks and fittings.
C655 As above.
CB101 C172 C/H working. High strength, high conductivity items. Springs, clips, fasteners, non-sparking tools.
CN101 C/H working. Sea-water corrosion resistant items, ammunition.
CN102C706 As above. CN104C710 C/H working. Deep
drawn and pressing items.
CN105 C/H working. Coins and medals.
CN107C715 C/H working. Salt water piping, fasteners.
CN108 C/H working. Very good resistance to corrosion erosion in sea water. Mooring cables, ocean cable pins.
C717 As above. C725 C/H working. Blanking,
drawing, forming, heading, spinning, stamping. Relay and switch springs, bellows
NS101 H working. Clock and watch components, architectural items.
NS103C745C working. Blanking, drawing, forming, heading, spinning. Rivets, screws, clips, slide fasteners, decorative items.
NS104C757 As above. NS105C754 As above. NS106C752 As above. NS107C770 C working. Blanking,
forming. Optical goods,

114
springs and clips for electrical equipment.
20% leaded nickel brass NS111C782 C working. Machined items to resist wear and corrosion, screws, hinges, keys, watch parts.
Note: C = cold, H = hot in relation to good working characteristics.
6 Magnesium 6.1 Materials Magnesium
Magnesium has a density at 20°C of 1.7 x 10³ kg m~3 and thus a low density compared with other metals. It has an electrical conduc-tivity of about 60% of that of copper, as well as a high thermal conductivity. It has a tensile strength which is too low for engineering purposes and so is used only in engineering in alloy form. Under ordinary atmospheric conditions magnesium has good corrosion resistance, as a result of an oxide layer which develops on its surface in air. However, this layer is not completely impervious, particularly in air that contains salts, and thus the corrosion resistance can be low under adverse conditions.
Magnesium alloys
Because of the low density of magnesium, the magnesium-base alloys have low densities. They thus find a use in applications where lightness is a prime consideration, e.g. in aircraft. Aluminium alloys have higher densities than magnesium alloys but can have greater strength. The strength-to-weight ratio for magnesium alloys is, however, greater than that of aluminium alloys. Magnesium alloys also have the advantage of good machinability and weld readily. The corrosion resistance is, however, not as good as that of aluminium alloys.
There are three main groups of magnesium alloys in common use, some being mainly used as casting alloys, some as wrought alloys and some offering alloys which can be used in both ways: 1 Magnesium-manganese alloys.
These are mainly used for sheet metal fabrication processes, being readily welded.
2 Magnesium-aluminium-zinc alloys. These are mainly used for sand casting, gravity die casting, extrusions and forging. Solution treatment and precipitation hardening are possible.
3 Magnesium-zirconium-thorium/zinc/silver alloys. The zirconium has an intense grain refining effect. The alloys are used in both cast and wrought forms. They have high proof stresses, good resistance to impact, good fabrication properties and good corrosion resistance.
See Codes for composition, Coding system for temper, Composition of cast alloys, Composition of wrought alloys, Annealing, Solution treatment and aging, Stress relieving, Density, Electrical properties, Fatigue properties, Mechanical properties of cast alloys, Mechanical properties of wrought alloys, Thermal properties, Weldability, Forms, Uses of cast alloys, Uses of wrought alloys.
6.2 Codes and compositions Codes for composition
A widely used coding system is that of the American Society for Testing Materials (ASTM). Letters and numbers are used to designate an alloy. Firstly two letters are used to indicate the major alloying elements (see Table 6.1). These are followed by two numbers to indicate the nominal percentage amounts of these two alloying elements. The third part of the designation is a letter from A to Z, but excepting I and O, to indicate different alloys with the

116
same nominal composition specified by the preceding letters and numbers. The final part of the coding is a specification of the temper, this being the same system as for aluminium. For details of commonly used tempers with magnesium, see Codes for temper.
To illustrate the above coding system, consider the magnesium alloy AZ81A-T4. The principal alloying elements are aluminium (A) and zinc (Z). There is nominally 8% aluminium and \°/o zinc. The specific alloy in this type is alloy A. It has a temper of T4, i.e. it is in the solution heat treated condition.
ASTM code letters for magnesium alloys Table 6.1 Letter
A B C D E F H K L M N P Q R S T Z
ASTM co Element
Aluminium Bismuth Copper Cadmium Rare earth Iron Thorium Zirconium Beryllium Manganese Nickel Lead Arsenic Chromium Silicon Tin Zinc
The coding system used by British Standards uses a different system for cast and wrought magnesium alloys. For cast alloys the designa-tion consists of the letters MAG followed by a number, the number being used to indicate the casting alloy concerned. MAG 3 is an example of a casting alloy. This is sometimes followed by a letter to indicate the temper, the same letters being used as for the British Standards' system for aluminium (see Coding system for temper). For wrought alloys the designation consists of the letters MAG followed by a dash and a letter to indicate the form of supply (S = plate, sheet and strip, E = bars, sections and tubes, including extruded forged stock). Following another dash there is a number upwards from 100 to indicate the specific alloy concerned. Finally there is a letter to indicate the temper, the same letters being used as for the British Standards' system for aluminium (see Coding system for temper).
As an example of the British Standards' system consider the magnesium alloy MAG-S-101M. The MAG indicates that it is a magnesium based alloy. The S indicates that it is in plate, sheet or strip form. The number 101 indicates the specific alloy concerned. The final M indicates that the temper is - as manufactured. An example of a cast alloy is MAG 3 TB, the 3 indicating the specific alloy concerned and the TB the temper, it being solution treated.
Coding system for temper
The coding systems used for temper are the same as those used for aluminium, the British Standards' system being a slight variation from the widely used American CDA system. Table 6.2 gives the tempers generally used with magnesium.

117
Table 6.2 Coding system for temper American British Temper
F 0 H10, H11 H23, H24, H26
T4 T5
M 0
TB TE
As fabricated/manufactured. Annealed. Slightly strain hardened. Strain hardened and partially
annealed. Solution heat treated. Precipitation treated, i.e. artificially
T6 TF Solution heat treated and precipitation treated, i.e. artificially
Composition of cast alloys
Table 6.3 shows the composition of cast magnesium alloys to ASTM and British Standard specifications.
Table 6.3 Composition of cast magnesium alloys BS ASTM Cast. code code proc. Nominal composition %
Mg
Magnesium-aluminium-zinc AZ63A S,P rem
MAG 1 AZ81A S,P rem MAG 2 S,P rem MAG 3 AZ91C S,P rem MAG 3 AZ91A D rem
AZ92A S,P rem MAG 7 S,P rem
AI
alloys 6.0 7.6 8.2 9.0 9.0 9.0 8.0
Magnesium-aluminium-manganese AM100A S,P rem AM60A D rem
10.0 6.0
Zn
3.0 0.7 0.7 0.7 0.7 2.0 0.9 a//oys
Mn
0.2 0.2 0.5 0.3 0.1 0.1 0.5
0. 0.
Th
1 1
Magnesium-zinc-zirconium-rare earth/thorium alloys MAG 4 ZK51A S,P rem
ZK61A S,P rem MAG 5 ZE41A S,P rem
ZE63A S,P rem MAG 6 EZ33A S,P rem MAG 8 HZ32A S,P rem MAG 9 ZH62A S,P rem
4.6 6.0 4.2 5.8 2.7 2.1 5.7
Magnesium-zirconium-thorium alloys HK31A rem
Magnesium-zirconium-silver alloys QE22A S,P rem
3.3 1.8
3.3
Zr
0.7 0.7 0.7 0.7 0.7 0.7 0.7
0.7
Others
1.2 RE 2.6 RE 3.3 RE
0.7 2.5 Ag, 2.1 RE
Note: rem = remainder, RE= rare earths.
Composition of wrought alloys
Table 6.4 shows the composition of commonly used wrought magnesium alloys.
aged.
aged.

118
Table 6.4 Composition of wrought magnesium alloys BS ASTM Nominal composition (%) code code
0.4 1.0 1.0
1.9
1.0 2.3 3.3 4.0 5.5
0.2 0.2 0.2
1.0
Mg AI Zn Mn Th Zr
Magnesium-aluminium-manganese alloys MAG-101 M1A rem 1.2 Magnesium-aluminium-zinc alloys
AZ10A rem 1.2 MAG-111 AZ31B rem 3.0 MAG-121 AZ61A rem 6.0 Magnesium-zinc-manganese alloys MAG-131 rem Magnesium-zinc -zirconium alloys MAG-141 rem 1.0 0.6
ZK21A rem 2.3 0.5 MAG-151 rem 3.3 0.6
ZK40A rem 4.0 0.5 MAG-161 ZK60A rem 5.5 0.6 Magnesium-thorium-zirconium/manganese alloys
HK31A rem 3.0 0.6 HM21A rem 0.6 2.0 HM31A rem 1.2 3.0
Note: rem = remainder.
63 Heat treatment Annealing
Annealing of the wrought magnesium-aluminium-zirconium alloys is 1 hour or more at about 345°C, the wrought magnesium-thorium-zirconium/manganese alloys 400 to 450°C, and the wrought magnesium-zinc-zirconium alloys about 290° C.
Solution treatment and aging
Table 6.5 outlines the types of heat treatment used with casting alloys.
Table 6.5 Solution treatment and aging of cast magnesium alloys
Alloy Solution tr. Aging Temper
Type Example temp.°C time htemp.Xtime h BS USA
Mg-AI-Mn AM100A 230 5 TE T5 Mg-AI-Zn AZ91C 170 16 TE T5
AZ91C, MAG 3 415 16-20' TB T4 AZ81A, MAG 1,
MAG 7. AZ91C, MAG 3, 41516-20* 170 16 TF T6
MAG 7. Mg-Zn-X EZ33A 215 5 TE T5
MAG 4 175 10-16 TE T5 MAG 6
HZ32A, MAG 8 315 16 TE T5 ZE41A, MAG 5 330 2 and
175 16 TE T5 ZH62A, MAG 9 330 2 and
175 16 TE T5
Note: indicates alternative forms of treatment are possible.
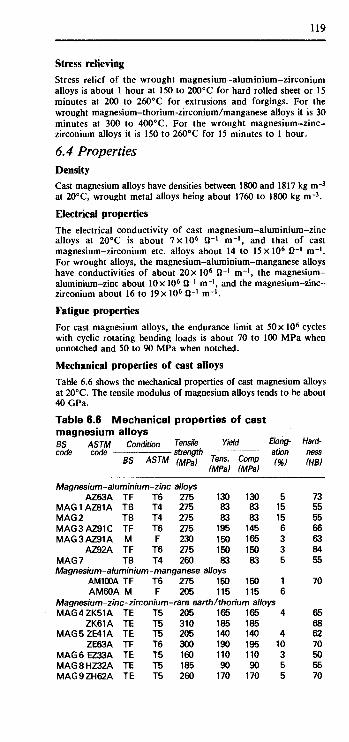
119
Stress relieving
Stress relief of the wrought magnesium-aluminium-zirconium alloys is about 1 hour at 150 to 200°C for hard rolled sheet or 15 minutes at 200 to 260°C for extrusions and forgings. For the wrought magnesium-thorium-zirconium/manganese alloys it is 30 minutes at 300 to 400°C. For the wrought magnesium-zinc-zirconium alloys it is 150 to 260°C for 15 minutes to 1 hour.
6.4 Properties Density
Cast magnesium alloys have densities between 1800 and 1817 kg m-3
at 20°C, wrought metal alloys being about 1760 to 1800 kg m~3.
Electrical properties
The electrical conductivity of cast magnesium-aluminium-zinc alloys at 20°C is about 7x l0 6 Ω"1 m"1, and that of cast magnesium-zirconium etc. alloys about 14 to 15xl06 Ω-1 m_l. For wrought alloys, the magnesium-aluminium-manganese alloys have conductivities of about 20 x 106 Ω-1 m~l, the magnesium-aluminium-zinc about 10χ106Ω-1 m-1, and the magnesium-zinc-zirconium about 16 to 19 x 106 Ω-1 m_l.
Fatigue properties
For cast magnesium alloys, the endurance limit at 50 x 106 cycles with cyclic rotating bending loads is about 70 to 100 MPa when unnotched and 50 to 90 MPa when notched.
Mechanical properties of cast alloys
Table 6.6 shows the mechanical properties of cast magnesium alloys at 20° C. The tensile modulus of magnesium alloys tends to be about 40GPa.
Table 6.6 Mechanical properties of cast magnesium alloys BS ASTM Condition Tensile Yield Bong- Hard-code code strength-— ation ness
BS ASTM (MPa) Tens Comp (%) m (MPa) (MPa)
Magnesium-aluminium -zinc AZ63A
MAG1AZ81A MAG 2 MAG3AZ91C MAG3AZ91A
AZ92A MAG 7
TF TB TB TF M TF TB
Magnesium-aluminiurr AM100A TF AM60A M
T6 T4 T4 T6 F
T6 T4
alloys 275 275 275 275 230 275 260
i-manganese T6 F
Magnesium-zinc-zirconium-MAG4ZK51A
ZK61A MAG5ZE41A
ZE63A MAG6EZ33A MAG8HZ32A MAG9ZH62A
TE TE TE TF TE TE TE
T5 T5 T5 T6 T5 T5 T5
275 205
130 83 83
195 150 150 83
alloys 150 115
130 83 83
145 165 150 83
150 115
5 15 15 6 3 3 5
1 6
-rare earth/thorium alloys 205 310 205 300 160 185 260
165 185 140 190 110 90
170
165 185 140 195 110 90
170
4
4 10 3 5 5
73 55 55 66 63 84 55
70
65 68 62 70 50 55 70

120
Magnesium-zirconium-thorium alloys HK31A TF T6 220 105 105 8 55 Magnesium-zirconium-silver alloys
QE22A TF T6 260 195 195 3 80
Note: The yield stress values are the 0.2% proof stress and are given for both tension and compression.
Mechanical properties of wrought alloys
Table 6.7 shows the mechanical properties of wrought magnesium alloys at 20°C. The values given should only be taken as indicative of the order of magnitude, since the values depend on the form of the product, i.e. sheet, bar, tube, and the thickness. The tensile modulus of magnesium alloys tends to be about 40 GPa.
Table 6.7 Mechanical properties of wrought magnesium alloys BS ASTM Condition Tensile Yield Bong- Hard-code code —— strength ation ness
BS ASTM (MPa) Tens. Comp. (%) {m (MPa) (MPa)
Magnesium-aluminium-manganese alloys MAG-101 M1A M F 255 Magnesium-aluminium-zinc alloys
AZ10A M F 240 MAG-111 AZ31B M F 260 MAG-121 A261A M F 310 Magnesium-zinc - manganese a Ho ys MAG-131 M F 260 Magnesium -zinc-zirconium alloys MAG-141 M F 270
ZK21A M F 260 MAG-151 M F 310
ZK40A TE T5 275 MAG-161 ZK60A TE T5 365
180
145 200 230
200
205 195 225 255 305
Magnesium - thorium -zirconium/manganese HK31A H24 255 HM21A T8 235 HM31A H24 290
200 170 220
83
70 97
130
135
140 250
alloys 160 130 180
12
10 15 12
>8
>8 4
)8 4
11
9 11 15
Note: The yield stress values given are the 0.2% proof stress.
Thermal properties
The linear thermal expansivity, i.e. coefficient of linear expansion, for both cast and wrought alloys is about 27 x 10-6 0 C _ 1 . For cast alloys, the thermal conductivity of magnesium-aluminium-zinc alloys is about 84 W m- 1 °C_ I and that of magnesium-zirconium etc. alloys about 100 to 113 W m_1 °C- 1 . For wrought alloys, it is about 140 W m_1 °C_ 1 for magnesium-aluminium-manganese alloys, about 80 W m_ 1 °C_ 1 for magnesium-aluminium-zinc alloys and about 120 to 130 W m_ I °C~l for magnesium-zirconium etc. alloys. The specific heat capacity of both cast and wrought alloys is about 1000 J kg-' 0C"1.
Weldability
Argon arc welding is the method most used with magnesium alloys. Gas welding must not be used with zirconium containing alloys and special procedures are necessary with other magnesium alloys. See the tables with Uses of cast alloys and Uses of wrought alloys for
40
50 60
90
70
70

121
details about specific alloys.
6.5 Uses
Forms
The forms of casting that can be used with the magnesium casting alloys is shown in Table 6.3, along with the details of alloy composi-tion. Most of the alloys can only be used for sand or permanent mould casting. Table 6.8 shows the forms available for the wrought magnesium alloys.
Table 6.8 Forms of wrought magnesium alloys BS ASTM Sheet Extruded bar code code plate and shapes
Magnesium-aluminium-manganese alloys MAG-101 M1A Magnesium-aluminium-zinc alloys
AZ10A MAG-111 AZ31B MAG-121 AZ61A Magnesium-zinc-manganese alloys MAG-131 Magnesium-zinc-zirconium alloys MAG-141
ZK21A MAG-151
ZK40A MAG-161 ZK60A Magnesium-thorium-zirconium/manganese alloys
HK31A HM21A HM31A
Uses of cast alloys
Table 6.9 shows typical uses of cast magnesium alloys. MAG 1, MAG 3, MAG 4 and MAG 7 can be considered general purpose alloys with MAG 2, MAG 5, MAG 6, MAG 8 and MAG 9 being used for special applications.
Table 6.9 Uses of cast magnesium alloys BS ASTM Typical uses code code
Magnesium-aluminium-zinc alloys MAG 1 AZ81A A general purpose sand and permanent mould
casting alloy, suitable for where ductility and resistance to shock are required with moderately high strength. Used for car wheels, portable electric tools, plastics moulds.
MAG 2 A high purity version of MAG 1. Used for instrument casings, photographic and optical equipment.
MAG 3 AZ91CLess microporosity than MAG 1 and so used AZ91Afor pressure-tight applications. Used for car
engine covers and manifolds, power tool and electric motor components.
MAG 7 Similar properties to MAG 3 and is very widely

122
used. Uses include portable power tool items, chain saw parts, bricklayers' hods, heavy vehicle engine sumps, manifolds and covers, car wheels, camera tripods.
Magnesium-zinc-zirconium-rare earth/thorium alloys MAG 4 ZK51AA high proof stress alloy with good ductility
and mechanical properties up to 150°C. Not suitable for spidery complex castings or welding.
MAG 5 ZE41AAn improvement on MAG 4 where spidery complex castings are required. Used where high strength and pressure tightness are required. Uses include suspension, chassis, bearings and manifold components for racing cars.
MAG 6 EZ33A Pressure tight and creep resistant up to 250°C and can be argon arc welded.
MAG 8 HZ32A An improvement on MAG 6 for use up to 350°C.
MAG 9 ZH62A Higher strength than MAG 4 and so used for heavy duty applications.
Uses of wrought alloys
Table 6.10 shows typical uses of wrought magnesium alloys.
Table 6.10 Uses of cast magnesium alloys BS ASTM Typical uses code code
Magnesium-aluminium-manganese alloys MAG-101 M1A A general purpose alloy with good corrosion
resistance, weldable by gas and argon arc, though having low strength.
Magnesium-aluminium-zinc alloys MAG-111 AZ31B A medium strength alloy with good formability
and weldable. MAG-121 AZ61A A general purpose alloy, weldable by gas and
argon arc. Magnesium-zinc-manganese alloys MAG-131 A medium strength alloy with good formability
and weldable by argon arc. Magnesium-zinc-zirconium alloys MAG-141 A high strength sheet and extrusion alloy
which is fully weldable. MAG-151 A high strength sheet, extrusion and forging
alloy which is weldable under good conditions. MAG-161 ZK60A A high strength extrusion and forging alloy but
which is not weldable.

7 Nickel 7.7 Materials Nickel Nickel has a density of 8.88 x 10³ kg m-3 and a melting point of 1455°C. It has good tensile strength and maintains it to quite elevated temperatures. It can be both cold and hot worked, has good machining properties and can be joined by welding, brazing and soldering. It possesses excellent corrosion resistance, hence it is often used as a cladding on steel.
Alloys
Nickel is used as the base metal for a number of alloys with excellent corrosion resistance and strength at high temperatures. The alloys can be considered to fall into three main categories: 1 Nickel-copper alloys Nickel and copper are completely soluble in each other in both the liquid and solid states, see the equilibrium diagram (Figure 5.6). Those nickel-copper alloys containing about 67% nickel and 33% copper are called Monels. 2 Solid solution nickel-chromium, etc. alloys Nickel-chromium-iron alloys, often with other alloying elements, form a series of solid solution engineering alloys called Inconels and Incoloys. The trade name Hastelloy is often used with solid solution nickel-chromium-molybdenum-iron alloys. 3 Precipitation hardening nickel-chromium-iron, etc. alloys Alloys based on just nickel-chromium-iron are only hardened by cold working; however the addition of other elements such as aluminium, beryllium, silicon or titanium enables them to be hardened by precipitation heat treatment. The term superalloys is often used for high temperature, heat resistant alloys that are able to maintain their high strengths, resistance to creep and oxidation resistance at high temperatures. They are complex alloys and can be nickel based, nickel-iron based or cobalt based, and include such elements as chromium, cobalt, molybdenum, aluminium, titanium, etc. They are available in both wrought and cast forms. The earliest nickel-base superalloy was Nimonic 80, a nickel-20% chromium solid solution with 2.25% titanium and 1.0% aluminium providing precipitates.
See Codes, Composition of nickel and alloys, Annealing, Solution treatment and precipitation, Stress relief, Creep properties, Density, Electrical resistivity, Fatigue properties, Mechanical properties of cast alloys, Mechanical properties of wrought alloys, Oxidation limit, Thermal properties, Forms, Uses of nickel alloys.
7.2 Codes and compositions Codes
In general most nickel alloys are referred to by their trade names. British Standards have a system of specifying alloys by the letters NA followed by a number to indicate the specific alloy concerned. Superalloys are given numbers against the letters HR. The American Society for Testing and Materials (ASTM) and the American Society of Mechanical Engineers (ASME) issue specifications for a number of nickel alloys, using a letter or letters followed by a three digit number. Table 7.1 shows the relationships of alloys specified by these methods to the trade names.
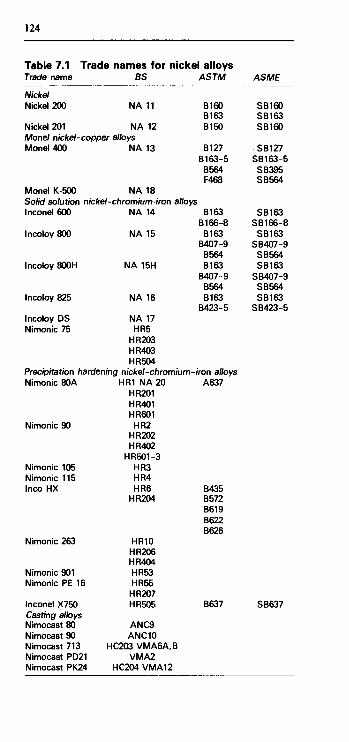
124
Table 7.1 Trade names for nickel alloys Trade name BS ASTM ASME
Nickel Nickel 200
Nickel 201
NA 11
NA 12 Monel nickel-copper alloys Monel 400
Monel K-500
NA 13
NA 18
B160 B163 B160
B127 B163-5 B564 F468
Solid solution nickel-chromium-iron alloys Inconel 600
Incoloy 800
Incoloy 800H
Incoloy 825
Incoloy DS Nimonic 75
NA 14
NA 15
NA 15H
NA 16
NA 17 HR5
HR203 HR403 HR504
Precipitation hardening nickel-chromium-Nimonic 80A
Nimonic 90
Nimonic 105 Nimonic 115 Inco HX
Nimonic 263
Nimonic 901 Nimonic PE 16
Inconel X750 Casting alloys Nimocast 80 Nimocast 90 Nimocast 713 Nimocast PD21 Nimocast PK24
HR1 NA 20 HR201 HR401 HR601 HR2
HR202 HR402
HR501-3 HR3 HR4 HR6
HR204
III
HR53 HR55 HR207 HR505
ANC9 ANC10
HC203 VMA6A,B VMA2
HC204 VMA12
B163 B166-8 B163
B407-9 B564 B163
B407-9 B564 B163
B423-5
-iron alloys A637
B435 B572 B619 B622 B626
B637
SB160 SB163 SB160
SB127 SB163-5 SB395 SB564
SB163 SB166-8 SB163
SB407-9 SB564 SB163
SB407-9 SB564 SB163
SB423-5
SB637
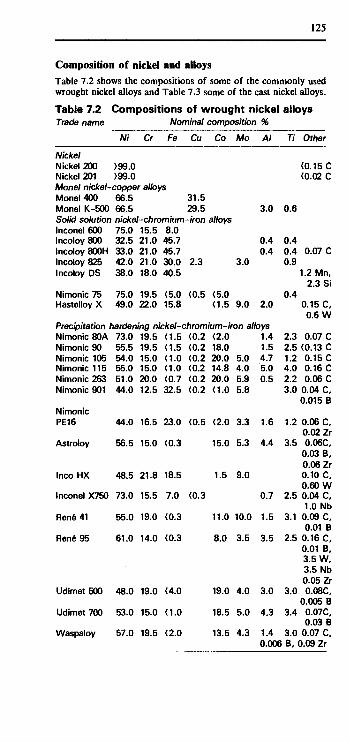
125
Composition of nickel and alloys
Table 7.2 shows the compositions of some of the commonly used wrought nickel alloys and Table 7.3 some of the cast nickel alloys.
Table 7.2 Compositions of wrought nickel alloys Trade name Nominal composition %
Nickel Nickel 200 Nickel 201 Monel nickel-Monel 400 Monel K-500
Ni
>99.0 >99.0
Cr Fe
■copper alloys 66.5 66.5
Solid solution nickel-chromium Inconel 600 Incoloy 800 Incoloy 800H Incoloy 825 Incoloy DS
Nimonic 75 Hastelloy X
Precipitation I Nimonic 80A Nimonic 90 Nimonic 105 Nimonic 115 Nimonic 263 Nimonic 901
Nimonic PE16
Astroloy
Inco HX
Inconel X750
Reno 41
Rene 95
Udimet 500
Udimet 700
Waspaloy
75.0 32.5 33.0 42.0 38.0
75.0 49.0
15.5 21.0 21.0 21.0 18.0
19.5 22.0
8.0 45.7 45.7 30.0 40.5
<5.0 15.8
Cu
31.5 29.5 -iron
2.3
<0.5
Co
alloys
<5.0 <1.5
Mo
3.0
9.0
AI
3.0
0.4 0.4
2.0
hardening nickel-chromium-iron alloys 73.0 55.5 54.0 55.0 51.0 44.0
44.0
56.5
48.5
73.0
55.0
61.0
48.0
53.0
57.0
19.5 19.5 15.0 15.0 20.0 12.5
16.5
15.0
21.8
15.5
19.0
14.0
19.0
15.0
19.5
<1.5 <1.5 <1.0 <1.0 <0.7 32.5
23.0
<0.3
18.5
7.0
<0.3
<0.3
<4.0
<1.0
<2.0
<0.2 <0.2 <0.2 <0.2 <0.2 <0.2
<0.5
<0.3
<2.0 18.0 20.0 14.8 20.0 <1.0
<2.0
15.0
1.5
11.0
8.0
19.0
18.5
13.5
5.0 4.0 5.9 5.8
3.3
5.3
9.0
10.0
3.5
4.0
5.0
4.3
1.4 1.5 4.7 5.0 0.5
1.6
4.4
0.7
1.5
3.5
3.0
4.3
1.4
Ti Other
<0.15 C <0.02 C
0.6
0.4 0.4 0.07 C 0.9
1.2 Mn, 2.3 Si
0.4 0.15 C, 0.6 W
2.3 0.07 C 2.5 <0.13 C 1.2 0.15 C 4.0 0.16 C 2.2 0.06 C 3.0 0.04 C,
0.015 B
1.2 0.06 C, 0.02 Zr
3.5 0.06C, 0.03 B, 0.06 Zr 0.10 C, 0.60 W
2.5 0.04 C, 1.0 Nb
3.1 0.09 C, 0.01 B
2.5 0.16 C, 0.01 B, 3.5 W, 3.5 Nb 0.05 Zr
3.0 0.08C, 0.005 B
3.4 0.07C, 0.03 B
3.0 0.07 C, 0.006 B, 0.09 Zr

126
Table 7.3 Trade name
Nimocast 80 Nimocast 90
Nimocast 713 Nimocast PD21 Nimocast PK24 B-1900 MAR-M 200
Rene 77 Rene 80
Compositions of cast nickel alloys
Ni
70.0 57.5
75
75
61 64 59
58 60
Cr
20.0 19.5
13
5.7
9.5 8 9
15 14
Nominal composition %
Si
0.6 0.6
Co
<2.0 16.5
15 10 10
15 9.5
Mo
4
2
3 6
4.2 4
AI
1.2 1.3
6
6
5.5 6 5
4.3 3
77
2.6 2.4
4.7 1 2
3.3 5
C Other
0.080.6 Mn 0.090.6 Mn,
<2.0 Fe 2Nb
11 W
1 V 0.1 4 Ta 0.15 1 Fe,
12.5 W 1 Nb
0.07 0.17 4 W
Note: Not all the above alloys have their compositions given in full detail, some of the very small alloy additions not being listed.
7.3 Heat treatment
Annealing
Annealing for nickel, such as Nickel 200, involves temperatures in the range 815 to 925°C and times of about 10 minutes for each centimetre thickness of material. Thin sheet would be about 3 to 5 minutes. Monel nickel-copper alloys are annealed at about 870 to 980°C for similar times. The solid solution nickel-chromium-iron alloys require temperatures in the range 950 to 1175°C with times ranging from about 5 to 20 minutes per centimetre thickness. The precipitation hardening nickel-chromium-iron alloys require about 1010 to 1135°C for 10 to 90 minutes per centimetre.
Solution treatment and precipitation
For those nickel-chromium-iron alloys which can be precipitation hardened, see Table 7.2; solution treatment generally consists of about 1060 to 1150°C for times which depend on the alloy concerned, usually 1/2 to 4 hours but with some requiring 8 hours or even longer. The cooling procedure depends on the alloy concerned, air cooling being used for many though with some requiring a rapid quench. The precipitation treatment generally involves temperatures of the order of 620 to 845 °C for times ranging from 2 to 24 hours. Air cooling then generally follows.
Stress relief Stress relieving treatments are only recommended for nickel, Monel and a very small number of other nickel alloys. For nickel, e.g. Nickel 200, the treatment is a temperature of 400 to 500°C, for Monel about 500 to 600°C. For all other alloys full annealing should generally be undertaken if a stress relieving treatment is required.
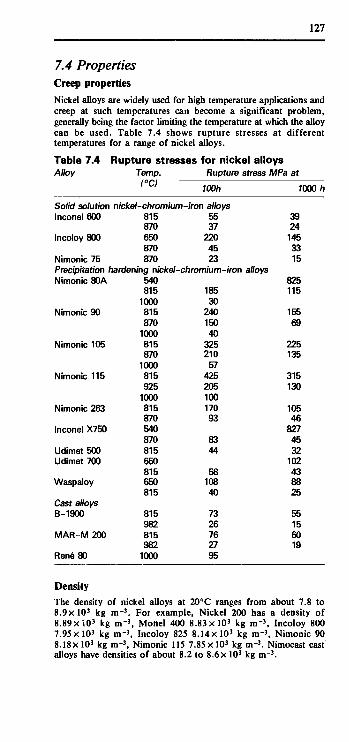
127
7.4 Properties Creep properties
Nickel alloys are widely used for high temperature applications and creep at such temperatures can become a significant problem, generally being the factor limiting the temperature at which the alloy can be used. Table 7.4 shows rupture stresses at different temperatures for a range of nickel alloys.
Table 7.4 Rupture stresses for nickel alloys Alloy Temp. Rupture stress MPa at
l°C) WOh 1000 h
Solid solution nickel-chromium-iron alloys Inconel 600
Incoloy 800
Nimonic 75
815 870 650 870 870
55 37
220 45 23
Precipitation hardening nickel-chromium-iron alloys Nimonic 80A
Nimonic 90
Nimonic 105
Nimonic 115
Nimonic 263
Inconel X750
Udimet 500 Udimet 700
Waspaloy
Cast alloys B-1900
MAR-M 200
Reno 80
540 815
1000 815 870
1000 815 870
1000 815 925
1000 815 870 540 870 815 650 815 650 815
815 982 815 982
1000
185 30
240 150 40
325 210 57
425 205 100 170 93
83 44
58 108 40
73 26 76 27 95
39 24 145 33 15
825 115
155 69
225 135
315 130
105 46
827 45 32
102 43 88 25
55 15 60 19
Density
The density of nickel alloys at 20°C ranges from about 7.8 to 8 .9xlO 3 kg m~3. For example, Nickel 200 has a density of 8.89X10³ kg m-3 , Monel 400 8.83x 10³ kg m~3, Incoloy 800 7.95xlO3 kg m~3, Incoloy 825 8 .14x l0 3 kg m~3, Nimonic 90 8.18x 10³ kg m-3, Nimonic 115 7.85 x 10³ kg m"3. Nimocast cast alloys have densities of about 8.2 to 8.6 x 10³ kg m - 3 .

128
Electrical resistivity
The electrical resistivity of nickel, e.g. nickel 200, is about 8 to 19 /iil m at 20° C. Nickel-copper alloys have resistivities of about 50 μθ m and nickel-chromium-iron alloys mainly of the order of 110 to 130 μίΐ m.
Fatigue properties
The fatigue limit for nickel alloys tends to be about 0.4 times the tensile strength at the temperature concerned. Thus, for example, Udimet 700 has a tensile strength of about 910 MPa at 800°C and a fatigue limit of 340 MPa.
Mechanical properties of cast alloys
Table 7.5 gives the mechanical properties of cast nickel alloys at elevated temperatures.
Table 7.5 Mechanical properties of cast nickel alloys Name Temp. Tensile Yield Elong-
(°C) strength stress ation (MPa) (MPa) (%)
Nimocast 80
Nimocast 90
Nimocast 713
Nimocast PD21
Nimocast PK24
B-1900 MAR-M 246 Reno 80
700 1000 700 900 760 980 700
1000 700
1000 870 870 870
970 75
540 154 940 470 810 560 965 500 790 860 620
680 40
400 77
745 305 780 390 825 380 700 690 550
12 82 18 40 6
20 2 4 6 5 4 5
11
Note: The values given under yield stress are the 0.2% proof stress Mechanical properties of wrought alloys
Table 7.6 gives the mechanical properties of wrought nickel alloys at room and elevated temperatures.
Table 7.6 Mechanical properties of wrought nickel alloys Name Cond- Temp. Tensile Yield Elong-
ition (°C) strength stress ation (MPa) (MPa) (%)
Nickel Nickel 200 CWA
CW Nickel 201 CWA Monel nickel-copper alloys Monel 400 CWA Monel K-500 CWSP
20 20 20
20 20
Solid solution nickel-chromium-iron Inconel 600 CWA,HWA
CW 20 20
700
380 535 350
480 900
alloys 550 830 365
105 380 80
195 620
240 620 175
35 12 35
35 20
30 7
50

129
Incoloy 800
Incoloy 800H
Incoloy 825 Incoloy DS
Nimonic 75
Hastelloy X
CWA,HWA HW
CWS,HWS
CWA,HWA
1000 20 20
700 20
700 20
700 1000
20 700
1000 20
650 870
75 520 450 300 450 300 590 335 65
750 420 80
960 710 255
Precipitation hardening nickel-chromium-iron Nimonic 80A
Nimonic 90
Nimonic 105
Nimonic 115
Nimonic 263
Nimonic 901
Nimonic PE16
Astroloy
Inco HX
Inconel X750
Reno 41
Reno 95
Udimet 500
Udimet 700
Waspaloy
SP
SP
SP
SP
SP
SP
SP
SP
SP
SP
SP
SP
SP
SP
SP
20 650 870 20
650 870 20
650 870 20
650 870 700
1000 700
1000 700
1000 20
650 870 700
1000 20
650 870 20
650 870 20
650 20
650 870 20
650 870 20
650 870
1240 1000 400
1240 1030 430
1140 1080 605
1240 1120 825 750 100 910 90
560 75
1410 1310 770 550 150
1120 825 235
1420 1340 620
1620 1460 1310 1210 640
1410 1240 690
1280 1120 525
40 205 170 180 170 180 220 210 35
200 50
500 400 180
a//oys 620 550 260 805 685 260 815 800 365 860 815 550 460 75
810 75
400 60
1050 965 690 300 80
635 565 165
1060 1000 550
1310 1220 840 760 495 965 855 635 795 690 515
60 30 30 70 30 70 30 49 75 41 57 58 43 37 50
24 18 34 23 20 16 12 24 25 25 25 18 23 68 12
27
16 18 25 44 52 24 9
47 14 14 19 15 14 32 28 20 17 16 27 25 34 35
Note: CW = cold worked, CWA = cold worked and annealed, CWS = cold worked and solution treated, HW = hot worked, HWA = hot worked and annealed, HWS = hot worked and solution
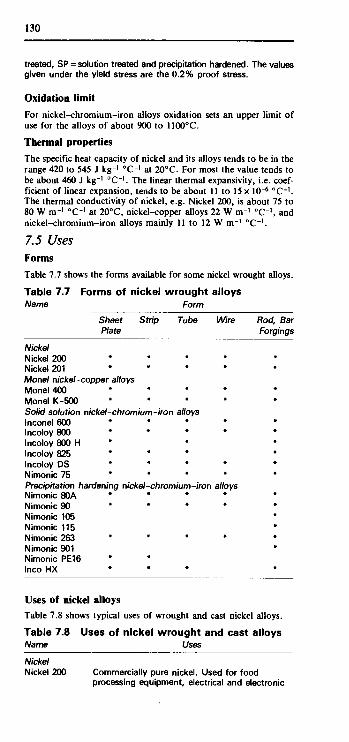
130
treated, SP = solution treated and precipitation hardened. The values given under the yield stress are the 0.2% proof stress.
Oxidation limit
For nickel-chromium-iron alloys oxidation sets an upper limit of use for the alloys of about 900 to 1100°C.
Thermal properties
The specific heat capacity of nickel and its alloys tends to be in the range 420 to 545 J kg"1 °C~l at 20°C. For most the value tends to be about 460 J kg-1 °C- 1. The linear thermal expansivity, i.e. coef-ficient of linear expansion, tends to be about 11 to 15 x 10-6 °C- 1 . The thermal conductivity of nickel, e.g. Nickel 200, is about 75 to 80 W m-1 °C~l at 20°C, nickel-copper alloys 22 W nH 0C-· , and nickel-chromium-iron alloys mainly 11 to 12 W m-1 "C-1.
7.5 Uses Forms
Table 7.7 shows the forms available for some nickel wrought alloys.
Table 7.7 Forms of nickel wrought alloys Name Form
Sheet Strip Tube Wire Rod, Bar Plate Forgings
Nickel Nickel 200 * Nickel 201 * Monel nickel-copper alloys Monel400 * Monel K-500 * Solid solution nickel-chromium-iron alloys Inconel 600 * * * * * Incoloy 800 * * * * * Incoloy 800 H Incoloy 825 * Incoloy DS Nimonic 75 * * * * * Precipitation hardening nickel-chromium-iron alloys Nimonic 80A * * * Nimonic 90 * Nimonic 105 * Nimonic 115 * Nimonic 263 * Nimonic 901 * Nimonic PE16 * * Inco HX
Uses of nickel alloys
Table 7.8 shows typical uses of wrought and cast nickel alloys.
Table 7.8 Uses of nickel wrought and cast alloys Name Uses
Nickel Nickel 200 Commercially pure nickel. Used for food
processing equipment, electrical and electronic
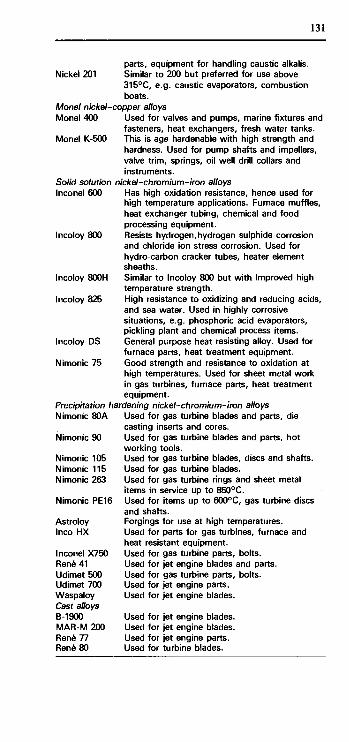
131
parts, equipment for handling caustic alkalis. Nickel 201 Similar to 200 but preferred for use above
315°C, e.g. caustic evaporators, combustion boats.
Monel nickel-copper alloys Monel 400 Used for valves and pumps, marine fixtures and
fasteners, heat exchangers, fresh water tanks. Monel K-500 This is age hardenable with high strength and
hardness. Used for pump shafts and impellers, valve trim, springs, oil well drill collars and instruments.
Solid solution nickel-chromium-iron alloys Inconel 600 Has high oxidation resistance, hence used for
high temperature applications. Furnace muffles, heat exchanger tubing, chemical and food processing equipment.
Incoloy 800 Resists hydrogen,hydrogen sulphide corrosion and chloride ion stress corrosion. Used for hydro-carbon cracker tubes, heater element sheaths.
Incoloy 800H Similar to Incoloy 800 but with improved high temperature strength.
Incoloy 825 High resistance to oxidizing and reducing acids, and sea water. Used in highly corrosive situations, e.g. phosphoric acid evaporators, pickling plant and chemical process items.
Incoloy DS General purpose heat resisting alloy. Used for furnace parts, heat treatment equipment.
Nimonic 75 Good strength and resistance to oxidation at high temperatures. Used for sheet metal work in gas turbines, furnace parts, heat treatment equipment.
Precipitation hardening nickel-chromium-iron alloys Nimonic 80A Used for gas turbine blades and parts, die
casting inserts and cores. Nimonic 90 Used for gas turbine blades and parts, hot
working tools. Nimonic 105 Used for gas turbine blades, discs and shafts. Nimonic 115 Used for gas turbine blades. Nimonic 263 Used for gas turbine rings and sheet metal
items in service up to 850°C. Nimonic PE16 Used for items up to 600°C, gas turbine discs
and shafts. Astroloy Forgings for use at high temperatures. Inco HX Used for parts for gas turbines, furnace and
heat resistant equipment. Used for gas turbine parts, bolts. Used for jet engine blades and parts. Used for gas turbine parts, bolts. Used for jet engine parts. Used for jet engine blades.
Inconel X750 Reno 41 Udimet 500 Udimet 700 Waspaloy Cast alloys B-1900 MAR-M 200 Rene 77 Rene 80
Used for jet engine blades. Used for jet engine blades. Used for jet engine parts. Used for turbine blades.

8 Titanium 8.1 Materials Titanium
Titanium has a relatively low density, 4.5 x 10³ kg m~3, just over half that of steel. It has a relatively low strength when pure, but alloying considerably increases it. It has excellent corrosion resistance, but is an expensive metal.
Titanium can exist in two crystal forms, alpha which is a hexagonal close-packed structure and beta which is body centred cubic. In pure titanium the alpha structure is the stable phase up to 883 °C and transforms into the beta structure above this temperature. Commer-cially pure titanium ranges in purity from 99.5 to 99.0%, the main impurities being iron, carbon, oxygen, nitrogen and hydrogen. The properties of the commercially pure titanium are largely determined by the oxygen content.
See Codes for composition, Composition, Annealing, Solution and precipitation treatment, Stress relief, Creep properties, Density, Electrical resistivity, Fatigue properties, Fracture toughness, Hardness, Impact properties, Machinability, Mechanical properties, Thermal properties, Weldability, Forms, Uses.
Titanium alloys
Titanium alloys can be grouped according to the phases present in their structure. The addition of elements such as aluminium, tin, oxygen or nitrogen results in the enlargement of the alpha phase region on the equilibrium diagram, such elements being referred to as alpha-stabilizing. Other elements such as vanadium, molybdenum, silicon and copper enlarge the beta phase region and are known as beta-stabilizing. There are other elements that are sometimes added to titanium and which are neither alpha or beta stabilizers. Zirconium is such an element, being used to contribute solid solution strengthening.
Titanium alloys are grouped into four categories, each category having distinctive properties: 1 Alpha titanium alloys These are composed entirely of alpha phase, significant amounts of alpha-stabilizing elements being added to the titanium. Such alloys are strong and maintain their strength at high temperatures. They have good weldability but are difficult to work and non-heat treatable. 2 Near-alpha titanium alloys These are composed of almost all alpha phase with just a small amount of beta phase dispersed throughout the alpha. This is achieved by adding small amounts, about 1 to 2%, of beta stabilizing elements. Such alloys have improved creep resistance at temperatures of the order of 450-500°C. 3 Alpha-beta titanium alloys These contain sufficient quantities of beta-stabilizing elements for there to be appreciable amounts of beta phase at room temperature. These alloys can be solution treated, quenched and aged for increased strength. 4 Beta titanium alloys When sufficiently large amounts of beta-stabilizing elements are added to titanium the resulting structure can be made entirely beta at room temperature after quenching, or in some cases air cooling. Unlike alpha alloys, beta alloys are readily cold worked in the solu

133
tion treated and quenched condition and can be subsequently aged to give very high strengths. In the high strength condition the alloys have low ductility. They also suffer from poor fatigue performance.
See Codes for composition, Composition, Annealing, Solution and precipitation treatment, Stress relief, Creep properties, Density, Electrical resistivity, Fatigue properties, Fracture toughness, Hardness, Impact properties, Machinability, Mechanical properties, Thermal properties, Weldability, Forms, Uses.
8.2 Codes and composition Codes for composition Titanium alloys are referred to by their structure, i.e. alpha, near-alpha, alpha-beta and beta. Specific alloys within such groups are often just referred to in terms of their nominal composition, e.g. Ti-5Al-2.5Sn for a 5 % aluminium-2.5% tin titanium alloy. One general system that is used in Great Britain is the specification of titanium alloys by the company, IMI Ltd. Table 8.1 shows the system. In America there are the ASTM and AMS specifications. In addition, because of the considerable use made of titanium alloys in military applications, there are military systems of specification.
Table 8.1 IMI codes for titanium alloys Alloy type Nominal composition IMI code
Alpha commercially pure
Ti-Pd Alpha + Ti-2.5Cu compound Near-alpha Ti-11Sn-5Zr-2.25AI-1Mo-0.2Si
Ti-6AI-5Zr-0.5Mo-0.25Si Ti-5.5AI-3.5Sn-3Zr-1Nb-0.25Mo-0.3Si
Alpha-beta Ti-6AI-4V Ti-4AI-4Mo-2Sn-0.5Si Ti-4AI-4Mo-4Sn-0.5Si
Beta Ti-11.5Mo-6Zr-4.5Sn
110, 115, 130, 155, 260, 262 230
679 685 829 318 550 551 beta III
125, 160
Composition The nominal composition of titanium alloys is used to specify alloys in tables of properties given in this chapter. See Mechanical properties for details of the compositions of commonly used titanium alloys.
8.3 Heat treatment Annealing
Table 8.2 shows typical annealing temperatures and times for titanium alloys. For some alloys, e.g. Ti-8Al-lMo-lV, two forms of annealing treatment are possible, mill annealing and duplex annealing. Mill annealing, in the case of this alloy, consists of heating at 790°C for 8 hours and then furnace cooling. Duplex annealing involves reheating the mill annealed material at 790° C for a quarter of an hour and then air cooling.
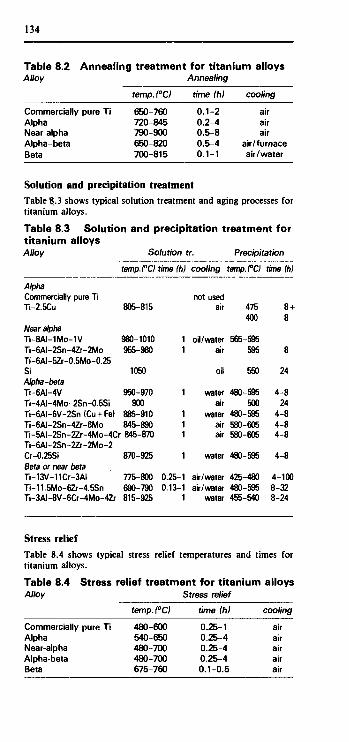
134
Table 8.2 Annealing treatment for titanium alloys Alloy Annealing
Commercially pure Ti Alpha Near alpha Alpha-beta Beta
temp.(°C)
650-760 720-845 790-900 650-820 700-815
time (h)
0.1-2 0.2-4 0.5-8 0.5-4 0.1-1
cooling
air air air
air/furnace air/water
Solution and precipitation treatment
Table 8.3 shows typical solution treatment and aging processes for titanium alloys. Table 8.3 Solution and precipitation treatment for titanium alloys Alloy Solution tr. Precipitation
Alpha Commercially pure Ti Ti-2.5Cu
Near alpha Ti-8AI-1Mo-1V Ti-6AI-2Sn-4Zr-2Mo Ti-6AI-5Zr-0.5Mo-0.25 Si Alpha-beta Ti-6AI-4V Ti-4AI-4Mo-2Sn-0.5Si Ti-6AI-6V-2Sn(Cu + Fe) Ti-6AI-2Sn-4Zr-6Mo
temp.(°C) time (h) cooling i
805-815
980-1010 955-980
1050
950-970 900
885-910 845-890
Ti-5AI-2Sn-2Zr-4Mo-4Cr 845-870 Ti-6AI-2Sn-2Zr-2Mo-2 Cr-0.25Si Beta or near beta Ti-13V-11Cr-3AI Ti-11.5Mo-6Zr-4.5Sn Ti-3AI-8V-6Cr-4Mo-4Zr
Stress relief
870-925
775-800 0.25 690-790 0.13 815-925
1 1
1
1 1 1
1
-1 -1 1
not used air
oil/water air
oil
water air
water air air
water
air/water air/water
water
\emp.f°C) time(h)
475 400
565-595 595
550
480-595 500
480-595 580-605 580-605
480-595
425-480 480-595 455-540
8 + 8
8
24
4-8 24
4-8 4-8 4-8
4-8
4-100 8-32 8-24
Table 8.4 shows typical stress relief temperatures and times for t i tanium alloys.
Table 8.4 Stress relief treatment for titanium alloys Alloy
Commercially pure Ti Alpha Near-alpha Alpha-beta Beta
temp.(°C)
480-600 540-650 480-700 480-700 675-760
Stress relief
time (h) <
0.25-1 0.25-4 0.25-4 0.25-4 0.1-0.5
pooling
air air air air air

135
8.4 Properties Creep properties
The upper service temperature limit of near alpha, alpha-beta and beta titanium alloys is set by creep. The limit for commercially pure titanium and alpha alloys is set by the reduction in tensile strength. In general, the upper limit for commercially pure titanium is about 200°C, for other alpha alloys about 250 to 350°C, for near alpha about 500°C, for alpha-beta about 350 to 400°C. and for beta about 300°C. See the table with Mechanical properties for details of tensile strength at elevated temperatures.
Table 8.5 shows creep rupture data for commercially pure titanium at room and elevated temperatures. Table 8.5 Creep rupture stresses for commercially pure titanium Titanium Temp. Rupture stress MPa
99.5Ti
99.2Ti
99.1Ti
99.0Ti
rut
20 150 300 20 150 300 20 150 300 20 150 300
100 h
286 190 139 397 253 215 455 275 216 533 321 241
1000 h
269 182 134 372 250 208 423 264 215 497 296 238
10 000 h
255 168 128 352 244 204 392 250 205 469 281 218
100 000 h
241 161 122 332 239 199 357 239 199 438 269 212
Density
The density of commercially pure titanium is 4.51 x 10³ kg m-3 at 20°C. Alpha alloys have densities about 4.48 x 10³ kg m-3, near alpha 4.4 to 4.8 x 10³ kg m~3, alpha-beta 4.4 to 4.8 x 10³ kg m~3, and beta 4.8 x 10³ kg m-3. Electrical resistivity
The electrical resistivity of commercially pure titanium at 20°C is 0.49 /tß m, with alloys about 1.6 to 1.7 μΩ m. Fatigue properties
The fatigue limit at 107 cycles for titanium is 0.50 times the tensile strength and for the alloys about 0.40 to 0.65 times the tensile strength. Fracture toughness
Table 8.6 shows typical values of fracture toughness, Kic, for a range of titanium alloys. Table 8.6 Fracture toughness of titanium alloys Alloy Condition K,c MPa m~%
Alpha Commercially pure Ti Annealed >70 Ti-2.5Cu Annealed >70
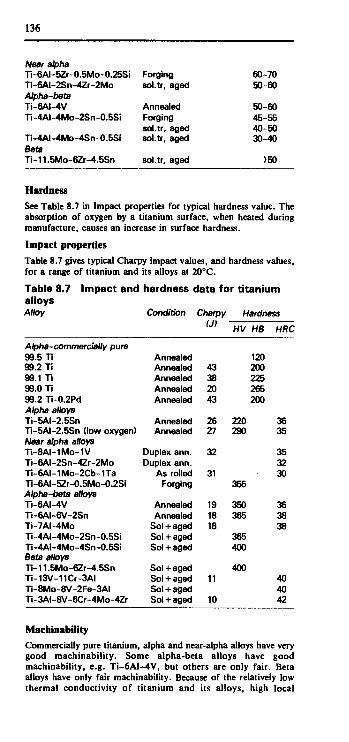
136
Near alpha Ti-6AI-5Zr-0.5Mo-0.25Si Ti-6AI-2Sn-4Zr-2Mo Alpha-beta Ti-6AI-4V Ti-4AI-4Mo-2Sn-0.5Si
Ti-4AI-4Mo-4Sn-0.5Si Beta Ti-11.5Mo-6Zr-4.5Sn
Forging sol.tr, aged
Annealed Forging sol.tr, aged sol.tr, aged
sol.tr, aged
60-70 50-60
50-60 45-55 40-50 30-40
>50
Hardness
See Table 8.7 in Impact properties for typical hardness value. The absorption of oxygen by a titanium surface, when heated during manufacture, causes an increase in surface hardness. Impact properties
Table 8.7 gives typical Charpy impact values, and hardness values, for a range of titanium and its alloys at 20° C. Table 8.7 Impact and hardness data for titanium alloys Alloy Condition Charpy Hardness
Alpha-commercially pure 99.5 Ti 99.2 Ti 99.1 Ti 99.0 Ti 99.2 Ti-0.2Pd Alpha alloys Ti-5AI-2.5Sn Ti-5AI-2.5Sn (low oxygen) Near alpha alloys Ti-8AI-1Mo-1V Ti-6AI-2Sn-4Zr-2Mo Ti-6AI-1Mo-2Cb-1Ta Ti-6AI-5Zr-0.5Mo-0.2Si Alpha-beta alloys Ti-6AI-4V Ti-6AI-6V-2Sn Ti-7AI-4Mo Ti-4AI-4Mo-2Sn-0.5Si Ti-4AI-4Mo-4Sn-0.5Si Beta alloys Ti-11.5Mo-6Zr-4.5Sn Ti-13V-11Cr-3AI TI-8Mo-8V-2Fe-3AI Ti-3AI-8V-6Cr-4Mo-4Zr
Annealed Annealed Annealed Annealed Annealed
Annealed Annealed
Duplex ann. Duplex ann.
As rolled Forging
Annealed Annealed
Sol + aged Sol + aged Sol + aged
Sol + aged Sol + aged Sol + aged Sol + aged
U)
43 38 20 43
26 27
32
31
19 18 18
11
10
HV HB
220 290
355
350 365
365 400
400
120 200 225 265 200
HRC
36 35
35 32 30
36 38 38
40 40 42
Machinability
Commercially pure titanium, alpha and near-alpha alloys have very good machinability. Some alpha-beta alloys have good machinability, e.g. Ti-6A1~4V, but others are only fair. Beta alloys have only fair machinability. Because of the relatively low thermal conductivity of titanium and its alloys, high local
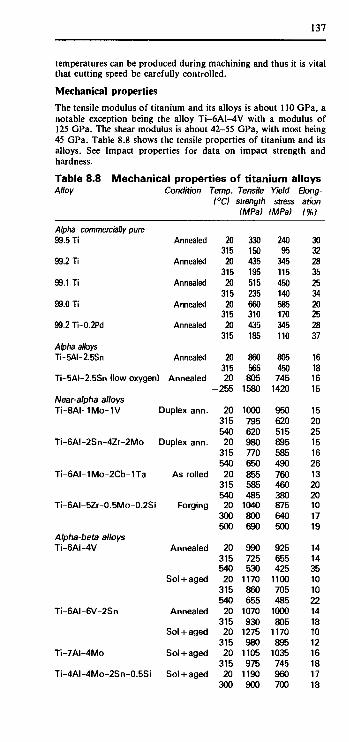
137
temperatures can be produced during machining and thus it is vital that cutting speed be carefully controlled.
Mechanical properties
The tensile modulus of titanium and its alloys is about 110 GPa, a notable exception being the alloy Ti-6A1-4V with a modulus of 125 GPa. The shear modulus is about 42-55 GPa, with most being 45 GPa. Table 8.8 shows the tensile properties of titanium and its alloys. See Impact properties for data on impact strength and hardness.
Table 8.8 Mechanical properties of titanium alloys Alloy Condition Temp. Tensile Yield Elong-
(°C) strength stress ation (MPa) (MPa) (%)
Alpha-commercially 99.5 Ti
99.2 Ti
99.1 Ti
99.0 Ti
99.2 Ti-0.2Pd
Alpha alloys Ti-5AI-2.5Sn
pure Annealed
Annealed
Annealed
Annealed
Annealed
Annealed
Ti-5AI-2.5Sn (low oxygen) Annealed
Near-alpha alloys Ti-8AI-1Mo-1V
Ti-6AI-2Sn-4Zr-2Mo
Ti-6AI-1Mo-2Cb--1Ta
Ti-6AI-5Zr-0.5Mo-0.2Si
Alpha-beta alloys Ti-6AI-4V
Ti-6AI-6V-2Sn
Ti-7AI-4Mo
Ti-4AI-4Mo-2Sn--0.5Si
Duplex ann.
Duplex ann.
As rolled
Forging
Annealed
Sol + aged
Annealed
Sol + aged
Sol + aged
Sol + aged
20 315 20
315 20
315 20
315 20
315
20 315 20
-255
20 315 540 20
315 540 20
315 540 20
300 500
20 315 540 20
315 540 20
315 20
315 20
315 20
300
330 150 435 195 515 235 660 310 435 185
860 565 805
1580
1000 795 620 980 770 650 855 585 485
1040 800 690
990 725 530
1170 860 655
1070 930
1275 980
1105 975
1190 900
240 95
345 115 450 140 585 170 345 110
805 450 745
1420
950 620 515 895 585 490 760 460 380 875 640 500
925 655 425
1100 705 485
1000 805
1170 895
1035 745 960 700
30 32 28 35 25 34 20 25 28 37
16 18 16 15
15 20 25 15 16 26 13 20 20 10 17 19
14 14 35 10 10 22 14 18 10 12 16 18 17 18

138
Ti-4AI-4Mo-4Sn-0.5Si
Beta alloys Ti-11.5Mo-6Zr-4.5Sn
Ti-13V-11Cr-3AI
Ti-8Mo-8V-2Fe-3AI
Ti-3AI-8V-6Cr-4Mo-4Zr
Sol + aged
Sol + aged
Sol + aged
Sol + aged
Sol + aged
500 20
300 500
20 315 20
315 20
315 20
315
790 1330 1030 900
1385 905
1220 885
1310 1130 1450 1035
600 1095 805 690
1315 850
1170 795
1240 980
1380 895
21 11 14 17
11 16 8
19 8
15 7
20
Note: The yield strength values quoted above are for the 0.2% proof stress.
Thermal properties
The linear thermal expansivity, i.e. the linear coefficient of expan-sion, is about 8 to 9x 10-* °C_1 for titanium and its alloys. The specific heat capacity at 20°C is about 530 J kg-1 °C-1 for commer-cially pure titanium, and varies from about 400 to 650 J kg-,0C_1
for titanium alloys. The thermal conductivity is about 16 W m_l
°C_I for commercially pure titanium, and varies from about 5 to 12 W m-' °C-' for alloys.
Weldability
Commercially pure titanium and other alpha and near-alpha alloys generally have very good weldability. Some alpha-beta alloys are weldable, but beta are generally not. Among alpha-beta alloys, Ti-6A1-4V has good weldability. There is a need to guard against contamination, particularly from oxygen and nitrogen, at the high temperatures involved in the welding process. For this reason TIG welding is the most widely used process. Electron-beam, laser, plasma arc and friction welding processes can also be used. Resistance spot and seam welding is only used in situations where fatigue life is not important.
8.5 Uses Forms
Table 8.9 shows the main forms available for titanium and its alloys. Table 8.9 Forms of titanium alloys Alloy Forms
Bar Forging Sheet Strip Plate Wire Tube
Alpha-commercially pure 99.5 Ti 99.2 Ti 99.1 Ti 99.0 Ti 99.2 Ti-0.2Pd

Alpha alloys Ti-5AI-2.5Sn Ti-5AI-2.5S (low oxygen) Near alpha alloys Ti-8AI-1Mo-1V Ti-6AI-2Sn-4Zr-2Mo Ti-6AI-1Mo-2Cb-1Ta Ti-6AI-5Zr-0.5Mo-0.2Si Alpha-beta alloys Ti-6AI-4V Ti-6AI-6V-2Sn Ti-7AI-4Mo Ti-4AI-4Mo-2Sn-0.5Si Ti-4AI-4Mo-4Sn-0.5Si Beta alloys Ti-11.5Mo-6Zr-4.5Sn Ti-13V-11Cr-3AI Ti-8Mo-8V-2Fe-3AI Ti-3AI-8V-6Cr-4Mo-4Zr
Note: the term wire covers both wire and fastener stock.
Uses Table 8.10 indicates typical uses of titanium and its alloys.
Table 8.10 Uses of titanium alloys Alloy Uses
Alpha-commercially pure 99.5 Ti Used where high ductility, good
weldability and high corrosion resistance required, e.g. marine parts, airframes, chemical plant parts. Very good formability, machinability and forging properties.
99.2 Ti As above. 99.1 Ti As above. 99.0 Ti As above., also used for gas
compressors, high speed fans, aircraft engine parts. Highest strength commercially pure titanium.
99.2 Ti-0.2Pd Has an improved resistance to corrosion in reducing media.
Alpha alloys Ti-5AI-2.5Sn Combines the very good formability,
machinability, weldability and forging properties of commercially pure titanium with improved strength at temperatures up to 350°C. Used for aircraft engine compressor blades and ducting, steam turbine blades.
Ti-5AI-2.5Sn (low A special grade for use at very low oxygen) temperatures, down to-255°C. Near-alpha alloys Ti-8AI-1Mo-1V High strength, good creep resistance
and toughness up to 450°C. Used for airframe and jet engine parts.
Ti-6AI-2Sn-4Zr-2Mo A creep resistant alloy for use up to 475°C. Used for airframe skin
139

140
components, parts and cases for jet engine compressors.
Ti-6AI-1Mo-2Cb-1Ta High toughness, good resistance to sea water and hot-salt stress corrosion, good weldability with moderate strength.
Ti-6AI-5Zr-0.5Mo-0.2Si Creep resistant alloy for use up to 550°C with good weldability.
Alpha-beta alloys Ti-6AI-4V Most widely used titanium alloy. Can
be heat treated to different strength levels and has good weldability and machinability. Requires hot forming. Used for blades and discs for aircraft turbines and compressors, rocket motor cases, marine components, steam turbine blades, structural forgings and fasteners.
Ti-6AI-6V-2Sn Used for structural aircraft parts and landing gear, rocket motor cases.
Ti-7AI-4Mo Used for airframes and jet engine parts, missile forgings. Good properties up to 425°C.
Ti-4AI-4Mo-2Sn-0.5Si A readily forged alloy with good creep resistance up to 400°C.
Ti-4AI-4Mo-4Sn-0.5Si A forging alloy with very high strength at room temperature.
Beta alloys Ti-11.5Mo-6Zr-4.5Sn Can be cold formed. Used for high
strength fasteners and aircraft sheet parts. Heat treatable.
Ti-13V-11Cr-3AI Used for high strength fasteners, honeycomb panels, aerospace components. Heat treatable.
Ti-8Mo-8V-2Fe-3AI Used for high strength fasteners, forged components and tough airframe sheets.
Ti-3AI-8V-6Cr-4Mo-4Zr Used for high strength fasteners, aerospace components, torsion bars.

9 Polymeric materials 9Λ Materials Types of polymer
Polymers can be grouped into three general categories: 1 Thermoplastics These materials can be softened and resoftened indefinitely by the application of heat, provided the temperature is not so high as to cause decomposition. The term thermoplastic implies that the material becomes plastic when heated. Such polymers have linear or branched molecular chain structures with few links, if any, between chains. Linear, and some branched, polymer chains can become aligned so that a degree of crystallinity occurs. 2 Thermosets These materials are rigid and not softened by the application of heat. Such polymers have molecular structures which are extensively cross-linked. Because of this, when heat causes bonds to break, the effect is not reversible on cooling. 3 Elastomers Elastomers are polymers which, as a result of their molecular struc-ture, allow considerable extensions which are reversible. Such materials are lightly cross-linked polymers. Between cross-links the molecular chains are fairly free to move. When stretched, the polymer chains tend to straighten and become aligned so that a degree of crystallinity occurs.
Elastomers
Elastomers can be grouped according to the form of their polymer chains.
1 Only carbon in the backbone of the polymer chain. This includes natural rubber, butadiene-styrene, butadiene acrylonitrile, butyl rubbers, polychloroprene and ethylene-propylene.
2 Polymer chains with oxygen in the backbone. Polypropylene oxide is an example.
3 Polymer chains with silicon in the backbone. Fluorosilicone is an example.
4 Polymer chains having sulphur in the backbone. Polysulphide is an example.
5 Thermoplastic elastomers. These are block copolymers with alter-nating hard and soft blocks. Examples are polyurethanes, ethylene vinyl acetate and styrene-butadiene-styrene. Such elastomers can be processed by thermoplastic moulding methods, such as injection and blow moulding. They, like thermoplastics, can be repeatedly softened by heating, unlike conventional elastomers.
See Additives, Crystallinity, Structure of polymers, Structure and properties, Codes, Composition, Chemical properties, Density, Glass transition temperature, Hardness, Mechanical properties, Permeability, Thermal properties, Uses.
Thermosets
The main thermosets are:
1 Phenolics 2 Amino resins (urea and melamine formaldehydes) 3 Epoxies 4 Unsaturated polyesters 5 Cross-linked polyurethanes

142
See Additives, Crystallinity, Structure of polymers, Structure and properties, Codes, Composition, Density, Electrical properties, Hardness, Mechanical properties, Thermal properties, Processing methods, Uses.
Thermoplastics
Thermoplastics can be considered as being two groups of material: ethnic and non-ethnic polymers. 1 The ethnic family of materials is based on ethylene. It can be
subdivided into a number of other groups: polyolefins based on polyethylene and polypropylene; vinyls based on vinyl chloride, vinyl acetate and various other vinyl compounds. The backbone of all ethnic polymers is made up of just carbon atoms.
2 The non-ethnic family of materials has molecular backbones which include non-carbon atoms. Such polymers include polyamides, polyacetals, polycarbonates and cellulosics.
See Additives, Crystallinity, Structure of polymers, Structure and properties, Codes, Composition, Chemical properties, Creep properties, Density, Electrical properties, Fracture toughness, Glass transition temperature, Hardness, Impact properties, Mechanical properties, Optical properties, Permeability, Thermal properties, Processing methods, Uses.
9.2 Polymer structures Additives
Plastics and rubbers almost invariably contain not only a polymeric material, but also additives. They may also be compounded from more than one polymer. The following are some of the main types of additive:
1 Fillers to modify the mechanical properties, to reduce for instance brittleness and increase the tensile modulus, e.g. wood flour, cork dust, chalk. They also have the effect of reducing the overall cost of the material.
2 Reinforcement, e.g. glass fibres or spheres, to improve the tensile modulus and strength.
3 Plasticizers to enable molecular chains to slide more easily past each other, hence making the material more flexible.
4 Stabilizers to enable the material to resist degradation better. 5 Flame retardants to improve the fire resistance properties. 6 Lubricants and heat stabilizers to assist the processing of the
material. 7 Pigments ard dyes to give colour to the material.
Crystallinity
Crystallinity is most likely to occur with polymers having simple linear chain molecules. Branched polymer chains are not easy to pack together in a regular manner, the branches get in the way. If the branches are regularly spaced along the chain, then some crystallinity is possible; irregularly spaced branches make crystall-inity improbable. Heavily cross-linked polymers, i.e. thermosets, do not exhibit crystallinity but under stress some elastomers can. Table 9.1 shows the maximum possible crystallinity of some common polymers.
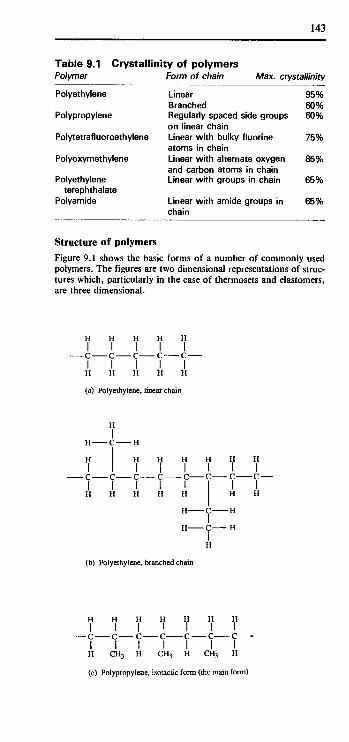
143
Table 9.1 Crystallinity of polymers Polymer
Polyethylene
Polypropylene
Polytetrafluoroethylene
Polyoxymethylene
Polyethylene terephthalate
Polyamide
Form of chain Max. crystallinity
Linear Branched Regularly spaced side groups on linear chain Linear with bulky fluorine atoms in chain Linear with alternate oxygen and carbon atoms in chain Linear with groups in chain
Linear with amide groups in chain
95% 60% 60%
75%
85%
65%
65%
Structure of polymers
Figure 9.1 shows the basic forms of a number of commonly used polymers. The figures are two dimensional representations of struc-tures which, particularly in the case of thermosets and elastomers, are three dimensional.
(c) Polypropylene, isotactic form (the main form)
(a) Polyethylene, linear chain
(b) Polyethylene, branched chain

144
(d) Polyvinylchloride
(f) Polytetrafluoroethylene
(CHjfc
(i) Nylon 6.6
(j) Polyoxymethylene (acetal homopolymer)
(c) Polystyrene
(g) Nylon 6
(h) Nylon II
(CH2)I0
(CH2)5
(CH2)4

145
(k) Polysulphide
(1) Polyethylene terephthalate
(n) Melamine formaldehyde
(o) Cis-polyisoprene, the natural rubber chain before vulcanization
(m) Polycarbonate

146
CH3
\ C =
\ / c—c
A/\ H H H H
H H H
A/ C C
\
/ CH3
H CH3 H CH3
/ \ / \
\ / c—c ΛΛ H H H H
c i.
H H H H
\ / \ /
ΛΛ
i i.
\ / c—c
AA H H H H
H H H H
\ / \ /
/ \ =c c—c c =
\ / \ / H CH3 H CH3
(p) Vulcanized rubber, sulphur linked polyisoprene chains
Figure 9.1 The basic forms of commonly used polymers
Structure and properties
The following are methods by which the properties of polymei materials can be changed.
1 Increasing the length of the molecular chain for a linear polymer. This increases the tensile strength and stiffness, sin longer chains more readily become tangled and so cannot so easily be moved.
2 Introducing large side groups into a linear chain. This increases the tensile strength and stiffness, since the side groups inhibit chain motion.
3 Producing branches on a linear chain. This increases the tensile strength and stiffness since the branches inhibit chain motion.
4 Introducing large groups into the chain. These reduce the ability of the chain to flex and so increase the rigidity.
5 Cross-linking chains. The greater the degree of cross-linking the more chain motion is inhibited and so the more rigid the material.
6 Introducing liquids between chains. The addition of liquids, termed plasticizers, which fill some of the space between polymer chains makes it easier for the chains to move and s< increases flexibility.
7 Making some of the material crystalline. With linear chains degree of crystallinity is possible. This degree can be controlled. The greater the degree of crystallinity the more dense the material, and the higher its tensile strength and stiffness.
8 Including fillers. The properties of polymeric materials can b affected by the introduction of fillers. Thus, for example, th tensile modulus and strength can be increased by incor-porating glass fibres. Graphite as a filler can reduce friction.
9 Orientation. Stretching or applying shear stresses during processing can result in polymeric materials becoming aligne in a particular direction. The properties in that direction are then markedly different to those in the transverse direction.
10 Copolymerization. Combining two or more monomers in a single polymer chain will change the properties, the property
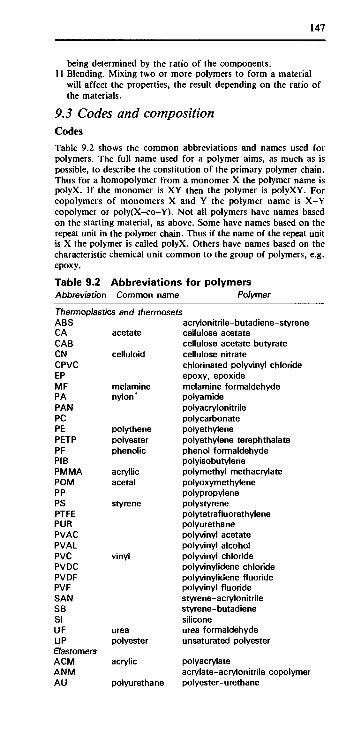
147
being determined by the ratio of the components. 11 Blending. Mixing two or more polymers to form a material
will affect the properties, the result depending on the ratio of the materials.
93 Codes and composition Codes Table 9.2 shows the common abbreviations and names used for polymers. The full name used for a polymer aims, as much as is possible, to describe the constitution of the primary polymer chain. Thus for a homopolymer from a monomer X the polymer name is polyX. If the monomer is XY then the polymer is polyXY. For copolymers of monomers X and Y the polymer name is X-Y copolymer or poly(X-co-Y). Not all polymers have names based on the starting material, as above. Some have names based on the repeat unit in the polymer chain. Thus if the name of the repeat unit is X the polymer is called polyX. Others have names based on the characteristic chemical unit common to the group of polymers, e.g. epoxy.
Table 9.2 Abbreviations for polymers Abbreviation Common name Polymer
Thermoplastics and thermosets ABS CA CAB CN CPVC EP MF PA PAN PC PE PETP PF PIB PMMA POM PP PS PTFE PUR PVAC PVAL PVC PVDC PVDF PVF SAN SB SI UF UP Elastomers ACM ANM AU
acetate
celluloid
melamine nylon*
polythene polyester phenolic
acryllic acetal
styrene
vinyl
urea polyester
acrylic
Polyurethane
acrylonitrile-butadiene-styrene cellulose acetate cellulose acetate butyrate cellulose nitrate chlorinated polyvinyl chloride epoxy, epoxide melamine formaldehyde polyamide polyacrylonitrile polycarbonate polyethylene polyethylene terephthalate phenol formaldehyde polyisobutylene polymethyl methacrylate polyoxymethylene polypropylene polystyrene polytetrafluorethylene Polyurethane polyvinyl acetate polyvinyl alcohol polyvinyl chloride polyvinylidene chloride polyvinylidene fluoride polyvinyl fluoride styrene-acrylonitrile styrene-butadiene silicone urea formaldehyde unsatu rated polyester
polyacrylate acrylate-acrylonitrile copolymer polyester-urethane
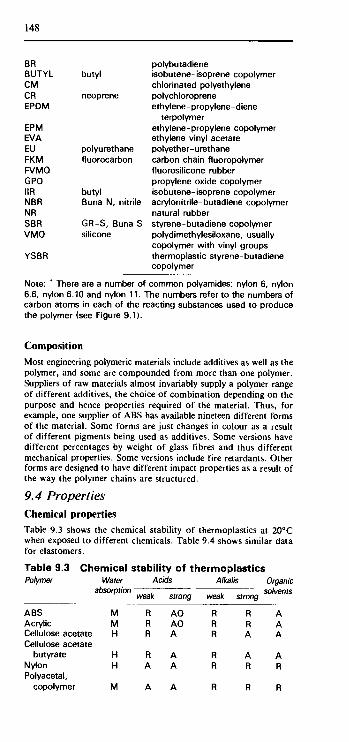
148
BR BUTYL CM CR EPDM
EPM EVA EU FKM FVMQ GPO MR NBR NR SBR VMQ
YSBR
butyl
neoprene
Polyurethane fluorocarbon
butyl Buna N, nitrile
GR-S, Buna S silicone
polybutadiene isobutene-isoprene copolymer chlorinated polyethylene polychloroprene ethylene-propylene-diene
terpolymer ethylene-propylene copolymer ethylene vinyl acetate polyether-urethane carbon chain fluoropolymer fluorosilicone rubber propylene oxide copolymer isobutene-isoprene copolymer acrylonitrile-butadiene copolymer natural rubber styrene-butadiene copolymer polydimethylesiloxane, usually copolymer with vinyl groups thermoplastic styrene-butadiene copolymer
Note: * There are a number of common polyamides: nylon 6, nylon 6.6, nylon 6.10 and nylon 11. The numbers refer to the numbers of carbon atoms in each of the reacting substances used to produce the polymer (see Figure 9.1).
Composition
Most engineering polymeric materials include additives as well as the polymer, and some are compounded from more than one polymer. Suppliers of raw materials almost invariably supply a polymer range of different additives, the choice of combination depending on the purpose and hence properties required of the material. Thus, for example, one supplier of ABS has available nineteen different forms of the material. Some forms are just changes in colour as a result of different pigments being used as additives. Some versions have different percentages by weight of glass fibres and thus different mechanical properties. Some versions include fire retardants. Other forms are designed to have different impact properties as a result of the way the polymer chains are structured.
9.4 Properties Chemical properties
Table 9.3 shows the chemical stability of thermoplastics at 20°C when exposed to different chemicals. Table 9.4 shows similar data for elastomers.
Table 9.3 Chemical stability of thermoplastics Polymer
ABS Acrylic Cellulose acetate Cellulose acetate
butyrate Nylon Polyacetal,
copolymer
Water
absorption
M M H
H H
M
Acids
weak
R R R
R A
A
strong
AO AO A
A A
A
Alkalis Organic
weak
R R R
R R
R
solvents strong
R A R A A A
A A R R
R R

149
Polyacetal, homopolymer
Polycarbonate Polyester Polyethylene, high
density Polyethylene, low
density Polypropylene Polystyrene PTFE PVC, unplasticized
M L L
L
L L L L
M
R R R
R
R R R R R
A A A
AO
AO AO AO R R
R A R
R
R R R R R
A A A
R
R R R R R
R A A
R
R R A R A
Note: For water absorption L = low, less than 0.1% by weight in 24 hours immersion, M = medium, between 0.1 and 0.4%, H = high, more than 0.4% and often about 1%. R = resistant, A = attacked with AO being attack by oxidizing acids.
Table 9.4 Chemical stability of elastomers Polymer
Butadiene-acrylonitrile
Butadiene-styrene Butyl Chlorosulphonated
polyethylene Ethylene-propylene Fluorocarbon Natural rubber Polychloroprene
(neoprene) Polysulphide Polyurethane Silicone
Acid
G G E
G E E G
G F F G
Alkali
G G E
G E E G
G G P E
Note: E = excellent resistance, G
Creep properties
Hydro-carbons (petrol,
oil)
E P P
G P E P
G E E F
= good,
Chlor-inated
solvents
P P P
P P E P
P G P P
F = fair,
Oxidiz-ation
F G E
E E E G
E E E E
P = poor.
Ozone
P P E
E E E P
E E E E
Creep can be significant in polymeric materials at normal temperatures, the creep behaviour depending on stress and temperature as well as the type of material concerned. Generally, flexible polymeric materials show more creep than stiff ones.
The data obtained from creep tests is strain against time for a number of different stresses. From such data, a graph of stress against strain can be produced for different times, such a graph being known as an isochronous stress-strain graph. For a specific time, the quantity obtained from the graph by dividing the stress by the strain, a form of secant modulus, can be obtained. The result is known as the creep modulus. It is not the same as the tensile modulus, though it can be used to compare the stiffness of polymeric materials. The creep modulus varies both with time and strain. Table 9.5 shows some typical values of creep modulus for thermoplastics after one year under constant load at 20°C.
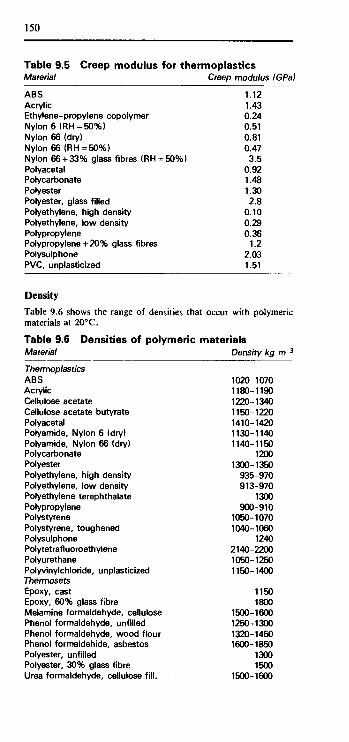
150
Table 9.5 Creep modulus for thermoplastics Material Creep modulus (GPa)
ABS 1.12 Acrylic 1.43 Ethylene-propylene copolymer 0.24 Nylon6(RH = 50%) 0.51 Nylon 66 (dry) 0.81 Nylon 66 (RH = 50%) 0.47 Nylon 66 + 33% glass fibres (RH = 50%) 3.5 Polyacetal 0.92 Polycarbonate 1.48 Polyester 1.30 Polyester, glass filled 2.8 Polyethylene, high density 0.10 Polyethylene, low density 0.29 Polypropylene 0.36 Polypropylene + 20% glass fibres 1.2 Polysulphone 2.03 PVC, unplasticized 1.51
Density
Table 9.6 shows the range of densities that occur with polymeric materials at 20°C. Table 9.6 Densities of polymeric materials Material
Thermoplastics ABS Acrylic Cellulose acetate Cellulose acetate butyrate Polyacetal Polyamide, Nylon 6 (dry) Polyamide, Nylon 66 (dry) Polycarbonate Polyester Polyethylene, high density Polyethylene, low density Polyethylene terephthalate Polypropylene Polystyrene Polystyrene, toughened Polysulphone Polytetrafluoroethylene Polyurethane Polyvinylchloride, unplasticized Thermosets Epoxy, cast Epoxy, 60% glass fibre Melamine formaldehyde, cellulose Phenol formaldehyde, unfilled Phenol formaldehyde, wood flour Phenol formaldehide, asbestos Polyester, unfilled Polyester, 30% glass fibre Urea formaldehyde, cellulose fill.
Density kg m~3
1020-1070 1180-1190 1220-1340 1150-1220 1410-1420 1130-1140 1140-1150
1200 1300-1350
935-970 913-970
1300 900-910
1050-1070 1040-1060
1240 2140-2200 1050-1250 1150-1400
1150 1800
1500-1600 1250-1300 1320-1450 1600-1850
1300 1500
1500-1600
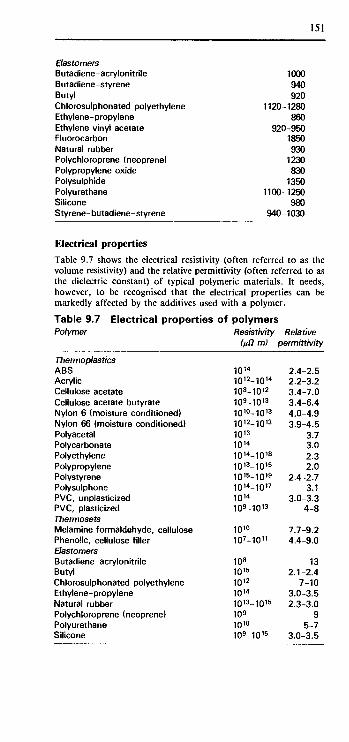
151
Elastomers Butadiene-acrylonitrile Butadiene-styrene Butyl Chlorosulphonated polyethylene Ethylene-propylene Ethylene vinyl acetate Fluorocarbon Natural rubber Polychloroprene (neoprene) Polypropylene oxide Polysulphide Polyurethane Silicone Styrene-butadiene-styrene
1000 940 920
1120-1280 860
920-950 1850 930
1230 830
1350 1100-1250
980 940-1030
Electrical properties
Table 9.7 shows the electrical resistivity (often referred to as the volume resistivity) and the relative permittivity (often referred to as the dielectric constant) of typical polymeric materials. It needs, however, to be recognised that the electrical properties can be markedly affected by the additives used with a polymer.
Table 9.7 Electrical properties of polymers Polymer Resistivity Relative
(μΩ m) permittivity
Thermoplastics ABS Acrylic Cellulose acetate Cellulose acetate butyrate Nylon 6 (moisture conditioned) Nylon 66 (moisture conditioned) Polyacetal Polycarbonate Polyethylene Polypropylene Polystyrene Polysulphone PVC, unplasticized PVC, plasticized Thermosets Melamine formaldehyde, cellulose Phenolic, cellulose filler Elastomers Butadiene-acrylonitrile Butyl Chlorosulphonated polyethylene Ethylene-propylene Natural rubber Polychloroprene (neoprene) Polyurethane Silicone
1014
101 2-1014
108-1012
109-1013
1010-1013 101 2-1013
1013 1014
101 4-1018
1013-1015 1015-1019 1014-1017 1014
109-1013
1010
107-1011
108
1015 1012
1014
1013-1015 109
1010
109-1015
2.4-2.5 2.2-3.2 3.4-7.0 3.4-6.4 4.0-4.9 3.9-4.5
3.7 3.0 2.3 2.0
2.4-2.7 3.1
3.0-3.3 4-8
7.7-9.2 4.4-9.0
13 2.1-2.4
7-10 3.0-3.5 2.3-3.0
9 5-7
3.0-3.5

152
Fracture toughness
Table 9.8 gives typical values of the plane strain fracture toughness in air of some thermoplastic materials at 20°C.
Table 9.8 Fracture toughness of thermoplastics Material K,cMPam-'A
Acrylic, cast sheet Nylon 6.6 Polycarbonate Polyethylene Polypropylene Polystyrene, general purpose Polyvinyl chloride
1.6 2.5-3.0
2.2 1-6
3.0-4.5 1.0 2-4
Glass transition temperatures
Table 9.9 shows the glass transition temperatures of thermoplastics and elastomers. Also the normal condition of the material is given at 20°C.
Table 9.9 Glass transition temperatures of thermoplastics Material State TQ °C
Thermoplastics ABS Acrylic Cellulose acetate Cellulose acetate butyrate Polyacetal, homopolymer Polyamide, Nylon 6 Polyamide, Nylon 66 Polycarbonate Polyethylene, high density Polyethylene, low density Polyethylene terephthalate Polypropylene Polystyrene Polysulphone Polytetrafluoroethylene Polyvinylchloride Polyvinylidene chloride Elastomers Butadiene-acrylonitrile Butadiene-styrene Butyl Chlorosulphonated polyethylene Ethylene-propylene Ethylene vinyl acetate Natural rubber Polychloroprene (neoprene) Polysulphide Polyurethane Silicone
amorphous amorphous amorphous amorphous semi cryst. semi cryst. semi cryst. amorphous semi cryst. semi cryst. semi cryst. semi cryst. amorphous amorphous semi cryst. amorphous semi cryst.
amorphous amorphous amorphous amorphous amorphous amorphous amorphous amorphous amorphous amorphous amorphous
100 100 120 120 -76 50 66
150 -120 -90
69 -10 100 190
-120 87
-17
-55 -55 -79 -55 -75
-160 -70 -50 -50 -60 -50
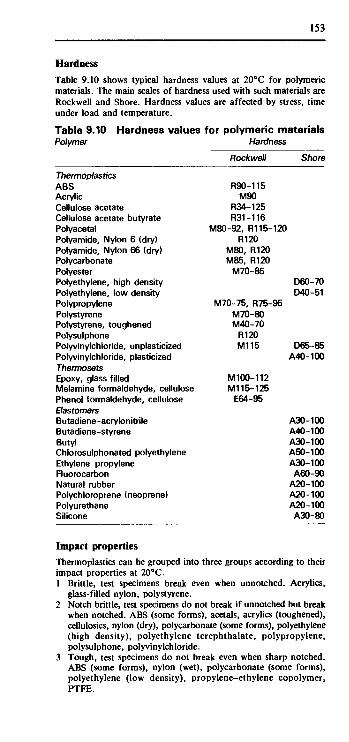
153
Hardness
Table 9.10 shows typical hardness values at 20°C for polymeric materials. The main scales of hardness used with such materials are Rockwell and Shore. Hardness values are affected by stress, time under load and temperature.
Table 9.10 Hardness values for polymeric materials Polymer
Thermoplastics ABS Acrylic Cellulose acetate Cellulose acetate butyrate Polyacetal Polyamide, Nylon 6 (dry) Polyamide, Nylon 66 (dry) Polycarbonate Polyester Polyethylene, high density Polyethylene, low density Polypropylene Polystyrene Polystyrene, toughened Polysulphone Polyvinylchloride, unplasticized Polyvinylchloride, plasticized Thermosets Epoxy, glass filled Melamine formaldehyde, cellulose Phenol formaldehyde, cellulose Elastomers Butadiene-acrylonitrile Butadiene-styrene Butyl Chlorosulphonated polyethylene Ethylene-propylene Fluorocarbon Natural rubber Polychloroprene (neoprene) Polyurethane Silicone
Hardness
Rockwell
R90-115 M90
R34-125 R31-116
Shore
M80-92, R115-120 R120
M80, R120 M85, R120
M70-85
M70-75, R75-95 M70-80 M40-70
R120 M115
M100-112 M115-125
E64-95
D60-70 D40-51
D65-85 A40-100
A30-100 A40-100 A30-100 A50-100 A30-100 A60-90
A20-100 A20-100 A20-100 A30-80
Impact properties Thermoplastics can be grouped into three groups according to their impact properties at 20°C. 1 Brittle, test specimens break even when unnotched. Acrylics,
glass-filled nylon, polystyrene. 2 Notch brittle, test specimens do not break if unnotched but break
when notched. ABS (some forms), acetals, acrylics (toughened), cellulosics, nylon (dry), polycarbonate (some forms), polyethylene (high density), polyethylene terephthalate, polypropylene, polysulphone, Polyvinylchloride.
3 Tough, test specimens do not break even when sharp notched. ABS (some forms), nylon (wet), polycarbonate (some forms), polyethylene (low density), propylene-ethylene copolymer, PTFE.

154
Mechanical properties
Table 9.11 shows the mechanical properties of thermoplastics, ther-mosets and elastomers at 20°C, together with their approximate maximum continuous use temperature.
Table 9.11 Mechanical properties of polymei Polymer
Thermoplastics ABS Acrylic Cellulose acetate Cellulose acetate butyrate Polyacetal, homopolymer Polyamide, Nylon 6 Polyamide, Nylon 66 Polycarbonate
Tensile strength
(MPa)
17-58 50-70 24-65 18-48
70 75 80
55-65 Polyethylene, high density 22-38 Polyethylene, low density 8-16 Polyethyleneter-ephthalate 50-70 Polypropylene Polystyrene Polystyrene, toughened Polysulphone Polytetrafluoroethylene PVC, unplasticised PVC, low plasticiser Thermosets ' Epoxy, cast Epoxy, 60% glass fibre Melamine form., cellulose f. Phenol formaldehyde Phenol formaldehyde,
wood flour filler Phenol formaldehyde,
asbestos filler Polyester, unfilled Olyester, 30% glass fibre Urea form., cellulose fill. Elastomers Butadiene-acrylonitrile Butadiene-styrene Butyl Chlorosulphonated
polyethylene Ethylene-propylene Ethylene vinyl acetate Fluorocarbon Natural rubber
30-40 35-60 17-24
70 14-35 52-58 28-42
60-100 200-420 55-85 35-55
40-55
30-55 55 120
50-80
28 24 20
21 20 19 18 20
Polychloroprene (neoprene) 25 Polypropylene oxide Polysulphide Polyurethane Silicone
14 9 40 10
Styrene- butadiene-styrene 14
Tensile modulus
(GPa)
1.4-3.1 2.7-3.5 1.0-2.0 0.5-1.4
3.6 1.1-3.1 2.8-3.3 2.1-2.4 0.4-1.3 0.1-0.3 2.1-4.4 1.1-1.6 2.5-4.1 1.8-3.1
2.5 0.4
2.4-4.1
3.2 21-25
Elong-ation (%)
10-140 5-8 5-55
40-90 15-75 60-320 60-300 60-100 50-800
100-600 60-100 50-600 2-40 8-50
50-100 200-600
2-40 200-250
7.0-10.5 0.5-1 5.2-7.0
5.5-8.0
1-1.5
0.5-1
0.1-11.5 0.1-0.2 2.4 7.7 3
7.0-13.5 0.5-1
700 600 900
500 300 750 300 800 1000 300 500 650 700 700
rs Max.
temp. (°C)
70 100 70 70
100 110 110 120 125 85
120 150 70 70
160 260 70
100
200 95
120
150
180 200
80
100 80
100
130 100 120 230 80
100 170 80 80
300 80

155
Optical properties
Table 9.12 gives the refractive index and the direct transmission factor for polymeric materials. This transmission factor is the percentage of light that would be transmitted if the material was 1 mm thick. Thinner material would give a higher transmission, thicker material would give less. Thus a transmission factor of 0% for 1 mm thickness does not mean that the material is completely opaque for thinner sheets.
Table 9.12 Optical properties of polymers Polymer Refractive Transmission
index factor (%)
Acetal copolymer Acrylics Cellulose acetate Nylon 66 Polycarbonate Polyethylene, low density Polyethylene terephthalate Polymethylepentene Polypropylene Polystyrene Polysulphone Polyvinylchloride Polytetrafluoroethylene
1.49 1.49
1.46-1.50 1.45 1.59 1.52
1.47 1.49
1.59-1.60 1.63 1.54 1.32
0 >99
0
45 >90 99
11-46
94 0
Permeability
A common use of polymeric materials is as a barrier to gases and vapours. A measure of the rate at which gases or vapours can permeate through a material is given by the permeability, the higher the permeability, the greater will be the flow rate through a polymer film. See permeability in Chapter 1. Table 9.13 gives permeability values for a number of gases/vapours at 25°C.
Table 9.13 Permeability of polymers Polymer
Nylon 6 Polyethylene, high density Polyethylene, low density Polyethylene terephthalate Polypropylene Polystyrene PVC, unplasticized Natural rubber Butyl rubber
Resilience
Permeability 10~ w kg
to oxygen
0.48 6.4
17.6 0.22 6.4
9.33 0.37
112.0 5.9
mN'1 s~1
water carbon dioxide
1350 40
300 600 170 300 400
7700
6.0 30
171 0.9
30 120
2.9 1110
45
To illustrate the term resilience, the more resilient a rubber ball, the higher it will bounce up after being dropped from a fixed height onto the floor. Natural rubber, butadiene-styrene, polychloroprene, and ethylene propylene have good resilience; butadiene-acrylonitrile, butyl, fluorosilicone and polysulphide fair resilience; polyurethane poor resilience.

156
Thermal properties
Table 9.14 shows the linear thermal expansivity, i.e. linear coeffi-cient of expansion, specific heat capacity and thermal conductivity of polymeric materials. The thermal conductivity of a polymer can be markedly reduced if it is made cellular or foamed. Data for such materials is included at the end of the table.
Table 9.14 Thermal properties of polymeric materials Polymer Thermal Specific Thermal
expans. ht. cap. conduct. (10-2 °C~1) (kJ kg~1 °C1) (W m~1 °C~1)
Thermoplastics ABS 8-10 Acrylic 6-7 Cellulose acetate 8-18 Cellulose acetate butyrate 11-17 Polyacetal, homopolymer 10 Polyamide, Nylon 6 (dry) 8-10 Polyamide, Nylon 66 (dry) 8-10 Polycarbonate 4-7 Polyethylene, high density 11-13 Polyethylene, low density 13-20 Polyethylene terephthalate Polypropylene 10-12 Polystyrene 6-8 Polystyrene, toughened 7-8 Polysulphone 5 Polytetrafluoroethylene 10 PVC, unplasticized 5-19 PVC, low plasticizer 7-25 Thermosets Epoxy, cast 6 Epoxy, 60% glass fibre 1 -5 Melamine form., cellulose f. 4 Phenol formaldehyde 3-4 Phenol formaldehyde,
cellulose filler 3-4 Polyester, unfilled 6 Elastomers Ethylene-propylene 6 Natural rubber Polychloroprene (neoprene) 24 Cellular polymers Polystyrene, density 16 kg nrr3
Polystyrene, density 32 kg m- 3
Polyurethane, density 16 kg m- 3
Polyurethane, density 32 kg m- 3
Polyurethane, density 64 kg m- 3
9.5 Uses Processing methods
The forms available for finished polymeric material products depend on the processing methods that are possible. Thus casting can be used to produce sheets, rods, tubes and simple shapes. Extrusion is used for sheets, rods, tubes and long shapes. Injection moulding,
1.5
1.5 1.5 1.5 1.6 1.7 1.3 2.3 1.9 1.0 1.9 1.2 1.4 1.3 1.1 1.1 1.7
1.1 0.8
1.5
1.1 1.9 1.7
0.13-0.20 0.13-0.15 0.13-0.20 0.13-0.20
0.17 0.17-0.21 0.17-0.21 0.14-0.16 0.31-0.35
0.25 0.14 0.16
0.12-0.13 0.12-0.13
0.19 0.27
0.12-0.14 0.15
0.17
0.27-0.42
0.16-0.32
0.17 0.18 0.21
0.039 0.032 0.040 0.023 0.025

157
compression moulding and transfer moulding are used for intricate shapes. Thermoforming is used to produce shapes from sheet material. Table 9.15 shows the processing methods possible with thermoplastics and Table 9.16 with thermosets.
Table 9.15 Processing methods for thermoplastics Polymer Extru- Inject- Extru- Rotat- Therm- Cast- Bend As
sion ion sion ional oform ing and film mould blow mould join
mould
ABS * * Acrylic * * * * * Cellulosics * * * * Polyacetal * * * Polyamide (nylon) * * * * * Polycarbonate * * * * * Polyester * * Polyethylene, high d. * * Polyethylene, low d. * * * * * * Polyethylene terephth.* * * * Polypropylene * * * * * * Polystyrene * * * * * * * Polysulphone * * * PTFE PVC * * * * * * *
Table 9.16 Processing methods with thermosets Polymer C or T Cast- Laminate Foam Film
moulding ing
Epoxy * * *
Melamine formaldehyde * *
Phenol formaldehyde * * * * Polyester * * * * Urea formaldehyde * *
Note: C or T moulding is compression or transfer moulding.
Uses
Table 9.17 gives examples of the end products possible with polymeric materials.
Table 9.17 Uses of polymeric materials Polymer Uses
Thermoplastics ABS Tough, stiff and abrasion resistant.
Used as casings for telephones, vacuum cleaners, hair driers, TV sets, radios, typewriters, luggage, boat shells, food containers.
Acrylic Transparent, stiff, strong and weather resistant. Used for light fittings, canopies, lenses for car lights, signs and nameplates. Opaque sheet is used for domestic baths, shower cabinets, basins, lavoratory cisterns.

158
Cellulose acetate
Cellulose acetate butyrate
Polyacetal, homopolymer
Polyamide, Nylon
Polycarbonate
Polyethylene, high density
Polyethylene, low density
Polyethylene terephthalate
Polypropylene
Polystyrene
Hard, stiff, tough but poor dimensional stability. Used for spectacle frames, tool handles, toys, buttons. More resistant to solvent attack, lower moisture absorption, higher impact strength than cellulose acetate. Used for cable insulation, natural gas pipes, street signs, street light globes, tool handles, lenses for instrument panel lights, blister packaging, containers. Stiff, strong and maintains properties at relatively high temperatures. Used as pipe fitt ings, parts for water pumps and washing machines, car instrument housings, bearings, gears, hinges, window catches, car seat belt buckles. Nylon 6 and 66 are the most widely used, 66 having a higher melting point and being stronger and stiffer than 6 but more absorbent of water. Used for gears, bearings, bushes, housings for power tools, electric plugs and sockets, and as fibres in clothing.
Tough, stiff and strong. Used where impact resistance and relatively high temperatures experienced. Used for street lamp covers, infant feeding bottles, machine housings, safety helmets, cups and saucers. Good chemical resistance, low moisture absorption and high electrical resistance. Used for piping, toys, household ware. Good chemical resistance, low moisture absorption and high electrical resistance. Used for bags, squeeze bottles, ball-point pen tubing, wire and cable insulation. In fibre form used for clothes. Used for electrical plugs and sockets, wire insulation, recording tapes, insulating tape, gaskets, and widely as a container for fizzy drinks. Used for crates, containers, fans, car fascia panels, tops of washing machines, radio and TV cabinets, toys, chair shells. Wi th no additives is brittle and transparent; blending with rubber gives a toughened form. This form is used as vending machine cups, casings for cameras, projectors, radios, TV sets and vacuum cleaners. Is excellent electrical insulator and used in electrical equipment. Foamed, or expanded,

Polysulphone
Polytetrafluoroethylene
PVC, unplasticized
PVC, plasticized
Thermosets Epoxy
Epoxy, cast
Epoxy, with glass fibres
Melamine formaldehyde
Phenol formaldehyde
Polyester
Urea formaldehyde
polystyrene is used for insulation and packaging. Strong, stiff and excellent creep resistance. Burns with difficulty and does not present a smoke hazard. Used in aircraft as parts in passenger service units, circuit boards, coil bobbins, circuit- breaker items, cooker control knobs. Tough and flexible, can be used over very wide temperature range. Used for piping carrying corrosive chemicals, gaskets, diaphragms, valves, O-rings, bellows, couplings, dry and self-lubricating bearings, and because other materials will not bond with it, coatings for non-stick pans, coverings for rollers, linings for hoppers and chutes. Rigid, used for piping for waste and soil drainage systems, rain water pipes, lighting fittings, curtain rails. Flexible, used for plastic rain coats, bottles, shoe soles, garden hose pipes, gaskets, inflatable toys.
Used as an adhesive, a laminating resin, and as a coating for structural steel, masonry and marine items. Encapsulation of electronic components, for fabrication of short run moulds, patterns. Gives hard, strong composites. Used for boat hulls and table tops. Supplied as a moulding powder, this includes the resin, fillers and pigments. Used for cups and saucers, knobs, handles, light fittings, toys. Composites with open-weave fabrics used for building panels and electrical equipment. Also known as Bakelite. Supplied as a moulding powder, this includes resin, fillers and pigments. Fillers account for 50 to 80% by weight of the moulding powder. Wood flour increases impact strength, asbestos fibres increase heat properties, mica increases electrical resistance. Used for electrical plugs and sockets, switches, door knobs and handles, camera bodies, ashtrays. Composites with paper or an open-weave fabric are used for gears, bearings, and electrical insulation parts.
Generally used as a composite with glass fibres. Used for boat hulls, building panels, stackable chairs. As melamine formaldehyde.
159

160
Elastomers Butadiene-acrylonitrile
Butadiene-styrene
Butyl
Chlorosulphonated polyethylene
Ethylene-propylene
Ethylene vinyl acetate
Fluorocarbon
Natural rubber
Polychloroprene (neoprene)
Polypropylene oxide
Polysulphide
Polyurethane
Silicone
Excellent resistance to organic liquids. Used for hoses, gaskets, seals, tank linings, rollers. Cheaper than natural rubber. Used in the manufacture of tyres, hosepipes, conveyor belts, cable insulation. Extremely impermeable to gases. Used for inner linings of tubeless tyres, steam hoses, diaphragms. Trade name Hypalon. Excellent resistance to ozone with good chemical resistance abrasion, fatigue and impact properties. Used for flexible hose for oil and chemicals, tank linings, cable insulation, V-belts, O-rings, seals, gaskets, shoe soles. Very high resistance to oxygen, ozone and heat. Good electrical and aging properties. Used for electric insulation, footwear, hose, belts. Flexible, good impact strength, high clarity. Used for cable insulation, flexible tubing, shoe soles, gaskets. Used for O-rings, seals, gaskets, diaphragms.
Inferior to synthetics in oil and solvent resistance and oxidation resistance. Attacked by ozone. Higher tear resistance than synthetic rubbers. Used for tyres, gaskets, hose. Good resistance to oils and good weathering characteristics. Used for oil and petrol hoses, gaskets, seals, diaphragms, chemical tank linings. Excellent impact and tear strength with good mechanical properties and resilience. Used for electrical insulation. Often has an offensive odour. Excellent resistance to oils and solvents, low permeability to gases. Can be attacked by micro-organisms. Used for printing rolls, cable coverings, coated fabrics, sealants in building work. Widely used for both flexible and rigid foams. Used as cushioning, packaging, structural and insulation panels. Can be used over a wide temperature range.-90 to 250°C and higher for some grades. Chemically inert, good electrical properties, but expensive. Used for electric insulation seals, shock mounts, vibration dampers, adhesives.
161
Styrene-butadiene-sty rene Known as a thermoplastic rubber. Properties controlled by ratio of styrene and butadiene. Properties comparable with natural rubber. Used for footwear, carpet backing, and in adhesives.
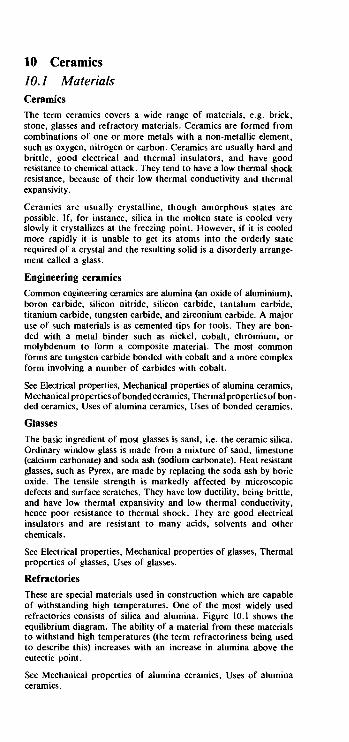
10 Ceramics 10.1 Materials Ceramics
The term ceramics covers a wide range of materials, e.g. brick, stone, glasses and refractory materials. Ceramics are formed from combinations of one or more metals with a non-metallic element, such as oxygen, nitrogen or carbon. Ceramics are usually hard and brittle, good electrical and thermal insulators, and have good resistance to chemical attack. They tend to have a low thermal shock resistance, because of their low thermal conductivity and thermal expansivity.
Ceramics are usually crystalline, though amorphous states are possible. If, for instance, silica in the molten state is cooled very slowly it crystallizes at the freezing point. However, if it is cooled more rapidly it is unable to get its atoms into the orderly state required of a crystal and the resulting solid is a disorderly arrange-ment called a glass.
Engineering ceramics
Common engineering ceramics are alumina (an oxide of aluminium), boron carbide, silicon nitride, silicon carbide, tantalum carbide, titanium carbide, tungsten carbide, and zirconium carbide. A major use of such materials is as cemented tips for tools. They are bon-ded with a metal binder such as nickel, cobalt, chromium, or molybdenum to form a composite material. The most common forms are tungsten carbide bonded with cobalt and a more complex form involving a number of carbides with cobalt.
See Electrical properties, Mechanical properties of alumina ceramics, Mechanical properties of bonded ceramics, Thermal properties of bon-ded ceramics, Uses of alumina ceramics, Uses of bonded ceramics.
Glasses
The basic ingredient of most glasses is sand, i.e. the ceramic silica. Ordinary window glass is made from a mixture of sand, limestone (calcium carbonate) and soda ash (sodium carbonate). Heat resistant glasses, such as Pyrex, are made by replacing the soda ash by boric oxide. The tensile strength is markedly affected by microscopic defects and surface scratches. They have low ductility, being brittle, and have low thermal expansivity and low thermal conductivity, hence poor resistance to thermal shock. They are good electrical insulators and are resistant to many acids, solvents and other chemicals.
See Electrical properties, Mechanical properties of glasses, Thermal properties of glasses, Uses of glasses.
Refractories
These are special materials used in construction which are capable of withstanding high temperatures. One of the most widely used refractories consists of silica and alumina. Figure 10.1 shows the equilibrium diagram. The ability of a material from these materials to withstand high temperatures (the term refractoriness being used to describe this) increases with an increase in alumina above the eutectic point.
See Mechanical properties of alumina ceramics, Uses of alumina ceramics.
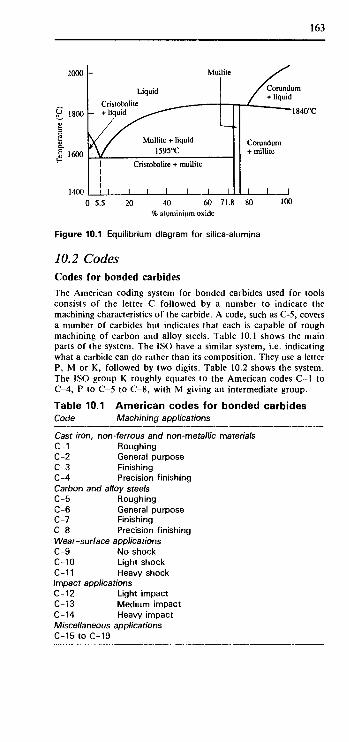
163
2000
& 1800
ex
I 1600
1400 0 5.5 20 40 60 71.8 80 100
% aluminium oxide
Figure 10.1 Equilibrium diagram for silica-alumina
10.2 Codes Codes for bonded carbides
The American coding system for bonded carbides used for tools consists of the letter C followed by a number to indicate the machining characteristics of the carbide. A code, such as C-5, covers a number of carbides but indicates that each is capable of rough machining of carbon and alloy steels. Table 10.1 shows the main parts of the system. The ISO have a similar system, i.e. indicating what a carbide can do rather than its composition. They use a letter P, M or K, followed by two digits. Table 10.2 shows the system. The ISO group K roughly equates to the American codes C-l to C-4, P to C-5 to C-8, with M giving an intermediate group.
Table 10.1 American codes for bonded carbides Code Machining applications
Cast iron, non-ferrous and non-metallic materials C-1 Roughing C-2 General purpose C-3 Finishing C-4 Precision finishing Carbon and alloy steels C-5 Roughing C-6 General purpose C-7 Finishing C-8 Precision finishing Wear-surface applications C-9 No shock C-10 Light shock C-11 Heavy shock Impact applications C-12 Light impact C-13 Medium impact C-14 Heavy impact Miscellaneous applications C-15to C-19
Mullite
Liquid
Cristobalite + mullite
Corundum + liquid
-1840°C
Corundum + millite
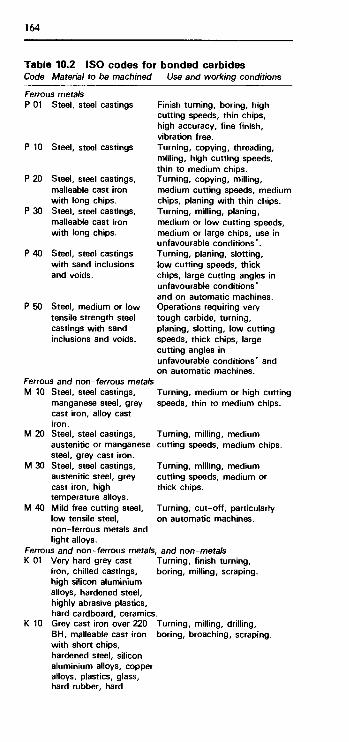
164
Table 10.2 ISO codes for bonded carbides Code Material to be machined Use and working conditions
Ferrous metals P 01 Steel, steel castings Finish turning, boring, high
cutting speeds, thin chips, high accuracy, fine finish, vibration free. Turning, copying, threading, milling, high cutting speeds, thin to medium chips. Turning, copying, milling, medium cutting speeds, medium chips, planing with thin chips. Turning, milling, planing, medium or low cutting speeds, medium or large chips, use in unfavourable conditions*. Turning, planing, slotting, low cutting speeds, thick chips, large cutting angles in unfavourable conditions* and on automatic machines. Operations requiring very tough carbide, turning, planing, slotting, low cutting speeds, thick chips, large cutting angles in unfavourable conditions* and on automatic machines.
Turning, medium or high cutting speeds, thin to medium chips.
P 10 Steel, steel castings
P 20 Steel, steel castings, malleable cast iron with long chips.
P 30 Steel, steel castings, malleable cast iron with long chips.
P 40 Steel, steel castings with sand inclusions and voids.
P 50 Steel, medium or low tensile strength steel castings with sand inclusions and voids.
Ferrous and non-ferrous metals M 10 Steel, steel castings,
manganese steel, grey cast iron, alloy cast iron.
M 20 Steel, steel castings, austenitic or manganese steel, grey cast iron.
M 30 Steel, steel castings, austenitic steel, grey cast iron, high temperature alloys.
M 40 Mild free cutting steel, low tensile steel, non-ferrous metals and light alloys.
Ferrous and non-ferrous metals, K 01 Very hard grey cast
iron, chilled castings, high silicon aluminium alloys, hardened steel, highly abrasive plastics, hard cardboard, ceramics
K 10 Grey cast iron over 220 BH, malleable cast iron with short chips, hardened steel, silicon aluminium alloys, copper alloys, plastics, glass, hard rubber, hard
Turning, milling, medium cutting speeds, medium chips.
Turning, milling, medium cutting speeds, medium or thick chips.
Turning, cut-off, particularly on automatic machines.
, and non-metals Turning, finish turning, boring, milling, scraping.
Turning, milling, drilling, boring, broaching, scraping.

165
cardboard, porcelain, stone.
K 20 Grey cast iron up to Turning, milling, planing, 220 BH, non-ferrous boring, broaching, demanding metals, copper, brass aluminium.
K 30 Low hardness grey cast Turning, milling, planing, iron, low tensile slotting, use in unfavourable steel, compressed wood, conditions* and with large
cutting angles. K 40 Soft wood, hard wood, Turning, milling, planing,
non-ferrous metals. slotting, use in unfavourable conditions*, and with large cutting angles.
Note: * Unfavourable conditions include shapes that are awkward to machine, material having a casting or forging skin, material having a variable hardness, and machining that involves variable depth of cut, interrupted cut or moderate to severe vibrations. In each of the above categories, the lower the number the higher the cutting speed and the lighter the feed, the higher the number the slower the cutting speed but the heavier the feed.
10.3 Properties Density
See Mechanical properties for values.
Electrical properties
Most ceramics have resistivities greater than 1013 Ω m with glasses about 104 to 1010 Ω m. The permittivity, i.e. dielectric constant, of alumina ceramics is about 8 to 10 with glasses about 4 to 7.
Mechanical properties of alumina ceramics
Table 10.3 shows the mechanical properties of alumina-silica ceramics.
Table 10.3 Mechanical properties of alumina ceramics Alumina Density Hardness Compressive Tensile Elastic (%) 103 kg m~3 Rockwell strength strength modulus
(A) (MPa) (MPa) (GPa)
85 90 96 99.9
3.39
3.60 3.72
3.96
73 79 78 90
1930
2480 2070
3790
155 220 190 310
221 276 303 386
Mechanical properties of bonded carbides
Table 10.4 shows the mechanical properties of commonly used bonded carbides. The properties depend on the grain size and so the data quoted relate to the spread of grain size commonly encountered. The modulus of elasticity is about 640 GPa with high tungsten carbide content (97%), dropping to about 480 GPa for 75% content.

166
Table 10.4 Mechanical properties of bonded carbides Composition Hardness Density Compressive Impact Main constituents Rockwell (103 kg me) strength strength (%) (A) (MPa) (J)
97WC-3Co 92-93 94WC-6Co 90-93 90WC-10Co 87-91 84WC-16Co 86-89 75WC-25CO 83-85 71WC-12.5TiC- 92-93
12TaC-4.5Co 72WC-8TiC-11.5TaC- 90-92
8.5Co 64TiC-28WC-2TaC- 94-95
2Cr2C3-5.0Co 57WC-27TaC-16Co 84-86
97WC-3Co 4.0 94WC-6Co 4.3 90WC-10Co 5.2 84WC-16CO 5.8 75WC-25C0 6.3 71WC-12.5TiC- 5.2
12TaC-4.5Co 72WC-8TiC-11.5TaC- 5.8
8.5Co 57WC-27TaC-16Co 5.9
15.0 15.0 14.5 13.9 13.0 12.0
5860 5170-5930 4000-5170 3860-4070
3100 5790
1.1 1.0-1.4 1.7-2.0 2.8-3.1
3.1 0.8
12.6 5170 0.9
6.6 4340
13.7 3720 2.0
121 5.4-5.9 100-121
112 7.0 88
71 6.5 35
6.8 50
7.7
Note: WC = tungsten carbide, TiC = titanium carbide, TaC = tantalum carbide, Cr+2C3 = chromium carbide, Co = cobalt.
Mechanical properties of glasses
The tensile strength of glasses is very much affected by microscopic defects and surface scratches and for design purposes a value of about 50 MPa is generally used. Glasses have a tensile modulus of about 70 GPa.
Thermal properties of bonded carbides
Table 10.5 gives the linear thermal expansivity and thermal conduc-tivity of bonded carbides. The expansivities are quoted for temperatures of 200°C and 1000°C. At a particular temperature, a low expansivity and low thermal conductivity means that the material is susceptible to thermal shock if there are sudden changes in temperature.
Table 10.5 Thermal properties of bonded carbides Composition Thermal expansivity Thermal Main constituents (10-6oC-1) conductivity <%> at200°C 1000°C W m"' °C"''
Note: WC = tungsten carbide, TiC = titanium carbide,
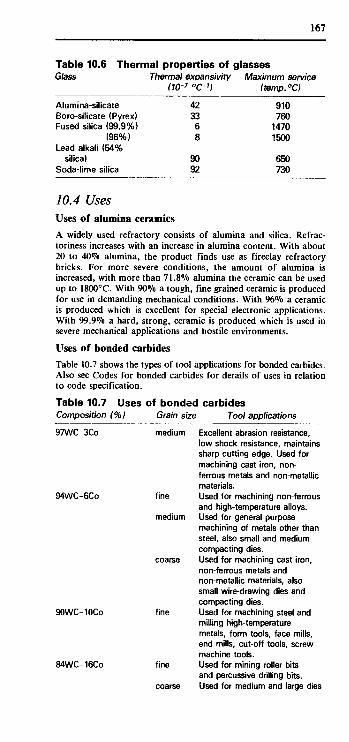
167
Table 10.6 Thermal properties of glasses Glass Thermal expansivity Maximum service
(10-7 °C-1) (temp.°C)
Alumina-siiicate Boro-silicate (Pyrex) Fused silica (99.9%)
(96%) Lead alkali (54%
silica) Soda-lime silica
42 33 6 8
90 92
910 760
1470 1500
650 730
10 A Uses Uses of alumina ceramics
A widely used refractory consists of alumina and silica. Refrac-toriness increases with an increase in alumina content. With about 20 to 40% alumina, the product finds use as fireclay refractory bricks. For more severe conditions, the amount of alumina is increased, with more than 71.8% alumina the ceramic can be used up to 1800°C. With 90% a tough, fine grained ceramic is produced for use in demanding mechanical conditions. With 96% a ceramic is produced which is excellent for special electronic applications. With 99.9% a hard, strong, ceramic is produced which is used in severe mechanical applications and hostile environments.
Uses of bonded carbides
Table 10.7 shows the types of tool applications for bonded carbides. Also see Codes for bonded carbides for details of uses in relation to code specification.
Table 10.7 Uses of bonded carbides Composition (%) Grain size Tool applications
97WC-3CO
94WC-6Co
90WC-10Co
84WC-16Co
medium Excellent abrasion resistance, low shock resistance, maintains sharp cutting edge. Used for machining cast iron, non-ferrous metals and non-metallic materials.
fine Used for machining non-ferrous and high-temperature alloys.
medium Used for general purpose machining of metals other than steel, also small and medium compacting dies.
coarse Used for machining cast iron, non-ferrous metals and non-metallic materials, also small wire-drawing dies and compacting dies.
fine Used for machining steel and milling high-temperature metals, form tools, face mills, end mills, cut-off tools, screw machine tools.
fine Used for mining roller bits and percussive drilling bits.
coarse Used for medium and large dies

168
75WC-25C0
71WC-12.5TiC-12TaC-4.5Co
72WC-8TiC-11.5TaC-8.5Co
64TiC-28WC-2TaC-2Cr2C3-5.0Co
57WC-27TaC-16Co
medium
medium
medium
medium
where toughness is required, blanking dies and large mandrels. Used for heading dies, cold extrusion dies, punches and dies for blanking heavy stock. Used for finishing and light roughing work on plain carbon, alloy steels and alloy cast irons. Tough, wear resistant, withstands high temperatures. Used for heavy duty machining, milling plain carbon, alloy steels and alloy cast irons. Used for high speed finishing of steels and cast irons. Used for cutting hot flash from welded tubing, and dies for hot extrusion of aluminium.
Note: WC = tungsten carbide, TiC = titanium carbide, TaC = tantalum carbide, Cr2C3 = chromium carbide, Co = cobalt.
Uses of glasses
Table 10.8 shows the basic characteristics and uses of commonly used glasses.
Table 10.8 Uses of glasses Glass Uses
Alumina-silicate
Boro-silicate (Pyrex)
Fused silica
Lead alkali (54% silica)
Soda-lime silica
Thermal shock resistant. Used for thermometers. Thermal shock resistant and easy to form. Used for glass cooking utensils. Thermal shock resistant. Used for laboratory equipment. Has a high refractive index. Used for cut glass items. Easy to form. Used as plate glass, windows, bottles.
coarse

11 Composites 11.1 Materials Types of composites Composites can be classified into three main categories: 1 Fibre reinforced Examples are vehicle tyres (rubber reinforced with woven cords), reinforced concrete, glass fibre reinforced plastics, carbon fibres in epoxy resins or aluminium, wood (a natural composite with tubes of cellulose in a matrix of lignin). 2 Particle reinforced Examples are polymeric materials incorporating fillers, such as glass spheres or finely divided powders, toughened polymers in which fine rubber particles are included, cermets with ceramic particles in a metal matrix. 3 Dispersion strengthened Examples are aluminium alloys following solution treatment and precipitation hardening, maraging steels, sintered metals.
In addition there is the entire range of laminated materials. Examples include plywood, clad metals, metal honeycomb struc-tures, corrugated cardboard.
Fibre reinforced materials
For fibre reinforced composites, the main functions of the fibres are to carry most of the load applied to the composite and provide stiffness. For this reason, fibre materials have high tensile strength and a high tensile modulus. The properties required of the matrix material are that it adheres to the fibre surfaces so that forces applied to the composite are transmitted to the fibres since they are primarily responsible for the strength of the composite, that it protects the fibre surfaces from damage and that it keeps the fibres apart to hinder crack propagation. The fibres used may be continuous, in lengths running the full length of the composite, or discontinuous in short lengths. They may be aligned so that they are all in the same direction, so giving directionality to the properties, or randomly orientated.
For continuous fibres:
composite strength = <7£/V + <Jm/m, composite modulus^isfff + Zfm/m,
where af = stress on fibres, am = stress on matrix, /> = fraction of composite cross-section fibre, fm = fraction matrix, £> = tensile modulus of fibres, £"m = tensile modulus of matrix.
For discontinuous fibres the composite strength is given by the same equation but with the σ( term replaced by an average stress term.
Average stress = afu(l -L C /2L) ,
where afU = the maximum strength of the fibres, i.e. tensile strength, L = length of fibres and Lc is the critical length of the fibres. Provided the fibre length is equal to or greater than the critical length, the stress reaches the maximum value possible in the fibre. The critical length is given by
critical length = a(UD/2Tt

170
where rm = the shear strength of the matrix, Ό- diameter of the fibres.
See Properties of fibre reinforced materials and Properties of wood.
Particle reinforced materials
Particle reinforced materials have particles of 1 μπι or more in diameter dispersed throughout a matrix, the particles often accoun-ting for a quarter to a half, or even more, of the total volume of the composite. Many polymeric materials incorporate fillers, the effect of the filler particles on the properties of the matrix material being generally to increase the tensile modulus, the tensile strength and impact resistance, reduce creep and thermal expansivity, and lower the overall cost of the material, since the polymer costs more than the filler.
The addition of spherical carbon black particles to rubbers is used to, amongst other things, improve the tensile modulus. The tensile modulus of the composite rubber is related to the modulus of the unfilled rubber E by
omposite modulus = E( 1+ 2.5/+14.1/2)
where/is the volume fraction of the composite that is carbon.
The toughness of some polymers can be increased by incorporating fine rubber particles in the polymer matrix. For example, polystyrene is toughened by polybutadiene to give a product referred to as high-impact polystyrene (HIPS). Styrene-acrylonitrile is toughened with polybutadiene or styrene-butadiene copolymer to give acrylonitrile-butadiene-styrene terpolymer (ABS). The rubber has a lower tensile modulus than the matrix material and the net result is a lowering of the tensile modulus and tensile strength but much greater elongations before breaking, hence the improvement in toughness.
Cermets are composites involving ceramic particles in a matrix of metal. The ceramics have a high strength, high tensile modulus, high hardness, but are brittle. By comparison, the metals are weaker and less stiff, but ductile. The resulting composite is strong, hard and relatively tough. See Chapter 10 and bonded ceramics for more details of this type of material.
Dispersion strengthened metals
The strength of a metal can be increased by small particles dispersed throughout it. One way of doing this is solution treatment followed by precipitation hardening. Such treatments are used with, for example, maraging steels (see Chapter 3) and aluminium alloys (see Chapter 4).
Another way of introducing a dispersion of small particles throughout a metal, involves sintering. This process involves compacting a powdered metal powder in a die and then heating it to a temperature high enough to knit together the particles in the powder. If this is done with aluminium, the result is a fine disper-sion of aluminium oxide, about 10%, throughout an aluminium matrix.

171
11.2 Properties Properties of fibre reinforced materials
Table 11.1 shows the properties of commonly used fibres and whiskers. Whiskers differ from fibres in that they are grown as single crystals, rather than being polycrystalline as are fibres. Table 11.2 shows the properties of some fibre-reinforced materials. Table 11.3 shows some critical length data for discontinuous fibres in a matrix.
Table 11.1 Properties of fibres Fibre Density
(10 <
Glasses E-glass S-glass Silica Polycrystalline materials Alumina Boron Carbon Silicon carbide Whiskers Alumina Boron carbide Graphite Silicon carbide Silicon nitride Metals Molybdenum Steel Tungsten
Table 11.2 Properti Composite
Polymer matrix
» kg m~3)
2.5 2.5 2.2
3.2 2.6 1.8 4.1
3.9 2.5 2.2 3.2 3.2
10.2 7.7
19.3
Tensile modulus
(GPa)
73 86 74
173 414 544 510
1550 450 700 700 380
335 200 345
Tensile strength
(MPa)
2.5 4.6 5.9
2.1 2.8 2.6 2.1
20.8 6.9
20.7 21 7.0
2.2 4.2 2.9
ies of fibre reinforced materials
Epoxy+14% alumina whiskers Epoxy + 35% silicon nitride
whiskers Epoxy + 58% carbon Epoxy + 72% E glass Epoxy + 72% S glass Nylon 66 + 30% glass Polyacetal + 20% glass Polycarbonate + 20% gla ss Polyethylene+ 20% glass Polypropylene + 20% glass Polyester+ 65% E glass Metal matrix Aluminium+ 50% boron Aluminium+ 47% silica Copper+ 50% tungsten Copper+ 77% tungsten Nickel+ 8% boron
Density (W3 kg ;
m~3)
1.6
1.9 1.7 2.2 2.1 1.4 1.6 1.4 1.1 1.1 1.8
2.7
14.1
Tensile modulus
(GPa)
42
105 165 56 66
20
207
262
Tensile strength
(MPa)
800
280 1520 1640 1900 140 75
110 40 40
340
1140 910
1210 1800 2700

172
Nickel+ 40% tungsten
Table 11.3 Critical length data for fibres in a matrix Fibre
Alumina whiskers Boron Boron Carbon Glass Glass Tungsten
Fibre diameter
(Mm)
2 100 100
7 13 13
2000
Matrix
Epoxy Aluminium Epoxy Epoxy Epoxy Polyester Copper
1100
Critical length (mm)
0.5 1.8 3.5 0.2 0.4 0.5 38
Properties of woods
Table 11.4 shows the approximate mechanical properties of common woods.
Table 11.4 Wood
Ash Beech Cedar, red Elm Mahogany Oak Pine (white) Spruce Teak
Propert Density (103kg-m3)
0.58 0.70 0.47 0.50 0.50 0.65 0.36 0.40 0.60
ies of woods £/asf/c modulus
16 14 6 9
12 11 9
11 13
II
0.9 1.1
0.6
0.6
Tensile strength (MPA)
100 100 60 80
100 100 60 70
100
Compressive
51
42 38
49 34 40
strength
|
11
8 6
9 4 5
Note: = = parallel to grain, II = perpendicular to grain.
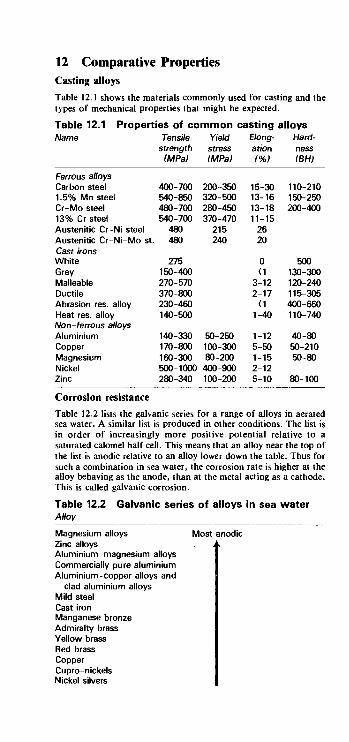
12 Comparative Properties Casting alloys
Table 12.1 shows the materials commonly used for casting and the types of mechanical properties that might be expected.
Table 12.1 Properties of common casting alloys Name Tensile Yield Elong- Hard-
strength stress ation ness (MPa) (MPa) (%) (BH)
Ferrous alloys Carbon steel 1.5% Mn steel Cr-Mo steel 13% Cr steel Austenitic Cr-Ni steel Austenitic Cr-Ni-Mo st Cast irons White Grey Malleable Ductile Abrasion res. alloy Heat res. alloy Non-ferrous alloys Aluminium Copper Magnesium Nickel Zinc
400-700 540-850 480-700 540-700
480 480
275 150-400 270-570 370-800 230-460 140-500
140-330 170-800 160-300 500-1000 280-340
200-350 320-500 280-450 370-470
215 240
50-250 100-300 80-200 400-900 100-200
Corrosion resistance
Table 12.2 lists the galvanic series for a range of alloys in aerated sea water. A similar list is produced in other conditions. The list is in order of increasingly more positive potential relative to a saturated calomel half cell. This means that an alloy near the top of the list is anodic relative to an alloy lower down the table. Thus for such a combination in sea water, the corrosion rate is higher at the alloy behaving as the anode, than at the metal acting as a cathode. This is called galvanic corrosion.
Table 12.2 Galvanic series of alloys in sea water Alloy
Magnesium alloys Most anodic Zinc alloys JL Aluminium-magnesium alloys I Commercially pure aluminium I Aluminium-copper alloys and I
clad aluminium alloys I Mild steel I Cast iron I Manganese bronze I Admiralty brass I Yellow brass I Red brass I Copper I Cupro-nickels I Nickel silvers I
15-30 13-16 13-18 11-15
26 20
0 <1
3-12 2-17
<1 1-40
1-12 5-50 1-15 2-12 5-10
110-210 150-250 200-400
500 130-300 120-240 115-305 400-650 110-740
40-80 50-210 50-80
80-100
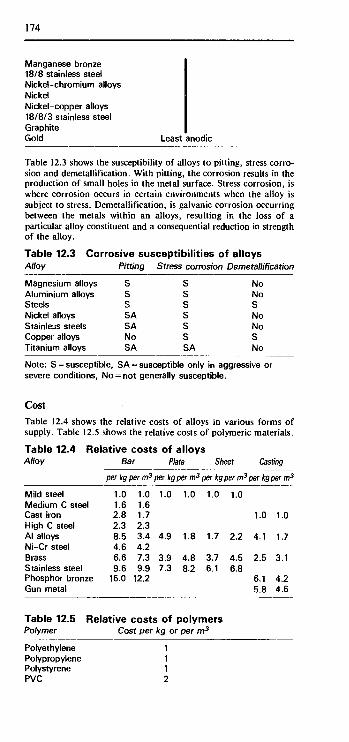
174
Manganese bronze 18/8 stainless steel Nickel-chromium alloys Nickel Nickel-copper alloys 18/8/3 stainless steel Graphite Gold Least anodic
Table 12.3 shows the susceptibility of alloys to pitting, stress corro-sion and demetallification. With pitting, the corrosion results in the production of small holes in the metal surface. Stress corrosion, is where corrosion occurs in certain environments when the alloy is subject to stress. Demetallification, is galvanic corrosion occurring between the metals within an alloys, resulting in the loss of a particular alloy constituent and a consequential reduction in strength of the alloy.
Table 12.3 Corrosive susceptibilities of alloys Alloy Pitting Stress corrosion Demetallification
Magnesium alloys Aluminium alloys Steels Nickel alloys Stainless steels Copper alloys Titanium alloys
S S S SA SA No SA
S S S S S S SA
No No S No No S No
Note: S = susceptible, SA = susceptible only in aggressive or severe conditions, No = not generally susceptible.
Cost
Table 12.4 shows the relative costs of alloys in various forms of supply. Table 12.5 shows the relative costs of polymeric materials.
Table 12.4 Alloy
Mild steel
Relative costs of alloys Bar Plate
per kg per m3 per kg per m3
1.0 Medium C steel 1.6 Cast iron High C steel AI alloys Ni-Cr steel Brass Stainless steel
2.8 2.3 8.5 4.6 6.6 9.6
Phosphor bronze 16.0 Gun metal
Table 12.5 Polymer
Polyethylene Polypropylene Polystyrene PVC
1.0 1.0 1.6 1.7 2.3 3.4 4.9 4.2 7.3 3.9 9.9 7.3
12.2
1.0
1.8
4.8 8.2
Sheet
per kg per m3
1.0
1.7
3.7 6.1
Relative costs of polymers Cost per kg or
1 1 1 2
per m3
1.0
2.2
4.5 6.8
Casting
per kg per m3
1.0 1.0
4.1 1.7
2.5 3.1
6.1 4.2 5.8 4.6

175
ABS Phenolics Acrylics Cellulose acetate Acetals Polycarbonate Nylons Polyurethane PTFE Fluorosilicones
4 4 4 5 5
12 15 20 30 80
Note: compared with the cost per kg of metals, the above data are such that polyethylene is about three times the cost of mild steel. However, compared with the cost per m3, the much lower densities of polymeric materials means that the cost per m3 of polyethylene is about one fifth that of mild steel.
Creep
The high temperature limits of use of many engineering materials is set by creep becoming too pronounced. Table 12.6 gives the approx-imate high temperatures limits, determined by creep, of a range of engineering metals. For polymeric materials, creep is much more pronounced than with metals and can affect the design of a compo-nent at room temperature. Additives markedly affect the creep properties of polymers.
Table 12.6 High temperature limits of metals Metal High temp, limit (°C)
Magnesium alloys Aluminium alloys Coppers Brasses Aluminium bronzes Phosphor bronzes Cupro-nickels Nickel silvers Titanium Titanium, alpha alloys Cast irons Titanium, alpha-beta Titanium, beta alloys Carbon steels Cr-Mo steels 18% Cr-10% Ni steel 25% Cr-20% Ni steel Ni-Cr alloys
75 100 120
150-200 250-400
150 200
150-200 200
250-350 350
350-400 300 450 550 600 750 800
Electrical conductivity
Table 12.7 shows the electrical conductivities of materials which are reasonably good electrical conductors.
Table 12.7 Electrical conductivities Material Conductivity I ACS (%)
Commercially pure AI 60 AI alloys 30-50 Commercially pure Cu 100 Cu alloys 5-50

176
Silver Silver alloys Gold Gold alloys Platinum Platinum alloys Palladium Palladium alloys Carbon steels Stainless steels
100 10-85
75 5-16
16 5
16 5-10
10 3
Mechanical properties
Table 12.8 shows, in a general way, the tensile strength and tensile modulus values for different types of engineering materials. In addi-tion, values of the specific strength and specific modulus are included. The specific strength, is the tensile strength divided by the density and the specific modulus, the tensile modulus divided by the density. Both are significant where weight has to be kept to a minimum, or in considering the relative merits of materials when cost, and hence amount of material, has to be kept to a minimum in a design where a particular strength or stiffness is required.
Table 12.8 Mechanical properties Material Density Tensile Tensile Specific Specific
(103 kg strength modulus strength modulus m3} (MPa) (GPa) (MPa/Mg (GPa/Mg
m~3) m~3)
Metals Low C steels High C steels Mn steel Cr steel Austenitic stainless Ferritic stainless Martensitic stainless A l -Cu alloys A l - M g alloys Brasses Aluminium bronzes Cupro-nickels Nickel silvers Magnesium alloys Ni-Cr alloys Ti alpha-beta alloys Polymers ABS Nylon Polyethylene, HOPE PET Polypropylene PVC, rigid Melamine formaldehyde Phenol formaldehyde Butyl Natural rubber Polychloroprene Composites Epoxy + 72% E glass
7.8 7.8 7.8 7.8 7.8 7.8 7.8 2.7 2.7 8.7 7.6 8.9 8.7 1.8 8.5 4.5
1.1 1.1 1.0 1.3 0.9 1.4 1.5 1.3 0.9 0.9 1.2
2.2
400 850 700 1000 1000 500 900 400 200 200 300 250 180 250 1200 1100
40 75 30 60 35 55 65 45 20 20 25
1640
200 200 200 200 200 200 200 70 70 110 120 135 130 40 220 110
2.2 2.5 0.9 3.2 1.3 3.2 6.7 6.1
56
51 109 90 128 128 64 115 148 74 23 39 28 21 139 141 244
36 68 30 46 39 39 43 35 22 22 21
745
26 26 26 26 26 26 26 26 26 13 16 15 15 22 26 24
2.0 2.3 0.9 2.5 1.4 2.3 4.5 4.7
25

177
Epoxy +58% carbon 1.7 1520 165 894 97 AI+ 50% boron 2.7 1140 207 422 77 Cu +50% tungsten 14.1 1210 262 86 19 Wood: ash 0.6 100 16 167 27
Thermal properties
Table 12.9 shows the approximate values of thermal expansivity, i.e. linear coefficient of thermal expansion, and thermal conductivity of a range of commonly used engineering materials.
Table 12.9 Thermal properties Material Thermal Thermal
> expansivity conductivity (106oC-1) (Wm-1°C-1)
Metals Alloy steels Carbon steels Cast iron, grey Stainless steel, austenitic Stainless steel, ferritic Stainless steel, martensitic Aluminium Aluminium alloys Copper Copper alloys Magnesium alloys Nickel-chromium alloys Titanium alloys Polymers Thermoplastics Thermosets Elastomers Cellular polymers Ceramics Bonded carbides Glasses
12 15 11 16 11 11 24 24 18
16-20 27
11-15 8-9
40-200 10-60
50-250
4-6 0.5-0.9
37 47
53-44 16 26 25
220-230 120-200
370 30-160 80-140 11-12 5-12
0.1-0.3 0.1-0.4 0.1-0.3
0.03
40-120 0.5-1

13 Materials index Elements
Table 13.1 gives the symbols, atomic mass numbers .atomic numbers and density at 20°C of the elements.
Table 13.1 The elements Element Symbol Atomic Atomic Density
mass number (103 kg m~3) number
Actinium Aluminium Americum Antimony Argon Arsenic Astatine Barium Berkelium Beryllium Bismuth Boron Bromine Cadmium Caesium/Cesium Calcium Californium Carbon Cerium Chlorine Chromium Cobalt Copper Curium Dysprosium Einsteinium Erbium Europium Fermium Fluorine Francium Gadolinium Gallium Germanium Gold Hafnium Helium Holmium Hydrogen Indium Iodine Iridium Iron Krypton Lanthanum Lawrencium Lead Lithium Lutetium
Ac AI Am Sb A As At Ba Bk Be Bi B Br Cd Cs Ca Cf C Ce Cl Cr Co Cu Cm Dy Es Er Eu Fm F Fr Gd Ga Ge Au Hf He Ho H In I Ir Fe Kr La Lr Pb Li Lu
227 26.98
243 121.75 39.95 74.92
210 137.34 247
9.01 208.98
10.81 79.91
112.40 132.91 40.08
251 12.01
140.12 35.45 52.00 58.93 63.54
247 162.50 254 167.26 152.0
253 19.00
223 157.25 69.72 72.59
196.97 178.49
4.00 164.93 1.008
114.82 126.90 192.2 55.85 83.8
138.91 257 207.19
6.94 174.97
89 13 95 51 18 33 85 56 97 4
83 5
35 48 55 20 98 6
58 17 24 27 29 96 66 99 68 63
100 9
87 64 31 32 79 72 2
67 1
49 53 77 26 36 57
103 82 3
71
10.1 2.7
11.8 6.7 1.8(g) 5.7
3.6
1.9 9.8 2.5 3.1 8.7 1.9 1.5
2.3 (graphite) 6.8 3.2(g) 7.2 8.9 8.9
8.5
9.1 5.2
1.7(g)
7.9 5.9 5.3
19.3 13.3 0.18(g) 8.8
0.09(g) 7.3 4.9
22.4 7.9 3.7(g) 6.2
11.3 0.53 9.8

Magnesium Manganese Mendelevium Mercury Molybdenum Neodymium Neon Neptunium Nickel Niobium Nitrogen Nobelium Osmium Oxygen Palladium Phosphorus Platinum Plutonium Polonium Potassium Praseodymium Promethium Protactinium Radium Rhenium Rhodium Rubidium Ruthenium Samarium Scandium Selenium Silicon Silver Sodium Strontium Sulphur Tantalum Technetium Tellurium Terbium Thallium Thorium Thulium Tin Titanium Tungsten Uranium Vanadium Xenon Ytterbium Yttrium Zinc Zirconium
Mg Mn Md Hg Mo Nd Ne Np Ni Nb N No Os 0 Pd P Pt Pu Po K Pr Pm Pa Ra Re Rh Rb Ru Sm Sc Se Si Ag Na Sr S Ta Tc Te Tb Tl Th Tm Sn Ti W U V Xe Yb Y Zn Zr
24.31 54.94
256 200.59 95.94
144.24 20.18
237 58.71 92.91
14.007 254
190.2 16.00
106.4 30.97
195.09 242 210 39.10
140.91 147 231 226 186.2 102.91 85.47
101.1 150.35 44.96 78.96 28.09
107.87 22.99 87.62 32.06
180.95 98
127.60 158.92 204.37 232.04 168.93 118.69 47.90
183.85 238.03 50.94
131.30 173.04 88.91 65.37 91.22
12 25
101 80 42 60 10 93 28 41 7
102 76 8
46 15 78 94 84 19 59 61 91 88 75 45 37 44 62 21 34 14 47 11 38 16 73 43 52 65 81 90 69 50 22 74 92 23 54 70 39 30 40
1.7 7.4
13.55 10.2 7.0 0.90(g)
19.5 8.9 8.4 1.25(g)
22.5 1.43(g)
12.0 1.8
21.45 19 9.4 0.86 6.5
5 21.0
12.5 1.5
12.4 7.5 3.1 4.8 2.3
10.5 0.97 2.6 2.1 (yellow)
16.6 11.5 6.2 8.3
11.85 11.5 9.3 7.3 4.5
19.3 19.05 6.1 5.9(g) 7.0 4.5 7.1 6.5
Note: the densities are at 20°C and are for solids unless marked (g) for gas.
179

180
Engineering metals
The following is an alphabetical listing of metals, each being listed according to the main alloying element, with their key characteristics. It is not a comprehensive list of all metallic elements, just those commonly encountered in engineering. Aluminium. Used in commercially pure form and alloyed with copper, manganese, silicon, magnesium, tin and zinc. Alloys exist in two groups: casting alloys and wrought alloys. Some alloys can be heat treated. Aluminium and its alloys have a low density, high electrical and thermal conductivity and excellent corrosion resistance. Tensile strength tends to be of the order of 150 to 400 MPa, with the tensile modulus about 70 GPa. There is a high strength to weight ratio. See Chapter 4. Beryllium. Beryllium metal is very costly and only used in very special circumstances. Beryllium is more often used as an alloying element, in particular with copper, nickel or steels. Beryllium metal has a high tensile strength and tensile modulus, but is very brittle. Chromium. Chromium is mainly used as an alloying element in stainless steels, heat-resistant alloys and high strength alloy steels. It is generally used in these for the corrosion and oxidation resistance it confers on the alloys. Cobalt. Cobalt is widely used as an alloy for magnets, typically 5-35% cobalt with 14-30% nickel, and 6-13% aluminium. Cobalt is also used for alloys which have high strength and hardness at room and high temperatures. These are often referred to as Stellites. Cobalt is also used as an alloying element in steels. Copper. Copper is very widely used in the commercially pure form and alloyed in the form of brasses, bronzes, cupro-nickels, and nickel silvers. Copper and its alloys have good corrosion resistance, high electrical and thermal conductivity, good machinability, can be joined by soldering, brazing and welding, and generally have good properties at low temperatures. The alloys have tensile strengths ranging from about 180 to 300 MPa and a tensile modulus about 20 to 28 GPa. See Chapter 5. Gold. Gold is very ductile and readily cold worked. It has good elec-trical and thermal conductivity. iron. The term ferrous alloys is used for the alloys of iron. These alloys include carbon steels, cast irons, alloy steels and stainless steels. See Chapter 3. Lead. Other than its use in lead storage batteries, it finds a use in lead-tin alloys as a metal solder, and in steels to improve the machinability. Magnesium. Magnesium is used in engineering alloyed mainly with aluminium, zinc, and manganese. The alloys have a very low density and though tensile strengths are only of the order of 250 MPa there is a high strength to weight ratio. The alloys have a low tensile modulus, about 40 GPa. They have good machinability. See Chapter 6. Molybdenum. Molybdenum has a high density, high electrical and thermal conductivity and low thermal expansivity. At high temperatures it oxidizes. It is used for electrodes and support members in electronic tubes and light bulbs, and heating elements for furnaces. Molybdenum is however more widely used as an alloying element in steels. In tool steels it improves hardness, in stainless steels it improves corrosion resistance, and in general in steels it improves strength, toughness and wear resistance. Nickel. Nickel is used as the base metal for a number of alloys with excellent corrosion resistance and strength at high temperatures. The alloys are basically nickel-copper and nickel-chromium-iron. The
181
alloys have tensile strengths between about 350 and 1400 MPa, the tensile modulus being about 220 GPa. See Chapter 7. Niobium. Niobium has a high melting point, good oxidation resistance and low modulus of elasticity. Niobium alloys are used for high temperature items in turbines and missiles. It is used as an alloying element in steels. Palladium. This metal is highly resistant to corrosion. It is alloyed with gold, silver or copper, to give metals which are used mainly for electrical contacts. Platinum. The metal has a high resistance to corrosion, is very ductile and malleable, but expensive. It is widely used in jewellery. Alloyed with elements such as iridium and rhodium, the metal is used in instruments for items requiring a high resistance to corrosion. Silver. Silver has a high thermal and electrical conductivity, and is very soft and ductile. Tantalum. Tantalum is a high melting point, highly acid-resistant, very ductile metal. Tantalum-tungsten alloys have high melting points, high corrosion resistance and high tensile strength. Tin. Tin has a low tensile strength, is fairly soft and can be very easily cut. Tin plate is steel plate coated with tin, the tin conferring good corrosion resistance. Solders are essentially tin alloyed with lead and sometimes antimony. Tin alloyed with copper and antimony gives a material widely used for bearing surfaces. Copper-tin alloys are known as bronzes. Titanium. Titanium as commercially pure or as an alloy has a high strength coupled with a relatively low density. It retains its properties over a wide temperature range and has excellent corrosion resistance. Tensile strengths are typically of the order of 1100 MPa and tensile modulus about 110 GPa. See Chapter 8. Tungsten. This is a dense metal with the highest melting point of any metal (3410°C). It is used for light bulb and electronic tube filaments, electrical contacts, and as an alloying element in steels. As whiskers it is used in many metal-whisker composites. See Chapter 11. Vanadium. This metal is mainly used as an alloying element in steels, e.g. high-speed tool steels. Zinc. Zinc has very good corrosion resistance and hence finds a use as a coating for steel, the product being called galvanised steel. It has a low melting point and hence zinc alloys are used for products such as small toys, cogs, shafts, door handles, etc. produced by die casting. Zinc alloys are generally about 96% zinc with 4% aluminium and small amounts of other elements or 95% zinc with 4% aluminium, 1% copper and small amount of other elements. Such alloys have tensile strength of about 300 MPa, elongations of about 7-10% and hardness of about 90 BH. Zirconium. An important use of this metal is as an alloying element with magnesium and steels. Engineering polymers
The following is an alphabetical listing of the main polymers used in engineering, together with brief notes of their main characteristics. For more details see Chapter 9. Acrylonitrile butadiene styrene (ABS). ABS is a thermoplastic polymer giving a range of opaque materials with good impact resistance, ductility and moderate tensile and compressive strength. It has a reasonable tensile modulus and hence stiffness, with good chemical resistance. Acetals. Acetals, i.e. polyacetals, are thermoplastics with properties

182
and applications similar to those of nylons. A high tensile strength is retained with time in a wide range of environments. They have a high tensile modulus and hence stiffness, high impact resistance and a low coefficient of friction. Ultraviolet radiation causes surface damage. Acrylics. Acrylics are transparent thermoplastics, trade names for such materials including Perspex and Plexiglass. They have high tensile strength and tensile modulus, hence stiffness, good impact resistance and chemical resistance, but a large thermal expansivity. Butadiene acrylonitrile. This is an elastomer, generally referred to as nitrile or Buna-N rubber (NBR). It has excellent resistance to fuels and oils. Butadiene styrene. This is an elastomer and is very widely used as a replacement for natural rubber because of its cheapness. It has good wear and weather resistance, good tensile strength, but poor resilience, poor fatigue strength and low resistance to fuels and oils. Butyl. Butyl, i.e. isobutene-isoprene copolymer, is an elastomer. It is extremely impermeable to gases. CeOulosks. This term encompasses cellulose acetate, cellulose acetate butyrate, cellulose acetate propionate, cellulose nitrate and ethyl cellulose. All are thermoplastics. Cellulose acetate is a transparent material. Additives are required to improve toughness and heat resistance. Cellulose acetate butyrate is similar to cellulose acetate but less temperature sensitive and with a greater impact strength. Cellulose nitrate colours and becomes brittle on exposure to sunlight. It also burns rapidly. Ethyl cellulose it tough and has low flammability. Chlorosulphonated polyethylene. This is an elastomer, trade name Hypalon. It has excellent resistance to ozone with good chemical resistance, fatigue and impact properties. Epoxies. Epoxy resins are, when cured, thermosets. They are frequently used with glass fibres to form composites. Such composites have high strength, of the order of 200-420 MPa, and stiffness, about 21-25 GPa. Ethylene propylene. This is an elastomer. The copolymer form, EPM, and the terpolymer form, EPDM, have very high resistance to oxygen, ozone and heat. Ethylene vinyl acetate. This is an elastomer which has good flex-ibility, impact strength and electrical insulation properties. Fluorocarbons. These are polymers consisting of fluorine attached to carbon chains. See polytetrafluoroethylene. Fluorosilicones. See silicone rubbers. Melamine formaldehyde. This resin, a thermoset, is widely used for impregnating paper to form decorative panels, and as a laminate for table and kitchen unit surfaces. It is also used with fillers for moulding knobs, handles, etc. It has good chemical and water resistance, good colourability and good mechanical strength. Natural rubber. This is an elastomer. It is inferior to synthetic rubbers in oil and solvent resistance and oxidation resistance. It is attacked by ozone. Nylons. The term nylon is used for a range of thermoplastic materials having the chemical name of poly am ides. A numbering system is used to distinguish between the various forms, the most common engineering ones being nylon 6, nylon 66 and nylon 11. Nylons are translucent materials with high tensile strength and of medium stiffness. Additives such as glass fibres are used to increase strength. Nylons have low coefficients of friction, which can be further reduced by suitable additives. For this reason they are widely used for gears and rollers. All nylons absorb water. Phenol formaldehyde. This is a thermoset and is mainly used as a
183
reinforced moulding powder. It is low cost, and has good heat resistance, dimensional stability and water resistance. Polyacetal. See acetals. Polyamides. See nylons. Polycarbonates. Polycarbonates are transparent thermoplastics with high impact strength, high tensile strength, high dimensional stability and good chemical resistance. They are moderately stiff. They have good heat resistance and can be used at temperatures up to 120°C. Polychloroprene. This is an elastomer, usually called neoprene. It has good resistance to oils and good weathering resistance. Polyesters. Two forms are possible, thermoplastics and thermosets. Thermoplastic polyesters have good dimensional stability, excellent electrical resistivity and are tough. They discolour when subject to ultraviolet radiation. Thermoset polyesters are generally used with glass fibres to form composite materials. Polyethylene. Polyethylene, or polythene, is a thermoplastic material. There are two main types: low density (LDPE) which has a branched polymer chain structure and high density (HDPE) with linear chains. Materials composed of blends of the two forms are available. LDPE has a fairly low tensile strength and tensile modulus, with HDPE being stronger and stiff er. Both forms have good impermeability to gases and very low absorption rates for water. Polyethylene terephthalate (PET). This is a thermoplastic polyester. It has good strength and stiffness, is transparent and has good impermeability to gases. It is widely used as bottles for fizzy drinks. Polypropylene. Polypropylene is a thermoplastic material with a low density, reasonable tensile strength and stiffness. Its properties are similar to those of polyethylene. Additives are used to modify the properties. Polypropylene oxide. This is an elastomer with excellent impact and tear strengths, good resilience and good mechanical properties. Polystyrene. Polystyrene is a transparent thermoplastic. It has moderate tensile strength, reasonable stiffness, but is fairly brittle and exposure to sunlight results in yellowing. It is attacked by many solvents. Toughened grades, produced by blending with rubber, have better impact properties. Polysulphide. This is an elastomer with excellent resistance to oils and solvents, and low permeability to gases. It can however be attacked by micro-organisms. Polysulphone. This is a strong, comparatively stiff, thermoplastic which can be used to a comparatively high temperature. It has good dimensional stability and low creep. Polytetrafluoroethylene (PTFE). PTFE is a tough and flexible ther-moplastic which can be used over a very wide temperature range. Because other materials will not bond with it, the material is used as a coating to items where non-stick facilities are required. Polyvinyls. Polyvinyls are thermoplastics and include polyvinyl acetate, polyvinyl butyral, polyvinyl chloride (PVC), chlorinated polyvinyl chloride and vinyl copolymers. Polyvinyl acetate (PVA) is widely used in adhesives and paints. Polyvinyl butyral (PVB) is mainly used as a coating material or adhesive. PVC has high strength and stiffness, being a rigid material. It is frequently combined with plasticizers to give a lower strength, less rigid, material. Chlorinated PVC is hard and rigid with excellent chemical and heat resistance. Vinyl copolymers can give a range of properties according to the constituents and their ratio. A common copolymer is vinyl chloride with vinyl acetate in the ratio 85 to 15. This is a rigid material. A more flexible form has the ratio 95 to 5. Silicone rubbers. Silicone rubbers or, as they are frequently called,

184
fluorosilicone rubbers, have good resistance to oils, fuels and solvents at high and low temperatures. They do, however, have poor abrasion resistance. Styrene-butadiene-styrene. This is called a thermoplastic rubber. Its' properties are controlled by the ratio of styrene to butadiene. The properties are comparable to those of natural rubber. Urea formaldehyde. This is a thermosetting material and has similar applications to melamine formaldehyde. Surface hardness is very good. The resin is also used as an adhesive.
Engineering ceramics
The term ceramics covers a wide range of materials and here only a few of the more commonly used engineering ceramics are considered. See Chapter 10 for more details. Alumina. Alumina, ie. aluminium oxide, is a ceramic which finds a wide variety of uses. It has excellent electrical insulation properties and resistance to hostile environments. Combined with silica it is used as refractory bricks. Boron. Boron fibres are used as reinforcement in composites with materials such as nickel. See Chapter 11. Boron nitride. This ceramic is used äs an electric insulator. Carbides. A major use of ceramics is, when bonded with a metal binder to form a composite material, as cemented tips for tools. These are generally referred to as bonded carbides, the ceramics used being generally carbides of chromium, tantalum, titanium and tungsten. See bonded carbides in Chapter 10. Chromium carbide. See carbides. Chromium oxide. This ceramic is used as a wear resistant coating. Glasses. The basic ingredient of most glasses is silica, a ceramic. Glasses tend to have low ductility, a tensile strength which is markedly affected by microscopic defects and surface scratches, low thermal expansivity and conductivity (and hence poor resistance to thermal shock), good resistance to chemicals and good electrical insulation properties. Glass fibres are frequently used in composites with polymeric materials. See Chapter 11. Kaolinite. This ceramic is a mixture of aluminium and silicon oxides, being a clay. Magnesia. Magnesia, ie. magnesium oxide, is a ceramic and is used to produce a brick called a dolomite refractory. Pyrex. This is a heat resistant glass, being made with silica, limestone and boric oxide. See glasses. Silica. Silica forms the basis of a large variety of ceramics. It is, for example, combined with alumina to form refractory bricks and with magnesium ions to form asbestos. It is the basis of most glasses. Silicon nitride. This ceramic is used as the fibre in reinforced materials, such as epoxies. See Chapter 11. Soda glass. This is the common window glass, being made from a mixture of silica, limestone and soda ash. See glasses. Tantalum carbide. See carbides. Titanium carbide. See carbides. Tungsten carbide. See carbides.

Appendix: Units The following are conversion factors, used in changing units from one system to another, for some of the more common quantities specified in the properties of materials. Energy
The units used generally for energy, in connection, for example, with impact energies, are the joule (J) and the foot pound-force (ft lbf), with this latter unit sometimes just written as ft lb.
1 J = 0.74 ft lbf 1 ft lbf = 1.36 J.
Tables A.l and A.2 show conversions between the energy units for typical values encountered in impact tests. Table A.1 Energy units (ft lbf to J) ft lbf J
10 14 20 27 30 41 40 54 50 68 60 82 70 95 80 109 90 122 100 136
Table A.2 Energy units (J to ft lbf) J ft lbf
10 7 20 15 30 22 40 30 50 37 60 44 70 52 80 59 90 67 100 74
Hardness Table A.3 shows the approximate relationship between the main hardness scales when used with steels, Table A.4 when used with non-ferrous alloys. Table A.3 Hardness scales for steels Brinell 3000 kg 10 mm ball
615 585 550 512 471 425
Rockwell Scale
A
81.3 80.0 78.6 77.0 75.3 73.3
C
60.1 57.8 55.2 52.3 49.1 45.3
Vickers diamond pyramid
700 650 600 550 500 450
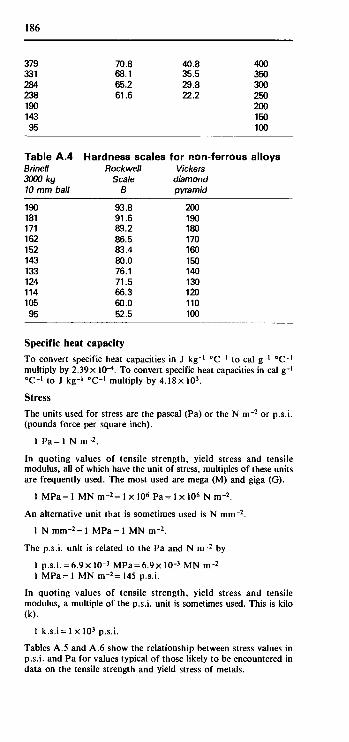
186
379 331 284 238 190 143 95
70.8 68.1 65.2 61.6
40.8 35.5 29.8 22.2
400 350 300 250 200 150 100
Table A.4 Hardness scales for non-ferrous alloys Brinell Rockwell Vickers 3000 kg Scale diamond 10 mm ball B pyramid
190 181 171 162 152 143 133 124 114 105 95
93.8 91.6 89.2 86.5 83.4 80.0 76.1 71.5 66.3 60.0 52.5
200 190 180 170 160 150 140 130 120 110 100
Specific heat capacity
To convert specific heat capacities in J kg-1 °C_1 to cal g_1 °C_I
multiply by 2.39 x 10⁻⁴. To convert specific heat capacities in cal g_1
0C-» to J kg-' °C- ' multiply by 4.18x 10³.
Stress
The units used for stress are the pascal (Pa) or the N m - 2 or p.s.i. (pounds force per square inch).
1 P a = l N m-2.
In quoting values of tensile strength, yield stress and tensile modulus, all of which have the unit of stress, multiples of these units are frequently used. The most used are mega (M) and giga (G).
1 MPa= 1 MN m-2= 1 x 10⁶ Pa= 1 x 10⁶ N m"2.
An alternative unit that is sometimes used is N mm- 2.
1 N mm-2= 1 MPa = 1 MN m' 2 .
The p.s.i. unit is related to the Pa and N m - 2 by
1 p.s.i. = 6.9xlO"3 MPa = 6.9xlO"3 MN m~2
1 M P a = l MN m~2= 145 p.s.i.
In quoting values of tensile strength, yield stress and tensile modulus, a multiple of the p.s.i. unit is sometimes used. This is kilo 00.
1 k.s.i= 1 x 10³ p.s.i.
Tables A.5 and A.6 show the relationship between stress values in p.s.i. and Pa for values typical of those likely to be encountered in data on the tensile strength and yield stress of metals.
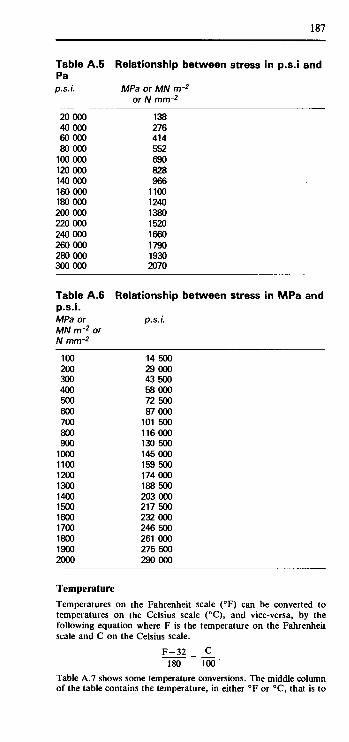
187
Table A.5 Relationship between stress in p.s.i and Pa p.s.i. MPa or MN m~2
or N mm~2
20 000 40 000 60 000 80 000 100 000 120 000 140 000 160 000 180 000 200 000 220 000 240 000 260 000 280 000 300 000
138 276 414 552 690 828 966 1100 1240 1380 1520 1660 1790 1930 2070
Table A.6 Relationship between stress in MPa and p.s.i. MPa or p.s.i. MN m~2 or N mm~2
100 200 300 400 500 600 700 800 900 1000 1100 1200 1300 1400 1500 1600 1700 1800 1900 2000
14 500 29000 43 500 58 000 72 500 87 000 101 500 116 000 130 500 145 000 159 500 174 000 188 500 203 000 217 500 232 000 246 500 261 000 275 500 290 000
Temperature
Temperatures on the Fahrenheit scale (°F) can be converted to temperatures on the Celsius scale (°C), and vice-versa, by the following equation where F is the temperature on the Fahrenheit scale and C on the Celsius scale.
F - 3 2 = _C_ 180 100'
Table A.7 shows some temperature conversions. The middle column of the table contains the temperature, in either °F or °C, that is to

188
be converted. The left hand column shows the conversion into temperatures on the scale in °F and the right hand column in °C. The data are all to three significant figures.
Table A.7 °F
68 122 212 302 392 482 572 752 932 1110 1290 1470 1650 1830 2010 2190 2370 2550 2730 2912 3092 3272
Temperature
20 50 100 150 200 250 300 400 500 600 700 800 900 1000 1100 1200 1300 1400 1500 1600 1700 1800
conversions °C
-6.7 10.0 37.8 65.6 93.3 121 149 204 260 316 371 427 482 338 593 649 704 760 815 871 927 982
Thermal conductivity
To convert thermal conductivities in W m_l °C_1 to cal cm-1 °C~' s-1 multiply by 2.39 x 10⁻³. To convert thermal conductivities in cal cm-1 °C"1 s-1 to W m-1 °C-1 multiply by 4.18 x 10"2.

Index This index does not list all the terms used - for these the reader is referred to Chapter 1 where there is an alphabetical listing. The index also does not list all the various forms of alloys and polymers, only the main categories are listed. For full details the reader is referred to Chapter 13 where each commonly-used metal and polymer, in alphabetical order, is briefly discussed and to the chapters specifically concerned with polymers or the metal.
Aging, defined, 1 Alloy steels, 22 Aluminium alloys, 64 Aluminium bronzes, 88 Aluminium-copper, equilibrium diagram, 66 Aluminium-magnesium, equilibrium diagram, 66 Aluminium-silicon equilibrium diagram, 65 Annealing:
aluminium alloys, 71 copper alloys, 96 defined, 1 ferrous alloys, 38 magnesium alloys, 115 nickel, 125 titanium alloys, 132
Anodizing, defined, 1 Austempering, defined, 1 Austenitizing, defined, 1
Bend tests, 1, 11 Beryllium bronzes, 88 Brasses, 87 Brazing, copper alloys, 98 Brinell test, 1, 13 Bronzes, 88
Carbon steels, 22 Carburizing, defined, 2 Case hardening:
defined, 2 ferrous alloys, 40
Cast irons, 23 Casting alloys, comparisons, 173 Ceramics, 162 Charpy test, 2, 16 Chemical properties, polymers, 148 Coding system:
aluminium cast alloys, 67 aluminium temper, 68 aluminium wrought alloys, 67 bonded carbides, 162 carbon steels, 25 cast irons, 25 copper alloys, 89 copper temper, 91 magnesium alloys, 115 magnesium temper, 116 nickel alloys, 123 polymers, 147 stainless steels, 26

190
steels: American, 26 steels: British, 28 titanium, 153 tool steels, 30
Composites, 167 Composition of:
alloy steels, 31 aluminium alloys, 70 carbon steels, 31 cast irons, 31 copper alloys, 92 free cutting steels, 35 magnesium alloys, 115 maraging steels, 36 nickel alloys, 124 polymers, 147 stainless steels, 36 titanium alloys, 132 tool steels, 37
Copper alloys, 84 Copper-aluminium equilibrium diagram, 86 Copper-beryllium equilibrium diagram, 87 Copper-nickel equilibrium diagram, 87 Copper-silicon equilibrium diagram, 86 Copper-tin equilibrium diagram, 85 Copper-zinc equilibrium diagram, 85 Corrosion resistance, comparisons, 173 Cost, comparisons, 174 Creep:
comparisons, 175 defined, 2
Creep modulus, defined, 2 Creep properties:
copper alloys, 98 ferrous alloys, 42 nickel alloys, 127 polymers, 149 titanium alloys, 135
Creep strength, defined, 2 Creep tests, 11 Cupronickels, 89
Density: aluminium alloys, 73 ceramics, 165 copper alloys, 98 ferrous alloys, 42 magnesium alloys, 119 nickel alloys, 127 polymers, 150 titanium alloys, 135
Dispersion strengthened materials, 170
Elastomers, 141 Electrical conductivity, defined, 3 Electrical properties:
aluminium alloys, 73 ceramics, 165 comparisons, 175 copper alloys, 98

ferrous alloys, 42 magnesium alloys, 119 nickel alloys, 128 polymers, 151 titanium alloys, 135
Electrical resistivity, defined, 3 Elements, 178 Endurance limit, defined, 3 Energy, units, 185 Equilibrium diagram:
aluminium-copper, 66 aluminium-magnesium, 66 aluminium-silicon, 65 copper-aluminium, 86 copper-beryllium, 87 copper-nickel, 87 copper-silicon, 86 copper-tin, 85 copper-zinc, 85 defined ,3 silica-alumina, 163
Expansivity: defined, 4 see also Thermal properties
Fabrication properties, aluminium alloys, 75 Fatigue limit, defined, 4 Fatigue properties:
aluminium alloys, 76 copper alloys, 98 ferrous alloys, 43 magnesium alloys, 119 nickel alloys, 128 titanium alloys, 135
Fatigue strength, defined, 4 Fatigue tests, 11 Ferrous alloys, 22 Fibre reinforced materials, 169 Forms of aluminium alloys, 81 Forms of copper alloys, 106 Forms of magnesium alloys, 121 Forms of nickel alloys, 130 Forms of titanium alloys 138 Fracture toughness:
defined, 4 polymers, 152 titanium alloys, 135
Free cutting steels, 24
Glass transition temperature: defined, 4 polymers, 152
Glasses, 162
Hardenability, defined, 4 Hardenability tests, 12 Hardness:
aluminium, 78 copper alloys, 99 ferrous alloys, 43
191

192
magnesium, 119 polymers, 153 scales, 16, 185 titanium alloys, 136
Hardness measurement, 13 Heat treatment:
aluminium alloys, 71 copper alloys, 96 ferrous alloys, 38 magnesium alloys, 116 nickel alloys, 126 titanium alloys, 133
Impact properties: copper alloys, 99 ferrous alloys, 43 polymers, 153 titanium alloys, 136
Impact tests, 16 Isochronous stress-strain graph, see creep modulus
Jominy test, see hardenabihty tests
Machinability: aluminium alloys, 76 copper alloys, 99 defined, 5 ferrous alloys, 43 titanium alloys, 136
Magnesium alloys, 115 Maraging steels, 24 Mechanical properties:
aluminium alloys, 76 bonded carbides, 165 carbon steels, 46 cast irons, 48 ceramics, 165 comparisons, 176 copper alloys, 99 free cutting steels, 51 glasses, 166 magnesium alloys, 119 maraging steels, 52 nickel alloys, 128 polymers, 154 stainless steels, 52 titanium alloys, 137
Moh scale, 5, 16
Nickel alloys, 123 Nickel silvers, 89 Nitriding:
defined, 5 ferrous alloys, 40
Normalizing: defined, 5 see also Heat treatment
Optical properties, polymers, 155 Oxidation resistance:
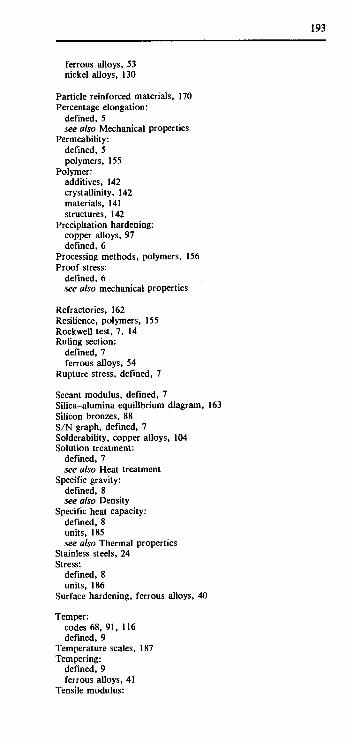
ferrous alloys, 53 nickel alloys, 130
Particle reinforced materials, 170 Percentage elongation:
defined, 5 see also Mechanical properties
Permeability: defined, 5 polymers, 155
Polymer: additives, 142 crystallinity, 142 materials, 141 structures, 142
Precipitation hardening: copper alloys, 97 defined, 6
Processing methods, polymers, 156 Proof stress:
defined, 6 see also mechanical properties
Refractories, 162 Resilience, polymers, 155 Rockwell test, 7, 14 Ruling section:
defined, 7 ferrous alloys, 54
Rupture stress, defined, 7
Secant modulus, defined, 7 Silica-alumina equilibrium diagram, 163 Silicon bronzes, 88 S/N graph, defined, 7 Solderability, copper alloys, 104 Solution treatment:
defined, 7 see also Heat treatment
Specific gravity: defined, 8 see also Density
Specific heat capacity: defined, 8 units, 185 see also Thermal properties
Stainless steels, 24 Stress:
defined, 8 units, 186
Surface hardening, ferrous alloys, 40
Temper: codes 68, 91, 116 defined, 9
Temperature scales, 187 Tempering:
defined, 9 ferrous alloys, 41
Tensile modulus:
193
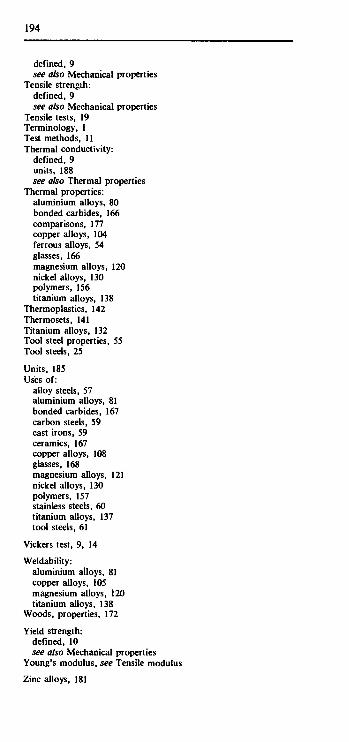
194
defined, 9 see also Mechanical properties
Tensile strength: defined, 9 see also Mechanical properties
Tensile tests, 19 Terminology, 1 Test methods, 11 Thermal conductivity:
defined, 9 units, 188 see also Thermal properties
Thermal properties: aluminium alloys, 80 bonded carbides, 166 comparisons, 177 copper alloys, 104 ferrous alloys, 54 glasses, 166 magnesium alloys, 120 nickel alloys, 130 polymers, 156 titanium alloys, 138
Thermoplastics, 142 Thermosets, 141 Titanium alloys, 132 Tool steel properties, 55 Tool steels, 25
Units, 185 Uses of:
alloy steels, 57 aluminium alloys, 81 bonded carbides, 167 carbon steels, 59 cast irons, 59 ceramics, 167 copper alloys, 108 glasses, 168 magnesium alloys, 121 nickel alloys, 130 polymers, 157 stainless steels, 60 titanium alloys, 137 tool steels, 61
Vickers test, 9, 14
Weldability: aluminium alloys, 81 copper alloys, 105 magnesium alloys, 120 titanium alloys, 138
Woods, properties, 172
Yield strength: defined, 10 see also Mechanical properties
Young's modulus, see Tensile modulus
Zinc alloys, 181
Related Documents