Engineering Management Tidbits! © Washington State University- 2014 1 [email protected] http://etm.wsu.edu/ James R. Holt, Ph.D., PE Professor Engineering Management Buffer Management in Projects A Game using Critical Chain Project Management. View this documen t in Slide- Show mode.

Engineering Management Tidbits! © Washington State University-20141 [email protected] James R. Holt, Ph.D., PE Professor Engineering Management.
Dec 14, 2015
Welcome message from author
This document is posted to help you gain knowledge. Please leave a comment to let me know what you think about it! Share it to your friends and learn new things together.
Transcript

Engineering Management Tidbits!
© Washington State University-2014 1
[email protected]://etm.wsu.edu/
James R. Holt, Ph.D., PEProfessor
Engineering Management
Buffer Management in Projects
A Game using Critical Chain Project Management.
View this document in Slide- Show mode.

Preparations for Game Director:
2
Printing Sheets for Manual CCPM Buffer Management Game Print pages 13-16 on card stock (one set per team).-- One slide is the initial project (before CCPM leveling)-- One slide is the Tasks sized at 1” per week with some too-long buffers they can cut to size.-- One slide is a Percent Calculator sheet (so you don’t need calculators)-- One slide is the Fever Chart for tracking the Buffer Status of projects over time. Give each team a pair of scissors so they can cut out their own pieces from slide 14.Use 1” square grid Easel Paper to arrange the projects.You will need some tape to stick down the buffers (there rest of the tasks will move during simulation).
Note: There is a second, small project at the end (slides 18-19) if you want another example (though more difficult to schedule) to schedule before or after your larger project. There are Extra Buffer strips at slide 20.

3
Project BufferFeeder Buffer
-80 -75 -70 -65 -60 -55 -50 -45 -40 -35 -30 -25 -20 -15 -10 -5 0
A315
A210
C315
A15
B210
B310
A410
A510
A615
B45
C410
D320
D45
C75
C615
Project Complete
Original Project(Before CCPM Leveling)
The times are already Aggressive (50% estimates).
Days 0 5 10 15 20 25 30 35 40 45 50 55 60 65 70 75
Weeks 0 1 2 3 4 5 6 7 8 9 10 11 12 13 14 15
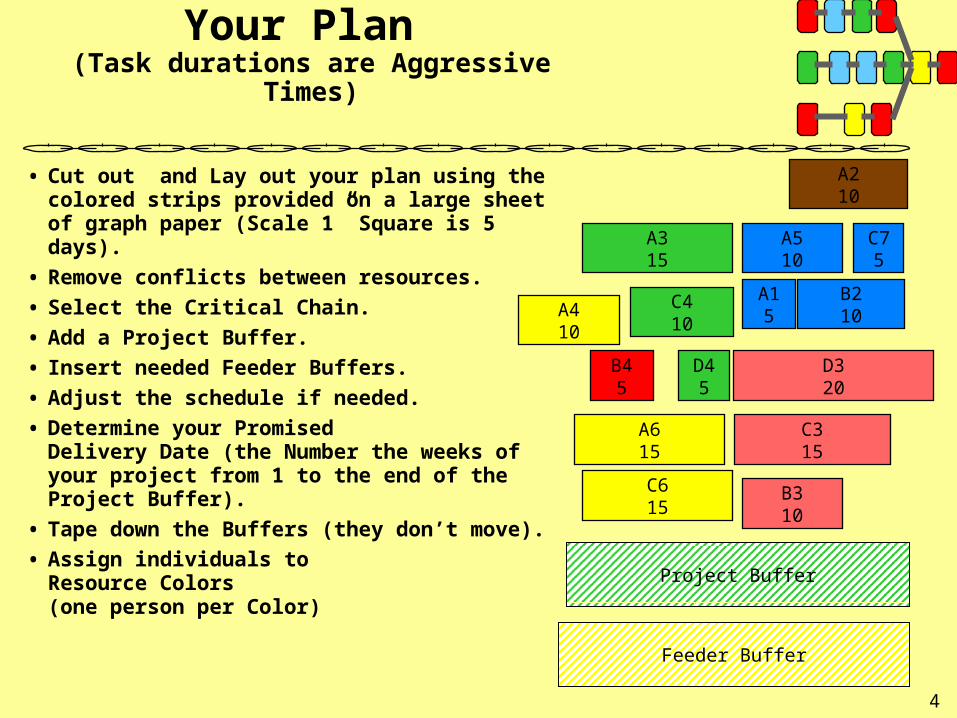
Your Plan (Task durations are Aggressive Times)
• Cut out and Lay out your plan using the colored strips provided on a large sheet of graph paper (Scale 1” Square is 5 days).
• Remove conflicts between resources.
• Select the Critical Chain.
• Add a Project Buffer.
• Insert needed Feeder Buffers.
• Adjust the schedule if needed.
• Determine your Promised Delivery Date (the Number the weeks of your project from 1 to the end of the Project Buffer).
• Tape down the Buffers (they don’t move).
• Assign individuals to Resource Colors (one person per Color)
4
A315
C410
D45
A15
B210
A510
C75
C315
B310
D320
A410
A615
B45
C615
Project Buffer
Feeder Buffer
A210

To play!
5
Each week, Resources which have work will work on their own active tasks.
(A week is 5 days or one square on the paper)
Each Resource can only work on one task at a time. Select the active task for that resources (a task that has all preceding work completed) before starting to roll.
The Resource rolls one fair die once each day (for a maximum of five days per week) to determine if the Task is complete or not during that week (it’s binary, the resource either completes the tasks that week or not). If the Resource rolls a Six during the five day week, one weeks worth of work is completed for the active task. If no Six is rolled after five rolls (by the end of the week) that task slides (moves) to the right one square and pushes any follow-on work ahead – to the right (usually into the Project Buffer).(Note: If the Resource rolls a Six early in the week AND there is currently additional active work for that same Resource immediately available, then that Resource can spend the rest of the week working on a second, or even third task during the same week up to the maximum five rolls per week.)

Management Decisions
6
The goal is to complete your project by the delivery date you promised. Use Buffer Management to determine the best place and time to use your resources.
NOTE:•Your Project Manager has ONE extra Die that can be used to assist any Resource for one week at a time. This is like “Over-Time” for that resource for a week. The extra die can be assigned at the beginning of the week and rolls five times during the week along with the color Resource working overtime that week. The number of sixes rolled by the resource and the extra die are both counted towards completion of that Resource’s Task for that week.•The Project Manager keeps track of the Number of Weeks the Extra Die was used.

7
How the Time Clock Moves Along ….
Project BufferFeeder Buffer
-80 -75 -70 -65 -60 -55 -50 -45 -40 -35 -30 -25 -20 -15 -10 -5 0
A315
A210
C315
A15
B210
B310
A410
A510
A615
B45
C410
D320
D45
C75
C615
Project Complete
Moving TimeLine
End of Week1
End of Week2
End of Week3
End of Week4
End of Week5 …
Each week, move your current Time Line
Days 0 5 10 15 20 25 30 35 40 45 50 55 60 65 70 75
Weeks 0 1 2 3 4 5 6 7 8 9 10 11 12 13 14 15
Feeder Buffer
Note: This is not a good CCPM schedule. It’s just thrown in here to show the movements of time.

8
How the Project Might Look Over the Length of the Project
Project Buffer
A315
A210
A15
B210
B310
A615
B45
D320
C75
Project Complete
Moving TimeLine
Each week, move your current Time Line
Days 0 5 10 15 20 25 30 35 40 120 125 130 135 140 145 150
Weeks 0 1 2 3 4 5 6 7 8 24 25 26 27 28 29 30
Feeder Buffer
FB
Note: This is not a good CCPM schedule. It’s just thrown in here to show the movements of time.
9
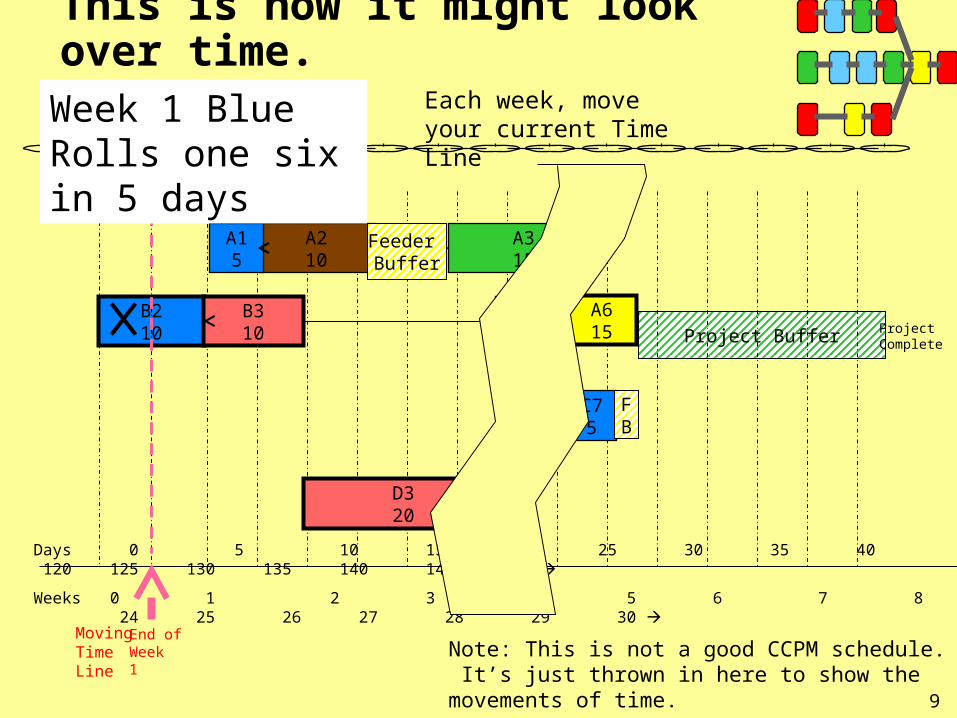
This is how it might look over time.
Project Buffer
A315
A210
A15
B210
B310
A615
B45
D320
C75
Project Complete
Moving TimeLine
End of Week1
Each week, move your current Time Line
Days 0 5 10 15 20 25 30 35 40 120 125 130 135 140 145 150
Weeks 0 1 2 3 4 5 6 7 8 24 25 26 27 28 29 30
Feeder Buffer
FB
Week 1 Blue Rolls one six in 5 days
Note: This is not a good CCPM schedule. It’s just thrown in here to show the movements of time.

10
This is how it might look over time.
Project Buffer
A315
B210
B310
A615
B45
D320
C75
Project Complete
Moving TimeLine
End of Week2
Each week, move your current Time Line
Days 0 5 10 15 20 25 30 35 40 120 125 130 135 140 145 150
Weeks 0 1 2 3 4 5 6 7 8 24 25 26 27 28 29 30
Feeder Buffer
FB
Week 2 Blue Rolls no six in 5 days
A210
A15
Note Feeder Buffer Consumption
Note: This is not a good CCPM schedule. It’s just thrown in here to show the movements of time.

11
This is how it might look over time.
Project Buffer
A315
B210
B310
A615
B45
D320
C75
Project Complete
Moving TimeLine
End of Week3
Each week, move your current Time Line
Days 0 5 10 15 20 25 30 35 40 120 125 130 135 140 145 150
Weeks 0 1 2 3 4 5 6 7 8 24 25 26 27 28 29 30
Feeder Buffer
FB
Week 3 Blue Rolls no six in 5 days
A210
A15
Note Feeder Buffer ConsumptionNote Project Buffer Consumption
Note: This is not a good CCPM schedule. It’s just thrown in here to show the movements of time.
12
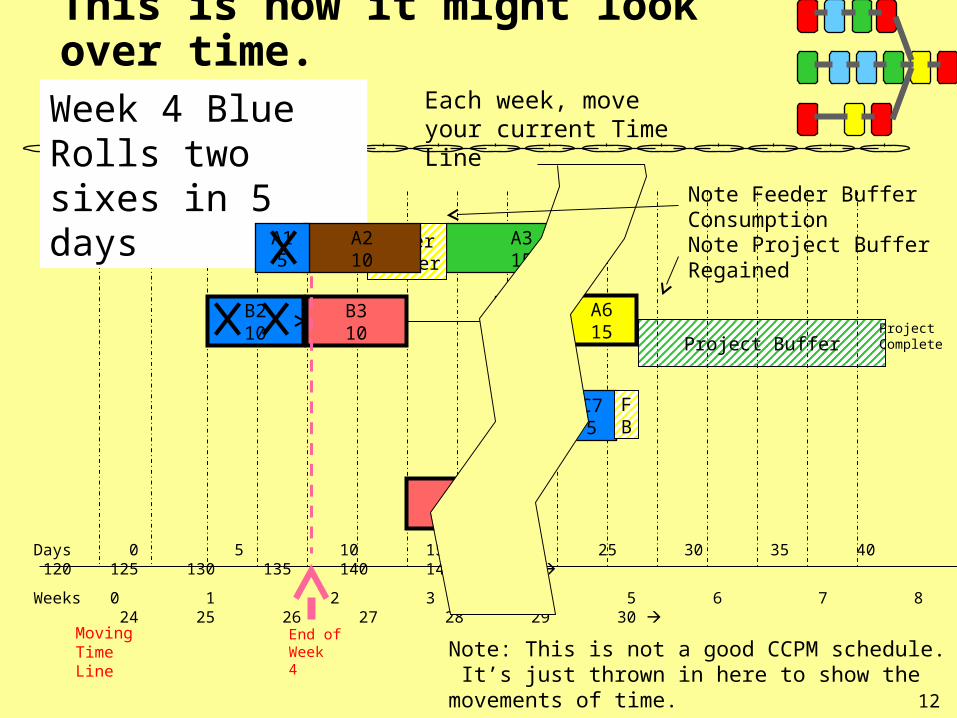
This is how it might look over time.
Project Buffer
A315
B210
B310
A615
B45
D320
C75
Project Complete
Moving TimeLine
End of Week4
Each week, move your current Time Line
Days 0 5 10 15 20 25 30 35 40 120 125 130 135 140 145 150
Weeks 0 1 2 3 4 5 6 7 8 24 25 26 27 28 29 30
Feeder Buffer
FB
Week 4 Blue Rolls two sixes in 5 days
A210
A15
Note Feeder Buffer ConsumptionNote Project Buffer Regained
Note: This is not a good CCPM schedule. It’s just thrown in here to show the movements of time.

13
Project BufferFeeder Buffer
-80 -75 -70 -65 -60 -55 -50 -45 -40 -35 -30 -25 -20 -15 -10 -5 0
A315
A210
C315
A15
B210
B310
A410
A510
A615
B45
C410
D320
D45
C75
C615
Project Complete
Original Project(Before CCPM Leveling)
The times are already Aggressive (50% estimates).
Days 0 5 10 15 20 25 30 35 40 45 50 55 60 65 70 75
Weeks 0 1 2 3 4 5 6 7 8 9 10 11 12 13 14 15

A315
C410
D45
A15
B210
A510
C75
C315
B310
D320
A410
A615
B45
C615
Project Buffer
Feeder Buffer
Feeder Buffer
<--A2
-->A4
<--B2
-->D4
-->A5
-->B4
<--B3
<--C3
-->C6
-->C6
<--D3
<--a5
-->C7
<--C4D4
-->A5
<--A3
-->A6
<--A3B4
-->C4
-->A2
-->B3
<--C6
A210
<--A1
-->A3
Feeder BufferLarge Project
LPLP
LP
LP
LP LP
LP LP
LP
LP LP
LP
LPLP
LP

Percentage Calculation Chart
Weeks 0 1 2 3 4 5 6 7 8 9 10 11 12 13 14 15 16 17 18 19 20Weeks Days 0 5 10 15 20 25 30 35 40 45 50 55 60 65 70 75 80 85 90 95 100
1 5 0100 2 10 0 50 100 3 15 1 33 67100 4 20 2 25 50 75 100 5 25 3 20 40 60 80 100 6 30 4 17 33 50 67 83 100 7 35 5 14 29 43 57 71 86100 8 40 6 13 25 38 50 63 75 88 100 9 45 7 11 22 33 44 56 67 78 89100
10 50 8 10 20 30 40 50 60 70 80 90 100 11 55 9 9 18 27 36 45 55 64 73 82 91100 12 60 10 8 17 25 33 42 50 58 67 75 83 92100 13 65 11 8 15 23 31 38 46 54 62 69 77 85 92 100 14 70 12 7 14 21 29 36 43 50 57 64 71 79 86 93100 15 75 13 7 13 20 27 33 40 47 53 60 67 73 80 87 93100 16 80 14 6 13 19 25 31 38 44 50 56 63 69 75 81 88 94 100 17 85 15 6 12 18 24 29 35 41 47 53 59 65 71 76 82 88 94100 18 90 16 6 11 17 22 28 33 39 44 50 56 61 67 72 78 83 89 94 100 19 95 17 5 11 16 21 26 32 37 42 47 53 58 63 68 74 79 84 89 95 100 20 100 18 5 10 15 20 25 30 35 40 45 50 55 60 65 70 75 80 85 90 95 100
Example: If the Critical Chain time is 80 days and you have completed 50 of the Critical Chain days, then you have completed 63% of the Critical Chain.
Use this row for 80 days.
Example: If the Project Buffer is 40 days, and you have consumed 15 days of Buffer, then you have consumed 38% of your Buffer.
Use this row for 40 days.

Fever Chart

Go!
17
Week 1
Week 2
Week 3
Week 4
Week 5
Week 6
Week 7
Week 8
Week 9
Week 10
Week 11
Week 12
Week 13
Week 14
Week 15
Week 16
Week 17
Week 18
Week 19
Week 20
Week 21
Week 22
Week 23
Week 24
Week 25
Week 26
Week 27
Week 28
Week 29
Week 30
Week 31
Week 32
Week 33
Week 34
Week 35
Week 36
Week 37
Week 38
Week 39
Week 40 (Use this animated slide to keep teams all on the same week).

Small Project
A-215
A-410
C-215
C-45
B-610
E-215
G-215
G-415
F-65
E-45
Project Complete

C-215
F-65
Project Buffer
Feeder Buffer
-->C-4
<--E-4G-4
A-410
-->B-6
Feeder BufferSmall Project
SP
SP
C-45
-->B-6
E-45
-->F-6
E-215
-->E-4
SP
G-415
<--G-2
-->F-6
SP
B-610
<--A-4C-4
A-215
SP
G-215
SP
<--A-2
<--C-2
<--E-2
-->A-4
-->G-4
SP
SP
SP SP

Project Buffer
Project Buffer
Project Buffer
Feeder Buffer
Feeder Buffer
Feeder Buffer
Feeder BufferA few extra Buffer Strips
Related Documents