Quality Approaches in Higher Education Volume 6, No. 2 • August 2015 Editor Elizabeth A. Cudney [email protected] Associate Editors Theodore Allen Jamison V. Kovach Kenneth Reid Cindy P. Veenstra Copy Editor Janet Jacobsen [email protected] Production Administrator Cathy Milquet [email protected] Layout/Design Julie Wagner Sandra Wyss Founding Editor Deborah Hopen ©2015 by ASQ Quality Approaches in Higher Education (ISSN 2161-265X) is a peer-reviewed publication that is published by ASQ’s Education Division, the Global Voice of Quality, and networks on quality in education. e purpose of the journal is to engage the higher education community in a discussion of significant topics related to improving quality and identifying best practices in higher education; and expanding the literature specific to quality in higher education topics. Quality Approaches in Higher Education grants permission to requestors desiring to cite content and/or make copies of articles provided that the journal is cited; for example, Source: Quality Approaches in Higher Education, Year, Vol. xx, (No. xx), http://asq.org/edu/quality-information/journals/ Questions about this publication should be directed to ASQ’s Education Division, Dr. Elizabeth A. Cudney, [email protected]. Publication of any article should not be deemed as an endorsement by ASQ or the ASQ Education Division. The Journal That Connects Quality and Higher Education @asq.org/edu IN THIS ISSUE: Note From the Editor 2 Elizabeth A. Cudney Research and Evaluation Methods Programs in the United States 4 Nancy L. Leech, Franci Crepeau-Hobson, Mark Perkins, and Carolyn A. Haug Grading By Objectives: A Matrix Method for Course Assessment 13 Ido Millet and Suzanne Weinstein Engineering Faculty Perspectives on the Nature of Quality Teaching 20 Jacqueline C. McNeil and Matthew W. Ohland Case Study: Application of DMAIC to Academic Assessment in 31 Higher Education Andrew S. Bargerstock and Sylvia R. Richards Striving for Operational Excellence in Higher Education: A Case Study 41 Implementing Lean for Distance Learning Karen L. Pedersen, Melisa J. Ziegler, and Lacy D. Holt

Welcome message from author
This document is posted to help you gain knowledge. Please leave a comment to let me know what you think about it! Share it to your friends and learn new things together.
Transcript

Quality Approaches in Higher Education Volume 6, No. 2 • August 2015
Editor Elizabeth A. Cudney [email protected]
Associate Editors Theodore Allen Jamison V. Kovach Kenneth Reid Cindy P. Veenstra
Copy Editor Janet Jacobsen [email protected]
Production Administrator Cathy Milquet [email protected]
Layout/Design Julie Wagner Sandra Wyss
Founding Editor Deborah Hopen
©2015 by ASQ
Quality Approaches in Higher Education (ISSN 2161-265X) is a peer-reviewed publication that is published by ASQ’s Education Division, the Global Voice of Quality, and networks on quality in education. The purpose of the journal is to engage the higher education community in a discussion of significant topics related to improving quality and identifying best practices in higher education; and expanding the literature specific to quality in higher education topics.
Quality Approaches in Higher Education grants permission to requestors desiring to cite content and/or make copies of articles provided that the journal is cited; for example, Source: Quality Approaches in Higher Education, Year, Vol. xx, (No. xx), http://asq.org/edu/quality-information/journals/
Questions about this publication should be directed to ASQ’s Education Division, Dr. Elizabeth A. Cudney, [email protected]. Publication of any article should not be deemed as an endorsement by ASQ or the ASQ Education Division.
The Journal That Connects Quality and Higher Education
@asq.org/edu
IN THIS ISSUE:Note From the Editor 2Elizabeth A. Cudney
Research and Evaluation Methods Programs in the United States 4Nancy L. Leech, Franci Crepeau-Hobson, Mark Perkins, and Carolyn A. Haug
Grading By Objectives: A Matrix Method for Course Assessment 13Ido Millet and Suzanne Weinstein
Engineering Faculty Perspectives on the Nature of Quality Teaching 20Jacqueline C. McNeil and Matthew W. Ohland
Case Study: Application of DMAIC to Academic Assessment in 31 Higher EducationAndrew S. Bargerstock and Sylvia R. Richards
Striving for Operational Excellence in Higher Education: A Case Study 41 Implementing Lean for Distance LearningKaren L. Pedersen, Melisa J. Ziegler, and Lacy D. Holt

2 Quality Approaches in Higher Education Vol. 6, No. 2
asq.org/edu
Note From the EditorElizabeth A. Cudney
In the spirit of quality and continuous improvement, the associate editors and reviewers of Quality Approaches in Higher Education (QAHE) continue to strive to utilize quality management principles to improve the journal by streamlining the processes and providing timely and detailed feedback to authors. The main purpose of QAHE is engaging the higher education community in topics related to improving quality, identifying best practices, and expanding the literature specific to quality in higher education. Our goal for the journal is to engender conver-sations that focus on improving educational practices with the use of quality tools throughout the educational experience.
Quality improvement methods are not just applicable in the classroom. These methods can be utilized to improve all aspects of higher education including teach-ing research and evaluation methods, learning outcomes assessment, quality teaching definitions, business process improvements, and training. This issue highlights the breadth of quality improvement applications and best practices in improving all aspects of higher education.
This issue is comprised of five articles that illustrate the breadth of applica-tion. The first article by Nancy Leech, Franci Crepeau-Hobson, Mark Perkins, and Carolyn Haug provides an exploratory study assessing training in research and evaluation methods in graduate-level programs across the United States based on four program components: individual resources such as cognitive skills, program components and features, the micro-environment, and the macro-environment. The next article by Ido Millet and Suzanne Weinstein presents a method to link course objectives to learning outcome assessment efforts in the design of a course. The methodology utilizes an integrated grading technique that weights the learn-ing objectives and classifies them as summative and formative. In the third article, Jacqueline McNeil and Matthew Ohland research how faculty describe quality teaching and the criteria they use to define it. The study employed a survey with open-ended questions and questions related to the inf luence of accreditation, which found that there was not a common understanding of quality teaching among engi-neering faculty. The fourth article by Andrew Bargerstock and Sylvia Richards employed Lean Six Sigma to streamline the process of assessing course outcomes and planning instructional improvements. A structured Lean Six Sigma event focused on the close-the-loop report and achieved a cycle-time reduction of two-thirds and greater compliance rates. The final article by Karen Pedersen, Melisa Ziegler, and Lacy Holt presents a train-the-trainer model for distance education using an indus-try partnership. The approach involved cross-functional teams to drive innovation and engage and empower employees. These articles highlight the breadth at which
Elizabeth A. Cudney
Associate Editors
Theodore Allen, Ph.D., The Ohio State University
Jamison V. Kovach, Ph.D., University of Houston
Kenneth Reid, Ph.D., Virginia Tech
Cindy Veenstra, Ph.D., Veenstra & Associates
Advisory Board
Belinda Chavez, MBA, Honeywell Technical Solutions (Chair, Education Division and QAHE Advisory Board)
Jeffrey E. Froyd, Ph.D., Texas A&M University
Julie Furst-Bowe, Ed.D., Southern Illinois University Edwardsville
Mark Gershon, Ph.D., Temple University
Cathy Hall, Ph.D., East Carolina University
3 Quality Approaches in Higher Education Vol. 6, No. 2
asq.org/edu
Editorial Review Board
Anthony Afful-Dadzie, Ph.D., University of Ghana
Yosef Allam, Ph.D., Embry-Riddle Aeronautical University
Sharnnia Artis, Ph.D., University of California, Irvine
Xuedong (David) Ding, Ph.D., University of Wisconsin-Stout
Julie Furst-Bowe, Ed.D., Southern Illinois University Edwardsville
Richard Galant, Ph.D., Educational Consultant
Cathy Hall, Ph.D., East Carolina University
Noah Kasraie, Ed.D., University of the Incarnate Word
Kathleen Lynch, Ph.D., Walden University
Leonard Perry, Ph.D., University of San Diego
Nicole Radziwill, Ph.D., James Madison University
Philip Strong, Ph.D., Michigan State University
Priyavrat Thareja, Ph.D., Rayat Institute of Engineering & Information Technology
quality approaches can be used to improve curriculum and instruction within col-leges and universities to assess learning outcomes and improve internal processes.
Elizabeth A. Cudney, Ph.D. is an associate professor in the Engineering Management and Systems Engineering Department at Missouri University of Science and Technology. In 2014, Cudney was elected an ASEM Fellow. In 2013, Cudney was elected as an ASQ Fellow. She was inducted into the ASQ International Academy for Quality in 2010. She received the 2008 ASQ A.V. Feigenbaum Medal and the 2006 SME Outstanding Young Manufacturing Engineering Award. Cudney has published five books and more than 45 journal papers. She holds eight ASQ certifications, which include Certified Quality Engineer, Manager of Quality/Operational Excellence, and Six Sigma Black Belt, amongst others. Contact her at [email protected].
Quality Approaches in Higher Education Sponsored by ASQ’s Education Division
Submit an article for our peer-reviewed journal on best practices in higher education.
Visit our website at asq.org/edu/quality-information/journals/ to read the Call for Papers and read Quality Approaches in Higher Education.
2012 International Conference on Software Quality
Shape the Future Through Quality
4 Quality Approaches in Higher Education Vol. 6, No. 2
asq.org/edu
Assessing
graduate-level
training in research
and evaluation
methods
Research and Evaluation Methods Programs in the United StatesNancy L. Leech, Franci Crepeau-Hobson, Mark Perkins, and Carolyn A. Haug
AbstractThis exploratory study utilized both quantitative and qualitative methods to examine the characteristics of research and evaluation methods programs in the United States. A list of universities in the United States was identified through the Carnegie website. Results indicate 45 research and evaluation programs in research-intensive universities, with two completely online programs. Findings from this study provide insight into the current state of graduate-level training within the discipline of research and evaluation methods.
KeywordsGraduate Education, Research and Evaluation Methods, Online Education
IntroductionThere are multiple master’s degrees available for students who wish to increase their edu-
cation past their undergraduate years (Peterson’s, 2014). Obtaining a master’s degree can drastically increase annual earnings, help with changing jobs or occupations, and increase “organizational fit…career satisfaction and performance” (Seibert, Kraimer, Holtom, & Pierotti, 2013, p. 169). Gwirtz (2014) states, “Students have several important decisions to make when considering whether to pursue an advanced degree. Graduate education requires a major commitment of time, money, rigorous course work, and, many times, a research project. In making this decision, the student must take an inventory of their pas-sion and career goals” (p. 241). Unfortunately, not all master’s degrees have the marketing capability to help potential students understand that the degree is available, will help them attain an interesting career, and serve as a viable choice for furthering their education (Lewison & Hawes, 2007).
The Leech (2012) conceptual framework for understanding how to educate knowledge-able and skilled researchers was utilized as a foundation for the current study and is presented in Figure 1. The Leech (2012) framework incorporates three theories/studies (Bozeman, Dietz, & Gaughan, 2001; Levine, 2007; Lovitts, 2005) and outlines four main areas that contribute to educating skilled and knowledgeable researchers: individual resources, the program, micro-environment, and macro-environment. Individual resources, as measured by Bozeman et al. (2001), include aspects of the student, such as his or her motivation and thinking styles. The program incorporates the curriculum, instruction, assessment, and standards. As defined by Lovitts (2005), the micro-environment includes peers, faculty, mentors, location of the school, and the department while the macro-environment includes the culture of graduate education and the culture of the discipline. Each of these areas is important to consider when evaluating graduate programs.
The purpose of this study was to investigate the research and evaluation programs in the United States, including whether they offer online programs, tuition costs, location (e.g., urban, rural, etc.), accreditation type, etc. Specifically, this study will answer the follow-ing overarching research question: What are the characteristics of research and evaluation programs in the United States? The current study provides an in-depth examination into the program component of Leech’s (2012) conceptual framework and addresses the other three areas of the framework with less emphasis.

5 Quality Approaches in Higher Education Vol. 6, No. 2asq.org/edu
The Research and Evaluation Methods (REM) master’s degree is one of the less well-known degrees. In general, REM degree programs provide training in data collection, analysis, interpreta-tion, and presentation of results from the data. These skills allow for the practical application of research and evaluation techniques to real-world problems and the translation of research into prac-tice and policy. After searching Education Resources Information Center (ERIC) through EBSCO, ProQuest, using the Boolean terms “research and evaluation program” and “research and eval-uation methods program,” and, for both searches, narrowing the search to only peer-reviewed documents, just two articles were found. By using Web of Knowledge with the search terms and narrowing the search to only peer-reviewed documents, six arti-cles were found. Unfortunately, but not surprisingly, none of the findings were applicable to increasing understanding of REM
programs. Using the search terms “research master’s program” various articles and sources were found, yet the majority of these articles were focused on other master’s programs, for example, biomedical sciences (Blanck, 2014), English-medium instructed master’s degree programs (Kuroda, 2014), programs in sustain-able development (Vermeulen, Bootsma, & Tijm, 2014), and online biostatistics programs (Shillam, Ho, & Commodore-Mensah, 2014) among others. These articles show there is extant research to better understand master’s programs, but very little research in the area of REM master’s programs.
After searching on Google, one unpublished paper was found. Alban and Hancock (2001) explored doctoral degrees in measurement, statistics, and evaluation methods. The pur-pose of the study was to better understand which programs were quality programs. Using the National Council on Measurement in Education's list of programs in educational measurement (National Council on Measurement in Education, 1998), the
American Psychological Association's (APA) publication, Graduate Study in Psychology (American Psychological
Association, 1998), and Peterson's The Grad Channel now found at Find a graduate school that's right
for you! (Peterson’s, 2015) website, 80 doctoral programs were identified. Eight areas were explored for the years 1995-2000, including the total number of full-time faculty, the total number of full-time students, the num-ber of content courses offered, the average number of assistantships, the number of doctoral degrees conferred, the number of students obtaining a faculty position in a Research I (e.g., research universities with very high research activity) and Research II (e.g., research universities with high research activity) university, the amount of grant funding received, and the number of publications by the faculty. The top 10 pro-grams in each area were delineated. This information is helpful, especially if a poten-tial student is choosing a doctoral program, yet this paper is missing important infor-mation: how prevalent the program is on the Internet (e.g., how difficult it is to find for a prospective student) and whether or not these programs are offered online, a delivery option that is becoming increas-ingly popular.
Online delivery of courses and entire programs of study have been growing for
Macro-environment
Asmeasuredby Bozeman,Dietz, andGaughan (2001)
Culture of graduate education
Micro-environment
Program
Instruction
Individualresources
Skilled andknowledgeable
researcher
Thinking styles
Standards
Peers/other faculty Advisor/mentor
Location Department
Curriculum
Motivation
Assessment
Culture of discipline
Figure 1: Leech’s (2012) Model for Understanding Doctoral Student Success Reprinted with permission.
6 Quality Approaches in Higher Education Vol. 6, No. 2asq.org/edu
the past decade (Russell, 2004). In fact, as early as the 1990s, computers were used for distance education through an online format (Kennedy & Archambault, 2012). According to Jaggars, Edgecombe, and Stacey (2013) the availability of online courses has increased by 29% since 2010. With this proliferation in online education there has been increased discussion of the growing number of institutions that offer programs in an online format (Flowers & Baltzer, 2006). The addition of online courses and programs has been termed “penetration rate” (Allen & Seaman, 2005, p. 5). Parsad, Lewis, and Tice (2008) found in the years 2006-2007, 88% of all public four-year institutions offered courses online or hybrid (e.g., a mix of online and face-to-face), 71% offered at least one online undergraduate degree, and 52% offered at least one online graduate degree. Interestingly, when looking across types of institutions, “the highest penetration rates for each level (associate's, bachelor's, master's, and doctoral) were seen at doctoral institutions” (Flowers & Baltzer, 2006, p. 39). According to Allen and Seaman (2005) in 2004, doctoral institutions had penetration rates of 64% for undergraduate, 79% for graduate, and 74% for continuing education. Programs that are offered only online are much less available. In fact, Allen and Seaman (2005) found that at doctoral institutions, 38% of undergraduate programs, 66% of master’s programs, and 16% of doctoral programs were offered entirely online.
MethodsThis study was a concurrent, equal status, partially-mixed
study (Leech & Onwuegbuzie, 2009) incorporating quantitative and qualitative data seeking to answer the following overarching research question: What are the characteristics of research and evaluation programs in the United States? Specific quantitative research questions included the following: Is there a difference in how many master’s-level and Ph.D.-level research and evaluation programs exist in very high research activity (RU/VH) institu-tions and research universities with high research activity (RU/H)? How many master’s- and Ph.D.-level research and evaluation pro-grams are available online? What are the mean, median, mode, and standard deviations of the number of credits in master’s- and Ph.D.-level research and evaluation programs? The qualitative research question was: How are research and evaluation programs described on the website? As this study did not include collecting data from human subjects, institutional research board approval at the authors’ institution was not required.
ProcedureA list of all 207 RU/VH universities and RU/H institutions
in the United States were identified through the Carnegie web-site (Carnegie Foundation for the Advancement of Teaching,
February, 2012). RU/VH and RU/H institutions must have at least 20 research doctoral degrees and not be a Tribal College or a Special Focus Institution (Carnegie Foundation for the Advancement of Teaching, February, 2012). Each institution’s name was searched using the Google search engine. Once a web-site for the university was found it was searched for the existence of a research and evaluation degree and/or program. Information was then extracted from the website and the data were entered into an Excel spreadsheet. Variables included if there was a master’s degree in research and evaluation and whether it was available online, if a Ph.D. program was available, the school or department that the program resided in, number of credits, cost per credit, and the qualitative description of the programs.
AnalysisThe quantitative data were analyzed with descriptive statis-
tics and chi-square. Assumptions of chi-square were checked. Quantitative data were imported from Excel into IBM SPSS version 22. The qualitative data were analyzed by using NVivo version 9.2.70.0 with constant comparative analysis (Glaser & Strauss, 1967), classical content analysis (Berelson, 1952), and word count (Fielding & Lee, 1998). Constant comparison analy-sis (Glaser & Strauss, 1967) was conducted by reading through the manuscript, developing chunks of the data (e.g., small phrases or sentences), assigning a code to each chunk, and then organiz-ing the codes into themes. Classical content analysis (Berelson, 1952) was conducted by counting the codes that were developed through the constant comparison analysis. Finally, word count (Fielding & Lee, 1998) was conducted by counting the number of words included for each program description.
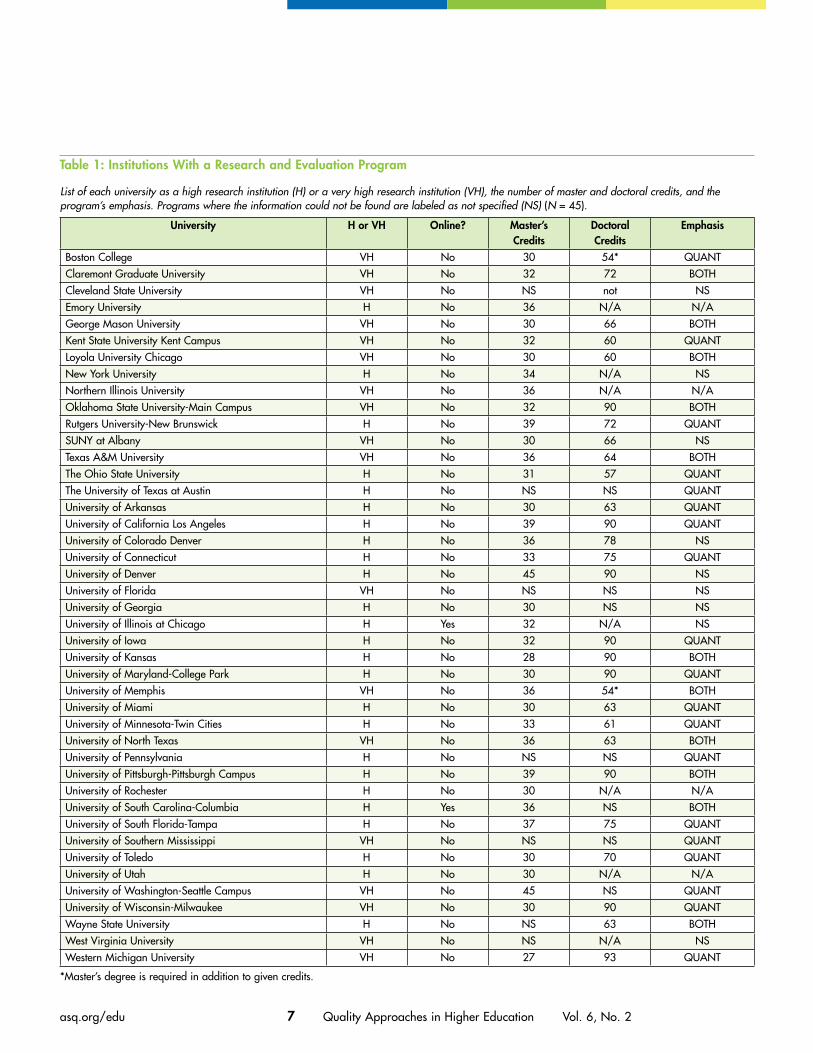
ResultsFrom the 207 universities investigated, a total of 45 research
and evaluation programs were found. Twenty-seven were at RU/H institutions and 18 were housed at RU/VH institutions. Table 1 presents the 45 institutions that house a research and evaluation program. A chi-square test was conducted to answer the first research question of whether there is a difference in how many master’s-level research and evaluation programs exist in RU/VH and RU/H institutions. Assumptions of having at least 80% of the expected frequencies being five or greater was checked and met. No statistically significant difference was found, χ2 = 1.16, df = 1, N = 207, p = .281. Therefore, the num-ber of master’s-level research and evaluation programs was not greater in RU/VH institutions than in RU/H. When looking at the number of research and evaluation programs available online, only two programs were identified: University of South Carolina-Columbia and University of Illinois at Chicago. The
7 Quality Approaches in Higher Education Vol. 6, No. 2asq.org/edu
Table 1: Institutions With a Research and Evaluation Program
List of each university as a high research institution (H) or a very high research institution (VH), the number of master and doctoral credits, and the program’s emphasis. Programs where the information could not be found are labeled as not specified (NS) (N = 45).
University H or VH Online? Master’s Credits
Doctoral Credits
Emphasis
Boston College VH No 30 54* QUANTClaremont Graduate University VH No 32 72 BOTHCleveland State University VH No NS not NSEmory University H No 36 N/A N/AGeorge Mason University VH No 30 66 BOTHKent State University Kent Campus VH No 32 60 QUANTLoyola University Chicago VH No 30 60 BOTHNew York University H No 34 N/A NSNorthern Illinois University VH No 36 N/A N/AOklahoma State University-Main Campus VH No 32 90 BOTHRutgers University-New Brunswick H No 39 72 QUANTSUNY at Albany VH No 30 66 NSTexas A&M University VH No 36 64 BOTHThe Ohio State University H No 31 57 QUANTThe University of Texas at Austin H No NS NS QUANTUniversity of Arkansas H No 30 63 QUANTUniversity of California Los Angeles H No 39 90 QUANTUniversity of Colorado Denver H No 36 78 NSUniversity of Connecticut H No 33 75 QUANTUniversity of Denver H No 45 90 NSUniversity of Florida VH No NS NS NSUniversity of Georgia H No 30 NS NSUniversity of Illinois at Chicago H Yes 32 N/A NSUniversity of Iowa H No 32 90 QUANTUniversity of Kansas H No 28 90 BOTHUniversity of Maryland-College Park H No 30 90 QUANTUniversity of Memphis VH No 36 54* BOTHUniversity of Miami H No 30 63 QUANTUniversity of Minnesota-Twin Cities H No 33 61 QUANTUniversity of North Texas VH No 36 63 BOTHUniversity of Pennsylvania H No NS NS QUANTUniversity of Pittsburgh-Pittsburgh Campus H No 39 90 BOTHUniversity of Rochester H No 30 N/A N/AUniversity of South Carolina-Columbia H Yes 36 NS BOTHUniversity of South Florida-Tampa H No 37 75 QUANTUniversity of Southern Mississippi VH No NS NS QUANTUniversity of Toledo H No 30 70 QUANTUniversity of Utah H No 30 N/A N/AUniversity of Washington-Seattle Campus VH No 45 NS QUANTUniversity of Wisconsin-Milwaukee VH No 30 90 QUANTWayne State University H No NS 63 BOTHWest Virginia University VH No NS N/A NSWestern Michigan University VH No 27 93 QUANT
*Master’s degree is required in addition to given credits.
8 Quality Approaches in Higher Education Vol. 6, No. 2asq.org/edu
third research question: What are the mean, median, mode, and standard deviations of the number of credits in master’s evalu-ation programs, was answered with descriptive statistics. The number of credits ranged from 27 to 45 (M = 33.76, median = 32, mode = 30, SD = 4.43).
The qualitative research question was to investigate how the research and evaluation programs were described on the websites. Three types of analyses were conducted: constant comparative analysis (Glaser & Strauss, 1967), classical con-tent analysis (Berelson, 1952), and word count (Fielding & Lee, 1998). Constant comparative analysis (Glaser & Strauss, 1967) revealed multiple themes. The themes are not presented in any particular order. One theme was the focus on multiple types of methodologies available in the programs including: quantitative and statistical techniques, qualitative, program evaluation, and measurement. For example, the website from Boston College states the following:
[Our program] has been training students to examine edu-cational programs, design quantitative research studies, develop assessment instruments, and analyze educational data to help inform policy-making for over 40 years.
Northern Illinois University’s website included the following when discussing the different methodologies:
Students learn to plan and design educational evaluations, implement and interpret qualitative and statistical data analytic procedures, and relate the findings to educational and social science policy.
Within this theme was the subtheme of how the descrip-tions incorporated information regarding the importance of having both quantitative and qualitative methods. For example, Cleveland State University includes the following statement regarding the importance of including both methodologies:
Particularly in this era of accountability, the program pro-vides students with both qualitative and quantitative skills necessary for data-based decision making.
A second theme focused on the purpose of the program and what the students would be prepared to do after graduation, for example:
The MA prepares individuals to enter careers as analysts, program evaluators, and public service leaders in legisla-tive and executive agencies, policy research organizations, nonprofit organizations, consulting firms, and founda-tions. (Claremont Graduate University)
Similarly, Northern Illinois University’s website includes the following:
[Our program] prepares students for careers as data analysts/statisticians in educational, business, and profes-sional settings, as well as in governmental agencies … as evaluators for school districts, business and professional organizations, culturally based institutions, and military and government agencies.
Other programs focused on preparing students to attend a doctoral program. For example, SUNY at Albany’s website states:
The program is primarily intended for students who plan to take advanced work in statistical methods or educa-tional measurement at the Ph.D. level.
A third theme that emerged from the data was the practical details of the program, including advising, coursework (includ-ing coursework in educational psychology), time in the program or credits required, and the culminating activity. Texas A&M University’s website included the following when discussing the coursework:
… focuses on a broad range of quantitative and meth-odological issues, including multivariate statistics, item response theory, generalizability theory, hierarchical lin-ear modeling, structural equation modeling, time series analysis, growth modeling, and Monte Carlo study.
Some websites included how the students could choose their culminating activity, for example:
Three credits of independent study coursework that is used to complete a thesis/project or to prepare to take the master’s level comprehensive exam. (University of Connecticut)
A fourth emerging theme—tailoring the program to the stu-dent to meet their unique needs and along with faculty being leaders in the field—was delineated.
Each student entering a REMS program has a unique set of interests and experiences. Consequently, programs of study are unique. Beyond Department core requirements … are free to design a unique program of study to meet individual career objectives. All master level students, however, are expected to be knowledgeable in research design, univariate statistical methods and qualitative methods. (University of Georgia)
Similarly, the University of Minnesota-Twin Cities’ website included that they offer:
… a unique course of study to those seeking to inform the decision-making process in a variety of fields, including education, business, and the social services.
9 Quality Approaches in Higher Education Vol. 6, No. 2asq.org/edu
Finally, some programs emphasized the importance of the environmental factors, the focus on diverse populations, and innovative methods and teaching techniques.
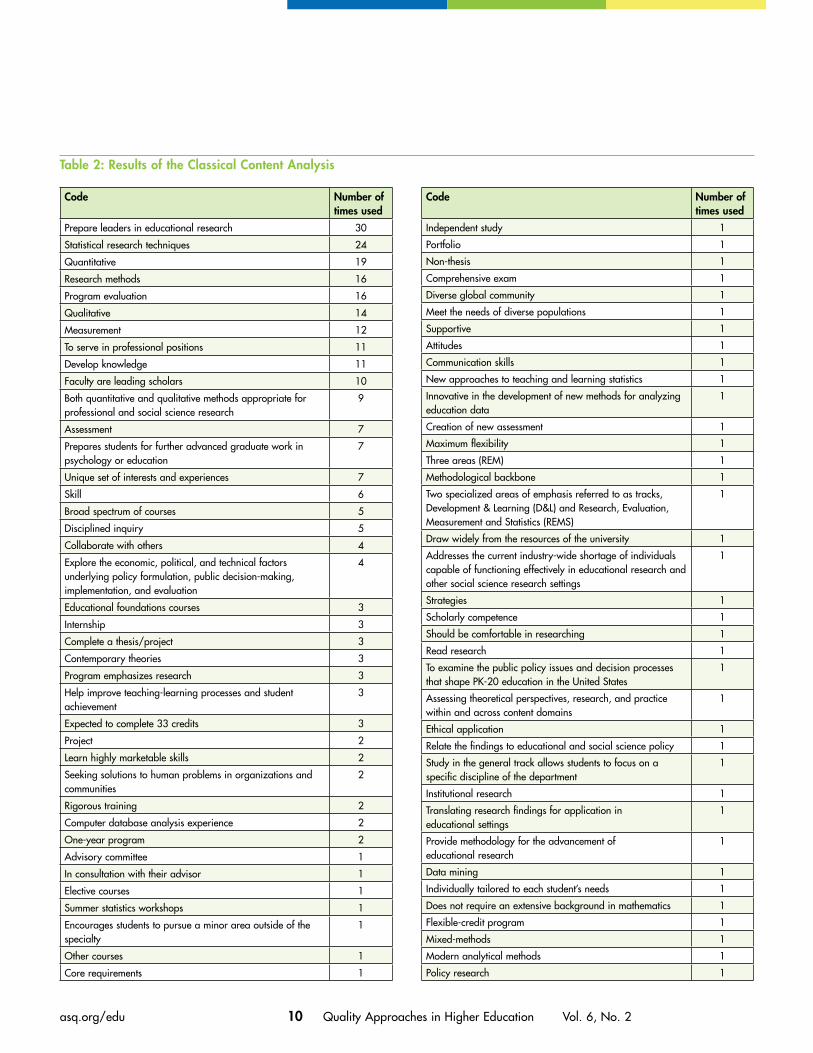
The second qualitative analysis conducted was classical con-tent analysis (Berelson, 1952) which revealed that prepare leaders in education research (n = 30), statistical research techniques (n = 24), quantitative (n = 19), program evaluation (n = 16), research methods (n = 16), qualitative (n = 14), and measurement (n = 12) were the most commonly used codes. Interestingly, the code of mixed methods was used only once. All other counts of codes can be found in Table 2.
Finally, word count (Fielding & Lee, 1998) was conducted to assess the number of words used in each description. The mean number of words used was 74.46, with a median of 71, and a mode of 42 (SD = 36.29). There was a wide range of the number of words used in the descriptions, from a low of 21 to the highest at 175.
DiscussionThis exploratory study utilized both quantitative and qualita-
tive methods to examine the characteristics of REM programs in the United States. The aim of the study was to begin to provide a rich description of graduate training opportunities within this discipline, a current gap in the extant literature. Using the Leech (2012) conceptual framework as a foundation, four areas that contribute to educating skilled and knowledgeable researchers were examined: individual resources such as cognitive skills, pro-gram components and features, the micro-environment, and the macro-environment. Program components from the framework were investigated in depth.
Findings from this study add to the extant literature by pro-viding insight into the current state of graduate-level training within the discipline of REM. Graduates of these degree pro-grams acquire the conceptual and methodological tools needed to conduct research, program evaluation, and policy analysis and synthesis. The present study indicates a variety of training options within the REM field in terms of credit hour and degree requirements, although the options for online study are limited; a surprising finding given that more than half of all public four-year institutions offer at least one online graduate degree (Parsad et al., 2008). Findings also suggest that information about these programs is readily available on the Internet and that program descriptions imply consideration of those variables which support the education and training of research and evaluation experts.
Qualitative analyses of REM program websites suggest the consideration of individual resources or human capital in the cur-riculum by describing unique courses of study intended to align with individual interests and experiences. As noted by Bozeman
et al. (2001), human capital can be used as a means of evaluating science and technology projects and programs. In addition, many REM program websites detail a variety of culminating activities and research projects, examples of social/research project capital (Leech, 2012). The importance of a cohesive, coherent program of study was highlighted by most REM program websites. The Leech (2012) and Lovitts (2001, 2005) frameworks both describe the contributions of the immediate setting to educating skilled and knowledgeable researchers. These micro-environments in which budding researchers work and train (e.g., the department, lab, etc.) can influence the scientific contributions ultimately made by program graduates (Lovitts, 2005). This is also true of the macro-environment (the social-cultural context of graduate education that includes norms and values). In general, REM pro-gram faculty appear to consider these important facets in their program design.
The majority of the REM programs examined emphasize multiple types of research methodology, including assessment, evaluation, quantitative and qualitative methods, and the appli-cation and utility of research in professional practice. Aiken, West, and Millsap (2008) emphasize the importance of train-ing in innovative quantitative methodology that is required to address increasingly diverse and complex research questions. REM programs appear to meet this charge.
The major limitation of this study was the use of REM pro-gram websites as the sole source of data. Many of the websites were quite limited in terms of descriptions of the program—including information related to micro- and macro-environments. Further, interactions between the four conceptual areas (individual resources, facets of the program, micro-, and macro-environ-ments) could not be explored. The interaction and reciprocal influence of these variables can ultimately impact the quality and significance of student scholarly contributions (Lovitts, 2005). In addition, the REM programs examined in this study are housed in various schools and colleges (e.g., education, public health, liberal arts, etc.) and are at various levels (e.g., master’s and doctoral). Analyses were not conducted to determine if the programs differed significantly in relation to the Leech con-ceptual framework (2012) as a result of these variations. Future research should examine the experiences of students in various REM programs, as well as professional outcomes of program graduates as a means of examining the effectiveness of programs in developing skilled and knowledgeable researchers.
ConclusionThe aim of this study was to examine the features of REM
programs in the United States and provide a rich description of graduate training opportunities within this discipline. Using
10 Quality Approaches in Higher Education Vol. 6, No. 2asq.org/edu
Table 2: Results of the Classical Content Analysis
Code Number of times used
Prepare leaders in educational research 30
Statistical research techniques 24
Quantitative 19
Research methods 16
Program evaluation 16
Qualitative 14
Measurement 12
To serve in professional positions 11
Develop knowledge 11
Faculty are leading scholars 10
Both quantitative and qualitative methods appropriate for professional and social science research
9
Assessment 7
Prepares students for further advanced graduate work in psychology or education
7
Unique set of interests and experiences 7
Skill 6
Broad spectrum of courses 5
Disciplined inquiry 5
Collaborate with others 4
Explore the economic, political, and technical factors underlying policy formulation, public decision-making, implementation, and evaluation
4
Educational foundations courses 3
Internship 3
Complete a thesis/project 3
Contemporary theories 3
Program emphasizes research 3
Help improve teaching-learning processes and student achievement
3
Expected to complete 33 credits 3
Project 2
Learn highly marketable skills 2
Seeking solutions to human problems in organizations and communities
2
Rigorous training 2
Computer database analysis experience 2
One-year program 2
Advisory committee 1
In consultation with their advisor 1
Elective courses 1
Summer statistics workshops 1
Encourages students to pursue a minor area outside of the specialty
1
Other courses 1
Core requirements 1
Code Number of times used
Independent study 1
Portfolio 1
Non-thesis 1
Comprehensive exam 1
Diverse global community 1
Meet the needs of diverse populations 1
Supportive 1
Attitudes 1
Communication skills 1
New approaches to teaching and learning statistics 1
Innovative in the development of new methods for analyzing education data
1
Creation of new assessment 1
Maximum flexibility 1
Three areas (REM) 1
Methodological backbone 1
Two specialized areas of emphasis referred to as tracks, Development & Learning (D&L) and Research, Evaluation, Measurement and Statistics (REMS)
1
Draw widely from the resources of the university 1
Addresses the current industry-wide shortage of individuals capable of functioning effectively in educational research and other social science research settings
1
Strategies 1
Scholarly competence 1
Should be comfortable in researching 1
Read research 1
To examine the public policy issues and decision processes that shape PK-20 education in the United States
1
Assessing theoretical perspectives, research, and practice within and across content domains
1
Ethical application 1
Relate the findings to educational and social science policy 1
Study in the general track allows students to focus on a specific discipline of the department
1
Institutional research 1
Translating research findings for application in educational settings
1
Provide methodology for the advancement of educational research
1
Data mining 1
Individually tailored to each student’s needs 1
Does not require an extensive background in mathematics 1
Flexible-credit program 1
Mixed-methods 1
Modern analytical methods 1
Policy research 1
11 Quality Approaches in Higher Education Vol. 6, No. 2asq.org/edu
the Leech (2012) conceptual framework as a foundation, four areas that contribute to educating skilled and knowledgeable researchers were examined, with particular focus on the program components: individual resources such as cognitive skills, pro-gram components and features, the micro-environment, and the macro-environment. Analyses revealed that although there are a variety of training options in terms of credit hour and degree requirements, opportunities for online study in this field are limited. Findings indicate that most REM programs emphasize multiple types of research methodology, including assessment, evaluation, quantitative and qualitative methods, and the appli-cation and utility of research in professional practice. Further, results suggest that, in general, training in innovative quantita-tive methodology is needed to address increasingly diverse and complex research questions. Graduates of these programs may be uniquely qualified to engage in data-based decision-making, relate research findings to educational and social science policy, and ultimately, address the persistent science-to-practice gaps that exist in education and social science fields.
References:Aiken, L. S., West, S. G., & Millsap, R. E. (2008). Doctoral training in statistics, measurement, and methodology in psychology: Replication and extension of Aiken, West, Sechrest, and Reno's (1990) survey of Ph.D. programs in North America. American Psychologist, 63(1), 32-50.
Alban, T. M., & Hancock, G. R. (2001, April). A survey of measurement, statistics, and evaluation doctoral programs in North America. Paper pre-sented at the annual meeting of the National Council on Measurement in Education. Seattle, WA.
Allen, I. E., & Seaman, J. (2005). Growing by degrees: Online education in the United States. Needham, MA: The Sloan Consortium. Retrieved from http://olc.onlinelearningconsortium.org/publications/survey/growing_by_degrees_2005.
American Psychological Association. (1998). Graduate Study in Psychology. Washington, DC: Author.
Berelson, B. (1952). Content analysis in communicative research. New York, NY: Free Press.
Blanck, G. (2014). The rise of the biomedical sciences master’s pro-gram at U.S. medical colleges. Teaching and Learning in Medicine: An International Journal, 26(4), 409-411.
Bozeman, B., Dietz, J. S., & Gaughan, M. (2001). Scientific and technical human capital: An alternative model for research evaluation. International Journal of Technology Management, 22(7-8), 716-740.
Carnegie Foundation for the Advancement of Teaching. (February, 2012). Carnegie classifications data file. Author.
Fielding, N. G., & Lee, R. M. (1998). Computer analysis and qualitative research. Thousand Oaks, CA: Sage.
Flowers, J., & Baltzer, H. (2006). Perceived demand for online and hybrid doctoral programs in technical education. Journal of Industrial Teacher Education, 43(4), 39-56.
Glaser, B. G., & Strauss, A. L. (1967). The discovery of grounded theory: Strategies for qualitative research. Chicago, IL: Aldine.
Gwirtz, P. A. (2014). Career opportunities for graduates with profes-sional master’s vs. Ph.D. degrees. The Physiologist, 57(4), 241-244.
Jaggars, S. S., Edgecombe, N., & Stacey, G. W. (2013). What we know about online course outcomes. New York, NY: Columbia University Community College Research Center.
Kennedy, K., & Archambault, L. (2012). Offering preservice teachers field experiences in K-12 online learning: A national survey of teacher education programs. Journal of Teacher Education, 63(3), 185-200.
Kuroda, C. (2014). The new sphere of international student educa-tion in Chinese higher education: A focus on English-medium degree programs. Journal of Studies in International Education, 18(5), 445-462.
Leech, N. L. (2012). Educating knowledgeable and skilled researchers in doctoral programs in schools of education: A new model. International Journal of Doctoral Studies, 7, 19-37. Retrieved from http://ijds.org/Volume7/IJDSv7p019-037Leech325.pdf.
Leech, N. L., & Onwuegbuzie, A. J. (2009). A typology of mixed methods research designs. Quality and Quantity: International Journal of Methodology, 43, 265-275.
Levine, A. (2007). Educating researchers. Washington, DC: The Education Schools Project.
Lewison, D. M., & Hawes, J. M. (2007, Summer). Student target mar-keting strategies for universities. Journal of College Admission, 196, 14-19.
Lovitts, B. E. (2001). Leaving the ivory tower: The causes and consequences of departure from doctoral study. Lanham, MD: Rowman & Littlefield.
Lovitts, B. E. (2005). Being a good course-taker is not enough: A theo-retical perspective on the transition to independent research. Studies in Higher Education, 30(2), 137-154.
National Council on Measurement in Education. (1998). Update of the NCME Recruitment of Educational Measurement Professionals Committee. Author: Washington, DC.
Parsad, B., Lewis, L., & Tice, P. (2008). Distance education at degree-granting postsecondary institutions: 2006-07. Washington, DC: Council for Higher Education Accreditation.
Peterson’s. (2015). Find a graduate school that's right for you!. Retrieved from http://www.petersons.com/graduate-schools.aspx.
Peterson’s. (2014). Find a graduate school that’s right for you! Retrieved from http://www.petersons.com/graduate-schools.aspx.
Russell, G. (2004). Virtual schools: A critical view. In C. Cavanaugh (Ed.), Development and management of virtual schools: Issues and trends (pp. 1-25). Hershey, PA: Information Science.
12 Quality Approaches in Higher Education Vol. 6, No. 2asq.org/edu
Seibert, S. E., Kraimer, M. L., Holtom, B. C., & Pierotti, A. J. (2013). Even the best laid plans sometimes go askew: Career self-management processes, career shocks, and the decision to pursue graduate education. Journal of Applied Psychology, 98(1), 169-182.
Shillam, C. R., Ho, G., & Commodore-Mensah, Y. (2014). Online biostatistics: Evidence-based curriculum for master’s nursing education. Journal of Nursing Education, 53(4), 229-232.
Vermeulen, W. J. V., Bootsma, M. C., & Tijm, M. (2014). Higher education level teaching of (master’s) programmes in sustainable devel-opment: Analysis of views on prerequisites and practices based on a worldwide survey. International Journal of Sustainable Development and World Ecology, 21(5), 430-448.
Nancy L. Leech, Ph.D. is a professor at the University of Colorado Denver. Leech is cur-rently teaching master’s- and Ph.D.-level courses in research, statistics, and measurement. Her area of research is promoting new develop-ments and better understandings in applied qualitative, quantitative, and mixed methodol-ogies. To date, she has published more than 70 articles in refereed journals and is co-author of three books: SPSS for Basic Statistics: Use and Interpretation, SPSS for Intermediate Statistics: Use and Interpretation, and Research Methods in Applied Settings: An Integrated Approach to Design and Analysis. Leech has made more than 85 presentations at regional, national, and international conferences. Contact Leech at [email protected].
Franci Crepeau-Hobson, Ph.D. is an associ-ate professor and the director of the School Psychology Program in the School of Education and Human Development at the University of Colorado Denver. She teaches legal/ethical foundations, psychological assessment, and crisis intervention and supervises practicum in the school psychology program. Her research interests include psychological assessment, best practices in school psychology, and crisis intervention. She has served as co-chair of the school psychology workgroup for the Colorado Council for Educator Effectiveness where she provided leadership in areas of assessment and accountability. Crepeau-Hobson has given numerous presentations at regional, national, and international conferences. For more infor-mation contact Crepeau-Hobson via email at [email protected].
Mark Perkins, Ph.D. is a research fellow at Colorado State University's School of Social Work. His research interests include measure-ment, quantitative research methods, and teaching research methods to educators and mental health professionals. Contact Perkins at [email protected].
Carolyn A. Haug, Ph.D. is executive director of accreditation and program effectiveness in the School of Education and Human Development at the University of Colorado Denver. She teaches program evaluation, measurement, and statistics in the Research and Evaluation Methodology program. Her research interests include teacher preparation, educator effective-ness, and student achievement. She has served as director of assessment for the Colorado Department of Education and director of school improvement and accountability for the Adams County 50 School District where she provided leadership in the areas of assessment, school improvement planning, program evaluation, and accountability, both statewide and at a local school district level. Haug has made numerous presentations at regional, national, and international conferences. Contact Haug via email at [email protected].
Nancy L. Leech
Franci Crepeau-Hobson
Mark Perkins
Carolyn A. Haug
13 Quality Approaches in Higher Education Vol. 6, No. 2
asq.org/edu
Linking course
objectives to
learning outcome
assessment efforts
in course design.
Grading By Objectives: A Matrix Method for Course AssessmentIdo Millet and Suzanne Weinstein
AbstractThis article describes a method for linking course assessments to learning objectives. This method allows instructors to see the relative weight and performance of each learning objective, as reflected by course assignments and exams. While designing the course, instructors can use this information to ensure the relative weights are aligned with the relative importance of the learning objectives. When the course is completed, instructors can see, at a glance, which objectives students mastered and which ones they did not. This information can be used to modify the course prior to the next offering. Furthermore, this information may be utilized for learning outcomes assessment efforts. At our business school, this method was implemented via a spreadsheet and used for several years by a fac-ulty member. We propose integrating the methodology into learning management systems.
KeywordsAssessment, Learning Objectives, Grades
IntroductionAccording to Frazer (1992), the basis for quality in higher education is self-evaluation,
and a “mirror” is required for teachers and universities to become "self-critical and reflective" (p. 18). In this article we describe a method that allows instructors to see the extent to which assessments are aligned with learning objectives, as well as how students have performed on specific learning objectives. This allows instructors to adjust assignments and tests to better reflect the desired balance across learning objectives. Because learning objectives with poor student performance become visible, this reporting system can also lead to beneficial adjust-ments to teaching strategies. For course objectives that reflect program-level objectives, the information generated by this system may also contribute to program-level assessment.
Graded assignments and exams are one of the most important features of any course because they provide the opportunity for both students and instructors to assess how well students have learned the course content. The educational assessment process begins with the development of learning objectives, which define what we expect students to know or be able to do following the course or program (Biggs, 1999; Fink, 2003; Suskie, 2009; Walvoord, 2004; Walvoord & Anderson, 1998; Wiggins & McTighe, 2005). According to Wiggins and McTighe (2005), after learning objectives are developed, assessments are designed to inform the instructor and the student about the extent to which the student has met those objectives. When done effectively, this process results in course assignments, projects, and tests that are closely aligned with each learning objective. Research has shown that such alignment results in powerful effects on student learning (Cohen, 1987).
After the assessments are designed, the instructor plans the teaching strategies that will prepare students to perform well on these tasks. However, even if faculty members design their courses in this way, they may not take the time to evaluate the extent to which their assessments match their objectives or how well students performed on each objective. Instructors are typically more concerned with how well students performed on the com-bination of assessments, which is how course grades are determined (Weinstein, Ching, Shapiro, & Martin, 2010). Furthermore, a single assignment, project, or exam frequently
14 Quality Approaches in Higher Education Vol. 6, No. 2asq.org/edu
assesses multiple course objectives, making it difficult to map students’ performance back to individual course objectives.
How Course Design Strategy Enhances AssessmentIn this article we will describe a matrix method for assess-
ment that is easy to implement and can help instructors improve the design of their courses while also contributing to program-level assessment.
Courses are commonly designed around topics. For example, an introductory psychology course may cover topics such as the biological underpinnings of behavior, memory, and abnormal behavior. In contrast, instructional design experts advocate that courses be designed around learning objectives, which are state-ments that delineate what students will know or be able to do after taking the course (Wiggins & McTighe, 2005). In this process, called constructive alignment (Biggs, 1999) or backward design (Wiggins & McTighe, 2005), the instructor begins with the desired results before developing assessments and teaching strategies.
Using the introductory psychology course as an example, the faculty member may state that he/she wants students to be able to compare and contrast the different theories of learning. He/She would then design an assessment, perhaps an essay question on a test, which aligns with that objective. The next step involves determining what activities students should engage in so that they are prepared to answer the essay question. For example, they may first read about the theories and then engage in a class discussion. When course objectives drive course design, both students and instructors are clear about what students will be able to know and do after completing the course.
Many instructors include instructional objectives in their syl-labi and course design process, but how can we provide evidence that the course actually achieves its stated objectives? Aligning learning objectives with assignments and tests can help answer this basic learning assessment question (Diamond, 1989; Fink, 2003; Huba & Freed, 2000; Nitko, 1996; Suskie, 2009; Walvoord & Anderson, 1998; Walvoord, 2004; Wiggins & McTighe, 2005).
Explicit links between course objectives and assessments offer benefits beyond the course design process. Such links can ensure that an appropriate percentage of course assessments address each learning objective. Such links can also help measure students’ per-formance on each learning objective. The instructor can then use this information to improve the course in appropriate ways. For example, the information may prompt the instructor to add assign-ments and test questions linked to a relatively neglected course objective. Similarly, a course objective with relatively poor perfor-mance may prompt the instructor to change the course design to address the deficiency. Likely causes of low performance on a par-ticular learning objective include problems with the objective itself,
the assessments used to evaluate the objective, or the teaching strat-egies used to prepare students for the assessment (Suskie, 2012).
Beyond the contribution to course design and evaluation, linking assessments to course objectives may also benefit pro-gram-level assessment. If some course-level objectives address program-level objectives, the evidence of student performance on these objectives can be incorporated into the program assess-ment materials. This “embedded assessment” strategy can save time for instructors (Weinstein et al., 2010).
What follows is a method for linking course objectives to assessments using computer software. Once these links are estab-lished, no extra effort (beyond the usual grading of assignments and tests) is needed to generate the information described above.
A Matrix Method for Grading By ObjectivesThe core idea behind the proposed grading by objectives
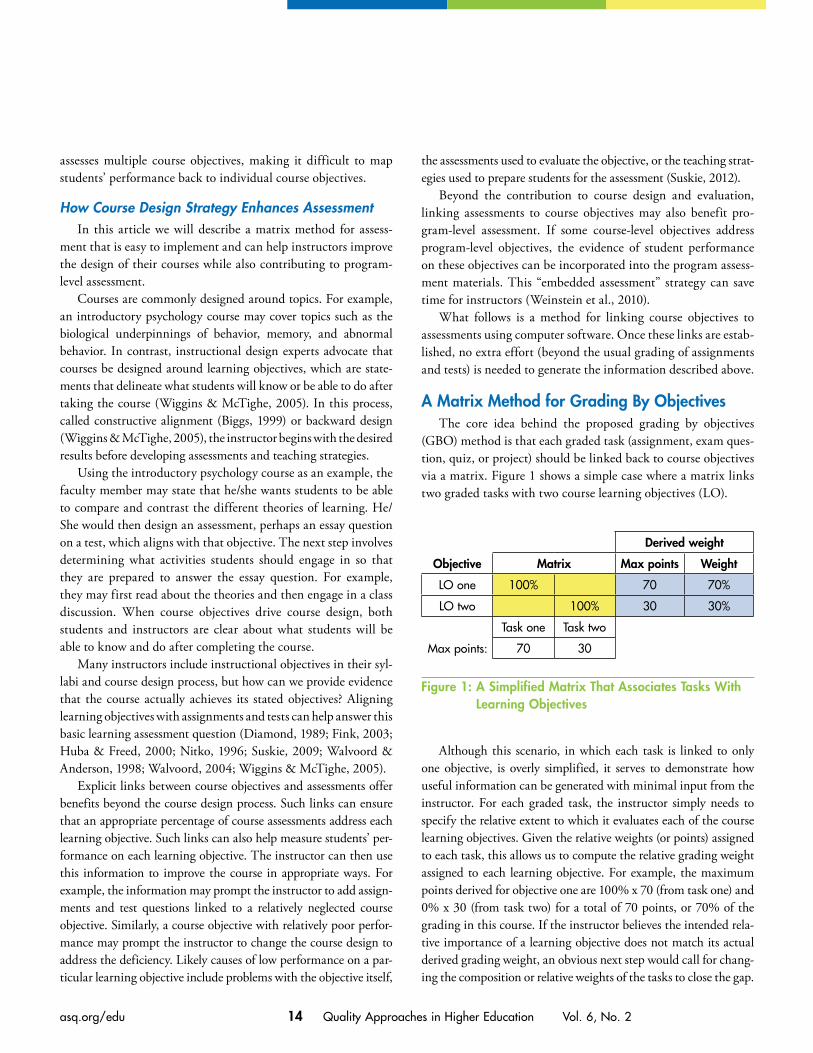
(GBO) method is that each graded task (assignment, exam ques-tion, quiz, or project) should be linked back to course objectives via a matrix. Figure 1 shows a simple case where a matrix links two graded tasks with two course learning objectives (LO).
Derived weight
Objective Matrix Max points Weight
LO one 100% 70 70%
LO two 100% 30 30%
Task one Task two
Max points: 70 30
Figure 1: A Simplified Matrix That Associates Tasks With Learning Objectives
Although this scenario, in which each task is linked to only one objective, is overly simplified, it serves to demonstrate how useful information can be generated with minimal input from the instructor. For each graded task, the instructor simply needs to specify the relative extent to which it evaluates each of the course learning objectives. Given the relative weights (or points) assigned to each task, this allows us to compute the relative grading weight assigned to each learning objective. For example, the maximum points derived for objective one are 100% x 70 (from task one) and 0% x 30 (from task two) for a total of 70 points, or 70% of the grading in this course. If the instructor believes the intended rela-tive importance of a learning objective does not match its actual derived grading weight, an obvious next step would call for chang-ing the composition or relative weights of the tasks to close the gap.
15 Quality Approaches in Higher Education Vol. 6, No. 2asq.org/edu
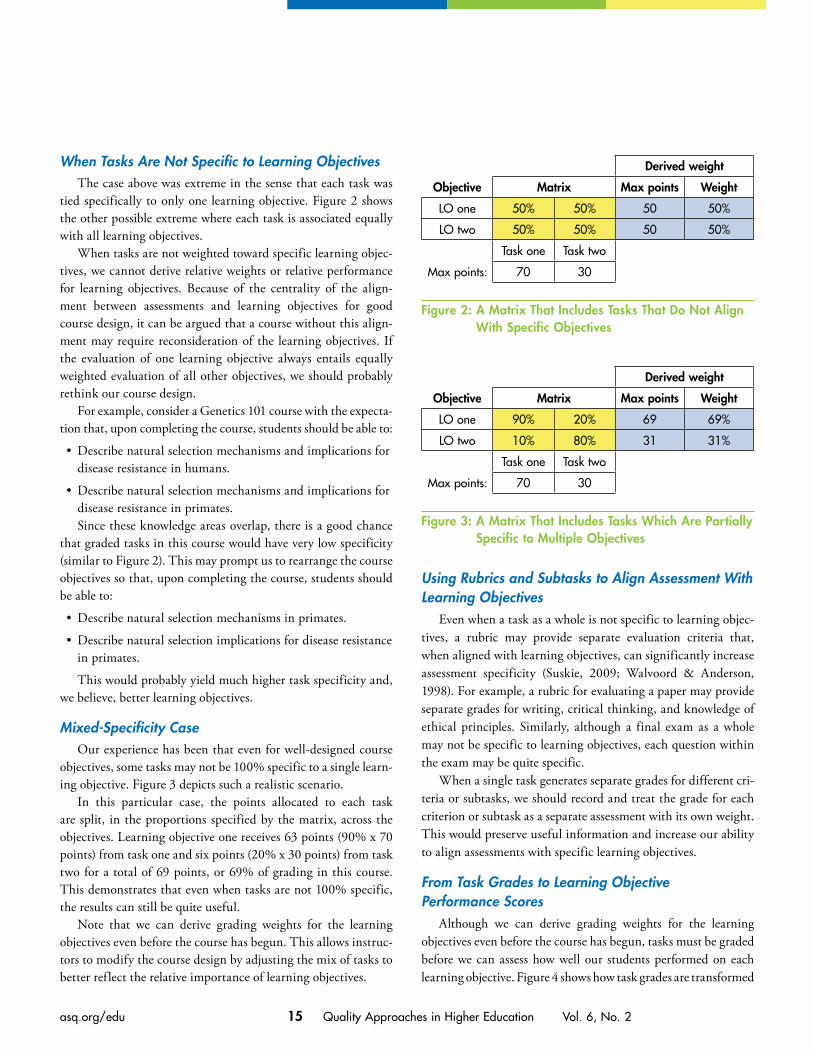
When Tasks Are Not Specific to Learning ObjectivesThe case above was extreme in the sense that each task was
tied specifically to only one learning objective. Figure 2 shows the other possible extreme where each task is associated equally with all learning objectives.
When tasks are not weighted toward specific learning objec-tives, we cannot derive relative weights or relative performance for learning objectives. Because of the centrality of the align-ment between assessments and learning objectives for good course design, it can be argued that a course without this align-ment may require reconsideration of the learning objectives. If the evaluation of one learning objective always entails equally weighted evaluation of all other objectives, we should probably rethink our course design.
For example, consider a Genetics 101 course with the expecta-tion that, upon completing the course, students should be able to:
• Describe natural selection mechanisms and implications for disease resistance in humans.
• Describe natural selection mechanisms and implications for disease resistance in primates.Since these knowledge areas overlap, there is a good chance
that graded tasks in this course would have very low specificity (similar to Figure 2). This may prompt us to rearrange the course objectives so that, upon completing the course, students should be able to:
• Describe natural selection mechanisms in primates.
• Describe natural selection implications for disease resistance in primates.
This would probably yield much higher task specificity and, we believe, better learning objectives.
Mixed-Specificity CaseOur experience has been that even for well-designed course
objectives, some tasks may not be 100% specific to a single learn-ing objective. Figure 3 depicts such a realistic scenario.
In this particular case, the points allocated to each task are split, in the proportions specified by the matrix, across the objectives. Learning objective one receives 63 points (90% x 70 points) from task one and six points (20% x 30 points) from task two for a total of 69 points, or 69% of grading in this course. This demonstrates that even when tasks are not 100% specific, the results can still be quite useful.
Note that we can derive grading weights for the learning objectives even before the course has begun. This allows instruc-tors to modify the course design by adjusting the mix of tasks to better reflect the relative importance of learning objectives.
Using Rubrics and Subtasks to Align Assessment With Learning Objectives
Even when a task as a whole is not specific to learning objec-tives, a rubric may provide separate evaluation criteria that, when aligned with learning objectives, can significantly increase assessment specificity (Suskie, 2009; Walvoord & Anderson, 1998). For example, a rubric for evaluating a paper may provide separate grades for writing, critical thinking, and knowledge of ethical principles. Similarly, although a final exam as a whole may not be specific to learning objectives, each question within the exam may be quite specific.
When a single task generates separate grades for different cri-teria or subtasks, we should record and treat the grade for each criterion or subtask as a separate assessment with its own weight. This would preserve useful information and increase our ability to align assessments with specific learning objectives.
From Task Grades to Learning Objective Performance Scores
Although we can derive grading weights for the learning objectives even before the course has begun, tasks must be graded before we can assess how well our students performed on each learning objective. Figure 4 shows how task grades are transformed
Derived weight
Objective Matrix Max points Weight
LO one 50% 50% 50 50%
LO two 50% 50% 50 50%
Task one Task two
Max points: 70 30
Figure 2: A Matrix That Includes Tasks That Do Not Align With Specific Objectives
Derived weight
Objective Matrix Max points Weight
LO one 90% 20% 69 69%
LO two 10% 80% 31 31%
Task one Task two
Max points: 70 30
Figure 3: A Matrix That Includes Tasks Which Are Partially Specific to Multiple Objectives

16 Quality Approaches in Higher Education Vol. 6, No. 2asq.org/edu
through the GBO matrix into performance scores for the learning objectives.
On average, students in this course scored 60% on task one and 90% on task two. This means that out of a maximum of 70 points, stu-dents averaged 42 points on task one, and out of a maxi-mum of 30 points, students averaged 27 points on task two. Multiplying these task performance points (TPPs) by the allocation percentages in the GBO matrix allows us to split and recombine these points into learning objective performance points (LOPP). For example, learning objective one accumulates 90% of the 42 TPPs from task one and 20% of the 27 TPPs from task two for a total of 43.2 LOPPs. Given that the maximum LOPPs for the first objec-tive is 69, we can compute an overall performance score of 63% for learning objective one. Similarly, learning objective two accumulates 10% of the 42 TPPs from task one and 80% of the 27 TPPs from task two for a total of 25.8 LOPPs. Given that the maximum LOPPs for the second objective is 31, we can compute a performance score of 83% for learning objective two.
Even though the tasks are not 100% specific to single objec-tives, this procedure provides useful information. We would be justified in concluding that students are struggling to attain learning objective one but are doing quite well with learning objective two. The instructor may then investigate the reasons for the poor performance on learning objective one and change the design of the course to address these deficiencies.
Summative Versus Formative TasksAccording to Allen (2005), the validity of a measure of stu-
dent performance (e.g., a grade) is diminished if measures of behavior, effort, or practice are included. Thus, when measuring academic performance using the GBO method, we recommend focusing only on summative assessments scores, such as exams, end-of-topic assignments, and final papers because these types of assessments are designed to determine the level at which students achieved the learning outcomes at the end of a unit or course. In such a case, we should exclude formative assessments, such as practice quizzes or early paper drafts, which are designed to provide feedback and help students improve.
Yet, when we move from the measurement of academic per-formance to a broader objective of course diagnostics, we may include metrics for formative assessments. Keeping both types of graded tasks in the matrix (and classifying each as summa-tive or formative) would provide useful information such as the relative assessment attention each learning objective receives in terms of summative assessments, formative assessments, or both. For example, the scatter chart in Figure 5 highlights a diver-gence between the summative and formative assessment weights for two out of four learning objectives. Learning objective one receives high summative but low formative assessment atten-tion, while learning objective two receives low summative but high formative attention. These disparities may or may not be appropriate for these learning objectives. In any case, the GBO method would help make such disparities visible to the instruc-tor, who can then make modifications if necessary.
Ancillary and Mixed GradesJust as formative grades should be excluded when assessing
the achievement of learning objectives, so should grades deal-ing with non-academic performance. Allen (2005, p. 220) states “grades should not be a hodgepodge of factors such as student’s level of effort, innate aptitude, compliance to rules, attendance,
Derived weight
Objective Matrix Max points Weight Actual points Performance
LO one 90% 20% 69 69% 69 69%
LO two 10% 80% 31 31% 31 31%
Task one Task two
Max points: 70 30
Performance 60% 90%
Actual points 42 27
Figure 4: Deriving Performance Scores for Learning Objectives
Weight
Summative Formative
LO one 35% 15%
LO two 15% 35%
LO three 20% 20%
LO four 30% 30%
Figure 5: Summative Versus Formative Assessment Weights
10% 20% 30% 40%
LO one
LO four
LO three
LO two
10%
20%
30%
40%
Summative weight
Form
ativ
e w
eigh
t
17 Quality Approaches in Higher Education Vol. 6, No. 2asq.org/edu
social behaviors, attitudes, or other nonachievement measures.” However, Allen (2005, p. 119) also claims that “although ancil-lary information such as effort and attitude could be part of an overall student report, they should not be part of a grade that represents academic achievement” (Tombari & Borich, 1999). Thus, instructors may choose to award points to non-academic behaviors for motivational purposes, but these points should be excluded from the GBO matrix if it is to represent a valid mea-sure of student performance.
A Case in PointFor several semesters, one of the authors has used the GBO
technique in a senior-level undergraduate course on busi-ness intelligence. A sanitized version (no student names) of the grading spreadsheet with the integrated GBO technique is available for download from: https://dl.dropboxusercontent.com/u/38773963/Grading_By_Objectives_Sample.xlsx.
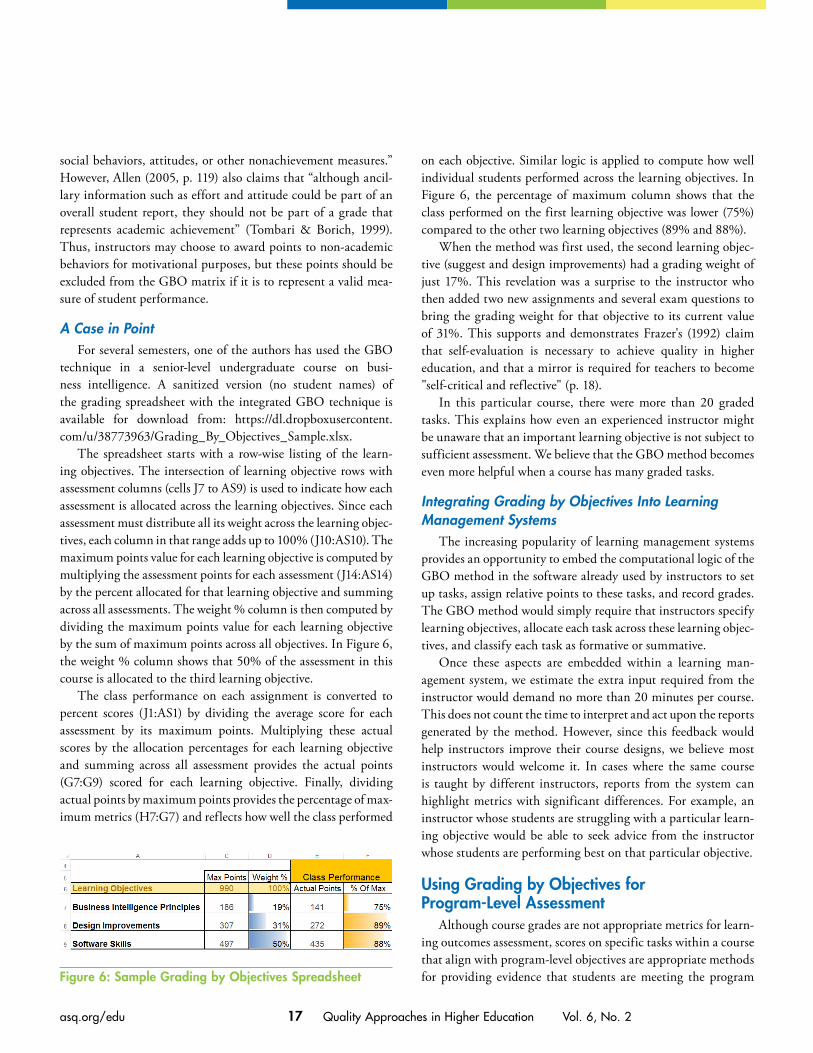
The spreadsheet starts with a row-wise listing of the learn-ing objectives. The intersection of learning objective rows with assessment columns (cells J7 to AS9) is used to indicate how each assessment is allocated across the learning objectives. Since each assessment must distribute all its weight across the learning objec-tives, each column in that range adds up to 100% (J10:AS10). The maximum points value for each learning objective is computed by multiplying the assessment points for each assessment (J14:AS14) by the percent allocated for that learning objective and summing across all assessments. The weight % column is then computed by dividing the maximum points value for each learning objective by the sum of maximum points across all objectives. In Figure 6, the weight % column shows that 50% of the assessment in this course is allocated to the third learning objective.
The class performance on each assignment is converted to percent scores (J1:AS1) by dividing the average score for each assessment by its maximum points. Multiplying these actual scores by the allocation percentages for each learning objective and summing across all assessment provides the actual points (G7:G9) scored for each learning objective. Finally, dividing actual points by maximum points provides the percentage of max-imum metrics (H7:G7) and reflects how well the class performed
on each objective. Similar logic is applied to compute how well individual students performed across the learning objectives. In Figure 6, the percentage of maximum column shows that the class performed on the first learning objective was lower (75%) compared to the other two learning objectives (89% and 88%).
When the method was first used, the second learning objec-tive (suggest and design improvements) had a grading weight of just 17%. This revelation was a surprise to the instructor who then added two new assignments and several exam questions to bring the grading weight for that objective to its current value of 31%. This supports and demonstrates Frazer's (1992) claim that self-evaluation is necessary to achieve quality in higher education, and that a mirror is required for teachers to become "self-critical and reflective" (p. 18).
In this particular course, there were more than 20 graded tasks. This explains how even an experienced instructor might be unaware that an important learning objective is not subject to sufficient assessment. We believe that the GBO method becomes even more helpful when a course has many graded tasks.
Integrating Grading by Objectives Into Learning Management Systems
The increasing popularity of learning management systems provides an opportunity to embed the computational logic of the GBO method in the software already used by instructors to set up tasks, assign relative points to these tasks, and record grades. The GBO method would simply require that instructors specify learning objectives, allocate each task across these learning objec-tives, and classify each task as formative or summative.
Once these aspects are embedded within a learning man-agement system, we estimate the extra input required from the instructor would demand no more than 20 minutes per course. This does not count the time to interpret and act upon the reports generated by the method. However, since this feedback would help instructors improve their course designs, we believe most instructors would welcome it. In cases where the same course is taught by different instructors, reports from the system can highlight metrics with significant differences. For example, an instructor whose students are struggling with a particular learn-ing objective would be able to seek advice from the instructor whose students are performing best on that particular objective.
Using Grading by Objectives for Program-Level Assessment
Although course grades are not appropriate metrics for learn-ing outcomes assessment, scores on specific tasks within a course that align with program-level objectives are appropriate methods for providing evidence that students are meeting the program Figure 6: Sample Grading by Objectives Spreadsheet
18 Quality Approaches in Higher Education Vol. 6, No. 2asq.org/edu
objectives. Thus, the GBO method provides an added benefit for instructors teaching courses in which assessments for one or more learning objectives will be used as evidence that students have met program-level objectives. The embedded formulas will automatically generate a percentage that represents the extent to which students have met a particular objective. This result can then be included in the program assessment report and discussed by program faculty as part of the process.
LimitationsThe proposed methodology assumes proper learning objec-
tives can be identified for courses. Yet, several researchers cast doubt on the ease and advisability of establishing such objectives. A good review of such objections is provided by James (2005). We need to exercise care and proper balance in establishing learning objectives:
If learning outcomes are defined too broadly, they lose their capacity to assist in comparison across cases and over time. Defined too narrowly, they become impotent, in the sense that they refer to so little of a de facto learning process that they are simply uninformative, powerless to generate or even signal improvement. (James 2005, p. 90).
Although instructors may welcome access to GBO metrics and reports, one sensitive consequence of this method is that it would make problem areas visible to administrators and, possibly, to other instructors. This tension between "external control and internal improvement" (Padró, p. 2) is an issue for any assessment initiative. However, since the GBO method uses grades as input, it raises the threat that instructors might be tempted to assign higher grades to escape negative attention from administrators and peers. To avoid such unintended consequences, it may be wise to restrict detailed feedback to constructive use by the instructor.
Allen (2005) warns “grading systems used by teachers vary widely and unpredictably and often have low levels of valid-ity due to the inclusion of nonacademic criteria used in the calculation of grades.” The GBO method strives to remove non-academic criteria by exclusively using summative grades for assessing the achievement of learning objectives. Still, there is a remaining concern about the reliability and consistency of sum-mative grades. To reduce possible instructor bias, subjectively scored tasks, such as essays, papers, or presentations, should be scored using well-developed rubrics, which make scoring more accurate, unbiased, and consistent (Suskie, 2009). Close atten-tion should also be paid to creating reliable objective tests such as multiple choice tests, which requires significant effort (Suskie, 2009). Also, a grade lift reporting system (Millet, 2010) may pro-mote grading consistency across faculty members.
Future ResearchFuture research may investigate the impact of using the
proposed GBO methodology on teaching practices, grades, academic performance, and student satisfaction. It would also be important to collect feedback from instructors who are early adopters of the technique. Such feedback may include overall sat-isfaction, suggestions for improvements, and level of impact on course and assessments designs.
As mentioned earlier, establishing proper learning objectives is an essential yet challenging aspect of any learning assessment effort. Future research is needed to establish guidelines for the creation of effective learning objectives for various educational contingencies.
Another interesting question relates to the proper balance between formative and summative assessment. As depicted in Figure 5, the GBO methodology provides descriptive information about that balance as reflected by graded tasks. However, we lack prescriptive insight. What type of balance is conducive to achiev-ing different types of learning goals in different situations? For example, do undergraduate students require a greater proportion of formative tasks? Do students benefit from a greater propor-tion of formative tasks for learning objectives at higher levels of Bloom’s taxonomy, such as analysis or evaluation (Bloom, 1956)? Do courses with a higher proportion of formative tasks lead to better long-term knowledge retention? What is the impact on stu-dent engagement and performance when formative task grades are downplayed in computing final grades? Answers to these and other questions associated with the impact of formative assessment on student performance would benefit our educational systems.
References:Allen, J. D. (2005). Grades as valid measures of academic achievement of classroom learning. The Clearing House: A Journal of Educational Strategies, Issues and Ideas, 78(5), 218-223.
Biggs, J. (1999). What the student does: teaching for enhanced learning. Higher Education Research & Development, 18(1), 57-75.
Bloom, B. S. (1956). Taxonomy of educational objectives. New York, NY: David McKay Co.
Cohen, S. A. (1987). Instructional alignment: Searching for a magic bullet. Educational Researcher, 16(8), 16-20.
Diamond, R. M. (1989). Designing and improving courses and curricula in higher education: A systematic approach. San Francisco, CA: Jossey-Bass.
Fink, D. (2003). Creating significant learning experiences. Hoboken, NJ: John Wiley and Sons.
Frazer, M. (1992). Quality assurance in higher education. Quality Assurance in Higher Education, edited by A. Craft. London and Washington. DC: The Falmer Press, 9-25.
19 Quality Approaches in Higher Education Vol. 6, No. 2asq.org/edu
Huba, M. E., and Freed, J. E. (2000). Learner-centered assessment on college campuses: Shifting the focus from teaching to learning. Boston, MA: Allyn and Bacon.
James, D. (2005). Importance and impotence? Learning, outcomes, and research in further education. Curriculum Journal, 16(1), 83-96.
Millet, I. (2010), Improving grading consistency through grade lift reporting, Practical Assessment, Research & Evaluation, 15(4). http://pareonline.net/pdf/v15n4.pdf.
Nitko, A. J. (1996). Educational assessment of students. Englewood Cliffs, NJ: Prentice Hall.
Padró, F. F. (2012). Giving the body of knowledge a voice. Quality Approaches in Higher Education, 3(2), 2-6.
Suskie, L. (2009). Assessing student learning: A common sense guide (2nd ed). San Francisco, CA: Jossey-Bass.
Suskie, L. (2012). Summarizing, understanding, and using assessment results. Presented at Penn State Harrisburg, PA: May 10.
Tombari, M., and Borich G. (1999). Authentic assessment in the class-room. Upper Saddle River, NJ: Merrill/Prentice Hall.
Walvoord, B. (2004). Assessment clear and simple. Hoboken, NJ: John Wiley and Sons.
Walvoord, B. E., & Anderson, V. J. (1998). Effective grading. Jossey-Bass.
Weinstein, S., Ching, Y., Shapiro, D., & Martin, R. (2010). Embedded assessment: Using data we already have to assess courses and programs. Assessment Update, 22(2), 6-7.
Wiggins, G., & McTighe, J. (2005). Understanding by design (2nd ed.). Alexandria, VA: Association for Supervision and Curriculum Development. Retrieved from http://books.google.com/books?id=N2EfKlyUN4QC&pg= PA1&source=gbs_toc_r&cad=4#v=onepage&q&f=false.
Ido Millet, Ph.D. is a professor of manage-ment information systems at the Sam and Irene Black School of Business, The Pennsylvania State University-Erie. His research interests include the analytic hierarchy process, online reverse auctions, business intelligence, and use of academic data to support faculty and stu-dents. Millet’s industrial experience includes systems analysis, project management, con-sulting, and software development. His business intelligence software packages have been purchased by more than 5,600 organi-zations. For more information, contact him via email at [email protected].
Suzanne Weinstein, Ph.D. is director of instructional consulting, assessment, and research at the Schreyer Institute for Teaching Excellence at Penn State University. She also holds a courtesy appointment in the depart-ment of psychology. Weinstein joined the teaching and learning support community at Penn State in 2002 as an assessment special-ist. Her assessment expertise ranges from single courses to multi-course projects to uni-versity-wide learning outcomes assessment. Contact her at [email protected].
Ido Millet
Suzanne Weinstein
The Quality Approaches in Higher Education editors will announce an annual best paper award to the author(s) of a paper published in QualityApproaches in Higher Education. The award will be announced in January of each year for the best paper from the issues of the previous year and will be based on the largest single contribution made to the development or application of quality approaches in higher education. There is no nomination form for this award.
Visit our website at asq.org/edu/quality-information/journals/ today!
2012 International Conference on Software Quality
Best Paper Award
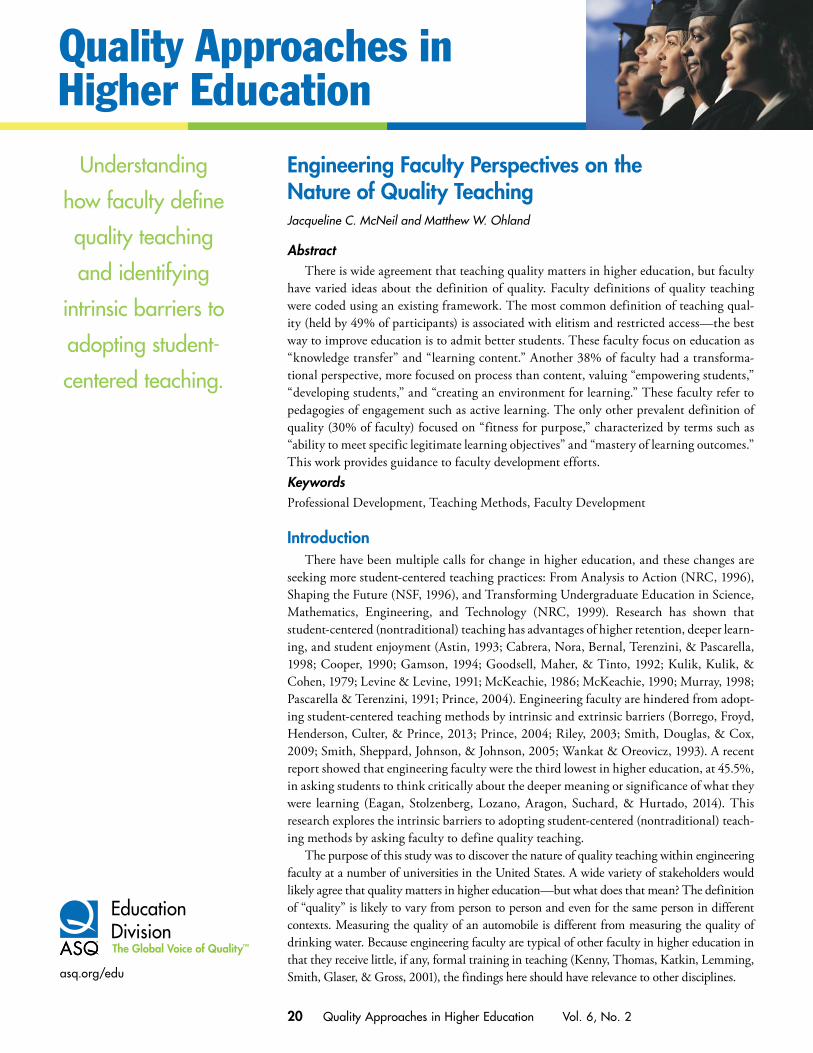
20 Quality Approaches in Higher Education Vol. 6, No. 2
asq.org/edu
Engineering Faculty Perspectives on the Nature of Quality TeachingJacqueline C. McNeil and Matthew W. Ohland
AbstractThere is wide agreement that teaching quality matters in higher education, but faculty
have varied ideas about the definition of quality. Faculty definitions of quality teaching were coded using an existing framework. The most common definition of teaching qual-ity (held by 49% of participants) is associated with elitism and restricted access—the best way to improve education is to admit better students. These faculty focus on education as “knowledge transfer” and “learning content.” Another 38% of faculty had a transforma-tional perspective, more focused on process than content, valuing “empowering students,” “developing students,” and “creating an environment for learning.” These faculty refer to pedagogies of engagement such as active learning. The only other prevalent definition of quality (30% of faculty) focused on “fitness for purpose,” characterized by terms such as “ability to meet specific legitimate learning objectives” and “mastery of learning outcomes.” This work provides guidance to faculty development efforts.Keywords Professional Development, Teaching Methods, Faculty Development
IntroductionThere have been multiple calls for change in higher education, and these changes are
seeking more student-centered teaching practices: From Analysis to Action (NRC, 1996), Shaping the Future (NSF, 1996), and Transforming Undergraduate Education in Science, Mathematics, Engineering, and Technology (NRC, 1999). Research has shown that student-centered (nontraditional) teaching has advantages of higher retention, deeper learn-ing, and student enjoyment (Astin, 1993; Cabrera, Nora, Bernal, Terenzini, & Pascarella, 1998; Cooper, 1990; Gamson, 1994; Goodsell, Maher, & Tinto, 1992; Kulik, Kulik, & Cohen, 1979; Levine & Levine, 1991; McKeachie, 1986; McKeachie, 1990; Murray, 1998; Pascarella & Terenzini, 1991; Prince, 2004). Engineering faculty are hindered from adopt-ing student-centered teaching methods by intrinsic and extrinsic barriers (Borrego, Froyd, Henderson, Culter, & Prince, 2013; Prince, 2004; Riley, 2003; Smith, Douglas, & Cox, 2009; Smith, Sheppard, Johnson, & Johnson, 2005; Wankat & Oreovicz, 1993). A recent report showed that engineering faculty were the third lowest in higher education, at 45.5%, in asking students to think critically about the deeper meaning or significance of what they were learning (Eagan, Stolzenberg, Lozano, Aragon, Suchard, & Hurtado, 2014). This research explores the intrinsic barriers to adopting student-centered (nontraditional) teach-ing methods by asking faculty to define quality teaching.
The purpose of this study was to discover the nature of quality teaching within engineering faculty at a number of universities in the United States. A wide variety of stakeholders would likely agree that quality matters in higher education—but what does that mean? The definition of “quality” is likely to vary from person to person and even for the same person in different contexts. Measuring the quality of an automobile is different from measuring the quality of drinking water. Because engineering faculty are typical of other faculty in higher education in that they receive little, if any, formal training in teaching (Kenny, Thomas, Katkin, Lemming, Smith, Glaser, & Gross, 2001), the findings here should have relevance to other disciplines.
Understanding
how faculty define
quality teaching
and identifying
intrinsic barriers to
adopting student-
centered teaching.
21 Quality Approaches in Higher Education Vol. 6, No. 2asq.org/edu
This research will help faculty, faculty developers, adminis-trators, students, and industry leaders understand the language used to describe quality teaching and the criteria faculty are using to define it. Thus, this paper leads to a deeper understand-ing of quality teaching in engineering education—an essential step in achieving it. Further, if there is diversity in how faculty define quality teaching, but the evaluation of teaching does not acknowledge that diversity, the result is that the success of some faculty who are striving for quality teaching will be measured against the wrong yardstick. As we strive for more diversity in engineering among students and faculty, and in the profession more generally (National Academy of Engineering, 2002), we must be transparent in how we measure success and be prepared to measure it in different forms.
Quality and Quality Management in Higher Education
Research on quality and quality management in industry have been applied toward designing a quality management system for higher education, with various papers on different topics within the umbrella term of quality (Srikanthan & Dalrymple, 2003). Owlia and Aspinwall (1996) created a framework for dimensions of quality specifically for colleges and universities by compar-ing nine different models of service quality dimensions. Each of the nine models that were compared showed how different perspectives can change the model’s quality dimensions. Owlia and Aspinwall (1996) compiled these various quality dimen-sions into a set for higher education: tangibles, competence, attitude, content, delivery, and reliability. Even in these papers that address quality from an industrial management perspective, there is debate regarding how to assess the teacher-student inter-actions because envisioning a student as a metaphorical “output” of a manufacturing process is unpalatable. Another approach to measuring quality in higher education is based on methods of measuring quality in a service business, as this avoids the need to compare students to products that are developed and made in a factory (Owlia & Aspinwall, 1996).
The work of Garvin (1988) is more useful because he provides a five-faceted definition of quality: transcendent, product-based, user-based, manufacturing-based, and value-based. By encom-passing diverse meanings of quality, we begin to be able to account for the different ways faculty achieve it. Transcendent interpretations of quality are individualistic, personal, and associated with ideas like love. Product-based interpretations are based on measurable standards. User-based interpretations address customer satisfaction criteria, which may vary con-siderably among stakeholder groups. Manufacturing-based interpretations are those that emphasize zero-defects based on
manufacturer specifications. Value-based interpretations focus on economic benefit.
Harvey and Green (1993) adapted Garvin’s definitions of quality in higher education resulting in five similar categories: exception-ality (in the sense of excellence), perfection and consistency, fitness for purpose, value for money, and transforming. These definitions, described below, regarding the nature of quality fit the data from how engineering faculty described quality teaching.
Harvey and Green’s Model of Quality in Higher EducationQuality as Exceptionality
Exceptionality is accepted universally in higher education because it is so elite and rare (Pfeffer & Coote, 1991). This defi-nition is pervasive in higher education because it is viewed as distinctive, special, or high class (Astin, 1993; Harvey & Green, 1993). Astin (1993) described the typical values behind excel-lence in education as reputation and resources, whereas he argued for “talent development,” focused more directly on the basic purpose of higher education. In resources, Astin included money, high-quality faculty, and high-quality students. Astin described reputation as a pyramid with a few well-known univer-sities on top and two-year community colleges and most smaller four-year universities on the bottom with no systematic research justifying an institution’s position in the pyramid. This conflates quality with exclusivity, inaccessibility, and privilege. Higher education in general is thus granted a measure of quality simply because not all people participate. Thus, Astin (1993) describes an American folklore of reputation in higher education. Ball (1985) defined excellence as having high, almost unattainable, standards. Meeting such standards requires excellent inputs and outputs (Moodie, 1986), which would make access to higher education even more limited. Ironically, this focus on attracting exceptional students reduces the need for quality teaching—as Harvey and Green note, “It does not matter that teaching may be unexceptional—the knowledge is there, it can be assimilated” (1993, p. 12). This view of quality has been described in uni-versities in Britain, Germany, and the United States (Astin & Solomon, 1981; Frackmann, 1991; Moodie, 1988; Miller, 1990).
Quality as Perfection and ConsistencyHarvey and Green’s (1993) description of perfection and con-
sistency as quality is an educational translation of “zero defects” and “getting things right the first time.” This form of quality is more inclusive because it is possible for all institutions to achieve it. An institution can demonstrate quality by meeting pre-defined measurable standards. The focus is on the process and
22 Quality Approaches in Higher Education Vol. 6, No. 2asq.org/edu
conformance to specifications, rather than stressing inspection as a means to quality (Peters & Waterman, 1982). This echoes Deming’s principle, “Cease dependence on inspection to achieve quality” (Deming, 1986) and more recently, the Accreditation Board for Engineering and Technology’s (ABET) policy that “It is not necessary to assess the level of attainment of an outcome for every graduate. Similarly, it is not necessary to assess the level of attainment for an outcome every year. Appropriate statistical sampling procedures may be used in the assessment of outcomes and objectives” (ABET, 2014).
Quality as Fitness for PurposeFitness for purpose provides another approach to defining
quality, which resonates with a desire to recognize a diversity of faculty goals and a diversity of institutional missions. While Harvey and Green (1993) define fitness for purpose as how well the service meets the expectations of the customer, there is no clear agreement on who the customers are in the case of higher education. Some customers who have been associated with higher education are students, parents, employers, and taxpayers (Jauch & Orwig, 1997; Mazelan, 1991; Collins, Cockburn, & MacRobert, 1990; Harvey & Green, 1993). In the case of higher education, there is also concern that customers are not in the best position to know what the specifications should be, particularly if the students are viewed as the customers (Marchese, 1991; Roberts & Higgins, 1992). If we consider the institutional mis-sion as fitness for purpose, the institution can be judged by how effectively and efficiently it achieves its mission, based on the quality assurance mechanism the university has in place (Harvey & Green, 1993). Noting that an institution’s mission and its qual-ity assurance mechanism may not align with consumers and their view of quality, it is not surprising that student satisfaction may not align with other measures of quality (Sallis & Hingley, 1991).
Quality as Value for MoneyThis interpretation assumes that quality can be defined in
economic terms. This approach levels the playing field of excep-tionality by considering what an institution achieves based on the students it attracts and the resources it consumes. In higher edu-cation in the United States, research expenditures are one of the primary measures of quality (Jennings, 1989; Cross, Wiggins, & Hutchings, 1990; Hutchings & Marchese, 1990; Millard, 1991). Measures of efficiency may not be good measures of effective-ness (Yorke, 1991; Yorke, 1992). Sensicle (1991) points out that there may be a tendency to rely solely on performance indicators to measure quality, and writes, “important qualitative aspects of performance and progress in higher education might be missed or submerged” (p. 16). Harvey and Green (1993) suggested
customer charters as a way to establish a set of standards of what a customer should expect for the money they pay, thus establishing a measure of quality. While such charters are intended to create a competitive market for higher quality, they have more commonly been used to set a standard practice for maintaining quality.
Quality as TransformationTransformation is a change of form, which can be documented
qualitatively, such as ice being transformed into water—while the temperature can be documented quantitatively; the change from solid to liquid is qualitative (Harvey & Green, 1993). In regard to education, the transformation process can be applied as doing something to the consumer, rather than doing something for the consumer (Elton, 1992). This transformational view of higher education even applies to the construction of new knowl-edge, because we are not just adding to the research, but are intertwined within the research we conduct (Kuhn, 2012; Price, 1963; Lakatos & Musgrave, 1970; Mullins & Mullins, 1973; Holten, 1988). Transformation might be achieved by enhancing or empowering the consumer. Enhancing the consumer can be related back to the inputs and outputs from the previous quality categories because with a value added, the conclusion would be to find a way to measure the value added, and perhaps miss the qualitative nature of quality added. Muller and Funnell (1992) argue for transformation in value added by explaining that learn-ers should be participants in their own learning and evaluating processes. This is closely aligned with empowering the consumer, which involves giving power over to the consumer to transform (Harvey & Burrows, 1992). Empowering the student in higher education will give them a chance to make decisions about their own learning (Wiggins, 1990). This self-empowerment can lead to student evaluations, student charters, self-selecting classes, and their critical thinking ability (Harvey & Green, 1993). Critical thinking cannot be learned solely through traditional lectures: “This requires an approach to teaching and learning that goes beyond requiring students to learn a body of knowledge and be able to apply it analytically. Critical thinking is about encourag-ing students to challenge preconceptions; their own, their peers and their teachers” (Harvey & Green, 1993, p. 26). Quality in terms of transformation of students is seen as “the extent to which the education system transforms the conceptual ability and self-awareness of the student” (Harvey & Green, 1993, p. 26).
These definitions of the nature of quality in higher education provide a framework for interpreting open-ended responses of faculty defining quality teaching. By classifying engineering fac-ulty based on their definitions of quality teaching, the researchers describe the conditions for change, and the conditions facing those who promote change, such as faculty development professionals.
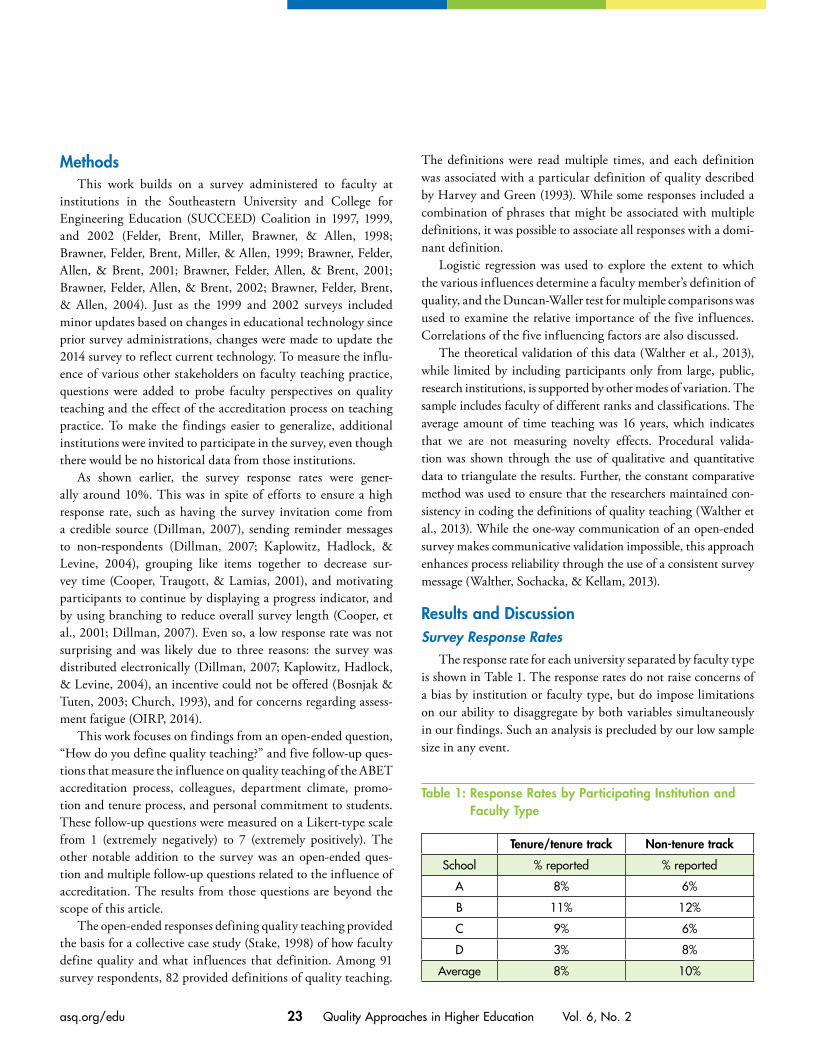
23 Quality Approaches in Higher Education Vol. 6, No. 2asq.org/edu
MethodsThis work builds on a survey administered to faculty at
institutions in the Southeastern University and College for Engineering Education (SUCCEED) Coalition in 1997, 1999, and 2002 (Felder, Brent, Miller, Brawner, & Allen, 1998; Brawner, Felder, Brent, Miller, & Allen, 1999; Brawner, Felder, Allen, & Brent, 2001; Brawner, Felder, Allen, & Brent, 2001; Brawner, Felder, Allen, & Brent, 2002; Brawner, Felder, Brent, & Allen, 2004). Just as the 1999 and 2002 surveys included minor updates based on changes in educational technology since prior survey administrations, changes were made to update the 2014 survey to reflect current technology. To measure the influ-ence of various other stakeholders on faculty teaching practice, questions were added to probe faculty perspectives on quality teaching and the effect of the accreditation process on teaching practice. To make the findings easier to generalize, additional institutions were invited to participate in the survey, even though there would be no historical data from those institutions.
As shown earlier, the survey response rates were gener-ally around 10%. This was in spite of efforts to ensure a high response rate, such as having the survey invitation come from a credible source (Dillman, 2007), sending reminder messages to non-respondents (Dillman, 2007; Kaplowitz, Hadlock, & Levine, 2004), grouping like items together to decrease sur-vey time (Cooper, Traugott, & Lamias, 2001), and motivating participants to continue by displaying a progress indicator, and by using branching to reduce overall survey length (Cooper, et al., 2001; Dillman, 2007). Even so, a low response rate was not surprising and was likely due to three reasons: the survey was distributed electronically (Dillman, 2007; Kaplowitz, Hadlock, & Levine, 2004), an incentive could not be offered (Bosnjak & Tuten, 2003; Church, 1993), and for concerns regarding assess-ment fatigue (OIRP, 2014).
This work focuses on findings from an open-ended question, “How do you define quality teaching?” and five follow-up ques-tions that measure the influence on quality teaching of the ABET accreditation process, colleagues, department climate, promo-tion and tenure process, and personal commitment to students. These follow-up questions were measured on a Likert-type scale from 1 (extremely negatively) to 7 (extremely positively). The other notable addition to the survey was an open-ended ques-tion and multiple follow-up questions related to the influence of accreditation. The results from those questions are beyond the scope of this article.
The open-ended responses defining quality teaching provided the basis for a collective case study (Stake, 1998) of how faculty define quality and what influences that definition. Among 91 survey respondents, 82 provided definitions of quality teaching.
The definitions were read multiple times, and each definition was associated with a particular definition of quality described by Harvey and Green (1993). While some responses included a combination of phrases that might be associated with multiple definitions, it was possible to associate all responses with a domi-nant definition.
Logistic regression was used to explore the extent to which the various influences determine a faculty member’s definition of quality, and the Duncan-Waller test for multiple comparisons was used to examine the relative importance of the five influences. Correlations of the five influencing factors are also discussed.
The theoretical validation of this data (Walther et al., 2013), while limited by including participants only from large, public, research institutions, is supported by other modes of variation. The sample includes faculty of different ranks and classifications. The average amount of time teaching was 16 years, which indicates that we are not measuring novelty effects. Procedural valida-tion was shown through the use of qualitative and quantitative data to triangulate the results. Further, the constant comparative method was used to ensure that the researchers maintained con-sistency in coding the definitions of quality teaching (Walther et al., 2013). While the one-way communication of an open-ended survey makes communicative validation impossible, this approach enhances process reliability through the use of a consistent survey message (Walther, Sochacka, & Kellam, 2013).
Results and DiscussionSurvey Response Rates
The response rate for each university separated by faculty type is shown in Table 1. The response rates do not raise concerns of a bias by institution or faculty type, but do impose limitations on our ability to disaggregate by both variables simultaneously in our findings. Such an analysis is precluded by our low sample size in any event.
Table 1: Response Rates by Participating Institution and Faculty Type
Tenure/tenure track Non-tenure track
School % reported % reported
A 8% 6%
B 11% 12%
C 9% 6%
D 3% 8%
Average 8% 10%
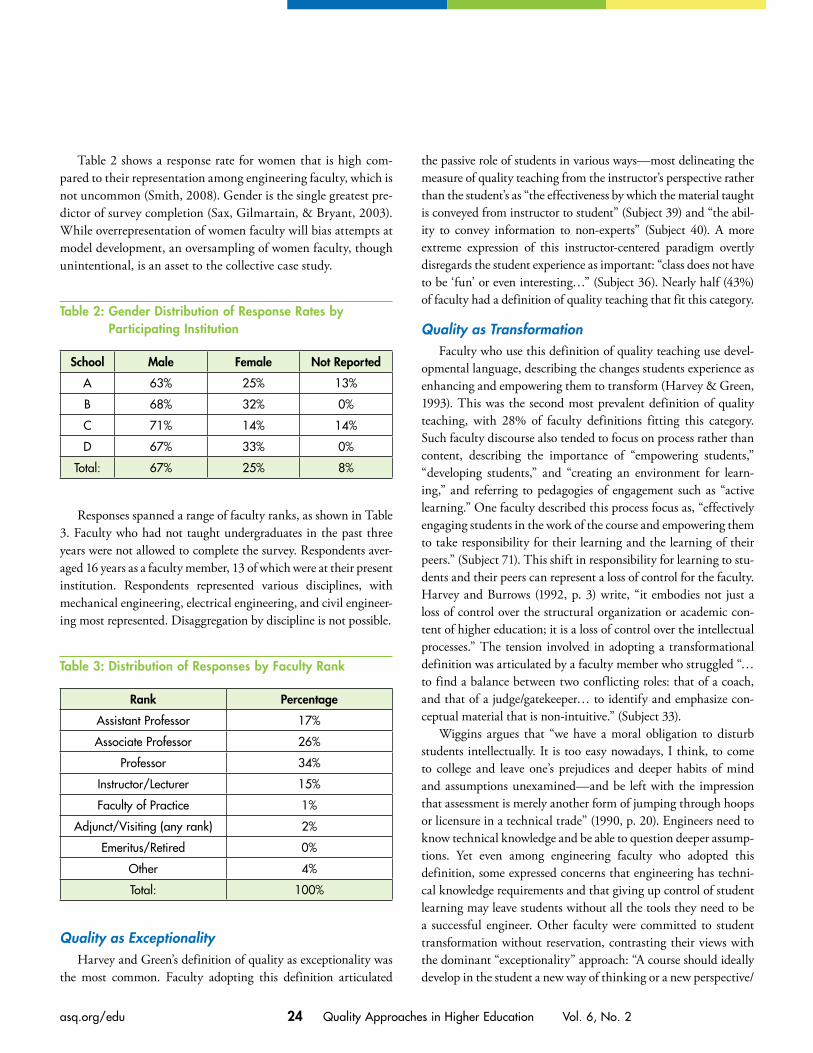
24 Quality Approaches in Higher Education Vol. 6, No. 2asq.org/edu
Table 2 shows a response rate for women that is high com-pared to their representation among engineering faculty, which is not uncommon (Smith, 2008). Gender is the single greatest pre-dictor of survey completion (Sax, Gilmartain, & Bryant, 2003). While overrepresentation of women faculty will bias attempts at model development, an oversampling of women faculty, though unintentional, is an asset to the collective case study.
Table 2: Gender Distribution of Response Rates by Participating Institution
School Male Female Not Reported
A 63% 25% 13%
B 68% 32% 0%
C 71% 14% 14%
D 67% 33% 0%
Total: 67% 25% 8%
Responses spanned a range of faculty ranks, as shown in Table 3. Faculty who had not taught undergraduates in the past three years were not allowed to complete the survey. Respondents aver-aged 16 years as a faculty member, 13 of which were at their present institution. Respondents represented various disciplines, with mechanical engineering, electrical engineering, and civil engineer-ing most represented. Disaggregation by discipline is not possible.
Table 3: Distribution of Responses by Faculty Rank
Rank Percentage
Assistant Professor 17%
Associate Professor 26%
Professor 34%
Instructor/Lecturer 15%
Faculty of Practice 1%
Adjunct/Visiting (any rank) 2%
Emeritus/Retired 0%
Other 4%
Total: 100%
Quality as ExceptionalityHarvey and Green’s definition of quality as exceptionality was
the most common. Faculty adopting this definition articulated
the passive role of students in various ways—most delineating the measure of quality teaching from the instructor’s perspective rather than the student’s as “the effectiveness by which the material taught is conveyed from instructor to student” (Subject 39) and “the abil-ity to convey information to non-experts” (Subject 40). A more extreme expression of this instructor-centered paradigm overtly disregards the student experience as important: “class does not have to be ‘fun’ or even interesting…” (Subject 36). Nearly half (43%) of faculty had a definition of quality teaching that fit this category.
Quality as TransformationFaculty who use this definition of quality teaching use devel-
opmental language, describing the changes students experience as enhancing and empowering them to transform (Harvey & Green, 1993). This was the second most prevalent definition of quality teaching, with 28% of faculty definitions fitting this category. Such faculty discourse also tended to focus on process rather than content, describing the importance of “empowering students,” “developing students,” and “creating an environment for learn-ing,” and referring to pedagogies of engagement such as “active learning.” One faculty described this process focus as, “effectively engaging students in the work of the course and empowering them to take responsibility for their learning and the learning of their peers.” (Subject 71). This shift in responsibility for learning to stu-dents and their peers can represent a loss of control for the faculty. Harvey and Burrows (1992, p. 3) write, “it embodies not just a loss of control over the structural organization or academic con-tent of higher education; it is a loss of control over the intellectual processes.” The tension involved in adopting a transformational definition was articulated by a faculty member who struggled “…to find a balance between two conflicting roles: that of a coach, and that of a judge/gatekeeper… to identify and emphasize con-ceptual material that is non-intuitive.” (Subject 33).
Wiggins argues that “we have a moral obligation to disturb students intellectually. It is too easy nowadays, I think, to come to college and leave one’s prejudices and deeper habits of mind and assumptions unexamined—and be left with the impression that assessment is merely another form of jumping through hoops or licensure in a technical trade” (1990, p. 20). Engineers need to know technical knowledge and be able to question deeper assump-tions. Yet even among engineering faculty who adopted this definition, some expressed concerns that engineering has techni-cal knowledge requirements and that giving up control of student learning may leave students without all the tools they need to be a successful engineer. Other faculty were committed to student transformation without reservation, contrasting their views with the dominant “exceptionality” approach: “A course should ideally develop in the student a new way of thinking or a new perspective/

25 Quality Approaches in Higher Education Vol. 6, No. 2asq.org/edu
lens into the world. Just exposure to new information or even a new skillset is not indicative of a high quality course.” (Subject 38).
Quality as Fitness for PurposeThis definition was described by 24% of faculty, using terms
such as “ability to meet specific legitimate learning objectives” and “mastery of learning outcomes.” Faculty described learn-ing objectives and outcomes more generally, such as, “establish clear learning outcomes for the course and providing meaning-ful learning opportunities that foster mastery of the outcomes” (Subject 84) and “students attain learning outcomes en masse...” (Subject 90). In those cases, it is unclear if those learning outcomes are chosen by individual faculty or the department, college, or uni-versity. Similarly, these general descriptions are unclear as to what those learning objectives are and whether certain outcomes are more important than others to the faculty member.
Although faculty did not generally name the specific learning objectives or outcomes tied to a course, some were more specific about the purpose of the learning outcomes. Some faculty iden-tified the purpose as application to practice, such as “How well the students can retain knowledge in the future and how well students are able to apply what they’ve learned in the future” (Subject 42) and “teaching the topics which are important to the students’ future success…” (Subject 66). Faculty that define qual-ity teaching in consideration of the student’s future attempt to frame quality from the perspective of the student. This is called “quality in perception” (Harvey & Green, 1993, p.20; Sallis & Hingley, 1991). The definitions of quality teaching that fit this category are vague and varied because there is uncertainty and variation in defining the “purpose” of higher education generally and in engineering particularly.
Quality as Perfection and ConsistencyThe definitions of quality teaching received in this study
did not resonate with this “zero defects” category. One
respondent stressed “clarity and consistency in grading proce-dures” (Subject 89), and was coded as having this definition. Srikanthan and Dalrymple (2003) focused on the stakeholders in higher education and expected that employees such as faculty and administrators would view quality in this category, but we do not find this to be the case in our sample.
Quality as Value for MoneyNo respondents specifically addressed financial value, return
on investment, specific performance indicators, or student/teacher charters on criteria for teaching—all of which would fit this definition. One respondent was classified in this category who cited ABET as an external authority. Turning to an entity outside the university to set standards of quality is character-istic of this definition. This respondent’s definition of quality teaching included “facilitating student learning of the specific technical and non-technical (includes ABET a-k) information and skills that apply to the course in question” (Subject 13).
Influences on Quality Teaching Five possible influences—the ABET accreditation process, col-
leagues, department climate, the promotion and tenure process, and personal commitment to students—were studied for their relationship to a respondent’s definition of quality using logistic regression. The follow-up questions were measured on a Likert-type scale from 1 (extremely negatively) to 7 (extremely positively). The definition of quality teaching was a categorical outcome vari-able and the five influences were independent variables. Neither gender nor faculty rank were found to play a role in a faculty member’s definition of quality teaching or the nature or extent of influences on teaching quality, so those were removed from the model and are not discussed further. Table 4 shows the faculty’s definition of teaching quality a space before the 20 coded as one of the five Harvey and Green’s taxonomy and faculty’s Likert scale questions of what influences their teaching quality.
Table 4: Means of Each of the Influences by Quality
Nature of Quality ABET Colleagues Department Climate
Tenure and Promotion
Personal Commitment
None 4.1 5.5 5.1 3.8 6.4
Exceptional 3.9 5.1 4.6 3.9 6.6
Perfection 4.0 4.0 2.0 3.0 6.0
Fitness for purpose 4.6 5.7 5.1 3.8 6.7
Value for money 5.0 4.0 4.0 3.0 6.0
Transformational 4.0 5.6 4.8 4.0 6.7

26 Quality Approaches in Higher Education Vol. 6, No. 2asq.org/edu
Table 5: Means of Each of the Influences by Gender
Gender ABET Colleagues Department Climate
Tenure and Promotion
Personal Commitment
Not reported 3.0 6.0 5.9 3.9 6.9
Male 4.1 5.3 4.5 3.8 6.6
Female 4.5 5.7 5.5 4.1 6.3
Table 6: Means of Each of the Influences by University
University ABET Colleagues Department Climate
Tenure and Promotion
Personal Commitment
A 4.2 5.4 4.6 3.8 6.2
B 4.3 5.6 4.8 3.8 6.8
C 3.9 4.8 4.5 4.2 6.7
D 4.0 6.2 5.8 4.0 6.8
Table 7: Means of Each of the Influences by Rank
Rank ABET Colleagues Department Climate
Tenure and Promotion
Personal Commitment
Assistant 4.0 5.2 4.8 3.8 6.6
Associate 4.2 5.3 4.5 3.9 6.5
Professor 3.9 5.4 4.8 3.8 6.7
Instructor 4.5 5.6 4.9 4.0 6.2
Only one influence was found to have a significant (p≤0.05) relationship to a respondent’s definition of quality in Table 4. With an odds ratio of 1.745, an increase of one unit on the reported influ-ence of ABET accreditation is associated with a respondent being 1.745 times more likely to define quality teaching as “fitness for purpose.” Because engineering accreditation provides a standard set of outcomes for engineering graduates (a common purpose), but provides flexibility in how those outcomes are achieved, this relationship can be explained. The greater challenge is explaining why no other relationships were observed between a respondent’s definition of quality teaching and the various influences. Whereas a faculty member’s definition of quality teaching was generally independent of their reported influence of the five factors studied, a pattern was observed among respondents’ reported influences—there appeared to be a consistent ranking of the influences as shown in Tables 5, 6, and 7. To control for the effect of comparing multiple means, the Duncan-Waller test for multiple comparisons was used, and the results are shown in Table 8. All the means are
significantly different, except the ABET accreditation process and the promotion and tenure process.
Table 8: Duncan-Waller Test for Multiple Comparisons of Influences on Teaching Quality
Duncan Grouping Mean Influence
A 6.6 Personal commitment to students
B 5.4 Colleagues
C 4.8 Departmental climate
4.1 ABET accreditation
D 3.8 The promotion and tenure process
Note: Means with the same letter are not significantly different (p=0.05), N=90 or 91.
Personal commitment to students has significantly more reported influence than colleagues, who have significantly more reported influence than the departmental climate, which,

27 Quality Approaches in Higher Education Vol. 6, No. 2asq.org/edu
in turn, has significantly more reported influence than ABET accreditation and the promotion and tenure process. The promo-tion and tenure process is a ritual that formalizes some aspects of the department climate, but respondents draw a distinction between the two. In other words, colleagues and the department can communicate values and practices related to quality teaching that are not embodied in the promotion and tenure process—policies are slower to change than people.
It is discouraging to note that the average influence of the promotion and tenure process is negative. Based on the open-ended responses of faculty, the focus of that process on research grants and publications at these universities has a negative effect on faculty’s teaching quality.
The ranking of the five influences studied was robust—the ranking was the same regardless of gender, faculty rank, and uni-versity. This has implications for faculty development practices. The strong influence of colleagues may at first appear as a bar-rier to change—because even if a department has expectations regarding quality teaching (such as by requiring faculty to attend teaching workshops), a junior faculty member may reduce her or his commitment to quality teaching based on conversations with colleagues. Yet this influence represents an opportunity as well—this underscores the potential for positive influence through mentoring by colleagues—particularly where a teach-ing mentor is identified independently from a research mentor. Pairing senior and junior colleagues as they engage in faculty development related to teaching may also prove effective.
One university had a notably higher rating for the influence of the promotion and tenure process, so there is hope that a uni-versity’s policies on promotion and tenure can have a positive effect on faculty’s teaching quality. Respondents at that univer-sity also indicated a higher influence from colleagues (p=0.05, odds ratio = 0.37), so all other things being equal, respondents at that university rate the influence of colleagues 0.37 higher on average than at other universities in the sample.
Based on the consistency of the rank order of the five influences, it is not surprising that responses for some of the influences are significantly correlated. Specifically, there is a relationship between the influence of colleagues and department climate (r=0.67, p<0.01), department climate and the promotion and tenure process (r=0.33, p<0.01), and colleagues and personal commitment to students (r=0.28, p<0.05). These correlations neither provide additional insight nor diminish the meaningful-ness of the earlier results.
Responses to “ABET accreditation process” as an influence in teaching quality are unrelated to gender, total years as a pro-fessor, and institution. Using “extremely negatively” (1) as the referent, faculty who responded more positively were less likely
to “give students the option of working in teams (two or more) to complete homework” [b = -0.41, χ2 (1, N = 89) = 6.24, p < 0.05 (odds ratio = 0.665)]. This is an interesting finding, since ABET accreditation wants students to be able to work in teams as an outcome. This research has shown that faculty with a nature of quality of fitness for purpose are more likely to see the benefit of ABET accreditation standards, perhaps these faculty are focused on fitness for purpose, and do not see the purpose in giving stu-dents the option of working in teams. Responses to “colleagues” as an influence in teaching quality are unrelated to gender, total years as a professor, and institution. Using “somewhat negative” (2) as the referent group because none of the participants chose the lowest response, faculty who responded more positively were more likely to “require students to work in teams (two or more) to complete homework” [b = 0.36, χ2 (1, N = 89) = 4.26, p < 0.05 (odds ratio = 1.429)].
“Department climate” responses as an influence in teach-ing quality are unrelated to gender, total years as a professor, and institution. Using “extremely negatively” (1) as the referent group, faculty who responded more positively were more likely to “require students to work in teams (two or more) to complete homework” [b = 0.40, χ2 (1, N = 88) = 5.42, p < 0.05 (odds ratio = 1.488)].
The influencers of “promotion and tenure process” and “per-sonal commitment to students” did not have any significant relationship to teaching methods.
ConclusionsEngineering faculty do not have a common understanding
of quality teaching, nor were all anticipated definitions present. Faculty developers and department chairs must consider these different definitions of quality teaching to reach diverse fac-ulty. Faculty whose definition of quality teaching resonates with accreditation may be well-suited to explaining the accredita-tion process to colleagues and in sharing accomplishments with accrediting bodies. This is especially important in that faculty who view quality as exceptionality are likely to view accredita-tion processes as a waste of time and money. Department chairs and upper administration may also be interested in faculty who view the nature of quality as transformational because those fac-ulty are more likely to use student-centered teaching techniques, which bolster recruitment and retention (Astin, 1993; Cabrera, Nora, Bernal, Terenzini, & Pascarella, 1998; Cooper, 1990; Gamson, 1994; Goodsell, 1992; Johnson, Johnson, & Smith, 1991; Kulik, Kulik, & Cohen, 1979; Levine & Levine, 1991; McKeachie, 1986; McKeachie, 1990; Murray, 1998; Pascarella & Terenzini, 1991; Prince, 2004). These faculty may be best suited to “master teacher” roles.

28 Quality Approaches in Higher Education Vol. 6, No. 2asq.org/edu
Faculty developers should address the specific needs of faculty with an exceptionality view of quality teaching by explaining the research on how students learn and the best teaching prac-tices from that research. Faculty with the transformative value of quality teaching could use more focused training on specific teaching methods. The fitness for purpose faculty could use a combination of an explanation of the research, which would show the purpose of specific teaching methods, and then a how-to workshop on student-centered teaching methods.
Future research on how faculty express personal commit-ment to teaching quality would likely reveal further underlying beliefs about teaching quality. The faculty surveyed reported that “myself” as the most important influencer of their teaching qual-ity, which suggests that interview methods are an appropriate approach to probe how faculty think about quality teaching and how that thinking affects their pedagogical choices. There should be further exploration of the five different aspects of quality teach-ing within departments to see if they are recognized and addressed or ignored. Faculty with certain perspectives may not have a voice in their department. Another important question is how depart-ments that have diverse views on the nature of teaching quality are perceived differently by the students in those departments and whether those differences result in varying student outcomes.
References:ABET (2014). Pre-visit Preparation, Retrieved from http://www.abet.org/pre-visit-preparation-module2/.
Astin, A. W. & Solomon, L. C. (1981). Are reputational ratings required to measure quality? Change, 13(7), 14-19.
Astin, A. W. (1993). What matters in college? Four critical years revisited. San Francisco, CA: Jossey-Bass. 482.
Ball, C. (1985). Fitness for purpose: Essays in higher education. In D. Urwin (Ed.). Society for Research into Higher Education & NFER-Nelson.
Bosnjak, M., & Tuten, T. L. (2003). Prepaid and promised incentives in web surveys an experiment. Social Science Computer Review, 21(2), 208-217.
Brawner, C. E., Felder, R. M., Brent, R., Miller, T. K., & Allen, R. H. (1999, November). Faculty teaching practices in an engineering educa-tion coalition. In Frontiers in Education Conference, 1999. FIE'99. 29th Annual (Vol. 1, 12A5-1). IEEE.
Brawner, C. E., Felder, R. M., Allen, R. H., Brent, R., & Miller, T. K. (2001, June). A comparison of electronic surveying by e-mail and web. In 2001 Annual Conference and Exposition Proceedings.
Brawner, C. E., Felder, R. M., Allen, R., & Brent, R. (2002). A survey of faculty teaching practices and involvement in faculty development activities. Journal of Engineering Education, 91(4), 393-396.
Brawner, C. E., Felder, R. M., Allen, R. H., & Brent, R. (2004, October). How do engineering faculty use instructional technology? In Frontiers in Education Conference, 2004. FIE 2004. 34th Annual (pp. F1E-6). IEEE.
Borrego, M., Froyd, J. E., Henderson, C., Cutler, S., & Prince, M. (2013). Influence of engineering instructors’ teaching and learning beliefs on pedagogies in engineering science courses. International Journal of Engineering Education, 29(6), 34-58.
Cabrera, A. F., Nora, A., Bernal, E. M., Terenzini, P. T., & Pascarella, E. T. (1998, November). Collaborative learning: Preferences, gains in cognitive and affective outcomes, and openness to diversity among col-lege students. Association for the Study of Higher Education Annual Meeting, Miami, FL.
Church, A. H. (1993). Estimating the effect of incentives on mail survey response rates: A meta-analysis. Public Opinion Quarterly, 57(1), 62-79.
Collins, D., Cockburn, M., & MacRobert, I. (1990). The Applicability of BS 5750 to college operations: First year report. November 1989-October 1990. Sandwell College.
Cooper, J., Prescott, L., Cook, L., Smith, R., Mueck, & Cuseo, J. (1990). Cooperative learning and college instruction: Effective use of student learning teams. Long Beach, CA: California State University Foundation.
Cross, K. P., Wiggins, G., & Hutchings, P. (1990). Assessment 1990: Understanding the implications. The AAHE Assessment Forum. Conference Proceedings (5th, Washington, DC, June 27-30, 1990).
Deming, W. E. (1986). Out of the crisis, Cambridge, MA: Massachusetts Institute of Technology.
Dillman, D. A., (2007). Mail and internet surveys: The tailored design method, (2nd ed.) Hoboken, NJ: John Wiley Co.
Eagan, K., Stolzenberg, E. B., Lozano, J. B., Aragon, M. C., Suchard, M. R., & Hurtado, S. Undergraduate teaching faculty: The 2013-2014 HERI faculty survey.
Elton, L. (1992). Research, teaching, and scholarship in an expanding higher education system. Higher Education Quarterly, 46(3), 252-268.
Felder, R. M., Brent, R., Miller, T. K., Brawner, C. E., & Allen, R. H. (1998, November). Faculty teaching practices and perceptions of institutional attitudes toward teaching at eight engineering schools. In Frontiers in Education Conference, 1998. FIE'98. 28th Annual (Vol. 1, 101-105). IEEE.
Frackmann, E. (1991). Perspectives of financing higher education in Germany. Higher Education Management, 3(3), 226-38.
Gamson, Z. F. (1994). Collaborative learning comes of age. Change: The Magazine of Higher Learning, 26(5), 44-49.
Garvin, D. A. (1988). Managing quality: The strategic and competitive edge. New York: The Free Press.
29 Quality Approaches in Higher Education Vol. 6, No. 2asq.org/edu
Goodsell, A. S., Maher, M., Tinto, V. (1992). Collaborative learning: A sourcebook for higher education. University Park, PA: National Center on Postsecondary Teaching, Learning, and Assessment. Pennsylvania State University.
Harvey, L., & Burrows, A. (1992). Empowering students. New Academic, 1(3), 2-3.
Harvey, L., & Green, D. (1993). Defining quality. Assessment & Evaluation in Higher Education, 18(1), 9-34.
Hutchings, P., & Marchese, T. (1990). Watching assessment: Questions, stories, prospects. Change: The Magazine of Higher Learning, 22(5), 12-38.
Jauch, L. R., & Orwig, R. A. (1997). A violation of assumptions: Why TQM won't work in the ivory tower. Journal of Quality Management, 2(2), 279-292.
Jennings, Jr., E. T. (1989). Accountability, program quality, outcome assessment, and graduate education for public affairs and administration. Public Administration Review, 49(5), 438-46.
Johnson, D. W., Johnson, R. T., & Smith, K. (1991a). Active learning: Cooperation in the College Classroom. Edina, MN: Interaction Book Company.
Kaplowitz, M. D., Hadlock, T. D., & Levine, R. (2004). A comparison of web and mail survey response rates. Public Opinion Quarterly, 68(1), 94-101.
Kenny, S. S., Thomas, E., Katkin, W., Lemming, M., Smith, P., Glaser, M., & Gross, W. (2001). Reinventing undergraduate education: Three years after the Boyer Report. Retrieved August 24, 2014, Retrieved from https://dspace.sunyconnect.suny.edu/bitstream/handle/1951/26013/Reinventing+Undergraduate+Education+%28Boyer+Report+II%29.pdf?sequence=1.
Kuhn, T. S. (2012). The structure of scientific revolutions. Chicago, IL: University of Chicago Press.
Kulik, J. A., Kulik, C. L. C., & Cohen, P. A. (1979). A meta-analysis of outcome studies of Keller's personalized system of instruction. American Psychologist, 34(4), 307.
Lakatos, I., & Musgrave, A. (1970). Criticism and the growth of knowl-edge, Cambridge: Cambridge University Press.
Levine, M. E. & Levine, R. I. (1991). A critical examination of aca-demic retention programs for at-risk minority college students. Journal of College Student Development, 32(4), 323-334.
Marchese, T. (1991). TQM reaches the Academy. AAHE Bulletin, 44(3), 3-9.
Mazelan, P., Brannigan, C., Green, D., Tormay, P., & O’Shea, J. (1991). Using measure of student satisfaction: The implications of a user-led strat-egy of quality assurance in higher education. Broadcast, 18(Winter), 4-5.
McKeachie, W. J. (1986). Teaching and learning in the college class-room: A review of the research literature (Vol. 86). Ann Arbor, MI: University of Michigan Press.
McKeachie, W. J. (1990). Research on college teaching: The historical background. Journal of Educational Psychology, 82(2), 189-200.
Millard, R. M. (1991). Governance, quality, and equity in the United States. In R.O. Bergdahl, G.C. Moodie, and I.J. Spitzberg (Eds.), Quality and Access in Higher Education, pp. 42-57. Buckingham: Open University Press.
Miller Jr, L. H. (1990). Forum: Hubris in the academy: Can teaching survive an overwhelming quest for excellence? Change: The Magazine of Higher Learning, 22(5), 9-53.
Moodie, G. C., (1986). Standards and criteria for higher education. Society for Research into Higher Education. Milton Keynes: Open University Press.
Moodie, G. C. (1988). The debates about higher education quality in Britain and the USA. Studies in Higher Education, 13(1), 5-13.
Muller, D., & Funnell, P. (1992). An exploration of the concept of quality in vocational education and training. Educational and Training Technology International, 29(3), 257-261.
Mullins, N. C. & Mullins, C. J. (1973). Theories and theory groups in contemporary American sociology. New York, NY: Harper & Row.
Murray, T. (1998). Authoring knowledge-based tutors: Tools for con-tent, instructional strategy, student model, and interface design. The Journal of the Learning Sciences, 7(1), 5-64.
National Academy of Engineering. Diversity in engineering: Managing the workforce of the future. Washington, DC: The National Academies Press, 2002.
National Research Council. (1996). From analysis to action: Undergraduate education in science, mathematics, engineering, and technology. Washington, DC: National Academy Press.
National Research Council. (1999). Transforming undergraduate education in science, mathematics, engineering, and technology. Committee on Undergraduate Science Education, Center for Science, Mathematics, and Engineering Education. Washington, DC: National Academy Press.
National Science Foundation. (1996). Shaping the future: New expecta-tions for undergraduate education in science, mathematics, engineering, and technology (NSF 96-139). Washington, DC: National Science Foundation.
OIRP (Office of Institutional Research and Planning), North Carolina State University (2014). Survey Advisory Committee. Retrieved from http://oirp.ncsu.edu/srvy/sac.
Owlia, M. S., & Aspinwall, E. M. (1996). A framework for the dimen-sions of quality in higher education. Quality Assurance in Education, 4(2), 12-20.
Pascarella, E. T., & Terenzini, P. T. (1991). How college affects students: Findings and insights from twenty years of research: San Francisco, CA: Jossey-Bass.
30 Quality Approaches in Higher Education Vol. 6, No. 2asq.org/edu
Peters, T. J., & Waterman, R. H. (1982). In search of excellence: Lessons from America's best-run companies. New York, NY: Harper & Row.
Pfeffer, N., & Coote, A. (1991). Is quality good for you? A critical review of quality assurance in welfare services (No. 5). Institute for Public Policy Research.
Price, D. D. S. (1963). Big science, little science. New York, NY: Columbia University, 119-119.
Prince, M. (2004). Does active learning work? A review of the research. Journal of Engineering Education, 93(3), 223-231.
Riley, D. (2003). Employing liberative pedagogies in engineering educa-tion. Journal of Women and Minorities in Science and Engineering, 9(2), 138-152.
Roberts, D., & Higgins, T. (1992). Higher education: The student experi-ence–the findings of a research programme into student decision-making and consumer satisfaction. Leeds, Heist.
Sallis, E., & Hingley, P. (1991). College quality assurance systems. Blagdon, England: Staff College.
Sax, L., Gilmartain, S., & Bryant, A. (2003). Assessing response rates and nonresponse bias in web and paper surveys. Research in Higher Education, 44(4), 409-432.
Sensicle, A. (1991, July). Quality assurance in higher education: The Hong Kong initiative. In HKCAA International Conference on Quality Assurance, Hong Kong (pp. 15-17).
Smith, W. (2008). Does gender influence online survey participation? A record-linkage analysis of university faculty online survey response behavior (research report). San Jose, CA: San Jose State University.
Smith, K. A., Douglas, T. C., & Cox, M. F. (2009). Supportive teaching and learning strategies in STEM education. New Directions for Teaching and Learning, 2009(117), 19-32.
Smith, K. A., Sheppard, S. D., Johnson, D. W., & Johnson, R. T. (2005). Pedagogies of engagement: Classroom‐based practices. Journal of Engineering Education, 94(1), 87-101.
Srikanthan, G., & Dalrymple, J. (2003). Developing alternative perspec-tives for quality in higher education. International Journal of Educational Management, 17(3), 126-136.
Stake, R. E. (1998). Case studies. In Denzin, N. K., and Lincoln Y. S. Strategies of qualitative inquiry. Thousand Oaks, CA: Sage. 86-109.
Wiggins, G. (1990). The case for authentic assessment. Washington, DC: ERIC Clearinghouse on Tests, Measurement, and Evaluation.
Walther, J., Sochacka, N. W., & Kellam, N. N. (2013). Quality in inter-pretive engineering education research: Reflections on an example study. Journal of Engineering Education, 102(4), 626-659.
Wankat, P. C., Felder, R. M., Smith, K. A., & Oreovicz, F. S. (2002). The scholarship of teaching and learning in engineering. Disciplinary styles in the scholarship of teaching and learning: Exploring common
ground, AAHE/Carnegie Foundation for the Advancement of Teaching, Washington, DC, 217-237.
Wankat, P. C., & Oreovicz, F. S. (1993). Teaching engineering. New York, NY: McGraw-Hill. 269-280.
Yorke, M. (1991). Performance indicators: Observations on their use in the assurance of course quality. CNAA Project Report, (30).
Yorke, M. (1992). Quality in higher education: A conceptualization and some observations on the implementation of a sectoral quality system. Journal of Further and Higher Education, 16(2), 90-104.
Jacqueline C. McNeil, Ph.D. is a research sci-entist for the College of Engineering at Purdue University. She will be starting at University of Louisville in Fall 2015 as an assistant professor in engineering fundamentals. McNeil is cur-rently investigating nontraditional student pathways in engineering and was a signifi-cant contributor in writing the National Science Foundation grant. She finished her Ph.D. in the engineering education depart-ment at Purdue University in December 2014. Her research is focused on engineering faculty perceptions of quality and on nontraditional students in engineering. McNeil was elected president of Engineering Education Student Government Association in 2013. Contact her at [email protected].
Matthew Ohland, Ph.D. is a professor of engineering education at Purdue University. His research on the longitudinal study of engineer-ing student development, team formation, peer evaluation, and extending the use of active and cooperative learning has been supported by more than $14.5 million from the National Science Foundation and the Sloan Foundation. With his collaborators, he has been recog-nized with the best paper in the Journal of Engineering Education in 2008 and 2011 and in IEEE Transactions on Education in 2011. Ohland is a Fellow of the American Society of Engineering Education and IEEE and has served on the IEEE Education Society Board of Governors, an associate editor of IEEE Transactions on Education, and chair of the Educational Research and Methods division of ASEE. Contact him at [email protected].
Jacqueline C. McNeil
Matthew Ohland
31 Quality Approaches in Higher Education Vol. 6, No. 2
asq.org/edu
Case Study: Application of DMAIC to Academic Assessment in Higher EducationAndrew S. Bargerstock and Sylvia R. Richards
AbstractAt a small university in the Midwestern part of the United States where Lean Six Sigma is a lively imperative, a newly trained kaizen team applied the Deming five-stage Define-Measure-Analyze-Improve-Control (DMAIC) methodology to streamline and improve efficiencies for an academic assessment process. In this case of the close-the-loop (CTL) report, the targeted process was a procedure for assessing effective delivery of course out-comes and for planning instructional improvements for all courses taught in the College of Business at Maharishi University of Management in Fairfield, IA. Through a structured lean improvement event (e.g., kaizen), a cross-functional team utilized its recent training in Lean Six Sigma to streamline the efficiency of the CTL process and boost faculty compli-ance. The enhanced CTL process reduced cycle time by two-thirds, removed frustrating non-value-added activity steps, discovered additional customer value, and boosted compli-ance rates significantly.
Keywords Continuous Improvement, Lean/Six Sigma/DMAIC, Quality Assurance, Process Management, Best Practices
IntroductionIn the decades since W. Edwards Deming (1986) began consulting with Japanese
industries in the 1950s on how to improve quality controls for production systems, the world has witnessed an evolution of organizational developmental philosophies that have moved sequentially from quality control to total quality management to lean management (lean). Although the roots of lean spring from Japanese manufacturing, Womack, Jones, and Roos (1990) revealed a more generic set of elements, rules, and tools that can be applied to any organization including manufacturing, merchandising, service-oriented, non-profit, governmental, and educational organizations.
In the late 1980s, Xerox Corporation adopted Deming’s Define, Measure, Analyze, Improve, Control (DMAIC) methodology to resolve inefficiencies in its business pro-cesses. Gradually, Xerox also used DMAIC as a tool to improve information flow into, through, and out of its educational clients (Kurt, 2004). George (2003) also demon-strated how continuous process improvement (CPI) methods have been adapted to service organizations.
Literature ReviewIn higher education, lean methods have been introduced in various forms. CPI initia-
tives have been incorporated within the classroom as experiential learning opportunities (Hand, Dolansky, Hanahan, Sundaram, & Tinsley, 2014). Systems thinking has been embraced as a conceptual framework within educational organizations in order to go beyond functional silos to sustain consistent improvement over time (Furst-Bowe, 2011). A business case was made for using Lean Six Sigma to support a systems-thinking and project-based approach for improvement in higher education (Simons, 2013). Emiliani (2015) has focused on implementing lean with instructional methods in a variety of ways.
Improving business
processes in
higher education
through DMAIC.

32 Quality Approaches in Higher Education Vol. 6, No. 2asq.org/edu
The DMAIC method has been increasingly utilized to solve problems in higher education administration (Ramanan & Ramanakumar, 2014). It has been applied in administrative practices to improve process consistency and to reduce cycle time in salary calculations in higher education institutions (Utecht & Jenicke, 2009). At Central Michigan University, DMAIC was adopted by information systems faculty for the purposes of aca-demic program design and curriculum development (Holmes, Jenicke, & Kumar, 2005). Sarda, Bonde, and Kallurkar (2006) demonstrated the role of DMAIC in a technical institution for continuously improving student results.
However, there is a lack of papers describing how DMAIC is used to streamline academic assessment processes. This arti-cle presents a case study applying the classic five-step DMAIC Lean Six Sigma procedure for improving business processes. At Maharishi University of Management, the timely and complete delivery of each course’s close-the-loop (CTL) report is needed by academic program directors who monitor student course sat-isfaction and faculty plans for improving their curriculum and classroom experience.
BackgroundSince 1999 when the Higher Learning Commission (HLC)
established the Academic Quality Improvement Program (AQIP), many institutions in higher education have been dis-covering ways to improve their quality improvement cultures (Higher Learning Commission, 2015). Maharishi University of Management is an accredited university located in Fairfield, IA, offering degrees with B.A., M.A., and Ph.D. programs in vari-ous academic disciplines. Overall, in spring 2015, enrollment for resident and online degree programs exceeded 1,400 students.
In 2012, executive leadership established a core group for applying tools of lean management to enhance communication with students, alumni, and faculty, while producing improve-ments to selected business processes. As enthusiasm and interest grew from these pilot projects, in 2013 the university decided to engage an outside consulting group to provide training in lean facilitation for a combined group of approximately 40 faculty and administrative leaders. After the training, the university’s lean steering committee approved a series of kaizen events to validate the training as pilot projects. Although there were some good results, it became apparent that the teams needed some additional techniques in data collection, baselining, and prob-lem analysis.
Consequently, in October 2014, two business faculty mem-bers, both certified lean facilitators, agreed to provide the next generation of training to a new set of faculty and administra-tors in conjunction with the executive leaders of the lean steering
committee team and leaders. Both facilitators possessed solid credentials. Thomas Palladino had earned a Six Sigma Black Belt and was an experienced human resources executive and trainer with more than 30 years of experience in corporate human resources management. The other certified lean facilitator and chair of the accounting department in the college of business, Andrew Bargerstock, had consulted in numerous lean projects on administrative processes within businesses, federal and state agency organizations, and universities.
The training was delivered in five, half-day sessions that cov-ered a discrete sequence of topics: lean history and structure, project selection, team selection, process mapping, baselining and data collection, root-cause analysis, future-state mapping, implement-ing and standardizing changes, and monitoring and assessment.
In the college of business, an MBA program administrator, Sylvia Richards, took the role of lead facilitator for the CTL report project and began building the framework for a kaizen event during the week of training. In the weeks that followed, she led a team toward improvement solutions.
This case study follows the five sequential DMAIC stages that were presented in the university’s lean management train-ing program. For this kaizen event, the five stages unfolded in this manner:
• Define—Selecting and planning the project.
• Measure—Gathering data on the current level of effectiveness of the process.
• Analyze—Mapping/understanding the process and discovering forms of waste.
• Improve—Utilizing collaborative problem solving to remove non-value-added elements.
• Control—Standardizing, monitoring, and managing process effectiveness.
Stage 1, Define: Selecting and Planning the Project. The selection and planning of the project involved identify-
ing the CTL project, determining the existence of a business case, and developing the project charter.
Identifying the CTL Project. When the MBA program administrator announced she was participating in the CPI train-ing in October 2014 and that she was looking for a project to complete during the training, one of the then business depart-ment co-chairs, Scott Herriott, jumped at the idea of a kaizen event on a critical departmental business process that he felt needed attention. As an accreditation team member for the North Central Association of Colleges and Schools (NCA), the depart-ment chair had many years of experience with onsite visits and evaluations of colleges and universities seeking new or renewed
33 Quality Approaches in Higher Education Vol. 6, No. 2asq.org/edu
accreditation. As a result of this expertise, the department chair had guided the university successfully through its own accredita-tion renewal in 2012, both with NCA and with the International Assembly of Collegiate Business Education (IACBE). From his passion for academic assessment and improvement methods that prove an institution delivers on what it purports to teach, he had developed a seven-question form called the CTL report as part of a series of assessment tools to demonstrate the department’s com-mitment to academic excellence and continuous improvement.
Determining the Business Case. The business case, or the cost/benefit of this project, was determined by analyzing its potential impact compared to cost. Because the purpose of the CTL report is course improvement, which ultimately is for the benefit and satisfaction of future students, this process can be seen as directly impacting the mission and goals of the university. To determine if there was a business case for this project, it was rated on the following selection criteria: high customer impact, high expected benefit, low cost to improve, high availability of data, and high ease of implementation using a five-point scale, with five rated as highest. The CTL project scored high in poten-tial impact. The marginal cost of doing the project was virtually zero, because it had already been determined that all participants would devote some time to a kaizen event. Thus, the business case was supported.
Developing the Project Charter. The project charter for the CTL project served as a focused articulation of the purpose and scope of the project, e.g., expected outcomes, names of the kaizen team members, expected length of the project, and speci-fication of deliverables. As stated in the project charter, the scope of the CTL project and the expected outcome was “to improve compliance rate of faculty submissions of the CTL reports. At the end of each course, the professor evaluates student learning outcomes and makes recommendations for changes to improve the course in the next offering. CTL reports are reviewed by the department chair and are made available to accreditation teams.” As the developer of the CTL report for that purpose, the depart-ment chair was named the process owner. Normally, a kaizen team should include people who work directly in the process to take advantage of their experience and also some people from
outside the process, who provide an independent non-attached perspective. The project facilitator was alert to getting out-side perspectives and enlisted a cross-functional team from the lean training event. Impromptu conversations were held with available kaizen team members in lieu of more formal kaizen meetings because of scheduling challenges with faculty and time constraints of the five-day lean training course.
Stage 2, Measure: Gathering data on the current level of effectiveness of the process.
The measurement phase took two directions. First, it was important to ascertain the productivity and effectiveness level of the current state of the process. Although faculty cooperated in preparing CTL reports leading up to the accreditation visit in 2012, the compliance rate had slipped dramatically in 2014 to approximately 10% of the expected reports, despite regular reminders to faculty. Hearing complaints about the CTL pro-cess as “cumbersome, complicated, and tedious,” the department chair wanted to get some fresh eyes to evaluate how the process could be simplified and improved. Secondly, the kaizen team wanted to get a clear definition of value from both primary and secondary customers.
Determining the Voice of the Customer. In lean man-agement, customer satisfaction is the goal, and customer specifications drive the improvement process. Consequently, the voice of the customer and baselining customer satisfaction are key to lean processes. In the CTL project, the primary customers are the department co-chairs and the secondary customers are the faculty. The baseline for customer satisfaction was determined by the 10% compliance rate and additionally by an informal poll of a few secondary customers.
The voice of the primary customers, who request and receive the CTL report, was clearly articulated by the department chair. As an accreditation team member, he greatly desired a mea-sureable assessment instrument that could prove an institution delivers on what each course purports to teach, and that would help demonstrate an institution’s commitment to academic excellence and continuous improvement. To satisfy the primary customer, the solution would need to provide accountability of faculty to improve their courses continuously, some way to moni-tor quality, and a means of institutional metrics with regard to course improvement.
Secondary customers were identified as the faculty members who receive the benefit of thoughtful inquiry to improve their courses. In this case, the faculty members were both secondary customers and also the performers of the process. Therefore, to satisfy the secondary customers, the CTL report process would have to provide clear value and also be easy to perform.
Implementation Tip 1:
In selecting an initial project to demonstrate the usefulness of DMAIC, it is best to engage customers of business processes to identify “low-hanging fruit,” e.g., processes that are likely to yield significant improvements through systematic analysis and problem solving. If the project seems too complex, it is probably not the best opportunity.
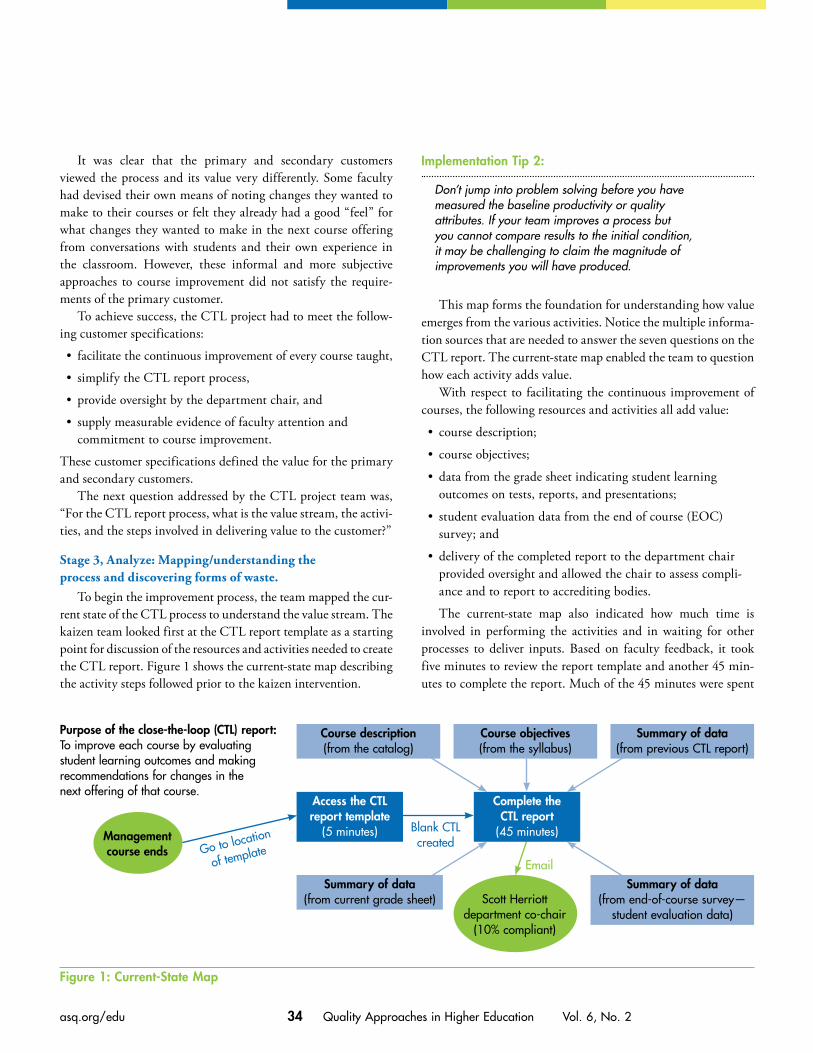
34 Quality Approaches in Higher Education Vol. 6, No. 2asq.org/edu
Figure 1: Current-State Map
Summary of data (from previous CTL report)
Summary of data (from end-of-course survey—
student evaluation data)
Summary of data (from current grade sheet)
Access the CTL report template
(5 minutes)
Complete the CTL report
(45 minutes)
Course objectives (from the syllabus)
Course description (from the catalog)
Purpose of the close-the-loop (CTL) report: To improve each course by evaluating student learning outcomes and making recommendations for changes in the next offering of that course.
Go to location
of templateEmail
Blank CTL createdManagement
course ends
Scott Herriott department co-chair
(10% compliant)
It was clear that the primary and secondary customers viewed the process and its value very differently. Some faculty had devised their own means of noting changes they wanted to make to their courses or felt they already had a good “feel” for what changes they wanted to make in the next course offering from conversations with students and their own experience in the classroom. However, these informal and more subjective approaches to course improvement did not satisfy the require-ments of the primary customer.
To achieve success, the CTL project had to meet the follow-ing customer specifications:
• facilitate the continuous improvement of every course taught,
• simplify the CTL report process,
• provide oversight by the department chair, and
• supply measurable evidence of faculty attention and commitment to course improvement.
These customer specifications defined the value for the primary and secondary customers.
The next question addressed by the CTL project team was, “For the CTL report process, what is the value stream, the activi-ties, and the steps involved in delivering value to the customer?”
Stage 3, Analyze: Mapping/understanding the process and discovering forms of waste.
To begin the improvement process, the team mapped the cur-rent state of the CTL process to understand the value stream. The kaizen team looked first at the CTL report template as a starting point for discussion of the resources and activities needed to create the CTL report. Figure 1 shows the current-state map describing the activity steps followed prior to the kaizen intervention.
This map forms the foundation for understanding how value emerges from the various activities. Notice the multiple informa-tion sources that are needed to answer the seven questions on the CTL report. The current-state map enabled the team to question how each activity adds value.
With respect to facilitating the continuous improvement of courses, the following resources and activities all add value:
• course description;
• course objectives;
• data from the grade sheet indicating student learning outcomes on tests, reports, and presentations;
• student evaluation data from the end of course (EOC) survey; and
• delivery of the completed report to the department chair provided oversight and allowed the chair to assess compli-ance and to report to accrediting bodies.
The current-state map also indicated how much time is involved in performing the activities and in waiting for other processes to deliver inputs. Based on faculty feedback, it took five minutes to review the report template and another 45 min-utes to complete the report. Much of the 45 minutes were spent
Implementation Tip 2:
Don’t jump into problem solving before you have measured the baseline productivity or quality attributes. If your team improves a process but you cannot compare results to the initial condition, it may be challenging to claim the magnitude of improvements you will have produced.
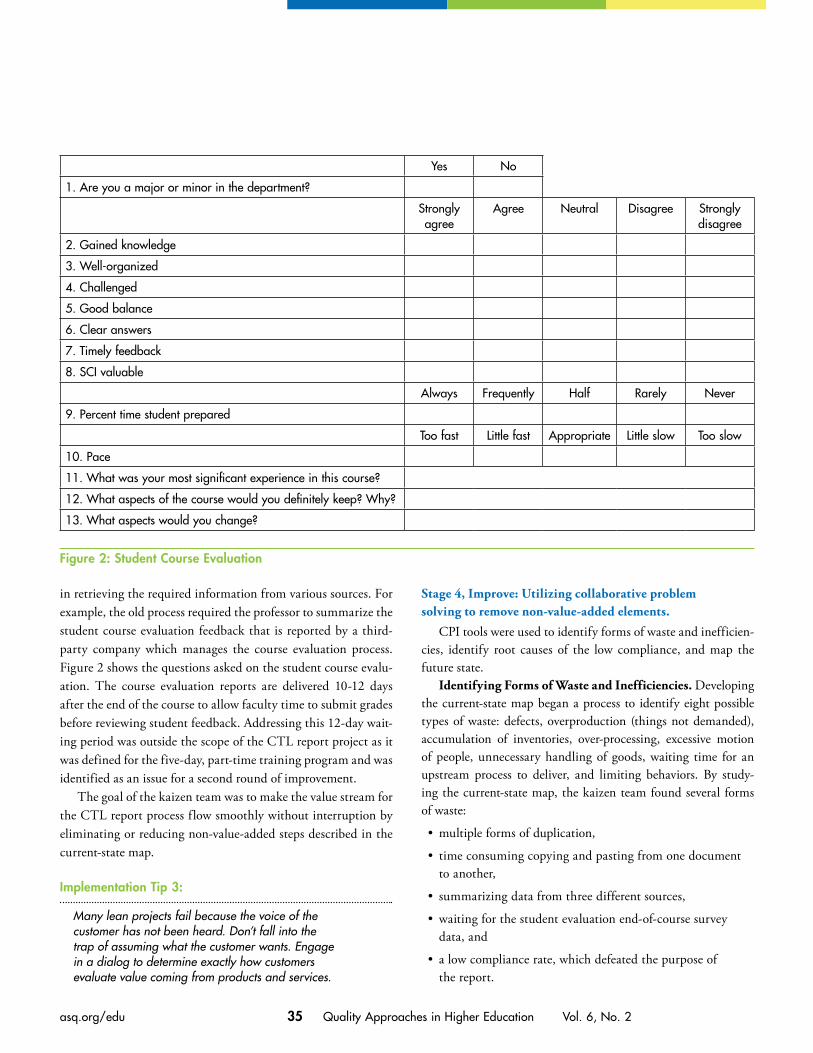
35 Quality Approaches in Higher Education Vol. 6, No. 2asq.org/edu
in retrieving the required information from various sources. For example, the old process required the professor to summarize the student course evaluation feedback that is reported by a third-party company which manages the course evaluation process. Figure 2 shows the questions asked on the student course evalu-ation. The course evaluation reports are delivered 10-12 days after the end of the course to allow faculty time to submit grades before reviewing student feedback. Addressing this 12-day wait-ing period was outside the scope of the CTL report project as it was defined for the five-day, part-time training program and was identified as an issue for a second round of improvement.
The goal of the kaizen team was to make the value stream for the CTL report process flow smoothly without interruption by eliminating or reducing non-value-added steps described in the current-state map.
Stage 4, Improve: Utilizing collaborative problem solving to remove non-value-added elements.
CPI tools were used to identify forms of waste and inefficien-cies, identify root causes of the low compliance, and map the future state.
Identifying Forms of Waste and Inefficiencies. Developing the current-state map began a process to identify eight possible types of waste: defects, overproduction (things not demanded), accumulation of inventories, over-processing, excessive motion of people, unnecessary handling of goods, waiting time for an upstream process to deliver, and limiting behaviors. By study-ing the current-state map, the kaizen team found several forms of waste:
• multiple forms of duplication,
• time consuming copying and pasting from one document to another,
• summarizing data from three different sources,
• waiting for the student evaluation end-of-course survey data, and
• a low compliance rate, which defeated the purpose of the report.
Yes No
1. Are you a major or minor in the department?
Strongly agree
Agree Neutral Disagree Strongly disagree
2. Gained knowledge
3. Well-organized
4. Challenged
5. Good balance
6. Clear answers
7. Timely feedback
8. SCI valuable
Always Frequently Half Rarely Never
9. Percent time student prepared
Too fast Little fast Appropriate Little slow Too slow
10. Pace
11. What was your most significant experience in this course?
12. What aspects of the course would you definitely keep? Why?
13. What aspects would you change?
Figure 2: Student Course Evaluation
Implementation Tip 3:
Many lean projects fail because the voice of the customer has not been heard. Don’t fall into the trap of assuming what the customer wants. Engage in a dialog to determine exactly how customers evaluate value coming from products and services.
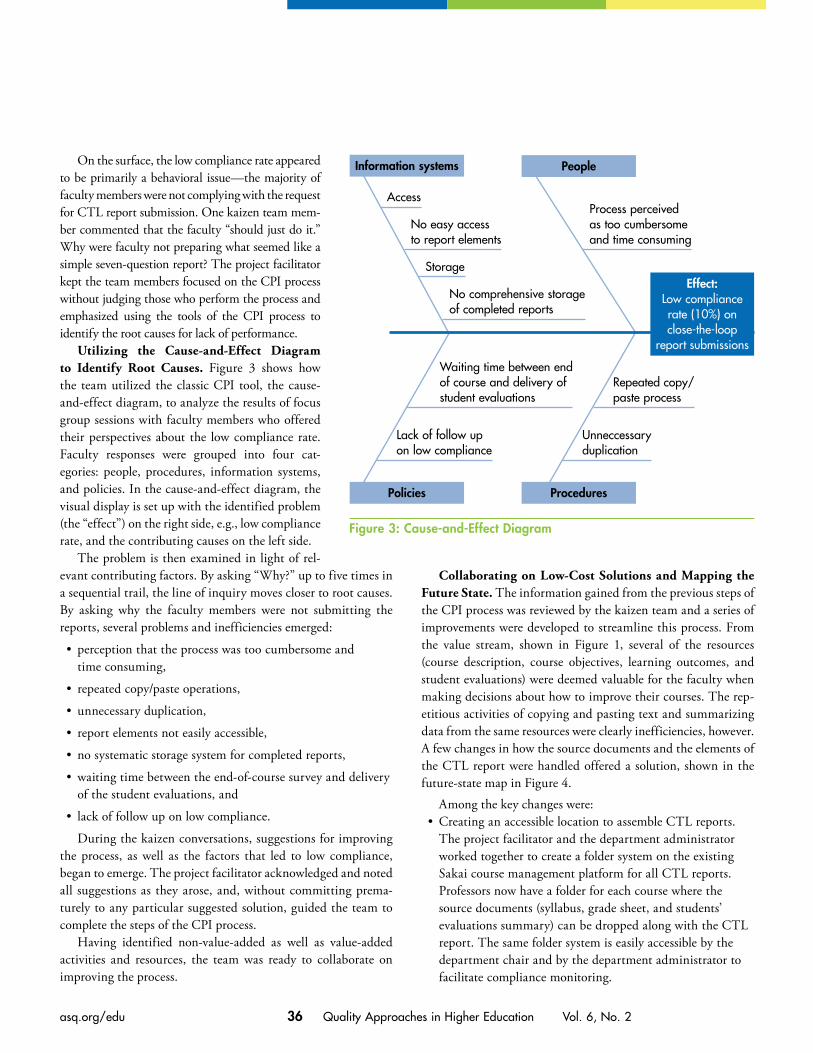
36 Quality Approaches in Higher Education Vol. 6, No. 2asq.org/edu
On the surface, the low compliance rate appeared to be primarily a behavioral issue—the majority of faculty members were not complying with the request for CTL report submission. One kaizen team mem-ber commented that the faculty “should just do it.” Why were faculty not preparing what seemed like a simple seven-question report? The project facilitator kept the team members focused on the CPI process without judging those who perform the process and emphasized using the tools of the CPI process to identify the root causes for lack of performance.
Utilizing the Cause-and-Effect Diagram to Identify Root Causes. Figure 3 shows how the team utilized the classic CPI tool, the cause-and-effect diagram, to analyze the results of focus group sessions with faculty members who offered their perspectives about the low compliance rate. Faculty responses were grouped into four cat-egories: people, procedures, information systems, and policies. In the cause-and-effect diagram, the visual display is set up with the identified problem (the “effect”) on the right side, e.g., low compliance rate, and the contributing causes on the left side.
The problem is then examined in light of rel-evant contributing factors. By asking “Why?” up to five times in a sequential trail, the line of inquiry moves closer to root causes. By asking why the faculty members were not submitting the reports, several problems and inefficiencies emerged:
• perception that the process was too cumbersome and time consuming,
• repeated copy/paste operations,
• unnecessary duplication,
• report elements not easily accessible,
• no systematic storage system for completed reports,
• waiting time between the end-of-course survey and delivery of the student evaluations, and
• lack of follow up on low compliance.
During the kaizen conversations, suggestions for improving the process, as well as the factors that led to low compliance, began to emerge. The project facilitator acknowledged and noted all suggestions as they arose, and, without committing prema-turely to any particular suggested solution, guided the team to complete the steps of the CPI process.
Having identified non-value-added as well as value-added activities and resources, the team was ready to collaborate on improving the process.
Collaborating on Low-Cost Solutions and Mapping the Future State. The information gained from the previous steps of the CPI process was reviewed by the kaizen team and a series of improvements were developed to streamline this process. From the value stream, shown in Figure 1, several of the resources (course description, course objectives, learning outcomes, and student evaluations) were deemed valuable for the faculty when making decisions about how to improve their courses. The rep-etitious activities of copying and pasting text and summarizing data from the same resources were clearly inefficiencies, however. A few changes in how the source documents and the elements of the CTL report were handled offered a solution, shown in the future-state map in Figure 4.
Among the key changes were:• Creating an accessible location to assemble CTL reports.
The project facilitator and the department administrator worked together to create a folder system on the existing Sakai course management platform for all CTL reports. Professors now have a folder for each course where the source documents (syllabus, grade sheet, and students’ evaluations summary) can be dropped along with the CTL report. The same folder system is easily accessible by the department chair and by the department administrator to facilitate compliance monitoring.
Figure 3: Cause-and-Effect Diagram
Information systems People
Policies Procedures
Access
Storage
No easy access to report elements
Waiting time between end of course and delivery of student evaluations
Process perceived as too cumbersome and time consuming
Repeated copy/paste process
Unneccessary duplication
No comprehensive storage of completed reports
Lack of follow up on low compliance
Effect: Low compliance rate (10%) on close-the-loop
report submissions
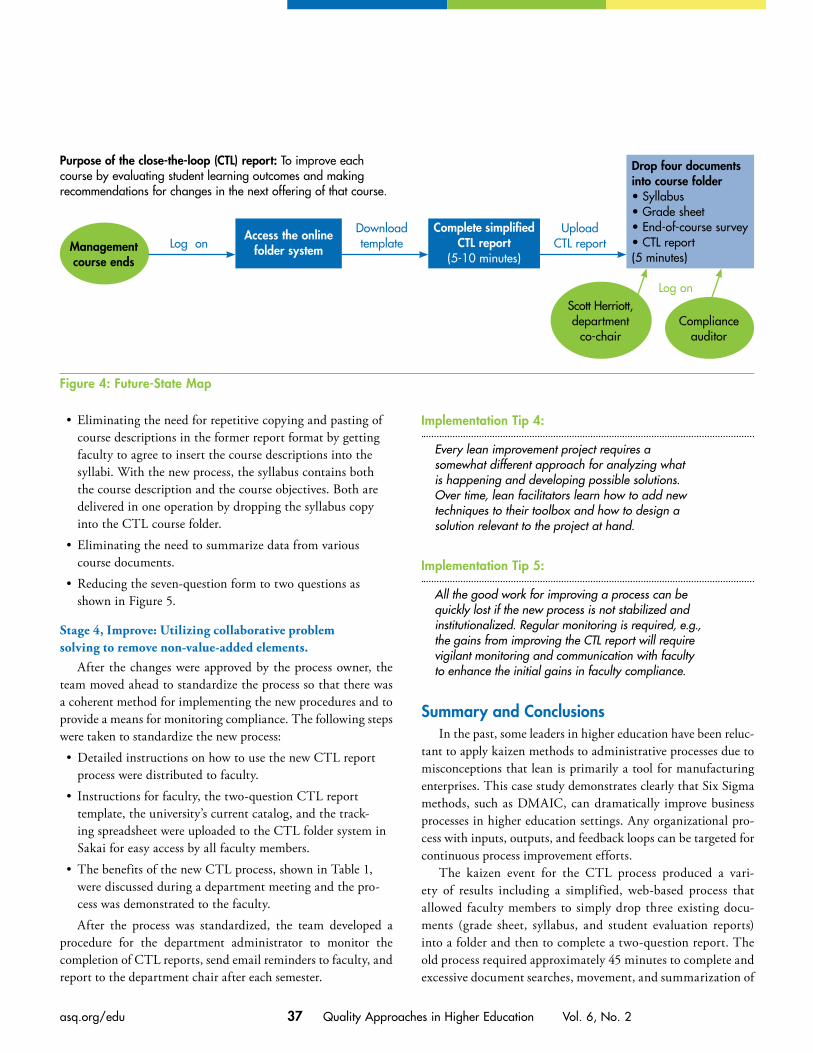
37 Quality Approaches in Higher Education Vol. 6, No. 2asq.org/edu
• Eliminating the need for repetitive copying and pasting of course descriptions in the former report format by getting faculty to agree to insert the course descriptions into the syllabi. With the new process, the syllabus contains both the course description and the course objectives. Both are delivered in one operation by dropping the syllabus copy into the CTL course folder.
• Eliminating the need to summarize data from various course documents.
• Reducing the seven-question form to two questions as shown in Figure 5.
Stage 4, Improve: Utilizing collaborative problem solving to remove non-value-added elements.
After the changes were approved by the process owner, the team moved ahead to standardize the process so that there was a coherent method for implementing the new procedures and to provide a means for monitoring compliance. The following steps were taken to standardize the new process:
• Detailed instructions on how to use the new CTL report process were distributed to faculty.
• Instructions for faculty, the two-question CTL report template, the university’s current catalog, and the track-ing spreadsheet were uploaded to the CTL folder system in Sakai for easy access by all faculty members.
• The benefits of the new CTL process, shown in Table 1, were discussed during a department meeting and the pro-cess was demonstrated to the faculty.
After the process was standardized, the team developed a procedure for the department administrator to monitor the completion of CTL reports, send email reminders to faculty, and report to the department chair after each semester.
Summary and ConclusionsIn the past, some leaders in higher education have been reluc-
tant to apply kaizen methods to administrative processes due to misconceptions that lean is primarily a tool for manufacturing enterprises. This case study demonstrates clearly that Six Sigma methods, such as DMAIC, can dramatically improve business processes in higher education settings. Any organizational pro-cess with inputs, outputs, and feedback loops can be targeted for continuous process improvement efforts.
The kaizen event for the CTL process produced a vari-ety of results including a simplified, web-based process that allowed faculty members to simply drop three existing docu-ments (grade sheet, syllabus, and student evaluation reports) into a folder and then to complete a two-question report. The old process required approximately 45 minutes to complete and excessive document searches, movement, and summarization of
Figure 4: Future-State Map
Drop four documents into course folder • Syllabus • Grade sheet • End-of-course survey • CTL report (5 minutes)
Access the online folder system
Complete simplified CTL report
(5-10 minutes)
Purpose of the close-the-loop (CTL) report: To improve each course by evaluating student learning outcomes and making recommendations for changes in the next offering of that course.
Download templateLog on
Upload CTL reportManagement
course ends
Log onScott Herriott, department
co-chair Compliance
auditor
Implementation Tip 4:
Every lean improvement project requires a somewhat different approach for analyzing what is happening and developing possible solutions. Over time, lean facilitators learn how to add new techniques to their toolbox and how to design a solution relevant to the project at hand.
Implementation Tip 5:
All the good work for improving a process can be quickly lost if the new process is not stabilized and institutionalized. Regular monitoring is required, e.g., the gains from improving the CTL report will require vigilant monitoring and communication with faculty to enhance the initial gains in faculty compliance.

38 Quality Approaches in Higher Education Vol. 6, No. 2asq.org/edu
Table 1: Benefits of the Revised Process
Simplified form Seven questions reduced to only two questions and a document checklist
No more copy and paste for each CTL report
The syllabus already contains the course objectives. It is now very important, however, that all business faculty add the course description from the catalog to the syllabus (a one-time operation). From that point on, no more copying and pasting! The syllabus, complete with course description, will simply be dropped into a folder in Sakai after each course.
Updating course description in the catalog
Including the course description in the syllabus allows faculty members to stay on top of any changes and facilitates timely updating of the catalog.
Private archive for your documents
Within the CTL Archive folder, each professor has a separate, private folder to store all the documents related to the CTL report syllabus, grade sheet, EOC student evaluation, and the CTL report itself for each course taught. Only you and the site administrator will be able to see your CTL reports.
Easy two-step procedure First prepare your documents (syllabus, grade sheet, EOC evaluation, and the CTL report) and then upload these four documents into the CTL Archive worksite in Sakai.
Value added Including the course description in the syllabus allows the professor to easily see when the course description needs to be updated in the catalog. Students appreciate accurate, up-to-date course descriptions in the catalog.
Figure 5: The CTL Report Form—Before and After
BeforeClose-the-Loop Report
After teaching a course, the professor should prepare a short memo to the program director or department chair with the following points:
1. Paste into the catalog description of the course and the course objectives from your syllabus.
2. What were the data on student learning outcomes in the previous offering of this course? Summarize (from a previous report, ideally) the results of tests, papers, projects, conversations with students, and end-of-course surveys. What strengths did the students show in light of the course objectives? What weaknesses?
3. What changes did you intend or recommend after the previous offering?
4. What changes did you actually implement in this offering?
5. What were the data on student learning outcomes in this offering? Summarize the results of tests, papers, projects, and end-of-course surveys.
6. What changes do you intend to make or recommend for the next offering?
7. What resources would be required to implement your recommendations?
AfterClose-the-Loop Report
Professor: Your Name
MGT xxxx Course Name YYYYMM
Date: mm/dd/yy
1. What changes did you implement in this offering?
2. What changes do you intend to make or recommend for the next offering?
Upload the following documents to the CTL Archive in Sakai:
Course syllabus (including course description and course objectives)
Grade sheet
End-of-course survey
Close-the-loop report

39 Quality Approaches in Higher Education Vol. 6, No. 2asq.org/edu
information. The new process takes about 10-15 minutes with much easier f low.
As an unexpected side benefit, the department was alerted to the need for changes in course descriptions as courses evolve. Consequently, the new CTL process created an opportunity to simplify a related business process that had not been system-atically managed in the past, e.g., the procedure for updating the university’s catalog of course descriptions. The CTL project also identified a related process—delivery time of the stu-dent evaluation data—as an area to address in a later round of improvement.
Within a few months of implementing the incremental improvements, the business department’s CTL project pro-duced an improvement in compliance from the base condition of 10% with the old process, to 47% with the new process. Clearly, continuous monitoring of compliance will be needed to drive compliance rates higher.
Among the key lessons learned from this project were:
• Proper training in lean methods can produce some significant impacts quickly. On Monday of the five-day training, the CTL facilitator was uncertain of her ability to perform. By Friday (after five, half-day training ses-sions), she was confident about what to do.
• Baselining is critical. The base condition was 10% non-compliance. The post-DMAIC condition was 47%. Further monitoring is needed to institutionalize the changes. Knowing the base condition allowed the team to claim a significant measurable improvement in compliance.
• Lean tools are very flexible. There are many tools avail-able to a kaizen team. Based on the nature of the process and the data available, the lean facilitator can choose the tools that fit the need of the project to discover root causes of poor quality and alternatives for change.
• Streamlining can produce unanticipated added value. With the new CTL process, faculty members now see their catalog course descriptions embedded in the course syl-labus. As faculty update the syllabus for a new course, they quickly observe if the catalog course description also needs updating for changes that have moved into the course con-tent. Thus, the university’s course catalog descriptions are more accurate.
• Lean Six Sigma training enriches job satisfaction. Administrative staff members often recognize where issues and inefficiencies exist, but may not be able to effect positive change. Lean training as part of staff develop-ment provides the language and tools that empower staff
members to identify, propose, and facilitate continuous improvement projects throughout the university.
In this particular application of the DMAIC method, the goal was to streamline the efficiency of a process for monitor-ing effective delivery of academic courses. As the new dean of the college of business administration, Scott Herriott, the pro-cess owner who requested the kaizen intervention, expressed his appreciation of the streamlined CTL process that enables pro-gram directors to monitor the quality of academic delivery more effectively. We encourage the application of Lean Six Sigma tools throughout higher education academic and administrative pro-cesses to enhance value to customers and fulfill the potential of the HLC’s AQIP mandate.
References: Deming, W. Edwards (1986). Out of the Crisis. Cambridge, MA: The MIT Press.
Emiliani, M. (2015). Engaging faculty in lean teaching. International Journal of Lean Six Sigma, 6(1).
Furst-Bowe, J. (2011). Systems thinking: Critical to quality improve-ment in higher education. Quality Approaches in Higher Education, 2(2), 2-4.
George, M. (2003). Lean Six Sigma for service: How to use lean speed and Six Sigma quality to improve services and transactions. USA: McGraw-Hill Companies.
Hand, R. K., Dolansky, M. A., Hanahan, E. E., Sundaram, V. M., & Tinsley, N. (2014). Quality comes alive: An interdisciplinary student team’s quality improvement experience in learning by doing—health-care education case study. Quality Approaches in Higher Education, 5(1), 26-32.
Higher Learning Commission (2015). The AQIP pathway. Retrieved from https://www.ncahlc.org/Pathways/aqip-home.html.
Holmes, M., Jenicke, L., & Kumar, A. (2005). Improving the effec-tiveness of the academic delivery process utilizing Six Sigma. Issues in Information Systems, 6(1).
Kurt, D. & Raifsnider, R. (2004). Lean Six Sigma in higher education: Applying proven methodologies to improve quality, remove waste, and quantify opportunities in colleges and universities. [White paper.] Retrieved from http://www.xerox.com/downloads/wpaper/x/xgs_white_paper_dkurt.pdf.
Ramanan, L. & Ramanakumar, K. (2014). Necessity of Six Sigma—as a measurement metric in measuring quality of higher education. International Journal of Business and Management Invention, 3(1), 28-30.
Sarda, S., Bonde, D., & Kallurkar, S. (2006). Application of Six Sigma in technical education. Journal of Engineering Education, 19(6), 45-47.
Simons, N. (2013). The business case for Lean Six Sigma in higher edu-cation. ASQ Higher Education Brief, 6(3), 1-6.

40 Quality Approaches in Higher Education Vol. 6, No. 2asq.org/edu
Utecht, K. & Jenicke, L. (2009). Increasing calculation consistency and reducing calculation time using Six Sigma: A case study of salary deter-mination in an institution of higher education. International Journal of Services and Standards, 5(2), 115-134.
Womack, J., Jones, D. & Roos, D. (1990). The Machine That Changed the World. New York, NY: Simon and Schuster.
Andrew S. Bargerstock, MBA, CPA, Ph.D., is the director of MBA programs and an associ-ate professor of management at Maharishi University of Management in Fairfield, IA, where his teaching focus is on lean accounting. His professional career spans both higher edu-cation and private sector management and consulting. He is a Certified Lean Management Facilitator who has guided kaizen events for corporate, university, federal, and state agency organizations through his consulting company, Vanguard Resource Group, Inc. Contact him at [email protected] or 641-919-4303.
Sylvia R. Richards, M.A. has served seven years as an MBA program administrator at Maharishi University of Management with various administrative roles in the department of business administration. She has partici-pated in the university’s lean training program and subsequent lean projects both as a facili-tator and kaizen team member. She can be contacted at [email protected].
Andrew S. Bargerstock
Sylvia R. Richards
Education Division’s Advancing the STEM Agenda Book A collection of conference papers from the 2011 Advancing the STEM Agenda Conference. Available through ASQ Quality Press.
This publication is full of collab-orative models, best practices, and advice for teachers, higher education faculty, and human resources personnel on improving the student retention (and thereby increasing the supply of STEM workers). Ideas that will work for both STEM and non-STEM fields are presented. The introduction maps out the current landscape of STEM education and compares the United States to other countries. The last chapter is the confer-ence chairs’ summary of what was learned from the conference and working with 36 authors to develop this book. This effort is
part of a grassroots effort among educators to help more students be successful in STEM majors and careers.
“Veenstra, Padró, and Furst-Bowe provide a huge contribution to the field of STEM education. We all know the statistics and of the huge need in the area of STEM students and education, but what has been missing are application and success stories backed by research and modeling. The editors have successfully contributed to our need by focusing on collaborative models, building the K-12 pipeline, showing what works at the collegiate level, connecting across gender issues, and illustrating workforce and innovative ideas.”
John J. Jasinski, Ph.D. President, Northwest Missouri State University
“Advancing the STEM Agenda provides a broad set of current perspectives that will contribute in many ways to advancing the understanding and enhancement of education in science, education, and engineering. This work is packed with insights from experienced educators from K-12, regional, and research university perspectives and bridges the transition from education to workplace.”
John Dew, Ed.D. Senior Vice Chancellor, Troy University

41 Quality Approaches in Higher Education Vol. 6, No. 2
asq.org/edu
Development of
a train-the-trainer
model in distance
education
for process
improvement.
Striving for Operational Excellence in Higher Education: A Case Study Implementing Lean for Distance LearningKaren L. Pedersen, Melisa J. Ziegler, and Lacy D. Holt
AbstractIn partnership with the Intel Corporation (Intel) Mentoring and Planning Services (MAPS) Program, senior leadership from a distance education division of a large university in the southwest instituted an initiative to engage, train, and empower employees. The primary goal of the initiative was to improve the learning experience for students while driving innovation, cutting costs, and enhancing internal effectiveness. To realize long-term suc-cess, a train-the-trainer approach was deployed that involved a cross-functional team of division employees. Through a series of division-wide training sessions, 135 staff were trained and 96 processes were identified as targets for improvement. Priority projects were identified as having a relatively simple implementation schedule yet with potential to have a significant positive effect on improving performance. This case study details the train-the-trainer model as well as progress made toward comprehensive process improvements.
Keywords Change Management, Continuous Improvement, Lean
IntroductionWith a network of more than 35 statewide campuses and an expansive online opera-
tion, the Extended Campuses division of research-intensive Northern Arizona University (NAU) embarked on a mission to change its organizational culture to better meet the needs of the 21st century marketplace. With numerous indicators coming from internal and external sources, division leaders knew it was time to take purposeful steps to enhance organizational effectiveness as part of its efforts to increase enrollment. Employee engage-ment to meet the evolving needs of learners, employers, and other key stakeholders was determined to be the most effective avenue for this effort.
Senior leadership instituted an initiative during the 2012-2014 academic years to engage, train, support, and empower employees with the primary goal to improve the learning expe-rience while cutting costs and enhancing internal effectiveness. To reach this goal, senior leadership turned to lean experts from Intel’s Mentoring and Planning Services (MAPS) Program. This program matches the skills of Intel employees with the unique needs of not-for-profit organizations. Through this partnership, members of Extended Campuses’ lean team were provided with more than 144 hours of training and support to implement a train-the-trainer approach that incorporated operational excellence thinking and lean principles into the workplace. This case study describes the application of lean in higher education, the evolution of NAU-Extended Campuses along its transformational journey, the training and mentoring support received from Intel, the effect of the initiative since its inception, and key steps other educational institutions can take to begin a lean journey.
Literature ReviewLean is a broad term that “refers to a collection of principles and methods that focus
on the identification and elimination of non-value added activity (waste) in any process”

42 Quality Approaches in Higher Education Vol. 6, No. 2asq.org/edu
(Piccolo & Knobloch, 2012). Lean strategies are tools that help organizations increase quality, drive innovation, and increase value while reducing waste and costs. Lean is about setting goals of improvement by having “continually declining costs, zero defects, zero inventories, and endless product variety” (Womack, Jones & Roos, 2007, p. 12). For education, the focus is more than just saving money; it is about improving the quality of learners’ experiences and creating an environment of operational excel-lence while maintaining academic rigor.
According to Miller (2014), “operational excellence is the relentless pursuit of doing things better. It is not a destination or a methodology but a mind-set that needs to exist across an orga-nization” (p.1). Miller’s (2014) work encouraged organizations to balance the lean philosophy in a more comprehensive framework by pushing beyond efficiency, productivity, savings, standardiza-tion, and eliminating waste. These “early experience” years are generally focused on operational projects (KPMG, 2013). Once employees start to see the benefits of lean, the organization con-tinues to adopt a lean culture into daily work on its way to having a “culture of continuous improvement” (KPMG, 2013). To reach this state, organizations must focus on effectiveness, improving performance, growth, increasing value, retention, and custom-ization while driving innovation (Miller, 2014).
While there are different models for describing organi-zational change (Barnett & Carroll, 1995), the progression of NAU-Extended Campuses during its lean journey can best be described within the five Stages of the Evolution of Continuous Improvement (Bessant, Caffyn, & Gallagher, 2001). Bessant, Caffyn, and Gallagher (2001) conducted a series of in-depth case studies that led them to describe the journey of continu-ous improvement (CI) as “a cluster of behavioral changes which establish innovation routines in [enterprises]” (p. 67). There are five levels in the model, from Level – 1 Pre-CI to Level 5 – Full CI Capability, that exemplify the underlying continuum of orga-nizational change. The levels are shown in Figure 1.
Successful lean initiatives that move organizations through the levels are characterized by the cultivation of a quality culture, the investment of people and resources up front, the realiza-tion of quick wins that build to larger benefits, and the level and quality of management effort exerted toward the initiative (Bessant et al., 2001; Freed, Klugman, & Fife, 1997; Roffe, 1998; Simons, 2013). The cultivation of a quality culture begins with an appreciation of the current culture. Roffe (1998) described how change is challenging to any organization and working within the boundaries of a current culture means slowly extend-ing and changing the culture to ensure the sustainability and integration of lean into the culture. The change is most suc-cessful when it is owned and championed by executives in the organization. Executives at the top level must be invested in the initiative, via people and resources, or else the potential for a mis-match between the strategic goals and actions of staff will exist. Training that starts at the top level can ensure that the desired message and culture are owned and lived by leadership (Bessant et al., 2001; Simons, 2013).
BackgroundOrganization Overview
NAU is a public institution serving more than 27,700 stu-dents, and its focus on an undergraduate residential experience is strengthened by a robust distance education division. Figure 2 shows NAU’s demographic statistics and organization background.
For more than 30 years, NAU’s Extended Campuses became the organizational means by which academic programs were accessible at a distance from the main campus. With a median age of 32, learners served by NAU-Extended Campuses com-plete undergraduate and graduate degrees as well as certificate
Figure 1: Stages in the Evolution of Continuous Improvement (CI)
Level 1 Level 2 Level 3 Level 4 Level 5
Problem solved randomly; no formal
CI
Levels 1-2 and formal development of strategic goals
Levels 1-4 and systematic finding
and problem solving
Levels 1 and structured problem-
solving process
Levels 1-3 and CI responsibilities held
within work unitPre-CI interest
Structured CI
Goal oriented
Proactive CI
Full CI
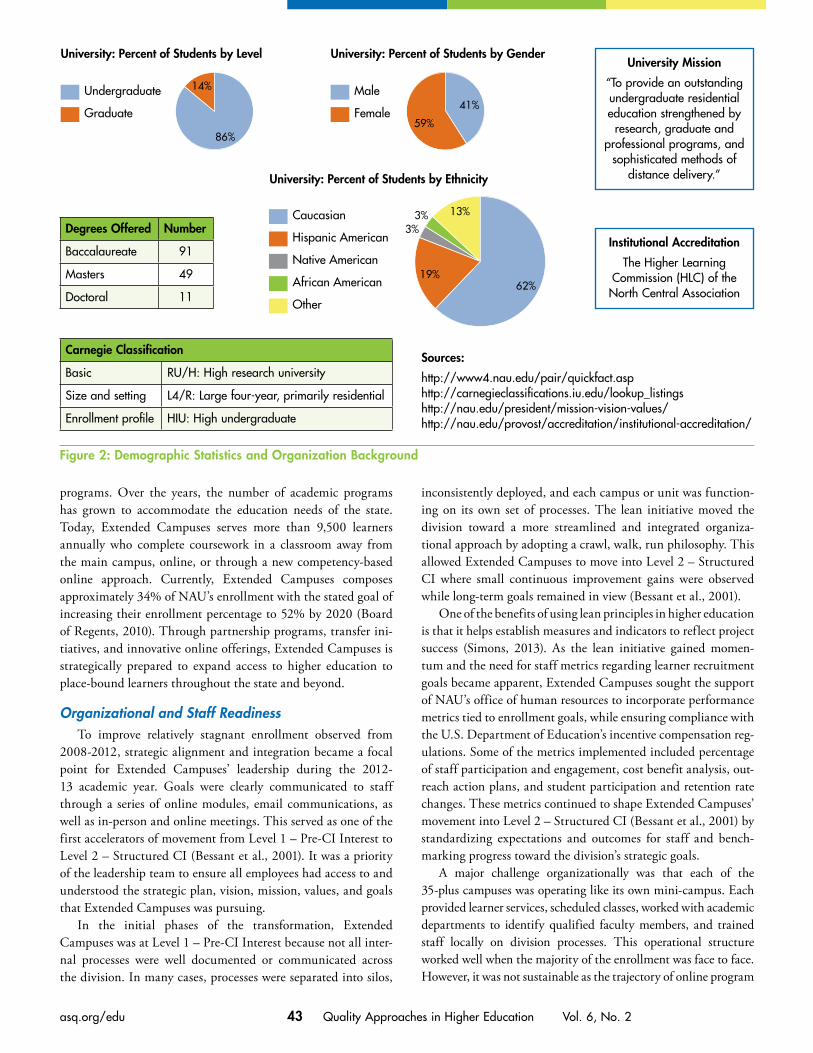
43 Quality Approaches in Higher Education Vol. 6, No. 2asq.org/edu
programs. Over the years, the number of academic programs has grown to accommodate the education needs of the state. Today, Extended Campuses serves more than 9,500 learners annually who complete coursework in a classroom away from the main campus, online, or through a new competency-based online approach. Currently, Extended Campuses composes approximately 34% of NAU’s enrollment with the stated goal of increasing their enrollment percentage to 52% by 2020 (Board of Regents, 2010). Through partnership programs, transfer ini-tiatives, and innovative online offerings, Extended Campuses is strategically prepared to expand access to higher education to place-bound learners throughout the state and beyond.
Organizational and Staff ReadinessTo improve relatively stagnant enrollment observed from
2008-2012, strategic alignment and integration became a focal point for Extended Campuses’ leadership during the 2012-13 academic year. Goals were clearly communicated to staff through a series of online modules, email communications, as well as in-person and online meetings. This served as one of the first accelerators of movement from Level 1 – Pre-CI Interest to Level 2 – Structured CI (Bessant et al., 2001). It was a priority of the leadership team to ensure all employees had access to and understood the strategic plan, vision, mission, values, and goals that Extended Campuses was pursuing.
In the initial phases of the transformation, Extended Campuses was at Level 1 – Pre-CI Interest because not all inter-nal processes were well documented or communicated across the division. In many cases, processes were separated into silos,
inconsistently deployed, and each campus or unit was function-ing on its own set of processes. The lean initiative moved the division toward a more streamlined and integrated organiza-tional approach by adopting a crawl, walk, run philosophy. This allowed Extended Campuses to move into Level 2 – Structured CI where small continuous improvement gains were observed while long-term goals remained in view (Bessant et al., 2001).
One of the benefits of using lean principles in higher education is that it helps establish measures and indicators to reflect project success (Simons, 2013). As the lean initiative gained momen-tum and the need for staff metrics regarding learner recruitment goals became apparent, Extended Campuses sought the support of NAU’s office of human resources to incorporate performance metrics tied to enrollment goals, while ensuring compliance with the U.S. Department of Education’s incentive compensation reg-ulations. Some of the metrics implemented included percentage of staff participation and engagement, cost benefit analysis, out-reach action plans, and student participation and retention rate changes. These metrics continued to shape Extended Campuses’ movement into Level 2 – Structured CI (Bessant et al., 2001) by standardizing expectations and outcomes for staff and bench-marking progress toward the division’s strategic goals.
A major challenge organizationally was that each of the 35-plus campuses was operating like its own mini-campus. Each provided learner services, scheduled classes, worked with academic departments to identify qualified faculty members, and trained staff locally on division processes. This operational structure worked well when the majority of the enrollment was face to face. However, it was not sustainable as the trajectory of online program
3%3%
19%62%
13%
14%
86%59%
41%
Caucasian
University: Percent of Students by Ethnicity
University: Percent of Students by Level
Hispanic American
Native American
African American
Other
Undergraduate
Graduate
University: Percent of Students by Gender
Male
Female
Figure 2: Demographic Statistics and Organization Background
University Mission
“To provide an outstanding undergraduate residential education strengthened by
research, graduate and professional programs, and
sophisticated methods of distance delivery.”
Institutional Accreditation
The Higher Learning Commission (HLC) of the North Central Association
Carnegie Classification
Basic RU/H: High research university
Size and setting L4/R: Large four-year, primarily residential
Enrollment profile HIU: High undergraduate
Degrees Offered Number
Baccalaureate 91
Masters 49
Doctoral 11
Sources:
http://www4.nau.edu/pair/quickfact.asp http://carnegieclassifications.iu.edu/lookup_listings http://nau.edu/president/mission-vision-values/ http://nau.edu/provost/accreditation/institutional-accreditation/
44 Quality Approaches in Higher Education Vol. 6, No. 2asq.org/edu
enrollment increased while face-to-face program enrollment decreased. In fall 2003, 91% of learners in Extended Campuses completed coursework face to face with only 9% completing coursework online (PAIR, n.d.). In 2013, enrollment patterns had shifted with just under 48% of learners completing face-to-face coursework and more than 52% completing coursework online.
As online enrollment grew, Extended Campuses began offer-ing some centralized services while other services remained local. However, systems and processes were often complicated, inconsistent, and operationally complex across NAU’s campuses. To achieve Extended Campuses’ key results (e.g. deploy high quality, market-driven academic programs, substantially grow enrollment, and provide support services to enable learners to graduate on time), the leadership knew a transformation of the organizational culture, including greater levels of consistency and continuity in systems and processes across campuses, was necessary to move forward.
With the hiring of a trained CI leader who served as a champion at a high level, the organization was well positioned to move into Level 2 – Structured CI (Bessant et al., 2001). As Freed, Klugman, and Fife (1997) stated, “leaders are essential in creating a quality culture and they play a significant role in ensuring that the necessary resources are available to support quality initiatives” (p. 8). Additionally, the senior leadership team remained consistent during this time and was committed financially and strategically to the lean implementation. They served on cross-functional teams that worked on different proj-ects which incorporated staff at all levels. This demonstrated to staff that lean was a transformational initiative meant to perma-nently change Extended Campuses’ culture and how they did their work and was not considered a one-time initiative.
In addition to the commitment the senior leadership made to implementing lean, a lean team was formed that pooled the talent, expertise, and unique perspectives of seven individu-als across Extended Campuses. The lean team was comprised of Extended Campuses’ associate vice president, assistant vice president, director of strategic initiatives, directory of technol-ogy, director of strategic marketing, coordinator of training and development, and business process improvement coordinator. The lean team furthered the organization’s movement into Level 2 – Structured CI by adding structure and organization to the operational excellence initiative (Bessant et al., 2001). The team was provided with the financial resources needed to accomplish their work, including support for the online and in-person train-ing, payment for travel expenses, creation of a resource library of relevant books, and the purchase of eVSM software. Given the need for involvement of employees at all levels to move through the CI stages, all employees were invited to participate in the lean
initiative at the direction of the senior leadership and lean team. By relying on the employees doing the work to improve the pro-cesses, Extended Campuses came together to resolve issues, drive innovation, improve quality, and increase value, thus creating a better educational experience for learners.
MethodologyTrain-the-Trainer Approach
While Extended Campuses worked with Intel mentors for two years, it was in fall 2013 when the Intel mentors worked directly with the lean team to implement a train-the-trainer program with the intent that the lean team would then train the Extended Campuses’ employees. Throughout the year, the lean team received monthly training and mentoring on specific lean principles, methodologies, and software. Topics of the train-ings included: business process improvement (BPI), stakeholder management, lean principles and methodologies, kaizen event management, and relevant software applications such as eVSM.
Prior to the lean team implementing the division-wide train-ing initiative, a Blackboard Learn (BbLearn) shell was developed to serve as the primary go-to location for lean information and resources. In December 2013, the lean team began the division-wide lean training effort by conducting a one-hour basic lean introduction and overview using a standard online meeting for-mat. The live training had 135 individuals or sites logged on and, the recording has since been accessed 75 additional times through BbLearn.
The initial training was followed by nine, four-hour pro-cess-map activity and training sessions strategically located throughout the state with 135 staff members participating (59% of NAU-Extended Campuses’ total staff). These trainings ensured that every person across the division had the same basic understanding and starting point so that lean principles could be infused into the workplace. During these training sessions, 96 processes were identified as targets for improvement. Between December 12, 2013, and February 18, 2014, more than 675 division-wide training hours (135 participated in the one-hour training and in the four-hour in-person training) were recorded.
The train-the-trainer approach was intended to give the divi-sion the foundation to move from Level 1 – Pre-CI Interest to Level 2 – Structured CI (Bessant et al., 2001). In addition, the approach allowed the organization to begin to develop a lean culture, bring quality to the forefront, and streamline internal processes.
Priority ProcessesCare was taken in selecting initial projects. High-priority
projects that are smaller in scope can be chosen at the beginning

45 Quality Approaches in Higher Education Vol. 6, No. 2asq.org/edu
phases given they have a visible impact on the organization. Simons (2013) called these “burning platform” projects because they are “critical to [the organization’s] survival” (p. 3). The need for quick wins cannot be understated during the early stage of a lean implementation. In this regard, motivational and operational issues must be addressed at the same time for the ini-tiative to achieve success (Alagaraja, 2010). Therefore, Extended Campuses chose first-priority projects that were identified as having a relatively simple implementation schedule with poten-tial to provide a significant positive effect on performance.
Selection: In the second round of employee lean training, participants worked individually or in small teams to identify processes within their functional area over which they had direct oversight. These process map trainings identified 96 processes that could benefit from improvement. As shown in Figure 3, pro-cesses were identified division wide. The greatest opportunity for improvement was observed in the enrollment management area because there are more staff members in this area and, therefore, more process improvement ideas were submitted. Furthermore, this area had experienced more process alignment activities and initiatives over the previous two years.
Using the 96 processes as a foundation, the lean team rated each on two dimensions (ease of implementation and impact to the organization) to prioritize the processes into a manage-able work flow. Using an implementation prioritization and scoring process, scores of 1, 3, 6, or 9 were assigned to each dimension. Impact scores ranged from 1 = Low Impact to 9 = High Impact. Ease of implementation scores ranged from 1 = Complex Implementation to 9 = Easy Implementation. Scores on each dimension were multiplied together and the resulting final score served as a guide to rank the projects from highest to lowest. Once prioritized, cross-functional teams were formed to begin work on the top four projects (see Table 1). Other projects followed, and, to date, these teams have completed 13 projects
with four still in progress. In addition, there are a number of staff members and work groups who have incorporated lean thinking into their daily work.
Description: Each of the top four priority projects (e.g. new student orientation [NSO], event management alignment, class presentation data collection, and computer support processes for new employees) required cross-functional teams to utilize their new lean knowledge and skills to solve problems and evalu-ate improvements. Historically, new student orientations were handled at individual campuses across the state. The challenges to the NSO process included: declining participation in many locations at in-person orientation sessions, a growing number of online students who may or may not have access to the orienta-tion, and many staff hours needed to facilitate and deliver quality sessions. An examination of the problem demonstrated the need to create a standard orientation to onboard all new learners suc-cessfully with the potential to also enhance retention efforts. A cross-functional team was formed to address the issues discovered in the process maps. The team collected orientation materials from every location across the state and gained a detailed under-standing of the individual campus work flows. Next, comparable peer institutions were investigated to see how they managed their
Figure 3: Percentage of 96 Processes by Functional Unit
9%5%
12%
60%
14%Technology
Marketing
Employee support
Enrollment management
Academic operations
Table 1: Implementation Prioritization of Top Four Processes
Process/Project Title Impact Ease of Implementation
Score (Impact x
Implementation)
Evidence of Success
New student orientation 9 3 27 375 hours x $18/hour average salary = total cost savings $6,750 annually
Computer support processes for new employees
6 9 54 Qualitative value added to organizational success
Event management alignment 9 9 81 Qualitative value added to organizational success
Class presentation data collection 9 9 81 No significant change/success noted

46 Quality Approaches in Higher Education Vol. 6, No. 2asq.org/edu
NSOs and what best practices could be applied to the division. An online NSO was piloted in spring and summer 2014 with initial learner feedback prompting several modifications. The improved NSO was launched for all new learners in fall 2014.
The intent of the event management alignment project was to create a streamlined process and expectations for staff regarding planned outreach events. The primary challenges to the current state of event management included: inconsistencies in processes across the state, varying approval processes for events requiring admissions fees, specific regions focusing on only one type of event, and prioritization of certain events within the recruitment process. Creating a standard operating process was identified as the primary need to ensure that student recruitment opportuni-ties were consistent and equally distributed across regions and recruiters. A team was formed and began by defining and orga-nizing the types of events, standard event materials required, and the pre- and post-event process. The team collected information from all recruiters, marketing materials, and approval processes. Next, the team identified a standard process for each area through discussion and compromise before deployment across the state.
The class presentation data collection project involved the amount of data a recruiter was required to collect from pro-spective learners during a class presentation. The importance of a class presentation is to relay program information quickly and create enthusiasm about pursuing a bachelor’s degree. The primary challenge with the required amount of data was that recruiters spent the majority of their time in the presentation confirming that prospective learners completed the form cor-rectly. Therefore, the marketing team reduced the amount of information required, created a new form, and sought input from staff members who used the form. Once feedback was collected, the new form was created and distributed at all events.
The computer support processes for new employees were handled individu-ally by hiring supervisors at individual campuses across the state. The chal-lenges faced included: amount of notice given to the technology team prior to a new employee starting, supervisors setting up technology access with-out including the technology team, and varying access based on who and when the technology was set up for the new employee. Since technology access is critical within a distributed organization, a streamlined process
was necessary to provide required access close to the start date. The technology team worked with the employee support team to identify the place in the hiring process in which a supervisor would inform them of a new hire. The technology team created an online submission form to allow supervisors to make requests for changes to technology at their campus, troubleshoot issues, and create tickets. The electronic form was deployed through the intranet and messaging was sent to all staff about the updates.
Evidence of SuccessPrior to beginning the training initiative, the lean team delin-
eated several success indicators with the objective of measuring participation, involvement, and engagement (see Table 2). The purpose was to establish a baseline for future assessments of impact and long-term results. The success indicators were selected based on discussion among the Intel mentors and the lean team mem-bers with the intent of establishing well-trained and engaged staff.
Four Priority Processes As shown in Table 1, the evidence of organizational success
on the top four projects was varied. The NSO project proved more difficult to implement yet had the greatest outcome of organizational success. Based on satisfaction surveys conducted, new learners from the fall of 2014 indicated that they Agreed or Strongly Agreed to the following statements: 91% agreed that the “Subject matter was useful for me as a new student,” 90% agreed that “The modules explained each concept well,” and 85% agreed that “Time spent was appropriate.” Although NAU-Extended Campuses has calculated an estimated time and cost savings for staff (see Table 1), additional calculations regarding
Table 2: Success Indicators and Outcomes
Success Indicator Frequency Measure of Outcome
Number and percentage of staff trained
Quarterly Participation 132 staff, 59% of staff
59% of staff 6 9 54
Number of lean resources shared and accessed
Monthly Participation and engagement
23 resources shared; accessed 248 times
Number of ideas submitted Monthly Volume 96 submitted
Percentage of people submitting ideas
Monthly Participation and involvement
43%
Percentage of ideas implemented Monthly Effectiveness 14%
Number of kaizen events Monthly Participation None to date
Control plans Monthly Transformation To be determined

47 Quality Approaches in Higher Education Vol. 6, No. 2asq.org/edu
student retention, success, and achievement associated with the orientation have not been calculated, as it is too early to measure changes in these areas.
The computer support processes for new employees have shown satisfying results for the supervisor, new employee, and the technology team. Supervisors have responded positively to the new system and have stated that the new system is more efficient than the previous email system, particularly since the previous email system resulted in bottlenecks for assigning tasks. Additionally, the technology team has identified that the ticketing system has improved efficiency in which they are able to respond to requests, plan for travel, and prioritize issues. Additional quantitative data is being calculated and a more com-prehensive assessment will be reported in fall 2015.
Since the January 2015 implementation of the event manage-ment alignment project, anecdotal indications show that staff are appreciative of the resources, have implemented the check-lists, and have reduced the preparation time and paper waste for events. Further quantitative evaluation work has been planned.
As the lean team learned through the class presentation data collection project, not all projects that have the potential for high impact and have a high ease of implementation are a success. Although the collection of data was reduced at the point of a class presentation, it did not prove to have a greater impact on the staff members’ time or effort and no significant change was found in the number of prospective students who filled out the data collection card. Although Extended Campuses has returned to a more in-depth data collection card, this project was the cata-lyst for refining the prospective student qualification process and improving the speed in which a prospective student met with a recruiter to having in-depth conversations with an advisor. As evidenced in this project, there are times when lean will not work for the specific or intended goals. However, when staff begin to move from Level 2 – Structured CI to Level 3 – Goal Oriented CI, the shift that occurs allows the organization to adapt more quickly and efficiently (Bessant et al., 2001).
Additional Evidence of SuccessObserved success with the first four priority projects rein-
forced a culture of continuous improvement and provided the needed motivation to tackle other projects identified as having a complex implementation schedule. It also sparked interest from other areas within the university. The work of Extended Campuses often overlaps with other campus departments, and the lean team saw the multiplier effect of engaging another team leader and how it can continue the ripples of operational excel-lence across departments. The lean team has observed employees and campuses that have incorporated the lean principles into
their language, thinking, and culture. Further evidence of suc-cess includes presentations by members of the lean team at seven local, state, and national conferences in 2013-14. Each presenta-tion allowed team members to reach individuals in the higher education community and showcase the impact of lean and operational excellence thinking. Additionally, members of the lean team have been called upon for advice as an outcome of the connections made at these presentations.
Conclusion and Next StepsNetworking, mentoring, and training the lean team moved
NAU-Extended Campuses in small, incremental steps toward improved effectiveness. The organizational goal was to infuse lean principles into the workforce to enhance efficiency as well as engage and empower staff to change throughout the division. As previously stated, a successful lean initiative must cultivate a cul-ture of quality, make initial investments in people and resources, and look for quick wins to maintain momentum (Freed, Klugman, & Fife, 1997; Roffe, 1998; Simons, 2013). This was the foun-dational approach Extended Campuses took along its journey, starting with one lean champion, then seven lean team members, and then more than 135 employees. NAU-Extended Campuses made significant human resource and financial commitments to the transformation and then chose the top-priority projects as the quick wins to build momentum toward fostering the culture of operational excellence and quality. Intel provided critical knowl-edge and resources that allowed the division’s leadership to focus on motivating and organizing the effort from the inside.
When NAU-Extended Campuses first began its journey, it was hovering around Level 1 – Pre-CI Interest (Bessant et al., 2001). Today, the division is firmly in Level 3 – Goal Oriented CI (Bessant et al., 2001) by continuing to identify goals of improve-ment and ways to look at challenges from new perspectives. As Extended Campuses has moved along the CI continuum, there has been an increase in organizational communication, com-mon focus via alignment of goals and initiatives, and improved employee engagement. The organizational transformations will require refinement as the division continues on its journey. Cultural changes take time and effort at all levels, but when owned and lived by leadership, a greater opportunity exists to align strategic goals and the actions of staff (Simons, 2013).
As NAU-Extended Campuses moves to Level 4 – Proactive CI (Bessant et al., 2001), the lean team will look for ways to engage and empower staff to begin using the team members as consultants rather than having lean team members drive process improvement. This shift requires significant confidence and skill building. However, it is essential that employees remain engaged
48 Quality Approaches in Higher Education Vol. 6, No. 2asq.org/edu
and empowered to act on their own in order for the division to move to Level 5 – Full CI (Bessant et al., 2001).
The lean team recognizes the need to quantify impacts more specifically. Therefore, the team is focusing on maturing its think-ing and understanding on issues around measurement. In spring 2014, members of the lean team completed training on the incor-poration of a new software package (eVSM) into projects to assist with process mapping and the budget-saving calculations attained. Using this software and other measurement methods will provide the foundation to report results in succinct and tangible ways.
Institutions interested in embarking on an operational excel-lence journey must assess their organizational readiness for this type of change. Outside experts may be helpful to guide the orga-nization to think creatively about how to motivate, organize, and truly instill a lean or operational excellence culture. Additionally, institutions must recognize that commitment will require direct investment of resources in addition to understanding opportu-nity costs. It is critical that higher education leadership engage in self-learning to provide solid foundations. What are you willing to commit to maximize performance and remain competitive? Getting started is a critical first step!
References:Alagaraja, M. (2010). Lean thinking as applied to the adult education environment. International Journal of Human Resources Development and Management, 10(1), 51-62.
Arizona Board of Regents (2010). Arizona Higher Education Enterprise Plan. Retrieved from: https://webapp6.asu.edu/corda/dashboards/ABOR_public/main.dashxml.
Barnett, W. P., & Carroll, G. R. (1995). Modeling internal organiza-tional change. Annual Review of Sociology, 21(1), 217-236.
Bessant, J., Caffyn, S., & Gallagher, M. (2001). An evolutionary model of continuous improvement behaviour. Technovation, 21(2), 67-77.
Freed, J. E., Klugman, M. R., & Fife, J. D. (1997). A culture of academic excellence: Implementing the quality principles in higher edu-cation. ASHE-ERIC Higher Education Report, 25(1), xv-191.
KPMG (2013). The three stages of Lean. Retrieved from http://www.kpmg.com/global/en/issuesandinsights/articlespublications/breaking-through-the-wall/pages/three-stages-of-lean.aspx.
Miller, A. (2014). Redefining operational excellence: New strategies for maximizing performance and profits across the organization. New York, NY: AMACOM - American Management Association.
Northern Arizona University – PAIR (n.d.). Institutional Effectiveness. Retrieved from: http://www4.nau.edu/pair/.
Piccolo, J., & Knobloch, P. (2012). Operational excellence in higher educa-tion. State College, PA: Innate Management, Inc. and The Pennsylvania State University.
Roffe, I. M. (1998). Conceptual problems of continuous quality improve-ment and innovation in higher education. Quality Assurance in Education, 6(2), 74-82.
Simons, N. (2013). The business case for Lean Six Sigma in higher edu-cation. ASQ Higher Education Brief, 6(3), 1-6.
Womack, J. P., Jones, D. T., Roos, D. (2007). The machine that changed the world. New York, NY: Free Press.
Karen L. Pedersen, Ph.D., recently stepped into the role as chief knowledge officer for the Online Learning Consortium (OLC – formerly Sloan-C). Prior to joining OLC, Pedersen served as the associate vice president for extended campuses at Northern Arizona University, the vice president for professional studies at Southwestern College (Kansas), and in aca-demic associate and dean roles at Upper Iowa University’s extended university. Prior to start-ing her administrative career, Pedersen served as a faculty member at the University of Nebraska at Kearney. She can be reached via email at [email protected].
Melisa J. Ziegler, M.A., is a Ph.D. candidate in educational psychology at The Pennsylvania State University and the program director for Washington State for the American Honors programs at Pierce College and Community Colleges of Spokane. She worked as a gradu-ate assistant for Penn State Academic Outreach’s operations unit where she worked on process improvement and operations proj-ects. Ziegler’s research interests include the measurement and evaluation of undergradu-ate learning outcomes and continuous process improvement. She can be reached via email at [email protected].
Lacy D. Holt, M.A., is the coordinator of train-ing and development at Northern Arizona University, Flagstaff, AZ. She has more than 15 years of experience in public K-12 and higher education with a focus on student services, employee development, and process improve-ment. Her research interests are in the areas of training and employee engagement. Holt can be reached via email at [email protected].
Karen L. Pedersen
Melisa J. Ziegler
Lacy D. Holt
http://www.kpmg.com/global/en/issuesandinsights/articlespublications/breaking-through-the-wall/pages
http://www.kpmg.com/global/en/issuesandinsights/articlespublications/breaking-through-the-wall/pages
The American Society for Quality’s Education Division publishes the online, double-blind, peer-reviewed journal Quality Approaches in Higher Education. The editorial team actively encourages authors to submit papers for upcoming issues.
The purpose of this journal is to engage the higher education community in a discussion of significant topics related to improving quality and identifying best practices in higher education; and expanding the literature specific to quality in higher education topics. With the increased emphasis on quality improvement in our colleges and universities, Quality Approaches in Higher Education engenders a conversation focusing on this topic, supported by manuscripts from the interna-tional higher education community of faculty, researchers, and administrators from the different disciplines and professions. Quality Approaches in Higher Education welcomes submissions of manuscripts from two- and four-year institutions, including engineering colleges, business schools, and schools of education. The journal also welcomes manuscripts from the student services arena, institutional research, professional development, continuing education, business affairs, and other aspects of the higher education campus related to quality improvement. We encourage evidence-based analysis using quality approach-driven improvement of higher education.
The following types of articles fit the purview of Quality Approaches in Higher Education:• Case studies on how to improve quality in a college or university using evidence-based analysis, continuous improve-
ment approaches, especially related to improving student retention and degree completion. • Research articles reporting on survey findings such as a national survey on students’ attitudes toward confidence, suc-
cess in college, social networking, student engagement, access and affordability, etc.• Case studies or research articles addressing issues such as the role of faculty and administrators in quality systems.• Case studies or research studies focusing on the role of quality in accreditation.• Case studies demonstrating best practices and systems thinking in higher education using the Baldrige Education
Criteria for Performance Excellence, Lean Six Sigma or other national quality models, standards from the Council for the Advancement of Standards in Higher Education (CAS), or national frameworks and protocols, including prepar-ing K-16 teachers for teaching in the 21st century learning environment.
• Case studies or research studies on scholarship of teaching and approaches to improved teaching, enhancing and sup-porting student learning, learning outcomes assessment best practices, and best practices for using technology in the college classroom.
• Case studies or research studies on how student service units and intervention programs impact the quality of student experience and student learning.
• Case studies or research studies specific to collaboration with industry on STEM education through internships, co-ops, and capstone experiences for providing experiential and deep learning experiences and preparing students for STEM careers.
• Research studies on how higher education practices impact the quality of student life and student success for different student populations, including underrepresented groups, first generation in college students, and students from low-income families.
• Case studies that highlight the emerging improvement science for education and the continuous improvement cycle.• Significant conceptual articles discussing theories, models, and/or best practices related to quality in colleges and
universities.NOTE: We may dedicate an issue to a special topic to highlight areas of high interest in the field of higher education. Articles generally should contain between 3,500 and 5,000 words and can include up to six charts, tables, diagrams, illustrations, or photos of high resolution. For details, please check the “Author Guidelines” at: http://asq.org/edu/quality-information/journals/
Please send your submissions to: Dr. Elizabeth Cudney at [email protected]
Call For Papers
Quality Approaches in Higher Education is a double-blind, peer-reviewed journal that is published online by the Education Division of the American Society for Quality (ASQ). The purpose of this journal is to engage the higher educa-tion community in a discussion of significant topics related to improving quality and identifying best practices in higher education; and expanding the literature specific to quality in higher education topics. We will only consider articles that have not been published previously and currently are not under consideration for publication elsewhere.
General InformationArticles in Quality Approaches in Higher Education generally should contain between 3,500 and 5,000 words and can
include up to six charts, tables, diagrams, photos, or other illustrations. See the “Submission Format” section for more detail.The following types of articles fit the purview of Quality Approaches in Higher Education:
• Case studies on how to improve quality in a college or university using evidence-based analysis and continuous improvement approaches, especially related to improving student retention and degree completion.
• Research articles reporting on survey findings such as a national survey on students’ attitudes toward confidence, suc-cess in college, social networking, student engagement, access and affordability, etc.
• Case studies or research articles addressing issues such as the role of faculty and administrators in quality systems.• Case studies or research studies focusing on the role of quality in accreditation.• Case studies demonstrating best practices and systems thinking in higher education using the Baldrige Education
Criteria for Performance Excellence, Lean Six Sigma or other national quality models, standards from the Council for the Advancement of Standards in Higher Education (CAS), or national frameworks and protocols, including preparing K-16 teachers for teaching in the 21st century learning environment.
• Case studies or research studies on scholarship of teaching and approaches to improved teaching, enhancing and sup-porting student learning, learning outcomes assessment best practices, and best practices for using technology in the college classroom.
• Case studies or research studies on how student service units and intervention programs impact the quality of student experience and student learning.
• Case studies or research studies specific to collaboration with industry on STEM education through internships, co-ops, and capstone experiences for providing experiential and deep learning experiences and preparing students for STEM careers.
• Research studies on how higher education practices impact the quality of student life and student success for different student populations, including underrepresented groups, first generation in college students, and students from low-income families.
• Case studies that highlight the emerging improvement science for education and the continuous improvement cycle.• Significant conceptual articles discussing theories, models, and/or best practices related to quality in colleges and universities.
Author Guidelines
Manuscript Review ProcessWe log all article submissions into a database and delete all references to you. These “blinded” versions then go to
the editorial review team for comments and recommendations. Both author(s) and reviewers remain anonymous in this process. The review process takes approximately three months during which time the reviewers advise the editor regarding the manuscript’s suitability for the audience and/or make suggestions for improving the manuscript. Reviewers consider the following attributes:1. Contribution to knowledge: Does the article present innovative or original ideas, concepts, or results that make a
significant contribution to knowledge in the field of quality in higher education?2. Significance to practitioners: Do the reported results have practical significance? Are they presented clearly in a fashion
that will be understood and meaningful to the readers?3. Conceptual rigor: Is the conceptual basis of the article (literature review, logical reasoning, hypothesis development,
etc.) adequate?4. Methodological rigor: Is the research methodology (research design, qualitative or quantitative, methods, survey meth-
odology, limitations, etc.) appropriate and applied correctly? For a conceptual paper, is the framework appropriate and applied correctly?
5. Conclusions and recommendations: When appropriate, are the conclusions and recommendations for further research insightful, logical, and consistent with the research results?
6. Readability and clarity: Is the article well organized and presented in a clear and readable fashion? Is the article written in English and in a grammatically acceptable manner?
7. Figures and tables: When submitted, are the figures and/or tables used appropriately to enhance the ability of the article to summarize information and to communicate methods, results, and conclusions?
8. Organization and style: Is the content of the article logically organized? Are technical materials (survey scales, extensive calculations, etc.) placed appropriately? Is the title representative of the article’s content?
9. Attributions: Are the sources cited properly using APA style? Are attributions indicated properly in the reference list?You should use these attributes as a checklist when reviewing your manuscript prior to submission; this will improve
its likelihood of acceptance.
Review Process OutcomesThere are three possible outcomes of the review process:
• Accept with standard editorial revisions. In this case, the content of the article is accepted without requiring any changes by you. As always, however, we reserve the right to edit the article for style.
• Accept with author revisions. An article in this category is suitable for publication, but first requires changes by you, such as editing it to fit our length requirements or providing more detail for a section. We provide specific feedback from our reviewers to guide the revision process.
• Decline to publish. Occasionally articles are submitted that do not fit our editorial scope. We may provide you with suggestions for modifying the article to make it more appropriate to our publication.Please note that after articles are edited for publication, we return them to you to approve the technical content. A
response may be required within 48 hours or the article may be held over for a subsequent issue.Articles that appear to be advertising or do not fit the general topics addressed by Quality Approaches in Higher
Education will be rejected without receiving peer reviews.
Author Guidelines

Helpful Hints1. Articles should emphasize application and implications of what is being presented, whether conceptual or research-based.• Use the early paragraphs to summarize the significance of the research.• Make the opening interesting; use the opening and/or background to answer the “so what?” question.• Spell out the practical implications for those involved in higher education.2. Detailed technical description of the research methods or conceptual/theoretical framework is important, but not
necessarily of interest to everyone. The description should enhance the narrative or be critical to the understanding of the article’s material.
3. Throughout the article, keep sentence structure and word choice clear and direct. 4. Avoid acronyms and jargon that are industry- or organization-specific. Try not to use variable names and other abbre-
viations that are specific to the research. Restrict the use of acronyms to those that most readers recognize. When acronyms are used, spell them out the first time they are used and indicate the acronym in parentheses.
5. Occasionally, our reviewers and readers view articles that include reference to the author(s) proprietary products or methods as a form of advertising. Although we encourage you to share personally developed theories and application approaches, we ask that you refrain from using our publication as a marketing tool. Please take great care when includ-ing information of this nature in your article.
6. If the article cites cost savings, cost avoidance, or cost-benefit ratios, or provides the results of statistical evaluations, include an explanation of the method of calculation, along with any underlying assumptions and/or analysis considerations.
7. Access to any survey discussed in the manuscript is important for our review and must be included with the manu-script. Depending on the length of the survey, we may include the entire survey with the article.
8. When submitting an article that is based on qualitative methodology, please be sure to describe the research questions, the information that is the basis of the data analysis, and report the developing themes. Also remember to include text analysis as part of data analysis. Please include the protocols in a separate Word document; review of the protocols will be important in our technical review. Consider including the protocols in the methodology section of the manuscript, if they can be presented concisely.
9. Our staff does not have the means to compile references or verify usage permissions; therefore, it is important for you to provide all that information with your article, including written letters of authorization when appropriate. Plagiarism is a rapidly growing crime—particularly due to the use of information from the Internet. Please help yourself, and us, to maintain professional integrity by investing the time necessary to verify your sources and to obtain and document all necessary permissions. Information on our requirements for documenting references, along with specific examples, is included at the end of these guidelines.
Author Guidelines
Submission Format1. We accept only electronic submissions in Microsoft Word format. The first page should be a title page with the title,
and names of the authors and their affiliations. The second page should be the start of the proposed article with the title and abstract (150 words maximum) at the top of the page. There should be no reference to the author(s) or affilia-tion in the text that follows. Instead of the name of a university for a case study, the text should state “the University”. The margins should be one inch all around on 8½ x 11 pages with Word’s one-column format, left-justified. The title and section titles should be 14 point bold Calibri font. The text font should use 11 point Calibri font and a line spac-ing of 1.5 is preferred. Section headings should be 12-point bold Calibri and left justified. Typical section names are: Abstract, Introduction, Background, Literature Review, Methodology, Results, Discussion, Suggestions for Best Practices, Summary or Conclusions, Recommendations, Future Work/Research, Acknowledgments, and References. The actual headings will depend on the focus of the manuscript. There may be two additional levels of sub-headings. The first set of subheadings would be left-justified with the first letter of each word capitalized and in bold, 12 point Calibri. The second level of sub-headings would be the same but in italics.
2. If you are familiar with the APA formatting, we prefer the APA format, but will accept a well-formatted manuscript following these already mentioned guidelines.
3. The manuscript should be between 3,500 and 5,000 words including the abstract, tables, and references. It should include no more than six tables or figures. If you feel strongly that more tables or figures are needed to support the manuscript, we ask that you submit the additional tables or figures and provide an explanation for including them.
4. Tables should be included at the end of the article and must be in Microsoft Word. Each table must be referenced in the article and labeled and centered on a separate line, such as “<Insert Table 1 About Here> with the caption for Table 1 on the next line, such as Table 1: Graduation Rate by Major. Do not embed .jpg, .tif, .gif, or tables in other similar formats in your article.
5. Drawings, graphs, and other illustrations should be sent in an email as separate .jpg files with 300dpi; each item should be included in a separate file. All drawings and other illustrations must be referenced in the article, and must be labeled and centered on a separate line, such as <Insert Figure 1 About Here> with the caption for Figure 1 on the next line: “Figure 1: Pareto Analysis of Student Participation in Department Activities.”
6. We can use photos if they enhance the article’s content. If you choose to submit a photo with your article, it must be a high-resolution .jpg or (at least 300 dpi and at least 4” by 6” in size). Photos should be sent in separate files and ref-erenced in the article. Photos should be accompanied by a complete caption, including a left- to-right listing of people appearing in the photo, when applicable. Do not include any text with the photo file. All persons in the photo must have given permission to have their photo published in Quality Approaches in Higher Education.
7. Also submit a separate high-resolution electronic photo (at least 300 dpi) for each author. Author photos should be at least 1” by 2”. Author photos should have a plain background, and the author should be facing toward the camera. Please include a separate Word document with a 75- to 100-word biography for each of the authors, mentioning the place of employment, as well as contact information.
Author Guidelines
Citations and ReferencesQuality Approaches in Higher Education follows the 6th edition of the Publication Manual of the American Psychological
Association. Citations and references should use the (author’s last name, year of publication) notation in a citation in the text and use the APA style.
The reference section should be headed with the section heading of “References” and all references are to be listed alphabetically by the first author’s last name. Each reference should list all authors. List the online URL with a hyperlink. Retrieved date is not needed. Here are some examples:Book examples:
Veenstra, C., Padró, F., & Furst-Bowe, J. (eds). (2012). Advancing the STEM agenda: Quality improvement supports STEM. Milwaukee, WI: ASQ Quality Press.
Sorensen, C. W., Furst-Bowe, J. A., & Moen, D. M. (2005). Quality and performance excellence in higher education. Bolton, MA: Anken Publishing Company, Inc.Journal article examples:
Dew, J. (2009). Quality issues in higher education, Journal for Quality and Participation 32(1), 4-9. Retrieved from http://asq.org/pub/jqp/past/2009/april/index.html
Plotkowski, P. (2013). Guest commentary: Real-World engineering education: The role of continuous improvement, Quality Approaches in Higher Education, 4 (1), 2-4. Retrieved from http://rube.asq.org/edu/2013/05/best-practices/quality-approaches-in-higher-education-vol-4-no-1.pdf Reference example:
National Science Board. (2012). Science and engineering indicators 2012. Arlington, VA: National Science Foundation. Retrieved from http://www.nsf.gov/statistics/seind10/.
If the authors cite their own work, they should simply state (Author, year) and the same in the reference list (no title) in the initial manuscript (since the reviews are double-blind).
One of the most common errors we have observed with submitted articles is improper referencing due to improper attribution in the text and reference section. Please make sure that all the material in the submitted article is properly referenced and cited as appropriate.
Submission Send an electronic copy of the Word document of the manuscript including the title page, abstract, text of the manu-
script, acknowledgments, and references, with a separate file of any surveys used, separate .jpg files of the figures and photos of authors, and a Word document of the author biographies to Dr. Elizabeth Cudney at [email protected].
Note on Copyright TransferPrior to publication, you must sign a form affirming your work is original and is not an infringement of an existing
copyright. Additionally, we ask you to transfer copyright to ASQ. The copyright transfer allows you to reproduce your article in specific ways, provided you request permission from ASQ and credit the copyright to ASQ. The transfer also allows ASQ to reproduce the work in other publications, on its website, etc.
If you use materials from other works in your articles (other than standard references), you must obtain written per-mission from the copyright owner (usually the publisher) to reprint each item of borrowed material. This includes any illustrations, tables, or substantial extracts (direct quotations) outside the realm of fair use. Submit these permission letters with the article. Articles cannot be published until copies of all permission letters are received.
For example, an article includes a PDSA illustration from a book. The permission statement would include: Figure 1 is from Nancy R. Tague’s The Quality Toolbox, 2nd ed., ASQ Quality Press, 2005, page 391. This permission statement would appear in the caption just below the PDSA figure.
Author Guidelines
http://rube.asq.org/edu/2013/05/best-practices/quality-approaches-in-higher-education-vol-4-no-1.pdf
Related Documents