Engine Remanufacturing and Energy Savings Sahil Sahni 1 , Avid Boustani 1 , Timothy Gutowski, Steven Graves January 28th, 2010 Environmentally Benign Laboratory Laboratory for Manufacturing and Productivity Sloan School of Management MITEI-1-d-2010 1 Sahil Sahni and Avid Boustani have contributed equally to this study.

Welcome message from author
This document is posted to help you gain knowledge. Please leave a comment to let me know what you think about it! Share it to your friends and learn new things together.
Transcript

Engine Remanufacturing and Energy Savings
Sahil Sahni1, Avid Boustani1, Timothy Gutowski, Steven Graves
January 28th, 2010
Environmentally Benign Laboratory
Laboratory for Manufacturing and Productivity
Sloan School of Management
MITEI-1-d-2010
1Sahil Sahni and Avid Boustani have contributed equally to this study.
Contents
1 Introduction 1
2 Gasoline Engines for Passenger Cars 22.1 Introduction . . . . . . . . . . . . . . . . . . . . . . . . . . . . 22.2 Life Cycle Inventory . . . . . . . . . . . . . . . . . . . . . . . 3
2.2.1 Raw Materials Production . . . . . . . . . . . . . . . . 32.2.2 Manufacturing . . . . . . . . . . . . . . . . . . . . . . 52.2.3 Use Phase . . . . . . . . . . . . . . . . . . . . . . . . . 52.2.4 Transportation . . . . . . . . . . . . . . . . . . . . . . 8
2.3 Life Cycle Assessment . . . . . . . . . . . . . . . . . . . . . . 82.4 Remanufacturing Energy Saving Potential . . . . . . . . . . . 92.5 Economics (Answer to Why Car Engines are Remanufactured!) 15
3 Diesel Engines for heavy duty combination trucks 173.1 Introduction . . . . . . . . . . . . . . . . . . . . . . . . . . . . 17
3.1.1 Raw Material Production and Manufacturing . . . . . 173.1.2 Use Phase . . . . . . . . . . . . . . . . . . . . . . . . . 173.1.3 Transportation . . . . . . . . . . . . . . . . . . . . . . 19
3.2 Life Cycle Analysis . . . . . . . . . . . . . . . . . . . . . . . . 193.3 Remanufacturing Energy Saving Potential . . . . . . . . . . . 19
4 Conclusion 21
5 Assumptions 23
1

List of Figures
1 Transportation Energy Use break-up for different vehicle cat-egories [1]. . . . . . . . . . . . . . . . . . . . . . . . . . . . . . 1
2 The average decision choices for a consumer who has usedhis car (bought in 1987) for 120,000 miles and now in 1999 isconsidering changing the vehicle or remanufacturing its com-ponents. . . . . . . . . . . . . . . . . . . . . . . . . . . . . . 3
3 Bill of Materials for Gasoline Internal Combustion Engine [2]. 44 Fuel Energy Distribution in a Passenger Car [3, 4]. . . . . . . 65 Engine Use phase calculation for a new engine of 1987. . . . . 76 Life Cycle Assessment of a New (1999) and Remanufactured
(1987) Gasoline Engine. . . . . . . . . . . . . . . . . . . . . . 87 Fuel Economy Trend for Passenger Cars[5]. . . . . . . . . . . 118 Annual Fuel Economy change for on-road Passenger Cars[6]. . 129 Use phase energy consumption for engines of different gener-
ation to travel 120,000 miles. . . . . . . . . . . . . . . . . . . 1210 Car Engine Remanufacturability Trend. . . . . . . . . . . . . 1311 Economic Analysis of Passenger Car Engine Remanufacturing. 1612 Fuel Energy Distribution in a Combination Truck[7]. . . . . . 1813 Life Cycle Assessment of a New (from 1999) and Remanufac-
tured (from 1987) Diesel Combination-Truck Engine. . . . . . 2014 Average Fuel Economy and Payload for a Combination-Truck[8]. 2015 Annual Fuel Economy change for on-road Combination Trucks. 2116 Truck Engine Remanufacturability. . . . . . . . . . . . . . . . 22
2

1 Introduction
As per [9], the United States Transportation sector consumed 28.5% of thetotal 101.5 quadrillion BTUs of energy consumed in the US in 2007. Thisfraction has been consistently rising at more than 1% over the last couple ofdecades. It is also true that the United States on-road transportation energyuse is dominated by Passenger Cars, as shown in the figure 1 [1]. The totalenergy used by on-road transportation (by cars, trucks, motorcycles andbuses) in 2007 is 22,393 trillion BTUs.
Figure 1: Transportation Energy Use break-up for different vehicle cate-gories [1].
On a per vehicle basis, heavy-duty trucks consume the most energy dueto their extensive driving cycles and low fuel economy. [9] reports that heavytrucks consumed on an average consumed over 23,000 BTUs per vehicle in2006, while passenger cars and light-trucks consumed approximately 5,500and 6,900 BTUs respectively. As a result, the need to reduce transporta-tion energy consumption, especially by passenger cars and heavy trucksis very apparent. To do so it is important to understand the character-istics of the vehicle population on-road as well as of the new ones pur-chased every year. The Bureau of Transportation Statistics [10] estimatesthe average new vehicle (passenger cars and light trucks) sales in 2008 tobe 10,933 while used vehicle sales to be 36,530. The same for 2007 were12,631 and 41,418 respectively. This shows the prevailing presence of cus-tomers interested in choosing used vehicles and their components over newones. Though this characteristic does not completely represent the vehiclepopulation, it seems to be highly prevalent and thus demands investigation.This report thus undertakes the task to evaluate the energy saving poten-tial of reusing/remanufacturing the largest-energy-consuming component ofa vehicle - its engine. When these engines reach their end of life, they caneither be land-filled or they can be recycled which would conserve only the
1
original materials, or they can be remanufactured and resold in a like-newworkable condition which would not only conserve the materials but alsothe value-added during the manufacturing processes, like casting, molding,machining etc. Intuitively, remanufacturing seems to be the most viableoption. Remanufacturing of automobiles engines has been practiced since1920s. As per the PERA (The Production Engine Remanufacturers Asso-ciation), engine remanufacturing in the U.S. alone is a $2.5 billion industrywith approximately 2.4m engines remanufactured every year [2].
In this report we would like to focus on remanufacturing of passengercar gasoline engines and heavy duty combination truck diesel engines andcalculate their benefits with reference to energy savings. Along with energy,economic assessments are also presented for comparison.
2 Gasoline Engines for Passenger Cars
2.1 Introduction
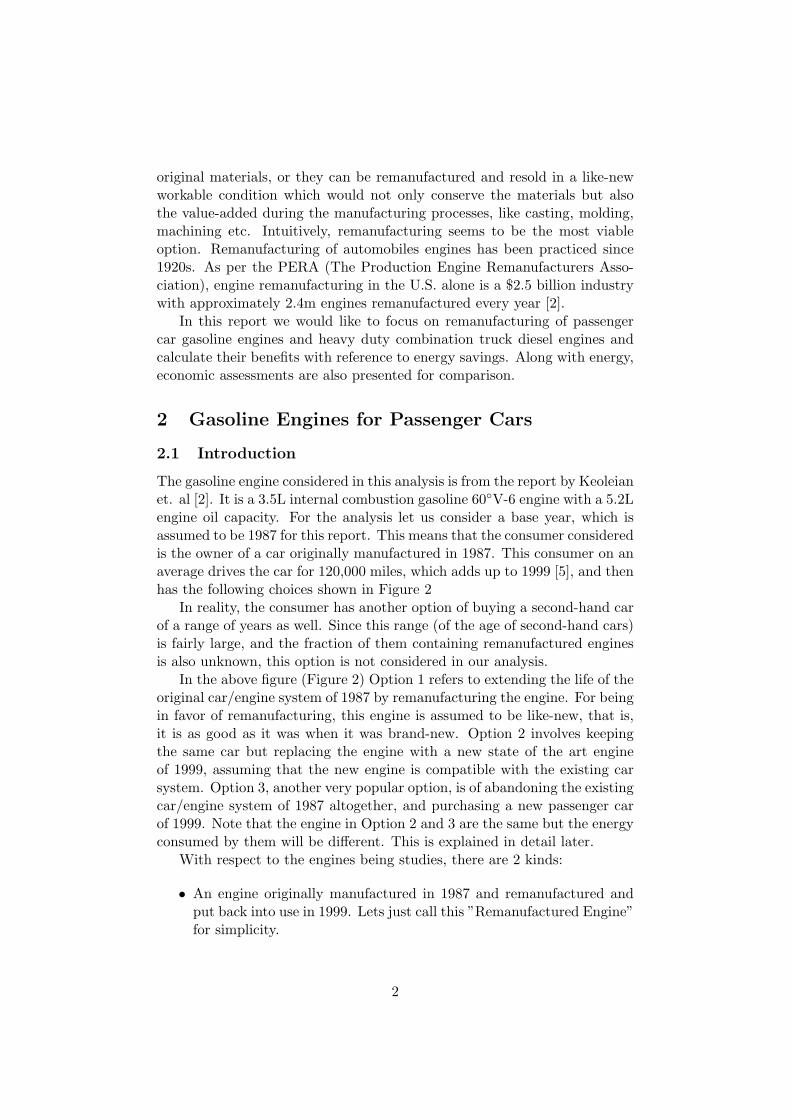
The gasoline engine considered in this analysis is from the report by Keoleianet. al [2]. It is a 3.5L internal combustion gasoline 60◦V-6 engine with a 5.2Lengine oil capacity. For the analysis let us consider a base year, which isassumed to be 1987 for this report. This means that the consumer consideredis the owner of a car originally manufactured in 1987. This consumer on anaverage drives the car for 120,000 miles, which adds up to 1999 [5], and thenhas the following choices shown in Figure 2
In reality, the consumer has another option of buying a second-hand carof a range of years as well. Since this range (of the age of second-hand cars)is fairly large, and the fraction of them containing remanufactured enginesis also unknown, this option is not considered in our analysis.
In the above figure (Figure 2) Option 1 refers to extending the life of theoriginal car/engine system of 1987 by remanufacturing the engine. For beingin favor of remanufacturing, this engine is assumed to be like-new, that is,it is as good as it was when it was brand-new. Option 2 involves keepingthe same car but replacing the engine with a new state of the art engineof 1999, assuming that the new engine is compatible with the existing carsystem. Option 3, another very popular option, is of abandoning the existingcar/engine system of 1987 altogether, and purchasing a new passenger carof 1999. Note that the engine in Option 2 and 3 are the same but the energyconsumed by them will be different. This is explained in detail later.
With respect to the engines being studies, there are 2 kinds:
• An engine originally manufactured in 1987 and remanufactured andput back into use in 1999. Lets just call this ”Remanufactured Engine”for simplicity.
2
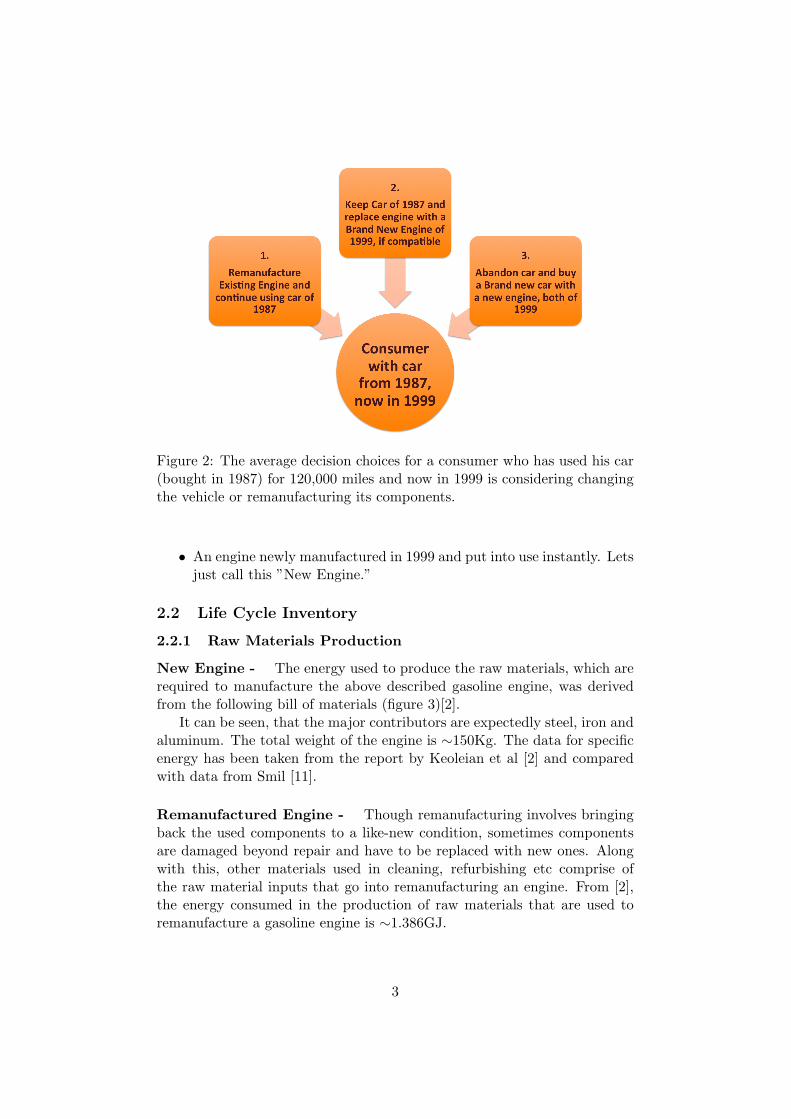
Figure 2: The average decision choices for a consumer who has used his car(bought in 1987) for 120,000 miles and now in 1999 is considering changingthe vehicle or remanufacturing its components.
• An engine newly manufactured in 1999 and put into use instantly. Letsjust call this ”New Engine.”
2.2 Life Cycle Inventory
2.2.1 Raw Materials Production
New Engine - The energy used to produce the raw materials, which arerequired to manufacture the above described gasoline engine, was derivedfrom the following bill of materials (figure 3)[2].
It can be seen, that the major contributors are expectedly steel, iron andaluminum. The total weight of the engine is ∼150Kg. The data for specificenergy has been taken from the report by Keoleian et al [2] and comparedwith data from Smil [11].
Remanufactured Engine - Though remanufacturing involves bringingback the used components to a like-new condition, sometimes componentsare damaged beyond repair and have to be replaced with new ones. Alongwith this, other materials used in cleaning, refurbishing etc comprise ofthe raw material inputs that go into remanufacturing an engine. From [2],the energy consumed in the production of raw materials that are used toremanufacture a gasoline engine is ∼1.386GJ.
3
Figure 3: Bill of Materials for Gasoline Internal Combustion Engine [2].
4

2.2.2 Manufacturing
New Engine - The energy consumed during manufacturing of the engine,which is exclusive of raw material production is 4.374 GJ [2].
Remanufactured Engine - The manufacturing, rather remanufacturingstage, primarily entails disassembly, cleaning, checking for defects, repair-ing/refurbishing, replacing (if need be), re-assembling and testing. Thesesteps all require energy which is taken to be ∼1.409 GJ from [2].
2.2.3 Use Phase
The energy consumed while the engine is in use is dependent on a number offactors like the total time of use, the fuel consumption rate, the percentageof fuel energy consumed by the engine itself etc. The fuel economy dataavailable [12] is only for new cars with new engines or for average on-roadvehicles. However if you mix and match cars and engines (like in the caseof Option 2), the fuel economy is likely to change since different cars havedifferent aerodynamic drag, different transmissions etc. Explicit data forthe fuel economy in such cases is not available. Remanufactured enginescan often be deployed into various car systems (as long as the car and theremanufactured engine are compatible), thus making it difficult to estimatethe resulting fuel economy. While the same engine when installed in differentcars can result in different fuel economies, it is true that the energy consumedper unit fuel input by the engine itself would be fixed. In other words, theefficiency of the engine (our system) remains fixed irrespective of which carthe engine is deployed into (which is outside the system).
Remanufactured Engine, Option 1 - Let us first analyze the homoge-neous system of Option 1 (car and engine of the same year, 1987, allowing usto use the available fuel economy literature data). To calculate the energyconsumed by the engine of 1987 (base year), we will calculate the fractionof total energy utilized by a car and engine of 1987, that corresponds to theengine alone. Note that the MPG of a car is for the car as the system andnot the engine alone.
The life of a passenger car vehicle was referred from [2] and considered tobe 120,000 miles, as described before. The fuel economy (mpg, fuel consump-tion rate) of a new car of 1987 was taken from [12] since the remanufacturedengine is expected to perform like new. The specific energy of Gasoline Fuelwas taken from [9]. These statistics can be used to calculate the energyused by the entire vehicle during it total use, since the fuel economy is theperformance metric of the entire vehicle. However, what is needed is theenergy used by the vehicle engine alone. The contribution of fuel that goesor is consumed by the engine, was adopted from [3, 4], and was taken to
5

be 80%. The distribution of fuel energy in a passenger car is shown in thefigure 4.
Figure 4: Fuel Energy Distribution in a Passenger Car [3, 4].
The thermodynamic efficiency of a gasoline engine (typically 38%) andengine frictions are used to calculate the engine contribution to the usephase energy of a vehicle (80% of the total fuel energy). In other words, theefficiency of this engine is roughly 20%.
It should be noted that the fraction of total energy consumed by thevehicle that can be attributed to the engine alone is called the ContributionFactor of the engine. With technological advances in drive-train efficiencies,vehicle aerodynamics, tire friction, this Contribution Factor is expected tovary in time. Since no data was found which indicated these changes, the80% [3] statistic, that originally comes from a reference published in 1994,was assumed to be valid for a new average passenger car manufactured inthis study’s base year, 1987.
Using the above statistics and approximations, the use phase energy fora new average engine for passenger cars in 1987 was estimated to be 443,149MJ. A better understanding for the calculations in shown in the table belowin Figure 5
Thus an engine manufactured in 1987, on an average consumes 443 GJof absolute energy during the 120,000 mi of driving. Since we assume like-new condition for the remanufactured engine and since the car remains thesame, this is also the energy consumed by the remanufactured engine orwith Option 1.
New Engine, Option 2 - The Option 2 considers continuing with thesame car of 1987, after replacing the installed engine with a new state-of-
6
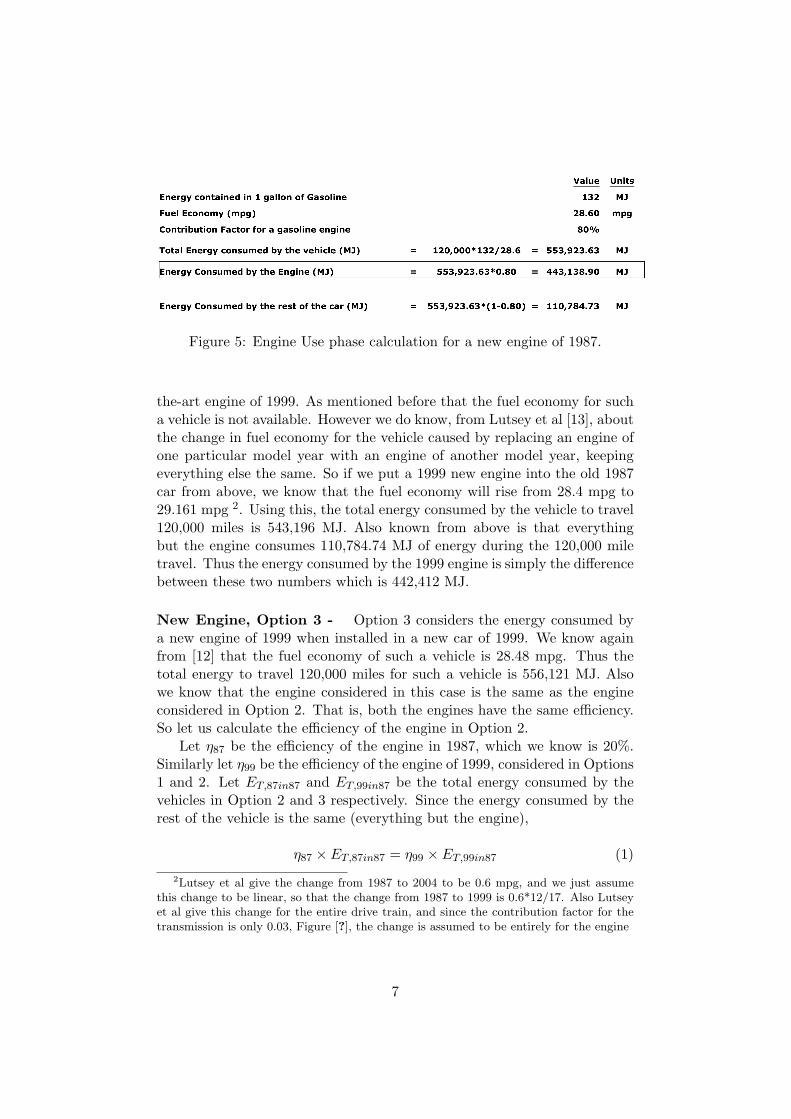
Figure 5: Engine Use phase calculation for a new engine of 1987.
the-art engine of 1999. As mentioned before that the fuel economy for sucha vehicle is not available. However we do know, from Lutsey et al [13], aboutthe change in fuel economy for the vehicle caused by replacing an engine ofone particular model year with an engine of another model year, keepingeverything else the same. So if we put a 1999 new engine into the old 1987car from above, we know that the fuel economy will rise from 28.4 mpg to29.161 mpg 2. Using this, the total energy consumed by the vehicle to travel120,000 miles is 543,196 MJ. Also known from above is that everythingbut the engine consumes 110,784.74 MJ of energy during the 120,000 miletravel. Thus the energy consumed by the 1999 engine is simply the differencebetween these two numbers which is 442,412 MJ.
New Engine, Option 3 - Option 3 considers the energy consumed bya new engine of 1999 when installed in a new car of 1999. We know againfrom [12] that the fuel economy of such a vehicle is 28.48 mpg. Thus thetotal energy to travel 120,000 miles for such a vehicle is 556,121 MJ. Alsowe know that the engine considered in this case is the same as the engineconsidered in Option 2. That is, both the engines have the same efficiency.So let us calculate the efficiency of the engine in Option 2.
Let η87 be the efficiency of the engine in 1987, which we know is 20%.Similarly let η99 be the efficiency of the engine of 1999, considered in Options1 and 2. Let ET,87in87 and ET,99in87 be the total energy consumed by thevehicles in Option 2 and 3 respectively. Since the energy consumed by therest of the vehicle is the same (everything but the engine),
η87 × ET,87in87 = η99 × ET,99in87 (1)
2Lutsey et al give the change from 1987 to 2004 to be 0.6 mpg, and we just assumethis change to be linear, so that the change from 1987 to 1999 is 0.6*12/17. Also Lutseyet al give this change for the entire drive train, and since the contribution factor for thetransmission is only 0.03, Figure [?], the change is assumed to be entirely for the engine
7

Using this the efficiency of the New Engine of 1999 was calculated to be20.395%. That is the newer engine is more efficient by 0.395%.
Using this and knowing that the total energy consumed by a new car of1999 is 556,121 MJ (calculated above), the energy consumed by the enginein Option 3 is 442,700 MJ, not very different from Option 3.
2.2.4 Transportation
Transportation has been estimated to be 3-5% of the Manufacturing andProcessing phases alone by ([2]). By including the use phase (which hasbeen show above to be severely dominating), the impact of transportationwould certainly be negligible. As a result transportation energy was notincluded in the analysis.
2.3 Life Cycle Assessment
Combining all calculations and data above for a new and remanufacturedgasoline engines for a passenger car, the life cycle assessment can be chartedout in figure 6.
Figure 6: Life Cycle Assessment of a New (1999) and Remanufactured (1987)Gasoline Engine.
The first point to grasp is the predominance of the use phase over thelife cycle of the products. The use phase of an engine consumes over 99%of the life cycle of the remanufactured engine and over 97% for the newengine, for both options (2 and 3). It can also be seen that the new engineprovides marginal savings in the use phase but at the same time consumesmore energy in both the raw materials and production phase. The similaruse phase of the new and remanufactured engines could be because theCAFE standards did not change significantly between 1987 and 1999. Thisis further diagnosed later. It is also worth noting that the above LCA
8

is based on a process-based model. A hybrid-model (using both process-based and economic input-output models) which includes the building, office,electricity, retail, motor, wholesale, truck transport, and rail transport etc.will estimate a much higher energy requirement to manufacture gasolineengines. For instance, authors of [14] estimate it to be close to 33,862 MJ,which is considerably higher than the process-based-model-estimate used inthis study. Similar statistics for the remanufactured engines is 17,102 MJ,which again is considerably higher than the process-based-model-estimateused in this study.
2.4 Remanufacturing Energy Saving Potential
Remanufacturing energy saving potential refers to the relative savings ob-tained by choosing to remanufacture over new. Remanufacturing is feasibleonly if the energy consumed during its life is less than that for a new en-gine. A remanufactured engine consumes lesser energy than a new engineduring the (re)manufacturing stage, but due to technological innovations,a new engine may consume lesser energy in the use phase than a previous-technology-based remanufactured one. Thus there is a trade-off which needsto be analyzed. The break even point is when the savings of a remanufac-tured engine, during the remanufacturing stage relative to the sum of themanufacturing and raw material stages of a new engine, are exactly lost inthe extra energy used in the use phase of a remanufactured engine becauseof being of a relatively out-dated technology.
However, realistically, remaufacturability of an engine or for that matterany product can be deterred by two major factors:
(a) Obsolescence - which is the inferiority of the performance metric ofa remanufactured product relative to the current new one. Technologicalchanges cause new products to offer more, may it be in terms of energyefficiency or capacity (volume, speed etc).
(b) Degree of Degradation - The goal of remanufacturing is to revive thediscarded product to a like-new condition. However, since the componentshave already lived one entire life before being remanufactured, their perfor-mance could be little inferior to what it was when it was manufactured forthe first time. Note, this degradation is expected to be little, since beforebeing sold, remanufactured products are expected to have passed all thetests that a new products undertakes.
Let us first deal with obsolescence assuming the there is no performancedegradation in the remanufactured engine, in other words, an engine origi-nally manufactured in 1987, and the same engine after being remanufacturedand used again starting 1999, have the same fuel economy (remanufacturingresumes the engine to like-new condition).
Once the engine is remanufactured and resold, it competes with new en-gines (in other words Option 2 vs 1 or Option 3 vs 1, as explained above),
9

which may or may not be performing better. One way to gauge the perfor-mance of an engine is to look at the average fuel economy of an on-road pas-senger car and of a new passenger car (domestic and international)[5, 6, 12],which has been graphed out below in Figure 7.
In 1975, after the 1973 oil embargo, the US government enforced the theCorporate Average Fuel Economy (CAFE) standards (came into effect in1979) under which all vehicles (new) with a gross weight less than 8,500 lbswere to provide a fuel economy above a certain minimum standard set forthat year. The impact for this is evident in the graphs. The second graphexhibits the reaction of this standard from new passenger car manufacturers.For remanufacturing energy saving potential, what is important is the annualchange in the performance metric (figure 8).
Since, the CAFE standards came into effect in 1979, the bar chart showsa evident spike in 1980, where the fuel economy of an average on-road vehicleincreased by ∼1.4 mpg. Though such changes do indicate the expectedimprovements in engine efficiency, but they are not a direct indicator sincethese improvements are the the comprehensive effects of improvements inengine efficiency, rolling resistance, transmission efficiency, aerodynamicsetc. As a result, repeating the calculation conducted above between a 1999new engine and a 1987 remanufactured engine, for a 1987 new engine anda 1975 remanufactured engine (note this period contains the enforcement ofthe CAFE standards) gives a better understanding for the remanufacturingenergy savings potential for the engine alone, and the trend exhibited. Theresults are shown in Figure 9.
Clearly, improvements in engine efficiency have helped reduce the usephase energy requirements by over 46% from 1975 to 1999, primarily becauseof the enforced CAFE standards (since there is a greater change between1975 and 1987 (compare first two columns) , when the CAFE standards wereenforced, than between 1987 and 1999 (compare the 3rd and 4th columns)).Also note the striking difference between the energy consumed by placinga 1987 Engine in a 1975 car and a 1987 engine in a 1987 car. Since theengines are primarily the same, this hints of the improvements in efficiencyof the other components of the car as well, between 1975 and 1987. Lutseyet al [13] support this result. Another interesting inference is that the 1999engine consumes lesser energy in the 1987 car than in the 1999 car. This isagain supported by [13] which shows how the increase in the size of the carhas a big role in explaining this.
Using these calculations and the data available for manufacturing andremanufacturing gasoline engines from Keoleian [2], the life cycle energycomparisons between new and remanufactured engines was made (Figure10).
Two years of comparison - 1987 and 1999 are shown.
1. 1987: The year of consideration is 1987
10

(a) On-Road Vehicles
(b) New Vehicles
Figure 7: Fuel Economy Trend for Passenger Cars[5].
11

Figure 8: Annual Fuel Economy change for on-road Passenger Cars[6].
Figure 9: Use phase energy consumption for engines of different generationto travel 120,000 miles.
12
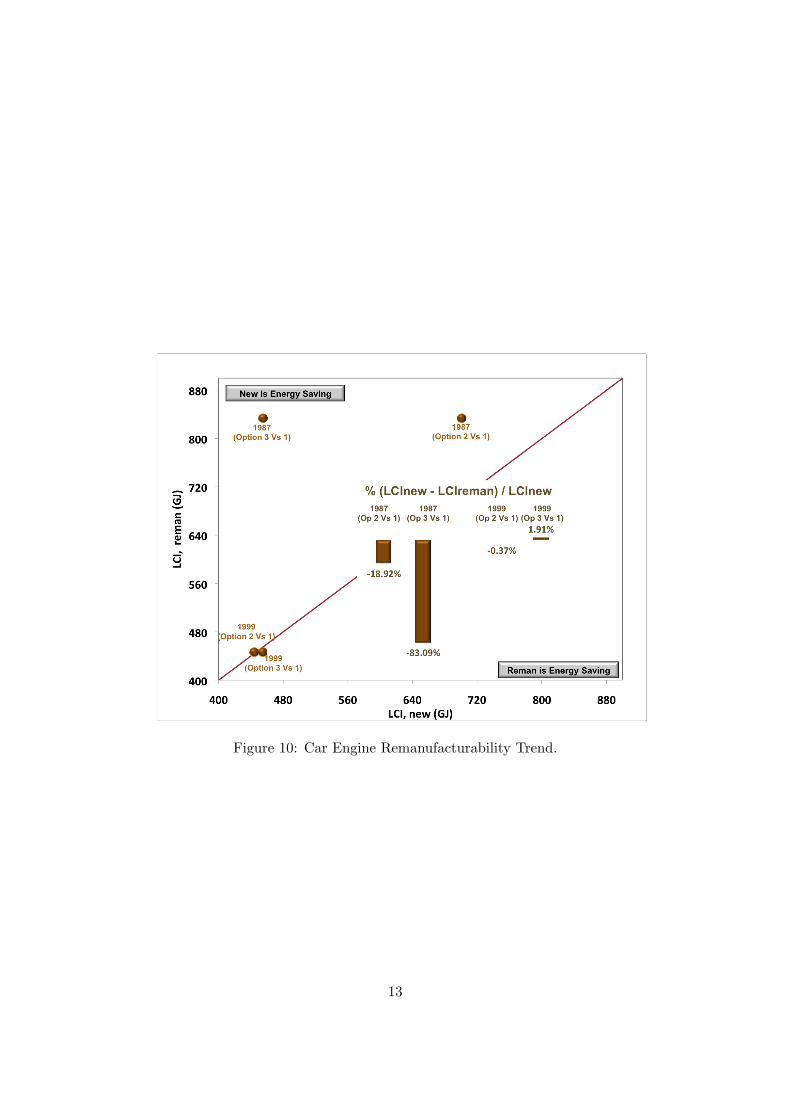
Figure 10: Car Engine Remanufacturability Trend.
13

• Option 1: A new engine of 1975 gets remanufactured and putback into the old car of 1975
• Option 2: A new engine of 1987 is placed into the old car of 1975
• Option 3: A new car (with a new engine) is bought in 1987 andused
2. 1999: The year of consideration is 1999
• Option 1: A new engine of 1987 gets remanufactured and putback into the old car of 1987
• Option 2: A new engine of 1999 is placed into the old car of 1987
• Option 3: A new car (with a new engine) is bought in 1999 andused
Since we are comparing a new engine with a remanufactured engine, foreach of the years of consideration we have two comparisons - Option 2 Vs 1and Option 3 Vs 1. The data point labeled 1999, compared a new (Option2 or 3) and remanufactured engine (Option 1) in 1999. The remanufacturedengine has lived through one life of 120,000 miles and date back to themanufacturing date of 1987. Similarly the data point of 1987 compares anew (Option 2 or 3) and remanufactured engine of 1987 (Option 1), wherethe remanufactured engine was originally manufactured in 1975. Again, wehave not yet considered any degradation for the remanufactured engine andassume it to be like it was when it was brand new.
The graphs shows that for the year of 1987 where the new engine per-formed much better than the remanufactured engine from before the CAFEstandards, there are life cycle energy savings by choosing the new engine.This means that the relative energy expenditure to manufacture the newengine is easily overcome by the use phase energy savings of the new engine,which is also evident in Figure 9. It is also clear that replacing the old engineof 1975 with a new car of 1987 (Option 3) gives much larger savings (over83%) than by only replacing the engine with a new engine of 1987 (Option2), which gives savings of close to 19%. This is because of the substantialimprovements in the efficiency of other components of the car as well apartfrom the engine. As a result there is lesser energy required by the othercomponents and thus lesser absolute losses by the engine.
For the year of 1999, the two engines (new and remanufactured) almostperform equivalently over the life cycle making the comparison nuanced withenergy savings of close to around 1%. This, as explained before, could bebecause the CAFE standards have not changes significantly between 1987and 1999. [13] have shown that though the efficiency of the vehicle hasimproved over these years as well, it has been diverted away from the fuel
14
economy and utilized to provide different functions to the passenger likeimproved air-conditioning, larger size etc.
The overall big conclusion from the analysis is that the savings in theproduction phase by remanufacturing gasoline engines for passenger cars canbe overwhelmed by the relative energy expenditure in the use phase (sincegasoline engines have a dominating use phase over their life cycles) becauseof technological obsolescence causing the new engines to be more efficient.This has been analyzed for remanufacturing without any degradation (thatis assuming like-new) and any degradation could further favor the use ofnew in such scenarios. Absence of efficiency improvements in the enginewill make the use phase between the new and remanufactured engine to beequivalent and thus the savings in the production phase can create a netsavings for the remanufactured engine over the life cycle.
2.5 Economics (Answer to Why Car Engines are Remanu-factured!)
Remanufacturability can be analyzed from either the environmental perspec-tive or from the point of view of economics. The most economical optionis not always the most environmental friendly. The economic feasibility ofremanufacturing is well know and it is common for remanufactured productsto sell at 40-60% of the price of a new product [15]. Hence we first lookedinto the environmental effects of remanufacturing passenger car gasoline en-gines, by comparing the energy consumed during the entire life cycle of anew and a remanufactured engine. We found that in earlier years of 1987,remanufacturing was not the energy saving option and choosing new leads togreater savings. For recent years like 1999, the analysis is nuanced. Whilethese estimations are assuming that the remanufactured engine performslike-new and has negligible performance degradation compared to how itwas when it was brand-new, adding any kind of degradation will only furtherpromote the use of new engines over remanufactured one from the energysavings perspective. However still, remanufacturing of automobile engines isa popular activity and a number of independent manufacturers and OEMspractice it. The reason for this can be understood by overlooking the envi-ronmental calculations above and concentrating on the economics alone. Asper the survey conducted by Keoleian et al [2], a new gasoline engine costs∼$5,700. On the other hand when buying a remanufactured engine, one caneither purchase it from the remanufacturer itself (∼$2,700) or from a dealer(∼$4,000) [2], who adds his commission within the total price. Thus themonetary savings for a customer can range from $1,700-$3,000. However,this initial monetary saving is expected to be lost (at least partially) by theextra gasoline consumed during the use phase of a remanufactured engine.
Until now we have assumed only obsolescence, but let us now also assumethat remanufacturing might fail to completely bring back the like-new con-
15

dition and that the quality of a remanufactured engine is slightly degraded,compared to what it was when it was first manufactured. Let us representthis degradation in terms of the percentage lower fuel economy offered bythe remanufactured engine. This analysis is exhibited in Figure 11.
ss
Figure 11: Economic Analysis of Passenger Car Engine Remanufacturing.
Two prices of gasoline have been considered - $2.5 per gallon and $4per gallon. The horizontal dashed lines are the savings in the two ways ofpurchasing a remanufactured engine - from a dealer or from the remanufac-turer itself. The total cost of extra gasoline consumed (over the use phase)increases linearly with the relative degradation of a remanufactured engine.It is inferred, that except for the case with a high price of gasoline and buy-ing the remanufactured engine from the dealer, the allowable degradationis more than 5%, which is quite unexpected with the critical testing andadvanced remanufacturing techniques used today. Thus remanufacturingappears to be profitable to the customer from the economics point of view,though it ends up being detrimental from an energy savings stand-point.
Another way to conduct economic analysis, is the way done in [2]. Thisanalysis is for the year of 1995, where the consumer has the choice to eitherbuy a new engine of 1995 or a remanufactured engine, originally manufac-tured in 1983. The price of the new engine like above was $5,700, while forthe remanufactured engine was $3,350 (average price between purchasingthrough a dealer or from a remanufacturer). The price of gasoline for thesubsequent 12 years was taken from [16]. Using these, the real life cycle en-ergy cost of a new engine is $13,178, while for the remanufactured is $11,100,calculated in 2000 dollars. Thus in terms of 2000 real dollars, purchasinga remanufactured gasoline engine in stead of a new engine in 1995, lead toa savings of approx. 16%. Thus again, economically, remanufacturing agasoline engine is favorable.
16

3 Diesel Engines for heavy duty combination trucks
3.1 Introduction
The engine chosen is from the report by Sutherland et al [17], which isa six-cylinder, 15L diesel engine with the application of heavy-duty semitractor-trailers (class 8 combination trucks). The consumer choice in thiscase is same as that shown in Figure 2 for gasoline engines. Once again letus use the labels of ”Remanufactured Engines” and ”New Engines.”
3.1.1 Raw Material Production and Manufacturing
New Engine - The bill of materials for a conventional engine for a heavyduty truck was used along with specific energies from [11] to estimate theenergy for materials production for a heavy duty engine to be 54,818 MJ. Theenergy for the manufacturing phase was obtained from the Keoleian report[2] and scaled up using the energy of the raw material processing. Thoughthe manufacturing energy could also be scaled up by weight, the compositionof the gasoline and diesel engines was found to be slightly different - Thegasoline engine has 45% Iron, 33% Steel and 20% Aluminum, while the dieselengine comprises of 62% Iron, 31% Steel and 4% Aluminum. Thus scalingby energy in the raw materials ((Energy to Manufacture Gasoline Engine)* (Energy in the Raw Materials for the Diesel Engines) / (Energy in theRaw Materials for the Gasoline Engine)) seems more appropriate. Doingthis gives the energy to manufacture the Diesel engine to be 31,855 MJ.Thus the total energy embodied in the Diesel Engine, which includes rawmaterials and manufacturing is 86,673 MJ.
Remanufactured Engine - The value of the embodied energy aftermanufacturing, has been used from the report by Sutherland et al [17].Their calculations reveal a savings of 16.25 GJ relative to a new enginejust prior to sale (embodied energy of a remanufactured engine is 1.85 GJ).This estimate is again for the main components of the engine (engine block,cylinder head, connecting rods, pistons and crank shaft), and not for thecomplete engine. By using it, the analysis becomes slightly in favor of di-recting remanufacturing to be more energy saving that using new.
3.1.2 Use Phase
New Engine - The estimated life time was referred from [18] and takento be 750,000 miles. The average mileage was taken to be 60,000 miles [8].Thus the average life-time of a truck was also estimated to be ∼12 years.Thus the years of consideration were again 1999, 1987 and 1975. [8] givesthe average fuel economy for combination trucks of these years to be 5.1,5.7 and 5.4 mpg respectively. Clearly the changes in fuel economy have
17

not been that substantial. To calculate the use phase energy, the energyintensity values (MJ/vehicle mile) for combination trucks was used [8]. Theyear 1999 was again chosen for the production of a new engine. This dataenables the calculation of energy consumed during the life of a combinationtruck. To calculate the fraction of this energy used by the engine [7] wasreferred. The distribution of fuel energy use by different parts of the vehicleis shown in Figure 12.
Figure 12: Fuel Energy Distribution in a Combination Truck[7].
Hence, ∼62% of the fuel energy is consumed by the engine (contributionfactor for the engine in heavy duty trucks is 62%). In the case of Heavy-DutyTrucks (combination trucks as considered in this study), the fuel economyhas not exhibited any considerable change and after discussing with the Fed-eral Highway Administration it was learnt that most of the fluctuation canbe attributed to the data gathering methodology [19]. This could primarilybe because there was no major regulation imposed for heavy duty truckslike the CAFE standards for passenger cars. As a result the contributionfactor for engines in trucks has been assumed to be constant for the years ofconsideration. In the case of passenger cars, the sharp improvements in thefuel economy were intentional and thus researchers like Lutsey et al [13] haddiagnosed the factors that had helped improve the fuel economy. In the caseof combination trucks on the other hand there is no data that explains whatfraction of the fluctuations in the fuel economy can be attributed to changesin engine efficiency, if any. As a result, unlike the case of passenger carsthere is not enough to estimate the fuel economy for truck having an enginefrom another year. Hence, Option 2 could not be evaluated for trucks. Thismeans that we will consider only two options for the consumer:
• a remanufactured engine installed back into the old truck that has
18

already been driven for 750,000 miles.
• a new engine in a new truck
Thus the use phase energy for the new engine of 1999 is simply 62%of the total energy consumed by the old truck during the 750,000 miles ofdriving. Using this and the above values (MJ/ vehicle mile values from [8]),the use phase energy of a diesel engine of a combination truck is estimatedto be ∼ 12.612 TJ.
Remanufactured Engine - In the year of 1999, the remanufacturedengine, which would be one lifetime old would be from 1987. Since thecontribution factor is assumed to remain the same, the same calculation canbe done for the remanufactured engine (which is like-new) as well to estimatethe use phase energy of a remanufactured diesel engine of a combinationtruck to be 11.97 MJ.
3.1.3 Transportation
Like in the case of gasoline engines, transportation energy is expected tobe negligible since its percentage contribution is expected to be similar fordiesel engines as it is for gasoline engine. Thus the transportation phaseenergy is neglected from the analysis.
3.2 Life Cycle Analysis
Combining all calculations and data above for a new diesel engine for acombination truck, the life cycle assessment can be charted out as shown inFigure 13.
Clearly the use phase energy consumption dominates tremendously overthe prior stages, making the bar for ”raw materials + manufacturing” hardlyvisible. Also it is interesting to note how a small difference of 0.3 mpgbetween the two generations creates an enormous difference in the use phase.
3.3 Remanufacturing Energy Saving Potential
To assess the remanufacturability of truck engines, like in the passenger carcase, fuel consumption trends were derived [8]. The CAFE standards wereonly imposed for light-duty vehicles with gross weight of ≤ 8,500 lbs. Thispartially explains why the fuel economy of trucks has remains more or lessconstant over the years. Another reason for this could be the monotonousincrease in the payload of trucks (not applicable to passenger cars) negatingthe increase of engine capability to provide a better fuel economy. To checkfor this the historical trend of the national average payload (in tons) of a class8 combination truck obtained from the Federal Highway Administration [20]
19

Figure 13: Life Cycle Assessment of a New (from 1999) and Remanufactured(from 1987) Diesel Combination-Truck Engine.
has been plotted below. Figure 14 shows this along with the fuel economytrend for combination trucks.
ss
Figure 14: Average Fuel Economy and Payload for a Combination-Truck[8].
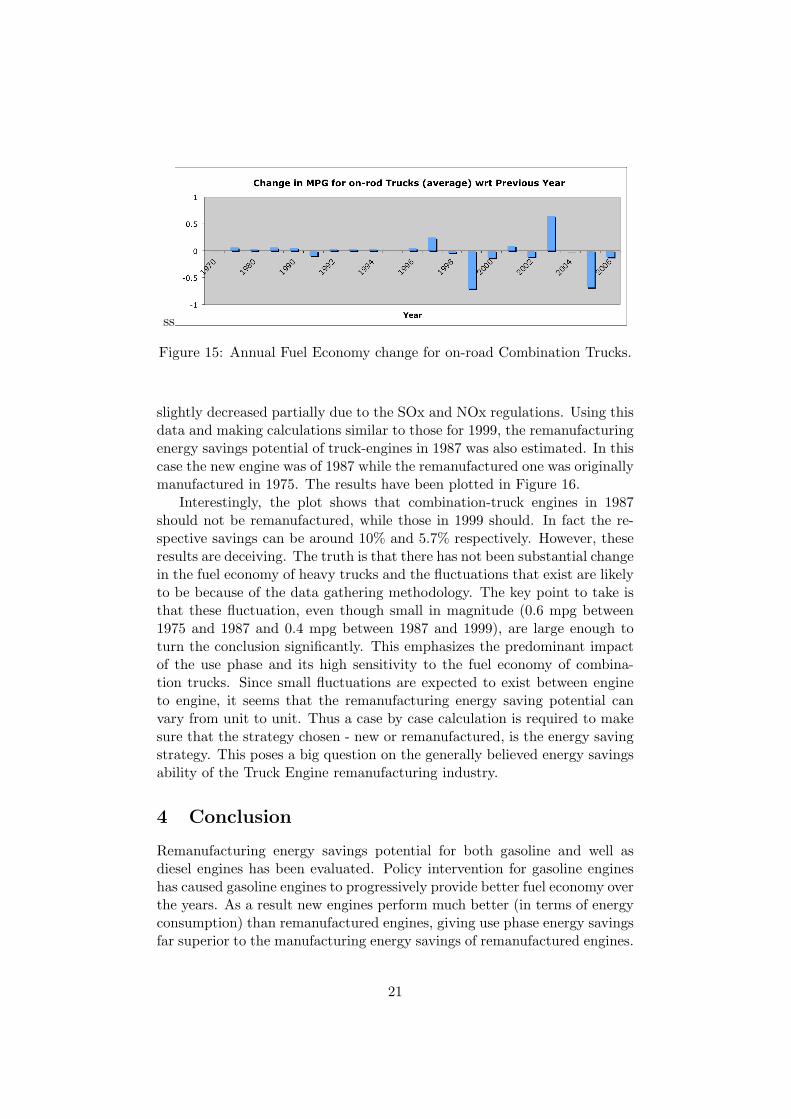
Both the payload and average fuel economy for combination trucks haveroughly been the same over the past. The slight fluctuations in both areattributed to the way data is recorded and procured by the Departmentof Transportation [19]. Figure 15 better exhibits the changes in fuel econ-omy over the years. The average absolute change is for the years underconsideration is only 0.18 mpg.
Using Figure 15 and 14, it is accepted that the performance in termsof fuel economy for combination truck engines has remained more or lessthe same over the past years. If anything, fuel economy of engines has
20
ss
Figure 15: Annual Fuel Economy change for on-road Combination Trucks.
slightly decreased partially due to the SOx and NOx regulations. Using thisdata and making calculations similar to those for 1999, the remanufacturingenergy savings potential of truck-engines in 1987 was also estimated. In thiscase the new engine was of 1987 while the remanufactured one was originallymanufactured in 1975. The results have been plotted in Figure 16.
Interestingly, the plot shows that combination-truck engines in 1987should not be remanufactured, while those in 1999 should. In fact the re-spective savings can be around 10% and 5.7% respectively. However, theseresults are deceiving. The truth is that there has not been substantial changein the fuel economy of heavy trucks and the fluctuations that exist are likelyto be because of the data gathering methodology. The key point to take isthat these fluctuation, even though small in magnitude (0.6 mpg between1975 and 1987 and 0.4 mpg between 1987 and 1999), are large enough toturn the conclusion significantly. This emphasizes the predominant impactof the use phase and its high sensitivity to the fuel economy of combina-tion trucks. Since small fluctuations are expected to exist between engineto engine, it seems that the remanufacturing energy saving potential canvary from unit to unit. Thus a case by case calculation is required to makesure that the strategy chosen - new or remanufactured, is the energy savingstrategy. This poses a big question on the generally believed energy savingsability of the Truck Engine remanufacturing industry.
4 Conclusion
Remanufacturing energy savings potential for both gasoline and well asdiesel engines has been evaluated. Policy intervention for gasoline engineshas caused gasoline engines to progressively provide better fuel economy overthe years. As a result new engines perform much better (in terms of energyconsumption) than remanufactured engines, giving use phase energy savingsfar superior to the manufacturing energy savings of remanufactured engines.
21
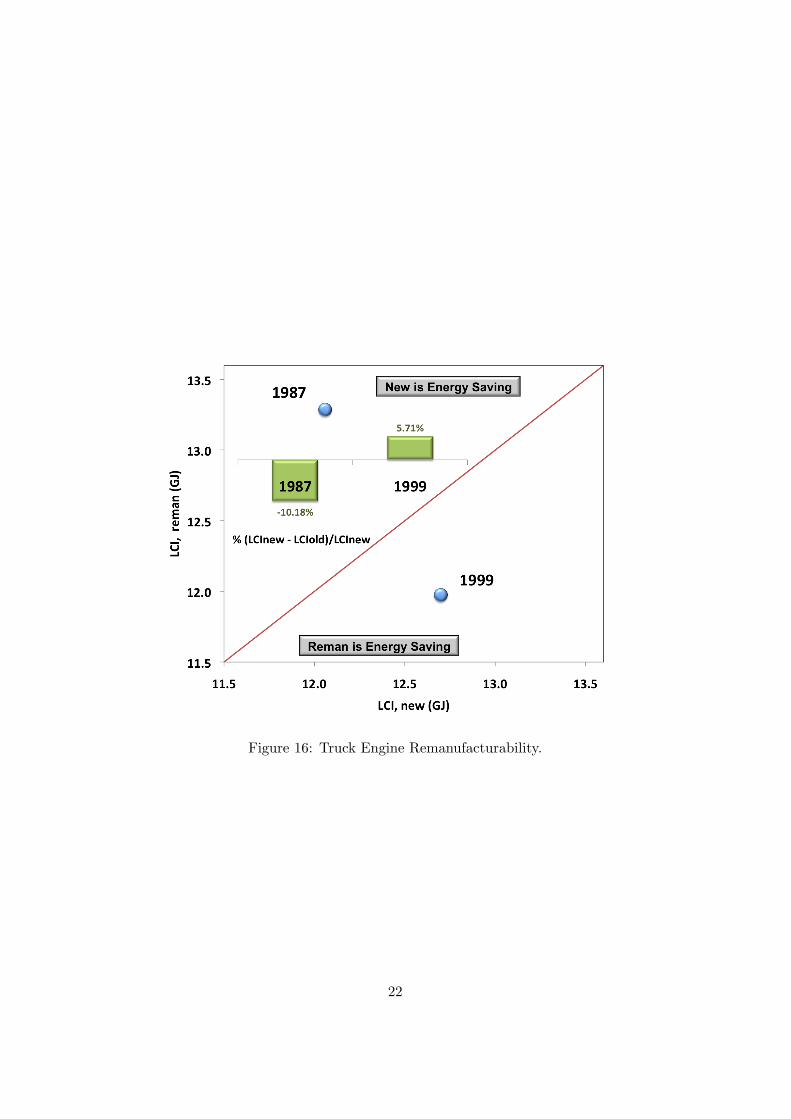
Figure 16: Truck Engine Remanufacturability.
22

Hence, choosing new engines was concluded to be the energy savings strat-egy for the years around 1987 when the CAFE standard were progressivelybecoming stricter. Over the past decade or more, the CAFE standards havenot changed and thus there has not been as significant an improvement inengine technologies as in the 80s. Thus for the years around 1999, it wasestimated that the total life cycle energy consumption for the new and re-manufactured engine was roughly similar. If new CAFE standards are to beenforced in the near future, the scenario will again be like the 80s, and useof the newer, more efficient engine is likely to be the energy saving strategy.
On the other hand diesel engines for combination trucks have not hadany standards imposed as a result of which the fuel economy for them hasroughly remained the same, historically. Thus the initial savings duringthe manufacturing phase for a remanufactured engine relative to new, areexpected to be the net energy savings over the life cycle. Thus remanu-facturing for diesel engines for combination trucks seems to be the viableenergy savings strategy. The fuel economy data used from the Departmentof Transportation, by itself has some inherent fluctuations which have beenobserved to impact the conclusions significantly. Overall, it was concludedthat even minor fluctuations (less than 1 mpg) in fuel economy are significantenough to reverse conclusions. This is because of the dominance of the usephase over the life cycle of the product. The use phase for the diesel engineconsumes close to 99.4% of the total life cycle energy. Such small variationis expected to exist from driver to driver, and from one driving condition toanother, and especially from one engine unit to the other. Thus accurateestimation of fuel economy is essential, on a case by case analysis, so as toestimate the remanufacturing energy savings potential for diesel heavy dutyengines.
5 Assumptions
In the above analysis a number of assumptions were made, primarily due todata unavailability. They are listed below:
• In reality, many reclaimed engines have lived a shorter life (e.g. fromabandoned cars or from car crashes where the engine survives) or evenlonger (some from the 1950s, as informed by local engine remanu-facturers), and since it is hard to know the average age of cores, aremanufactured core is assumed to be 1 lifetime old, on an average.
• Energy to manufacture and remanufacture engines for the variousyears considered could not be found, and thus the same manufacturingand remanufacturing energy was used for all the years. Hence, man-ufacturing and remanufacturing energies for the two types of enginesobtained from [2] and [17] were used for all years under consideration.
23

At this point it should be understood that the manufacturing phasehas been shown to have a minimal impact on the total life cycle energyconsumption and thus the impact of this assumption is not expectedto be severe.
• The fuel economy of a vehicle for its entire life time has been taken tobe the average off all new vehicles of its class (passenger car/class 8truck) and model year.
• It was assumed that the average fuel economy of a car does not dete-riorate with use, and during the entire life the average fuel economyof an engine is what it was to start with.
• The two primary reports for this study, [2, 17], base their analysis andconclusions on a single engine each and not an average of multipleengines, as ideally desired. This report does the same, again due tolack of average data availability.
• The percentage contribution of the engine to the total fuel consumedby a vehicle is assumed to be constant for all years under considerationfor the truck. This assumption has been justified in the text.
• For the case of Gasoline Engines, Lutsey et al give the change from1987 to 2004 to be 0.6 mpg, and we just assume this change to be linear,so that the change from 1987 to 1999 is 0.6*12/17. Also Lutsey et algive this change for the entire drive train, and since the contributionfactor for the transmission is only 0.03, Figure 4, the change is assumedto be entirely for the engine.
• An engine dissipates a fraction of its energy as heat, when it consumesfuel. This fraction is taken to be constant in the above study. However,[21] have indicated that this fraction could vary from 10 - 40 % de-pending on the engine torque, RPM (revolutions per minute) etc. Theestimations used above (38% for gasoline engines and 42% for dieselengines) are close to the upper limit indicated by them. This meansthat the use phase energies estimated above are on the conservativeside and that the impact of use phase can be even more pronounced.
• Transportation has been estimated to be 3-5% of the Manufacturingand Processing phases alone by ([2]). By including the use phase(which has been show above to be severely dominating), the impact oftransportation would certainly be negligible. As a result transporta-tion energy was not included in the analysis.
24

References
[1] Stacy C. Davis, Susan W. Diegel, and Robert G. Boundy. Transporta-tion energy databook edition 28. Prepared by the Oak Ridge NationalLaboratory for the US Department of Energy, 2009.
[2] Vanessa M. Smith and Gregory A. Keoleian. The value of remanu-factured engines: life-cycle environmental and economic perspectives.Journal of Industrial Ecology, 8(1-2):193–221, 2004.
[3] Cutler J. Cleveland (Editor in Chief). Vehicles and their power plants:energy use and efficieny. Encyclopedia of Energy, 2004.
[4] Marc Ross. Fuel efficiency and the physics of automobiles. Contempo-rary Physics, 38(6):381–394, 1997.
[5] US Energy Information Administration. April 2009 monthly energyreview. 2009.
[6] Automotive Fuel Economy Program. Annual update fy 2003. 2003.
[7] Energy Efficiency US Department of Energy and Renewable Energy.Roadmap and technical white papers: 21st century truck partnership.
[8] Bureau of Transportation Statistics. Internet Source: http ://www.bts.gov/publications/nationaltransportationstatistics/html/table0414.html.Table 4-14: Combination truck fuel consumption and travel. NationalTransportation Statistics 2009.
[9] Stacy C. Davis, Susan W. Diegel, and Robert G. Boundy. Transporta-tion energy databook edition 28. Prepared by the Oak Ridge NationalLaboratory for the US Department of Energy, 2008.
[10] National Transportation Statistics 2008 Bureau of Transporta-tion Statistics. Table 1-17: New and used passenger car sales andleases. 2008.
[11] Vaclav Smil. Energy in Nature and Society. MIT Press, 2008.
[12] US Department of Energy. Table 7. transportation sector key indicatorand delivered energy consumption, annual energy outlook 2009. 2009.
[13] Nicholas Lutsey and Daniel Sperling. Energy efficiency, fuel economyand policy implications. Transportation Research Record: Journal ofTransportation Research Board, (1941):8–17, 2005.
[14] E.R. Venta and A. M. Wolsky. Energy and labor cost of gasoline engineremnanufacturing. Department of Energy, ENergy and EnvironmentalSystems Division, 1978.
25
[15] William Hauser and Robert T. Lund. The remanufacturing industry:Anatomy of a giant. 2003.
[16] U.S. Department of Energy. Internet Source: http ://www.eia.doe.gov/emeu/aer/txt/ptb0524.html Annual En-ergy Review 2008. Table5.24retailmotorgasolineandon-highwaydieselfuelprices,1949-2008. 2009.
[17] John W. Sutherland, Daniel P. Adler, and Vishesh Kumar Karl R. Haa-pala. A comparison of manufacturing and remanufacturing energy in-tensities with application to diesel engine production. CIRP Annals -Manufacturing Technology, 57(5-8), 2008.
[18] Linda Gaines, Frank Stodolsky, Roy Cuenca, and James Eberhardt. Lifecycle analysis of heavy vehicles. Air & Waste Managent AssociationAnnual Meeting, 1998.
[19] Department of Transportation. Personal conversation with the us fed-eral highway administration, office of policy information.
[20] US Department of Transportation. Vehicle travel information system(vtris) - by the federal highway administration (fhwa). Internet Source:https://apps.fhwa.dot.gov/VTRIS/.
[21] Jerome Barrand and Jason Bokar. Reducing tire rollingresistance to save fuel and lower emissions. SAE WorldCongress and Exhibition, April 2008. Internet Source: http ://www.sae.org/technical/papers/2008− 01− 0154, 2008.
26
Related Documents