International Journal of Prognostics and Health Management, ISSN 2153-2648, 2011 010 Engine Oil Condition Monitoring Using High Temperature Integrated Ultrasonic Transducers Kuo-Ting Wu 1 , Makiko Kobayashi 1 , Zhigang Sun 1 *, Cheng-Kuei Jen 1 , Pierre Sammut 1 , Jeff Bird 2 , Brian Galeote 2 and Nezih Mrad 3 1 Industrial Materials Institute, National Research Council Canada, Boucherville, Quebec, Canada J4B 6Y4 *[email protected] 2 Institute for Aerospace Research, National Research Council Canada, Ottawa, Ontario, Canada K1A 0R6 3 Department of National Defence, Air Vehicles Research Section, Ottawa, Ontario, Canada K1A 0K ABSTRACT The present work contains two parts. In the first part, high temperature integrated ultrasonic transducers (IUTs) made of thick piezoelectric composite films, were coated directly onto lubricant oil supply and sump lines of a modified CF700 turbojet engine. These piezoelectric films were fabricated using a sol-gel spray technology. By operating these IUTs in transmission mode, the amplitude and velocity of transmitted ultrasonic waves across the flow channel of the lubricant oil in supply and sump lines were measured during engine operation. Results have shown that the amplitude of the ultrasonic waves is sensitive to the presence of air bubbles in the oil and that the ultrasound velocity is linearly dependent on oil temperature. In the second part of the work, the sensitivity of ultrasound to engine lubricant oil degradation was investigated by using an ultrasonically equipped and thermally-controlled laboratory test cell and lubricant oils of different grades. The results have shown that at a given temperature, ultrasound velocity decreases with a decrease in oil viscosity. Based on the results obtained in both parts of the study, ultrasound velocity measurement is proposed for monitoring oil degradation and transient oil temperature variation, whereas ultrasound amplitude measurement is proposed for monitoring air bubble content. 1. INTRODUCTION Engine oil condition includes oil viscosity, oil cleanliness, air bubble content, and oil temperature. Being able to monitor these parameters will not only safeguard engine operation under an oil condition it was designed for, but will also provide a means to assess the health of the entire engine system since any deviation from the nominal state of these parameters could be linked to one or more faulty components. Among oil condition monitoring systems presently used in aircraft engines, inductive oil debris monitor sensor offered by GasTOPS can be fitted to oil lube line and is capable of counting and sizing ferrous and non- ferrous particles above minimum size; Quantitative Debris Monitor (QDM®) technology offered by Eaton Aerospace captures ferrous wear debris and counts ferromagnetic particles exceeding a pre-set mass threshold; Zapper® pulsed electric chip detector system, also offered by Eaton Aerospace, captures ferrous debris and issues a warning signal to prompt for an action when debris buildup bridges the gap between two electrodes. Ultrasound, when applied judiciously and under favorable conditions, has the capability to sense all the aforementioned oil condition parameters. Although methods employing piezoelectric ultrasonic transducers (UTs) have been widely used for real- time, in-situ or off-line non-destructive evaluation (NDE) of large metallic structures including airplanes, automobiles, ships, pressure vessels, pipelines, etc., owing to their subsurface inspection capability, fast inspection speed, simplicity and cost-effectiveness (Gandhi et al., 1992; Ihn et al., 2004; Birks et al., 1991), applications of piezoelectric UTs to engine condition monitoring are relatively few due to difficulties in implementing UTs at elevated engine operating temperatures. In the present work, integrated UT (IUT) and associated wiring assembly designed for engine condition monitoring were fabricated directly onto the lubricant oil supply and sump lines of a modified CF700 turbojet engine. The applicability of the IUT assemblies to real-time engine condition monitoring was then investigated. The engine conditions of interest were air bubble content in the oil supply line, oil viscosity degradation and temperature. In order to assess the capability of ultrasound for oil viscosity degradation monitoring, four lubricant oils were tested in a temperature range of 50 °C to 130 °C by using an ultrasonically equipped test cell. In the present paper, actual engine and laboratory tests setups and results are presented. Based on the results, ultrasonic approaches for real-time monitoring of air bubble content in oil, oil viscosity degradation, and oil temperature Wu et al. This is an open-access article distributed under the terms of the Creative Commons Attribution 3.0 United States License, which permits unrestricted use, distribution, and reproduction in any medium, provided the original author and source are credited.

Welcome message from author
This document is posted to help you gain knowledge. Please leave a comment to let me know what you think about it! Share it to your friends and learn new things together.
Transcript
International Journal of Prognostics and Health Management, ISSN 2153-2648, 2011 010
Engine Oil Condition Monitoring Using High Temperature Integrated
Ultrasonic Transducers
Kuo-Ting Wu1, Makiko Kobayashi
1, Zhigang Sun
1*, Cheng-Kuei Jen
1, Pierre Sammut
1,
Jeff Bird2, Brian Galeote
2 and Nezih Mrad
3
1Industrial Materials Institute, National Research Council Canada, Boucherville, Quebec, Canada J4B 6Y4
2 Institute for Aerospace Research, National Research Council Canada, Ottawa, Ontario, Canada K1A 0R6
3 Department of National Defence, Air Vehicles Research Section, Ottawa, Ontario, Canada K1A 0K
ABSTRACT
The present work contains two parts. In the first part, high
temperature integrated ultrasonic transducers (IUTs) made
of thick piezoelectric composite films, were coated directly
onto lubricant oil supply and sump lines of a modified
CF700 turbojet engine. These piezoelectric films were
fabricated using a sol-gel spray technology. By operating
these IUTs in transmission mode, the amplitude and
velocity of transmitted ultrasonic waves across the flow
channel of the lubricant oil in supply and sump lines were
measured during engine operation. Results have shown that
the amplitude of the ultrasonic waves is sensitive to the
presence of air bubbles in the oil and that the ultrasound
velocity is linearly dependent on oil temperature. In the
second part of the work, the sensitivity of ultrasound to
engine lubricant oil degradation was investigated by using
an ultrasonically equipped and thermally-controlled
laboratory test cell and lubricant oils of different grades.
The results have shown that at a given temperature,
ultrasound velocity decreases with a decrease in oil
viscosity. Based on the results obtained in both parts of the
study, ultrasound velocity measurement is proposed for
monitoring oil degradation and transient oil temperature
variation, whereas ultrasound amplitude measurement is
proposed for monitoring air bubble content.
1. INTRODUCTION
Engine oil condition includes oil viscosity, oil cleanliness,
air bubble content, and oil temperature. Being able to
monitor these parameters will not only safeguard engine
operation under an oil condition it was designed for, but will
also provide a means to assess the health of the entire engine
system since any deviation from the nominal state of these
parameters could be linked to one or more faulty
components. Among oil condition monitoring systems
presently used in aircraft engines, inductive oil debris
monitor sensor offered by GasTOPS can be fitted to oil lube
line and is capable of counting and sizing ferrous and non-
ferrous particles above minimum size; Quantitative Debris
Monitor (QDM®) technology offered by Eaton Aerospace
captures ferrous wear debris and counts ferromagnetic
particles exceeding a pre-set mass threshold; Zapper®
pulsed electric chip detector system, also offered by Eaton
Aerospace, captures ferrous debris and issues a warning
signal to prompt for an action when debris buildup bridges
the gap between two electrodes. Ultrasound, when applied
judiciously and under favorable conditions, has the
capability to sense all the aforementioned oil condition
parameters. Although methods employing piezoelectric
ultrasonic transducers (UTs) have been widely used for real-
time, in-situ or off-line non-destructive evaluation (NDE) of
large metallic structures including airplanes, automobiles,
ships, pressure vessels, pipelines, etc., owing to their
subsurface inspection capability, fast inspection speed,
simplicity and cost-effectiveness (Gandhi et al., 1992; Ihn et
al., 2004; Birks et al., 1991), applications of piezoelectric
UTs to engine condition monitoring are relatively few due
to difficulties in implementing UTs at elevated engine
operating temperatures. In the present work, integrated UT
(IUT) and associated wiring assembly designed for engine
condition monitoring were fabricated directly onto the
lubricant oil supply and sump lines of a modified CF700
turbojet engine. The applicability of the IUT assemblies to
real-time engine condition monitoring was then
investigated. The engine conditions of interest were air
bubble content in the oil supply line, oil viscosity
degradation and temperature. In order to assess the
capability of ultrasound for oil viscosity degradation
monitoring, four lubricant oils were tested in a temperature
range of 50 °C to 130 °C by using an ultrasonically
equipped test cell.
In the present paper, actual engine and laboratory tests
setups and results are presented. Based on the results,
ultrasonic approaches for real-time monitoring of air bubble
content in oil, oil viscosity degradation, and oil temperature Wu et al. This is an open-access article distributed under the terms of the
Creative Commons Attribution 3.0 United States License, which permits unrestricted use, distribution, and reproduction in any medium, provided
the original author and source are credited.
INTERNATIONAL JOURNAL OF PROGNOSTICS AND HEALTH MANAGEMENT
2
are proposed. Some implementation details and advantages
associated with the proposed approaches are discussed.
2. ENGINE OIL CONDITION MONITORING
EXPERIMENT
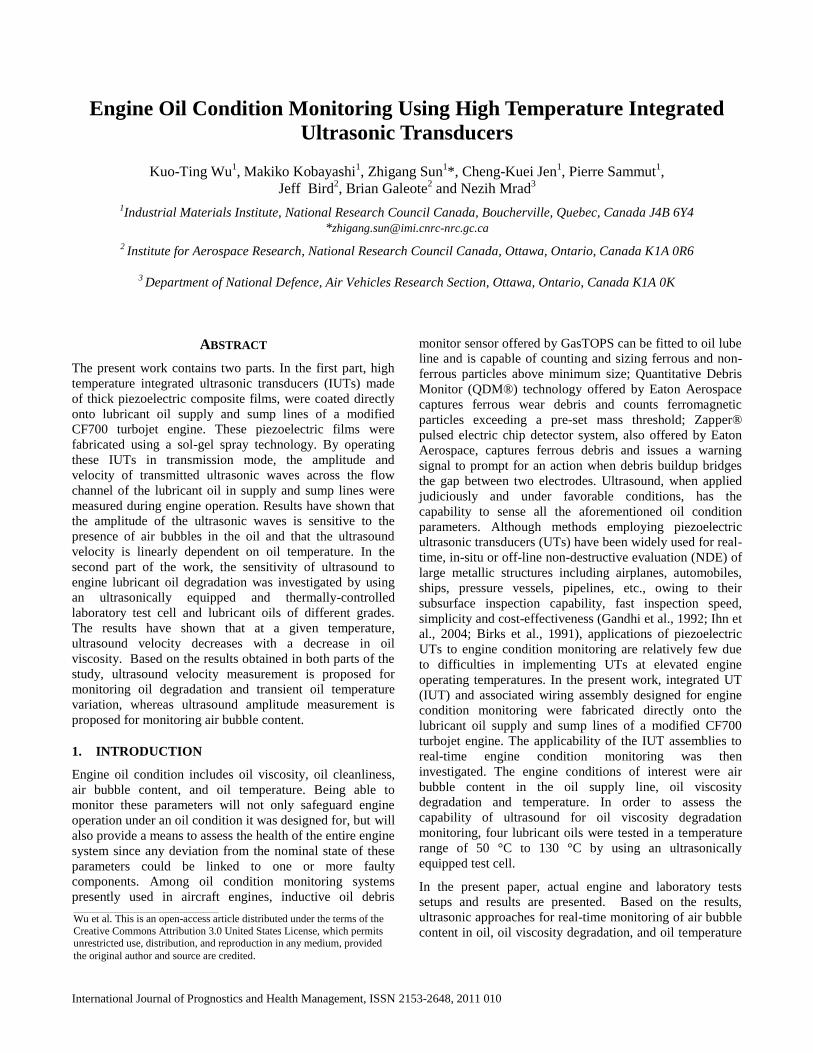
A modified CF700 turbojet engine (with fan module
removed), shown in Figure 1, was used as representative of
typical vibration, temperature and oil environments, as well
as component materials and surface finishes. This engine
platform offered the opportunity to assess oil flow in typical
fully developed supply line flows and substantially aerated
sump return line flows.
Figure 1. A modified CF700 turbojet engine.
The fabrication of IUTs involves a sol-gel based sensor
fabrication process (Kobayashi et al., 2004, 2009) consisting
of six main steps: (1) preparation of high dielectric constant
lead-zirconate-titanate (PZT) solution, (2) ball milling of
piezoelectric bismuth titanate (BIT) or PZT powders to
submicron size, (3) sensor spraying using slurries from steps
(1) and (2) to form a thin UT film, (4) heat treating to
produce a thin solid BIT composite (BIT-c) or PZT
composite (PZT-c) film, (5) Corona poling to obtain
piezoelectricity, and (6) electrode painting for electrical
connectivity. Steps (3) and (4) are repeated multiple times to
produce optimal film thickness for specified ultrasonic
operating frequency and performance. Silver or platinum
paste was used to fabricate top electrodes. BIT-c film is to
be used for higher temperature applications (e.g.
temperature endurance of 500 °C) (Kobayashi et al., 2004,
2009); whereas PZT-c film is to be used when higher
piezoelectricity than BIT-c film is required and when
temperature is lower than 200 °C. A series of aging and
thermal shock resistance tests have been conducted on
sprayed-on films. In one test, a PZT-c film was subjected to
375 thermal cycles between 22 °C and 150 °C. In one aging
test, a PZT-c film was heated in a furnace at 200 °C for over
300 days. In another aging test, a PZT-c film was excited
with a 125 Volt pulse at 1 kHz pulse repetition rate for 1500
hours. The films performed well in all the tests.
(a)
(b)
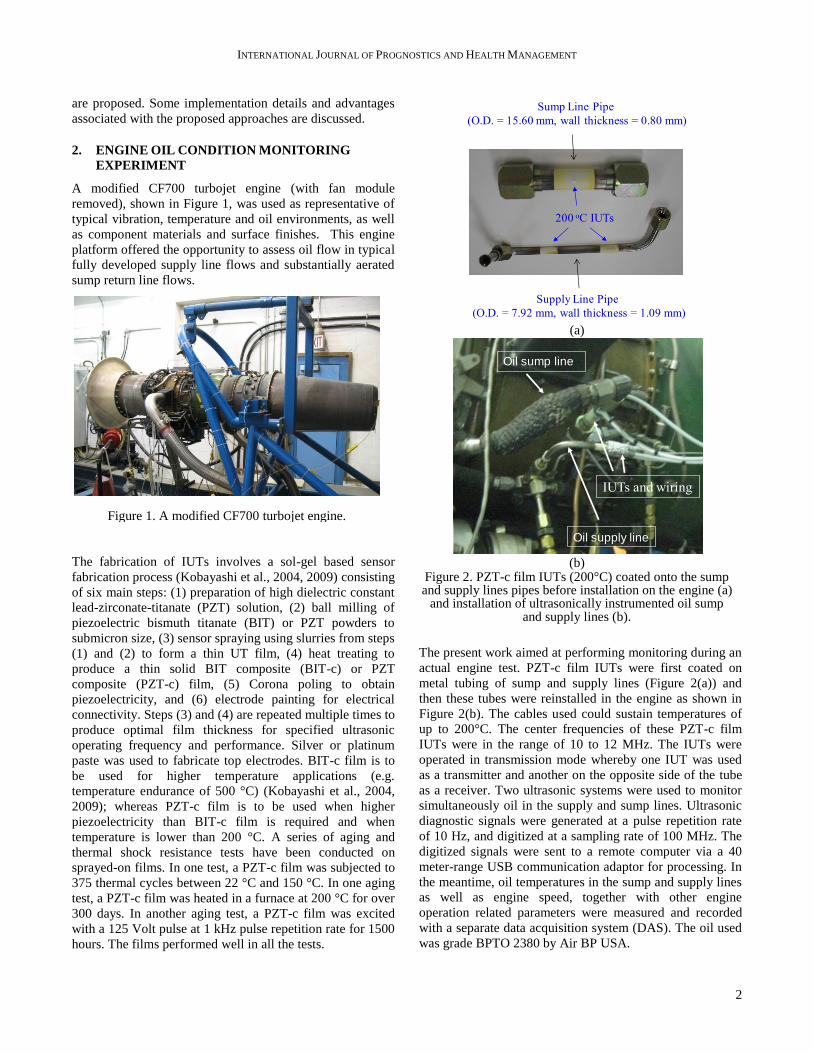
Figure 2. PZT-c film IUTs (200°C) coated onto the sump and supply lines pipes before installation on the engine (a)
and installation of ultrasonically instrumented oil sump and supply lines (b).
The present work aimed at performing monitoring during an
actual engine test. PZT-c film IUTs were first coated on
metal tubing of sump and supply lines (Figure 2(a)) and
then these tubes were reinstalled in the engine as shown in
Figure 2(b). The cables used could sustain temperatures of
up to 200°C. The center frequencies of these PZT-c film
IUTs were in the range of 10 to 12 MHz. The IUTs were
operated in transmission mode whereby one IUT was used
as a transmitter and another on the opposite side of the tube
as a receiver. Two ultrasonic systems were used to monitor
simultaneously oil in the supply and sump lines. Ultrasonic
diagnostic signals were generated at a pulse repetition rate
of 10 Hz, and digitized at a sampling rate of 100 MHz. The
digitized signals were sent to a remote computer via a 40
meter-range USB communication adaptor for processing. In
the meantime, oil temperatures in the sump and supply lines
as well as engine speed, together with other engine
operation related parameters were measured and recorded
with a separate data acquisition system (DAS). The oil used
was grade BPTO 2380 by Air BP USA.
Supply Line Pipe
(O.D. = 7.92 mm, wall thickness = 1.09 mm)
Sump Line Pipe
(O.D. = 15.60 mm, wall thickness = 0.80 mm)
200 oC IUTs
Oil sump line
Oil supply line
IUTs and wiring

INTERNATIONAL JOURNAL OF PROGNOSTICS AND HEALTH MANAGEMENT
3
Table 1 describes a test schedule developed as
representative of transient and steady state operations. Data
recording by DAS was controlled manually. Both steady
state (SS) and transient (TR) recordings of engine data were
conducted at every 50 milliseconds (20 Hz) when the engine
speed was changed, after stabilization of two minutes, and
after engine shutdown. The points and transitions selected
are representative of basic performance tests in a test cell.
The maximum speed is limited to 80% because of the
matching of the engine and test cell airflow capabilities.
Seq
uen
ce
Case Notes Status to
record
(SS:
steady
state
TR:
transient
state)
1 Start-
up
Take point before
startup and during
transient to idle SS, TR
2
Idle
5 min @ idle, 50%,
take points @ 2 min
and 5 min SS,SS
3 Slow
accel.
30 second acceleration
to 65%, hold for 2 min TR, SS
4 Slow
accel.
30 second acceleration
to 80% TR
5 Hold
@ 80% 5 min hold @ 80% SS
6 Slow
decel.
30 second deceleration
to 65%, hold, take
points @ 2 min TR, SS
7 Slow
decel.
30 second deceleration
to idle, hold, take points
@ 5 min TR, SS
8 Slow
accel.
30 second acceleration
to 65%, hold for 2 min TR, SS
9 Slow
accel.
30 second acceleration
to 80% TR
10 Hold
@ 80% 5 min hold @ 80% SS
11 Slow
decel.
30 second deceleration
to 65%, hold, take
points @ 2 min TR, SS
12 Slow
decel.
30 second deceleration
to idle, hold, take points
@ 2 min TR, SS
13 Shut-
down
shut down, take SS
after engine has
stopped TR, SS
Table 1 Schedule of an engine test
3. STATIC ULTRASONIC MEASUREMENT
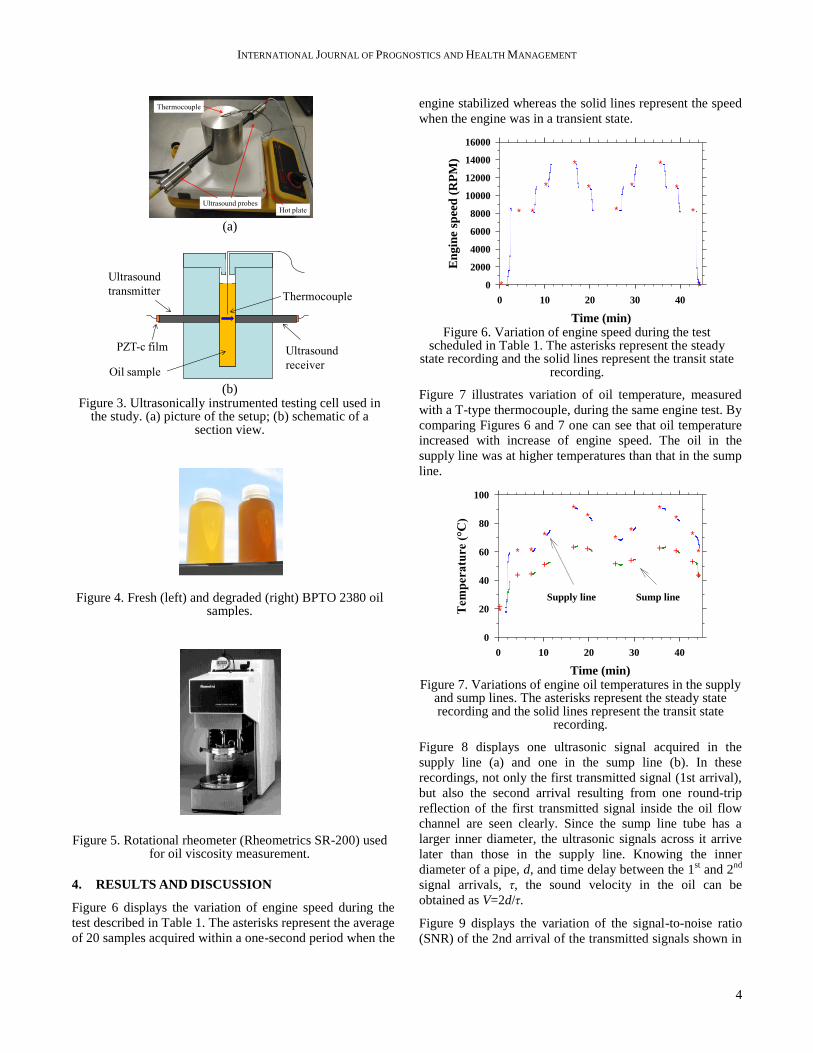
A test cell shown in Figure 3 was used for studying the
sensitivity of ultrasound to oil viscosity. The data will be
presented in the Results and Discussion section. The
ultrasound probes were composed of a stainless steel rod
and a PZT-c film deposed on one end of the rod. The probes
were intrusively mounted in the test cell with the inside end
being in touch with the oil sample. One probe was used as
transmitter and the other as receiver. A thermocouple was
used for oil temperature measurement. Two oil samples of
grade BPTO 2380 and two samples of a generic car motor
oil with viscosity rating of SAE 5W20 were tested. Of the
two BPTO 2380 samples, one was fresh and the other was
degraded due to long term storage. These two samples can
be easily differentiated from their colors as shown in Figure
4. For the two generic car motor oil samples, one was in
fresh condition, and the other was used. Their difference
could also be seen from their color difference. During the
testing, the test cell was wrapped with a piece of thermal
insulation fabric and was heated up to a pre-set temperature
(130 °C). After the test cell reached thermal equilibrium, the
heater was turned off and then data acquisition was carried
out when the test cell was cooled naturally in a 23 °C room
temperature setting. The cooling rates were about 1.3
°C/minute and 0.3 °C/minute when the oil temperatures
were at 112 °C and 40 °C, respectively. We estimated that
these cooling rates were slow enough to ensure a uniform
temperature distribution in the probed section. The distance
between the probing ends of the ultrasound probes was
determined at room temperature by using water as sound
wave propagation medium in the test cell and by measuring
the transit time, t, for ultrasonic waves to travel the distance
between probes ends. This distance was measured to be
d=c×t=9.59 mm, where c is the sound speed in water at 23
°C.
In a parallel experiment, the viscosities of the four oil
samples were measured using a constant stress rotational
rheometer, SR-200, presented in Figure 5. The strain
response as a function of time under a constant stress load
was monitored in a Couette type testing environment, at
room temperature. The measured oil viscosities, resulting
from the step stress (creep) measurements, are listed in
Table 2.
BPTO 2380 Generic 5W20
Fresh 0.0448 Fresh 0.1041
Old 0.0406 Used 0.0841
Table 2 Oil viscosity at 22 °C (Pa·s)
INTERNATIONAL JOURNAL OF PROGNOSTICS AND HEALTH MANAGEMENT
4
(a)
(b)
Figure 3. Ultrasonically instrumented testing cell used in the study. (a) picture of the setup; (b) schematic of a
section view.
Figure 4. Fresh (left) and degraded (right) BPTO 2380 oil samples.
Figure 5. Rotational rheometer (Rheometrics SR-200) used for oil viscosity measurement.
4. RESULTS AND DISCUSSION
Figure 6 displays the variation of engine speed during the
test described in Table 1. The asterisks represent the average
of 20 samples acquired within a one-second period when the
engine stabilized whereas the solid lines represent the speed
when the engine was in a transient state.
Figure 6. Variation of engine speed during the test
scheduled in Table 1. The asterisks represent the steady state recording and the solid lines represent the transit state
recording.
Figure 7 illustrates variation of oil temperature, measured
with a T-type thermocouple, during the same engine test. By
comparing Figures 6 and 7 one can see that oil temperature
increased with increase of engine speed. The oil in the
supply line was at higher temperatures than that in the sump
line.
Figure 7. Variations of engine oil temperatures in the supply
and sump lines. The asterisks represent the steady state recording and the solid lines represent the transit state
recording.
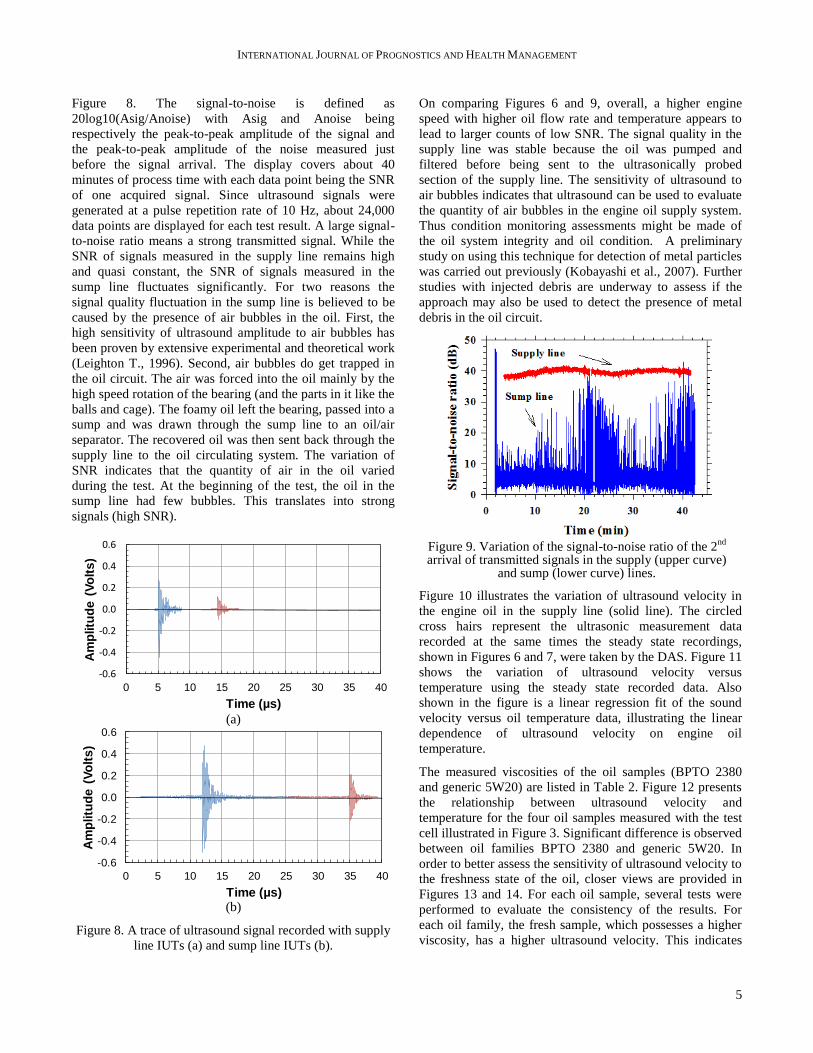
Figure 8 displays one ultrasonic signal acquired in the
supply line (a) and one in the sump line (b). In these
recordings, not only the first transmitted signal (1st arrival),
but also the second arrival resulting from one round-trip
reflection of the first transmitted signal inside the oil flow
channel are seen clearly. Since the sump line tube has a
larger inner diameter, the ultrasonic signals across it arrive
later than those in the supply line. Knowing the inner
diameter of a pipe, d, and time delay between the 1st and 2
nd
signal arrivals, τ, the sound velocity in the oil can be
obtained as V=2d/τ.
Figure 9 displays the variation of the signal-to-noise ratio
(SNR) of the 2nd arrival of the transmitted signals shown in
Ultrasound probes
Thermocouple
Hot plate
Oil sample
Thermocouple
Ultrasound
transmitter
Ultrasound
receiver
PZT-c film
Time (min)
0 10 20 30 40
En
gin
e sp
eed
(R
PM
)
0
2000
4000
6000
8000
10000
12000
14000
16000
*
* *
*
*
*
*
*
*
*
*
*
Time (min)
0 10 20 30 40
Tem
per
atu
re (
°C)
0
20
40
60
80
100
*
* *
*
**
**
**
*
*
+
+ ++
+ +
+ +
+ ++
+
Supply line Sump line
INTERNATIONAL JOURNAL OF PROGNOSTICS AND HEALTH MANAGEMENT
5
Figure 8. The signal-to-noise is defined as
20log10(Asig/Anoise) with Asig and Anoise being
respectively the peak-to-peak amplitude of the signal and
the peak-to-peak amplitude of the noise measured just
before the signal arrival. The display covers about 40
minutes of process time with each data point being the SNR
of one acquired signal. Since ultrasound signals were
generated at a pulse repetition rate of 10 Hz, about 24,000
data points are displayed for each test result. A large signal-
to-noise ratio means a strong transmitted signal. While the
SNR of signals measured in the supply line remains high
and quasi constant, the SNR of signals measured in the
sump line fluctuates significantly. For two reasons the
signal quality fluctuation in the sump line is believed to be
caused by the presence of air bubbles in the oil. First, the
high sensitivity of ultrasound amplitude to air bubbles has
been proven by extensive experimental and theoretical work
(Leighton T., 1996). Second, air bubbles do get trapped in
the oil circuit. The air was forced into the oil mainly by the
high speed rotation of the bearing (and the parts in it like the
balls and cage). The foamy oil left the bearing, passed into a
sump and was drawn through the sump line to an oil/air
separator. The recovered oil was then sent back through the
supply line to the oil circulating system. The variation of
SNR indicates that the quantity of air in the oil varied
during the test. At the beginning of the test, the oil in the
sump line had few bubbles. This translates into strong
signals (high SNR).
(a)
(b)
Figure 8. A trace of ultrasound signal recorded with supply
line IUTs (a) and sump line IUTs (b).
On comparing Figures 6 and 9, overall, a higher engine
speed with higher oil flow rate and temperature appears to
lead to larger counts of low SNR. The signal quality in the
supply line was stable because the oil was pumped and
filtered before being sent to the ultrasonically probed
section of the supply line. The sensitivity of ultrasound to
air bubbles indicates that ultrasound can be used to evaluate
the quantity of air bubbles in the engine oil supply system.
Thus condition monitoring assessments might be made of
the oil system integrity and oil condition. A preliminary
study on using this technique for detection of metal particles
was carried out previously (Kobayashi et al., 2007). Further
studies with injected debris are underway to assess if the
approach may also be used to detect the presence of metal
debris in the oil circuit.
Figure 9. Variation of the signal-to-noise ratio of the 2
nd
arrival of transmitted signals in the supply (upper curve) and sump (lower curve) lines.
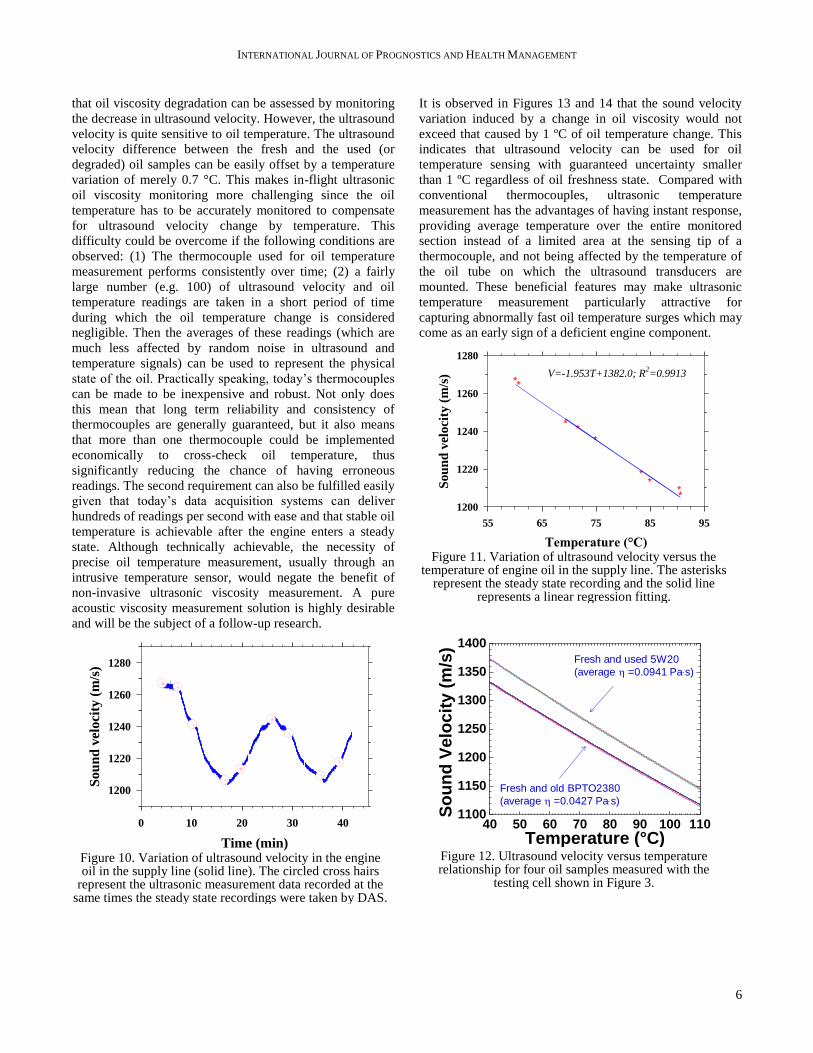
Figure 10 illustrates the variation of ultrasound velocity in
the engine oil in the supply line (solid line). The circled
cross hairs represent the ultrasonic measurement data
recorded at the same times the steady state recordings,
shown in Figures 6 and 7, were taken by the DAS. Figure 11
shows the variation of ultrasound velocity versus
temperature using the steady state recorded data. Also
shown in the figure is a linear regression fit of the sound
velocity versus oil temperature data, illustrating the linear
dependence of ultrasound velocity on engine oil
temperature.
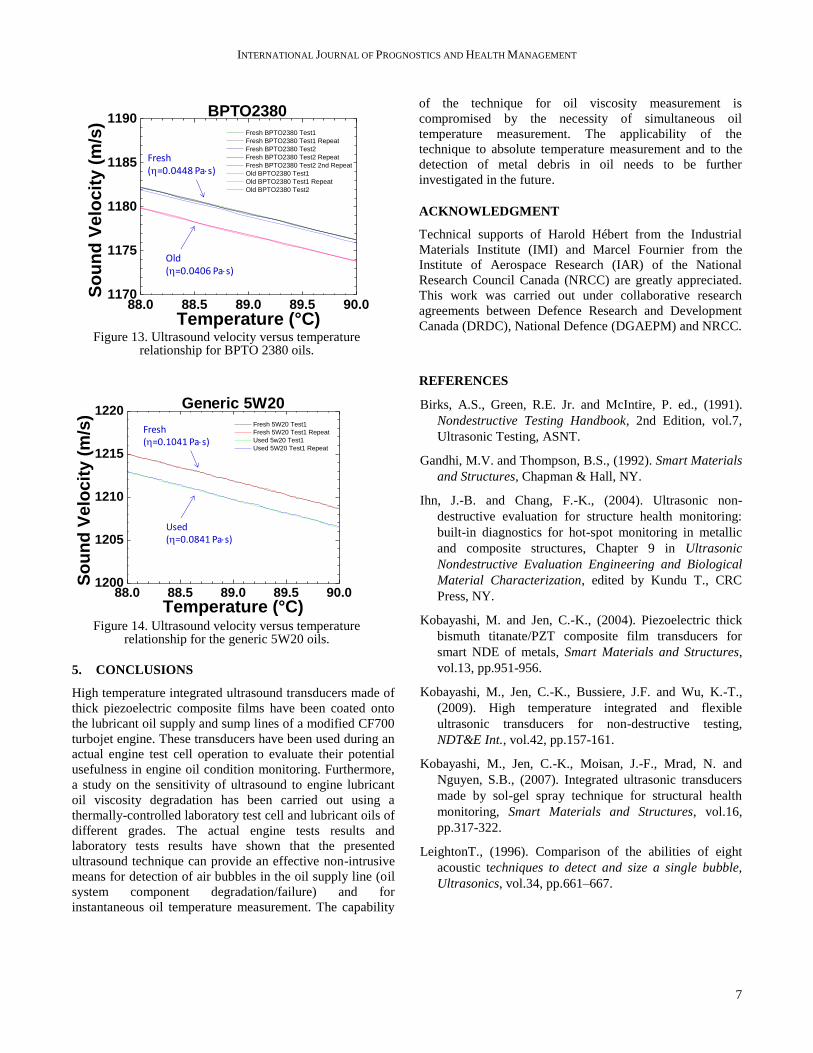
The measured viscosities of the oil samples (BPTO 2380
and generic 5W20) are listed in Table 2. Figure 12 presents
the relationship between ultrasound velocity and
temperature for the four oil samples measured with the test
cell illustrated in Figure 3. Significant difference is observed
between oil families BPTO 2380 and generic 5W20. In
order to better assess the sensitivity of ultrasound velocity to
the freshness state of the oil, closer views are provided in
Figures 13 and 14. For each oil sample, several tests were
performed to evaluate the consistency of the results. For
each oil family, the fresh sample, which possesses a higher
viscosity, has a higher ultrasound velocity. This indicates
-0.6
-0.4
-0.2
0.0
0.2
0.4
0.6
0 5 10 15 20 25 30 35 40
Am
plitu
de
(V
olt
s)
Time (µs)
-0.6
-0.4
-0.2
0.0
0.2
0.4
0.6
0 5 10 15 20 25 30 35 40
Am
plitu
de
(V
olt
s)
Time (µs)
INTERNATIONAL JOURNAL OF PROGNOSTICS AND HEALTH MANAGEMENT
6
that oil viscosity degradation can be assessed by monitoring
the decrease in ultrasound velocity. However, the ultrasound
velocity is quite sensitive to oil temperature. The ultrasound
velocity difference between the fresh and the used (or
degraded) oil samples can be easily offset by a temperature
variation of merely 0.7 °C. This makes in-flight ultrasonic
oil viscosity monitoring more challenging since the oil
temperature has to be accurately monitored to compensate
for ultrasound velocity change by temperature. This
difficulty could be overcome if the following conditions are
observed: (1) The thermocouple used for oil temperature
measurement performs consistently over time; (2) a fairly
large number (e.g. 100) of ultrasound velocity and oil
temperature readings are taken in a short period of time
during which the oil temperature change is considered
negligible. Then the averages of these readings (which are
much less affected by random noise in ultrasound and
temperature signals) can be used to represent the physical
state of the oil. Practically speaking, today’s thermocouples
can be made to be inexpensive and robust. Not only does
this mean that long term reliability and consistency of
thermocouples are generally guaranteed, but it also means
that more than one thermocouple could be implemented
economically to cross-check oil temperature, thus
significantly reducing the chance of having erroneous
readings. The second requirement can also be fulfilled easily
given that today’s data acquisition systems can deliver
hundreds of readings per second with ease and that stable oil
temperature is achievable after the engine enters a steady
state. Although technically achievable, the necessity of
precise oil temperature measurement, usually through an
intrusive temperature sensor, would negate the benefit of
non-invasive ultrasonic viscosity measurement. A pure
acoustic viscosity measurement solution is highly desirable
and will be the subject of a follow-up research.
Figure 10. Variation of ultrasound velocity in the engine oil in the supply line (solid line). The circled cross hairs
represent the ultrasonic measurement data recorded at the same times the steady state recordings were taken by DAS.
It is observed in Figures 13 and 14 that the sound velocity
variation induced by a change in oil viscosity would not
exceed that caused by 1 ºC of oil temperature change. This
indicates that ultrasound velocity can be used for oil
temperature sensing with guaranteed uncertainty smaller
than 1 ºC regardless of oil freshness state. Compared with
conventional thermocouples, ultrasonic temperature
measurement has the advantages of having instant response,
providing average temperature over the entire monitored
section instead of a limited area at the sensing tip of a
thermocouple, and not being affected by the temperature of
the oil tube on which the ultrasound transducers are
mounted. These beneficial features may make ultrasonic
temperature measurement particularly attractive for
capturing abnormally fast oil temperature surges which may
come as an early sign of a deficient engine component.
Figure 11. Variation of ultrasound velocity versus the
temperature of engine oil in the supply line. The asterisks represent the steady state recording and the solid line
represents a linear regression fitting.
Figure 12. Ultrasound velocity versus temperature relationship for four oil samples measured with the
testing cell shown in Figure 3.
Time (min)
0 10 20 30 40
Sou
nd
vel
oci
ty (
m/s
)
1200
1220
1240
1260
1280
Temperature (°C)
55 65 75 85 95
Sou
nd
vel
oci
ty (
m/s
)
1200
1220
1240
1260
1280
**
*
*
*
*
*
*
*
V=-1.953T+1382.0; R2=0.9913
Fresh and used 5W20
(average =0.0941 Pas)
Fresh and old BPTO2380
(average =0.0427 Pas)
40 50 60 70 80 90 100 1101100
1150
1200
1250
1300
1350
1400
So
un
d V
elo
cit
y (
m/s
)
Temperature (°C)
INTERNATIONAL JOURNAL OF PROGNOSTICS AND HEALTH MANAGEMENT
7
Figure 13. Ultrasound velocity versus temperature
relationship for BPTO 2380 oils.
Figure 14. Ultrasound velocity versus temperature
relationship for the generic 5W20 oils.
5. CONCLUSIONS
High temperature integrated ultrasound transducers made of
thick piezoelectric composite films have been coated onto
the lubricant oil supply and sump lines of a modified CF700
turbojet engine. These transducers have been used during an
actual engine test cell operation to evaluate their potential
usefulness in engine oil condition monitoring. Furthermore,
a study on the sensitivity of ultrasound to engine lubricant
oil viscosity degradation has been carried out using a
thermally-controlled laboratory test cell and lubricant oils of
different grades. The actual engine tests results and
laboratory tests results have shown that the presented
ultrasound technique can provide an effective non-intrusive
means for detection of air bubbles in the oil supply line (oil
system component degradation/failure) and for
instantaneous oil temperature measurement. The capability
of the technique for oil viscosity measurement is
compromised by the necessity of simultaneous oil
temperature measurement. The applicability of the
technique to absolute temperature measurement and to the
detection of metal debris in oil needs to be further
investigated in the future.
ACKNOWLEDGMENT
Technical supports of Harold Hébert from the Industrial
Materials Institute (IMI) and Marcel Fournier from the
Institute of Aerospace Research (IAR) of the National
Research Council Canada (NRCC) are greatly appreciated.
This work was carried out under collaborative research
agreements between Defence Research and Development
Canada (DRDC), National Defence (DGAEPM) and NRCC.
REFERENCES
Birks, A.S., Green, R.E. Jr. and McIntire, P. ed., (1991).
Nondestructive Testing Handbook, 2nd Edition, vol.7,
Ultrasonic Testing, ASNT.
Gandhi, M.V. and Thompson, B.S., (1992). Smart Materials
and Structures, Chapman & Hall, NY.
Ihn, J.-B. and Chang, F.-K., (2004). Ultrasonic non-
destructive evaluation for structure health monitoring:
built-in diagnostics for hot-spot monitoring in metallic
and composite structures, Chapter 9 in Ultrasonic
Nondestructive Evaluation Engineering and Biological
Material Characterization, edited by Kundu T., CRC
Press, NY.
Kobayashi, M. and Jen, C.-K., (2004). Piezoelectric thick
bismuth titanate/PZT composite film transducers for
smart NDE of metals, Smart Materials and Structures,
vol.13, pp.951-956.
Kobayashi, M., Jen, C.-K., Bussiere, J.F. and Wu, K.-T.,
(2009). High temperature integrated and flexible
ultrasonic transducers for non-destructive testing,
NDT&E Int., vol.42, pp.157-161.
Kobayashi, M., Jen, C.-K., Moisan, J.-F., Mrad, N. and
Nguyen, S.B., (2007). Integrated ultrasonic transducers
made by sol-gel spray technique for structural health
monitoring, Smart Materials and Structures, vol.16,
pp.317-322.
LeightonT., (1996). Comparison of the abilities of eight
acoustic techniques to detect and size a single bubble,
Ultrasonics, vol.34, pp.661–667.
88.0 88.5 89.0 89.5 90.01170
1175
1180
1185
1190
S
ou
nd
Velo
cit
y (
m/s
)
Temperature (°C)
Fresh BPTO2380 Test1
Fresh BPTO2380 Test1 Repeat
Fresh BPTO2380 Test2
Fresh BPTO2380 Test2 Repeat
Fresh BPTO2380 Test2 2nd Repeat
Old BPTO2380 Test1
Old BPTO2380 Test1 Repeat
Old BPTO2380 Test2
Fresh(=0.0448 Pas)
Old(=0.0406 Pas)
BPTO2380
88.0 88.5 89.0 89.5 90.01200
1205
1210
1215
1220
So
un
d V
elo
cit
y (
m/s
)
Temperature (°C)
Fresh 5W20 Test1
Fresh 5W20 Test1 Repeat
Used 5w20 Test1
Used 5W20 Test1 Repeat
Fresh(=0.1041 Pas)
Used(=0.0841 Pas)
Generic 5W20
Related Documents