
Welcome message from author
This document is posted to help you gain knowledge. Please leave a comment to let me know what you think about it! Share it to your friends and learn new things together.
Transcript

������������������������������������������������
�������������

���������� ��

US$12.2 bn
US$1.4 bn
Revenues evolution by country 2001 – 2010
CAGR
+27 %
46%
30%
14%
Brazil
And a new cycle ofgrowth has began
73%
3Q 2011
8%21%
29%
41%
9%1%1%
�����������������������������������������������
2007
2006
2005
2004
2003
2002
2000
1993
1988
1982
1976
2008
2009
Source: Cencosud
2010
Opened the first
supermarket
IPO in the
Santiago Stock
Exchange
3Q 2011

������
������
� ��� ���������
����
� �����������
2010 Revenues: US$12.2 billion
Selling Area: 2.9 million m2
Stores: 773
Customers: more than 100 million
����������������������������������������� �����!������
Note: Figures include Bretas acquisition in October 2010
�����
� �����������
� ��� ���������
� ��������� ������
� �������� �������
� ������� �������
���������
� �����������
� ��� ���������
� �������� �������
� ������� �������
� �����������
� ������� �������
� �������� �������
� ������� �������
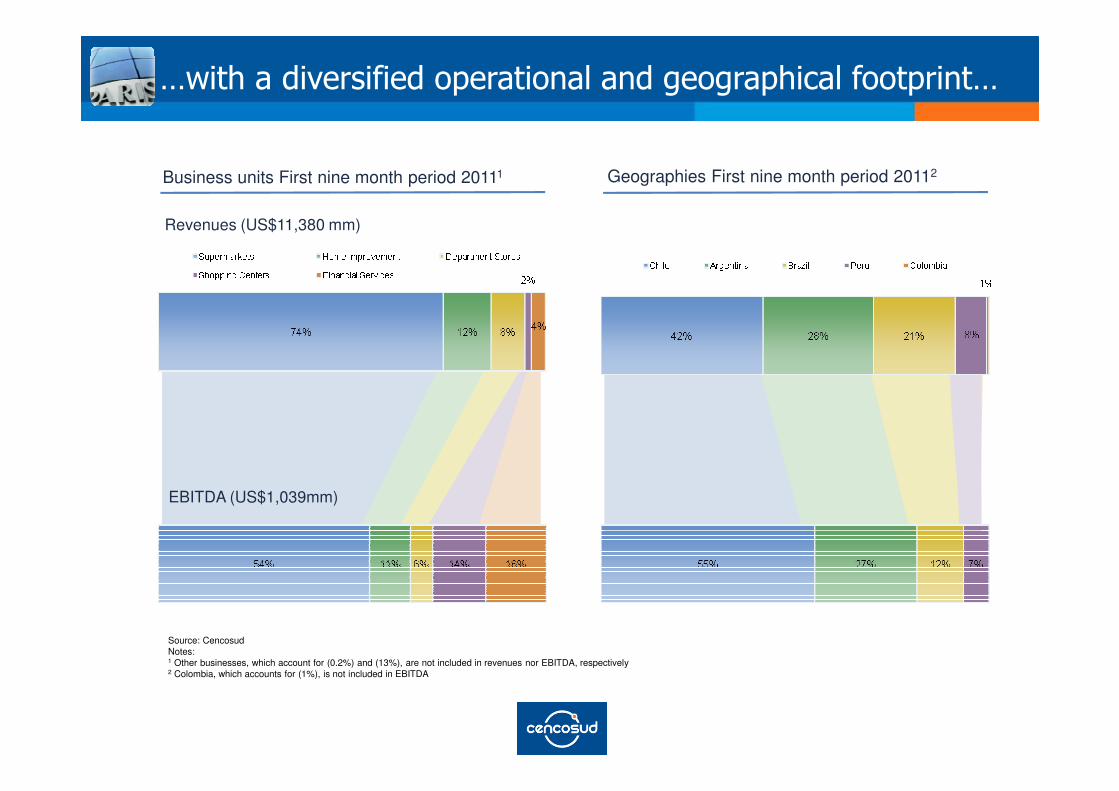
Business units First nine month period 20111
Revenues (US$11,380 mm)
Geographies First nine month period 20112
�"��������#��������������������������������������������
Source: CencosudNotes:1 Other businesses, which account for (0.2%) and (13%), are not included in revenues nor EBITDA, respectively2 Colombia, which accounts for (1%), is not included in EBITDA
EBITDA (US$1,039mm)
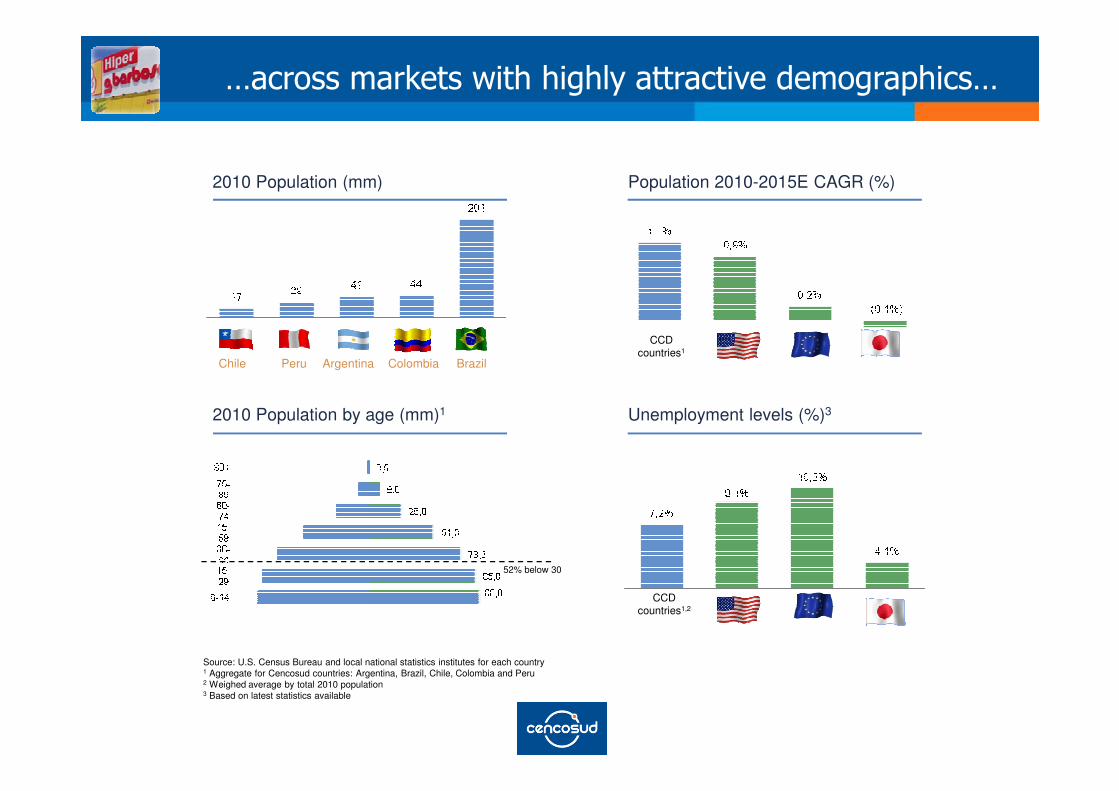
2010 Population (mm) Population 2010-2015E CAGR (%)
CCD countries1
PeruChile BrazilArgentina Colombia
�����������$���"�������������������#�������������
Source: U.S. Census Bureau and local national statistics institutes for each country1 Aggregate for Cencosud countries: Argentina, Brazil, Chile, Colombia and Peru2 Weighed average by total 2010 population3 Based on latest statistics available
2010 Population by age (mm)1
52% below 30
Unemployment levels (%)3
CCD countries1,2
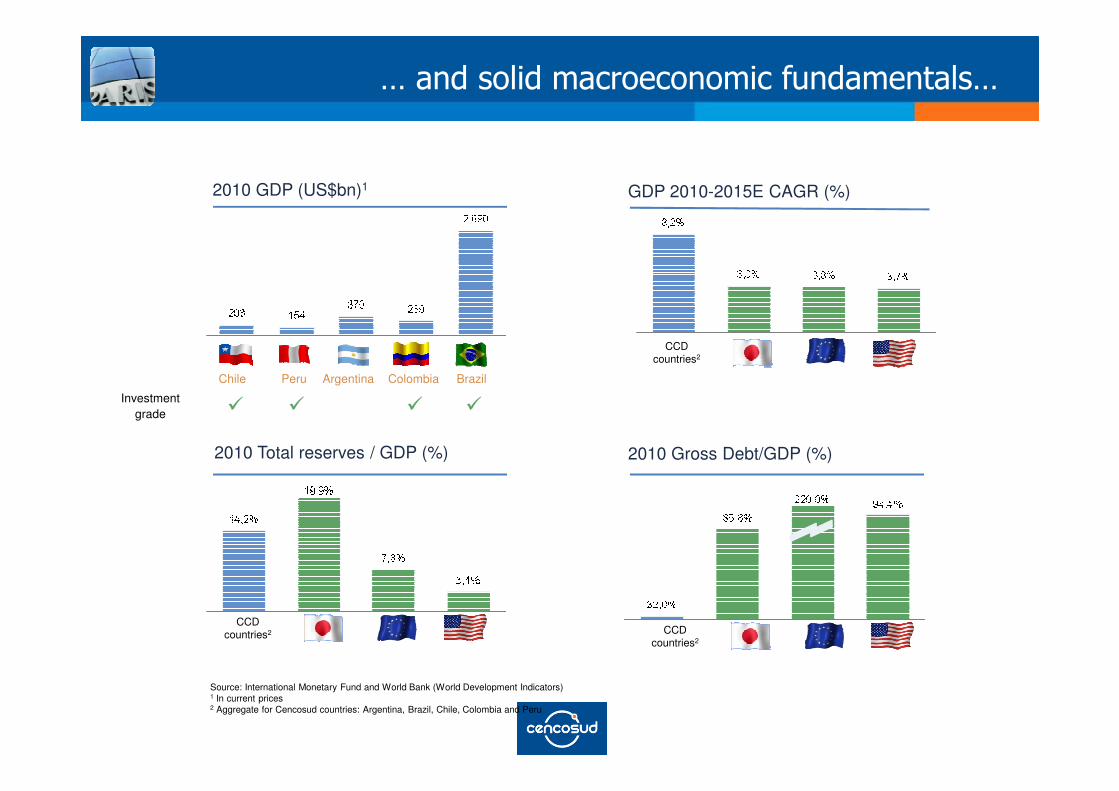
2010 GDP (US$bn)1 GDP 2010-2015E CAGR (%)
CCD countries2
PeruChile BrazilArgentina Colombia
Investment � � � �
�������������������������������������
Source: International Monetary Fund and World Bank (World Development Indicators) 1 In current prices2 Aggregate for Cencosud countries: Argentina, Brazil, Chile, Colombia and Peru
2010 Total reserves / GDP (%)
CCD countries2
2010 Gross Debt/GDP (%)
CCD countries2
Investment grade � � � �
�����
������
������
������
������
������
������
������
������
��������
����
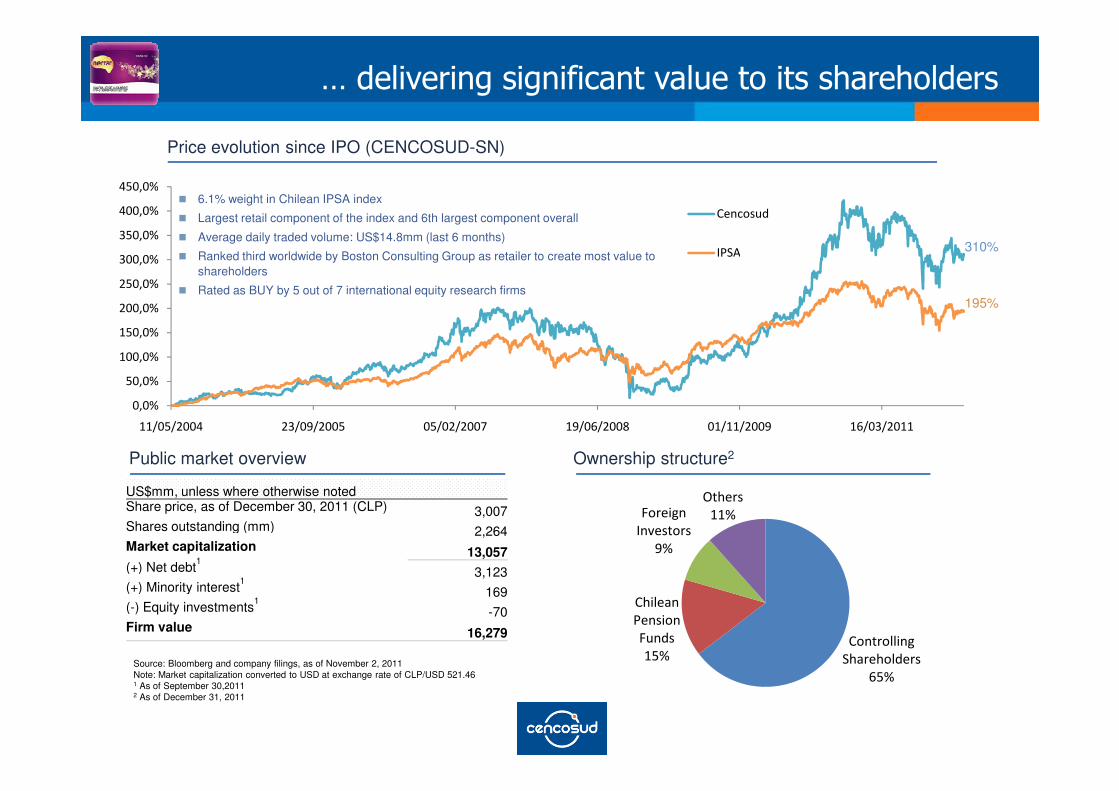
� 6.1% weight in Chilean IPSA index
� Largest retail component of the index and 6th largest component overall
� Average daily traded volume: US$14.8mm (last 6 months)
� Ranked third worldwide by Boston Consulting Group as retailer to create most value to shareholders
� Rated as BUY by 5 out of 7 international equity research firms
310%
195%
Price evolution since IPO (CENCOSUD-SN)
�����#�����������������#���������������������
����
���������� ���� ����� ���������! � ��"����# ��������� �"��������
Source: Bloomberg and company filings, as of November 2, 2011Note: Market capitalization converted to USD at exchange rate of CLP/USD 521.461 As of September 30,20112 As of December 31, 2011
Public market overview Ownership structure2
���$��%% �&�
�'���'�%����
"��
�' %����
���� ���
(����
���
(��� &��
����$���
�
$'���
���
US$mm, unless where otherwise notedShare price, as of December 30, 2011 (CLP) 3,007Shares outstanding (mm) 2,264Market capitalization 13,057(+) Net debt1 3,123(+) Minority interest1 169(-) Equity investments1
-70Firm value 16,279

�����
Sales evolution (US$ bn)
�����
�����������������������������#���
�
Source: CencosudNote: 2005 – 2009 figures in Chilean GAAP while 2010 and 2011 figures in IFRS
� Addition of 58 supermarkets, 1 new home improvement, 4 department stores and 1new shopping center in Chile versus 3Q2010
� Consolidation of Bretas
� In all the countries and formats Cencosud obtained positive same stores sales figures(double-digit SSS growth in Argentina and Peru)

Sales breakdown by business – 3Q 2011 Sales breakdown by country – 3Q 2011
%��������������������������&�'�����#���
��
Source: CencosudNote: 2005 – 2009 figures in Chilean GAAP while 3Q 2010 and 3Q 2011 figures in IFRS
������
��������
������
��������
���� ��������� �����
�����
�����
Mg 7.9%Mg. 7.2%
()*+,!�������#�#��������-./,���0
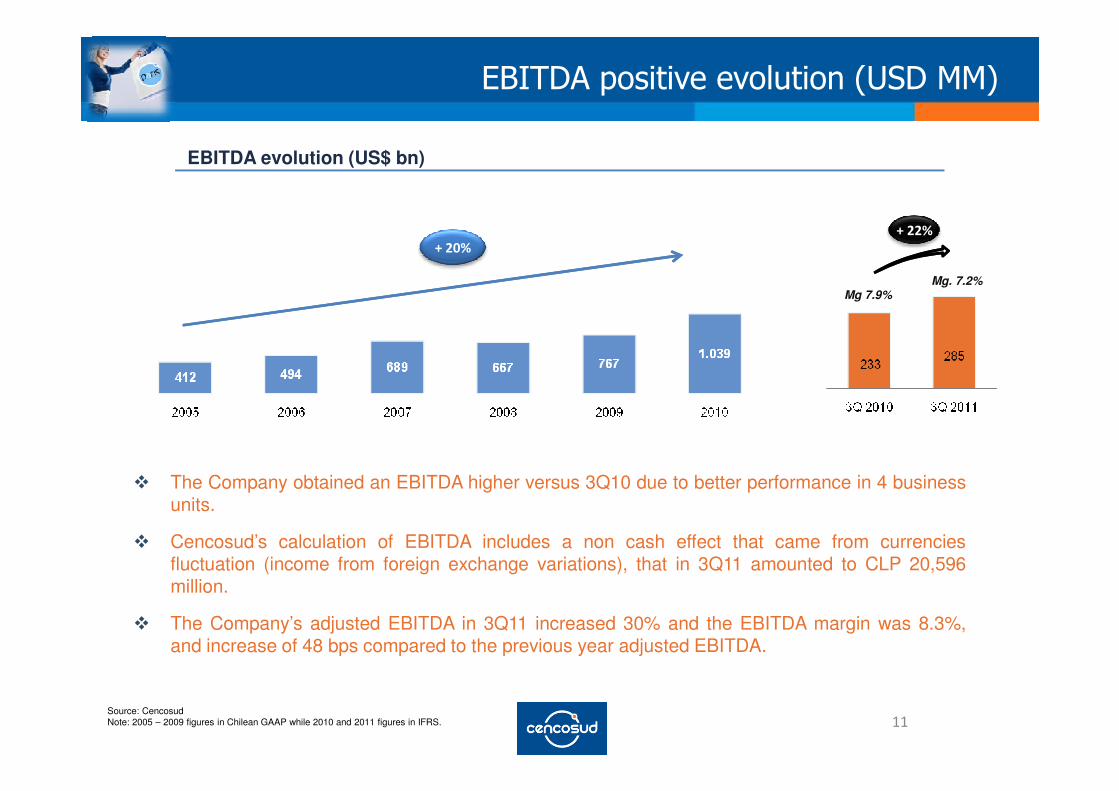
EBITDA evolution (US$ bn)
��Source: CencosudNote: 2005 – 2009 figures in Chilean GAAP while 2010 and 2011 figures in IFRS.
� The Company obtained an EBITDA higher versus 3Q10 due to better performance in 4 businessunits.
� Cencosud’s calculation of EBITDA includes a non cash effect that came from currenciesfluctuation (income from foreign exchange variations), that in 3Q11 amounted to CLP 20,596million.
� The Company’s adjusted EBITDA in 3Q11 increased 30% and the EBITDA margin was 8.3%,and increase of 48 bps compared to the previous year adjusted EBITDA.

��� ���
��������������� ������ ������� )��!�
%���������������������� )�*#��� )�*"��� ���"�
1���������*���� � *��#� �*� �� ����"�
1����������� )��*#��� )� *#�"� "����
*��������� )��*�#�� )��*��!� )����
*���������2�����)��$ )��� )�� � )� ���
()*+,!��������3���-� 2���0
Cencosud’s calculation of EBITDAincludes a non cash effect thatcame from currencies fluctuation(income from foreign exchangevariations)
•in 3Q11 was CLP 20,596 MM
•In 3Q10 was CLP 498 MM*���������2�����)��$ )��� )�� � )� ���
%#����� )��*���� ) �*�*
,��������� )� *� �� )��*��!� �����
������ ������� ������ �����
()*+,!������� !��� !�#� )��"�$
������� ������ ������� ������� ��
������� ���������� �� �� ��� �� �
•In 3Q10 was CLP 498 MM

EBITDA breakdown by business¹ – 3Q 2011 EBITDA breakdown by country² – 3Q 2011
*�������()*+,!����)��4�������1���������/�#���
��
Source: Cencosud¹ Other businesses which account for (17%) are not included. ² Colombia EBITDA (1%) is not included.
� More than 70% of EBITDA came from retail businesses
� Margin improvement was driven by supermarkets and home improvement divisions
� In supermarkets was achieved by better higher gross margins mainly in Chile andArgentina mostly in the Jumbo banners.

+�� ������� ��

68 stores 145 stores#1
North East Region (34%)Minas Gerais (25%) #1
#2
/������$��5�����������///����6���������
Source market share: Cencosud and AC Nielsen as of September 2011. In Chile and Peru figures are for march 2011 ��
184 stores261 stores#2
#2
* Dia Stores not include
*658 stores

EBITDA breakdown by country, YTD 3Q 2011
Sales evolution (US$ bn) EBITDA evolution (US$ mm)
CAGR
����
����
CAGR
����
����
SSS evolution by country 3Q 2011
Mg 7.0% Mg 6.9%
/������$��5�3��������������������������!�������
EBITDA breakdown by country, YTD 3Q 2011
�"
Source: CencosudNote: 2005 – 2009 figures in Chilean GAAP while 2010 and 2011 figures in IFRS.
SSS evolution by country 3Q 2011
� Prezunic is the 3rd largest supermarket operator of Rio de Janeiro and the
!�7������������2�4����5��������3��������)��4��
�!
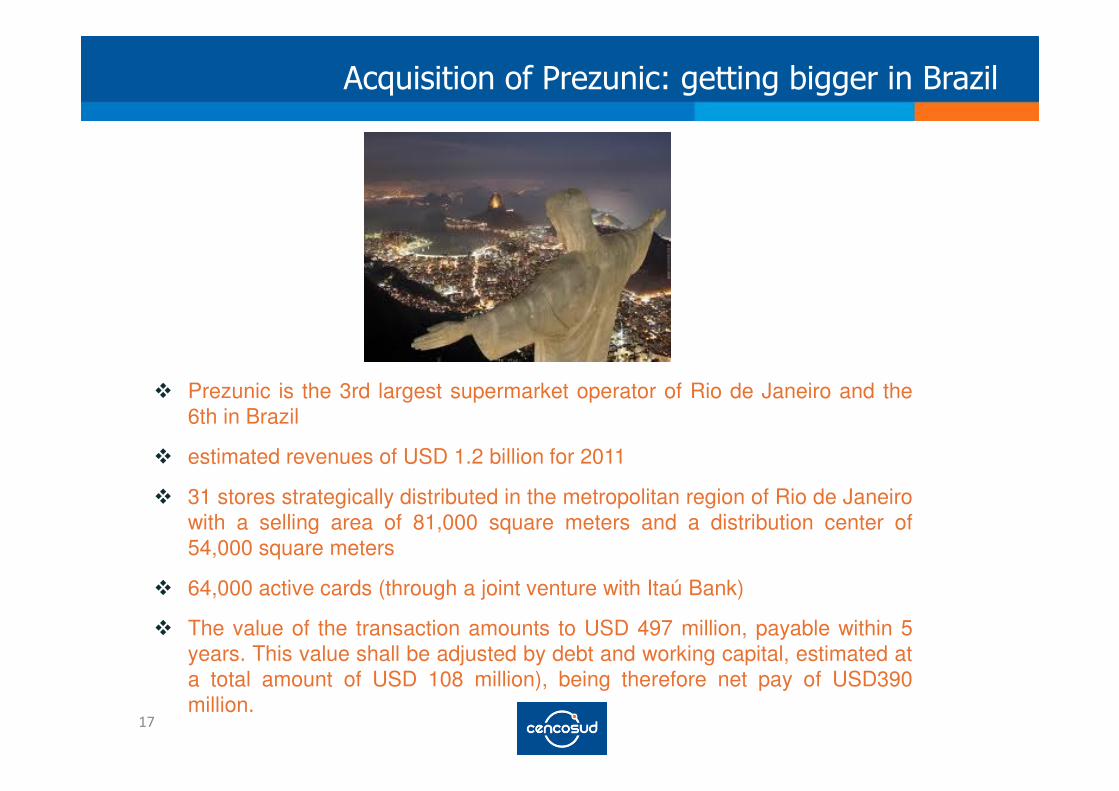
� Prezunic is the 3rd largest supermarket operator of Rio de Janeiro and the6th in Brazil
� estimated revenues of USD 1.2 billion for 2011
� 31 stores strategically distributed in the metropolitan region of Rio de Janeirowith a selling area of 81,000 square meters and a distribution center of54,000 square meters
� 64,000 active cards (through a joint venture with Itaú Bank)
� The value of the transaction amounts to USD 497 million, payable within 5years. This value shall be adjusted by debt and working capital, estimated ata total amount of USD 108 million), being therefore net pay of USD390million.

All Prezunic Stores has the same layout:� 2,500 m2 selling area*� 230 employees� 26 checkouts
!�7������������2�4����5��������3��������)��4��

EBITDA evolution (US$ mm)Sales evolution (US$ mm)
CAGR
����
����
CAGR
����
����
SSS evolution by country 3Q 2011
Mg 6.1% Mg 7.2%
8���*����#���5�����������������3������������
�
Source: CencosudNote: 2005 – 2009 figures in Chilean GAAP while 2010 and 2011 figures in IFRS.(1) 2005 – 2010 Growth rate
SSS evolution by country 3Q 2011
• In Chile Easy closed one store inConcepcion (CLP 1 bn revenues in3Q10) and our competitor openeda store in the same month
• The performance in the north ofChile has to be improved

EBITDA evolution (US$ mm)Sales evolution (US$ mm)
���
������
����
�����CAGR
CAGR
Mg 4.9% Mg 4.0%
,��������/����5���������������������
Market Share
Source: Company reports. Considers only department stores that disclose retail sales as of 2Q 2011.
��
Source: CencosudNote: 2005 – 2009 figures in Chilean GAAP while 2010 and 2011 figures in IFRS.¹ Cencosud accounts for US$ 654 mm in sales in 2005 as Paris is consolidated as from 2Q 2005.
���������
SSS evolution 3Q 2011
3.5%
30.8%
-7.3%

EBITDA evolution (US$ mm)(1)Sales evolution (US$ mm)
CAGR
����������CAGR
���
����
Mg 68% Mg 73%
/�������������5�����������"���"�����������3�����
Geographic presence and occupancy rates
���
39%45%
55%
Source: CencosudNote: 2005 – 2009 figures in Chilean GAAP while 2010 and 2011 figures in IFRS.(1): Figures only include third party sales..
#214 Shopping Centers
582,241 m2
99% occupancy rate
#29 Shopping Centers
487,927 m2
97% occupancy rate
2 Shopping Centers65,763 m2
96% occupancy rate
�������������������������������
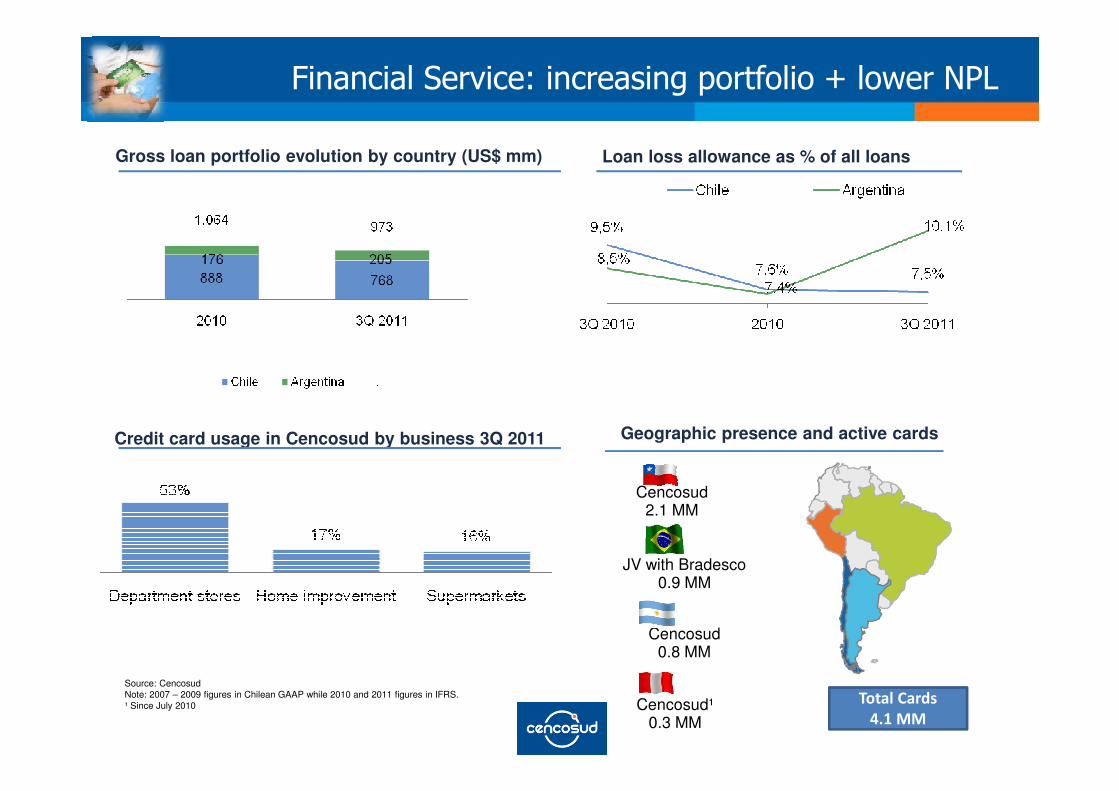
Gross loan portfolio evolution by country (US$ mm) Loan loss allowance as % of all loans
1���������/�#��5���������������������9���"��:2
Credit card usage in Cencosud by business 3Q 2011
��
Source: CencosudNote: 2007 – 2009 figures in Chilean GAAP while 2010 and 2011 figures in IFRS.¹ Since July 2010 ��!"��!�#�
����$ $
Geographic presence and active cards
Cencosud¹0.3 MM
Cencosud2.1 MM
Cencosud0.8 MM
JV with Bradesco0.9 MM
( ���� �%�, &'% &'$
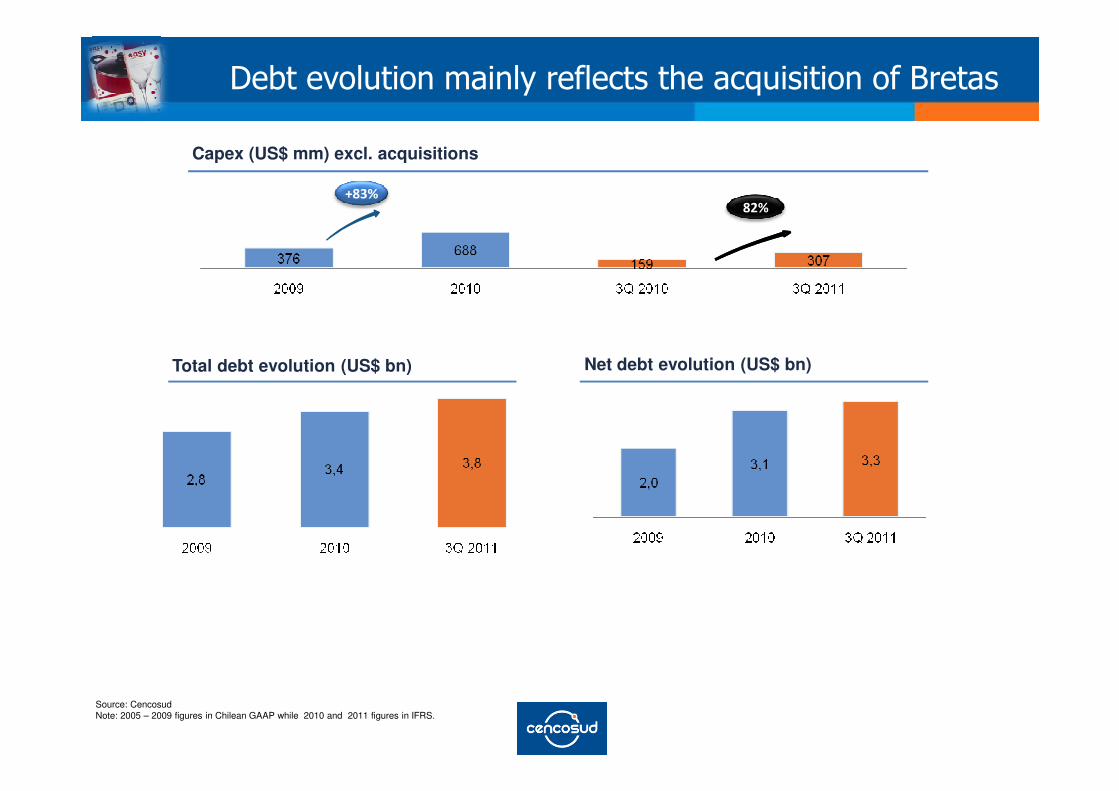
Total debt evolution (US$ bn) Net debt evolution (US$ bn)
Capex (US$ mm) excl. acquisitions
�������
,3��#���������������������������7������������)����
��
Source: CencosudNote: 2005 – 2009 figures in Chilean GAAP while 2010 and 2011 figures in IFRS.

Net debt / EBITDA
- 25%- 14%
Financial debt / Equity
Total debt / EBITDA
EBITDA / Interest expenses
*����#������������������������
��
Source: CencosudNote: 2005 – 2009 figures in Chilean GAAP while 2010-2011 figures in IFRS. Multiples calculated in local currency.
+ 84%
Financial debt / EquityEBITDA / Interest expenses
- 17%

,3�!�����4����� /�����
Amortizaciones al Cierre Dic 2008
558
351385
594
138
7 7 18 25
119
26 27 57 67 68 69 70 70 52
221
0
100
200
300
400
500
600
700
2009
2010
2011
2012
2013
2014
2015
2016
2017
2018
2019
2020
2021
2022
2023
2024
2025
2026
2027
2028
Duration 4.7 Y
Debt Amortization December 2008
Source: Cencosud
Figures in USD MM��
Amortizaciones Hoy
240167
251
365 336
62 98
230
41 39
819
80 81 99 117 117 99
268
48 17115
0100200
300400500600
700800
900
2011
2012
2013
2014
2015
2016
2017
2018
2019
2020
2021
2022
2023
2024
2025
2026
2027
2028
2029
2030
2031
Duration 7.4 Y
2009
2010
2011
2012
2013
2014
2015
2016
2017
2018
2019
2020
2021
2022
2023
2024
2025
2026
2027
2028
Debt Amortization Sep 2011

� Bondholders meeting held on January 5th 2012
� Continue growth of the company and have slack to take advantage ofinvestment opportunities
� Covenant Liabilities-cash /Equity it is conditioned to the seasonality of thebusiness (more working capital is required in the fourth quarter)
� Having to deal with exchange rate volatility requires additional clearances'
� Conservative covenant and validated by the market in the last 7 placements
��#������8������������2�����
� Conservative covenant and validated by the market in the last 7 placements(UF 18.8 MM)
� Simplify the measurement and control from a single covenant
� Changes proposed
� Financial debt / Equity < 1.3x
� Liabilities-cash / Equity<1.5x
Net Financial Debt / Equity <1.2x

!��"��� ������#
$%�� ��#
�"��&�#�"��&�#
Related Documents


![MWV Presentation for GS Conference.ppt [Read-Only]library.corporate-ir.net/library/11/111/111517/items/295055/0508...demand and changes in production capacities; ... • Begin value](https://static.cupdf.com/doc/110x72/5aa620aa7f8b9ae7438e6d0f/mwv-presentation-for-gs-read-onlylibrarycorporate-irnetlibrary11111111517items2950550508demand.jpg)
![080213 RIU Expolorers Conference.ppt · 2008/02/13 · Title: Microsoft PowerPoint - 080213 RIU Expolorers Conference.ppt [Compatibility Mode] Author: brobertson Created Date: 2/13/2008](https://static.cupdf.com/doc/110x72/601b3c61511f805c84738afa/080213-riu-expolorers-20080213-title-microsoft-powerpoint-080213-riu-expolorers.jpg)