Energy utilization, carbon dioxide emission, and exergy loss in flavored yogurt production process Esra Sorgüven a, * , Mustafa Özilgen b a Department of Mechanical Engineering, Yeditepe University, 34755 Kayisdagi Istanbul, Turkey b Department of Food Engineering, Yeditepe University, 34755 Kayisdagi Istanbul, Turkey article info Article history: Received 27 October 2011 Received in revised form 30 January 2012 Accepted 1 February 2012 Available online 4 March 2012 Keywords: Flavored yogurt Energy utilization Carbon dioxide emission Exergy loss abstract This paper investigates the impact of food production processes on the environment in terms of energy and exergy utilization and carbon dioxide emission. There are three different energy utilization mech- anisms in food production: Utilization of solar energy by plants to produce agricultural goods; feed consumption by herbivores to produce meat and milk; fossil fuel consumption by industrial processes to perform mixing, cooling, heating, etc. Production of strawberry-flavored yogurt, which involves these three mechanisms, is investigated here thermodynamically. Analysis starts with the cultivation of the ingredients and ends with the transfer of the final product to the market. The results show that 53% of the total exergy loss occurs during the milk production and 80% of the total work input is consumed during the plain yogurt making. The cumulative degree of perfection is 3.6% for the strawberry-flavored yogurt. This value can rise up to 4.6%, if renewable energy resources like hydropower and algal biodiesel are employed instead of fossil fuels. This paper points the direction for the development of new tech- nology in food processing to decrease waste of energy and carbon dioxide accumulation in the atmosphere. Ó 2012 Elsevier Ltd. All rights reserved. 1. Introduction Scarcity of energy resources and carbon dioxide concentration in the atmosphere are two major concerns of humanity. Since the beginning of the industrial revolution in 1850’s, energy demand is rising, resources are diminishing and carbon dioxide concentration in the atmosphere is increasing. Consequences are publicly blamed for numerous environmental and climatic adverse observations. Increasing thermodynamic efficiency and decreasing CO 2 emission are essential. This paper illustrates the importance of a detailed thermodynamic analysis for a food production process. The strawberry-flavored yogurt production process is selected as an example, since it involves three important stages: agriculture, dairy farming, and industrial processes. Plants take energy from a renewable source, i.e. sun, and perform photosynthesis. The environmental cost for the agriculture is only due to the consumption of non-renewables, such as fertilizers, microelements and diesel consumed by farming machinery. Herbivores take energy from plant-based feed and use this energy for growth, locomotion, heat transfer, etc. In the case of calves, a small part of the intake energy is used for lactation, too. Industrial processes mainly consume fossil fuels; thus, the environmental cost of these operations is rather large. This paper shows the thermodynamical differences between the consumption of renewables and non- renewables by plants through photosynthesis, by calves to synthesize milk, and by industrial processes like mixing, refriger- ation, transportation etc. Energy utilization to produce several food products had been the subject of some studies in the past. However, the overall production process of flavored yogurt had never been a subject of such a study before. The exergy loss and carbon dioxide emission was not a part of previous studies either. This paper presents a unique approach, where the energy utilization, the carbon dioxide emission, and the exergy loss are calculated for a food product starting with the cultivation of the ingredients in the farm, and ending with the transfer of the final product to the market. 2. Methods Fig. 1 shows the system chosen for the analysis. System boundaries involve milk production in the dairy farm, agriculture of strawberry and sugar beet, industrial processes to produce milk * Corresponding author. Tel.: þ90 216 578 04 98; fax: þ90 216 578 04 00. E-mail addresses: [email protected] (E. Sorgüven), mozilgen@ yeditepe.edu.tr (M. Özilgen). Contents lists available at SciVerse ScienceDirect Energy journal homepage: www.elsevier.com/locate/energy 0360-5442/$ e see front matter Ó 2012 Elsevier Ltd. All rights reserved. doi:10.1016/j.energy.2012.02.003 Energy 40 (2012) 214e225

Welcome message from author
This document is posted to help you gain knowledge. Please leave a comment to let me know what you think about it! Share it to your friends and learn new things together.
Transcript
at SciVerse ScienceDirect
Energy 40 (2012) 214e225
Contents lists available
Energy
journal homepage: www.elsevier .com/locate/energy
Energy utilization, carbon dioxide emission, and exergy loss in flavored yogurtproduction process
Esra Sorgüven a,*, Mustafa Özilgen b
aDepartment of Mechanical Engineering, Yeditepe University, 34755 Kayisdagi Istanbul, TurkeybDepartment of Food Engineering, Yeditepe University, 34755 Kayisdagi Istanbul, Turkey
a r t i c l e i n f o
Article history:Received 27 October 2011Received in revised form30 January 2012Accepted 1 February 2012Available online 4 March 2012
Keywords:Flavored yogurtEnergy utilizationCarbon dioxide emissionExergy loss
* Corresponding author. Tel.: þ90 216 578 04 98; fE-mail addresses: [email protected]
yeditepe.edu.tr (M. Özilgen).
0360-5442/$ e see front matter � 2012 Elsevier Ltd.doi:10.1016/j.energy.2012.02.003
a b s t r a c t
This paper investigates the impact of food production processes on the environment in terms of energyand exergy utilization and carbon dioxide emission. There are three different energy utilization mech-anisms in food production: Utilization of solar energy by plants to produce agricultural goods; feedconsumption by herbivores to produce meat and milk; fossil fuel consumption by industrial processes toperform mixing, cooling, heating, etc. Production of strawberry-flavored yogurt, which involves thesethree mechanisms, is investigated here thermodynamically. Analysis starts with the cultivation of theingredients and ends with the transfer of the final product to the market. The results show that 53% ofthe total exergy loss occurs during the milk production and 80% of the total work input is consumedduring the plain yogurt making. The cumulative degree of perfection is 3.6% for the strawberry-flavoredyogurt. This value can rise up to 4.6%, if renewable energy resources like hydropower and algal biodieselare employed instead of fossil fuels. This paper points the direction for the development of new tech-nology in food processing to decrease waste of energy and carbon dioxide accumulation in theatmosphere.
� 2012 Elsevier Ltd. All rights reserved.
1. Introduction
Scarcity of energy resources and carbon dioxide concentrationin the atmosphere are two major concerns of humanity. Since thebeginning of the industrial revolution in 1850’s, energy demand isrising, resources are diminishing and carbon dioxide concentrationin the atmosphere is increasing. Consequences are publicly blamedfor numerous environmental and climatic adverse observations.Increasing thermodynamic efficiency and decreasing CO2 emissionare essential. This paper illustrates the importance of a detailedthermodynamic analysis for a food production process. Thestrawberry-flavored yogurt production process is selected as anexample, since it involves three important stages: agriculture, dairyfarming, and industrial processes. Plants take energy froma renewable source, i.e. sun, and perform photosynthesis. Theenvironmental cost for the agriculture is only due to theconsumption of non-renewables, such as fertilizers, microelementsand diesel consumed by farming machinery. Herbivores takeenergy from plant-based feed and use this energy for growth,
ax: þ90 216 578 04 00.(E. Sorgüven), mozilgen@
All rights reserved.
locomotion, heat transfer, etc. In the case of calves, a small part ofthe intake energy is used for lactation, too. Industrial processesmainly consume fossil fuels; thus, the environmental cost of theseoperations is rather large. This paper shows the thermodynamicaldifferences between the consumption of renewables and non-renewables by plants through photosynthesis, by calves tosynthesize milk, and by industrial processes like mixing, refriger-ation, transportation etc.
Energy utilization to produce several food products had beenthe subject of some studies in the past. However, the overallproduction process of flavored yogurt had never been a subject ofsuch a study before. The exergy loss and carbon dioxide emissionwas not a part of previous studies either. This paper presentsa unique approach, where the energy utilization, the carbondioxide emission, and the exergy loss are calculated for a foodproduct starting with the cultivation of the ingredients in the farm,and ending with the transfer of the final product to the market.
2. Methods
Fig. 1 shows the system chosen for the analysis. Systemboundaries involvemilk production in the dairy farm, agriculture ofstrawberry and sugar beet, industrial processes to produce milk
Nomenclature
b Stream availability, kJ/kmolCDP Cumulative degree of perfection, eCCO2E Cumulative carbon dioxide emission, kg/tonCEnC Cumulative energy consumption, MJ/tonCExC Cumulative exergy consumption, MJ/tonh Enthalpy, kJ/kmolm mass, kgQ Heat, kJs Entropy, kJ/(kmol K)T Temperature, KW Work output from the system, kJx Molar fractionX Exergy, kJ
Subscripts0 Restricted dead statei Any speciesin Inletk Index of heat sourcesout Outlet
Superscriptsth Thermomechanicalch Chemical
E. Sorgüven, M. Özilgen / Energy 40 (2012) 214e225 215
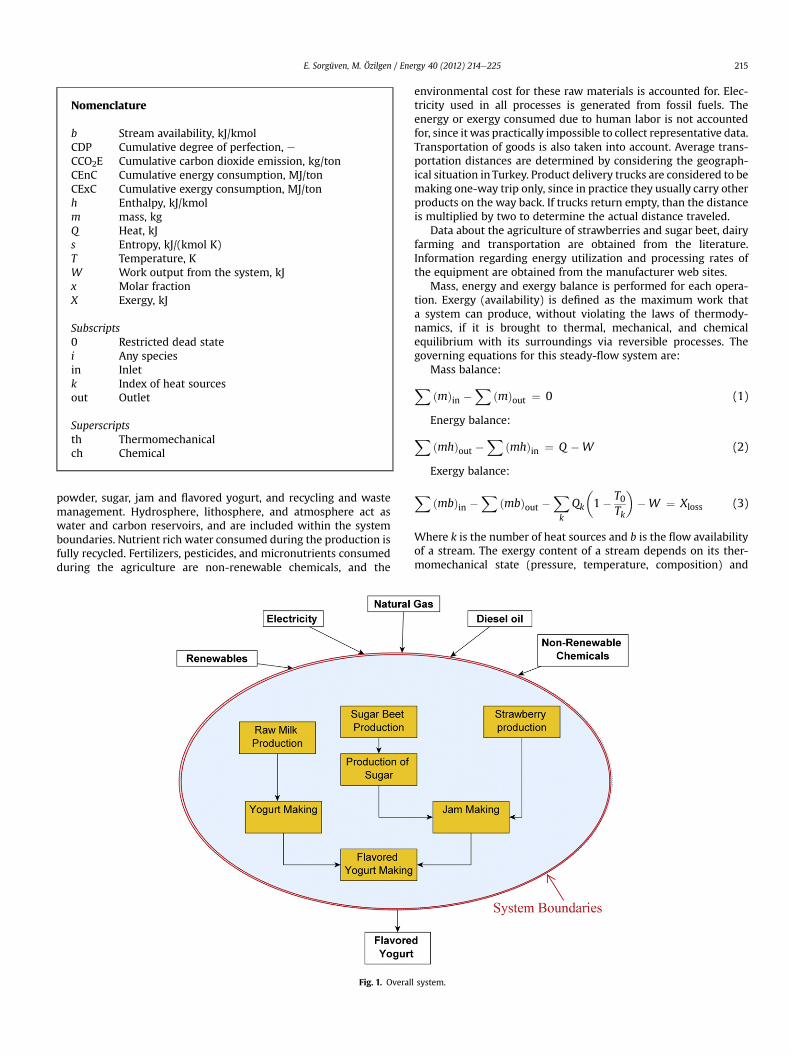
powder, sugar, jam and flavored yogurt, and recycling and wastemanagement. Hydrosphere, lithosphere, and atmosphere act aswater and carbon reservoirs, and are included within the systemboundaries. Nutrient rich water consumed during the production isfully recycled. Fertilizers, pesticides, and micronutrients consumedduring the agriculture are non-renewable chemicals, and the
Fig. 1. Overal
environmental cost for these raw materials is accounted for. Elec-tricity used in all processes is generated from fossil fuels. Theenergy or exergy consumed due to human labor is not accountedfor, since it was practically impossible to collect representative data.Transportation of goods is also taken into account. Average trans-portation distances are determined by considering the geograph-ical situation in Turkey. Product delivery trucks are considered to bemaking one-way trip only, since in practice they usually carry otherproducts on the way back. If trucks return empty, than the distanceis multiplied by two to determine the actual distance traveled.
Data about the agriculture of strawberries and sugar beet, dairyfarming and transportation are obtained from the literature.Information regarding energy utilization and processing rates ofthe equipment are obtained from the manufacturer web sites.
Mass, energy and exergy balance is performed for each opera-tion. Exergy (availability) is defined as the maximum work thata system can produce, without violating the laws of thermody-namics, if it is brought to thermal, mechanical, and chemicalequilibrium with its surroundings via reversible processes. Thegoverning equations for this steady-flow system are:
Mass balance:X
ðmÞin �X
ðmÞout ¼ 0 (1)
Energy balance:X
ðmhÞout �X
ðmhÞin ¼ Q �W (2)
Exergy balance:
XðmbÞin �
XðmbÞout �
Xk
Qk
�1� T0
Tk
��W ¼ Xloss (3)
Where k is the number of heat sources and b is the flow availabilityof a stream. The exergy content of a stream depends on its ther-momechanical state (pressure, temperature, composition) and
l system.
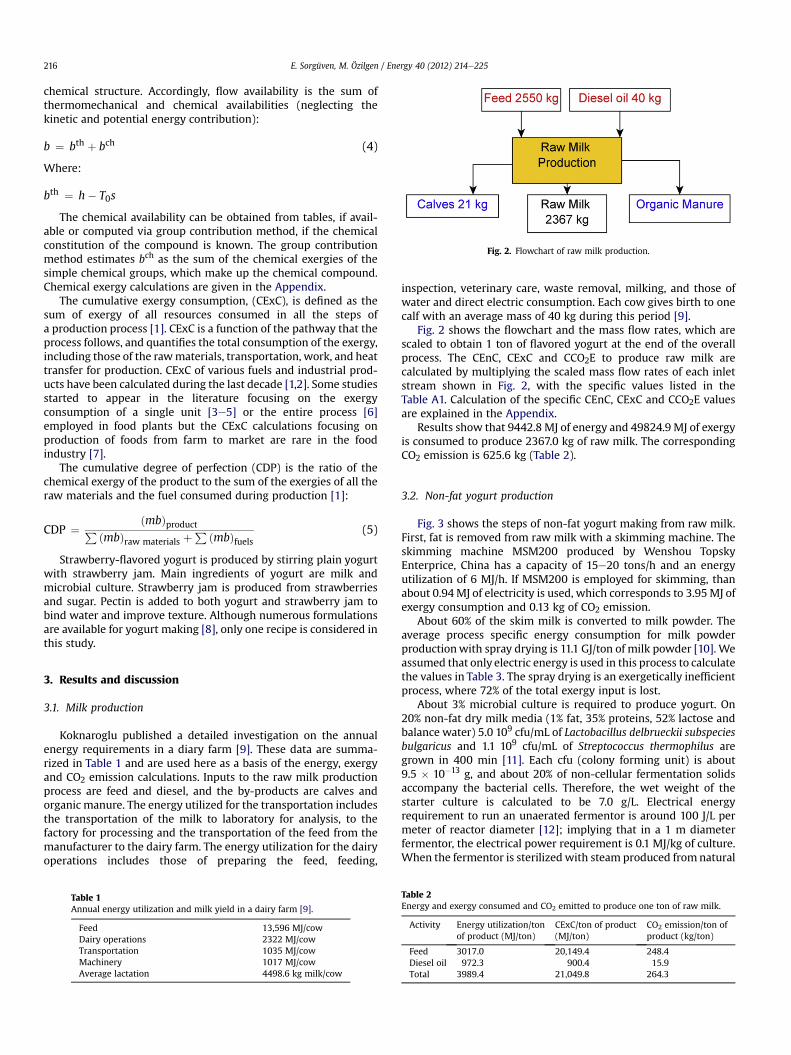
Fig. 2. Flowchart of raw milk production.
E. Sorgüven, M. Özilgen / Energy 40 (2012) 214e225216
chemical structure. Accordingly, flow availability is the sum ofthermomechanical and chemical availabilities (neglecting thekinetic and potential energy contribution):
b ¼ bth þ bch (4)
Where:
bth ¼ h� T0s
The chemical availability can be obtained from tables, if avail-able or computed via group contribution method, if the chemicalconstitution of the compound is known. The group contributionmethod estimates bch as the sum of the chemical exergies of thesimple chemical groups, which make up the chemical compound.Chemical exergy calculations are given in the Appendix.
The cumulative exergy consumption, (CExC), is defined as thesum of exergy of all resources consumed in all the steps ofa production process [1]. CExC is a function of the pathway that theprocess follows, and quantifies the total consumption of the exergy,including those of the rawmaterials, transportation, work, and heattransfer for production. CExC of various fuels and industrial prod-ucts have been calculated during the last decade [1,2]. Some studiesstarted to appear in the literature focusing on the exergyconsumption of a single unit [3e5] or the entire process [6]employed in food plants but the CExC calculations focusing onproduction of foods from farm to market are rare in the foodindustry [7].
The cumulative degree of perfection (CDP) is the ratio of thechemical exergy of the product to the sum of the exergies of all theraw materials and the fuel consumed during production [1]:
CDP ¼ ðmbÞproductP ðmbÞraw materials þP ðmbÞfuels
(5)
Strawberry-flavored yogurt is produced by stirring plain yogurtwith strawberry jam. Main ingredients of yogurt are milk andmicrobial culture. Strawberry jam is produced from strawberriesand sugar. Pectin is added to both yogurt and strawberry jam tobind water and improve texture. Although numerous formulationsare available for yogurt making [8], only one recipe is considered inthis study.
3. Results and discussion
3.1. Milk production
Koknaroglu published a detailed investigation on the annualenergy requirements in a diary farm [9]. These data are summa-rized in Table 1 and are used here as a basis of the energy, exergyand CO2 emission calculations. Inputs to the raw milk productionprocess are feed and diesel, and the by-products are calves andorganic manure. The energy utilized for the transportation includesthe transportation of the milk to laboratory for analysis, to thefactory for processing and the transportation of the feed from themanufacturer to the dairy farm. The energy utilization for the dairyoperations includes those of preparing the feed, feeding,
Table 1Annual energy utilization and milk yield in a dairy farm [9].
Feed 13,596 MJ/cowDairy operations 2322 MJ/cowTransportation 1035 MJ/cowMachinery 1017 MJ/cowAverage lactation 4498.6 kg milk/cow
inspection, veterinary care, waste removal, milking, and those ofwater and direct electric consumption. Each cow gives birth to onecalf with an average mass of 40 kg during this period [9].
Fig. 2 shows the flowchart and the mass flow rates, which arescaled to obtain 1 ton of flavored yogurt at the end of the overallprocess. The CEnC, CExC and CCO2E to produce raw milk arecalculated by multiplying the scaled mass flow rates of each inletstream shown in Fig. 2, with the specific values listed in theTable A1. Calculation of the specific CEnC, CExC and CCO2E valuesare explained in the Appendix.
Results show that 9442.8 MJ of energy and 49824.9 MJ of exergyis consumed to produce 2367.0 kg of raw milk. The correspondingCO2 emission is 625.6 kg (Table 2).
3.2. Non-fat yogurt production
Fig. 3 shows the steps of non-fat yogurt making from raw milk.First, fat is removed from raw milk with a skimming machine. Theskimming machine MSM200 produced by Wenshou TopskyEnterprice, China has a capacity of 15e20 tons/h and an energyutilization of 6 MJ/h. If MSM200 is employed for skimming, thanabout 0.94MJ of electricity is used, which corresponds to 3.95MJ ofexergy consumption and 0.13 kg of CO2 emission.
About 60% of the skim milk is converted to milk powder. Theaverage process specific energy consumption for milk powderproductionwith spray drying is 11.1 GJ/ton of milk powder [10]. Weassumed that only electric energy is used in this process to calculatethe values in Table 3. The spray drying is an exergetically inefficientprocess, where 72% of the total exergy input is lost.
About 3% microbial culture is required to produce yogurt. On20% non-fat dry milk media (1% fat, 35% proteins, 52% lactose andbalance water) 5.0 109 cfu/mL of Lactobacillus delbrueckii subspeciesbulgaricus and 1.1 109 cfu/mL of Streptococcus thermophilus aregrown in 400 min [11]. Each cfu (colony forming unit) is about9.5 � 10�13 g, and about 20% of non-cellular fermentation solidsaccompany the bacterial cells. Therefore, the wet weight of thestarter culture is calculated to be 7.0 g/L. Electrical energyrequirement to run an unaerated fermentor is around 100 J/L permeter of reactor diameter [12]; implying that in a 1 m diameterfermentor, the electrical power requirement is 0.1 MJ/kg of culture.When the fermentor is sterilized with steam produced fromnatural
Table 2Energy and exergy consumed and CO2 emitted to produce one ton of raw milk.
Activity Energy utilization/tonof product (MJ/ton)
CExC/ton of product(MJ/ton)
CO2 emission/ton ofproduct (kg/ton)
Feed 3017.0 20,149.4 248.4Diesel oil 972.3 900.4 15.9Total 3989.4 21,049.8 264.3
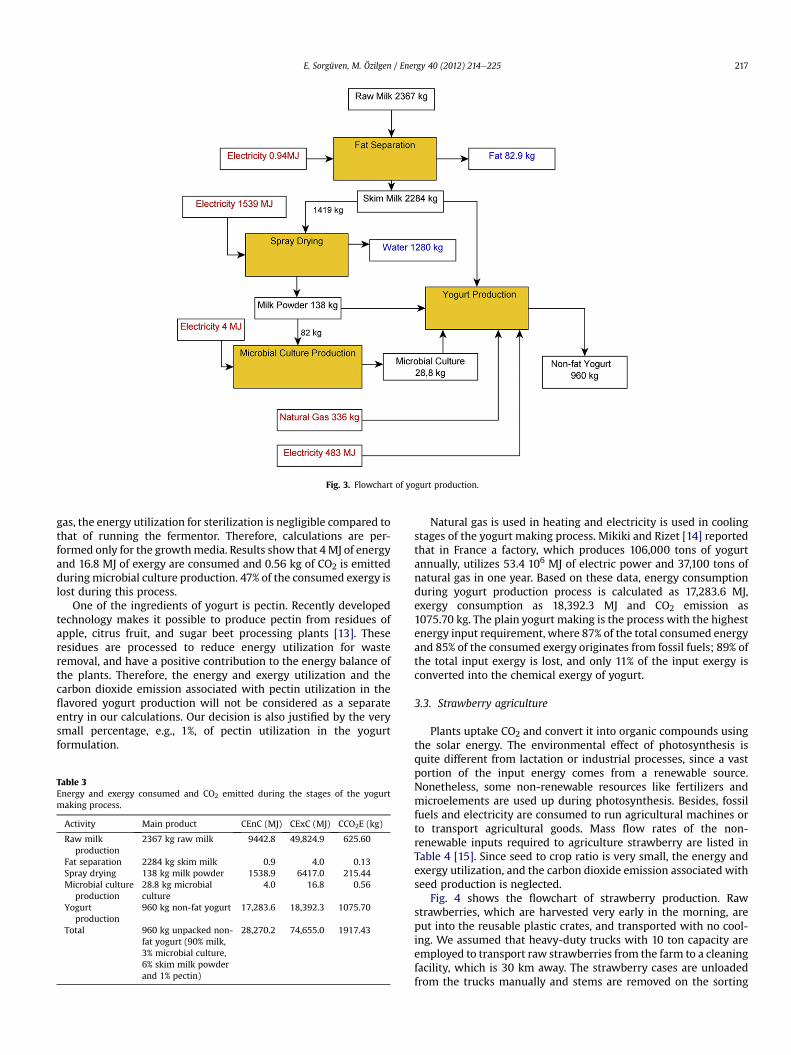
Fig. 3. Flowchart of yogurt production.
E. Sorgüven, M. Özilgen / Energy 40 (2012) 214e225 217
gas, the energy utilization for sterilization is negligible compared tothat of running the fermentor. Therefore, calculations are per-formed only for the growthmedia. Results show that 4MJ of energyand 16.8 MJ of exergy are consumed and 0.56 kg of CO2 is emittedduringmicrobial culture production. 47% of the consumed exergy islost during this process.
One of the ingredients of yogurt is pectin. Recently developedtechnology makes it possible to produce pectin from residues ofapple, citrus fruit, and sugar beet processing plants [13]. Theseresidues are processed to reduce energy utilization for wasteremoval, and have a positive contribution to the energy balance ofthe plants. Therefore, the energy and exergy utilization and thecarbon dioxide emission associated with pectin utilization in theflavored yogurt production will not be considered as a separateentry in our calculations. Our decision is also justified by the verysmall percentage, e.g., 1%, of pectin utilization in the yogurtformulation.
Table 3Energy and exergy consumed and CO2 emitted during the stages of the yogurtmaking process.
Activity Main product CEnC (MJ) CExC (MJ) CCO2E (kg)
Raw milkproduction
2367 kg raw milk 9442.8 49,824.9 625.60
Fat separation 2284 kg skim milk 0.9 4.0 0.13Spray drying 138 kg milk powder 1538.9 6417.0 215.44Microbial culture
production28.8 kg microbialculture
4.0 16.8 0.56
Yogurtproduction
960 kg non-fat yogurt 17,283.6 18,392.3 1075.70
Total 960 kg unpacked non-fat yogurt (90% milk,3% microbial culture,6% skim milk powderand 1% pectin)
28,270.2 74,655.0 1917.43
Natural gas is used in heating and electricity is used in coolingstages of the yogurt making process. Mikiki and Rizet [14] reportedthat in France a factory, which produces 106,000 tons of yogurtannually, utilizes 53.4 106 MJ of electric power and 37,100 tons ofnatural gas in one year. Based on these data, energy consumptionduring yogurt production process is calculated as 17,283.6 MJ,exergy consumption as 18,392.3 MJ and CO2 emission as1075.70 kg. The plain yogurt making is the process with the highestenergy input requirement, where 87% of the total consumed energyand 85% of the consumed exergy originates from fossil fuels; 89% ofthe total input exergy is lost, and only 11% of the input exergy isconverted into the chemical exergy of yogurt.
3.3. Strawberry agriculture
Plants uptake CO2 and convert it into organic compounds usingthe solar energy. The environmental effect of photosynthesis isquite different from lactation or industrial processes, since a vastportion of the input energy comes from a renewable source.Nonetheless, some non-renewable resources like fertilizers andmicroelements are used up during photosynthesis. Besides, fossilfuels and electricity are consumed to run agricultural machines orto transport agricultural goods. Mass flow rates of the non-renewable inputs required to agriculture strawberry are listed inTable 4 [15]. Since seed to crop ratio is very small, the energy andexergy utilization, and the carbon dioxide emission associated withseed production is neglected.
Fig. 4 shows the flowchart of strawberry production. Rawstrawberries, which are harvested very early in the morning, areput into the reusable plastic crates, and transported with no cool-ing. We assumed that heavy-duty trucks with 10 ton capacity areemployed to transport raw strawberries from the farm to a cleaningfacility, which is 30 km away. The strawberry cases are unloadedfrom the trucks manually and stems are removed on the sorting
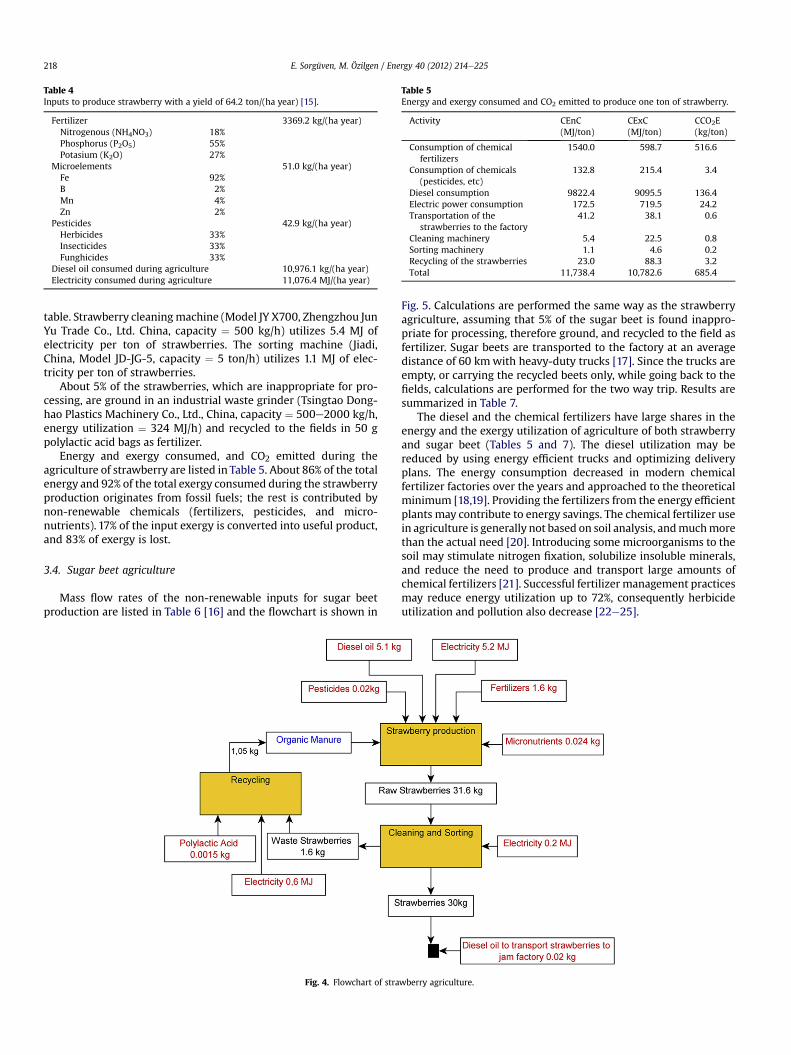
Table 4Inputs to produce strawberry with a yield of 64.2 ton/(ha year) [15].
Fertilizer 3369.2 kg/(ha year)Nitrogenous (NH4NO3) 18%Phosphorus (P2O5) 55%Potasium (K2O) 27%
Microelements 51.0 kg/(ha year)Fe 92%B 2%Mn 4%Zn 2%
Pesticides 42.9 kg/(ha year)Herbicides 33%Insecticides 33%Funghicides 33%
Diesel oil consumed during agriculture 10,976.1 kg/(ha year)Electricity consumed during agriculture 11,076.4 MJ/(ha year)
Table 5Energy and exergy consumed and CO2 emitted to produce one ton of strawberry.
Activity CEnC(MJ/ton)
CExC(MJ/ton)
CCO2E(kg/ton)
Consumption of chemicalfertilizers
1540.0 598.7 516.6
Consumption of chemicals(pesticides, etc)
132.8 215.4 3.4
Diesel consumption 9822.4 9095.5 136.4Electric power consumption 172.5 719.5 24.2Transportation of the
strawberries to the factory41.2 38.1 0.6
Cleaning machinery 5.4 22.5 0.8Sorting machinery 1.1 4.6 0.2Recycling of the strawberries 23.0 88.3 3.2Total 11,738.4 10,782.6 685.4
E. Sorgüven, M. Özilgen / Energy 40 (2012) 214e225218
table. Strawberry cleaningmachine (Model JY X700, Zhengzhou JunYu Trade Co., Ltd. China, capacity ¼ 500 kg/h) utilizes 5.4 MJ ofelectricity per ton of strawberries. The sorting machine (Jiadi,China, Model JD-JG-5, capacity ¼ 5 ton/h) utilizes 1.1 MJ of elec-tricity per ton of strawberries.
About 5% of the strawberries, which are inappropriate for pro-cessing, are ground in an industrial waste grinder (Tsingtao Dong-hao Plastics Machinery Co., Ltd., China, capacity ¼ 500e2000 kg/h,energy utilization ¼ 324 MJ/h) and recycled to the fields in 50 gpolylactic acid bags as fertilizer.
Energy and exergy consumed, and CO2 emitted during theagriculture of strawberry are listed in Table 5. About 86% of the totalenergy and 92% of the total exergy consumed during the strawberryproduction originates from fossil fuels; the rest is contributed bynon-renewable chemicals (fertilizers, pesticides, and micro-nutrients). 17% of the input exergy is converted into useful product,and 83% of exergy is lost.
3.4. Sugar beet agriculture
Mass flow rates of the non-renewable inputs for sugar beetproduction are listed in Table 6 [16] and the flowchart is shown in
Fig. 4. Flowchart of stra
Fig. 5. Calculations are performed the same way as the strawberryagriculture, assuming that 5% of the sugar beet is found inappro-priate for processing, therefore ground, and recycled to the field asfertilizer. Sugar beets are transported to the factory at an averagedistance of 60 kmwith heavy-duty trucks [17]. Since the trucks areempty, or carrying the recycled beets only, while going back to thefields, calculations are performed for the two way trip. Results aresummarized in Table 7.
The diesel and the chemical fertilizers have large shares in theenergy and the exergy utilization of agriculture of both strawberryand sugar beet (Tables 5 and 7). The diesel utilization may bereduced by using energy efficient trucks and optimizing deliveryplans. The energy consumption decreased in modern chemicalfertilizer factories over the years and approached to the theoreticalminimum [18,19]. Providing the fertilizers from the energy efficientplants may contribute to energy savings. The chemical fertilizer usein agriculture is generally not based on soil analysis, andmuchmorethan the actual need [20]. Introducing some microorganisms to thesoil may stimulate nitrogen fixation, solubilize insoluble minerals,and reduce the need to produce and transport large amounts ofchemical fertilizers [21]. Successful fertilizer management practicesmay reduce energy utilization up to 72%, consequently herbicideutilization and pollution also decrease [22e25].
wberry agriculture.
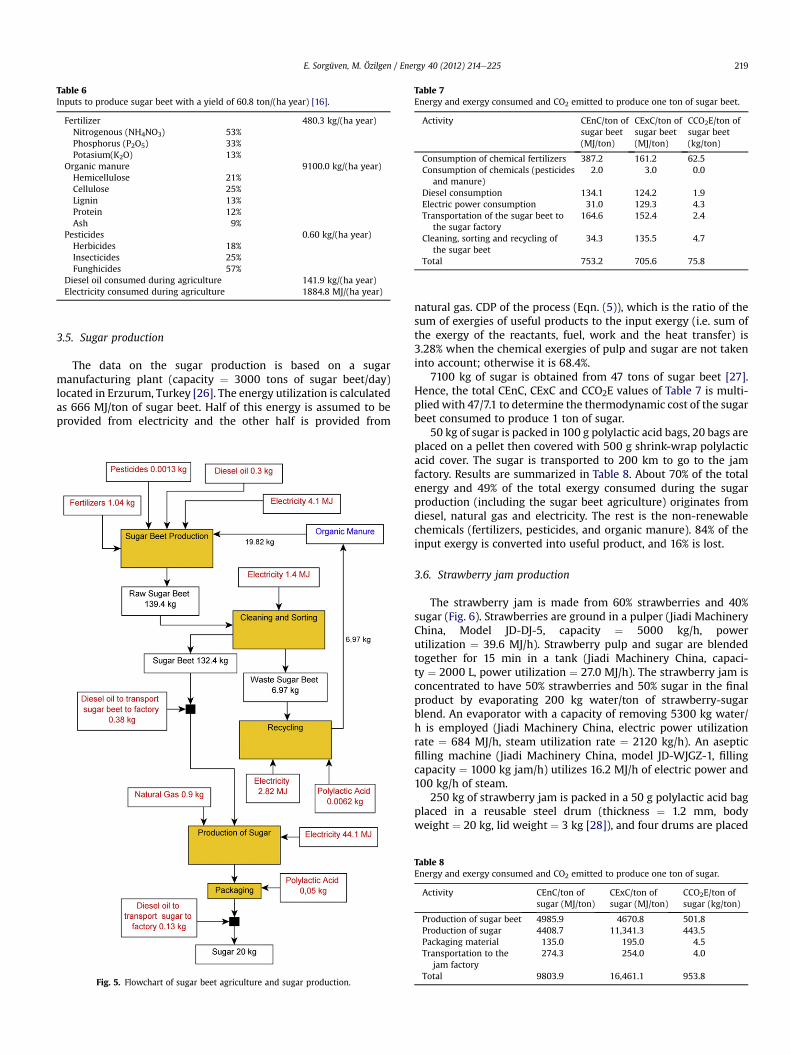
Table 6Inputs to produce sugar beet with a yield of 60.8 ton/(ha year) [16].
Fertilizer 480.3 kg/(ha year)Nitrogenous (NH4NO3) 53%Phosphorus (P2O5) 33%Potasium(K2O) 13%
Organic manure 9100.0 kg/(ha year)Hemicellulose 21%Cellulose 25%Lignin 13%Protein 12%Ash 9%
Pesticides 0.60 kg/(ha year)Herbicides 18%Insecticides 25%Funghicides 57%
Diesel oil consumed during agriculture 141.9 kg/(ha year)Electricity consumed during agriculture 1884.8 MJ/(ha year)
Table 7Energy and exergy consumed and CO2 emitted to produce one ton of sugar beet.
Activity CEnC/ton ofsugar beet(MJ/ton)
CExC/ton ofsugar beet(MJ/ton)
CCO2E/ton ofsugar beet(kg/ton)
Consumption of chemical fertilizers 387.2 161.2 62.5Consumption of chemicals (pesticides
and manure)2.0 3.0 0.0
Diesel consumption 134.1 124.2 1.9Electric power consumption 31.0 129.3 4.3Transportation of the sugar beet to
the sugar factory164.6 152.4 2.4
Cleaning, sorting and recycling ofthe sugar beet
34.3 135.5 4.7
Total 753.2 705.6 75.8
E. Sorgüven, M. Özilgen / Energy 40 (2012) 214e225 219
3.5. Sugar production
The data on the sugar production is based on a sugarmanufacturing plant (capacity ¼ 3000 tons of sugar beet/day)located in Erzurum, Turkey [26]. The energy utilization is calculatedas 666 MJ/ton of sugar beet. Half of this energy is assumed to beprovided from electricity and the other half is provided from
Fig. 5. Flowchart of sugar beet agriculture and sugar production.
natural gas. CDP of the process (Eqn. (5)), which is the ratio of thesum of exergies of useful products to the input exergy (i.e. sum ofthe exergy of the reactants, fuel, work and the heat transfer) is3.28% when the chemical exergies of pulp and sugar are not takeninto account; otherwise it is 68.4%.
7100 kg of sugar is obtained from 47 tons of sugar beet [27].Hence, the total CEnC, CExC and CCO2E values of Table 7 is multi-plied with 47/7.1 to determine the thermodynamic cost of the sugarbeet consumed to produce 1 ton of sugar.
50 kg of sugar is packed in 100 g polylactic acid bags, 20 bags areplaced on a pellet then covered with 500 g shrink-wrap polylacticacid cover. The sugar is transported to 200 km to go to the jamfactory. Results are summarized in Table 8. About 70% of the totalenergy and 49% of the total exergy consumed during the sugarproduction (including the sugar beet agriculture) originates fromdiesel, natural gas and electricity. The rest is the non-renewablechemicals (fertilizers, pesticides, and organic manure). 84% of theinput exergy is converted into useful product, and 16% is lost.
3.6. Strawberry jam production
The strawberry jam is made from 60% strawberries and 40%sugar (Fig. 6). Strawberries are ground in a pulper (Jiadi MachineryChina, Model JD-DJ-5, capacity ¼ 5000 kg/h, powerutilization ¼ 39.6 MJ/h). Strawberry pulp and sugar are blendedtogether for 15 min in a tank (Jiadi Machinery China, capaci-ty ¼ 2000 L, power utilization ¼ 27.0 MJ/h). The strawberry jam isconcentrated to have 50% strawberries and 50% sugar in the finalproduct by evaporating 200 kg water/ton of strawberry-sugarblend. An evaporator with a capacity of removing 5300 kg water/h is employed (Jiadi Machinery China, electric power utilizationrate ¼ 684 MJ/h, steam utilization rate ¼ 2120 kg/h). An asepticfilling machine (Jiadi Machinery China, model JD-WJGZ-1, fillingcapacity ¼ 1000 kg jam/h) utilizes 16.2 MJ/h of electric power and100 kg/h of steam.
250 kg of strawberry jam is packed in a 50 g polylactic acid bagplaced in a reusable steel drum (thickness ¼ 1.2 mm, bodyweight ¼ 20 kg, lid weight ¼ 3 kg [28]), and four drums are placed
Table 8Energy and exergy consumed and CO2 emitted to produce one ton of sugar.
Activity CEnC/ton ofsugar (MJ/ton)
CExC/ton ofsugar (MJ/ton)
CCO2E/ton ofsugar (kg/ton)
Production of sugar beet 4985.9 4670.8 501.8Production of sugar 4408.7 11,341.3 443.5Packaging material 135.0 195.0 4.5Transportation to the
jam factory274.3 254.0 4.0
Total 9803.9 16,461.1 953.8
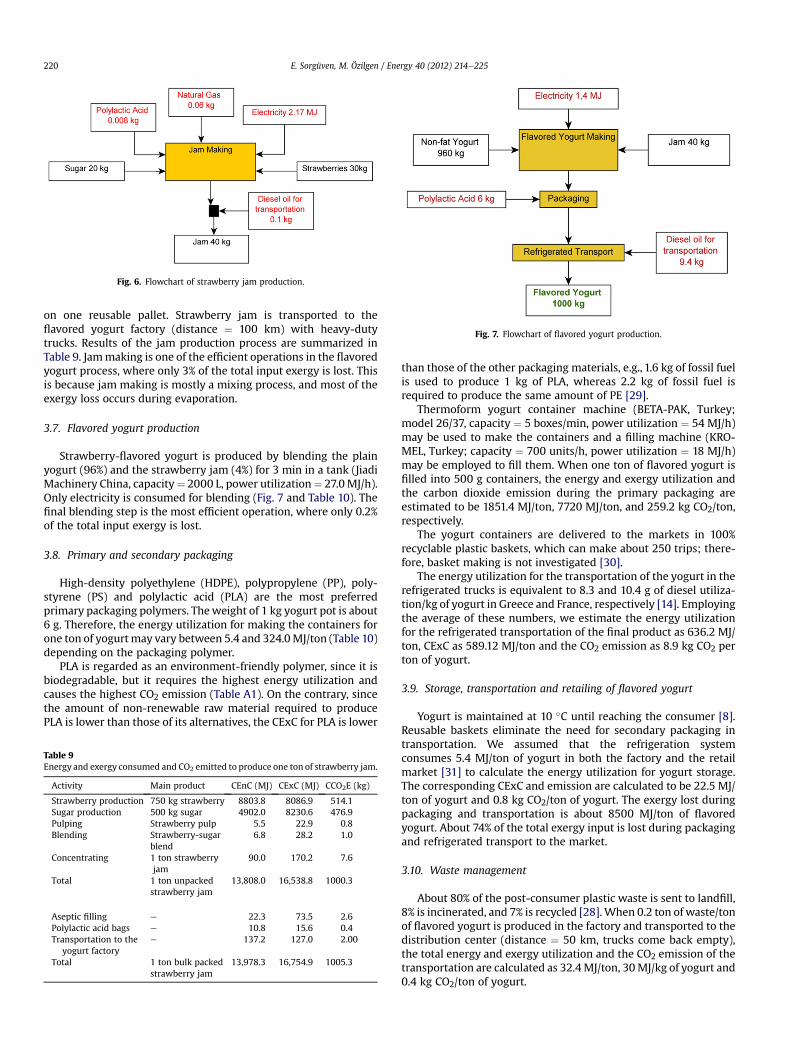
Fig. 6. Flowchart of strawberry jam production.
Fig. 7. Flowchart of flavored yogurt production.
E. Sorgüven, M. Özilgen / Energy 40 (2012) 214e225220
on one reusable pallet. Strawberry jam is transported to theflavored yogurt factory (distance ¼ 100 km) with heavy-dutytrucks. Results of the jam production process are summarized inTable 9. Jammaking is one of the efficient operations in the flavoredyogurt process, where only 3% of the total input exergy is lost. Thisis because jam making is mostly a mixing process, and most of theexergy loss occurs during evaporation.
3.7. Flavored yogurt production
Strawberry-flavored yogurt is produced by blending the plainyogurt (96%) and the strawberry jam (4%) for 3 min in a tank (JiadiMachinery China, capacity¼ 2000 L, power utilization¼ 27.0MJ/h).Only electricity is consumed for blending (Fig. 7 and Table 10). Thefinal blending step is the most efficient operation, where only 0.2%of the total input exergy is lost.
3.8. Primary and secondary packaging
High-density polyethylene (HDPE), polypropylene (PP), poly-styrene (PS) and polylactic acid (PLA) are the most preferredprimary packaging polymers. Theweight of 1 kg yogurt pot is about6 g. Therefore, the energy utilization for making the containers forone ton of yogurtmay vary between 5.4 and 324.0MJ/ton (Table 10)depending on the packaging polymer.
PLA is regarded as an environment-friendly polymer, since it isbiodegradable, but it requires the highest energy utilization andcauses the highest CO2 emission (Table A1). On the contrary, sincethe amount of non-renewable raw material required to producePLA is lower than those of its alternatives, the CExC for PLA is lower
Table 9Energy and exergy consumed and CO2 emitted to produce one ton of strawberry jam.
Activity Main product CEnC (MJ) CExC (MJ) CCO2E (kg)
Strawberry production 750 kg strawberry 8803.8 8086.9 514.1Sugar production 500 kg sugar 4902.0 8230.6 476.9Pulping Strawberry pulp 5.5 22.9 0.8Blending Strawberry-sugar
blend6.8 28.2 1.0
Concentrating 1 ton strawberryjam
90.0 170.2 7.6
Total 1 ton unpackedstrawberry jam
13,808.0 16,538.8 1000.3
Aseptic filling e 22.3 73.5 2.6Polylactic acid bags e 10.8 15.6 0.4Transportation to the
yogurt factorye 137.2 127.0 2.00
Total 1 ton bulk packedstrawberry jam
13,978.3 16,754.9 1005.3
than those of the other packaging materials, e.g., 1.6 kg of fossil fuelis used to produce 1 kg of PLA, whereas 2.2 kg of fossil fuel isrequired to produce the same amount of PE [29].
Thermoform yogurt container machine (BETA-PAK, Turkey;model 26/37, capacity ¼ 5 boxes/min, power utilization ¼ 54 MJ/h)may be used to make the containers and a filling machine (KRO-MEL, Turkey; capacity ¼ 700 units/h, power utilization ¼ 18 MJ/h)may be employed to fill them. When one ton of flavored yogurt isfilled into 500 g containers, the energy and exergy utilization andthe carbon dioxide emission during the primary packaging areestimated to be 1851.4 MJ/ton, 7720 MJ/ton, and 259.2 kg CO2/ton,respectively.
The yogurt containers are delivered to the markets in 100%recyclable plastic baskets, which can make about 250 trips; there-fore, basket making is not investigated [30].
The energy utilization for the transportation of the yogurt in therefrigerated trucks is equivalent to 8.3 and 10.4 g of diesel utiliza-tion/kg of yogurt in Greece and France, respectively [14]. Employingthe average of these numbers, we estimate the energy utilizationfor the refrigerated transportation of the final product as 636.2 MJ/ton, CExC as 589.12 MJ/ton and the CO2 emission as 8.9 kg CO2 perton of yogurt.
3.9. Storage, transportation and retailing of flavored yogurt
Yogurt is maintained at 10 �C until reaching the consumer [8].Reusable baskets eliminate the need for secondary packaging intransportation. We assumed that the refrigeration systemconsumes 5.4 MJ/ton of yogurt in both the factory and the retailmarket [31] to calculate the energy utilization for yogurt storage.The corresponding CExC and emission are calculated to be 22.5 MJ/ton of yogurt and 0.8 kg CO2/ton of yogurt. The exergy lost duringpackaging and transportation is about 8500 MJ/ton of flavoredyogurt. About 74% of the total exergy input is lost during packagingand refrigerated transport to the market.
3.10. Waste management
About 80% of the post-consumer plastic waste is sent to landfill,8% is incinerated, and 7% is recycled [28].When 0.2 ton of waste/tonof flavored yogurt is produced in the factory and transported to thedistribution center (distance ¼ 50 km, trucks come back empty),the total energy and exergy utilization and the CO2 emission of thetransportation are calculated as 32.4MJ/ton, 30MJ/kg of yogurt and0.4 kg CO2/ton of yogurt.
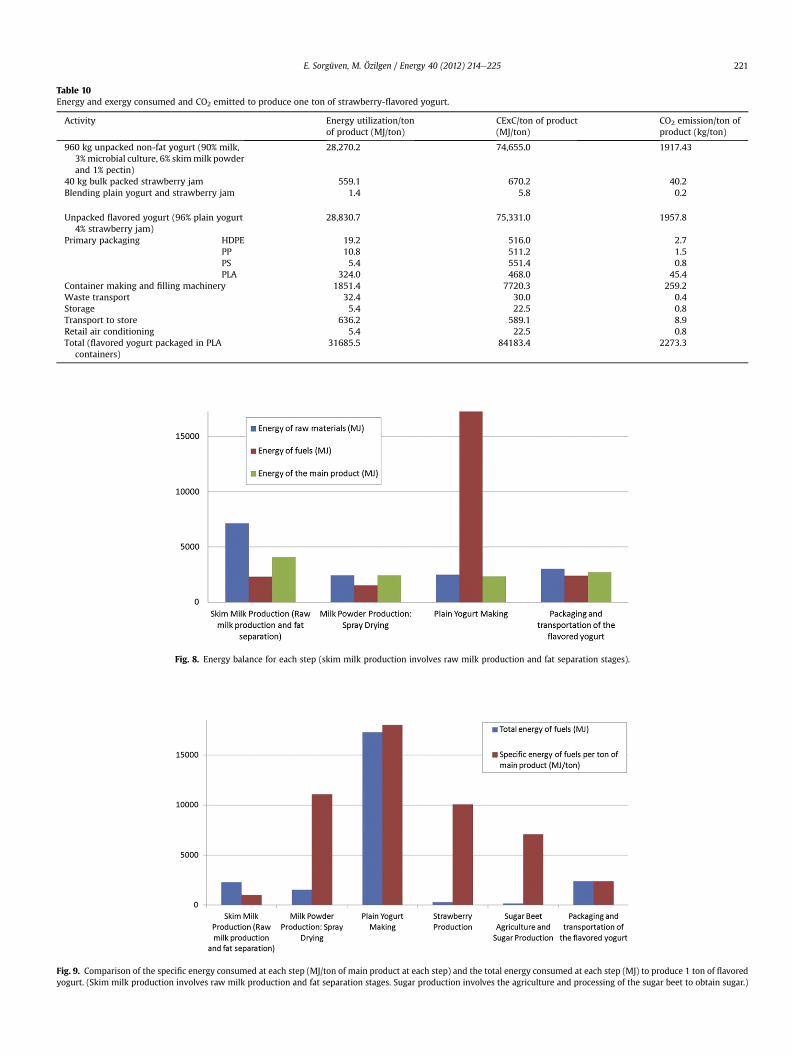
Table 10Energy and exergy consumed and CO2 emitted to produce one ton of strawberry-flavored yogurt.
Activity Energy utilization/tonof product (MJ/ton)
CExC/ton of product(MJ/ton)
CO2 emission/ton ofproduct (kg/ton)
960 kg unpacked non-fat yogurt (90% milk,3%microbial culture, 6% skimmilk powderand 1% pectin)
28,270.2 74,655.0 1917.43
40 kg bulk packed strawberry jam 559.1 670.2 40.2Blending plain yogurt and strawberry jam 1.4 5.8 0.2
Unpacked flavored yogurt (96% plain yogurt4% strawberry jam)
28,830.7 75,331.0 1957.8
Primary packaging HDPE 19.2 516.0 2.7PP 10.8 511.2 1.5PS 5.4 551.4 0.8PLA 324.0 468.0 45.4
Container making and filling machinery 1851.4 7720.3 259.2Waste transport 32.4 30.0 0.4Storage 5.4 22.5 0.8Transport to store 636.2 589.1 8.9Retail air conditioning 5.4 22.5 0.8Total (flavored yogurt packaged in PLA
containers)31685.5 84183.4 2273.3
Fig. 8. Energy balance for each step (skim milk production involves raw milk production and fat separation stages).
Fig. 9. Comparison of the specific energy consumed at each step (MJ/ton of main product at each step) and the total energy consumed at each step (MJ) to produce 1 ton of flavoredyogurt. (Skim milk production involves raw milk production and fat separation stages. Sugar production involves the agriculture and processing of the sugar beet to obtain sugar.)
E. Sorgüven, M. Özilgen / Energy 40 (2012) 214e225 221
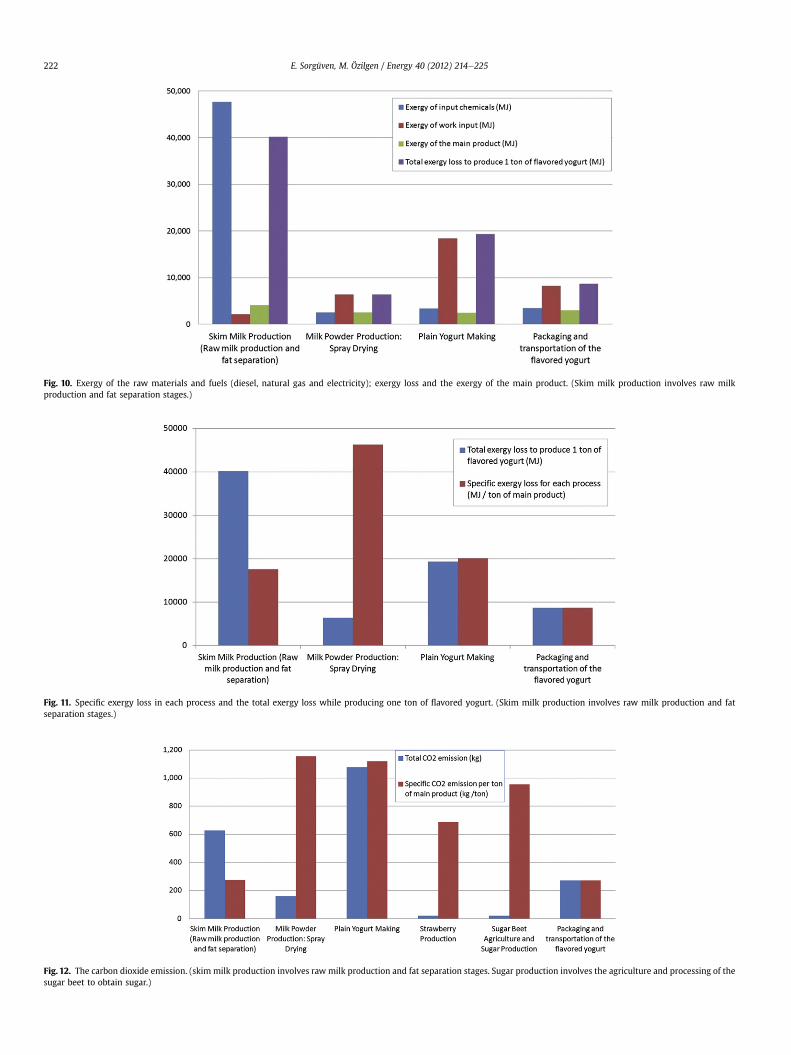
Fig. 10. Exergy of the raw materials and fuels (diesel, natural gas and electricity); exergy loss and the exergy of the main product. (Skim milk production involves raw milkproduction and fat separation stages.)
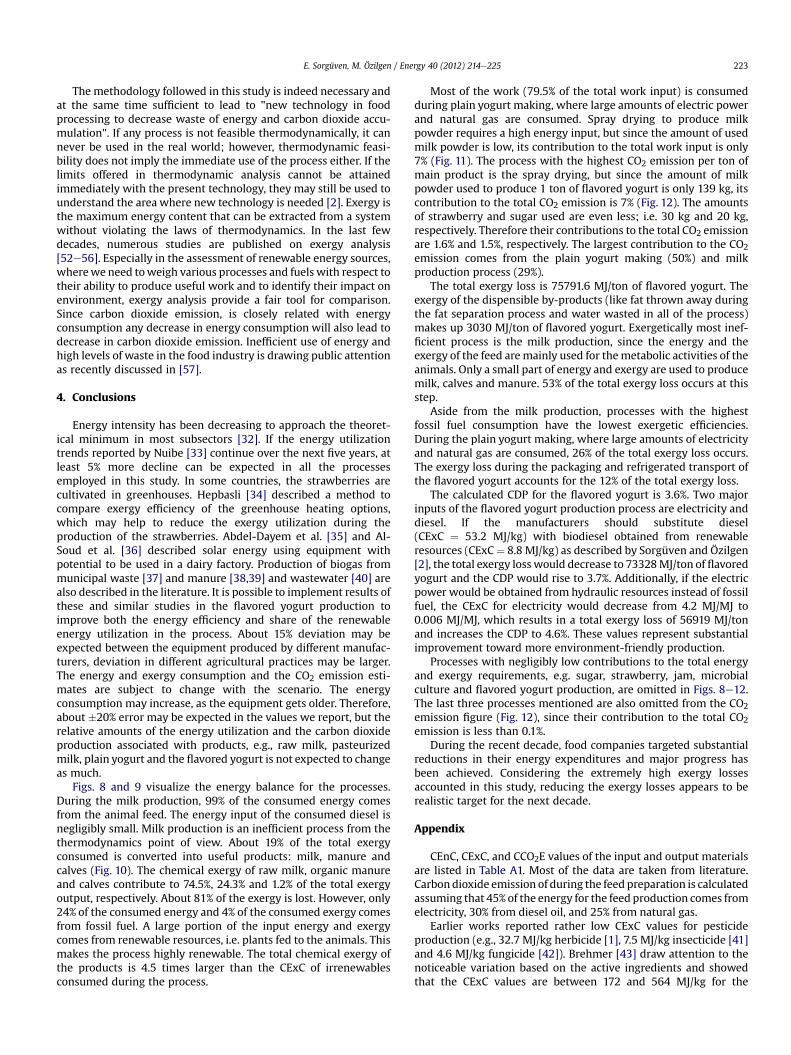
Fig. 11. Specific exergy loss in each process and the total exergy loss while producing one ton of flavored yogurt. (Skim milk production involves raw milk production and fatseparation stages.)
Fig. 12. The carbon dioxide emission. (skim milk production involves raw milk production and fat separation stages. Sugar production involves the agriculture and processing of thesugar beet to obtain sugar.)
E. Sorgüven, M. Özilgen / Energy 40 (2012) 214e225222
E. Sorgüven, M. Özilgen / Energy 40 (2012) 214e225 223
The methodology followed in this study is indeed necessary andat the same time sufficient to lead to "new technology in foodprocessing to decrease waste of energy and carbon dioxide accu-mulation". If any process is not feasible thermodynamically, it cannever be used in the real world; however, thermodynamic feasi-bility does not imply the immediate use of the process either. If thelimits offered in thermodynamic analysis cannot be attainedimmediately with the present technology, they may still be used tounderstand the area where new technology is needed [2]. Exergy isthe maximum energy content that can be extracted from a systemwithout violating the laws of thermodynamics. In the last fewdecades, numerous studies are published on exergy analysis[52e56]. Especially in the assessment of renewable energy sources,wherewe need toweigh various processes and fuels with respect totheir ability to produce useful work and to identify their impact onenvironment, exergy analysis provide a fair tool for comparison.Since carbon dioxide emission, is closely related with energyconsumption any decrease in energy consumption will also lead todecrease in carbon dioxide emission. Inefficient use of energy andhigh levels of waste in the food industry is drawing public attentionas recently discussed in [57].
4. Conclusions
Energy intensity has been decreasing to approach the theoret-ical minimum in most subsectors [32]. If the energy utilizationtrends reported by Nuibe [33] continue over the next five years, atleast 5% more decline can be expected in all the processesemployed in this study. In some countries, the strawberries arecultivated in greenhouses. Hepbasli [34] described a method tocompare exergy efficiency of the greenhouse heating options,which may help to reduce the exergy utilization during theproduction of the strawberries. Abdel-Dayem et al. [35] and Al-Soud et al. [36] described solar energy using equipment withpotential to be used in a dairy factory. Production of biogas frommunicipal waste [37] and manure [38,39] and wastewater [40] arealso described in the literature. It is possible to implement results ofthese and similar studies in the flavored yogurt production toimprove both the energy efficiency and share of the renewableenergy utilization in the process. About 15% deviation may beexpected between the equipment produced by different manufac-turers, deviation in different agricultural practices may be larger.The energy and exergy consumption and the CO2 emission esti-mates are subject to change with the scenario. The energyconsumption may increase, as the equipment gets older. Therefore,about �20% error may be expected in the values we report, but therelative amounts of the energy utilization and the carbon dioxideproduction associated with products, e.g., raw milk, pasteurizedmilk, plain yogurt and the flavored yogurt is not expected to changeas much.
Figs. 8 and 9 visualize the energy balance for the processes.During the milk production, 99% of the consumed energy comesfrom the animal feed. The energy input of the consumed diesel isnegligibly small. Milk production is an inefficient process from thethermodynamics point of view. About 19% of the total exergyconsumed is converted into useful products: milk, manure andcalves (Fig. 10). The chemical exergy of raw milk, organic manureand calves contribute to 74.5%, 24.3% and 1.2% of the total exergyoutput, respectively. About 81% of the exergy is lost. However, only24% of the consumed energy and 4% of the consumed exergy comesfrom fossil fuel. A large portion of the input energy and exergycomes from renewable resources, i.e. plants fed to the animals. Thismakes the process highly renewable. The total chemical exergy ofthe products is 4.5 times larger than the CExC of irrenewablesconsumed during the process.
Most of the work (79.5% of the total work input) is consumedduring plain yogurt making, where large amounts of electric powerand natural gas are consumed. Spray drying to produce milkpowder requires a high energy input, but since the amount of usedmilk powder is low, its contribution to the total work input is only7% (Fig. 11). The process with the highest CO2 emission per ton ofmain product is the spray drying, but since the amount of milkpowder used to produce 1 ton of flavored yogurt is only 139 kg, itscontribution to the total CO2 emission is 7% (Fig. 12). The amountsof strawberry and sugar used are even less; i.e. 30 kg and 20 kg,respectively. Therefore their contributions to the total CO2 emissionare 1.6% and 1.5%, respectively. The largest contribution to the CO2emission comes from the plain yogurt making (50%) and milkproduction process (29%).
The total exergy loss is 75791.6 MJ/ton of flavored yogurt. Theexergy of the dispensible by-products (like fat thrown away duringthe fat separation process and water wasted in all of the process)makes up 3030 MJ/ton of flavored yogurt. Exergetically most inef-ficient process is the milk production, since the energy and theexergy of the feed are mainly used for themetabolic activities of theanimals. Only a small part of energy and exergy are used to producemilk, calves and manure. 53% of the total exergy loss occurs at thisstep.
Aside from the milk production, processes with the highestfossil fuel consumption have the lowest exergetic efficiencies.During the plain yogurt making, where large amounts of electricityand natural gas are consumed, 26% of the total exergy loss occurs.The exergy loss during the packaging and refrigerated transport ofthe flavored yogurt accounts for the 12% of the total exergy loss.
The calculated CDP for the flavored yogurt is 3.6%. Two majorinputs of the flavored yogurt production process are electricity anddiesel. If the manufacturers should substitute diesel(CExC ¼ 53.2 MJ/kg) with biodiesel obtained from renewableresources (CExC¼ 8.8 MJ/kg) as described by Sorgüven and Özilgen[2], the total exergy loss would decrease to 73328MJ/ton of flavoredyogurt and the CDP would rise to 3.7%. Additionally, if the electricpower would be obtained from hydraulic resources instead of fossilfuel, the CExC for electricity would decrease from 4.2 MJ/MJ to0.006 MJ/MJ, which results in a total exergy loss of 56919 MJ/tonand increases the CDP to 4.6%. These values represent substantialimprovement toward more environment-friendly production.
Processes with negligibly low contributions to the total energyand exergy requirements, e.g. sugar, strawberry, jam, microbialculture and flavored yogurt production, are omitted in Figs. 8e12.The last three processes mentioned are also omitted from the CO2emission figure (Fig. 12), since their contribution to the total CO2emission is less than 0.1%.
During the recent decade, food companies targeted substantialreductions in their energy expenditures and major progress hasbeen achieved. Considering the extremely high exergy lossesaccounted in this study, reducing the exergy losses appears to berealistic target for the next decade.
Appendix
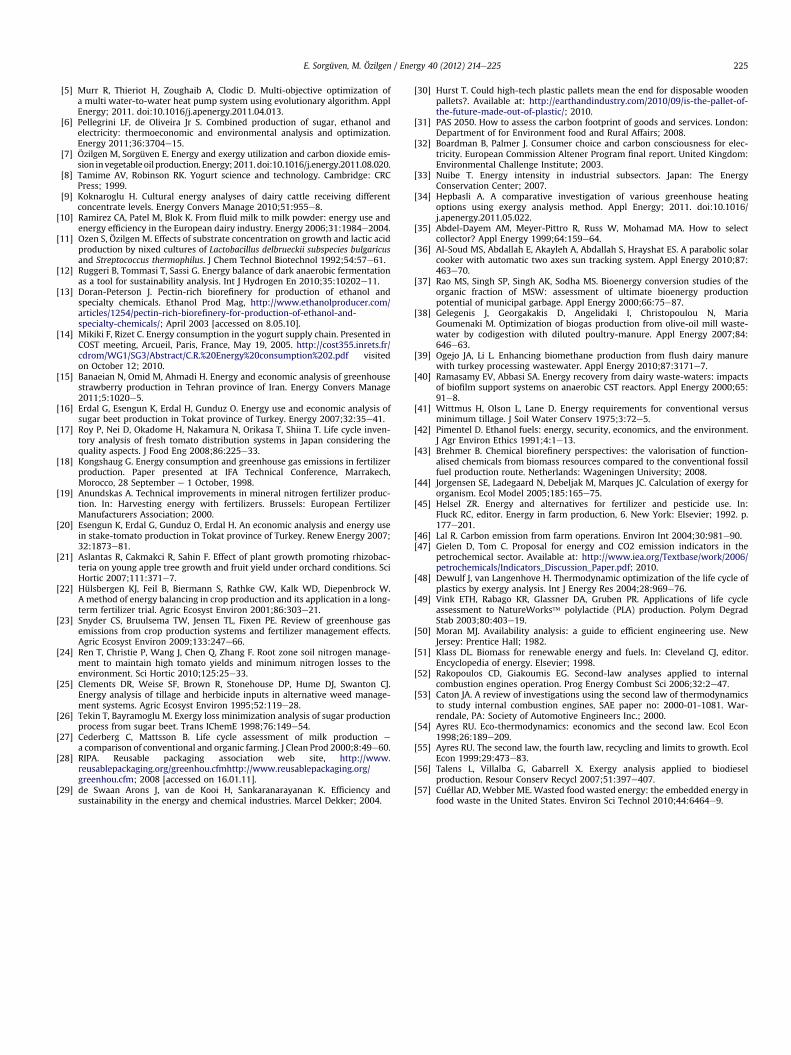
CEnC, CExC, and CCO2E values of the input and output materialsare listed in Table A1. Most of the data are taken from literature.Carbondioxide emission of during the feed preparation is calculatedassuming that 45% of the energy for the feed production comes fromelectricity, 30% from diesel oil, and 25% from natural gas.
Earlier works reported rather low CExC values for pesticideproduction (e.g., 32.7 MJ/kg herbicide [1], 7.5 MJ/kg insecticide [41]and 4.6 MJ/kg fungicide [42]). Brehmer [43] draw attention to thenoticeable variation based on the active ingredients and showedthat the CExC values are between 172 and 564 MJ/kg for the
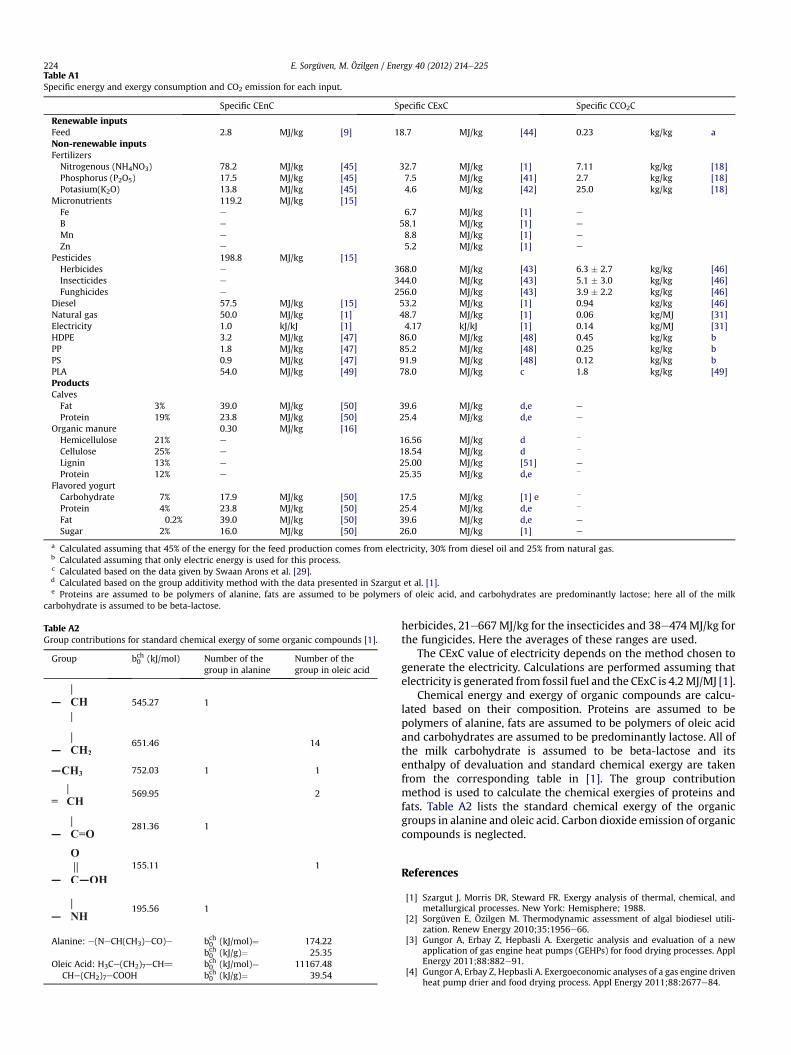
Table A1Specific energy and exergy consumption and CO2 emission for each input.
Specific CEnC Specific CExC Specific CCO2C
Renewable inputsFeed 2.8 MJ/kg [9] 18.7 MJ/kg [44] 0.23 kg/kg aNon-renewable inputsFertilizersNitrogenous (NH4NO3) 78.2 MJ/kg [45] 32.7 MJ/kg [1] 7.11 kg/kg [18]Phosphorus (P2O5) 17.5 MJ/kg [45] 7.5 MJ/kg [41] 2.7 kg/kg [18]Potasium(K2O) 13.8 MJ/kg [45] 4.6 MJ/kg [42] 25.0 kg/kg [18]
Micronutrients 119.2 MJ/kg [15]Fe e 6.7 MJ/kg [1] e
B e 58.1 MJ/kg [1] e
Mn e 8.8 MJ/kg [1] e
Zn e 5.2 MJ/kg [1] e
Pesticides 198.8 MJ/kg [15]Herbicides e 368.0 MJ/kg [43] 6.3 � 2.7 kg/kg [46]Insecticides e 344.0 MJ/kg [43] 5.1 � 3.0 kg/kg [46]Funghicides e 256.0 MJ/kg [43] 3.9 � 2.2 kg/kg [46]
Diesel 57.5 MJ/kg [15] 53.2 MJ/kg [1] 0.94 kg/kg [46]Natural gas 50.0 MJ/kg [1] 48.7 MJ/kg [1] 0.06 kg/MJ [31]Electricity 1.0 kJ/kJ [1] 4.17 kJ/kJ [1] 0.14 kg/MJ [31]HDPE 3.2 MJ/kg [47] 86.0 MJ/kg [48] 0.45 kg/kg bPP 1.8 MJ/kg [47] 85.2 MJ/kg [48] 0.25 kg/kg bPS 0.9 MJ/kg [47] 91.9 MJ/kg [48] 0.12 kg/kg bPLA 54.0 MJ/kg [49] 78.0 MJ/kg c 1.8 kg/kg [49]ProductsCalvesFat 3% 39.0 MJ/kg [50] 39.6 MJ/kg d,e e
Protein 19% 23.8 MJ/kg [50] 25.4 MJ/kg d,e e
Organic manure 0.30 MJ/kg [16]Hemicellulose 21% e 16.56 MJ/kg d �
Cellulose 25% e 18.54 MJ/kg d �
Lignin 13% e 25.00 MJ/kg [51] e
Protein 12% e 25.35 MJ/kg d,e �
Flavored yogurtCarbohydrate 7% 17.9 MJ/kg [50] 17.5 MJ/kg [1] e �
Protein 4% 23.8 MJ/kg [50] 25.4 MJ/kg d,e �
Fat 0.2% 39.0 MJ/kg [50] 39.6 MJ/kg d,e e
Sugar 2% 16.0 MJ/kg [50] 26.0 MJ/kg [1] e
a Calculated assuming that 45% of the energy for the feed production comes from electricity, 30% from diesel oil and 25% from natural gas.b Calculated assuming that only electric energy is used for this process.c Calculated based on the data given by Swaan Arons et al. [29].d Calculated based on the group additivity method with the data presented in Szargut et al. [1].e Proteins are assumed to be polymers of alanine, fats are assumed to be polymers of oleic acid, and carbohydrates are predominantly lactose; here all of the milk
carbohydrate is assumed to be beta-lactose.
Table A2Group contributions for standard chemical exergy of some organic compounds [1].
Group bch0 (kJ/mol) Number of thegroup in alanine
Number of thegroup in oleic acid
545.27 1
651.46 14
752.03 1 1
569.95 2
281.36 1
155.11 1
195.56 1
Alanine: e(NeCH(CH3)eCO)e bch0 (kJ/mol)¼ 174.22bch0 (kJ/g)¼ 25.35
Oleic Acid: H3Ce(CH2)7eCH]CHe(CH2)7eCOOH
bch0 (kJ/mol)¼ 11167.48bch0 (kJ/g)¼ 39.54
E. Sorgüven, M. Özilgen / Energy 40 (2012) 214e225224
herbicides, 21e667MJ/kg for the insecticides and 38e474MJ/kg forthe fungicides. Here the averages of these ranges are used.
The CExC value of electricity depends on the method chosen togenerate the electricity. Calculations are performed assuming thatelectricity is generated from fossil fuel and the CExC is 4.2MJ/MJ [1].
Chemical energy and exergy of organic compounds are calcu-lated based on their composition. Proteins are assumed to bepolymers of alanine, fats are assumed to be polymers of oleic acidand carbohydrates are assumed to be predominantly lactose. All ofthe milk carbohydrate is assumed to be beta-lactose and itsenthalpy of devaluation and standard chemical exergy are takenfrom the corresponding table in [1]. The group contributionmethod is used to calculate the chemical exergies of proteins andfats. Table A2 lists the standard chemical exergy of the organicgroups in alanine and oleic acid. Carbon dioxide emission of organiccompounds is neglected.
References
[1] Szargut J, Morris DR, Steward FR. Exergy analysis of thermal, chemical, andmetallurgical processes. New York: Hemisphere; 1988.
[2] Sorgüven E, Özilgen M. Thermodynamic assessment of algal biodiesel utili-zation. Renew Energy 2010;35:1956e66.
[3] Gungor A, Erbay Z, Hepbasli A. Exergetic analysis and evaluation of a newapplication of gas engine heat pumps (GEHPs) for food drying processes. ApplEnergy 2011;88:882e91.
[4] Gungor A, Erbay Z, Hepbasli A. Exergoeconomic analyses of a gas engine drivenheat pump drier and food drying process. Appl Energy 2011;88:2677e84.
E. Sorgüven, M. Özilgen / Energy 40 (2012) 214e225 225
[5] Murr R, Thieriot H, Zoughaib A, Clodic D. Multi-objective optimization ofa multi water-to-water heat pump system using evolutionary algorithm. ApplEnergy; 2011. doi:10.1016/j.apenergy.2011.04.013.
[6] Pellegrini LF, de Oliveira Jr S. Combined production of sugar, ethanol andelectricity: thermoeconomic and environmental analysis and optimization.Energy 2011;36:3704e15.
[7] Özilgen M, Sorgüven E. Energy and exergy utilization and carbon dioxide emis-sion invegetableoilproduction. Energy; 2011. doi:10.1016/j.energy.2011.08.020.
[8] Tamime AV, Robinson RK. Yogurt science and technology. Cambridge: CRCPress; 1999.
[9] Koknaroglu H. Cultural energy analyses of dairy cattle receiving differentconcentrate levels. Energy Convers Manage 2010;51:955e8.
[10] Ramirez CA, Patel M, Blok K. From fluid milk to milk powder: energy use andenergy efficiency in the European dairy industry. Energy 2006;31:1984e2004.
[11] Ozen S, Özilgen M. Effects of substrate concentration on growth and lactic acidproduction by nixed cultures of Lactobacillus delbrueckii subspecies bulgaricusand Streptococcus thermophilus. J Chem Technol Biotechnol 1992;54:57e61.
[12] Ruggeri B, Tommasi T, Sassi G. Energy balance of dark anaerobic fermentationas a tool for sustainability analysis. Int J Hydrogen En 2010;35:10202e11.
[13] Doran-Peterson J. Pectin-rich biorefinery for production of ethanol andspecialty chemicals. Ethanol Prod Mag, http://www.ethanolproducer.com/articles/1254/pectin-rich-biorefinery-for-production-of-ethanol-and-specialty-chemicals/; April 2003 [accessed on 8.05.10].
[14] Mikiki F, Rizet C. Energy consumption in the yogurt supply chain. Presented inCOST meeting, Arcueil, Paris, France, May 19, 2005. http://cost355.inrets.fr/cdrom/WG1/SG3/Abstract/C.R.%20Energy%20consumption%202.pdf visitedon October 12; 2010.
[15] Banaeian N, Omid M, Ahmadi H. Energy and economic analysis of greenhousestrawberry production in Tehran province of Iran. Energy Convers Manage2011;5:1020e5.
[16] Erdal G, Esengun K, Erdal H, Gunduz O. Energy use and economic analysis ofsugar beet production in Tokat province of Turkey. Energy 2007;32:35e41.
[17] Roy P, Nei D, Okadome H, Nakamura N, Orikasa T, Shiina T. Life cycle inven-tory analysis of fresh tomato distribution systems in Japan considering thequality aspects. J Food Eng 2008;86:225e33.
[18] Kongshaug G. Energy consumption and greenhouse gas emissions in fertilizerproduction. Paper presented at IFA Technical Conference, Marrakech,Morocco, 28 September e 1 October, 1998.
[19] Anundskas A. Technical improvements in mineral nitrogen fertilizer produc-tion. In: Harvesting energy with fertilizers. Brussels: European FertilizerManufacturers Association; 2000.
[20] Esengun K, Erdal G, Gunduz O, Erdal H. An economic analysis and energy usein stake-tomato production in Tokat province of Turkey. Renew Energy 2007;32:1873e81.
[21] Aslantas R, Cakmakci R, Sahin F. Effect of plant growth promoting rhizobac-teria on young apple tree growth and fruit yield under orchard conditions. SciHortic 2007;111:371e7.
[22] Hülsbergen KJ, Feil B, Biermann S, Rathke GW, Kalk WD, Diepenbrock W.A method of energy balancing in crop production and its application in a long-term fertilizer trial. Agric Ecosyst Environ 2001;86:303e21.
[23] Snyder CS, Bruulsema TW, Jensen TL, Fixen PE. Review of greenhouse gasemissions from crop production systems and fertilizer management effects.Agric Ecosyst Environ 2009;133:247e66.
[24] Ren T, Christie P, Wang J, Chen Q, Zhang F. Root zone soil nitrogen manage-ment to maintain high tomato yields and minimum nitrogen losses to theenvironment. Sci Hortic 2010;125:25e33.
[25] Clements DR, Weise SF, Brown R, Stonehouse DP, Hume DJ, Swanton CJ.Energy analysis of tillage and herbicide inputs in alternative weed manage-ment systems. Agric Ecosyst Environ 1995;52:119e28.
[26] Tekin T, Bayramoglu M. Exergy loss minimization analysis of sugar productionprocess from sugar beet. Trans IChemE 1998;76:149e54.
[27] Cederberg C, Mattsson B. Life cycle assessment of milk production ea comparison of conventional and organic farming. J Clean Prod 2000;8:49e60.
[28] RIPA. Reusable packaging association web site, http://www.reusablepackaging.org/greenhou.cfmhttp://www.reusablepackaging.org/greenhou.cfm; 2008 [accessed on 16.01.11].
[29] de Swaan Arons J, van de Kooi H, Sankaranarayanan K. Efficiency andsustainability in the energy and chemical industries. Marcel Dekker; 2004.
[30] Hurst T. Could high-tech plastic pallets mean the end for disposable woodenpallets?. Available at: http://earthandindustry.com/2010/09/is-the-pallet-of-the-future-made-out-of-plastic/; 2010.
[31] PAS 2050. How to assess the carbon footprint of goods and services. London:Department of for Environment food and Rural Affairs; 2008.
[32] Boardman B, Palmer J. Consumer choice and carbon consciousness for elec-tricity. European Commission Altener Program final report. United Kingdom:Environmental Challenge Institute; 2003.
[33] Nuibe T. Energy intensity in industrial subsectors. Japan: The EnergyConservation Center; 2007.
[34] Hepbasli A. A comparative investigation of various greenhouse heatingoptions using exergy analysis method. Appl Energy; 2011. doi:10.1016/j.apenergy.2011.05.022.
[35] Abdel-Dayem AM, Meyer-Pittro R, Russ W, Mohamad MA. How to selectcollector? Appl Energy 1999;64:159e64.
[36] Al-Soud MS, Abdallah E, Akayleh A, Abdallah S, Hrayshat ES. A parabolic solarcooker with automatic two axes sun tracking system. Appl Energy 2010;87:463e70.
[37] Rao MS, Singh SP, Singh AK, Sodha MS. Bioenergy conversion studies of theorganic fraction of MSW: assessment of ultimate bioenergy productionpotential of municipal garbage. Appl Energy 2000;66:75e87.
[38] Gelegenis J, Georgakakis D, Angelidaki I, Christopoulou N, MariaGoumenaki M. Optimization of biogas production from olive-oil mill waste-water by codigestion with diluted poultry-manure. Appl Energy 2007;84:646e63.
[39] Ogejo JA, Li L. Enhancing biomethane production from flush dairy manurewith turkey processing wastewater. Appl Energy 2010;87:3171e7.
[40] Ramasamy EV, Abbasi SA. Energy recovery from dairy waste-waters: impactsof biofilm support systems on anaerobic CST reactors. Appl Energy 2000;65:91e8.
[41] Wittmus H, Olson L, Lane D. Energy requirements for conventional versusminimum tillage. J Soil Water Conserv 1975;3:72e5.
[42] Pimentel D. Ethanol fuels: energy, security, economics, and the environment.J Agr Environ Ethics 1991;4:1e13.
[43] Brehmer B. Chemical biorefinery perspectives: the valorisation of function-alised chemicals from biomass resources compared to the conventional fossilfuel production route. Netherlands: Wageningen University; 2008.
[44] Jorgensen SE, Ladegaard N, Debeljak M, Marques JC. Calculation of exergy fororganism. Ecol Model 2005;185:165e75.
[45] Helsel ZR. Energy and alternatives for fertilizer and pesticide use. In:Fluck RC, editor. Energy in farm production, 6. New York: Elsevier; 1992. p.177e201.
[46] Lal R. Carbon emission from farm operations. Environ Int 2004;30:981e90.[47] Gielen D, Tom C. Proposal for energy and CO2 emission indicators in the
petrochemical sector. Available at: http://www.iea.org/Textbase/work/2006/petrochemicals/Indicators_Discussion_Paper.pdf; 2010.
[48] Dewulf J, van Langenhove H. Thermodynamic optimization of the life cycle ofplastics by exergy analysis. Int J Energy Res 2004;28:969e76.
[49] Vink ETH, Rabago KR, Glassner DA, Gruben PR. Applications of life cycleassessment to NatureWorks� polylactide (PLA) production. Polym DegradStab 2003;80:403e19.
[50] Moran MJ. Availability analysis: a guide to efficient engineering use. NewJersey: Prentice Hall; 1982.
[51] Klass DL. Biomass for renewable energy and fuels. In: Cleveland CJ, editor.Encyclopedia of energy. Elsevier; 1998.
[52] Rakopoulos CD, Giakoumis EG. Second-law analyses applied to internalcombustion engines operation. Prog Energy Combust Sci 2006;32:2e47.
[53] Caton JA. A review of investigations using the second law of thermodynamicsto study internal combustion engines, SAE paper no: 2000-01-1081. War-rendale, PA: Society of Automotive Engineers Inc.; 2000.
[54] Ayres RU. Eco-thermodynamics: economics and the second law. Ecol Econ1998;26:189e209.
[55] Ayres RU. The second law, the fourth law, recycling and limits to growth. EcolEcon 1999;29:473e83.
[56] Talens L, Villalba G, Gabarrell X. Exergy analysis applied to biodieselproduction. Resour Conserv Recycl 2007;51:397e407.
[57] Cuéllar AD, Webber ME. Wasted food wasted energy: the embedded energy infood waste in the United States. Environ Sci Technol 2010;44:6464e9.
Related Documents