Energy Utilisation in Karnataka: Part-III Small Scale Industries Sector Dr. D.K. Subramanian Dr. T.V. Ramachandra ENERGY RESEARCH GROUP CENTRE FOR ECOLOGICAL SCIENCES INDIAN INSTITUTE OF SCIENCE, BANGALORE 560 012, INDIA Address for Correspondence Dr. T.V.Ramachandra, Energy and Wetlands Research Group, Centre for Ecological Sciences, Indian Institute of Science Bangalore 560 012, India E Mail : [email protected] [email protected] [email protected] Published in Humanity Development Library Versio - 2.0 Humanity Libraries Project c/o Global Help Projects vzw & HumanityCD Ltd. Oosterveldlaan 196 B-2610 Antwerp BELGIUM Email : [email protected] Tel : 32-3-448.05.54 Fax : 32-3-449.75.74 Telephone : 91-080-3600985 / 309 2506 Fax : 91-080-3601428 / 3600085 / 3600683 [CES-TVR] Visit : www.oneworld.org/globalprojects/humcdrom www.oneworld.org/globalprojects/welcome.htm http://wgbis.ces.iisc.ernet.in/energy/paper/part3/coverpage.html 1 of 1 10/1/2013 3:00 PM

Welcome message from author
This document is posted to help you gain knowledge. Please leave a comment to let me know what you think about it! Share it to your friends and learn new things together.
Transcript
Energy Utilisation in Karnataka: Part-III Small Scale IndustriesSector
Dr. D.K. Subramanian Dr. T.V. Ramachandra
ENERGY RESEARCH GROUPCENTRE FOR ECOLOGICAL SCIENCES
INDIAN INSTITUTE OF SCIENCE, BANGALORE 560 012, INDIA
Address for Correspondence
Dr. T.V.Ramachandra,Energy and Wetlands Research Group,Centre for Ecological Sciences,Indian Institute of ScienceBangalore 560 012, India
E Mail : [email protected]@[email protected]
Published in
Humanity Development Library Versio - 2.0Humanity Libraries Projectc/o Global Help Projects vzw& HumanityCD Ltd.Oosterveldlaan 196B-2610 Antwerp BELGIUMEmail :[email protected]
Tel : 32-3-448.05.54Fax : 32-3-449.75.74
Telephone : 91-080-3600985 / 309 2506Fax : 91-080-3601428 / 3600085 / 3600683 [CES-TVR]
Visit : www.oneworld.org/globalprojects/humcdromwww.oneworld.org/globalprojects/welcome.htm
http://wgbis.ces.iisc.ernet.in/energy/paper/part3/coverpage.html
1 of 1 10/1/2013 3:00 PM
INTRODUCTION
Energy utilization in a state is a complex activity closely intertwined with the limits on resources. At one end, there are energy resources which are used in various tasks. At the opposite are end uses in many sectors. In between we have many alternate paths of conversion of energy into many different forms and methods of transportation. The complexity of a total integrated energy scenario can be seen from the following aspects;
i) many energy sources can be used to perform a task (for example we can use electricity, firewood, coal, agricultural wastes, kerosene, charcoal and solar energy in the direst mode to heat water for bathing; we can run an irrigation pumping system with the help of electricity, diesel oil, biogas, or solar cells).
ii) energy from a resource can be converted via many stages to the form required by an end use. An example is the conversion of coal to heat (in a boiler), heat to mechanical energy (in a turbine), mechanical form to electrical form (in a generator), electricity to a mechanical form (in a motor) and mechanical to a potential form (in a pump) in order to pump water from a well. There may be several paths from a source to an end use device, (for example, we can use biogas for lighting either directly in a mantle or by its conversion into electricity, use it in an electric bulb).
iii) several devices may be available for a particular end use and one has to choose one of them (we have open chulas, mud stoves, steel stoves, improved stoves, smokeless chulas, three pan or two pan stoves for cooking purposes; all of them use firewood).
iv) Transporting methods are several (we can have a pithead thermal power station in a colliery and transmit electric energy via transmission lines or we can have a thermal power station close to a load centre and transport coal/oil by means of road, rail or sea routes).
The above features reveal the complexity of the energy situation. Add to this the fact that resources were available in abundance and the economists decreed that their costs/prices be negligible. All these made people consume large quanta of energy resources in the name of development with little or no concern for energy conservation. Energy efficiencies were very low. In several instances, only about 5 units of energy went into useful output out of an input of 100 units. This situation has nothing to do with many societal factors like - affluent stages of development, levels of technology, sectors of usage (like industrial or domestic) or resources (firewood or electricity).
Secondly, there was no emphasis on the use of renewable resources. Cost and convenience were the essential factors in the development of energy systems and this resulted in very low efficiencies of utilization on the oneside and on the other the rapid depletion of non renewable resources.
Both low efficiency use and rapid depletion of resources have their impact on our environment. These lead to the development of more mines, construction of giant hydroelectric projects,

planning, design and construction of nuclear plants and massive denudation of forests and village wood lots.
The previous two articles (Energy Utilisation in Karnataka part I and II) provided an exposure on the general energy situation in Karnataka and energy utilization in industries. The last study revealed that energy use is highly inefficient in the industrial sector. Since Small Scale Industries form an important component of our industrial set-up it was decided to concentrate on the small scale industrial sector in this study.
Certain important parameters of the small scale sector are
i) Industries are diffused all over the State. Hence it is possible to compare energy utilization in several districts.
ii) Industries in a group manufacture similar products. For example, bakeries in different places make products of great similarity. In the case of major industries we cannot get this degree of uniformity. If we consider two electrical industries, one may manufacture transformers and another motors. There are differences in technology, scales of production, materials used, production processes etc. Because of a greater degree of similarities that exist in a small scale industry group, conclusions on energy use can be meaningful.
iii) Economics of production is much more important in a small scale industry and energy plays a key role in the production efficiency in certain groups. It can even decide whether an industry can survive or not.
We start with a comparison of Karnataka with India with respect to Small Scale Industries (SSI). This is followed by a general picture of SSIs in Karnataka. Then a brief comparison with HT industries is given. The energy consumption comparisons for 47 groups are described later. Finally districtwise analysis of SSIs with reference to energy use is discussed.
The main indicator chosen in these studies has been the energy consumption/unit of production; the same as that used in the previous studies.
Before we look at the situation in Karnataka let us fix the position of Karnataka with reference to India in the Small Scale Industry sector. Table 1 illustrates this.
We can see from this table that
(i) Karnataka has 5.57% of factories; (ii) It's share of capital is only 4.43%; (iii) It's share of manpower is 5.12%; (iv) Wages constitute 4.90%; (v) Fuels consumed account for 3.55% of all India total. (vi) Value of the output is 4.24%.
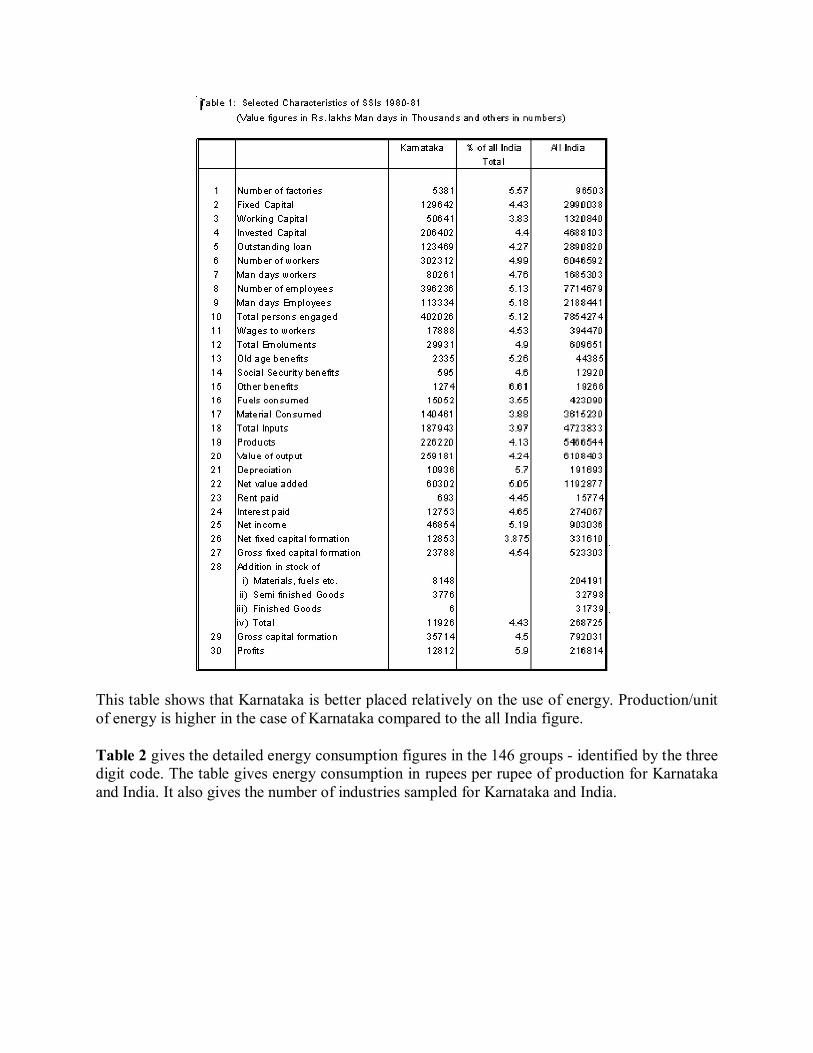
This table shows that Karnataka is better placed relatively on the use of energy. Production/unit of energy is higher in the case of Karnataka compared to the all India figure.
Table 2 gives the detailed energy consumption figures in the 146 groups - identified by the three digit code. The table gives energy consumption in rupees per rupee of production for Karnataka and India. It also gives the number of industries sampled for Karnataka and India.


We can see that Karnataka has higher costs of energy in the following sectors.
(i) 203: Canning, preserving and processing of fish, crustacean and similar foods;
(ii) 204: Grain mill products;
(iii) 205: Manufacture of bakery products;
(iv) 207: Products from indigenous Sugar, Boora, Khandasari, Gur, etc.;
(v) 213: Coffee curing, roasting and grinding;
(vi) 215: Manufacture of Ice;
(vii) 219: Manufacture of food products not elsewhere classified;
(viii) 226: Manufacture of bidis;
(ix) 259: Manufacture of jute bags and other jute textiles;
(x) 260: Knitting mills;
(xi) 262: Embroidery and making of crepes; laces and fringes;
(xii) 266: Manufacture of made up textile goods such as curtains, mosquito nets, etc.;
(xiii) 276: Manufacture of wooden furniture and fixtures;
(xiv) 287: Engraving, etching, blockmaking, etc.;
(xv) 288: Book binding;
(xvi) 299: Manufacture of leather and fur products not elsewhere classified;
(xvii) 301: Manufacture of footwear made primarily of vulcanized or moulded rubber;
(xviii) 302: Manufacture of rubber products not elsewhere classified;
(xix) 304: Petroleum refineries;
(xx) 319: Manufacture of chemical products not elsewhere classified;
(xxi) 320: Manufacture of structural clay products;
(xxii) 325: Manufacture of mica products;
(xxiii) 326: Manufacture of structural stone products, stone dressing, stone-crushing;
(xxiv) 352: Manufacture of prime movers, boilers and steam generating plant such as diesel engines;
(xxv) 354: Industrial machinery for industries other than food and textile;
(xxvi) 355: Manufacture of refrigerators, airconditioners and fire fighting equipment and other parts.
(xxvii) 358: Manufacture of office computing and accounting machinery and accessories;
(xxviii) 360: Manufacture of electrical industrial machinery and apparatus;
(xxix) 374: Manufacture of motor vehicals and parts;
(xxx) 375: Manufacture of motor cycles scooters and parts;
(xxxi) 378: Bullockcarts, push carts, hand carts etc;
(xxxii) 382: Manufacture of watches and clocks;

(xxxiii) 383: Manufacture of jewellery and related articles;
(xxxiv) 387: Manufacture of stationery articles like fountain pens, pencils, pens, tags etc.,
It shows that Karnataka has higher energy efficiency in 34 groups out of a total of 146 when compared with the all India figures.
Table 3 gives the same information but cumulated for a two digit code. This leaves us with only 25 groups. In this case, we find that two groups show a high energy efficiency figure for Karnataka compared to all India average and one group shows slightly higher value. The remaining 22 groups have lower figures for Karnataka than that for India. Both tables 2 and 3 show that in most of the groups, Karnataka has favourable energy use figures compared to the all India scene; but there are some groups that need a careful look - to find out ways and means of reducing energy consumption. Some groups show a very high difference and they need immediate attention.
Small Scale Industries In Karnataka :
Let us look at a general picture of the small scale industrial scene in Karnataka especially from the point of view of their spatial distribution, investment costs, growth rates and man power generation. Even though these aspects are not directly related to the energy consumption
patterns, they throw light on the developmental aspects and also indirectly influence energy and environment.
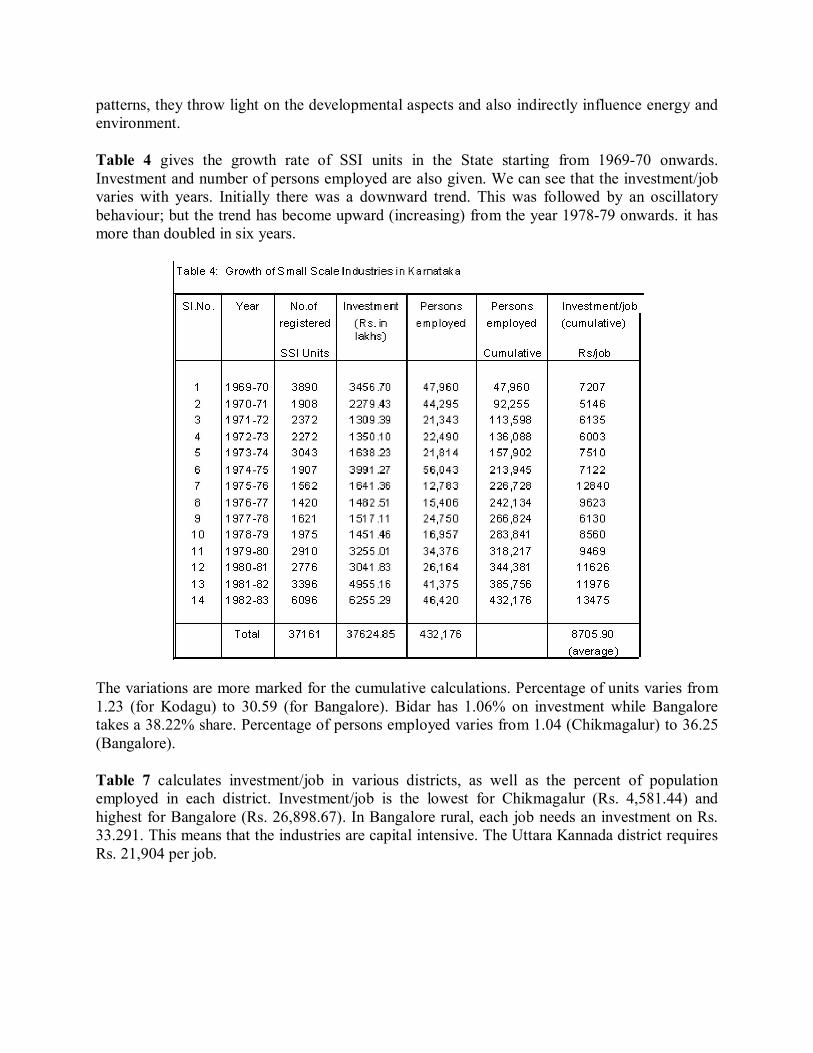
Table 4 gives the growth rate of SSI units in the State starting from 1969-70 onwards. Investment and number of persons employed are also given. We can see that the investment/job varies with years. Initially there was a downward trend. This was followed by an oscillatory behaviour; but the trend has become upward (increasing) from the year 1978-79 onwards. it has more than doubled in six years.
The variations are more marked for the cumulative calculations. Percentage of units varies from 1.23 (for Kodagu) to 30.59 (for Bangalore). Bidar has 1.06% on investment while Bangalore takes a 38.22% share. Percentage of persons employed varies from 1.04 (Chikmagalur) to 36.25 (Bangalore).
Table 7 calculates investment/job in various districts, as well as the percent of population employed in each district. Investment/job is the lowest for Chikmagalur (Rs. 4,581.44) and highest for Bangalore (Rs. 26,898.67). In Bangalore rural, each job needs an investment on Rs. 33.291. This means that the industries are capital intensive. The Uttara Kannada district requires Rs. 21,904 per job.

Many times, we feel that SSIs generate employment. This aspect is also looked at in this table. The column percent of population employed calculates the ratio of the number of persons employed in SSI in a district to the total population of that district as a percentage. This fraction is quite low for all the districts. Mysore provides employment in SSI for only 0.23% of its population, U.K. district, on the lowest side, provides employment to only 0.054% of its population (for the year 1982-83). If we look at the cumulative picture, Bangalore gives employment to 3.16% of its population and Gulbarga to only 0.376% of its population. Only four districts cross the 1% mark, all others providing employment to less than 1% of their population in SSI sector.
Table 8 looks at another parameter - investment per capita. Again Bangalore leads with Rs. 47.16 in 1982-83 (Rs. 290.68 cumulative) and at the other end is Bijapur Rs. 4.11 in 1982-83 (25.15 cumulative). Only four districts have investment/population greater than this state average (cumulative).
The above comparisons show that there are a lot of disparities in investments in each district, investment/job, employment and investment/capita. Even SSIs have not dispersed very well in the whole of the State. These are pictorially displayed in figures. Fig. 1 gives the growth of the number of industries starting from 1970. Fig. 2 illustrates the manpower employed. Fig 3 shows the increase in investment. Fig. 4 graphs the distribution of SSIs in districts.

Comparison of Small Scale Industries with Large and Medium Industries
Table 9 gives the gross fixed capital/employee and related figures for high tension consumers. The GFC/employee varies from Rs. 13,464 to 35,645. This shows that the variation between SSI and these industries is not very high especially if we look at the low end of the investment/employee. The table also shows that industries with a contract electricity demand of 100-250 KVA have a higher employment potential and lower energy consumption figures. These details are for the year 1978.
Table 9:Gross Fixed Capital Slab-wise
Sl. No. G.F.C./EC (Rs.)
G.F.C./EC Rs.(KWH)
Empoleement per 100 KVA of Contract Demand (No.)
G.F.C per KVA of Contract Demand (Rs.)
1 2 3 4
35,645 27,232 20,975 13,464 29,760
1.617 8.710 10.300 8.448
19 70 79 73 28
6,876 19,166 16,549 9,783 8,206

Energy Consumption in SSIs
The number of Small Scale Industries in the State is very large. Hence it is not possible to obtain data from all of them. So, data obtained from a sample were looked at. The SSIs have been coded into different groups. Even though about 140 groups were identified in the sample, many of them have a very few samples. Hence, we derived from the sample a secondary sample - we discarded all groups with a small sample. This resulted in a reduced sample of 47 groups.
Table 10 lists the SSI groups and their industrial codes. It has a variety of manufactures - bakery, food grains, furniture, garments, printing, leather chappals, polythene bags, plastics, soaps, oils, bricks, cement products, steel and structural products, agricultural tools, utensils, electroplating, machinery electrical appliances, automobile parts etc.
In order to compare the energy utilization, we calculated energy use/rupee of production for every group (this was also calculated district-wise as discussed in the next section).
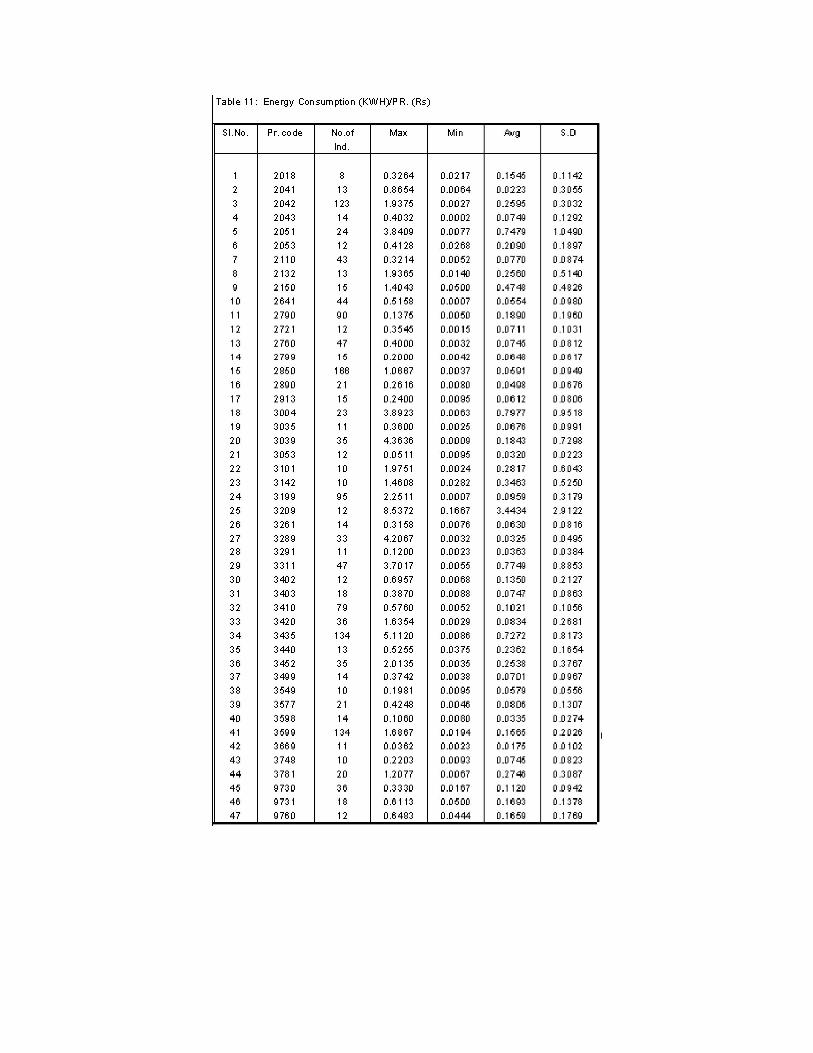
Table 11 gives the specific energy consumption for the 47 groups. It gives the maximum value, minimum value, average and standard deviation for every group. The maximum value gives the maximum used by an industry in the group. Similarly the minimum is calculated. We can see that energy consumption in kilowatt hours/rupee of production has a considerable variation in each group; the variations being more than 100 times in some sectors. These wide variations show that there is a very good scope for improvement in energy use and conservation of energy. All groups exhibit strong variations.
Some sectors show a very high value of energy consumption and they deserve attention. Some examples are bricks and tiles, bakeries, tyre retread-plastic foam products, castings and agricultural implements.
In order to see the economic impact and survival of SSIs (with reference to energy use), Table 12 is computed. This gives energy consumption in rupees per rupee of production. This again reveals the variations pictured in table 11. Industries in many groups use more than 30 paise for energy in a rupee of production. Two industries use more than 70 paise for energy per rupee of production. They belong to agarbathi and castings groups. Survival of many industries depends on energy conservation as revealed clearly especially in the case of those which use more than 25% of cost for energy.
Table 13 compares energy consumption with man power. In addition to the fact that there is a wide disparity in intrasector and intersector units, there is also a striking feature that the higher values of energy consumptions per person in some groups are greater than the similar figures for H.T. industries. This deserves further analysis and improvement are desirable. This also shows that all small scale units are not employment generating units.


District-wise Variation of Specific Energy Consumption in SSIs
Since there are a lot of similarities in SSIs pertaining to the same industrial code, it was decided to calculate the energy consumption per rupee of production in various districts. These are calculated for the 47 sectors identified in the last section.
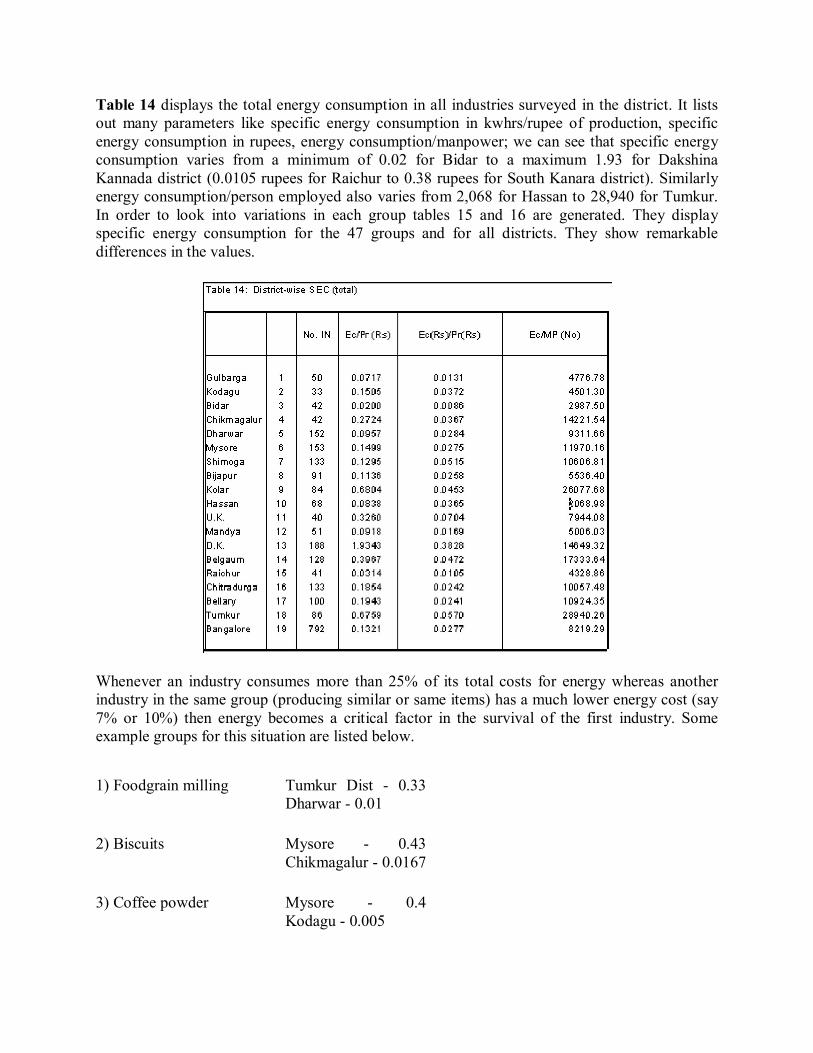
Table 14 displays the total energy consumption in all industries surveyed in the district. It lists out many parameters like specific energy consumption in kwhrs/rupee of production, specific energy consumption in rupees, energy consumption/manpower; we can see that specific energy consumption varies from a minimum of 0.02 for Bidar to a maximum 1.93 for Dakshina Kannada district (0.0105 rupees for Raichur to 0.38 rupees for South Kanara district). Similarly energy consumption/person employed also varies from 2,068 for Hassan to 28,940 for Tumkur. In order to look into variations in each group tables 15 and 16 are generated. They display specific energy consumption for the 47 groups and for all districts. They show remarkable differences in the values.
Whenever an industry consumes more than 25% of its total costs for energy whereas another industry in the same group (producing similar or same items) has a much lower energy cost (say 7% or 10%) then energy becomes a critical factor in the survival of the first industry. Some example groups for this situation are listed below.
1) Foodgrain milling Tumkur Dist - 0.33 Dharwar - 0.01
2) Biscuits Mysore - 0.43 Chikmagalur - 0.0167
3) Coffee powder Mysore - 0.4 Kodagu - 0.005

4) Cold storage D.K. Dist - 0.48 Bidar - 0.03
5) Bricks and tiles Tumkur - 0.34 S.K. Dist - 0.33 Hassan - 0.07 U.K. Dist - 0.14
6) Bullock Carts and parts Dharwar - 0.25 Shimoga - 0.006
The above list shows that price difference is also partly due to the difference in prices for traditional fuels like firewood. This does not mean that energy efficiency is the same; because table 15 shows that the difference in energy efficiency exists.
Conclusions
We can draw the following conclusions based on these studies;
(i) Even though Karnataka exhibits better energy efficiency compared to the Indian figures, it has higher energy consumption (lower energy efficiency) values for 34 groups out of a total of 146 groups considered. This means that a closer look at these 34 groups is needed.
(ii) Karnataka's map of Small Scale Industries reveals an uneven distribution of the industries amongst the various districts. Bangalore's share is very high. It has 30.59% of the SSI units in the State and has a share of 38.22% in the total investment.
Bangalore also needs the highest investment per job. Its investment/job is Rs. 26,896.67 compared to Rs. 4,581.44 for Chikmagalur. (Bangalore rural needs a still higher figure).
(iii) Percentage of population getting employment in Small Scale Industries is not high. It is very low. The maximum comes from Bangalore 3.16%; the lowest is for Gulbarga - only 0.376%. Only 4 districts cross the 1% mark; all others have employment for less than 1% of their population in the SSI sector.
(iv) Investment/capita also shows Bangalore leading (with Rs.290.68 cumulative) and Bijapur on the lower side (Rs. 25.15). Only four districts have investment/capita greater than the state average.
(v) Average investment per person employed for SSI is similar to that for the lower end of major industries - that is industries with a contract electricity demand of 100-250 KVA. A similar situation exists for energy consumption/person also.
(vi) One of the indices to compare energy efficiencies in a group of industries is the specific energy consumption factor - energy consumption per unit (rupee) of production. This was

calculated for 47 groups of SSIs. Many groups exhibit very great differences for this index. Ratios of 1:100 are found in several sectors. Some of the groups with wide variations are bricks and tiles, bakeries, tyre retreading, castings and agricultural implements. They need immediate attention. There is a need for a central monitoring agency to prepare norms for various groups and inform the SSIs whenever they exceed the norms. Several associations exist for small scale sector in the Country and the State. They can also take a lead in establishing a monitoring agency.
(vii) Economic impact of energy on an industry can be indicated by the fractional cost of energy in the overall cost of production. Many industries spend more than 30 paise for energy in a rupee of production. Viability of an industry is closely related to the energy usage in many cases.
(viii) District-wise variations in specific energy consumptions show that Dakshina Kannada district has a high value and Bidar a low value. In order to separate energy intensity nature, groupwise analysis was conducted.
(ix) Group-wise and district-wise analysis of specific energy consumptions show wide variations in every group. About 33 groups reveal ratios of maximum to minimum specific energy consumptions greater than 10. This means that there is a remarkable potential for energy conservation in these groups.
(x) Group-wise and district-wise analysis of percentage of expenditure on energy reveal very high differences in some cases. Some of the groups, where some industries have an energy expenditure of 25% or more and many others with lower values, are foodgrain milling, biscuits, coffee powder, cold storage, bricks and tiles, and bullock carts and parts. In all these cases, marked differences exist suggesting again the need for energy conservation measures.
Since many of these groups are traditional in nature and consume fuels like firewood, their impact on environment is obvious and clear.
Acknowledgments
Thanks are due to the Director, Small Scale Industries and Mr. Ramanathan, Assistant Director (Ele.) for their help in our data collection work and energy analysis.
References
Aburas, R., 'Energy conservation policies in Jordan', Energy Policy, pp 591-598, Butterworth and Co (Publishers) Ltd, Dec. 1989.
Anandalingam, G., 'Policy incentives for industrial energy conservation', Discussion Paper No. 02.83, TERI, New Delhi.
Anandalingam, G., 'Energy conservation in the industrial sector of developing countries', Energy Policy, pp 335-339, Butterworth and Co (Publishers) Ltd, Aug. 1985.
Anderson, W.P., 'Energy and the environment: The new case for conservation', Energy Studies Review, Vol. 6, No. 1, pp 16-32, Canada, 1994.
Ang, B.W., 'Decomposition of industrial energy consumption: The energy intensity approach', Energy Economics, Vol. 16, No. 3, pp 163-174, Butterworth-Heinemann Ltd, 1994.
Ang, B.W. and Lee, S.Y., 'Decomposition of industrial energy consumption: Some methodological and application issues', Energy Economics, Vol. 16, No. 2, pp 83-92, Butterworth-Heinemann Ltd, 1994.
Ang, B.W., 'A statistical analysis of energy coefficients', Energy Economics, pp 93-110, Butterworth-Heinemann Ltd, April 1991.
Anxo, D. and Sterner, T., Using electricity data to measure capital utilization', Energy Economics, Vol. 16, No. 1, pp 63-74, Butterworth-Heinemann Ltd, 1994.
Arya, G., 'Energy saving in motor control systems', 3rd Annual Conference, Environmental and Energy Efficiency Management, July 1990.
Beck, R. and Solow, J.L., 'Forecasting nuclear power supply with Bayesian autoregression', Energy Economics, Vol. 16, No. 3, pp 185-192, Butterworth-Heinemann Ltd, 1994.
Communication, 'State of industrial sickness in India', Productivity, Vol. 30, No. 4, pp 462-465, January-March 1990.
DPIE, 'Future Energy Management', Australian Government Publishing Service, Canberra, Nov. 1991.
Fawkes, S.D. and Jacques, J.K., 'Approaches to energy conservation management in beverage - related industries and their effectiveness', Energy Policy, pp 559-566, Butterworth-Heinemann Ltd, Dec. 1987.
Hansen, U., 'Delinking of energy consumption and economic growth: The German experience', Energy Policy, pp 631-640, Butterworth-Heinemann Ltd, Sep. 1990.
Howarth, R.B., Schipper, L., Duerr, P.A. and Strom, S., 'Manufacturing energy use in eight OECD countries: Decomposting the impacts of changes in output, industry structure and energy intensity', Energy Economics, pp 135-141, Butterworth-Heinemann Ltd, April 1991.
Huang, J.P., 'Industry energy use and structural change: A case study of The People's Republic of China', Energy Economics, pp 131-136, Butterworth-Heinemann Ltd, April 1993.
Hunter, R., 'Energy options', SPA, pp 35-40, Autumn 1992.
Industrial Economist, Annual Number, Vol. XVIII, No. 12.
Jelinski, L.W. et al. 'Industrial ecology: Concepts and approaches', Colloquium Paper, Vol. 89, pp 793-797, Proceedings of National Academic Sciences, USA, 1992.
Jutsen, J., 'Energy management in industry: issues and challenges', The National Energy Management Forum, June 1991.
Kothari, V.S., 'Industrial energy policies of India', TERI, Oct. 1987.
Levine, M.D., et al. 'Energy efficiency, developing Nations, and Eastern Europe', A Report to the U.S. Working Group on Global Energy Efficiency, June 1991.
Lohani, B.N. and Azimi, A.M., 'Barriers to energy end-use efficiency', Energy Policy, pp 533-545, Butterworth-Heinemann Ltd, June 1992.
Mander, S. and Wilson, B., 'An analysis of data from the enterprise energy audit program', Project 41.013, ABARE.
McInnes, G. and Unterwurzacher, E., 'Electricity end-use efficiency: an assessment of the scope for efficiency gains and policy options', Energy Policy, pp 208-216, Butterworth-Heinemann Ltd, April 1991.
Munasinghe, M., 'Efficient management of the power sector in developing countries', Energy Policy, pp 94-103, Butterworth-Heinemann Ltd, 1992.
Natarajan, T.V. and Bhattacharya, A., 'Reliability considerations in generation, transmission and distribution of electric power system - with special reference to India', Discussion Paper No. 07.84, TERI, New Delhi.
Nilsson, K., 'Industrial production planning with optimal electricity cost', Energy Conservation Management, Vol. 34, No. 3, pp 153-158, Pergamon Press Ltd, Great Britain, 1993.
NPC Energy Management Division, 'Energy indicators for Indian refinery sector', Productivity, Vol. 30, No. 4, pp 495, January-March 1990.
NPC Research Section, 'Productivity in Indian food processing industries', Productivity, Vol. 30, No. 4, pp 466-482, January-March 1990.
Oelschlager, R., 'Cutting costs: Energy savings with industrial dryers', Drying Technology, Vol. 9, No. 4, pp 883-890, Marcel Dekkar, Inc, 1991.
Pachauri, R.K., 'Energy efficiency in developing countries: Policy options and the poverty dilemma', Natural Resources Forum, pp 319-325, Butterworth-Heinemann Ltd, Nov. 1990.
Pachauri, R.K., 'Energy efficiency and conservation in India', UNEP Industry and Environment, pp 19-24, 1990.

Parikh, J., et al. 'Consumption patterns: The driving force of environmental stress', United Nations Conference on Environment and Development, Oct. 1991.
Pasha, H.A., Ghaus, A. and Malik, S., 'The economic cost of power outages in the industrial sector of Pakistan', Energy Economics, pp 301-322, Butterworth and Co (Publishers) Ltd, Oct. 1989.
Rapp, B. and Selmer, J., 'Impact of organizational factors on energy conservation measures', Energy Policy, pp 437-444, Butterworth and Co (Publishers) Ltd, Oct 1985.
Reddy, A.K.N. and Goldemberg, J., 'Energy for the developing world', Scientific American, pp 63-72, Sep. 1990.
Reddy, A.K.N., 'An alternative pattern of Indian industrialization', In: Change and Choice in Indian Industries, Eds. Bagchee, A.K. and Bannerji, N., Calcutta, 1982.
Rudig, W., 'Energy conservation and electricity utilities: a comparative analysis of organizational obstacles to CHP/DH', Energy Policy, pp 104-148, Butterworth and Co (Publishers) Ltd, April 1986.
Samuelson, P.A., 'Conserved energy without work or heat', Applied Mathematics, Vol. 89, pp 1090-1094, Proceedings of National Academic Sciences, USA, Feb. 1992.
Schurr, S.H., 'Energy conservation and productivity growth: Can we have both?', Energy Policy, pp 126-142, Butterworth and Co (Publishers) Ltd, April 1985.
Silverstrini, G.V., ' Energy planning and flexibility of the energy system', Energy Systems and Policy, Vol. 14, pp 113-125, Taylor and Francis, UK, 1990.
'Small scale industries in India', Hand Book of Statistics 1989, Ministry of Industry, New Delhi.
Somasekhara, N., Selvaraju, V. and Rao, D.M., 'Economies of scale in Indian manufacturing industries', Productivity, Vol. 30, No. 4, pp 445-448, January-March 1990.
Soussan, J., 'Energy crisis in the third world', Primary Resources and Energy in the Third World, Rout Ledge, London and New York, 1988.
Steer, A., 'Energy and industry', World Development Report, pp 114-133, World Bank, Oxford University Press, Inc, 1992.
Tamimi, A. and Kodah, Z., 'Modeling of energy consumption and projection in Jordan', Energy Conversation Management, Vol. 34, No. 5, pp 427-432, Pergamon Press Ltd, Great Britain, 1993.

Tripathy, S.C., Roy, M.C. and Balasubramanian, R., 'Energy auditing kit for cement industries', Energy Conversation Management, Vol. 33, No. 12, pp 1073-1078, Pergamon Press Ltd, Great Britain, 1992.
Related Documents