www.esri.ie 4 Working Paper No. 219 November 2007 Energy-Using Appliances and Energy-Saving Features: Determinants of Ownership in Ireland Joe O’Doherty a , Seán Lyons a and Richard S.J. Tol a,b,c Abstract: Energy usage and energy efficiency are of increasing concern in Ireland. Regression analyses on a large household micro-dataset reveal that those homes that have more energy-saving features are also likely to have a high ‘potential energy use’. Statistically significant dwelling features include location, value and dwelling type, while household features such as income, age, period of residency, social status and tenure type are also important. Key words: Energy use, Ireland, appliance ownership, energy efficiency Corresponding Author: [email protected] a The Economic and Social Research Institute, Whitaker Square, Sir John Rogerson’s Quay, Dublin 2, Ireland b Institute for Environmental Studies, Vrije Universiteit, Amsterdam, The Netherlands c Department of Engineering and Public Policy, Carnegie Mellon University, Pittsburgh, PA, USA ESRI working papers represent un-refereed work-in-progress by members who are solely responsible for the content and any views expressed therein. Any comments on these papers will be welcome and should be sent to the author(s) by email. Papers may be downloaded for personal use only.

Welcome message from author
This document is posted to help you gain knowledge. Please leave a comment to let me know what you think about it! Share it to your friends and learn new things together.
Transcript
www.esri.ie
4
Working Paper No. 219
November 2007
Energy-Using Appliances and Energy-Saving Features: Determinants of Ownership in Ireland
Joe O’Dohertya, Seán Lyonsa and Richard S.J. Tola,b,c
Abstract: Energy usage and energy efficiency are of increasing concern in Ireland. Regression analyses on a large household micro-dataset reveal that those homes that have more energy-saving features are also likely to have a high ‘potential energy use’. Statistically significant dwelling features include location, value and dwelling type, while household features such as income, age, period of residency, social status and tenure type are also important. Key words: Energy use, Ireland, appliance ownership, energy efficiency
Corresponding Author: [email protected]
a
The Economic and Social Research Institute, Whitaker Square, Sir John Rogerson’s Quay, Dublin 2, Ireland b Institute for Environmental Studies, Vrije Universiteit, Amsterdam, The Netherlands
c Department of Engineering and Public Policy, Carnegie Mellon University, Pittsburgh, PA,
USA
ESRI working papers represent un-refereed work-in-progress by members who are solely responsible for the content and any views expressed therein. Any comments on these papers will be welcome and should be sent to the author(s) by email. Papers may be downloaded for personal use only.
Energy-Using Appliances and Energy-Saving Features: Determinants of Ownership in Ireland
1 Introduction
Domestic energy demand is determined both by the number of households and their
characteristics, in particular the extent to which they employ energy-using appliances
and avail of energy-saving features. This paper investigates the determinants of
domestic ownership of energy-using appliances and energy-saving features in Ireland,
a country that has seen rapid economic and demographic change in the last fifteen
years, and where the household sector accounts for 23 per cent of total energy
consumption (O’Leary et al., 2007).
Household energy use has been a popular topic of study in the literature on
energy policy and economics. Energy requirements of household consumption have
been studied in The Netherlands (Biesiot and Noorman, 1999; Vringer et al., 2007;
Weber and Perrels, 2000), Sweden (Carlsson-Kanyama et al., 2005), the United States
(O’Neill and Chen, 2002), Brazil (Cohen et al., 2005). Lenzen et al. (2006) present a
comparative study of Australia, Brazil, Denmark, India and Japan. Aggregating
energy use and demand from the analysis of data on appliance ownership and usage –
as is undertaken in this study – has been conducted previously in Malaysia (Saidur et
al., 2007), the United Kingdom (Yao and Steemers, 2005; Efstathiou et al., 2004;
Mansouri et al., 1996), Austria (Haas et al., 1998), and Australia (Hart and de Dear,
2003).
In Ireland, the study of domestic energy usage has been quite limited. Healy and
Clinch (2002, 2004) present the results of two surveys of 1,500 households, with a
focus on fuel poverty. Clinch et al. (2001) and Clinch and Healy (2003) develop a
model of improvements in domestic energy efficiency that incorporates both
appliance usage and domestic energy-saving features. In relation to energy-saving
features in homes, Scott (1997) provides an overview of literature in this area, as well
as conducting a replication study of ownership of these items, highlighting the
difficulties that can exist when potential owners seek to install such features in their
own homes.
In this study we use a large household micro-dataset to estimate two models.
The first examines the characteristics of households that own large numbers of
2

energy-using appliances, and the second investigates the relationship between
household characteristics and energy-saving features.
The most comprehensive effort to investigate the relationships between
household and dwelling characteristics in Ireland is the National Survey of Housing
Quality, 2001-2002 (NSHQ; Watson and Williams, 2003). The survey ‘obtained
detailed information from a representative sample of over 40,000 householders on
characteristics and problems of the dwelling, and on the household members’ (ibid,
v). As such, it provides a snapshot of a household’s appliances and mains connectivity
status.1 However, Watson and Williams (2003) only provide descriptive statistics.
Here, we econometrically analyse the data from the NSHQ.
By conducting regression analysis on the data from the NSHQ, it is possible to
determine what factors influence the appliance ownership status and prevalence of
energy-saving features in Irish households.
We find that similar sets of factors are associated with having larger numbers of
energy-saving devices and energy-using appliances. Detached homes that are new and
expensive are likely to have more energy-saving features, but are also likely to have
more appliances than older, less expensive homes. Similarly, households with higher
incomes and who own their home are more likely to have more energy-saving
features. Other factors such as the length of time a household has been resident at its
current address, respondent age and tenure type were also found to be significant in
these models.
The remainder of this paper proceeds as follows. The next section analyses data
from the National Survey of Housing Quality 2001-2002 (NSHQ). Section 3 outlines
the theoretical model being analysed. Section 4 presents the results from our
econometric analysis. Finally, the concluding section draws inferences from each of
the preceding sections.
2 Data
The Irish National Survey of Housing Quality (NSHQ) was carried out in 2001-2002.
The survey gathered information from a sample of over 40,000 householders on
characteristics and problems of the dwelling, and on household members.
1 The NSHQ has so far been a once-off survey, commissioned by the Department of the Environment, Heritage and Local Government (DEHLG) and conducted by the Economic and Social Research Institute. As such, conducting any time-series analysis on the data was impossible.
3

The questions asked in the NSHQ are not sufficient to explain total energy usage by
households – such a project would require more extensive data on details of
appliances, analysis of their efficiency, and the frequency with which they are used –
but they do allow us to model the quantity of appliances present in households. The
survey asks about the presence of the following items: refrigerator, freezer,
microwave oven, dishwasher, clothes washer, clothes dryer or washer/dryer, shower,
TV, VCR, telephone and personal computer. We used these data to construct a
variable measuring the size of the set of appliance types held by each household. This
variable takes a maximum value of eleven (i.e. there are twelve categories, as a home
can also have none of the above appliances). It must be noted that the methods of
accounting for appliance ownership that are employed in this paper in effect only
count the presence of certain appliances. We do not know the intensity of usage of
these appliances in particular households, and we also do not know when a household
has more than one appliance of a given class.
There is likely to be a wide disparity in the amount of energy used by each of
these appliance types. Given ‘normal’ rates of usage and power, a VCR will use more
energy than a refrigerator, for example. To allow for this in a stylised way, we apply a
weight to each appliance type based on the proportion of overall energy that a
representative model regularly consumes. Weights were obtained for this purpose
from Fawcett et al. (2000). This study indicates the total electricity consumption by
appliance type in households in three countries, the UK, Portugal and the Netherlands.
Given the broad similarity in the availability of appliances in the UK and Ireland, we
chose the UK weights as the best proxy for energy usage of Irish household
appliances. The energy-weighted appliance number variable was then re-scaled to a
zero-one interval, so that it could be used in the model outlined in the next section.
For the other part of this analysis – specifically, the presence of energy-saving
items in homes – the NSHQ again proved to be a valuable source of data. The survey
asked respondents about the presence of the following items in their homes: Wall
insulation, enclosed porch, roof insulation, double glazing, draft stripping, low-energy
light bulbs, insulated hot water cylinder, central heating controls, separate timer for
water heating. For two reasons, we decided not to apply weights to each of these
features to allow for the energy-saving benefits each allows. First, performance
standards for the listed features vary widely. For example, roof insulation and double-
glazing technologies have improved significantly, and the NSHQ did not ask
4
respondents to specify the form that each feature took. Second, the NSHQ asked
respondents to indicate the presence of at least one of these features, but does not ask
about the prevalence of each feature within the home; a home may have just a few
energy-saving light bulbs or only some of its windows double-glazed, for example.
The dependent variable in this instance is thus a simple count of the number of
energy-saving features present in a home.
Both of the dependent variables described above were employed in regressions
against explanatory variables that are detailed in Table 1 and Table 2.2
The next section will detail the models employed in this analysis.
3 Models
In order to model the determinants of energy usage in Ireland we employ a Papke-
Wooldridge generalised linear modelling (GLM) estimator. This method was first
employed by Papke and Wooldridge (1996) to investigate employee participation in
pension plans, and a thorough description of this modelling procedure is contained in
that paper. Essentially, this is a fractional logit model that involves the use of a
dependent variable that is constrained to minimum and maximum values of zero and
one. The model estimates the marginal effects of a GLM modelling procedure on this
variable. The dependent variable was detailed in the previous section.
In the decade since this modelling technique was first employed, it has been
used in a variety of policy areas, including sport, energy, finance and health, and is
particularly useful in for this paper, where observations are distributed between a
defined minimum and maximum that can be rescaled to zero and one.
In order to analyse those factors that affect the total number of energy-saving
features present in a household, a Poisson count model was employed. For an
overview of Poisson models, see Wooldridge (2002) or El Sayyad (1973). Poisson
models have been used to analyse a very wide variety of dependent variables, from
the number of goals scored in football matches (see Karlis and Ntzoufras, 2003) to the
frequency of bombs landing on parts of London in World War 2 (see Feller, 1957). In
general, they can be employed in situations where one wishes to interpret a count of
events or items as a dependent variable. As it is employed here, outcomes were
2 Unfortunately, there were only a limited number of observations for the total floor space of the dwelling and for the length of ownership by the household currently living in the dwelling, so these were omitted from this analysis.
5
limited to whole numbers between zero and nine, inclusive, indicating the total
number of energy-saving items in each household.
4 Results
This section presents the results of the two regressions run on the NSHQ data, a
Papke-Wooldridge fractional logit model for the weighted number of energy-using
items in a residence, and a Poisson count model for analysing the determinants of the
number of energy-saving devices in a dwelling.3
Weighted number of energy-using appliances – potential energy use
Twelve energy-using appliances4 were accorded a weight based on the proportion of
total electricity consumption that can be apportioned to its usage (weights adapted
from Fawcett et al, 2000). This variable was rescaled such that the maximum value
was one and, accordingly, each household was ranked on a 0-1 scale. We refer to this
as potential energy use. The results of this regression are shown in Table 3. For a
given variable, a coefficient of 0.2 means that a unit change in that variable would
result in a change of 0.2 along the 0-1 interval, holding all other variables at their
respective means. Accordingly, some of the results are presented here as percentage
changes, indicating the effect on the dependent variable of a unit change in an
independent variable.
As shown in Table 3, nearly all of the tested variables have a high level of
significance in this regression. The results shown in Table 3 indicate that the
following factors have a positive influence on owning more appliances:
Off-peak mains electricity: Having off-peak mains electricity increases a
household’s potential energy use by 1.3%.
House value: For every £100,000 increase in the value of a house, potential energy
use increases by 4.4%.
Household income: For every £100 increase in household income potential energy
use increases by 0.6%.
3 A Poisson model was chosen over a negative binomial count model after it was tested for overdispersion and no evidence was found to suggest that this was present. 4 The twelve appliances are Refrigerator, Freezer, Microwave Oven, Dishwasher, Clothes Washer, Clothes Dryer, Washer/dryer, shower, TV, VCR, Telephone and PC. Note that clothes dryer and washer/dryer are mutually exclusive, and as such the maximum number that any household can have is eleven.
6

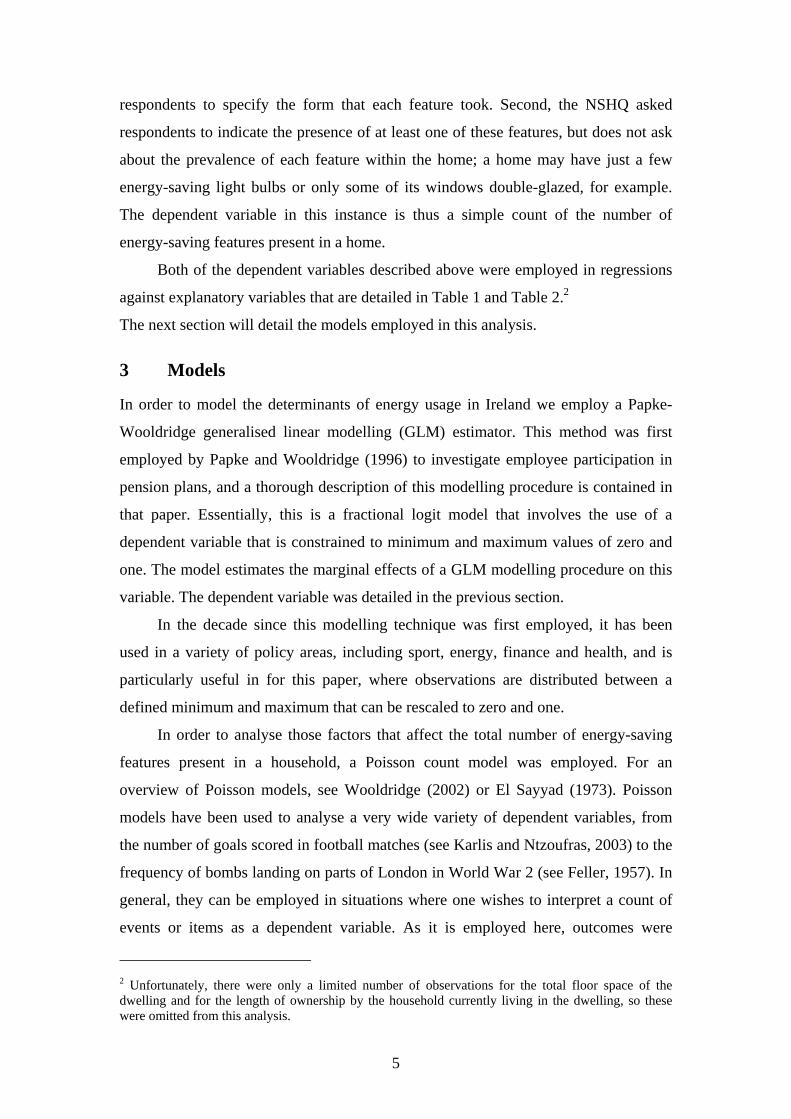
House age: Compared to the omitted variable, ‘before 1900’, all but one of the other
variables in this group are likely to use more energy (living in a house built in the
period ‘1900-1940’ is likely to reduce energy use, but this result is not statistically
significant). However, this does not follow a chronological trend, as is demonstrated
in Figure 1.
[Figure 1 about here]
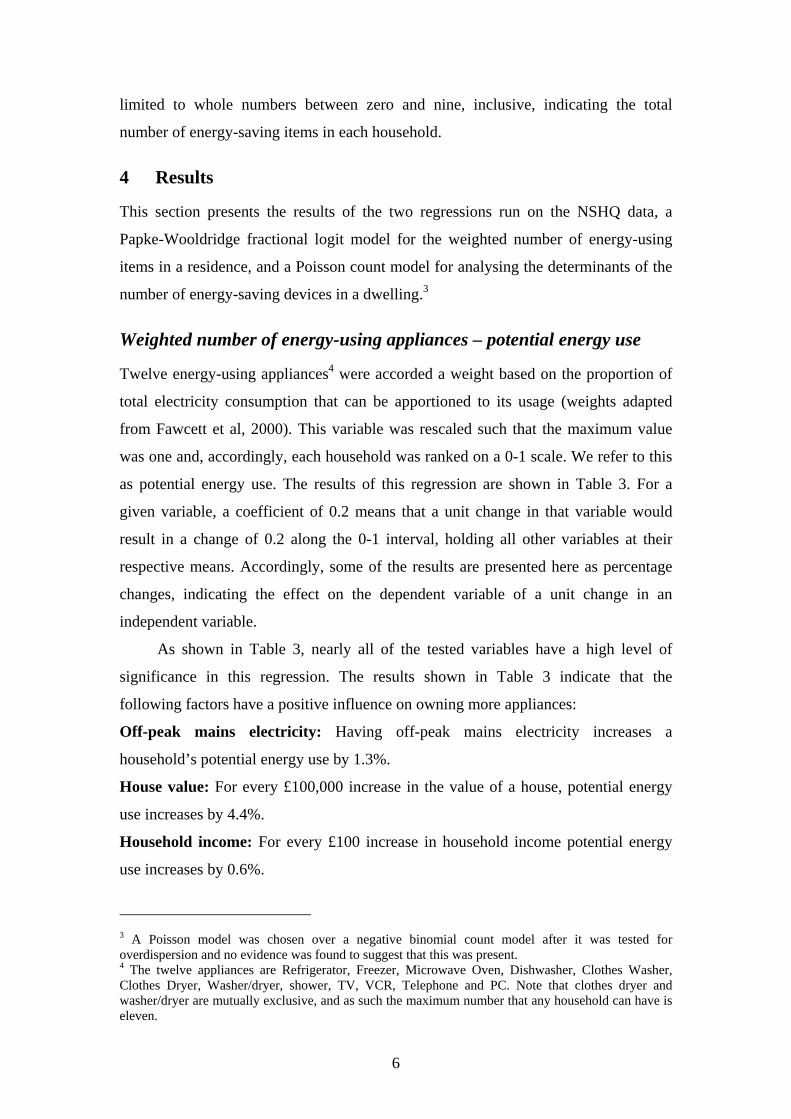
Household type: Compared to the omitted variable, ‘1 adult under 65’, other
household types have a higher potential use of energy, except for households
composed of ‘1 adult over 65’, which have 3% less energy use potential. ‘Couples
with children’ have 11.8% higher potential energy use than the base category, while
other types of households (‘Other families with children’, ‘parents with grown-up
children’, ‘all adults under 65’ and ‘all adults over 65’) have 6.9%-9.4% higher
potential energy use. These results are illustrated in Figure 2.
[Figure 2 about here]
The following factors have a negative influence on potential energy use:
Years at this address: For every additional ten years a household has been resident at
an address it’s potential energy use falls by 0.8%.
Tenure type: Compared to the omitted variable, ‘own outright’, households with all
other forms of tenure are likely to have lower potential energy use (although
‘purchasing’ is not statistically significant at the 10% level), particularly local
authority renters and private renters, membership of which decreases a household’s
potential energy use by 8% and 11%, respectively.
Social status: Compared to the omitted variable, ‘high professional’, each of the other
classes is likely to have lower potential energy use. This is illustrated in Figure 3.
Note that ‘low professional’ is not statistically significant.
[Figure 3 about here]
Dwelling type: Compared to the omitted variable, ‘detached’, each of the other
variables is likely to lower potential use. There is substantial variation among the
7

dwelling type effects. Living in a semi-detached house reduces a household’s
potential energy use by 1.8% compared to the detached house baseline, and living in a
terraced house or a purpose-built apartment confers a similar reduction of 2.5%. In
contrast, living in an apartment in a converted house reduces a household’s potential
energy use by 7.4% and living in a caravan is associated with a reduction of 14%.
Finally for this regression, there is mixed evidence with regard to age and
location. Compared to the omitted variable, ‘under 40’, householders in the ‘40-64’
age category are likely to have more appliances, increasing their potential energy use
by 1.4%. On the other hand, those in the ‘over 65’ age category have potential use 2%
lower than the base category. Geographical location does not seem to be associated
with significant variations in potential use of energy.
Number of energy-saving features:
We estimated a Poisson model to explain the total number of energy-saving features
in each household. Table 4 shows the results from this regression, and the results are
summarised below.
The results are presented as ‘Incident Rate Ratios’ (IRR), rather than
coefficients.5
As can be seen from Table 4, nearly all of the tested variables have a high level
of significance in the Poisson model. The results shown in Table 4 indicate that the
following factors have a positive influence on having more energy-saving features:
Off-peak mains electricity: Having off-peak mains electricity increases the expected
number of energy-saving features in the dwelling by 4.5%.
House value: For every £100,000 increase in the value of a house the expected
number of energy-saving features in the dwelling increases by 3.4%.
Household income: For every £100 increase in household income the expected
number of energy-saving features in the dwelling increases by 1.1%.
5 The relationship between the coefficient and the IRR for any variable is , where β is the coefficient as it might normally be interpreted. As coefficients are defined as the difference between the
log of expected counts, where formally, this can be written as
βeIRR =
⎟⎟⎠
⎞⎜⎜⎝
⎛=−= +
+X
XXX µ
µµµβ 1
1 log)log()log( ,
where β is the regression coefficient, µ is the expected count and the subscripts represent where the predictor variable, say X, is evaluated at x and x+1 (implying a one unit change in the predictor variable X). Therefore eβ is the ratio of two consecutive count estimates, and is more easily interpreted.
8
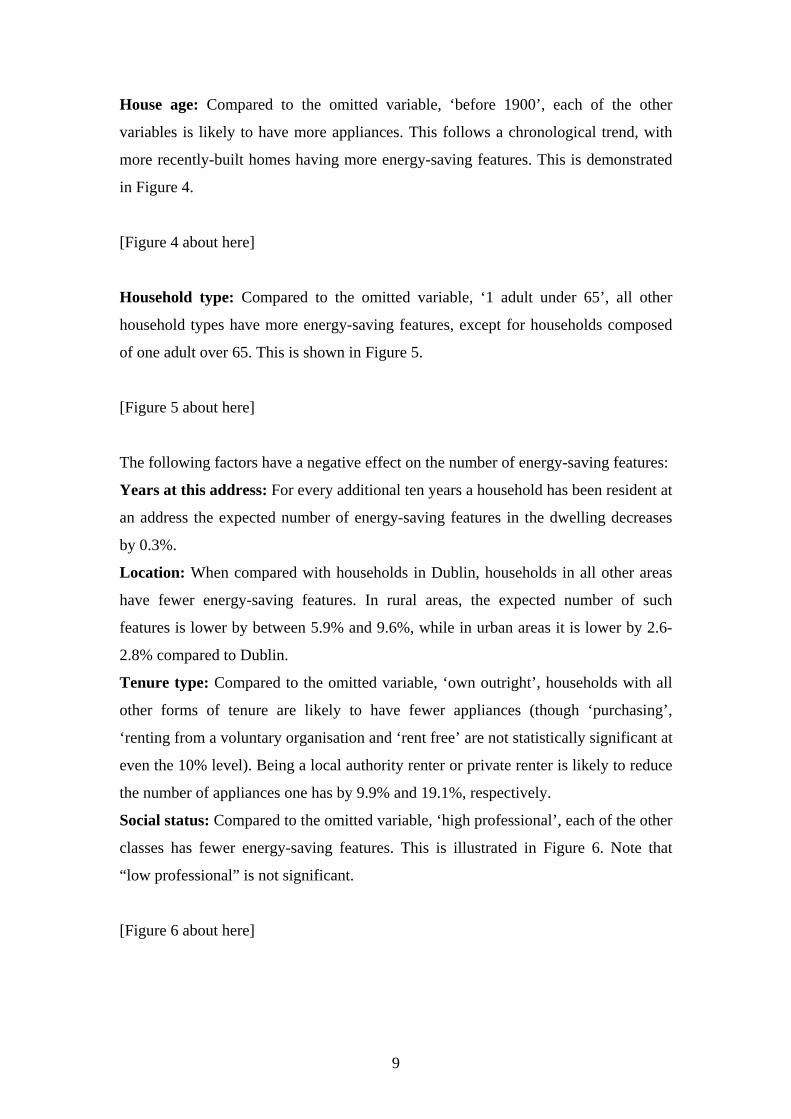
House age: Compared to the omitted variable, ‘before 1900’, each of the other
variables is likely to have more appliances. This follows a chronological trend, with
more recently-built homes having more energy-saving features. This is demonstrated
in Figure 4.
[Figure 4 about here]
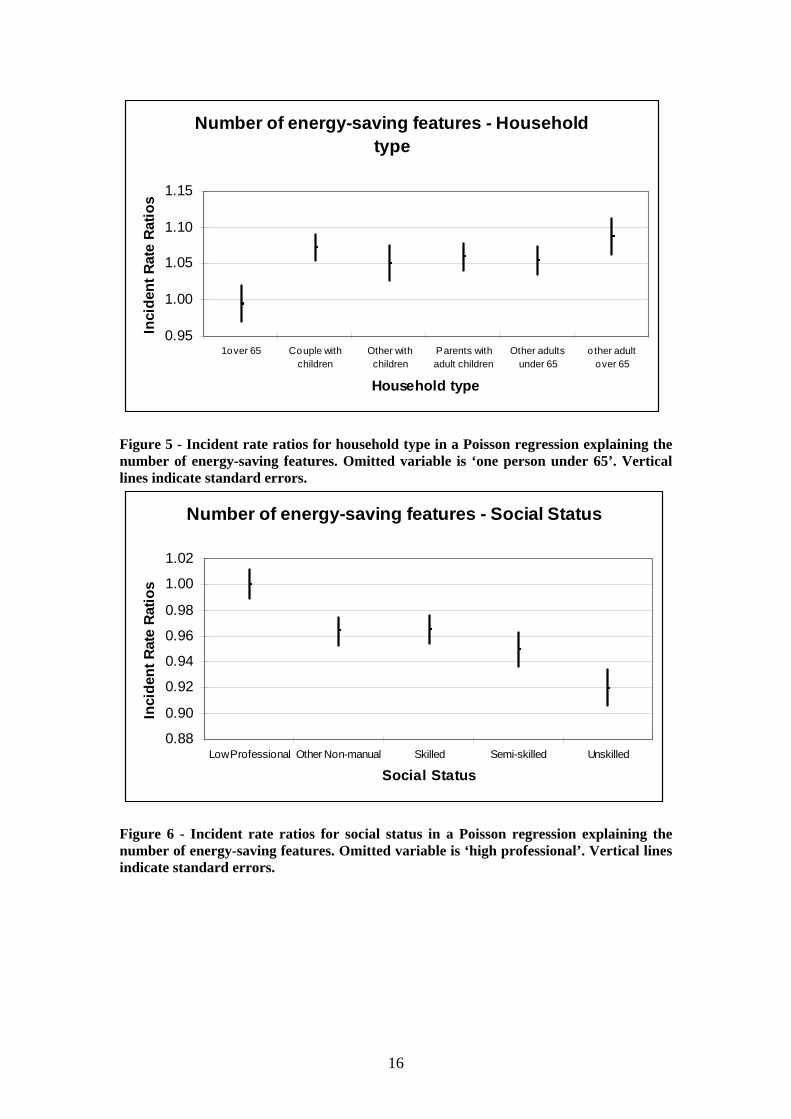
Household type: Compared to the omitted variable, ‘1 adult under 65’, all other
household types have more energy-saving features, except for households composed
of one adult over 65. This is shown in Figure 5.
[Figure 5 about here]
The following factors have a negative effect on the number of energy-saving features:
Years at this address: For every additional ten years a household has been resident at
an address the expected number of energy-saving features in the dwelling decreases
by 0.3%.
Location: When compared with households in Dublin, households in all other areas
have fewer energy-saving features. In rural areas, the expected number of such
features is lower by between 5.9% and 9.6%, while in urban areas it is lower by 2.6-
2.8% compared to Dublin.
Tenure type: Compared to the omitted variable, ‘own outright’, households with all
other forms of tenure are likely to have fewer appliances (though ‘purchasing’,
‘renting from a voluntary organisation and ‘rent free’ are not statistically significant at
even the 10% level). Being a local authority renter or private renter is likely to reduce
the number of appliances one has by 9.9% and 19.1%, respectively.
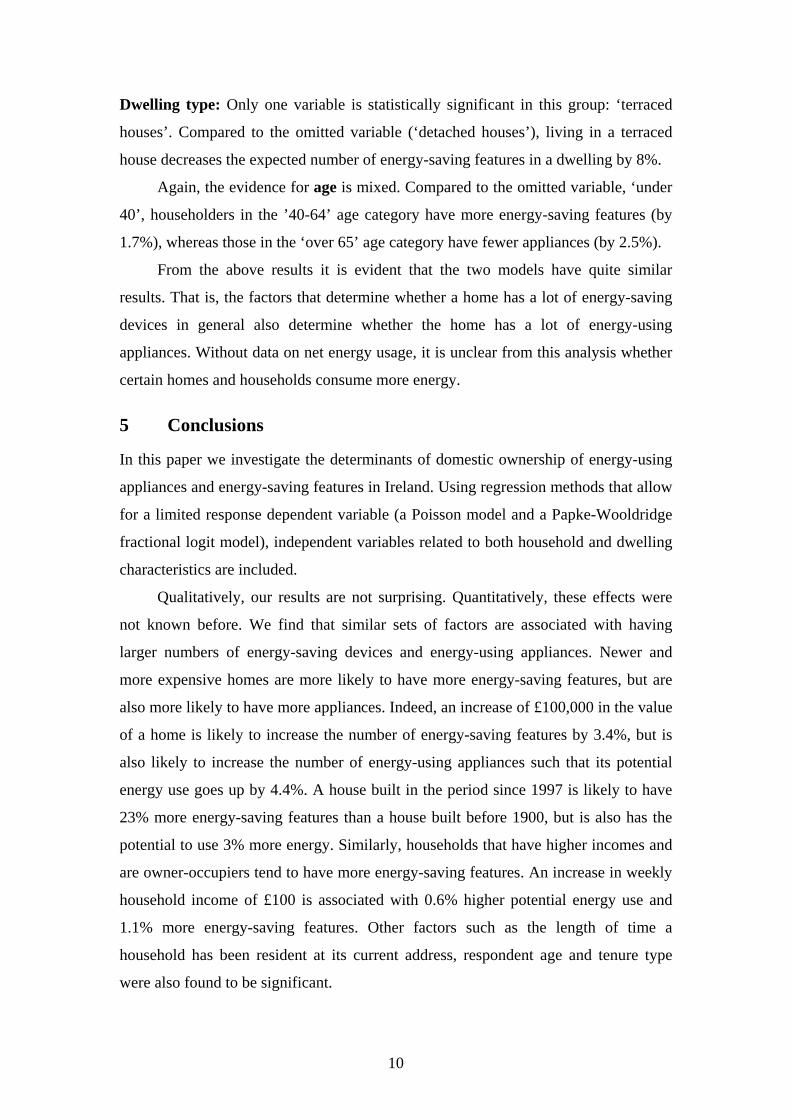
Social status: Compared to the omitted variable, ‘high professional’, each of the other
classes has fewer energy-saving features. This is illustrated in Figure 6. Note that
“low professional” is not significant.
[Figure 6 about here]
9
Dwelling type: Only one variable is statistically significant in this group: ‘terraced
houses’. Compared to the omitted variable (‘detached houses’), living in a terraced
house decreases the expected number of energy-saving features in a dwelling by 8%.
Again, the evidence for age is mixed. Compared to the omitted variable, ‘under
40’, householders in the ’40-64’ age category have more energy-saving features (by
1.7%), whereas those in the ‘over 65’ age category have fewer appliances (by 2.5%).
From the above results it is evident that the two models have quite similar
results. That is, the factors that determine whether a home has a lot of energy-saving
devices in general also determine whether the home has a lot of energy-using
appliances. Without data on net energy usage, it is unclear from this analysis whether
certain homes and households consume more energy.
5 Conclusions
In this paper we investigate the determinants of domestic ownership of energy-using
appliances and energy-saving features in Ireland. Using regression methods that allow
for a limited response dependent variable (a Poisson model and a Papke-Wooldridge
fractional logit model), independent variables related to both household and dwelling
characteristics are included.
Qualitatively, our results are not surprising. Quantitatively, these effects were
not known before. We find that similar sets of factors are associated with having
larger numbers of energy-saving devices and energy-using appliances. Newer and
more expensive homes are more likely to have more energy-saving features, but are
also more likely to have more appliances. Indeed, an increase of £100,000 in the value
of a home is likely to increase the number of energy-saving features by 3.4%, but is
also likely to increase the number of energy-using appliances such that its potential
energy use goes up by 4.4%. A house built in the period since 1997 is likely to have
23% more energy-saving features than a house built before 1900, but is also has the
potential to use 3% more energy. Similarly, households that have higher incomes and
are owner-occupiers tend to have more energy-saving features. An increase in weekly
household income of £100 is associated with 0.6% higher potential energy use and
1.1% more energy-saving features. Other factors such as the length of time a
household has been resident at its current address, respondent age and tenure type
were also found to be significant.
10
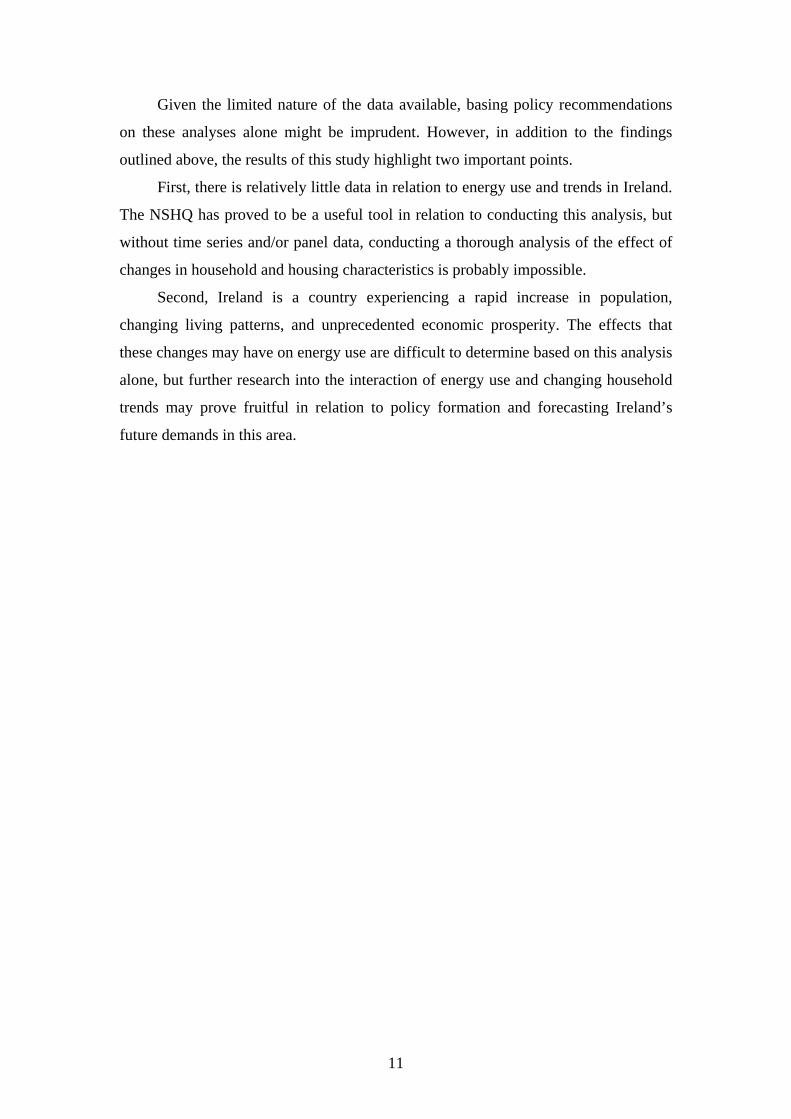
Given the limited nature of the data available, basing policy recommendations
on these analyses alone might be imprudent. However, in addition to the findings
outlined above, the results of this study highlight two important points.
First, there is relatively little data in relation to energy use and trends in Ireland.
The NSHQ has proved to be a useful tool in relation to conducting this analysis, but
without time series and/or panel data, conducting a thorough analysis of the effect of
changes in household and housing characteristics is probably impossible.
Second, Ireland is a country experiencing a rapid increase in population,
changing living patterns, and unprecedented economic prosperity. The effects that
these changes may have on energy use are difficult to determine based on this analysis
alone, but further research into the interaction of energy use and changing household
trends may prove fruitful in relation to policy formation and forecasting Ireland’s
future demands in this area.
11

Bibliography
Biesiot, W and KJ Noorman (1999): Energy Requirements of Household Consumption: A Case Study of the Netherlands; Ecological Economics 28, 367-383
Carlsson-Kanyama, A, R Engström and R Kok (2005): Indirect and Direct Energy Requirements of City Households in Sweden: Options for Reduction, Lessons from Modeling; Journal of Industrial Ecology 9(1-2), 221-236
Clinch, JP and JD Healy (2003): Valuing Improvements in Comfort from Domestic Energy Efficiency Retrofits using a Trade-Off Simulation Model; Energy Economics 25, 565-583
Clinch, JP, JD Healy and C King (2001): Modelling Improvements in Domestic Energy Efficiency; Environmental Modelling & Software 16, 87-106
Cohen, C, M Lenzen, R Schaeffer (2005): Energy Requirements of Households in Brazil; Energy Policy 33, 555-562
El Sayyad, GM (1973): Bayesian and Classical Analysis of Poisson Regression; Journal of the Royal Statistical Society – Series B (Methodological) 35(3), 445-451
Efstathiou, A, D Grant and S Maxwell (2004): The ownership and use of small kitchen domestic appliances: case study, Liverpool; International Journal of Consumer Studies 28(3), 305–311
Fawcett, T, K Lane and B Boardman (2000): Carbon Futures for European Households; University of Oxford Environmental Change Institute; Oxford
Feller, W (1957): An Introduction to Probability Theory and its Applications; Wiley; New York
Haas, R, P Biermayr, J Zoechling and H Auer (1998): Impact on Electricity Consumption of Household Appliances in Austria: a comparison of time series and cross-section analyses; Energy Policy 26(13), 1031-1040
Hart, M and R de Dear (2003): Weather Sensitivity in Household Appliance Energy End-use; Energy and Buildings 36, 161-174
Healy, JD and JP Clinch (2002): Fuel Poverty, Thermal Comfort and Occupancy: Results of a National Household Survey in Ireland, Applied Energy 73 (3-4), 329-343
Healy, JD and JP Clinch (2004): Quantifying the Severity of Fuel Poverty, its Relationship with Poor Housing and Reasons for Non-investment in Energy-Saving Measures in Ireland, Energy Policy 32, 207-220
Karlis, D and I Ntzoufras (2003): Analysis of Sports Data by Using Bivariate Poisson Models; Journal of the Royal Statistical Society: Series D (The Statistician) 52 (3), 381–393
Lenzen, M, M Wier, C Cohen, H Hayami, S Pachauri and R Schaeffer (2006): A Comparative Multivariate Analysis of Household Energy Requirements in Australia, Brazil, Denmark, India and Japan; Energy 31, 181-207
Mansouri, I, M Newborough and D Probert (1996): Energy Consumption in UK Households: Impact of Domestic Electrical Appliances; Applied Energy 54(3), 211-285
12

O’Leary, F, M Howley and B O’Gallachóir (2007): Energy Efficiency in Ireland; Sustainable Energy Ireland; Cork
O’Neill, BC and BS Chen (2002): Demographic Determinants of Household Energy Use in the United States; Population and Development Review 28, 53-88
Papke, LE and JM Wooldridge (1996): Econometric Methods for Fractional Response Variables with an Application to 401 (K) Plan Participation Rates; Journal of Applied Econometrics 11(6), 619-632
Saidur, R, HH Masjuki, MY Jamaluddin and S Ahmed (2007): Energy and Associated Greenhouse Gas Emissions from Household Appliances in Malaysia; Energy Policy 35, 1648-1657
Scott, S (1997): Household Energy Efficiency in Ireland: A Replication Study of Ownership of Energy Saving Items; Energy Economics 19, 187-208
Vringer, K, T Aalbers and K Blok (2007): Household Energy Requirement and Value Patterns; Energy Policy 35, 553–566
Watson, Dorothy and James Williams (2003): Irish National Survey of Housing Quality; The Economic and Social Research Institute, Dublin
Weber, C and A Perrels (2000): Modelling Lifestyle Effects on Energy Demand and Related Emissions; Energy Policy 28 (2000), 549-566
Wooldridge, J.M. (2002): Econometric Analysis of Cross-section and Panel Data; MIT Press; Cambridge
Yao, R and K Steemers (2005): A Method of Formulating Energy Load Profile for Domestic Buildings in the UK
13

Figures
Potential energy usage - House age
-0.01
0.00
0.01
0.02
0.03
0.04
1900-40 1941-60 1961-70 1971-80 1981-90 1991-96 After 97House age
MFX
coe
ffici
ents
- ef
fect
on
0-1
sca
le
Figure 1 - Marginal effects of house age on potential energy usage in Papke-Wooldridge regression. Omitted variable is 'before 1900'. Vertical lines indicate standard errors.
Potential energy usage - Household type
-0.05
0.00
0.05
0.10
0.15
1 over 65 Couple withchildren
Other withchildren
Parents withadult children
Other adultsunder 65
other adultover 65
Household type
MFX
coe
ffici
ents
- ef
fect
on
0-1
sca
le
Figure 2 - Marginal effects of household type on potential energy usage in Papke-Wooldridge regression. Omitted variable is 'one person under 65'. Vertical lines indicate standard errors.
14

Potential energy usage - Social Status
-0.07
-0.06
-0.05
-0.04
-0.03
-0.02
-0.01
0.00
LowProfessional
Other Non-manual
Skilled Semi-skilled Unskilled
Social Status
MFX
coe
ffici
ents
- ef
fect
on
0-1
scal
e
Figure 3 - Marginal effects of social status on potential energy usage in Papke-Wooldridge regression. Omitted variable is 'high professional'. Vertical lines indicate standard errors.
Number of energy-saving features - House age
0.90
0.95
1.00
1.05
1.10
1.15
1.20
1.25
1900-40 1941-60 1961-70 1971-80 1981-90 1991-96 After 97
House age
Inci
dent
Rat
e R
atio
s
Figure 4 - Incident rate ratios for house age in a Poisson regression explaining the number of energy-saving features. Omitted variable is ‘before 1900’. Vertical lines indicate standard errors.
15
Number of energy-saving features - Household type
0.95
1.00
1.05
1.10
1.15
1 over 65 Couple withchildren
Other withchildren
Parents withadult children
Other adultsunder 65
other adultover 65
Household type
Inci
dent
Rat
e Ra
tios
Figure 5 - Incident rate ratios for household type in a Poisson regression explaining the number of energy-saving features. Omitted variable is ‘one person under 65’. Vertical lines indicate standard errors.
Number of energy-saving features - Social Status
0.88
0.90
0.92
0.94
0.96
0.98
1.00
1.02
Low Professional Other Non-manual Skilled Semi-skilled Unskilled
Social Status
Inci
dent
Rat
e R
atio
s
Figure 6 - Incident rate ratios for social status in a Poisson regression explaining the number of energy-saving features. Omitted variable is ‘high professional’. Vertical lines indicate standard errors.
16
Tables
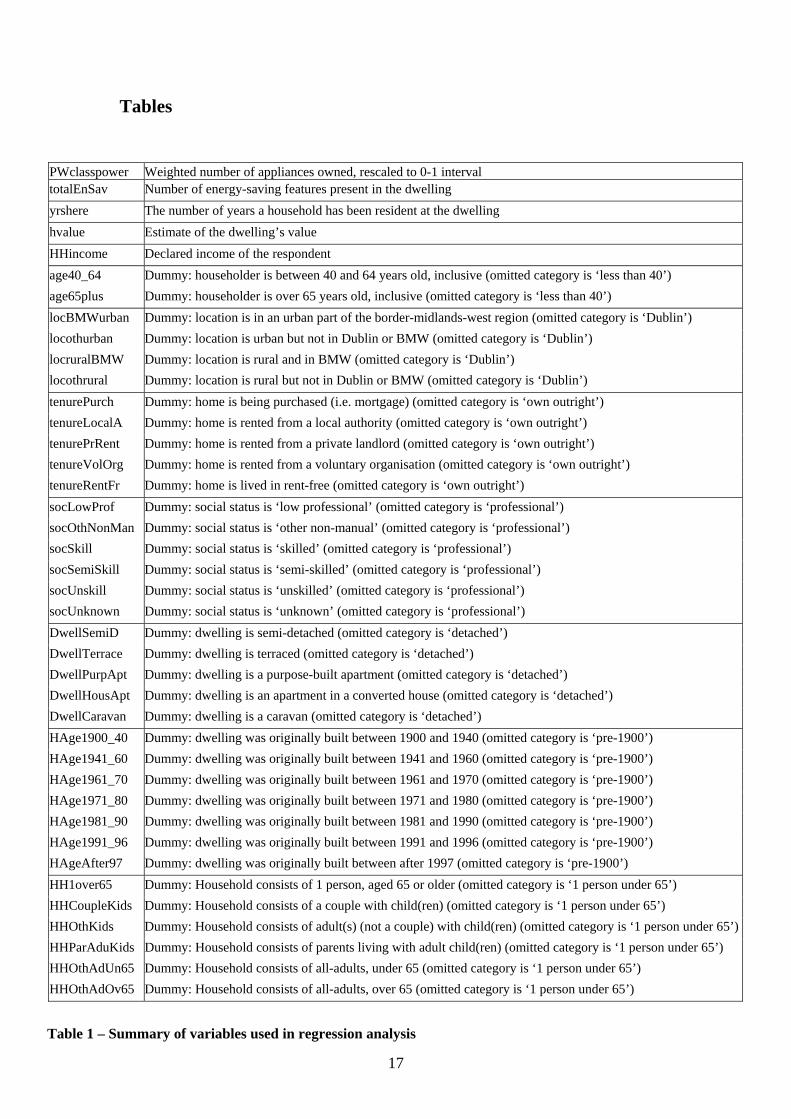
PWclasspower Weighted number of appliances owned, rescaled to 0-1 interval totalEnSav Number of energy-saving features present in the dwelling yrshere The number of years a household has been resident at the dwelling hvalue Estimate of the dwelling’s value HHincome Declared income of the respondent age40_64 Dummy: householder is between 40 and 64 years old, inclusive (omitted category is ‘less than 40’) age65plus Dummy: householder is over 65 years old, inclusive (omitted category is ‘less than 40’) locBMWurban Dummy: location is in an urban part of the border-midlands-west region (omitted category is ‘Dublin’) locothurban Dummy: location is urban but not in Dublin or BMW (omitted category is ‘Dublin’) locruralBMW Dummy: location is rural and in BMW (omitted category is ‘Dublin’) locothrural Dummy: location is rural but not in Dublin or BMW (omitted category is ‘Dublin’) tenurePurch Dummy: home is being purchased (i.e. mortgage) (omitted category is ‘own outright’) tenureLocalA Dummy: home is rented from a local authority (omitted category is ‘own outright’) tenurePrRent Dummy: home is rented from a private landlord (omitted category is ‘own outright’) tenureVolOrg Dummy: home is rented from a voluntary organisation (omitted category is ‘own outright’) tenureRentFr Dummy: home is lived in rent-free (omitted category is ‘own outright’) socLowProf Dummy: social status is ‘low professional’ (omitted category is ‘professional’) socOthNonMan Dummy: social status is ‘other non-manual’ (omitted category is ‘professional’) socSkill Dummy: social status is ‘skilled’ (omitted category is ‘professional’) socSemiSkill Dummy: social status is ‘semi-skilled’ (omitted category is ‘professional’) socUnskill Dummy: social status is ‘unskilled’ (omitted category is ‘professional’) socUnknown Dummy: social status is ‘unknown’ (omitted category is ‘professional’) DwellSemiD Dummy: dwelling is semi-detached (omitted category is ‘detached’) DwellTerrace Dummy: dwelling is terraced (omitted category is ‘detached’) DwellPurpApt Dummy: dwelling is a purpose-built apartment (omitted category is ‘detached’) DwellHousApt Dummy: dwelling is an apartment in a converted house (omitted category is ‘detached’) DwellCaravan Dummy: dwelling is a caravan (omitted category is ‘detached’) HAge1900_40 Dummy: dwelling was originally built between 1900 and 1940 (omitted category is ‘pre-1900’) HAge1941_60 Dummy: dwelling was originally built between 1941 and 1960 (omitted category is ‘pre-1900’) HAge1961_70 Dummy: dwelling was originally built between 1961 and 1970 (omitted category is ‘pre-1900’) HAge1971_80 Dummy: dwelling was originally built between 1971 and 1980 (omitted category is ‘pre-1900’) HAge1981_90 Dummy: dwelling was originally built between 1981 and 1990 (omitted category is ‘pre-1900’) HAge1991_96 Dummy: dwelling was originally built between 1991 and 1996 (omitted category is ‘pre-1900’) HAgeAfter97 Dummy: dwelling was originally built between after 1997 (omitted category is ‘pre-1900’) HH1over65 Dummy: Household consists of 1 person, aged 65 or older (omitted category is ‘1 person under 65’) HHCoupleKids Dummy: Household consists of a couple with child(ren) (omitted category is ‘1 person under 65’) HHOthKids Dummy: Household consists of adult(s) (not a couple) with child(ren) (omitted category is ‘1 person under 65’)HHParAduKids Dummy: Household consists of parents living with adult child(ren) (omitted category is ‘1 person under 65’) HHOthAdUn65 Dummy: Household consists of all-adults, under 65 (omitted category is ‘1 person under 65’) HHOthAdOv65 Dummy: Household consists of all-adults, over 65 (omitted category is ‘1 person under 65’)
Table 1 – Summary of variables used in regression analysis
17
Potential energy use
Papke-Wooldridge regression Number of energy-saving features –
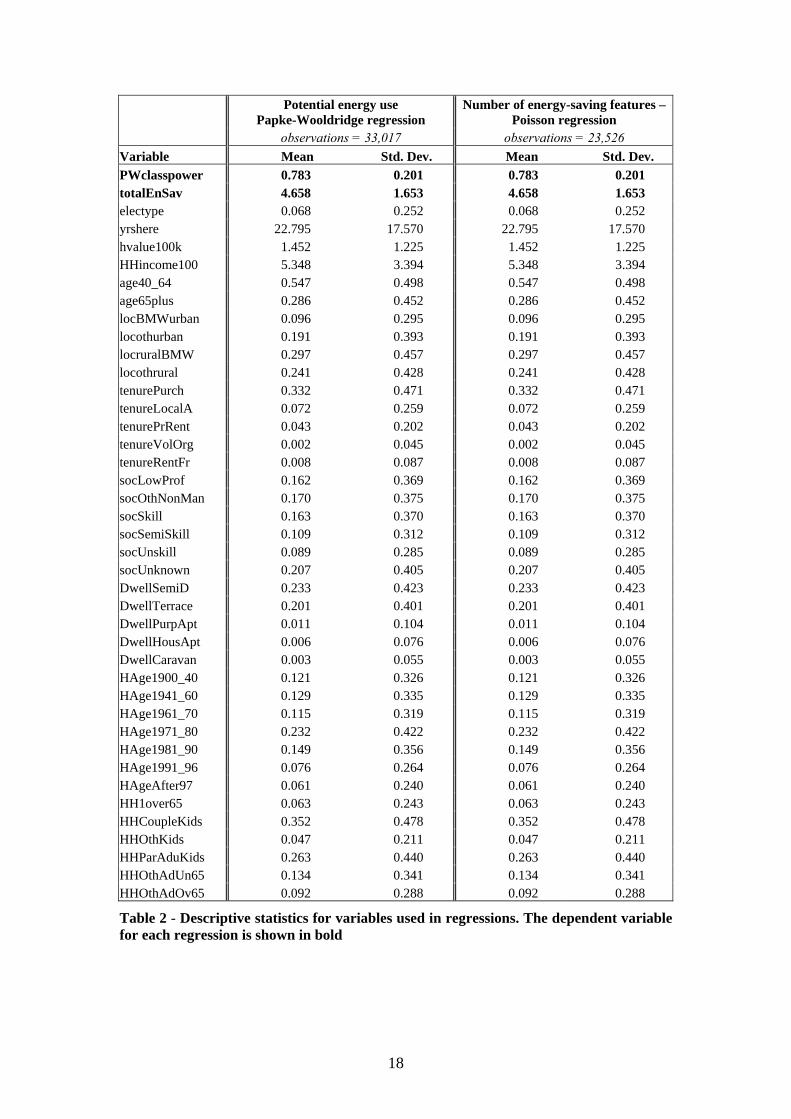
Poisson regression observations = 33,017 observations = 23,526 Variable Mean Std. Dev. Mean Std. Dev. PWclasspower 0.783 0.201 0.783 0.201 totalEnSav 4.658 1.653 4.658 1.653 electype 0.068 0.252 0.068 0.252 yrshere 22.795 17.570 22.795 17.570 hvalue100k 1.452 1.225 1.452 1.225 HHincome100 5.348 3.394 5.348 3.394 age40_64 0.547 0.498 0.547 0.498 age65plus 0.286 0.452 0.286 0.452 locBMWurban 0.096 0.295 0.096 0.295 locothurban 0.191 0.393 0.191 0.393 locruralBMW 0.297 0.457 0.297 0.457 locothrural 0.241 0.428 0.241 0.428 tenurePurch 0.332 0.471 0.332 0.471 tenureLocalA 0.072 0.259 0.072 0.259 tenurePrRent 0.043 0.202 0.043 0.202 tenureVolOrg 0.002 0.045 0.002 0.045 tenureRentFr 0.008 0.087 0.008 0.087 socLowProf 0.162 0.369 0.162 0.369 socOthNonMan 0.170 0.375 0.170 0.375 socSkill 0.163 0.370 0.163 0.370 socSemiSkill 0.109 0.312 0.109 0.312 socUnskill 0.089 0.285 0.089 0.285 socUnknown 0.207 0.405 0.207 0.405 DwellSemiD 0.233 0.423 0.233 0.423 DwellTerrace 0.201 0.401 0.201 0.401 DwellPurpApt 0.011 0.104 0.011 0.104 DwellHousApt 0.006 0.076 0.006 0.076 DwellCaravan 0.003 0.055 0.003 0.055 HAge1900_40 0.121 0.326 0.121 0.326 HAge1941_60 0.129 0.335 0.129 0.335 HAge1961_70 0.115 0.319 0.115 0.319 HAge1971_80 0.232 0.422 0.232 0.422 HAge1981_90 0.149 0.356 0.149 0.356 HAge1991_96 0.076 0.264 0.076 0.264 HAgeAfter97 0.061 0.240 0.061 0.240 HH1over65 0.063 0.243 0.063 0.243 HHCoupleKids 0.352 0.478 0.352 0.478 HHOthKids 0.047 0.211 0.047 0.211 HHParAduKids 0.263 0.440 0.263 0.440 HHOthAdUn65 0.134 0.341 0.134 0.341 HHOthAdOv65 0.092 0.288 0.092 0.288
Table 2 - Descriptive statistics for variables used in regressions. The dependent variable for each regression is shown in bold
18

variable dy/dx Std. Err. z P>|z| Mean electype 0.013 0.004 3.53 0.000 *** 0.066 yrshere -0.001 0.000 -11.18 0.000 *** 23.255 hvalue100k 0.044 0.003 16.34 0.000 *** 1.452 HHincome100 0.006 0.000 16.41 0.000 *** 5.492 age40_64 0.014 0.003 4.54 0.000 *** 0.560 age65plus -0.020 0.004 -4.46 0.000 *** 0.283 locBMWurban -0.009 0.004 -2.15 0.031 ** 0.091 locothurban 0.015 0.003 4.34 0.000 *** 0.196 locruralBMW -0.007 0.005 -1.50 0.133 0.304 locothrural 0.002 0.004 0.46 0.642 0.247 tenurePurch -0.002 0.002 -1.04 0.301 0.354 tenureLocalA -0.081 0.005 -15.27 0.000 *** 0.050 tenurePrRent -0.107 0.008 -14.07 0.000 *** 0.029 tenureVolOrg -0.064 0.027 -2.39 0.017 ** 0.001 tenureRentFr -0.036 0.014 -2.63 0.008 *** 0.006 socLowProf -0.004 0.004 -0.90 0.366 0.168 socOthNonMan -0.016 0.004 -3.77 0.000 *** 0.171 socSkill -0.028 0.004 -6.28 0.000 *** 0.170 socSemiSkill -0.036 0.005 -7.34 0.000 *** 0.108 socUnskill -0.059 0.005 -10.75 0.000 *** 0.086 socUnknown -0.037 0.005 -8.13 0.000 *** 0.193 DwellSemiD -0.018 0.003 -6.24 0.000 *** 0.239 DwellTerrace -0.025 0.003 -7.28 0.000 *** 0.185 DwellPurpApt -0.025 0.012 -2.17 0.030 ** 0.007 DwellHousApt -0.074 0.019 -3.93 0.000 *** 0.003 DwellCaravan -0.140 0.031 -4.46 0.000 *** 0.002 HAge1900_40 -0.001 0.004 -0.34 0.733 0.120 HAge1941_60 0.006 0.004 1.80 0.072 * 0.125 HAge1961_70 0.031 0.004 8.90 0.000 *** 0.116 HAge1971_80 0.029 0.003 8.74 0.000 *** 0.238 HAge1981_90 0.021 0.004 5.62 0.000 *** 0.151 HAge1991_96 0.025 0.004 5.72 0.000 *** 0.075 HAgeAfter97 0.030 0.005 6.37 0.000 *** 0.060 HH1over65 -0.003 0.006 -0.58 0.565 0.059 HHCoupleKids 0.118 0.004 31.35 0.000 *** 0.363 HHOthKids 0.090 0.004 24.85 0.000 *** 0.039 HHParAduKids 0.094 0.004 25.39 0.000 *** 0.267 HHOthAdUn65 0.071 0.004 20.01 0.000 *** 0.132 HHOthAdOv65 0.069 0.004 16.15 0.000 *** 0.094
Table 3 - Papke-Wooldridge regression results for potential energy use; *=significant at the 10% level; **=significant at the 5% level; ***=significant at the 1% level; AIC = Akaike Information Criterion; BIC = Bayesian Information Criterion.
19
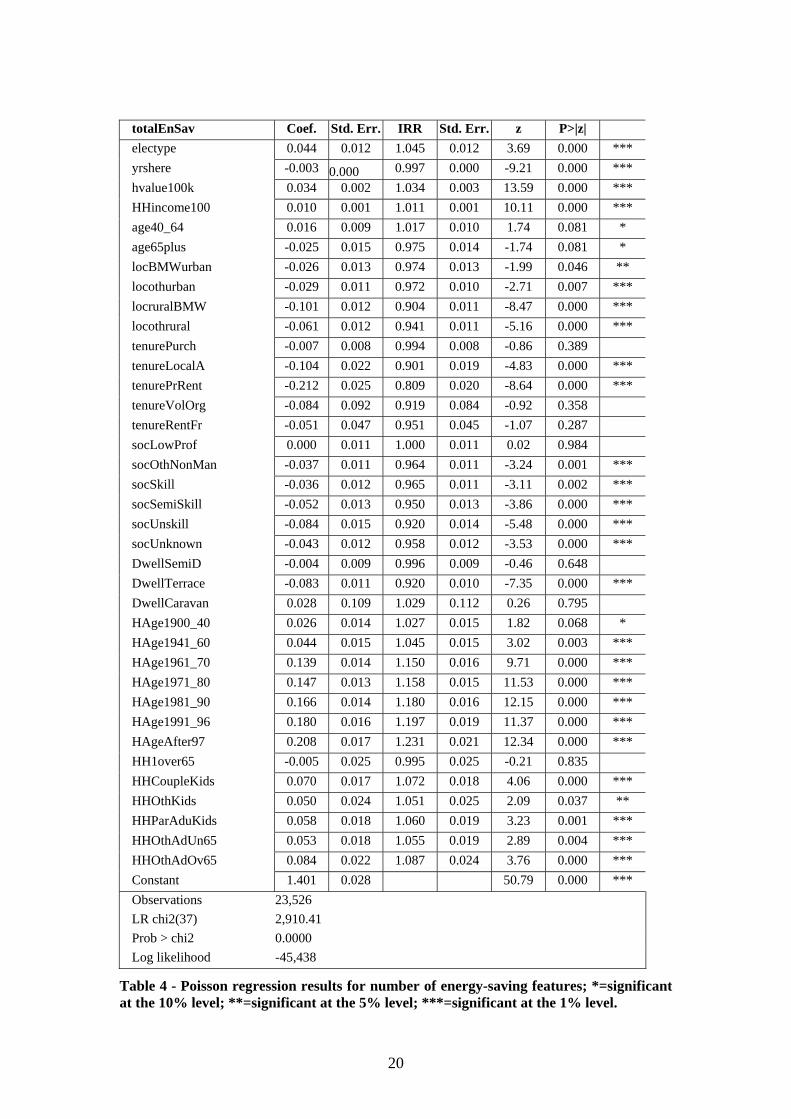
totalEnSav Coef. Std. Err. IRR Std. Err. z P>|z| electype 0.044 0.012 1.045 0.012 3.69 0.000 *** yrshere -0.003 0.000 0.997 0.000 -9.21 0.000 *** hvalue100k 0.034 0.002 1.034 0.003 13.59 0.000 *** HHincome100 0.010 0.001 1.011 0.001 10.11 0.000 *** age40_64 0.016 0.009 1.017 0.010 1.74 0.081 * age65plus -0.025 0.015 0.975 0.014 -1.74 0.081 * locBMWurban -0.026 0.013 0.974 0.013 -1.99 0.046 ** locothurban -0.029 0.011 0.972 0.010 -2.71 0.007 *** locruralBMW -0.101 0.012 0.904 0.011 -8.47 0.000 *** locothrural -0.061 0.012 0.941 0.011 -5.16 0.000 *** tenurePurch -0.007 0.008 0.994 0.008 -0.86 0.389 tenureLocalA -0.104 0.022 0.901 0.019 -4.83 0.000 *** tenurePrRent -0.212 0.025 0.809 0.020 -8.64 0.000 *** tenureVolOrg -0.084 0.092 0.919 0.084 -0.92 0.358 tenureRentFr -0.051 0.047 0.951 0.045 -1.07 0.287 socLowProf 0.000 0.011 1.000 0.011 0.02 0.984 socOthNonMan -0.037 0.011 0.964 0.011 -3.24 0.001 *** socSkill -0.036 0.012 0.965 0.011 -3.11 0.002 *** socSemiSkill -0.052 0.013 0.950 0.013 -3.86 0.000 *** socUnskill -0.084 0.015 0.920 0.014 -5.48 0.000 *** socUnknown -0.043 0.012 0.958 0.012 -3.53 0.000 *** DwellSemiD -0.004 0.009 0.996 0.009 -0.46 0.648 DwellTerrace -0.083 0.011 0.920 0.010 -7.35 0.000 *** DwellCaravan 0.028 0.109 1.029 0.112 0.26 0.795 HAge1900_40 0.026 0.014 1.027 0.015 1.82 0.068 * HAge1941_60 0.044 0.015 1.045 0.015 3.02 0.003 *** HAge1961_70 0.139 0.014 1.150 0.016 9.71 0.000 *** HAge1971_80 0.147 0.013 1.158 0.015 11.53 0.000 *** HAge1981_90 0.166 0.014 1.180 0.016 12.15 0.000 *** HAge1991_96 0.180 0.016 1.197 0.019 11.37 0.000 *** HAgeAfter97 0.208 0.017 1.231 0.021 12.34 0.000 *** HH1over65 -0.005 0.025 0.995 0.025 -0.21 0.835 HHCoupleKids 0.070 0.017 1.072 0.018 4.06 0.000 *** HHOthKids 0.050 0.024 1.051 0.025 2.09 0.037 ** HHParAduKids 0.058 0.018 1.060 0.019 3.23 0.001 *** HHOthAdUn65 0.053 0.018 1.055 0.019 2.89 0.004 *** HHOthAdOv65 0.084 0.022 1.087 0.024 3.76 0.000 *** Constant 1.401 0.028 50.79 0.000 *** Observations 23,526 LR chi2(37) 2,910.41 Prob > chi2 0.0000 Log likelihood -45,438
Table 4 - Poisson regression results for number of energy-saving features; *=significant at the 10% level; **=significant at the 5% level; ***=significant at the 1% level.
20
Year Number Title/Author(s) ESRI Authors/Co-authors Italicised
2007 218 The Public/Private Mix in Irish Acute Public
Hospitals: Trends and Implications Jacqueline O’Reilly and Miriam M. Wiley
217 Regret About the Timing of First Sexual
Intercourse: The Role of Age and Context Richard Layte, Hannah McGee
216 Determinants of Water Connection Type and
Ownership of Water-Using Appliances in Ireland Joe O’Dohe y, Seán Lyons and Richard S.J. Tol rt
r
r t
.
215 Unemployment – Stage or Stigma?
Being Unemployed During an Economic Boom Emer Smyth
214 The Value of Lost Load Richard S.J. Tol 213 Adolescents’ Educational Attainment and School
Experiences in Contemporary Ireland Merike Darmody, Selina McCoy, Eme Smyth
212 Acting Up or Opting Out? Truancy in Irish
Secondary Schools Merike Darmody, Eme Smy h and Selina McCoy
211 Where do MNEs Expand Production: Location
Choices of the Pharmaceutical Industry in Europe after 1992 Frances P Ruane, Xiaoheng Zhang
210 Holiday Destinations: Understanding the Travel
Choices of Irish Tourists Seán Lyons, Karen Mayor and Richard S.J. Tol
209 The Effectiveness of Competition Policy and the
Price-Cost Margin: Evidence from Panel Data Patrick McCloughan, Seán Lyons and William Batt
208 Tax Structure and Female Labour Market
Participation: Evidence from Ireland Tim Callan, A. Van Soest, J.R. Walsh
207 Distributional Effects of Public Education Transfers
in Seven European Countries Tim Callan, Tim Smeeding and Panos Tsakloglou
21
206 The Earnings of Immigrants in Ireland: Results from the 2005 EU Survey of Income and Living Conditions Alan Barrett and Yvonne McCar hy t
t
.
t
205 Convergence of Consumption Patterns During
Macroeconomic Transition: A Model of Demand in Ireland and the OECD Seán Lyons, Karen Mayor and Richard S.J. Tol
204 The Adoption of ICT: Firm-Level Evidence from
Irish Manufacturing Industries Stefanie Haller and Iulia Traistaru-Siedschlag
203 EU Enlargement and Migration: Assessing the
Macroeconomic Impacts Ray Barrell, John Fitz Gerald and Rebecca Riley
202 The Dynamics of Economic Vulnerability: A Comparative European Analysis Christopher T. Whelan and Ber rand Maître
201 Validating the European Socio-economic
Classification: Cross-Sectional and Dynamic Analysis of Income Poverty and Lifestyle Deprivation Dorothy Watson, Christopher T Whelan and Bertrand Maître
200 The ‘Europeanisation’ of Reference Groups:
A Reconsideration Using EU-SILC Christopher T. Whelan and Ber rand Maître
199 Are Ireland’s Immigrants Integrating into its Labour Market? Alan Barrett and David Duffy
198 “Man Enough To Do It”? Girls and Non-Traditional Subjects in Lower Secondary Education Emer Smyth and Merike Darmody
197 Analysing the Effects of Tax-benefit Reforms on
Income Distribution: A Decomposition Approach Olivier Bargain and Tim Callan
196 Heterogeneous Exporter Behaviour: Exploring the Evidence for Sunk-Costs and Hysteresis Frances Ruane
22
Related Documents