The sole responsibility for the content of this presentation lies with the authors. It does not necessarily reflect the opinion of the European Union. Neither the EACI nor the European Commission are responsible for any use that may be made of the information contained here. Inspection of HVAC systems through continuous monitoring and benchmarking www.iservcmb.info Energy use of existing air-conditioning systems Dr Ian Knight IEE iSERV Coordinator Cardiff University, UK REHVA Annual Conference Timisoara, Romania 19 th April 2012

Welcome message from author
This document is posted to help you gain knowledge. Please leave a comment to let me know what you think about it! Share it to your friends and learn new things together.
Transcript

The sole responsibility for the content of this presentation lies with the authors. It does not necessarily reflect the opinion of the European Union. Neither the EACI nor the European Commission are responsible for any use
that may be made of the information contained here.
Inspection of HVAC systems
through continuous
monitoring and benchmarking
www.iservcmb.info
Energy use of existing air-conditioning systems
Dr Ian Knight
IEE iSERV Coordinator
Cardiff University, UK
REHVA Annual Conference
Timisoara, Romania
19th April 2012

2
iSERV Partners
Welsh School of Architecture, Cardiff University
Building energy use experts
K2n Ltd
Database experts
MacWhirter Ltd
Installation, Maintenance and Energy Inspections
National and KapodistrianUniversity of Athens
Indoor Air Quality experts
University of Porto
HVAC and Engineering experts
Politecnico di Torino
HVAC and Engineering experts
Université de Liège
HVAC and Modelling experts
Univerza v Ljubljani
HVAC and Engineering experts
University of Pecs
HVAC and Engineering experts
Austrian Energy Agency
Dissemination and Legislation
REHVA
HVAC Professional Body
CIBSE
HVAC Professional Body

iSERV aims
Quantify the existing energy performance of HVAC components and systems achieved in practice, as a first step to agreeing what is possible to be achieved
Produce professional guidance on achieving improved energy performance in HVAC systems
Involve the HVAC Sector in setting the targets on which they will be assessed as part of their contribution towards the ‘near zero carbon’ buildings required by start 2019/2021
Quantify the energy savings achieved from the provision of tailored energy efficiency advice to individual systems
Include anyone in the EU who wishes to participate
Provide more certainty over achievable savings3

HVAC Energy Use in Europe
Heating, Ventilation and AC systems in the EU-27 accounted for ~313 TWh of electricity use in 2007, about 11% of the total 2,800 TWh of electricity consumed in Europe
HVAC systems must be a key contributor towards energy savings if the EU is to reach its target of reducing energy use by 20% by 2020
These figures do not include non-electrical energy use
EquipmentElectrical consumption as % of total EU use in
2007
Air conditioning units and chillers
0.75
Fans in ventilation systems
3.34
Pumps 1.81
Space and Hot Water Heating
5.23
4
EC Joint Research Centre, Institute for Energy, 2009

Energy end use of AC systems in EU Offices (from IEE HARMONAC)
5
-
10
20
30
40
50
60
70
80
Total Chillers Total CHWpumps
Total fans Total HWpumps
W/m
2
Average, Max and Min of normalised electrical installed capacities in EU Offices by HVAC
component
-
1.0
2.0
3.0
4.0
5.0
6.0
7.0
8.0
Total Chillers Total CHWpumps
Total fans Total HWpumps
W/m
2
Average, Max and Min of normalised average power consumption in EU Offices by HVAC
component
Installed Capacities and Annual Average Power Demands per m2 for HVAC components installed in EU Offices.
The average HARMONAC EU Office ‘Cooling only’ VAC system had a FLE electrical power demand of around 6.5 W/m2 (around 56 kWh/m2.a) This does not include energy used for heating.
However, it is not possible to predict from this data how much energy a specific HVAC system should consume.

HVAC energy use as part of building energy consumption (HARMONAC)
6
0 100 200 300 400 500 600 700 800 900 1,000
CS-AT2: Office
CS-AT1: Office
CS-FR1: Large lecture theatre
CS-SI2: Offices and Business Centre
CS-IT3: Retirement house
CS-PT2: Library
CS-GR1: Office
CS-FR7: Offices
CS-BE1: Adminstration Building
CS-SI1: Cultural Centre
CS-PT3: Museum
CS-BE8: Office Building
CS-GR5: University Offices and classrooms
CS-UK4: School of Music
CS-PT4: Office Building
CS-GR4: Conference Building
CS-SI3: Sports Arena and Sports Centre
CS-IT5: Office building
CS-UK9: Library
CS-GR3: Supermarket
CS-UK2: Offices
CS-IT2: Office and laboratory building
CS-BE7: Office Building
CS-BE6: Office
CS-IT1: Office building
CS-SI5: Office Building
CS-UK10: Offices
CS-UK1: Offices
CS-BE2: Administration Building
CS-BE5: Laboratory Building
CS-SI4: Supermarket
CS-UK7: Medical Research Building
CS-IT4: Office and laboratory building
CS-GR2: Health Club and Gym
kWh/m2 per annum
AC system components measured annual energy use as part of total building electrical energy consumption
Chillers Actual kWh/m2
CHW Pumps Actual kWh/m2
Fans Actual kWh/m2
Total Building Elec minus AC kWh/m2
The normalised total annual electrical energy use of the whole building is the sum of all four elements shown in the legend
It can be seen that there is no clear pattern of energy use across EU

How much energy should a specific HVAC system use?
This is what we need to know if assessing ‘energy efficiency’
While legislation such as the EPBD can ‘require’ energy efficiency, the practical design and operation of ‘low energy’ HVAC systems is a difficult goal to achieve in practice
There is little data on energy use when servicing given end use activities and we now know that ‘design’ and actual energy use is rarely the same
In the current absence of accurate modelling capabilities we can try and address this question using a statistical approach
Real and on-going energy use measurements at a large-scale, related to identifiable and quantifiable parameters, can provide a sense of what is possible in terms of HVAC energy use.
Such an approach can also enable a sensible transition to more energy efficient HVAC provision and also allow new, energy efficient systems and designs to gain rapid market entry
7

Benchmarking HVAC system performance – iSERVcmb (iSERV)
iSERV is a first attempt to provide a framework and process to address the lack of real in-use data.
iSERV is designed to produce a large dataset of sub-hourly energy use in European HVAC systems and their components.
From this data, initial benchmark energy use ranges will be derived for the energy consumed by HVAC components servicing specified end-uses, areas and hours-of-use.
This will enable bespoke benchmarks to be derived for actual HVAC systems servicing specified activity mixes
These parameters were indicated by HARMONAC as being the most important areas to address first.
8

iSERV basics
Provision of a fully web-based framework to:• Collect and store diverse sources of operational data
• Connect HVAC components to spaces, meters and activities
• Analyse the data and produce relevant benchmarks
• Analyse this information and compare to benchmarks and iSERV modelling tools
• Check data for iSERV/HARMONAC Energy Conservation Opportunities (ECOs) specific to the system or component, identify where ECOs might exist and alert the end user
• Report key information to the end user at regular intervals, or on demand, to assist in managing energy use
• Assess the savings made as part of support to end user in maximising performance for their specific needs
9

iSERV project elements
Anyone collecting sub-hourly energy consumption data from their HVAC systems can participate
A specific spreadsheet to setup HVAC systems
Online database to collect metered data, allow system changes over time, and provide system specific reports
Modelling tools and system specific advice algorithms
Currently, just over 200 HVAC systems committed to provide data to date (still recruiting towards a target of 1600)
HVAC Manufacturers and End Users represented on project Steering Group
10

Initial data entry spreadsheet
Currently available in 9 languages:• English, Greek, Italian,
Portuguese, Slovenian, Dutch, French, Spanish, German
• Spreadsheet empty
• Spreadsheet example
“The Excel spreadsheet developed by the iSERV project is a unique tool to structure and organise the information of HVAC systems... It aligns perfectly with the need to improve the value of HVAC system inspections by having collected and gathered pertinent information prior to the inspection…”Olli Seppänen, REHVA General Secretary. 11
Building Utility Meter HVAC sensor HVAC system HVAC component Schedules of Setpoint&Occupation
Space
Building Name Name Name Name Name Name Name
Description Description Description Description Description Description Description
Organisation Name
Meter Type Sensor Type Main HVAC system
Component type Time Control Method Floor Area (m2)
Site Name Unit Type Unit Type HVAC type Component sub-type Date Range: Applies From
Sector
Sector Multiplier Duct/Pipe Area (m2)
System Classification
Serves which HVAC system(s)
Date Range: Applies To Activity
Address Space Where Located
Unique Sensor ID
System Sub-Classification
Space Where Located RH Range: Upper Limit Served By HVAC(s)
Town Unique Meter ID
Data Starts From
Data Starts From Nominal Electrical Power Input (KW) OR/AND Meter Name
RH Range:Lower Limit Utility Meter(s)
Postcode Data Starts From
End Month End Month Heating Setpoint / Date & Time
Schedule of Setpoints, RH and Occupancy
Country End Month Sensor Name Sensor Name Cooling Setpoint / Date & Time
Sensor Name
Control of HVAC Temperature
Parent Meter Name
Meter Name Data Starts From Relative Humidity / Date & Time
Data Starts From
Construct Month Control of Flow Temperature
End Month Occupancy / Date & Time End Month
Data Starts From Parent Component Control of HVAC Temperature
End Month Nominal Heat Rejection Capacity (KW)
HVAC Component Physically located here
Property Reference Code
Coefficient of Performance (COP)
Utility Meters Physically located here
GPS - latitude Energy Efficiency Rating (EER)
Space Notes
GPS - longitude Seasonal Energy Efficiency Rating (SEER)
Gross Internal Area (m2)
European Seasonal Energy Efficiency Rating
Conditioned GIA (m2)
Manufacturer
Schedule Range
Main HVAC Model
Building Notes Serial Number
Year of Manufacture
Nominal Cooling Capacity (KW)
Nominal Heating Capacity (KW)
Nominal Heating Power Input (KW)
Maintenance contract
Maintenance trigger
Date of last maintenance visit
Date of next maintenance visit
Cells highlighted in grey colour acquire their content automatically from other cells.
Cells in green show data that can be sourced from the Eurovent Certification HVAC Database
Cells highlighted in blue colour show optional data, but which is still very useful to owner and iSERV
Cells in light red show data that is chosen from embedded lists
Cells in orange show data that is chosen from data entered elsewhere in the spreadsheet

McKenzie House Spreadsheet
Excerpts from a Case Study system submitted to the iSERV database
• Calculated area served by the HVAC systems
• HVAC component (part entry)
12
HVACComponent
Name* Description Component Type* Component Sub-type* Serves which HVAC System(s)* Space Where Located
Packaged chiller 1Chiller to supply cooling to
whole buildingCold Generators Screw Liquid Chillers
AHU 1 and AHU 2;AHU 3;AHU 4;AHU 5;AHU 6;AHU 7;AHU 8;AHU 9;AHU 10;AHU 11
RX02
Or* but preferably both if available
Nominal Electrical Power Input (KW) Meter Name(s) Sensor Name(s) Data Starts From End Month
484.00 Chiller 1 cum power chiller 1 Flow temp;CW common return 11/2011 <Ctrl-↓>
Gross Internal Area (m2) Conditioned Gross Internal Area (m2)
8914.76 8434.93

Data available online
Component data displayed and alterable online system
13

Raw and calculated data examples
Raw input data file and Excel sheet output from iSERV database for McKenzie House data
Note error correction will be provided by iSERV – vital for robust data analysis
14
Sum of
Std_Month_
Consumption
Column
Labels
Month
Blr 1
Cumulative
Blr 2
Cumulative
Blr 3
Cumulative
Chiller 1
cum power
Chiller 2
cum power
Mar-11 5,956.81 316,373.75 9,614.31 986 561
Apr-11 2,919.58 18,340.97 3,903.47 1,846 1,374
May-11 791.39 3,443.61 1,058.75 1,042 464
Jun-11 - - - 1,868 1,382
Jul-11 - - - 5,326 5,092
Aug-11 - - - 4,555 3,730
Sep-11 224.58 224.58 - 2,561 1,651
Oct-11 2,481.11 246,988.19 3,443.61 806 498
Nov-11 4,320.56 73,631.25 6,523.61 561 354
Dec-11 242,218.47 294,749.58 12,533.89 288 189
Jan-12 71,075.28 266,901.25 10.69 261 190
Feb-12 277,756.11 76,197.92 225,684.86 316 234
Mar-12 19,378.33 20,982.50 19,378.33 93 58
Grand Total 627,122.22 1,317,833.61 282,151.53 20,509 15,777
Unique Meter ID Meter_Name Read_Date_Time Meter_Reading
LAN030/UNIT011/SENSOR034 Blr 1 Cumulative 01/03/2011 00:00 7183
LAN030/UNIT011/SENSOR034 Blr 1 Cumulative 01/03/2011 00:15 7183
LAN030/UNIT011/SENSOR034 Blr 1 Cumulative 01/03/2011 00:30 7183
LAN030/UNIT011/SENSOR034 Blr 1 Cumulative 01/03/2011 00:45 7183
LAN030/UNIT011/SENSOR034 Blr 1 Cumulative 01/03/2011 01:00 7183
LAN030/UNIT011/SENSOR034 Blr 1 Cumulative 01/03/2011 01:15 7183
LAN030/UNIT011/SENSOR034 Blr 1 Cumulative 01/03/2011 01:30 7183
LAN030/UNIT011/SENSOR034 Blr 1 Cumulative 01/03/2011 01:45 7183
LAN030/UNIT011/SENSOR034 Blr 1 Cumulative 01/03/2011 02:00 7183
LAN030/UNIT011/SENSOR034 Blr 1 Cumulative 01/03/2011 02:15 7185
LAN030/UNIT011/SENSOR034 Blr 1 Cumulative 01/03/2011 02:30 7193
LAN030/UNIT011/SENSOR034 Blr 1 Cumulative 01/03/2011 02:45 7199
LAN030/UNIT011/SENSOR034 Blr 1 Cumulative 01/03/2011 03:00 7199
LAN030/UNIT011/SENSOR034 Blr 1 Cumulative 01/03/2011 03:15 7199
LAN030/UNIT011/SENSOR034 Blr 1 Cumulative 01/03/2011 03:30 7199
LAN030/UNIT011/SENSOR034 Blr 1 Cumulative 01/03/2011 03:45 7199
LAN030/UNIT011/SENSOR034 Blr 1 Cumulative 01/03/2011 04:00 7199
LAN030/UNIT011/SENSOR034 Blr 1 Cumulative 01/03/2011 04:15 7199
LAN030/UNIT011/SENSOR034 Blr 1 Cumulative 01/03/2011 04:30 7199
LAN030/UNIT011/SENSOR034 Blr 1 Cumulative 01/03/2011 04:45 7199
LAN030/UNIT011/SENSOR034 Blr 1 Cumulative 01/03/2011 05:00 7199
LAN030/UNIT011/SENSOR034 Blr 1 Cumulative 01/03/2011 05:15 7199
LAN030/UNIT011/SENSOR034 Blr 1 Cumulative 01/03/2011 05:30 7199
LAN030/UNIT011/SENSOR034 Blr 1 Cumulative 01/03/2011 05:45 7199
LAN030/UNIT011/SENSOR034 Blr 1 Cumulative 01/03/2011 06:00 7199
LAN030/UNIT011/SENSOR034 Blr 1 Cumulative 01/03/2011 06:15 7199
LAN030/UNIT011/SENSOR034 Blr 1 Cumulative 01/03/2011 06:30 7199
LAN030/UNIT011/SENSOR034 Blr 1 Cumulative 01/03/2011 06:45 7199
LAN030/UNIT011/SENSOR034 Blr 1 Cumulative 01/03/2011 07:00 7199
LAN030/UNIT011/SENSOR034 Blr 1 Cumulative 01/03/2011 07:15 7199
LAN030/UNIT011/SENSOR034 Blr 1 Cumulative 01/03/2011 07:30 7199
LAN030/UNIT011/SENSOR034 Blr 1 Cumulative 01/03/2011 07:45 7201
LAN030/UNIT011/SENSOR034 Blr 1 Cumulative 01/03/2011 08:00 7201
LAN030/UNIT011/SENSOR034 Blr 1 Cumulative 01/03/2011 08:15 7202
LAN030/UNIT011/SENSOR034 Blr 1 Cumulative 01/03/2011 08:30 7205
LAN030/UNIT011/SENSOR034 Blr 1 Cumulative 01/03/2011 08:45 7205
LAN030/UNIT011/SENSOR034 Blr 1 Cumulative 01/03/2011 09:00 7207
LAN030/UNIT011/SENSOR034 Blr 1 Cumulative 01/03/2011 09:15 7209
LAN030/UNIT011/SENSOR034 Blr 1 Cumulative 01/03/2011 09:30 7210
LAN030/UNIT011/SENSOR034 Blr 1 Cumulative 01/03/2011 09:45 7211
LAN030/UNIT011/SENSOR034 Blr 1 Cumulative 01/03/2011 10:00 7211
LAN030/UNIT011/SENSOR034 Blr 1 Cumulative 01/03/2011 10:15 7213
LAN030/UNIT011/SENSOR034 Blr 1 Cumulative 01/03/2011 10:30 7213
LAN030/UNIT011/SENSOR034 Blr 1 Cumulative 01/03/2011 10:45 7214

Sum of
Std_Month_
Consumption
Column
Labels
Month
Blr 1
Cumulative
Blr 2
Cumulative
Blr 3
Cumulative
Chiller 1
cum power
Chiller 2
cum power
Clean
Supply DB
cum power
DB Floor 2
cum power
DB Floors
1&3 cum
power
DB Ground
cum power
Fire Panel
cum power
Lan Room
AC cum
power
Landlords
DB cum
power
Lift 1 cum
power
Lifts 2&3
cum power
Main
Incomer CP
MCP 4th
Plant cum
power
MCP Boiler
Plant cum
power
MCP
Central
services
MCP Dining
cum power
MCP
Ground
cum power
MCP
Kitchen
cum power
MCP
Podium
cum power
MCP
Restaurant
cum power
MCP roof
cum power
MCP
Staircase
Pressure
Outside
lights cum
power
Printing
area cum
power
Tower Riser
Even Floors
cum power
Tower Riser
Odd floors
cum power
unknown?
cum power
Mar-11 5,956.81 316,373.75 9,614.31 986 561 37 - 10,993 - 1 1,792 - 206 253 99,253 207 5,623 567 622 - 4,005 3,069 469 12,995 1,360 57 140 15,632 9,036 105
Apr-11 2,919.58 18,340.97 3,903.47 1,846 1,374 47 - 9,154 - 1 1,734 - 1 412 81,365 177 1,772 534 628 - 3,177 3,068 405 9,858 1,235 12 53 12,489 6,980 283
May-11 791.39 3,443.61 1,058.75 1,042 464 49 - 9,661 - 1 1,792 - 24 490 82,732 188 1,062 561 859 - 3,229 2,876 413 7,880 1,289 11 42 13,946 7,405 17
Jun-11 - - - 1,868 1,382 12 - 9,904 - 1 1,543 - 249 416 85,947 176 907 574 559 - 3,742 2,397 421 9,161 1,286 11 37 14,393 7,968 312
Jul-11 - - - 5,326 5,092 22 - 9,299 - 2 1,400 - 276 388 92,747 185 930 537 488 - 4,230 2,196 408 11,206 1,227 11 35 13,558 7,817 346
Aug-11 - - - 4,555 3,730 1 - 9,455 - - 1,401 - 259 371 91,448 182 961 560 548 - 4,372 2,573 442 11,094 1,420 10 35 13,221 7,887 16
Sep-11 224.58 224.58 - 2,561 1,651 13 - 9,341 - 2 1,356 - 270 382 84,318 177 935 542 529 - 3,978 2,227 424 9,430 1,289 29 38 13,712 7,872 173
Oct-11 2,481.11 246,988.19 3,443.61 806 498 17 - 9,422 - 1 1,403 - 272 378 83,722 185 2,079 536 514 - 3,902 2,441 406 9,502 1,236 69 46 13,647 7,593 695
Nov-11 4,320.56 73,631.25 6,523.61 561 354 10 - 10,019 - 1 1,358 - 282 403 88,882 179 4,018 541 523 - 4,200 2,376 418 11,541 1,275 109 103 14,213 7,962 126
Dec-11 242,218.47 294,749.58 12,533.89 288 189 110 - 7,816 - 2 1,402 - 217 305 80,854 198 4,373 522 556 - 2,856 3,427 416 10,939 1,289 123 173 12,327 6,585 18
Jan-12 71,075.28 266,901.25 10.69 261 190 145 - 8,854 - 1 1,359 - 252 364 87,521 215 4,628 498 515 - 2,862 2,987 400 12,208 1,232 108 166 14,440 7,628 17
Feb-12 277,756.11 76,197.92 225,684.86 316 234 109 - 10,176 - 2 1,362 - 277 407 101,491 248 7,620 510 534 - 2,925 3,224 469 18,255 1,294 79 167 15,606 8,330 943
Mar-12 19,378.33 20,982.50 19,378.33 93 58 46 - 3,337 - - 454 - 89 133 30,778 63 2,577 165 175 - 1,008 1,057 146 4,067 411 17 53 5,020 2,654 201
Grand Total 627,122.22 1,317,833.61 282,151.53 20,509 15,777 618 - 117,431 - 15 18,356 - 2,674 4,702 1,091,058 2,380 37,485 6,647 7,050 - 44,486 33,918 5,237 138,136 15,843 646 1,088 172,204 95,717 3,252
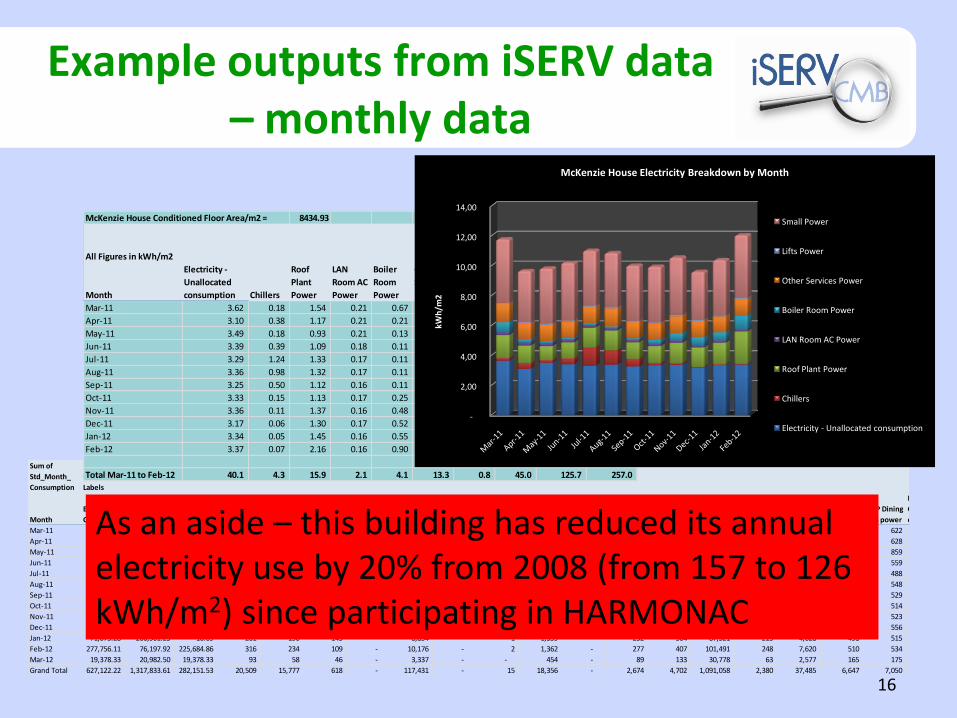
McKenzie House Conditioned Floor Area/m2 = 8434.93
All Figures in kWh/m2
Month
Electricity -
Unallocated
consumption Chillers
Roof
Plant
Power
LAN
Room AC
Power
Boiler
Room
Power
Other
Services
Power
Lifts
Power
Small
Power
Total
Electricity
Total -
Boilers
Mar-11 3.62 0.18 1.54 0.21 0.67 1.22 0.05 4.27 11.77 39.35
Apr-11 3.10 0.38 1.17 0.21 0.21 1.09 0.05 3.44 9.65 2.98
May-11 3.49 0.18 0.93 0.21 0.13 1.12 0.06 3.69 9.81 0.63
Jun-11 3.39 0.39 1.09 0.18 0.11 1.09 0.08 3.87 10.19 -
Jul-11 3.29 1.24 1.33 0.17 0.11 1.10 0.08 3.69 11.00 -
Aug-11 3.36 0.98 1.32 0.17 0.11 1.20 0.07 3.63 10.84 -
Sep-11 3.25 0.50 1.12 0.16 0.11 1.09 0.08 3.70 10.00 0.05
Oct-11 3.33 0.15 1.13 0.17 0.25 1.09 0.08 3.73 9.93 29.98
Nov-11 3.36 0.11 1.37 0.16 0.48 1.13 0.08 3.86 10.54 10.01
Dec-11 3.17 0.06 1.30 0.17 0.52 1.10 0.06 3.22 9.59 65.15
Jan-12 3.34 0.05 1.45 0.16 0.55 1.03 0.07 3.72 10.38 40.07
Feb-12 3.37 0.07 2.16 0.16 0.90 1.09 0.08 4.20 12.03 68.72
Total Mar-11 to Feb-12 40.1 4.3 15.9 2.1 4.1 13.3 0.8 45.0 125.7 257.0
Example outputs from iSERV data – monthly data
15
-
2,00
4,00
6,00
8,00
10,00
12,00
14,00
kWh
/m2
McKenzie House Electricity Breakdown by Month
Small Power
Lifts Power
Other Services Power
Boiler Room Power
LAN Room AC Power
Roof Plant Power
Chillers
Electricity - Unallocated consumption
Sum of
Std_Month_
Consumption
Column
Labels
Month
Blr 1
Cumulative
Blr 2
Cumulative
Blr 3
Cumulative
Chiller 1
cum power
Chiller 2
cum power
Clean
Supply DB
cum power
DB Floor 2
cum power
DB Floors
1&3 cum
power
DB Ground
cum power
Fire Panel
cum power
Lan Room
AC cum
power
Landlords
DB cum
power
Lift 1 cum
power
Lifts 2&3
cum power
Main
Incomer CP
MCP 4th
Plant cum
power
MCP Boiler
Plant cum
power
MCP
Central
services
MCP Dining
cum power
MCP
Ground
cum power
MCP
Kitchen
cum power
MCP
Podium
cum power
MCP
Restaurant
cum power
MCP roof
cum power
MCP
Staircase
Pressure
Outside
lights cum
power
Printing
area cum
power
Tower Riser
Even Floors
cum power
Tower Riser
Odd floors
cum power
unknown?
cum power
Mar-11 5,956.81 316,373.75 9,614.31 986 561 37 - 10,993 - 1 1,792 - 206 253 99,253 207 5,623 567 622 - 4,005 3,069 469 12,995 1,360 57 140 15,632 9,036 105
Apr-11 2,919.58 18,340.97 3,903.47 1,846 1,374 47 - 9,154 - 1 1,734 - 1 412 81,365 177 1,772 534 628 - 3,177 3,068 405 9,858 1,235 12 53 12,489 6,980 283
May-11 791.39 3,443.61 1,058.75 1,042 464 49 - 9,661 - 1 1,792 - 24 490 82,732 188 1,062 561 859 - 3,229 2,876 413 7,880 1,289 11 42 13,946 7,405 17
Jun-11 - - - 1,868 1,382 12 - 9,904 - 1 1,543 - 249 416 85,947 176 907 574 559 - 3,742 2,397 421 9,161 1,286 11 37 14,393 7,968 312
Jul-11 - - - 5,326 5,092 22 - 9,299 - 2 1,400 - 276 388 92,747 185 930 537 488 - 4,230 2,196 408 11,206 1,227 11 35 13,558 7,817 346
Aug-11 - - - 4,555 3,730 1 - 9,455 - - 1,401 - 259 371 91,448 182 961 560 548 - 4,372 2,573 442 11,094 1,420 10 35 13,221 7,887 16
Sep-11 224.58 224.58 - 2,561 1,651 13 - 9,341 - 2 1,356 - 270 382 84,318 177 935 542 529 - 3,978 2,227 424 9,430 1,289 29 38 13,712 7,872 173
Oct-11 2,481.11 246,988.19 3,443.61 806 498 17 - 9,422 - 1 1,403 - 272 378 83,722 185 2,079 536 514 - 3,902 2,441 406 9,502 1,236 69 46 13,647 7,593 695
Nov-11 4,320.56 73,631.25 6,523.61 561 354 10 - 10,019 - 1 1,358 - 282 403 88,882 179 4,018 541 523 - 4,200 2,376 418 11,541 1,275 109 103 14,213 7,962 126
Dec-11 242,218.47 294,749.58 12,533.89 288 189 110 - 7,816 - 2 1,402 - 217 305 80,854 198 4,373 522 556 - 2,856 3,427 416 10,939 1,289 123 173 12,327 6,585 18
Jan-12 71,075.28 266,901.25 10.69 261 190 145 - 8,854 - 1 1,359 - 252 364 87,521 215 4,628 498 515 - 2,862 2,987 400 12,208 1,232 108 166 14,440 7,628 17
Feb-12 277,756.11 76,197.92 225,684.86 316 234 109 - 10,176 - 2 1,362 - 277 407 101,491 248 7,620 510 534 - 2,925 3,224 469 18,255 1,294 79 167 15,606 8,330 943
Mar-12 19,378.33 20,982.50 19,378.33 93 58 46 - 3,337 - - 454 - 89 133 30,778 63 2,577 165 175 - 1,008 1,057 146 4,067 411 17 53 5,020 2,654 201
Grand Total 627,122.22 1,317,833.61 282,151.53 20,509 15,777 618 - 117,431 - 15 18,356 - 2,674 4,702 1,091,058 2,380 37,485 6,647 7,050 - 44,486 33,918 5,237 138,136 15,843 646 1,088 172,204 95,717 3,252
Example outputs from iSERV data – monthly data
16
McKenzie House Conditioned Floor Area/m2 = 8434.93
All Figures in kWh/m2
Month
Electricity -
Unallocated
consumption Chillers
Roof
Plant
Power
LAN
Room AC
Power
Boiler
Room
Power
Other
Services
Power
Lifts
Power
Small
Power
Total
Electricity
Total -
Boilers
Mar-11 3.62 0.18 1.54 0.21 0.67 1.22 0.05 4.27 11.77 39.35
Apr-11 3.10 0.38 1.17 0.21 0.21 1.09 0.05 3.44 9.65 2.98
May-11 3.49 0.18 0.93 0.21 0.13 1.12 0.06 3.69 9.81 0.63
Jun-11 3.39 0.39 1.09 0.18 0.11 1.09 0.08 3.87 10.19 -
Jul-11 3.29 1.24 1.33 0.17 0.11 1.10 0.08 3.69 11.00 -
Aug-11 3.36 0.98 1.32 0.17 0.11 1.20 0.07 3.63 10.84 -
Sep-11 3.25 0.50 1.12 0.16 0.11 1.09 0.08 3.70 10.00 0.05
Oct-11 3.33 0.15 1.13 0.17 0.25 1.09 0.08 3.73 9.93 29.98
Nov-11 3.36 0.11 1.37 0.16 0.48 1.13 0.08 3.86 10.54 10.01
Dec-11 3.17 0.06 1.30 0.17 0.52 1.10 0.06 3.22 9.59 65.15
Jan-12 3.34 0.05 1.45 0.16 0.55 1.03 0.07 3.72 10.38 40.07
Feb-12 3.37 0.07 2.16 0.16 0.90 1.09 0.08 4.20 12.03 68.72
Total Mar-11 to Feb-12 40.1 4.3 15.9 2.1 4.1 13.3 0.8 45.0 125.7 257.0
-
2,00
4,00
6,00
8,00
10,00
12,00
14,00
kWh
/m2
McKenzie House Electricity Breakdown by Month
Small Power
Lifts Power
Other Services Power
Boiler Room Power
LAN Room AC Power
Roof Plant Power
Chillers
Electricity - Unallocated consumption
As an aside – this building has reduced its annual electricity use by 20% from 2008 (from 157 to 126 kWh/m2) since participating in HARMONAC

Example outputs from iSERV data – subhourly data
Example for Chiller 1 for July 2011 showing good control both in and out of occupancy hours
17

Levels of data analysis and reporting
iSERV will provide indications of efficiency at the level of individual components AND full systems.
Reports will be at the following levels of granularity:
• Annual
• Monthly
• Sub-hourly
Reports will also be againstactivity, floor areas, etc andcombinations of these
Example shows HVAC component monthly energy use per m2 served in the building by this component
18

Basic monthly report?

Basic monthly report with benchmarks

iSERV potential reports
The image to the right shows a mock-up of the type of report possible from iSERV:
• Benchmark ranges as background to actual
• Performance of components against bespoke benchmarks for given activity mix
• Tabular information

Future actions
Using the approach post-iSERV
iSERV derived professional guidance from CIBSE and REHVA
Engaging the HVAC Sector Actors in helping improve the energy efficiency of their sector and setting their own standards and processes as a means of meeting the requirements of the EPBD
Engaging with EU legislators to enable a sector-led approach to helping meet legislative targets
22

Summary
One of the main benefits of the iSERV methodology is that it allows rapid identification of good and best practice in HVAC energy use without favouring any technology or approach.
‘Real’ data from real systems makes the information easy to understand by all stakeholders, and provides confidence that the performance benchmarks are achievable.
Inclusive - anyone with data can participate, allowing all systems to regularly benchmark their performance and contribute to a wider understanding of what is possible
Benchmarks can evolve as rapidly as needed, and the effects of changes are easily quantified
The goal is a maintained reduction in HVAC energy use
23

If not iSERV then what?
EU Member States will set benchmarks for allowable energy use/carbon emissions in the near future as part of route to 2019/2021 NZEB
If the HVAC Sector does not produce benchmark figures for itself in a manner which is seen to be independent, robust and forward looking then it runs the risk of unreasonable demands being made which could simply lead to poor buildings and systems.
24
“…CIBSE is participating in iSERV as the project offers practical help to thosewho operate and manage HVAC systems to reduce energyconsumption, carbon emissions and, most importantly to many buildingoperators, cost.
Hywel Davies, Technical Director, CIBSE

iSERV Workshop
Tomorrow 13:30 – 15:00 in LONDRA room
Aim is to debate the practical implementation of an iSERV-type approach for the HVAC sector with a view to determining future standards against which the sector will be assessed
There are sign-up sheets at the entrance to this room if you wish to indicate a topic you are interested in. This will allow us to tailor the workshop to your interests
All are welcome
25

The sole responsibility for the content of this presentation lies with the authors. It does not necessarily reflect the opinion of the European Union. Neither the EACI nor the European Commission are responsible for any use
that may be made of the information contained here.
Inspection of HVAC systems
through continuous
monitoring and benchmarking
www.iservcmb.info
Thank you for your attention
Contact details:
Related Documents