Energy Taxation and Subsidies in Europe: A Report on Government Revenues, Subsidies and Support Measures for Fossil Fuels and Renewables in the EU and Norway Report for the International Association of Oil and Gas Producers May 2014

Welcome message from author
This document is posted to help you gain knowledge. Please leave a comment to let me know what you think about it! Share it to your friends and learn new things together.
Transcript

Energy Taxation and Subsidies in Europe:
A Report on Government Revenues,
Subsidies and Support Measures for Fossil
Fuels and Renewables in the EU and
Norway
Report for the International Association of Oil
and Gas Producers
May 2014

Project Team
Daniel Radov
Adil Hanif
Harry Fearnehough
Ruxandra Ciupagea
NERA Economic Consulting
15 Stratford Place
London W1C 1BE
United Kingdom
Tel: 44 20 7659 8500 Fax: 44 20 7659 8501
www.nera.com

Energy Taxation & Subsidies in Europe Contents
Contents
Acknowledgments i
Executive Summary ii
1. Introduction 1
2. Overview of Literature 2
2.1. Defining and Measuring Subsidies 2
2.2. Studies Investigating Subsidies and “Support” to Fossil Fuels 5
3. Methodology 16
3.1. Key Features of Our Approach 18
3.2. Scope of Transfers 19
3.3. Categories of Revenues and Expenditures 21
3.4. Externalities 28
3.5. Data and sources 32
4. Results of NERA’s Analysis 33
4.1. EU-Wide Results for All Energy Sources 35
4.2. Breakdown of Transfers for Each Energy Source 40
4.3. Differences among Individual Countries 47
4.4. Externalities 47
4.5. Summary of Results 50
5. Conclusions 52
Appendix A. Case Study of Tax Regime Applying to the Upstream Oil and Gas Sector in the United Kingdom 53
A.1. Introduction 53
A.2. Taxation Mechanisms 54
A.3. Analysis of Tax Revenues and the Marginal Rate 59
A.4. Conclusions 62
Appendix B. Detailed Approach to Estimating Transfers 64
B.1. Estimating Government Revenues 64
B.2. Estimating Government Expenditures and Mandated Transfers 90
Appendix C. Shadow Price of Carbon Used in the Study 99
C.1. Overview of Approaches 99
C.2. Review of Estimates Available in the Literature 99
C.3. Summary of Estimates and Carbon Prices Used 103

Energy Taxation & Subsidies in Europe List of Tables
List of Tables
Table 3.1 Activities Associated with Energy Sources 20 Table 3.2 Categories of Government Revenues and Expenditures 22 Table 4.1 EU28 + Norway Net Government Revenues and Mandated Transfers
(2011) 36 Table 4.2 Summary Results for 2011 51 Table B.1 Estimated Corporation Tax Revenues for the EU28 + Norway in 2011 84 Table B.2 R&D Support Estimates for EU28 + Norway (2007-2011) 98 Table C.1 Estimates of Social Cost of Carbon – US EPA 100 Table C.2 Estimates of Average Social Cost of Carbon – Tol (2009) 100 Table C.3 Shadow Cost of Carbon Estimates Reported by DECC 101

Energy Taxation & Subsidies in Europe List of Figures
List of Figures
Figure ES-1 Overview of NERA’s Approach iii Figure ES-2 Energy Value Chains Included in Our Analysis iv Figure ES-3 EU28 + Norway Net Government Revenues and Mandated Transfers
(2011) v Figure ES-4 EU28 + Norway Net Government Revenues and Mandated Transfers
(2007 - 2011) vi Figure ES-5 EU28 + Norway Net Government Revenues and Mandated Transfers
($/boe) (2011) vii Figure ES-6 EU28 + Norway Net Government Revenues and Mandated Transfers
($/boe) (2007 - 2011) viii Figure 2.1 OECD Inventory: Five Countries Providing Highest “Support” in 2011 7 Figure 2.2 IMF Estimates of “Post-Tax Subsidies”: EU-28 + Norway, 2011 10 Figure 2.3 Government Transfers and Tax Expenditures in OECD Inventory Data
(2011) 13 Figure 3.1 Overview of NERA’s Approach 17 Figure 4.1 Primary Energy Consumption of Different Energy Sources (2007 - 2011) 34 Figure 4.2 EU28 + Norway Net Government Revenues and Mandated Transfers
(2011) 36 Figure 4.3 EU28 + Norway Net Government Revenues and Mandated Transfers
(2007 - 2011) 37 Figure 4.4 EU28 + Norway Net Government Revenues and Mandated Transfers
($/boe) (2011) 38 Figure 4.5 EU28 + Norway Net Government Revenues and Mandated Transfers
($/boe) (2007 - 2011) 40 Figure 4.6 EU28 + Norway Government Revenues, Expenditures, and Mandated
Transfers: Oil (2011) 42 Figure 4.7 EU28 + Norway Government Revenues, Expenditures, and Mandated
Transfers: Gas (2011) 43 Figure 4.8 EU28 + Norway Government Revenues, Expenditures, and Mandated
Transfers: Coal (2011) 44 Figure 4.9 EU28 + Norway Government Revenues, Expenditures, and Mandated
Transfers: Wind (2011) 45 Figure 4.10 EU28 + Norway Government Revenues, Expenditures, and Mandated
Transfers: Solar (2011) 46 Figure 4.11 Comparison of Norway and Germany Net Government Revenues (2011) 47 Figure 4.12 GHG Emissions in the EU28 + Norway, 2007 - 2011 48 Figure 4.13 GHG Externality Costs - Low, Medium, and High 49 Figure A.1 UK Oil and Gas Production (1975-2013) 54 Figure A.2 Production Value and Government Revenues by Tax Scheme (Nominal) 59 Figure A.3 Marginal Tax Rate on UK Petroleum Production 61 Figure A.4 Government Revenue as a Proportion of Oil and Gas Production Value 62 Figure B.1 Oil and Gas Production in the EU28 + Norway (2007 - 2011) 65 Figure B.2 Coal Production in EU + Norway (2011) 70 Figure B.3 Excise Duty and Other Energy Taxes Government Revenues Allocated
to Energy Sources (2007-2011) 87 Figure C.1 Average annual EUA prices (2008-2012; nominal) 102 Figure C.2 Summary of Estimates of the Price of Carbon 103

Energy Taxation & Subsidies in Europe Acknowledgments
NERA Economic Consulting i
Acknowledgments
This report, prepared by NERA Economic Consulting, was commissioned by the
International Association of Oil and Gas Producers (OGP). The authors are grateful to
colleagues within NERA, as well as external peer reviewers who provided very helpful
suggestions and comments on earlier drafts of the text, including Mauricio Bermudez-
Neubauer, David Harrison, Bob Grabham, Marta Moro, Carole Nakhle (University of Surrey),
and Frans Oosterhuis (IVM). The content of the final report is the responsibility of the
authors alone.
Energy Taxation & Subsidies in Europe Executive Summary
NERA Economic Consulting ii
Executive Summary
This report, prepared by NERA Economic Consulting, presents the results of analysis that
compares the taxation and subsidy regimes applying to oil, gas, coal, wind, and solar power
in the EU28 and Norway during the period 2007-2011.1 The motivation for the current study
is to provide a clear and transparent approach to understanding different estimates of subsidy
and government support, and to put them in a broader context.
In recent years there have been various attempts, led by major international institutions, to
estimate the level of “subsidies” and “support” offered to different energy sources around the
world (examples include OECD, IMF, IEA, and IISD2).
Although there is a legitimate public interest in the question that these studies pose, the
conclusions that they reach are influenced strongly by their methodologies. Most of the major
studies are careful to acknowledge that their methodology assumes a particular perspective
that leaves out potentially important factors. In addition, once these studies reach the sphere
of public debate, they have been misinterpreted and in some cases misused by commentators.
Many of these existing studies adopt an approach that requires them to define a baseline or
“benchmark” level of energy taxation, which they then compare to the tax rates applied to
other selected sources of energy – possibly in different regions, or in different sectors.
Taxation below these benchmark levels is counted as “support”. A significant weakness of
the reliance on benchmarks is that the assessment is entirely dependent on a subjective
judgment of where the benchmark “should” be set. In many cases, there are other equally
plausible benchmarks that could be selected, and that may lead to very different conclusions
being reached. In addition, different benchmarks are typically applied across different
products, and approaches to defining benchmarks may vary across countries. Consequently,
estimates of support often cannot be compared across countries or energy sources. Moreover,
some studies have been used in ways that are not intended by the authors, adding to
confusion about what the results mean. For example, the OECD’s results have been cited in a
European Commission working document as suggesting that fossil fuels in Europe received
support of €26 billion in 2011.3 This figure appears to be derived by summing estimates
across countries, which the OECD explicitly cautions against.4
1 2011 is the latest year for which comprehensive pan-European data were available at the time of writing.
2 OECD (2013), “Inventory of Estimated Budgetary Support and Tax Expenditures for Fossil Fuels 2013”. IEA (2012)
World Energy Outlook. IMF (2013), “Energy Subsidy Reform: Lessons and Implications”. And finally, for example,
IISD (2012), “Fossil Fuels – At What Cost? Government Support for Upstream Oil and Gas Activities in Norway” and
other studies available at http://www.iisd.org/gsi/.
3 See European Commission (2013), “European Commission Guidance for the Design of Renewables Support Schemes”.
Commission Staff Working Document.
4 Such aggregation ignores the variation in benchmark levels across countries – which underscores the often subjective
nature of the benchmarks used. The OECD authors also note that even within a country, adding up the estimates may be
“problematic”.

Energy Taxation & Subsidies in Europe Executive Summary
NERA Economic Consulting iii
Methodology
We have approached the question of relative levels of “support” from a perspective that
differs from those used in prior studies. We estimate the full range of financial flows both to
and from different sources of energy as a result of government policy, including direct
subsidies, other transfers of funds, and major taxes. We start by cataloguing government
policies that either lead to government revenues (e.g. taxes, duties, licensing fees, royalties)
or government expenditures (direct capital grants, consumption support payments, production
subsidies) that are linked to fuels or energy sources. On top of these, we include support that
is provided indirectly through government-mandated transfers – transfers that are effectively
required by government policies, but which may not involve direct contributions to or
demands on government finances (for example, feed-in-tariffs). This approach is
summarised in Figure ES-1 below.
Figure ES-1 Overview of NERA’s Approach
Our approach explicitly recognises that government expenditures on subsidies have an
obvious counterpart in government revenues from taxation. Whereas other approaches
selectively choose a subset of taxes to benchmark against, we take a more comprehensive
approach, and estimate all material sources of revenue raised from different energy sources.
This eliminates the need to select an arbitrary benchmark to compare to.
A major advantage of our approach is that it allows us to make cross-sector, cross-energy,
and cross-country comparisons and to calculate totals, which it is not possible to do under
many of the other approaches used in the literature. We also consider individual policies and
Government Revenues:
• Upstream revenues: taxes, license fees, royalties,
dividend payments, corporation tax revenues
• Corporation tax on midstream and downstream activities
– e.g. energy transformation (power generation and
refining), storage, transportation and retail
• Excise duties and other energy taxes
• Value added tax
Mandated transfers:
• Support schemes for renewable energy sources (e.g. FITs
or renewable energy certificates)
Government Expenditures:
• Upstream government expenditures – support to current
production
• Government transfers for power generation, energy
transport and storage
• Consumption support: payments (often to selected
vulnerable groups – e.g. low-income households)
• Government payments to cover historic liabilities
(exclusively in coal industry – e.g. labour compensation)
Total:
• Net transfers received from (provided to) each energy
source, i.e. all the government revenues, minus
government expenditures and mandated transfers
Illustrative Diagram
€

Energy Taxation & Subsidies in Europe Executive Summary
NERA Economic Consulting iv
sectors of the economy, so we can reflect details that may be overlooked by more high level
methodologies.5
To underpin our analysis, we have developed a database of government revenue, government
expenditure, and mandated transfers for each of the five energy sources in all 28 EU Member
States as well as Norway. The information we rely on is all derived from publicly available
data sources, supplemented with our own estimates where data are not readily available. The
stages in the energy value chain to which we have applied our methodology are illustrated in
Figure ES-2 (below).
Figure ES-2 Energy Value Chains Included in Our Analysis
We have also considered externalities6 associated with the use of energy. It is beyond the
scope of our work to deal comprehensively with all externalities related to the five energy
sources considered here. However, to illustrate how externality costs (or benefits) relate to
our main analysis, we consider the example of greenhouse gas (GHG) emissions.
We summarise some of our key findings below.
5 For example, so-called “price gap” approaches, which are used by the IEA and IMF, interpret lower final energy prices
relative to a benchmark prices as subsidies, but do not investigate the value chain above final consumption.
6 Externalities are costs that, as a result of an activity or market transaction, are imposed on a third party that is not
directly involved in that activity or transaction. (Note that externalities can also be benefits that accrue to third parties.)
There are a wide range of externalities sometimes linked directly or indirectly to energy – among them greenhouse gas
emissions, emissions of “local” pollutants, security of energy supply, innovation spill-overs, “disamenity” value of
wind farms and other electricity generating capacity, water scarcity, road congestion, etc.

Energy Taxation & Subsidies in Europe Executive Summary
NERA Economic Consulting v
Results: Government revenues and support to energy sources
We find that EU28+Norway governments receive far greater revenues from oil, gas and
coal than these energy sources receive in the form of direct subsidies or other transfers. Oil is by far the largest contributor to government revenues. In contrast, wind and solar
power are net recipients of support.
Figure ES-3 summarises our results for the five energy sources for 2011. The green bars
represent revenues collected by the government in respect of each energy source, and the red
bars represent direct government payment or mandated transfers to each energy source. The
blue line represents the sum of these two – the “net transfer” amount.
Figure ES-3 EU28 + Norway Net Government Revenues and Mandated Transfers (2011)
Source: NERA Analysis (all data sources discussed in Appendix B)
On the order of €480 billion in revenues were collected by EU28+Norway governments
in 2011 from the five energy sources. Of this, close to 70 percent, or just over €330 billion,
came from the oil sector. Gas contributed around one fifth of the revenue, or almost €100
billion. Coal accounted for around €36 billion in revenue, but also received transfers on the
order of €4 billion. We estimate that wind contributed around €8 billion in government
revenue, but received transfers amounting to around €9 billion, implying total net payments
to the sector of €1 billion. Finally, we estimate that in 2011 solar power contributed around
€2 billion to government revenues, but received transfers totalling close to €17 billion.
Duties on motor vehicle fuels account for the largest single source of government
revenue from energy, ahead of VAT. Duties on these fuels yielded over €180 billion in
2011, and accounted for approximately 84 percent of all excise duty revenues from energy.

Energy Taxation & Subsidies in Europe Executive Summary
NERA Economic Consulting vi
VAT paid on energy is also a very significant contribution to government revenues. A
large share of VAT is paid on oil through motor vehicle fuels, but there is also a significant
amount of VAT paid on electricity and on fuels used for space heating.7
After excise duty and VAT, revenues collected from the upstream oil and gas sector
contribute the most to government coffers, accounting for €83 billion in total. The
production of oil and gas is heavily taxed, with sector profits facing tax rates that can reach as
high as 80 percent – far above the average EU corporation tax of 23 percent.
The results for the years 2007-2010 are similar to the results for 2011 (Figure ES-4). The
most significant change over time is that the magnitude of transfers to solar power has
increased very significantly in absolute terms. The amount of installed solar generating
capacity expanded rapidly during this period, resulting in large increases in public support for
solar technologies. We do not have comprehensive European data that extend to 2012 or
2013, but we note that support to RES sources has continued to increase during these years.
Figure ES-4 EU28 + Norway Net Government Revenues and Mandated Transfers
(2007 - 2011)
Note: Renewable support data are not available for 2007 and 2008, so we omit estimates of
net transfer values for these years.
Figure ES-5 shows the net transfers to each fuel source per unit of primary energy
consumption. The per unit results are shown in US Dollars per barrel of oil equivalent
(“boe”), to facilitate comparison with the price of a barrel of crude oil. The magnitude of the
7 We allocate VAT collected on electricity in proportion to each energy source’s share of production across the EU.

Energy Taxation & Subsidies in Europe Executive Summary
NERA Economic Consulting vii
net transfers to solar power per unit of energy amounts to more than $700/boe. The net
contribution to government revenues by oil per unit of primary consumption is highest, at
$124/boe, followed by gas ($49/boe) and coal ($24/boe).8
Figure ES-5 EU28 + Norway Net Government Revenues and Mandated Transfers ($/boe)
(2011)
Source: NERA analysis Note: Values have been converted into barrels of oil equivalent using a conversion rate of
7.33 barrels of oil to 1 tonne of oil.
Figure ES-6 presents similar information, showing the net transfers (represented in Figure
ES-5 by the blue lines) covering the full period from 2007 to 2011. Results are relatively
consistent across years. It is clear from our results that solar power receives the largest net
transfer, both in absolute terms and per unit of energy consumed. In absolute terms, total
support for wind and solar has increased over time, although measured per unit of energy
consumption, support has declined over the period.
8 The bulk of revenues from oil are collected from excise duty and VAT, whereas gas and coal provide a significant share
of government revenues via their use in electricity generation. Due to the relative efficiencies of the fuels, the value of
the primary consumption denominator used in the per boe calculation is greater for coal than for gas, relative to receipts.

Energy Taxation & Subsidies in Europe Executive Summary
NERA Economic Consulting viii
Figure ES-6 EU28 + Norway Net Government Revenues and Mandated Transfers ($/boe)
(2007 - 2011)
Source: NERA analysis. Note: Renewable support data are not available for 2007 and 2008, so we omit estimates of net
transfer values for these years.
Externalities
The costs associated with externalities differ from the other categories included in our study.
For one, externality costs do not reflect any direct transfers between energy sources and the
government, or any mandated monetary transfers. It is also important to recognise that an
externality cost – for example, of GHGs – represents a cost that is borne by society as a
whole, not simply by the government. Thus direct comparisons to government revenues
alone are likely to be misleading. If the costs of the carbon externality, for example, were
reflected in government policies designed to “internalise” it, this would affect not only
government revenues, but also benefits to consumers and producers across the economy. The
ultimate implications for government revenues would depend on how the demand for carbon-
emitting products and alternatives responded to changes in their relative prices.
One cannot simply assume that if carbon were priced at a level higher than the prices already
imposed by existing policies, this would result in lower net revenues to government from
every carbon-emitting fuel. Government revenues for individual fuels might stay the same,
or decline, or they could even increase, depending on how responsive both demand and
supply are to price. Thus one should not simply “net off” the externality costs associated
with carbon – or any externality – from government revenues.
With these caveats in mind, we estimate the implications of different assumed values of the
externality cost of carbon. There is significant uncertainty about the cost of the externality

Energy Taxation & Subsidies in Europe Executive Summary
NERA Economic Consulting ix
per tonne of CO2 (often referred to as the shadow price of carbon). To reflect this uncertainty,
we have used low, medium and high estimates of €10, 30, and 70/tCO2.9 At the medium
shadow price of €30/tCO2, the externality costs would be €53 billion for oil, €29 billion for
gas, and €35 billion for coal.
9 These values lie within the range that most sources regard as most likely, although the full range is much wider.

Energy Taxation & Subsidies in Europe Introduction
NERA Economic Consulting 1
1. Introduction
In recent years there has been increasing interest in the question of government support for
energy. A number of international organisations, including OECD and IMF, have conducted
studies to estimate the level of subsidies. However, the conclusions reached by these studies
are strongly influenced by methodological choices, and often the results are difficult to
compare across countries and products. To add clarity and transparency to the existing body
of analysis, the International Association of Oil and Gas Producers commissioned NERA
Economic Consulting to undertake a study with two primary objectives:
1. to better understand the approaches and data used by different organisations for
estimating government support to the energy sector; and
2. to compare the taxation and subsidy regimes that apply to different energy sources
across the EU 28 plus Norway.
The five energy sources considered in this report are: oil, gas, coal, wind, and solar power.
Because energy sources both receive financial support from and contribute revenue to the
government, NERA’s study examines financial flows to and from the five energy sectors in
the period 2007-11 in the EU28 and Norway. Government revenues are generated from
energy through a variety of taxes, duties, royalties, levies and charges. On the other hand,
energy sources receive direct transfers through government expenditures providing direct
subsidies, grants and support payments. In addition, energy sources also receive revenues
from government-mandated transfers through support schemes such as feed-in-tariffs or
renewable energy certificate schemes. Our study has catalogued these diverse financial flows
to and from different energy sources to provide a comprehensive perspective, across the EU
and Norway, on the issue of energy taxation and subsidies.
In next chapter (Chapter 2) we summarise and comment on the existing literature addressing
the question of government support for different energy sources, and briefly review some of
the most widely quoted studies. Chapter 3 describes the methodological framework of our
study. We summarise the economic activities and the scope of transfers we have considered,
and we explain how our approach addresses the question of government support – and how it
avoids some of the limitations of other approaches. Chapter 4 presents the findings of our
study, and Chapter 5 concludes.
As part of this work we have also prepared a case study of the tax regime applying to the
upstream oil and gas sector in the United Kingdom, and this is included in Appendix A.
Details of our estimation approach and data sources for individual categories of transfers are
described in Appendix B. Finally, Appendix C includes a brief overview of different
estimates of shadow price of carbon.

Energy Taxation & Subsidies in Europe Overview of Literature
NERA Economic Consulting 2
2. Overview of Literature
There have been a number of efforts in recent years to estimate “subsidies” and/or “support”
provided by governments to different sources of energy. The motivations for these studies
vary, although often they aim to investigate whether government policies confer advantages
to specific sources of energy – most notably, fossil fuels. In particular, the commitment by
the G-20 group of countries in 2009 to “rationalize and phase out over the medium term
inefficient fossil fuel subsidies that encourage wasteful consumption” is often cited as the key
motivation for investigating the scale of energy “subsides” or “support” to fossil fuels.
Although there is a legitimate public interest in the question that these studies pose, the
conclusions that they reach are influenced strongly by their methodologies. Different
organisations investigating these questions have adopted wide ranges of scope, definitions of
what should count as a “subsidy” or a form of “support”, and approaches to quantify them.
Accordingly, the results produced by different studies, often addressing very similar
questions, vary considerably.
This section begins by providing a brief overview of the how the concepts of “subsidy” and
“support” are defined in some of these studies. It then reviews the most widely quoted
studies with a view to illustrating how “subsidies” or “support” have been estimated in
practice.
2.1. Defining and Measuring Subsidies
The concepts of “subsidy” and “support” are defined in many studies investigating
governments’ treatments of different energy sources. Examples include:
de Moor (2001),10
which states that: “subsidies comprise all measures that keep prices for
consumers below market level or keep prices for producers above market level or that
reduce costs for consumers and producers by giving direct or indirect support”.
Uranium Information Centre (2005),11
which identifies categories of activities that can be
construed as representing subsidies. The categories, as described in Reidy and
Diesendorf (2003),12
include:
− “Financial subsidies”, which include: “(1) direct subsidies and rebates; (2) favourable
tax treatment; (3) provision of infrastructure and public agency services below cost;
(4) provision of capital at less than market rates; (5) failure of government-owned
entities to achieve normal rates of return; (6) trade policies, such as import and export
tariffs and non-tariff barriers”;
− “Research and development (R&D) funding; and
− External costs (externalities) of energy production not accounted for in pricing
systems.”
10 de Moor (2001), “Towards a Grand Deal on Subsidies and Climate Change,” Natural Resources Forum 25, 167-176
11 Uranium Information Centre (2005), “Energy Subsidies and External Cost,”, Melbourne, Australia.
12 Reidy and Diesendorf (2003), “Financial Subsidies to the Australian Fossil Fuel Industry,” Energy Policy 31, 125-137

Energy Taxation & Subsidies in Europe Overview of Literature
NERA Economic Consulting 3
the International Institute for Sustainable Development (IISD), which has undertaken
several studies investigating the treatment of fossil fuels. Its approach is underpinned by
the World Trade Organisation’s (WTO) definition of subsidies, which it identifies in
situations where:13
− “Government provides direct transfer of funds or potential direct transfer of funds or
liabilities,
− Revenue is foregone or not collected,
− Government provides goods or services or purchases goods,
− Government provides income or price support.”
It is important to note that these definitions have their origins in different contexts – for
example, the WTO’s definition is intended for use in international trade disputes, in which a
foreign party may believe it has been unfairly treated relative to a domestic party.14
In a
similar context, the European Commission (EC) has outlined rules to identify cases of State
Aid, which has some parallels with the question of defining subsidies or support. According
to EC rules, a measure is considered to be a form of State Aid if:15
− “there has been an intervention by the State or through State resources which can take
a variety of forms (e.g. grants, interest and tax reliefs, guarantees, government
holdings of all or part of a company, or providing goods and services on preferential
terms, etc.);
− the intervention gives the recipient an advantage on a selective basis, for example to
specific companies or industry sectors, or to companies located in specific regions;
− competition has been or may be distorted; and
− the intervention is likely to affect trade between Member States.”
A common feature of these definitions is that they are very broad in scope, and aimed at
providing a conceptual framework for thinking about subsidies or support. In some cases,
specific measures are identified as representing forms of subsidies – for example, R&D
spending by the government or direct transfers to consumers and/or producers. More
commonly, however, establishing whether a particular measure may constitute a subsidy
under these broad definitions often necessitates further judgments. For example, whether
government policies lead to situations in which “competition has been or may be distorted”
requires considerable analysis – most notably a hypothetical assessment of what constitutes a
competitive situation. Whether government “revenue is forgone or not collected” requires
the specification of a counterfactual against which any revenue can be regarded to have been
13 This description is due to IISD (2011), “Subsidies and External Costs in Electric Power Generation: A Comparative
Review of Estimates”
14 For this reason, McKenzie and Mintz (2011) criticise the use of the WTO’s definition for investigating subsidies in the
energy sector. They note that this “definition of a subsidy is designed specifically to identify and remediate trade
distortions. Importantly, it was not the purpose of the ASCM (i.e. the WTO’s Agreement on Subsidies and
Countervailing Measures) to add together a plethora of identified subsidies for the purposes of determining their impact
on investment, output and emissions.”
15 http://ec.europa.eu/competition/state_aid/overview/index_en.html

Energy Taxation & Subsidies in Europe Overview of Literature
NERA Economic Consulting 4
forgone. Similarly, to establish whether capital has been provided at “less than market rates”
or if government owned-entities are failing to achieve “normal rates of return” requires
assessments of what market rates or what normal rates of return are.
Hence in practice, with only a few exceptions (for example, R&D spending), identifying
whether a policy constitutes a form of “subsidy” requires the specification of a more detailed
methodology that is often subject to various judgments. In addition, estimating the
magnitude of a subsidy often requires further assumptions to be made. Consequently, the
results reported by different studies are strongly influenced by their methodologies and the
underlying judgements and assumptions – both with respect to how a subsidy or form of
support is identified, and in how its magnitude is subsequently estimated.
The methodological approaches for measuring subsidies adopted in the literature can be
categorised into two broad types:
Price-gap approaches: which involve comparing prices paid by consumers (both final and
intermediate) with benchmark or reference prices. Such approaches, therefore, do not
consider the individual mechanisms that contribute to differences between consumer
prices and benchmarks; and
Programme-specific approach: which involve analyses of individual policy measures
against criteria with a view to identifying whether these constitute a form of “support” or
“subsidy”.
Both approaches have significant data requirements, although programme-specific
approaches are more data intensive as they require the analysis of individual policy measures.
Hence, many programme-specific approaches often focus on a particular country in isolation.
Although many studies can be categorised as taking one of these two broad approaches, there
can be important differences in the methodologies employed by individual studies that can
lead to very different conclusions. For the remainder of this section, we provide brief
overviews of four of the most widely quoted studies conducted by the following
organisations:
1. the Organisation of Economic Cooperation and Development (OECD);16
2. the International Energy Agency (IEA);17
3. the International Monetary Fund (IMF);18
and
4. the IISD.19
These studies have been relied upon repeatedly by public bodies and organisations to
highlight the (perceived) preferential treatment of specific energy sources. For example:
16 OECD (2013), “Inventory of Estimated Budgetary Support and Tax Expenditures for Fossil Fuels 2013”
17 IEA (2013), “World Energy Outlook: 2013”
18 IMF (2013), “Energy Subsidy Reform: Lessons and Implications”
19 IISD (2012), “Fossil Fuels – At What Cost? Government Support for Upstream Oil and Gas Activities in Norway”

Energy Taxation & Subsidies in Europe Overview of Literature
NERA Economic Consulting 5
in a recent Staff Working Document,20
the European Commission cited a figure of €26
billion as the total level of support received by fossil fuels, apparently relying on an
interpretation of the OECD inventory that the OECD itself cautions against (see
section 2.2.5 below);
the IISD’s review of subsidies in electricity generation quotes estimates from the IEA,
IMF and OECD, as well as its own analysis.21
a review of energy subsidies by Oil Change International similarly reports estimates
collected by IEA and OECD, summing estimates constructed using two very different
methodologies;22
and finally
a recent report by (Blyth (2013)) to the UK Parliament’s House of Commons
Environmental Audit Committee provides estimates of subsidies in the UK.23
For fossil
fuels, the study largely relies on the OECD’s inventory. It also goes on to report
subsidies received by nuclear power and renewable energy sources.
2.2. Studies Investigating Subsidies and “Support” to Fossil Fuels
2.2.1. The OECD’s Inventory of Budgetary Support
Study Snapshot: OECD Inventory of Budgetary Support
Methodology type: Programme-specific
Methodology: Support identified consists primarily of tax expenditures, defined as the difference between the actual tax rate applied to an energy product and a country-specific benchmark tax rate
Scope: OECD member states (including Norway and 21 of the EU 28 member states)
The OECD, relying on a programme-specific approach, has produced one of the most widely
quoted studies on “support” to fossil fuels. The inventory, however, relies heavily on
government documents produced individually by all the OECD 34 member states to estimate
the level of support in each country. As the inventory acknowledges itself, conventions vary
across member states with respect to which measures are considered a form of support
(particularly with respect to “tax expenditures”, which are discussed below), making it
difficult to compare the results across countries and products. The OECD methodology has
been subsequently applied to six non-OECD EU countries by IVM (2013).24
20 European Commission (2013), “European Commission Guidance for the Design of Renewables Support Schemes”
Commission Staff Working Document. 5 November 2013
21 IISD (2011), “Subsidies and External Costs in Electric Power Generation: A Comparative Review of Estimates”
22 Oil Change International (2012), “Low Hanging Fruit: Fossil Fuel, Climate Finance, and Sustainable Development”
23 Blyth (2013), “Written Evidence Commissioned by the Committee from Dr William Blyth, Oxford Energy Associates”
24 IVM (2013), “Budgetary Support and Tax Expenditures for Fossil Fuels: An Inventory for Six non-OEC EU Countries”

Energy Taxation & Subsidies in Europe Overview of Literature
NERA Economic Consulting 6
The inventory notes that its definition of “support” is
“deliberately broad, and is broader than some conceptions of ‘subsidy’. It
covers a wide range of measures that the authors deem to provide a benefit
or preference for a particular activity or a particular product, either in
absolute terms or relative to other activities or products.”
The categories of items covered by the OECD inventory are: “tax expenditures that in
some way provide a benefit or preference for fossil fuel production or consumption”; and
a selection of measures “that do not affect current production or consumption…
including… expenditures relating:
− to past production activities (e.g. to compensate victims of mine land subsidence
following the underground extraction of coal or hydrocarbons),
− to research and development not directly relating to production, and
− to activities such as the funding of strategic stockpiles.”
“Tax expenditures” represent the difference between the actual tax rate applied to a good or
product and essentially a hypothetical higher “benchmark” rate. We discuss tax expenditures
in further detail in section 2.2.5 below – in particular, explaining the limitations of using them
to identify subsidies or support. The vast majority of “support” identified by the OECD
inventory is, in fact, in the form of tax expenditures.
Figure 2.1 shows the five countries identified by the OECD inventory in which fossil fuels
receive the largest “support”. To emphasise the importance of tax expenditures, we
distinguish them from other measures that involve actual direct transfers from the
government to the energy source, rather than foregone (hypothetical) tax revenue.25
The only
significant level of support identified in the top five countries that is not tax expenditure is
government payments associated with coal mining in Germany.
25 Note that we do not sum the estimates of “support” identified in the OECD inventory across countries, as the
methodology used does not allow for cross-country comparisons for the bulk of the support identified (which is via tax
expenditures). This feature of the study’s methodology is emphasised by the OECD authors, and we discuss this in
more detail in section 2.2.1 below.

Energy Taxation & Subsidies in Europe Overview of Literature
NERA Economic Consulting 7
Figure 2.1 OECD Inventory: Five Countries Providing Highest “Support” in 2011
Source: OECD (2013) and NERA analysis as described in text
2.2.2. IEA database of energy subsidies
Study Snapshot: IEA World Energy Outlook (and accompanying online database)
Methodology type: Price gap
Methodology: Support is measured by comparing end-user prices to a benchmark based on the price at the nearest international hub (and for electricity, the annual average cost of generating electricity), adjusted to include costs of distribution and marketing, and, where applicable, VAT (other taxes are not included in the benchmark price).
Scope: Global
The IEA maintains a database of energy subsidies for a number of countries, and reports
results in its World Energy Outlook annual publication. The database focuses on fossil fuels,
and reports subsidies separately for oil, natural gas, coal and electricity.
The IEA has adopted a “price gap” approach to defining and measuring subsidies that
involves comparing final prices faced by end-users (or electricity producers) to a “reference
price”. The reference price is intended to correspond to the “full cost of supply.” The
amount by which actual prices paid by consumers are lower than the reference price – i.e. the
price gap – is taken to be the level of subsidy.
With the exception of electricity, reference prices are based on comparable prices in the
nearest international hub. Reference prices include an adjustment to reflect transport-related
costs, and the nature of adjustments varies between countries that are net exporters and
0
1
2
3
4
5
Coal Oil Gas Coal Oil Gas Coal Oil Gas Coal Oil Gas Coal Oil Gas
Germany UnitedKingdom
France Belgium Italy
€bn
Direct Government Expenditure Tax Expenditures

Energy Taxation & Subsidies in Europe Overview of Literature
NERA Economic Consulting 8
importers of the fuel. In addition, the IEA reference price for a given country also includes
an adjustment for VAT where VAT is levied on the energy source, although other taxes (e.g.
excise duties) are excluded from the reference price. For electricity, the reference price is
based on an assessment of the average cost of producing electricity. Under the price gap
methodology, prices below reference prices in importing countries are an indication of the
level government support for a particular energy source. In energy producing countries, if
actual prices are below reference prices, the price gap methodology identifies the opportunity
cost associated with the lower price – i.e. the amount by which energy could be sold at higher
prices elsewhere.
The IEA reported global subsidies to fossil fuels of $523 billion in 2011 (and $544 in
2012).26
The IEA’s approach does not identify any subsidies in the EU, however, because
end-user fuel prices do not materially differ from the international reference prices against
which the IEA makes its comparison. The IEA notes, however, that its approach generally
underestimates total fossil fuel support because it does not detect policies that do not lower
the downstream end user price below the applicable reference price.
2.2.3. IMF’s energy subsidy reform
Study Snapshot: Energy Subsidy Reform – Lessons and Implications, IMF
Methodology type: Price gap
Methodology: Similar to IEA approach comparing end-user prices to benchmark price. Distinguishes between: (1) “pre-tax support” – measured by comparing (pre-tax) end-user prices with a benchmark pre-tax price; and (ii) “post-tax support” – compares end-user prices (including taxes such as VAT, General Sales Tax (GST), excise duties) with a benchmark price that includes an allowance for notional“benchmark”consumptiontaxes (such as VAT or GST) as well as certain externalities attributed to energy sources.
Scope: Global
The IMF has undertaken work on measuring energy subsidies, focusing on fossil fuels. It
uses a price gap methodology that is very similar to the IEA’s for measuring subsidies. Its
definition of subsidies distinguishes between consumer and producer subsidies: “consumer
subsidies arise when the prices paid by consumers, including both firms (intermediate
consumption) and households (final consumption), are below a benchmark price, while
producer subsidies arise when prices received by suppliers are above this benchmark.” When
consumer prices are below the benchmark someone (e.g. the government) is assumed to be
covering the difference.
The IMF estimates subsidies on two different bases:
26 IEA. World Energy Outlook 2012; and IEA. World Energy Outlook 2013.

Energy Taxation & Subsidies in Europe Overview of Literature
NERA Economic Consulting 9
1. pre-tax subsidies, which are based on a comparison of pre-tax end-user prices with a
benchmark price. For traded products, the benchmark price is based on an international
benchmark price adjusted for distribution and transportation costs. The IMF assumes
margins for distribution and transportation are similar across all countries. For non-
traded products – mainly electricity – the benchmark price is “is the cost recovery price
for the domestic producer, including a normal return to capital and distribution costs”.
2. post-tax subsidies, which compare end-user prices inclusive of all taxes with a
benchmark price that reflects assumptions about a “reference rate” of VAT (or GST) and
allowances for the externalities of greenhouse gas (GHG) emissions, local air pollutants,
and some traffic externalities (e.g. congestion). For VAT, the IMF develops assumptions
about what constitutes a reference rate of VAT: for example, in countries where no VAT
is paid on the consumption of any product, it nonetheless assumes that the reference VAT
is the same as in countries with similar incomes. The adjustment for GHG emissions in
the benchmark price is based on an assumed carbon price of 34 USD/tCO2e, which is
taken from the United States Environmental Protection Agency.27
Finally, for local air
pollutants, the IMF assumes that countries have similar characteristics to the US and uses
estimates from the US to quantify this externality.
The IMF’s study acknowledges several limitations of its adopted methodology. For example,
its price gap approach “does not capture subsidies that arise when energy suppliers are
inefficient and make losses at benchmark prices.” However, there are more important
limitations of its methodology that are also acknowledged by the authors, including: a lack of
data for some products and/or countries; reliance on a snapshot of prices at a particular point
in time and for selected groups only; lack of comparability across countries for some types of
fuels because they reflect local characteristics; stylised assumptions about transportation
costs; and – significantly, given the motivations for the current study – stylised assumptions
for “corrective taxes”.
On the pre-tax basis, the IMF estimates total global fossil fuel subsidies of $492 billion in
2011. However, the majority of this is accounted for by oil exporting countries, with Middle
Eastern and North African countries accounting for about 48 per cent of the total. The IMF
does not find any significant pre-tax subsidies in advanced economies.
On a post-tax basis, the IMF estimates total subsidies of $2.0 trillion in 2011. Externalities
account for the most significant share of this total, accounting for about $1.3 trillion. A large
proportion of the post-tax subsidy is attributed to the US, which the IMF estimates provides
“subsidies” of $410 billion. We have not attempted to analyse this estimate, as the US is
outside the scope of our study. In the EU 28 + Norway, which are the focus of the present
study, the IMF finds total post-tax “subsidies” of $113 billion. Figure 2.2 shows the
breakdown of subsidies by fuel across these countries as a whole, and in the five countries
that, according to the IMF, account for the largest share of “post-tax subsidies”.
27 This carbon price is based on the social cost of carbon approach. We discuss different approaches to estimating a
carbon price in Appendix C.

Energy Taxation & Subsidies in Europe Overview of Literature
NERA Economic Consulting 10
Figure 2.2 IMF Estimates of “Post-Tax Subsidies”: EU-28 + Norway, 2011
Source: IMF. “Energy Subsidy Reform: Lessons and Implications.” 2013.
Note: Thefigureshowsthetotal“post-taxsubsidies”identifiedbythe IMF for the EU-28+Norway,brokendownbyfuel.ItalsoshowstheIMF’sestimatesforthefiveEU-28 countries accounting for the greatest amount of post-tax subsidy.
2.2.4. The IISD’s reports on subsidies
Study Snapshot: Several reports by IISD on different countries
Methodology type: Programme-specific
Methodology: Support is measured through the assessment of individual measures, with tax expenditures typically accounting for the majority of estimated support.
Scope: Selected individual countries
The IISD has undertaken several studies to estimate subsidies in different countries, including
Canada, Indonesia, Russia, and Norway. The approach adopted by IISD in all of these
studies involves a programme-specific review of individual policies, which is similar to the
approach adopted by the OECD. In particular, the IISD adopts the WTO’s definition of
subsidies (see above) and evaluates different policy measures to assess the extent to which
each may constitute a subsidy.
The majority of “support” identified in the IISD’s country reviews is typically in the form of
forgone government revenues – most notably, tax expenditures. For example, in the IISD’s
report on Norway, two policy measures account for around 97 percent of the total “subsidy”
identified, both of which are examples of forgone revenues by the government. Similarly,

Energy Taxation & Subsidies in Europe Overview of Literature
NERA Economic Consulting 11
more than half of the total support identified in the IISD’s study on Canada is in the form tax
expenditures.
The IISD’s report on Norway (which is one of the countries included our study) focuses on
upstream oil and gas production only, and reports figures for 2009. The two policy measures
that account for the vast majority of the total “subsidy” are: (1) the reimbursement of
exploration expenditures;28
and (2) the fast deductions of investment.29
In the case of the first
measure, the IISD study acknowledges that the Norwegian “Ministry of Finance states that
such reimbursement is not to be viewed as a subsidy”. However, IISD nonetheless regards
the measure to be a form of subsidy as it represents “a preferential treatment of deficit-
running companies in the petroleum industry compared with such companies in other
industries.” In contrast, the OECD inventory does not record either of Norway’s capital
allowance provisions as “support”. This difference underscores the extent to which
subjective judgments have a very significant influence on estimates of support that are based
on tax expenditure.
2.2.5. Comments on Existing Approaches
A feature of the estimates of “support” produced in some of the studies summarised above is
that they rely on hypothetical “benchmarks” to identify subsidy and support. These
benchmarks are often selected in a way that is subjective, and that may not be appropriate
when considered in a wider context.
For example, as noted above, the OECD inventory appears to be the source of the European
Commission’s estimate of total government “support” of fossil fuels of €26 billion30
– even
though the OECD cautions against adding up its estimates (see Box 2.1). Other studies, for
example, by the IEA and IMF, typically also rely on benchmarks for their reference prices.
As noted above, the IMF does not find any significant “subsidies” in EU countries when
analysing pre-tax prices, but it does when it considers post-tax prices. This highlights the
importance of clearly articulating the nature of the “support” that is identified by different
analyses. Tax regimes and mechanisms for raising revenue vary significantly across
countries. When benchmarks are used to compare levels of taxes it requires particular
judgments about the levels at which taxes should be set, and these judgments are far from
uniform.
To illustrate some of shortcomings of relying on benchmarking approaches – particularly
when analysing taxation and other revenue-raising policies – we consider the OECD
28 The reimbursement of exploration companies was introduced in 2004 with a view to encouraging new entry. It allows
companies in a non-taxable position to reclaim 78 per cent (also the marginal tax rate on the profits from the sector) of
their exploration expenditures in the year after they have been incurred.
29 The fast deductions of investments refer to accelerated depreciation of capital allowances over six years for offshore
investments. IISD concludes that this is a subsidy, because it allows for faster deductions than are available to other
sectors. However, IISD concludes that the “uplift” provided for the partial additional depreciation over four years
against the Special Tax of 50 per cent is not a subsidy, because it was introduced specifically in the context of the
higher Special Tax rate. Thus even though IISD notes that in general “fast payback needs to be seen in the context of
the high tax rate of 78 per cent, as these elements were enacted and balanced against each other”, they apply this
conclusion selectively to one capital allowance provision, but not the other.
30 See footnote 20, above.

Energy Taxation & Subsidies in Europe Overview of Literature
NERA Economic Consulting 12
inventory, which is one of the most widely quoted sources on the budgetary support of fossil
fuels. The OECD inventory provides a very useful and detailed compilation of a wide range
of policies across a large number of countries, and we rely on it as a source of data for the
current work. However, because the benchmarks that it relies upon are difficult to compare
or sum across countries and across energy sources, its findings need to be used with an
understanding of what it is appropriate to do with them, and what not.
Box 2.1 (Mis)-Interpretations of the OECD Inventory
As noted above, the OECD inventory appears to be the source of the European Commission’s
estimate of fossil fuel subsidies in 2011 amounting to €26 billion.31
The data in the OECD
inventory are not intended to be summed across countries, or even across fuels. However,
when we sum all of the reported support and expenditure included in the OECD inventory for
EU countries – which the OECD explicitly advises against doing – we find a total of
approximately €27 billion in 2011, with an average amount over the years 2007 to 2011 of
€26 billion. We therefore infer that the European Commission has derived its estimate for
fossil fuel subsidies by summing up all figures in the inventory, with slight discrepancies
possibly explained by exchange rate conversions.
We have carried out a line-by-line review of the OECD data, noting which items reflect direct
government payments and which reflect tax expenditures. In Figure 2.3 we take the data for
2011 from the OECD inventory and, for the three fuels, break down the total amount of €27
billion total into direct government payments to each fuel and tax expenditures.
31 See footnote 20 above.

Energy Taxation & Subsidies in Europe Overview of Literature
NERA Economic Consulting 13
Figure 2.3 Government Transfers and Tax Expenditures in OECD Inventory Data (2011)
Source: NERA analysis of OECD (2013).
This analysis makes it clear that if one sums the OECD inventory across countries in this way
(which should not be done in the first place) a large majority of the €27 billion is attributable
to “tax expenditure” – which are not comparable across countries or fuels. Only around €4.1
billion actually reflects government payments to the sectors (of which €3.7 billion was
directed towards the coal sector), which it may be appropriate to sum.
As Box 2.1 illustrates, by far the most significant forms of “support” identified in the OECD
inventory are so-called “tax expenditures” – and this is also true of the IISD study. Tax
expenditures represent the difference between the actual tax rate applied to a commodity and
what is essentially a hypothetical higher “benchmark” rate. For example, in the UK, the VAT
rate applied to natural gas consumed by the domestic and residential sector is 5 per cent.
Different VAT rates are applied to different commodities and categories of consumption: the
VAT rate on food items is 0 per cent; on residential electricity consumption it is 5 per cent;
and on gasoline it is 20 per cent. Although EU legislation defines a “standard rate” of VAT
of 15 per cent,32
the legislation includes provisions for various exemptions to apply to some
types of products, including natural gas, electricity and heating. Thus, it is not
straightforward to determine what an appropriate “benchmark” VAT rate is. For instance,
depending on the subjective judgment of what constitutes the benchmark rate, different
conclusions can be reached about whether domestically consumed natural gas in the UK is
“supported” by the UK’s 5 per cent VAT tax. Subjective judgements about benchmarks – for
example, about VAT – also underpin the approach adopted by the IMF.33
32 VAT Directive 2006/112/EC
33 As noted in section 2.2.3 above, the IMF includes a notional rate of VAT in its (post-tax) benchmark prices – even in
countries where no VAT is paid on any product.

Energy Taxation & Subsidies in Europe Overview of Literature
NERA Economic Consulting 14
The commentary accompanying the OECD’s inventory includes a detailed discussion of the
issues associated with measuring “support” in the form of tax expenditures. An important
limitation of the inventory’s findings is that estimates of support cannot be compared across
countries or across energy sources. The authors note that “a simple cross-country comparison
of the tax expenditures can lead to a misleading picture of the relative treatment of fossil
fuels”. This is because tax expenditures reported in the OECD inventory are based on
estimates constructed by and for individual member states, and there is a lack of consistency
across countries in their approaches to issues that are fundamental to the identification and
estimation of tax expenditures. In particular, there is:
a lack of consensus among countries on how a benchmark should be defined. The report
notes that several approaches are used. For example, the authors discuss that some
countries set a benchmark with respect to “a conceptual view about what constitutes
‘normal’ taxation of income and consumption” whereas others only rely on a benchmark
that is explicitly defined in law.
a lack of consensus among countries on how to measure the size of tax expenditures. For
example, the authors note that when quantifying tax expenditures, some countries do not
take into account expected changes in consumer behaviour (for example, changes in
consumption patterns) in response to tax changes, whereas others do take them into
account.
The use of tax expenditures also poses challenges in conducting comparisons of “support”
across different energy sources. Typically, tax expenditures are identified by comparing tax
rates across a small group of fuels. For example, in Finland, the tax rate applying to gasoline
is used as the benchmark for transport fuels, and a tax expenditure on diesel is identified on
this basis. If the rate on diesel were used as the benchmark instead, there would be no
support identified, because the rate on gasoline is higher. It also is not clear how tax rates
should be compared across a broader range of fuels that are subject to different taxation
regimes. To give an example, in the UK, the climate change levy (CCL) covers electricity,
gas and solid fuels, but not oil and its derivatives. Instead, oil is covered by the hydrocarbon
oils duty. The existence of such differences shows the challenges of drawing conclusions on
the relative “support” offered to different energy sources solely on the basis of selectively
analysing tax expenditures.
A further limitation of approaches such as the OECD’s inventory is that they focus on
policies that apply at particular portions of the value chain of an energy source and ignore the
broader context of the tax regime applying to the energy source’s end to end value chain.
This limitation is also acknowledged by the OECD inventory in the context of fossil-fuel
production taxes. The inventory notes that “countries use varying approaches, such as
royalty systems, resource-rent taxes, and cash-flow taxes to tax the super-normal profits that
can be associated with resource extraction and ensure a fair return to the public when
publicly-owned resources are sold. All of these issues must be taken into account when
assessing any particular feature of a tax system” (emphasis added).
The importance of the overall context is illustrated by the historical experience of taxation
applied to the upstream oil and gas sector in the United Kingdom, which we discuss in more
detail in a case study included in Appendix A. The case study shows how, reflecting
different government objectives, the regime has changed on several occasions, and it

Energy Taxation & Subsidies in Europe Overview of Literature
NERA Economic Consulting 15
illustrates how inferences drawn from focusing on an individual policy change and/or period
can be misleading, because it misses the bigger picture.
The importance of taking into account a wider context applies not just to the kind of
individual policy-by-policy analysis undertaken by the OECD. It also applies to the high
level approaches adopted by the IMF and IEA. As noted above, the IMF’s post-tax estimate
of subsidies includes a component for externalities – including GHG emissions, local air
pollutants, and a selection of transport externalities (for example, congestion and accidents).
The IMF’s approach appears to attribute these externalities entirely to the energy sources, and
then considers whether end-user prices, inclusive of taxes such as excise duties, cover such
externalities. In practice, however, other forms of taxation are typically applied, in
conjunction with taxes levied directly on energy sources, to reflect externalities. Such taxes
are ignored by the IMF’s approach. For example, many countries use different instruments to,
directly or indirectly, charge for the congestion externality – for example, road-pricing
schemes or taxes levied directly on the sale of vehicles. The IMF’s approach, however,
ignores such revenues.
In practice, therefore, governments make a range of different decisions about whether, and
how, to internalise externalities, through both regulations and pricing mechanisms. As we
discuss below, in part for this reason, and because externalities are in a category that is
distinct from government revenues and subsidies, we do not account for them in the way
adopted by IMF. We discuss our approach in section 3.4, below.

Energy Taxation & Subsidies in Europe Methodology
NERA Economic Consulting 16
3. Methodology
As the discussion in Chapter 2 shows, a number of studies have investigated governments’
direct and indirect payments to and receipts from different energy sources with a view to
assessing the extent of “support” provided by diverse government policies and mechanisms.
In this chapter, we discuss our approach to addressing this question (summarised in Box 3.1).
We begin by describing key features of our approach in section 3.1, and note its main
advantages over the approaches used by others. We then outline the scope of government
revenues, expenditures, and other transfers that we consider in section 3.2: here we discuss
the different parts of the energy value chains, how we have decided which categories to
prioritise, and how we allocate transfers between different energy sources. To facilitate the
comparison of net financial flows among the different countries and energy sources, we have
classified them into a set of categories. These categories are described in more detail in
section 3.3. Finally, we have also considered the externality associated with the release of
greenhouse gas emissions, and we discuss this externality along with others in section 3.4.

Energy Taxation & Subsidies in Europe Methodology
NERA Economic Consulting 17
Box 3.1 Approach to Comparing Support Across Energy Sources
We have approached the question of relative levels of “support” from a perspective that
differs from those used in other studies. We estimate the full range of financial flows both to
and from different sources of energy as a result of government policy, including direct
subsidies, other transfers of funds, and major taxes. We start by cataloguing government
policies that either lead to government revenues (e.g. taxes, duties, licensing fees, royalties)
or government expenditures (direct capital grants, consumption support payments, production
subsidies) that are linked to fuels or energy sources. On top of these, we include support that
is provided indirectly through government-mandated transfers – transfers that are effectively
required by government policies, but which may not involve direct contributions to, and
demands on, government finances (for example, feed-in-tariffs). This approach is
summarised in Figure 3.1 below.
Figure 3.1 Overview of NERA’s Approach
Our approach explicitly recognises that government expenditures on subsidies have an
obvious counterpart in government revenues from taxation. Whereas other approaches
selectively choose a subset of taxes to benchmark against, we take a more comprehensive
approach, and estimate all material sources of revenue raised from different energy sources.
This eliminates the need to select an arbitrary benchmark to compare to.
A major advantage of our approach is that it allows us to make cross-sector, cross-energy,
and cross-country comparisons and to calculate totals, which it is not possible to do under
many of the other approaches used in the literature. We also consider individual policies and
sectors of the economy, so we can reflect details that may be overlooked by more high level
methodologies (for example, the price gap approaches used by the IEA or IMF).
Government Revenues:
• Upstream revenues: taxes, license fees, royalties,
dividend payments, corporation tax revenues
• Corporation tax on midstream and downstream activities
– e.g. energy transformation (power generation and
refining), storage, transportation and retail
• Excise duties and other energy taxes
• Value added tax
Mandated transfers:
• Support schemes for renewable energy sources (e.g. FITs
or renewable energy certificates)
Government Expenditures:
• Upstream government expenditures – support to current
production
• Government transfers for power generation, energy
transport and storage
• Consumption support: payments (often to selected
vulnerable groups – e.g. low-income households)
• Government payments to cover historic liabilities
(exclusively in coal industry – e.g. labour compensation)
Total:
• Net transfers received from (provided to) each energy
source, i.e. all the government revenues, minus
government expenditures and mandated transfers
Illustrative Diagram
€

Energy Taxation & Subsidies in Europe Methodology
NERA Economic Consulting 18
3.1. Key Features of Our Approach
As noted on the preceding page, our approach is to estimate two “government transfer”
quantities for each energy source: 1) total revenues collected from the energy source by
government, and 2) total expenditures that benefit the energy source. 34
Taken together, these
two quantities allow us to estimate the net total effect on public finances of government
policies and mechanisms affecting a particular energy source. Expenditures are the total
demands on public finances (including, for example, direct payments from governments);
revenues are the total contributions to public finances (including, for example, excise taxes).
We discuss the specific categories of government revenues and expenditures we have
considered in sections 3.3.1 and 3.3.2 (respectively) below.
In addition, our analysis extends to transfers that are mandated by government policies, but
which may not involve direct contributions to, and demands on, government finances. Like
direct transfers, government-mandated transfers also involve transfers to or away from an
energy source (and often between sources) with a view to supporting a policy objective. For
example, many government policies provide feed-in-tariffs (FITs) to renewable energy
sources and these are typically paid for by consumers or other electricity suppliers, with the
financial flows between consumers and producers prompted by the policy often bypassing
public coffers altogether. One way to view mandated transfers is to consider the net financial
burden placed on the energy source by taxes and other key government policies. Viewed this
way, taxes such as VAT and corporation tax impose a financial burden on the energy source.
Conversely, policies such as direct grants or mandated transfers such as FITs for renewable
energy sources lead to support for the energy source. We discuss government-mandated
transfers further in section 3.3.3 below.
We also consider how to reflect externalities in our analysis – that is, the costs or benefits
resulting from an activity that affect third parties that are not directly involved. There are a
wide range of externalities often linked directly or indirectly to energy (for example,
greenhouse gas emissions). Positive externalities lead to benefits or revenues accruing to
third parties and negative externalities generate costs or damages to those parties. To the
extent that firms are not charged for negative externalities, policies permitting these
externalities may be considered a form of “support”: firms do not pay for the cost that their
activity imposes on others. In practice, some government transfers (and government-
mandated transfers) are motivated in part by the presence of such externalities.35
We discuss
externalities further in section 3.4 below.
Our approach provides a transparent assessment of the net government transfers to/from each
energy source, taking account of transfers across the entire value chain, from production,
transformation, transport, and storage, to distribution and consumption. In turn, these net
transfers to/from each energy source provide an indication of the extent to which government
34 It is also possible to understand our methodology from the perspective of the energy sectors themselves, in which case
the two categories become 1) sector payments to government, and 2) sector revenues due to government policy –
whether received directly from governments, or as a result of government mandates or other policy.
35 For example, the EU legislation on minimum excise duties on energy products is explicitly identified as being linked to
emissions of CO2.

Energy Taxation & Subsidies in Europe Methodology
NERA Economic Consulting 19
policies may support them. Importantly, by focusing on transfers across the entire value
chain, our results of the overall net contribution of each energy source are not distorted by
selectively focusing on policies affecting only certain activities. This is an important
consideration for understanding any support provided to energy sources. The strategic
importance of energy sectors means that they typically face multiple government policies at
different parts of their value chains, designed to achieve multiple objectives. Individual
elements of policies, if viewed in isolation, may lead to some measures being viewed as
“support”, when in fact they might be part of a broader set of policy objectives that seek to
increase government revenues overall.
Our approach avoids many of the shortcomings of existing approaches by including: (i) the
full range of an energy source’s value chain – from production to final consumption; (ii)
transfers from government as well as transfers to government (including transfers mandated
by government policy). This allows individual policies affecting an energy source to be
analysed within the wider context of government taxation and regulation. Importantly, the
approach allows for more meaningful comparisons between the net contributions to (or
demands on) government finances of different energy sources and other objectives in the
public interest. Unlike many of the approaches outlined above, our methodology enables
comparisons across energy sources and across countries.36
3.2. Scope of Transfers
Our analysis extends to all 28 countries of the European Union as well as Norway. To guard
against the possibility that our results could be affected by one-off changes in policy, we have
gathered available data on transfers over the period 2007 to 2011.37
(In some cases data are
not available over the entire period.)
The discussion in the preceding section highlights the importance of accounting for the full
range of economic activities from each energy source. Our methodological scope therefore
extends to expenditures and revenues across the entire value chain – from production to final
consumption. The specific activities that we have investigated for each energy source are
summarised in Table 3.1. We have relied upon publicly available data sources, and so in
practice, our estimates have been constrained by data availability. We note any omissions,
and our approach to addressing these, in our discussion of individual categories below.
36 We note that we do not consider macroeconomic or “multiplier” effects (which would require a very significant
expansion of our scope). We also do not attempt to quantify the impacts on employment of different energy sources, on
which there is a wide and expanding literature of varying quality. Our focus is on the energy sources themselves, and
not their interactions with the wider economy.
37 Unfortunately many of the data sources on which we rely have not yet been updated for 2012.

Energy Taxation & Subsidies in Europe Methodology
NERA Economic Consulting 20
Table 3.1 Activities Associated with Energy Sources
In most cases, we have not attempted to account for transfers associated with employees.
Examples of such transfers include national insurance contributions, social security payments,
or any state pension contributions made by employers. Similarly, we have not tried to reflect
income tax payments by employees. This reflects the view that labour typically does not
“belong” to a particular sector. The only exceptions to excluding labour-related transfers are
compensation payments made by the government to coal miners, typically associated with
structural adjustments as well as health liabilities. Such payments are a direct consequence of
the involvement of employees in coal production, and not because they are employees per
se.38
The fiscal regimes applied in the different members states of the EU and Norway include a
vast number of mechanisms that lead to transfers. We have identified major data sources that
cover some of the most important categories of revenues and expenditures relating to energy.
For revenues and expenditures not covered in our detailed analysis of major data sources, we
have applied a materiality threshold to prioritise the most important transfers. In this respect,
we have used an energy source and country-specific threshold of the smaller of €0.5 billion or
5 per cent of revenue or expenditure. We have used a variety of approaches to establish
whether a particular item is likely to meet this threshold. Box 3.2 illustrates one example of
our approach applied to the coal mining industry in Poland.
38 We are not aware of any reason to think that excluding employee-related contributions from our analysis materially
affects our overall conclusions about the relative comparison of different energy sources.

Energy Taxation & Subsidies in Europe Methodology
NERA Economic Consulting 21
Box 3.2 Materiality: Coal Mine Corporation Taxes in Poland
We have investigated the profitability of coal mines in Poland to establish the likely
magnitude of corporation tax receipts. Our review of publicly available sources has
suggested that in many years, profits have been negative, and that when profits have been
made, these are typically small. We have therefore concluded that corporation tax receipts
from coal production in Poland are therefore likely to be significantly below the materiality
threshold. The appendices on revenue and expenditure items provide details of how we have
established materiality for different transfers.
For revenues from energy production activities, we have focussed on the group of countries
that together account for at least 90 per cent of production of an energy source within the EU
and Norway. We have then derived estimates of revenues from remaining production
activities by scaling our estimates in proportion to the residual production in each country.
For example, for oil and gas, this threshold has led us to produce detailed estimates of
upstream revenues for: Norway, Netherlands, United Kingdom, Germany, Denmark and Italy.
Collectively, these countries accounted for 90 per cent of combined oil and gas production in
the EU countries and Norway in 2011. We have scaled the estimates for these six countries
to estimate total revenues from oil and gas production across the remainder of the EU
In some cases, we have been able to collect revenues or expenditure data that are aggregated
across the energy sector as a whole – for example, VAT receipts on electricity. We have
allocated such transfers to individual energies in proportion to an appropriate measure of
activity for the relevant sector. For example, in the case electricity VAT receipts, we have
allocated total receipts to individual fuel sources on the basis of the respective electricity
production from each fuel. This approach has also been used by other reports measuring
support – for example, the OECD’s inventory of budgetary transfers.
3.3. Categories of Revenues and Expenditures
To facilitate the comparison between different energy sources, we have allocated transfers to
different categories of revenue and expenditure. The different categories are shown in
Table 3.2 below.

Energy Taxation & Subsidies in Europe Methodology
NERA Economic Consulting 22
Table 3.2 Categories of Government Revenues and Expenditures
Source: NERA analysis Notes: 1. EU ETS revenues are classified in Eurostat among energy taxes but are not included within
excise duties. 2. For mandated expenditures, the corresponding“revenue”categoryistypically funded
through levies or other instruments whose costs are shared between consumers and other producers – for example, balancing costs associated with renewable energy sources are reflected in higher bills for customers. We do not quantify these costs imposed on consumers and other producers, but note that they may be significant.
3. Includes support to RES and CHP electricity generation technologies (FITs, RECs, ROCs), priority grid access and grid infrastructure investment support which can either be in the form of direct or mandated transfers.
4. Includes decommissioning payments, compensation payments to workers and spending on repairing environmental damages. 5. The impact of price regulation has not been quantified – see discussion below.
We provide an overview of these categories in the sub-sections below, distinguishing
between direct revenue categories, direct expenditure categories, and transfers mandated by
government policy.
3.3.1. Direct Government Revenue Categories
3.3.1.1. Upstream extraction and production taxes
Royalties, hydrocarbon taxes such as the petroleum revenue tax in the UK or the special tax
in Norway, and other similar upstream levies are major sources of direct government revenue
from fossil fuels. A variety of approaches are used by countries to extract revenues from
hydrocarbon production related activities, and these approaches often change over time (in
part, in line with the evolution of government policy objectives). Appendix A includes a
detailed case study of the tax regime applying to the upstream oil and gas sector in the UK,
and shows how this has changed to reflect changing policies and markets, and the evolving

Energy Taxation & Subsidies in Europe Methodology
NERA Economic Consulting 23
state of the UK’s resource over time. Examples of instruments included within the royalties
and upstream levies category include: royalties levied on the value of the underlying resource
(e.g. the value of oil, gas or coal), taxes levied on cash flows, taxes on profits, and fees
charged up-front by government when awarding contracts. Further details of our approach
are included in Appendix B.
We have also estimated returns to the government in the form of dividends from state-owned
energy companies involved in upstream fossil-fuel production – in particular, oil and gas
companies. State ownership in such companies is often one of the ways that governments
share revenues from the extraction of the natural resource. Such companies therefore
represent an important example of an alternative to royalties or fossil-fuel specific product
taxes. To reflect this, we have included such dividends within the scope of our study. We
have, however, not included revenues from state-owned energy companies operating in other
activities – for example, transmission network companies. Unlike upstream fossil fuel
extraction companies, the sharing of profits with society is typically not a primary motive for
state-ownership. Instead, state-ownership typically reflects a combination of historical
reasons, perceived strategic nature of the company’s activity, and an alternative to regulation
in the case of infrastructure companies that have natural monopoly characteristics (e.g.
electricity transmission grids or gas transport networks).
3.3.1.2. Corporation tax
Corporation taxes – i.e. taxes imposed on the profits of companies – are another significant
source of government revenues from the energy sources. Total corporation tax receipts
across all business activities in Europe were approximately €322 billion in 2011.39
Although
aggregate statistics for corporation taxes are available, we are not aware of any publicly
available sources that provide a breakdown of corporation tax that can be easily attributed to
the different energy sources. The only exceptions to this are corporation tax receipts from
upstream oil and gas activities, where the significance of the tax contribution of the
companies has led governments to report these explicitly.
To facilitate the estimation of such revenues, we have distinguished between companies in
different vertical segments of the value chain of each energy source, and have limited our
scope to estimate only corporation tax receipts that meet the materiality threshold. For
example, for corporation tax receipts from electricity and gas retailers, we have used
information from the UK on profitability to obtain an estimate of overall industry profits at
the level of the EU. Average profitability in the UK is estimated to be £50 per fuel account.40
With 26 million households and assuming an average of two accounts per household, profits
in the UK amount to £2.6 billion. Based on the 2011 corporation tax rate of 26 per cent, total
UK tax receipts are estimated to have amounted to nearly £0.7 billion. This meets the
country-specific materiality threshold, and we have therefore included corporation tax from
electricity and gas retailers in our study. The estimate for the UK has then been scaled to
derive an estimate for the remaining countries in our study. Our approach to estimating
corporation tax receipts is described in more detail in Appendix B.
39 Eurostat, Taxation Trends in the European Union: Data for Member States, Iceland, and Norway – 2013 Edition.
40 Ofgem, Electricity and Gas Supply Indicators.
Energy Taxation & Subsidies in Europe Methodology
NERA Economic Consulting 24
3.3.1.3. Excise duties and other energy taxes
Excise duties represent one of the most significant sources of government revenue from the
energy sector: nearly €200 billion of government revenues in 2011 were derived from such
duties on the sale of coal, oil and gas and their derivatives.41
Duties are levied on a number
of oil and gas derivative products, including petrol, kerosene, automotive diesel, industrial
gas oil, fuel oil, natural gas, coal, and electricity. Rates of excise duties vary significantly
across EU member states. For example, the excise duty applied to petrol ranges from €359
per 1,000 litres in Romania to nearly €750 per 1,000 litres in the Netherlands.42
We have
obtained estimates of revenues from excise duties from data published by the European
Commission and Eurostat. To allocate receipts to fuels, we have relied on the allocation
reported by the European Commission. Excise duty revenues from electricity are smaller and,
similarly to the methodology applied to VAT, we have allocated these to the different energy
sources based on the source’s contribution to the generation mix in each country.
Excise duties make up approximately 94 percent of all energy taxes in the EU28 and Norway.
Additional energy taxes include revenues from carbon taxes in certain countries as well as
revenues from the auctioning of allowances in the EU ETS. Appendix B provides additional
details of our approach to estimating excise duty and other energy tax revenues.43
3.3.1.4. Value Added Tax
Value added taxes (VAT) are another very significant source of government revenues from
energy, with total VAT receipts from coal, oil and gas sales in the EU and Norway amounting
to €118bn billion in 2011, with a further €43bn in VAT accruing to all of the energy sources
that are included in the scope of this study through the sale of electricity. Unlike excise
duties, available sources on VAT revenues do not typically report a breakdown of VAT that
can be readily allocated to specific energy sources. We have therefore constructed estimates
using a variety of sources. There are three main categories of VAT receipts for which we
have adopted different approaches to estimate government revenues:
VAT on the final consumption of energy (other than electricity) – for example,
products like natural gas, kerosene, petrol and diesel. We have estimated VAT receipts
from such products using energy price data and published VAT rates for domestic and
business consumption by country ;
VAT on the final consumption of electricity. We have allocated VAT receipts on
electricity consumption to our different energy sources in proportion to their share of the
generation mix in each country; and
41 European Commission, Excise Duty Tables: Part II – Energy Products and Electricity. A further €17bn of excise duties
was raised on the sale of electricity.
42 European Commission, Excise Duty Tables: Part II – Energy Products and Electricity, July 2013.
43 Note that due to certain inconsistencies in the data on excise duties and all energy taxes, as well as issues in allocating
other energy tax revenues across fuels, we have primarily relied on excise duty data for the countries included in this
study. Section B.1.3 in Appendix B provides further detail.

Energy Taxation & Subsidies in Europe Methodology
NERA Economic Consulting 25
VAT on intermediate consumption by businesses that rely on energy sources as
inputs. VAT on intermediate consumption is typically refunded to businesses. Because
the value added of businesses’ final output includes the value of their energy input, the
VAT paid on the final output also includes the VAT that would have been associated with
the energy used. We have therefore estimated VAT collected on intermediate
consumption by treating it as final consumption. This approach provides a convenient
way of reflecting the proportion of final VAT that is directly attributable to the energy
source, ignoring the VAT associated with the rest of a business’s output
For companies in the energy sector, a similar consideration arises in relation to their own
VAT. VAT receipts on the final consumption of energy products, in part, reflect the value
added associated with the inputs that are used in upstream and mid-stream activities in the
energy sector. For example, for the electricity sector, VAT receipts reflect, among other
things, the contribution of capital equipment to the final electricity price. Although some of
these inputs lie outside the direct scope of the energy sector, our methodology effectively
includes VAT associated with them, because of their integral role in the final output. This
approach also means that we do not “penalise” electricity sources that are more reliant on
capex relative to opex. For example, a major contributor to the final price of electricity
produced by gas is the cost of the gas itself, whereas for wind power, a majority share of the
cost is accounted for by capital equipment. Further details of our approach to estimating
VAT receipts are included in Appendix B.
3.3.2. Direct Government Expenditure Categories
In this section we provide an overview of our methodology regarding direct transfers made
from the government to the different energy sources – including payments to producers and
consumers as well as funds made available to cover historic production liabilities. Support to
current production and consumption provides incentives to increase the supply and use of
different energy sources. Payments made regarding historic liabilities, on the other hand, do
not promote current activity, but are often the result of underinvestment in the past. These
include payments covering decommissioning costs, compensating workers for health-related
issues due to poor labour conditions, or restoring land that has suffered from environmental
damage due to resource extraction activities.
We have relied primarily on the OECD’s inventory (as well as the supporting work carried
out by IVM (2013) for six non-OECD EU countries), to identify and estimate government
expenditures. Both organisations have carried out a detailed review of support across the oil,
gas and coal sectors in all EU countries. We rely on the OECD and IVM only as a data source
for direct payments to these sectors, excluding entries that are categorised as tax expenditures,
because we account separately (and much more comprehensively) for taxes. We do not
attempt to replicate this work, or significantly add to it. We have, however, carried out our
own validations of some of the more significant data items. Our detailed analysis of the
OECD and IVM inventories split out payments into different categories, broadly
corresponding to parts of the value chain. These categories include:
Upstream payments – in support of energy extraction activity. Production support is the
largest category of direct government expenditure. It is exclusively provided to the coal
sector, most notably in Germany and Spain. These support programmes are being
gradually phased out.
Energy Taxation & Subsidies in Europe Methodology
NERA Economic Consulting 26
Midstream payments – in support of energy transformation (e.g. electricity generation
or refining) as well as energy storage and transportation. There are relatively few
midstream payments identified in the OECD and IVM inventories, the most significant of
which is to support loss making coal-fired power generation in Poland.
Downstream payments – in support of final consumption, such as consumption grants or
price caps for certain types of consumer. Downstream payments are the second largest
category of support and are more prevalent in the oil and natural gas sectors. The
majority of payments consist of excise duty refunds provided by the government to
certain sectors, such as agriculture or public transport. These are distinct from tax
expenditures in that the full excise rate is initially paid (and captured within our data).
Only after initially paying the full rate of tax can eligible consumers request refunds on
this tax payment, which then reduce the initial government revenue.
Decommissioning payments – where governments (partially) cover the cost of asset
disposal, such as closing coal mines. This category is exclusively applicable to the coal
sector and typically is a result of either a lack of provision for decommissioning costs, or
the premature closing of mines where the owner has been unable to afford to carry out
adequate decommissioning.
Compensatory payments to workers – where governments assume liabilities related to
both health issues from historic production activities and structural unemployment. This
category also relates exclusively to the coal sector. The closure of mines in certain
countries left many otherwise unskilled workers unable to re-enter the labour force, and
facing significant health problems. Governments in the Czech Republic, Germany, Spain
and Poland have allocated resources to provide compensation to workers.
Environmental damage compensation – where governments assume the cost of
restoring areas of land that suffered from environmental damage as a result of historic
production activities. This is a relatively minor expenditure category, capturing transfers
made by the Czech and Polish governments.
In addition to relying on the estimates included within the OECD and IVM studies we have
also considered certain additional areas of government expenditure that are not included in
these inventories, which vary in their materiality as well as the extent to which reliable data is
publicly available.
Governments also make contributions to research and development (R&D) funding in energy
sectors. For example, the International Energy Agency (IEA) reports that the UK
government’s contribution to R&D funding in the energy sector in 2010 amounted to over
£0.5 billion. However, a significant proportion of this funding was allocated to other energy
sources (for example, nuclear power) and activities such as energy efficiency that are beyond
the scope of this study. Government expenditure on energy-related R&D represents a
demand on the public budget, and we have investigated the size of such transfers from
sources such as the IEA’s country-specific Energy Policies reviews.
Finally, our study also considers infrastructure investment that may lead to direct government
expenditures (or mandated transfers – see next section). We discuss infrastructure investment
and how it relates to our methodology in Appendix B. We have not been able to estimate a
specific figure for this category, although we provide some illustrative figures for the scale of
expenditures that could be associated with different energy sources.

Energy Taxation & Subsidies in Europe Methodology
NERA Economic Consulting 27
3.3.3. Government Mandated Transfers
As noted above, we have defined transfers in a broad sense so that they also include
government mandated obligations that lead to payments by others. Even though the
government does not, in most cases, directly earn revenues or incur significant expenditures
from such policies, these policies nonetheless lead to such revenues and expenditures being
accrued and incurred by others. Perhaps the clearest example of such mandated transfers is a
feed-in-tariff (FIT) provided to electricity generated from renewable energy sources. FITs
are typically paid for by consumers and other electricity producers/suppliers.
In addition to FITs, we also include other mechanisms through which renewable energy
sources are supported – for example, renewable energy certificates (RECs), and other similar
support schemes. In the case of fixed FITs (as opposed to “premium FITs”), our estimates
relate to the incremental support over and above the market value of the electricity supplied.
Estimates are based on data collected by the Council of European Energy Regulators (CEER).
Another example of government policies that impose costs on some segments of the energy
sector and confer benefits to others are provisions granting “priority access” to the power grid
for renewable electricity generators. Priority grid access provides support to electricity
generators and imposes a cost on the wider industry – and is therefore similar to other
mandated transfers. CEER (2013) reports that nine EU countries provide priority grid
connections and twelve EU countries provide priority grid access to renewable energy
generators.44
We have investigated the extent of the support that may be conferred by such
policies. We have, however, not included a quantitative value of this support in our main
results because of the significant uncertainties associated with any estimate. We discuss
priority grid access in more detail in Appendix B.
Many EU countries also apply price regulation whereby selected groups of consumers (and
sometimes all consumers) pay prices that differ from the market value of the energy provided.
Such price regulation leads to an implicit transfer to some (or all) consumers. The findings of
the IMF study, which does not highlight any significant support in the EU based on a
comparison of final energy prices with international benchmarks, suggest that there appear to
be no major cases in the EU of price regulation leading to significantly lower prices being
faced by all consumers. In cases where only a sub-set of consumers benefit from price
regulation, the cost is typically borne by a mixture of producers and other consumers,
therefore representing a cross-subsidy between different groups. This feature of price
regulation – i.e. a transfer between different groups – means that the cost of price regulation
is typically borne by the energy source in question. We have therefore not included such
price regulation in our estimates.45
44 The countries that provide priority grid access are: Belgium, the Czech Republic, Germany, Greece, Hungary, Italy,
Lithuania, Netherlands, Poland, Romania, Slovakia and Spain.
45 We note that the overall effect of such policies on consumption levels – i.e. on the quantity consumed – is not clear.
Those being charged higher prices consume less than they otherwise would, and those being charged lower prices
consume more. These two effects may not offset each other exactly, and there are potentially good reasons to suppose
that overall consumption is higher than it otherwise would be.

Energy Taxation & Subsidies in Europe Methodology
NERA Economic Consulting 28
More generally, because the analysis that we present here is static, it does not attempt to
capture what may be important implications of the policies that lead to mandated transfers.
In particular, the incidence of the transfer (i.e. the groups that bear the costs of payments
mandated by government policy), is often spread across several groups. For example, the
costs of FITs are borne by other energy companies (who face increased costs to pay the
associated levies, and whose revenues also may be significantly affected by impacts on
market prices and quantities) as well as by final consumers. In general we have not
attempted to capture dispersed effects across the wider energy markets and economy. The
impacts of the policies considered here are complex, and we make no attempt to trace their
full impact.
To take one specific example, in Germany the rapid increase in generation from renewable
energy sources has been partly responsible for a dramatic erosion recently of the financial
viability of gas-fired power stations. The absolute fiscal contribution of gas to Germany’s
government is therefore likely to have fallen, in part as a result of renewable support policies.
Moreover, independent studies have suggested that across the EU, the increase in renewable
energy as a result of government support has been a very significant contributor to the
reduction in carbon emissions covered by the EU ETS, which has in turn suppressed the EU
ETS allowance price, reduced government revenues from the EU ETS, and affected the
balance between coal-fired and gas-fired electricity generation. The cascade of policy
interactions and associated fiscal implications is important for understanding how
government policies affect the wider energy system, and has implications for many of the
issues considered in our study, but these complex interactions are well beyond the scope of
our work.
3.4. Externalities
Externalities are costs (or benefits) that, as a result of an activity or market transaction, are
imposed on (or that accrue to) a party that is not directly involved in that activity or
transaction. There are various externalities that are often linked to different activities along
the value chains of different energy sources, some more directly than others. Examples of
externalities include: emissions of “local” pollutants, security of energy supply, 46
innovation
spill-overs, “disamenity” value of wind farms and other generating capacity, water scarcity,
road congestion – and many others.
To the extent that externalities are not already reflected in government policies and transfers,
their occurrence could be considered a form of “support”. For example, if firms releasing
greenhouse gas emissions do not face the cost of the associated externality (whatever it may
be), then they are imposing a cost on society that they do not bear in full themselves.
However, it is important to recognise that this is a cost borne by society as a whole, and
therefore differs from both direct government expenditure and transfers mandated by the
government. Comparing this cost directly to government revenues alone therefore is unlikely
46 For example, EU legislation (Directive 2006/67/EC followed by Directive 2009/119/EC) requires countries to retain
minimum petroleum reserves with a view to maintaining security of supply. Individual member states use different
approaches to maintaining strategic reserves. In some cases, the obligation is passed on to energy companies. The
benefits accruing to society from energy companies holding such supplies represent a positive externality.

Energy Taxation & Subsidies in Europe Methodology
NERA Economic Consulting 29
to provide a full understanding of how externalities relate to support and government
revenues. Government policies linking financial transfers to externalities are typically
complex and involve several instruments. For example, a range of externalities are linked to
road transport, including GHG emissions, emissions of local pollutants, congestion, accidents,
noise, and others. Governments charge for such externalities (potentially to internalise them)
in a variety of ways, including taxes levied on fuels, taxes on vehicles (often with charges
differentiated by vehicle type and technology), road pricing schemes, etc. The variety of
instruments used reflects, in part, the way in which the cost of the externality depends on
several factors – and may not even be related directly to the fuel used. Reflecting this, we do
not recommend directly comparing government revenues collected from energy use with the
cost of the externalities that may be linked to these energy sources (in different ways and to
different degrees).
To illustrate how externality costs (or benefits) relate to our main analysis, we consider the
example of greenhouse gas (GHG) emissions, given the importance of these emissions in
motivating renewable energy policies.
3.4.1. The externality associated with greenhouse gas emissions
GHG emissions for EU countries and Norway are reported in the UNFCCC inventory
database, and are attributable to different energy sources. There is, however, significant
uncertainty about the cost imposed by these emissions.
We have conducted a review of estimates available in the literature of the cost of the
externality associated with a tonne of CO2 emissions (often referred to as the “shadow price”
of carbon). The range of estimates available is very wide, and we have selected, low,
medium and high values of €10, 30 and 70/tCO2, respectively. These values reflect the range
that most sources regard as the most likely cost of carbon, although estimates in the literature
range from low estimates that are negative to high values that are several multiples of the
highest value we have considered. Details of the methodological approaches used in the
literature, as well as a summary of the main estimates we have considered, are included
in Appendix C.
As noted, the cost of the GHG externality (as well as costs or benefits associated with other
externalities) is of a very different nature to the government expenditure and mandated
transfers that are the main focus of this study. The GHG externality represents a cost that is
borne by society as a whole, not simply by the government, and it is therefore appropriate to
consider the externality within the context of the full value that products with GHG emissions
contribute to society. This value is not reflected solely in government revenues.
Within a welfare economics framework, the value that consumers place on the consumption
of fossil fuels (or on any goods) must be at least equal to the amount consumers spend on
them. (The value is equal to the amount consumers spend plus their “consumer surplus”.)
The overall value to society is the difference between the cost of producing the fuels and the
value that consumers place on them (the “total surplus”). In this framework, the extent to
which taxes on GHG emissions can be passed onto consumers is an indicator of the value that
consumers attach to fossil fuel use, and therefore of the overall contribution of these fuels to
society’s total surplus. We note that estimating total surplus or the value to consumers is
beyond the scope of our study.

Energy Taxation & Subsidies in Europe Methodology
NERA Economic Consulting 30
If the cost of the GHG externality (whatever it may be) were reflected through a new policy
instrument designed to “internalise” its full costs, then this would have an impact on the
prices of fossil-fuel based sources. If this required a change in government policy it would
depart from the static framework that we have used for our analysis. The implication of such
a change for government revenues would depend on how the demand for (and supply of)
fossil fuel products responds to changes in prices. The range of impacts could vary between
two extremes: at one end of the spectrum, there could be no demand response at all; in this
case there would be additional government revenues from the instrument, on top of revenues
from existing fiscal measures. At the extreme, the quantity of fossil fuel consumption could
fall to zero – in which case total revenues from all taxes and other fiscal measures would also
drop to zero. In neither of the two extremes would government revenues fall below zero. We
discuss the different possibilities in more detail in section 4.4 below.
3.4.2. Existing policies for GHG emissions
As noted above, there are instances where government policies explicitly aim to account for
externalities, and many European countries have already put in place individual policies that
are intended to address the externality associated with GHG emissions. For example, EU
legislation on minimum excise duty rates on energy products are justified on the basis of CO2
intensities of different fuels.47
In addition, across the EU, the EU Emission Trading System
(ETS) has been established to create a price for CO2 (and other GHG emissions) that is
intended to force emitters to internalise the emissions externality.48
Many Member States
have additional policies that set a price on carbon emissions. All of these policies internalise
a cost of carbon, although they do so at different levels per tonne of emissions. Many of the
policies provide direct revenues to government, and also impose costs on wider markets that
are shared between consumers and producers.
Under emissions trading systems like the EU ETS, the allocation of emission rights also has
implications for the amount of government revenue that is raised from the policy. To date,
under the EU ETS the majority of emissions allowances have been allocated for free to
operators of installations that emit GHGs49
– although in some countries certain sectors
(notably the power sector) were required to purchase a significant proportion of allowances
from the government.
Emitters who have the obligation to surrender allowances face a liability that is created as a
result of government policy. The cost of this liability is determined by the value of emissions
allowances. If allowances are allocated for free to emitters, the cost of the emissions liability
is defrayed by the value of the allowances that are given freely.
In contrast, if allowances must be bought by emitters from the government, the amount paid
is a direct transfer to the government, similar to a tax on carbon. By extension, if allowances
47 European Commission (2011), Citizen’s Summary: EU Energy Taxation Proposal
48 The EU ETS imposes an overall cap on emissions from installations in sectors covered by the policy, and firms must
surrender emissions allowances or other emission rights, which they can trade, to cover their emissions,
49 Just under 94 per cent of total allowances between 2008 and 2012 were freely allocated.

Energy Taxation & Subsidies in Europe Methodology
NERA Economic Consulting 31
were allocated entirely to non-emitters, or to individuals,50
the obligation to surrender
allowances would amount to a government-mandated transfer from operators with emissions
to those who had freely received the allowances.51
Following this logic, the free allocation (and subsequent trading) of allowances effectively
results in mandated transfers from emitters to other emitters. This has distributional impacts
among emitters, depending on who was best able to abate (whether through technology,
through reduced economic activity, or through fuel switching). However, the net value of
these mandated transfers across all emitters is, by construction, zero. In cases where the
distributional impact of trading led to a particular energy source becoming a net recipient of
mandated transfers from another energy source, our methodology would identify this as a
mandated transfer from one energy source to another.52
There is a separate question concerning who should bear responsibility for the cost of the
externality. This question is related to the question of how allowances should be allocated,
because allocation can be seen as implicit acknowledgment of either the right to be
compensated for accepting emissions or the right to emit. The question of how allowances
should be allocated is ultimately a normative question whose answer is best addressed
through political negotiation, political economy, and political philosophy, rather than
economic analysis. Just as there is no objective answer to the question “What is the correct
level at which to set the VAT rate on energy consumption?”, or “What is the right level of
corporation tax on upstream production?”, there is also no objective answer to the question
“What is the correct allocation of emissions allowances?” We consider it outside the scope of
our study to attempt to answer this question.53
In our analysis, we estimate government revenues from existing carbon pricing mechanisms
(which is included in data on energy taxation). We calculate the cost of the externality
separately, as discussed in section 3.4.1. We discuss the relationship of the two quantities –
50 For example, as they would be under proposals to implement so-called “personal carbon allowances”.
51 This has parallels with support schemes for renewable energy sources, where an obligation is placed on others that
imposes a cost on them and results in monetary transfers to renewables. For the reasons set out in section 3.3.3 above,
we have not attempted to estimate how these costs are distributed across different groups or to reflect these costs in our
analysis.
52 Note that in keeping with the restrictions to scope that we apply to other areas of our analysis, we have not attempted to
account for the wider market impacts of the EU ETS – just as we have not attempted to account for the impacts of RES
support policies on market prices or residual demand for non-RES sources.
53 In the case of the EU ETS, the free allocation of allowances is part of a broader policy framework for addressing GHG
emissions. The policy framework is wide-ranging in scope, with features such as: inclusion of only a sub-set of sectors
and emitting facilities; gradual reduction over time in the overall cap on emissions; provisions to gradually change the
way in which allowances are allocated to those sectors that are included within the scheme; and exemptions from
provisions for the auctioning of allowances for sectors with specified characteristics. This policy framework reflects a
number of considerations, and it is clear that alternative policy frameworks could have been adopted (for example,
expanding or reducing the scope of sectors included, changing how the cap on emissions is adjusted, using alternative
approaches to the allocation of allowances, etc.).
If one’s “benchmark” is that all allowances should be auctioned, then free allocation of allowances to emitters will
appear to be “foregone revenue” – and therefore a form of support. If, on the other hand, one’s benchmark is that
emission rights should be grandfathered, or that there should be a period of gradual adjustment starting from full
grandfathering to full auctioning, then the approach taken under the EU ETS during Phases 1 and 2 will not imply that
any revenue has been “forgone”.

Energy Taxation & Subsidies in Europe Methodology
NERA Economic Consulting 32
the government revenues from the pricing of the carbon externality, and the social costs
associated with the carbon externality – in Chapter 4 below.
3.5. Data and sources
We have drawn on a wide range of sources to carry out this study. Where possible we have
relied upon pan-European datasets that cover all, or at least the significant majority, of the 28
EU Member States and Norway. For example, excise duty data – the largest single
government revenue item – come from European Commission DG Customs and Tax Union
publications.
Likewise, data from the OECD inventory, and the additional coverage provided by the IVM
report, provide the majority of direct government expenditure data that we include.
Notwithstanding some of the limitations of its application discussed above (and
acknowledged by the OECD), the study represents one of the most in-depth analyses of
support across different member countries of the OECD, many of which are also included
within our study. We rely on the OECD inventory only as a data source for direct payments
to the coal, oil, and gas sectors. We do not include entries that are categorised as tax
expenditures.
Data about support for renewable electricity generation, much of which is provided in the
form of mandated transfers, is based on a survey carried out by the Council of European
Energy Regulators. For those countries that were not included within the survey we have
applied the average support rate for wind and solar power, across the countries for which we
do have data, to the electricity generated from these sources.
Data on energy and electricity consumption, which inform many of our estimates, are sourced
from the Eurostat energy database. Energy prices are also taken from Eurostat as well as the
IEA, which are a key input to estimating VAT revenues from the different energy sources.
We have supplemented these pan-European datasets with official government reporting from
selected countries – for example, in the case of upstream oil and gas revenues – as well as
industry data, such as profit estimates, to inform our calculations of corporation tax. The
collection of less readily available information and sources has been beyond the scope of this
study, but the dataset that we have developed could be further supplemented with additional
information if it became available.
Appendix B describes in detail the data sources we have relied upon to develop our estimates.
Wherever possible we have sought to use information from public sources. In some cases,
due to limitations of time and resources, we have had to make assumptions, which we have
attempted to validate by drawing on other relevant information.

Energy Taxation & Subsidies in Europe Results of NERA’sAnalysis
NERA Economic Consulting 33
4. Results of NERA’s Analysis
In this section we provide the main results of our analysis and include supporting discussion
to some of the key findings. Unless otherwise noted, we present the results for the region
covering the EU28 and Norway as a whole, with a focus on 2011 data.
Our estimates show the value of transfers associated with different energy sources in recent
years, which reflect the policies that have been in force during this period in individual EU
countries and Norway. The results therefore reflect what has happened historically, and
naturally cannot be used to make projections about net transfers under other policies. All the
results presented in this report are nominal values, generally in millions or billions of Euros.
Our analysis compares different energy sources, so it is important to note that they vary
significantly in their contributions to final energy consumption across the EU and Norway.
This is also reflected in the magnitude of the transfers we have identified. To put some of our
results in context, Figure 4.1 shows primary energy consumption (of the five energy sources
included in this study) in the EU and Norway split into the five energy sources that we cover.

Energy Taxation & Subsidies in Europe ResultsofNERA’sAnalysis
NERA Economic Consulting 34
Figure 4.1 Primary Energy Consumption of Different Energy Sources (2007 - 2011)
Source: Eurostat Note: 1. The figure presents the primary energy consumption of the five energy sources
covered by this study. It excludes other energy sources, such as nuclear power, hydroelectric power, biomass, and other renewable energy technologies;
2. Primary energy consumption is presented both in million tonnes of oil equivalent units ((“Mtoe”,on the left-hand axis) and million barrels of oil equivalent (“Mboe”onthe right-hand axis) using a conversion factor of 7.33 barrels of oil to 1 tonne of oil.
54
Oil and gas have consistently accounted for the largest shares of consumption of the energy
sources. The consumption of electricity produced by wind and solar technologies still
accounts for a very minor share of the total, although this share has been increasing over time.
To reflect the large differences between the volume of consumption of the five energy
sources, we have generally presented our results below in two complementary formats. We
present estimates of both absolute monetary values and in terms of monetary value per unit of
energy consumed.
Finally, the analysis that we present here does not attempt to capture all of the monetary
transfers associated with some of the policies that we have analysed. For example, as noted
above (section 3.3.3) in the case of mandated transfers, the incidence of the transfer (i.e. the
groups that bear the costs of payments mandated by government policy), is often spread
across several groups. For example, costs of FITs are borne by other energy companies, who
pay the associated levies, as well as by final consumers. The costs borne by non-RES energy
companies by FITs and other renewable support policies are mandated transfers that the
government imposes on those obliged to pay for the RES sources. These costs manifest
54 BP Statistical Review.

Energy Taxation & Subsidies in Europe ResultsofNERA’sAnalysis
NERA Economic Consulting 35
themselves in at least three ways – first, as direct costs in the form of allocation of
responsibility to pay into the funds that remunerate RES generators (or in the case of RECs,
the costs associated with procuring RECs). Second, the addition of RES supply to the system
results in the displacement of generation by other capacity, which may reduce the
profitability of this capacity. Third, and related, the addition of RES supply may affect the
price of electricity in the market, making generation from other sources unviable. In general
we have not attempted to capture the dispersed affects across the wider energy markets and
economy that result from the mandated transfers that we consider.
In the sections that follow we first present summary results for all of the five energy sources,
comparing them alongside each other on the same chart. Then, in sections 4.2.1 to 4.2.5 we
present more detailed results specific to each energy source, examining where the main
government revenues, expenditures and other transfers arise across the different categories
that we have described above in Chapter 3.
4.1. EU-Wide Results for All Energy Sources
In the methodology section above we outline how we have attributed different categories of
government revenue, expenditure and mandated transfers to the five energy sources that are
included in this study. At an aggregate level, in 2011, we calculate that governments from the
EU and Norway collected just under €480 billion in revenues from activities directly related
to the combined production and consumption of oil, gas, coal, wind and solar energy. Total
government expenditure plus mandated transfers to the five energy sources in 2011 was
significantly less, at approximately €30 billion. Figure 4.2 shows the allocation of these
overall amounts across the energy sources. The green bars represent revenues to the
government; the red bars represent direct expenditure by the government as well as mandated
transfers received by each energy source. The blue lines indicate the net government revenue
(revenue minus expenditure and mandated transfers). The same data are presented in tabular
form in Table 4.1, which also includes a measure of the scale of consumption of the different
energy sources in the EU28 and Norway.

Energy Taxation & Subsidies in Europe ResultsofNERA’sAnalysis
NERA Economic Consulting 36
Figure 4.2 EU28 + Norway Net Government Revenues and Mandated Transfers (2011)
Source: NERA Analysis (all data sources discussed in Appendix B)
Note: ‘Netgovernmentrevenuesandmandatedtransfers’(blueline)arecalculatedbysubtracting government expenditure and mandated transfers from total government revenues.
Table 4.1 EU28 + Norway Net Government Revenues and Mandated Transfers (2011)
Source: NERA Analysis (all data sources discussed in Appendix B)
Across the different fuels, the majority of revenues are derived from oil, followed by gas.55
Significant, but smaller revenues are allocated to coal, and relatively negligible amounts
55 The production of oil and gas is linked in many countries, which makes it more difficult to attribute government
revenues to one or the other fuel. In each country, we have allocated revenues from the production of oil and gas to the
two energy sources in direct proportion to their share of production revenue, calculated by multiplying production,
measured in tonnes of oil equivalent, by an annualised market price for crude oil and natural gas. Across the whole
region gas production is marginally higher than oil production, but oil prices per unit of energy have tended to be higher
than gas prices. Therefore, on this basis oil is allocated a higher proportion of the total revenues paid to government by
upstream oil and gas activities. There are other ways of allocating government revenues between the two fuels that may
be equally plausible, but they would not materially affect any of our key findings.
Government
Revenues
Government
Expenditures
and Mandated
Transfers Total
Primary Energy
Consumption
Source € billion € billion € billion Mtoe
Oil 333 -0.2 332 511
Gas 100 -0.4 100 390
Coal 36 -4 33 286
Wind 8 -9 -1 16
Solar 2 -17 -15 4

Energy Taxation & Subsidies in Europe ResultsofNERA’sAnalysis
NERA Economic Consulting 37
assigned to both the wind and solar sectors. Turning to expenditures and mandated transfers,
the most significant support is focused on the solar sector (€17 billion), with smaller amounts
paid out to wind (€9 billion) and even less to coal (€4 billion), gas (€0.4 billion) and oil (€0.2
billion). It is also apparent that, at least in the fossil fuel sectors, and overall, government
revenues dwarf government expenditure across these fuels. We break down the main
contributions to these overall figures for each energy source in sections 4.2.1 to 4.2.5 below.
For this study we have focused on data covering the period 2007 to 2011. To prevent
excessive duplication, we present the majority of our results for 2011. Whilst there is a
degree of variation across years, particularly at the country level, this is fairly minor in the
context of overall total values. The results for 2011 are therefore representative of the full
period. In Figure 4.3 we present the net government revenues (revenues minus expenditures
and other mandated transfers) for all years. These points correspond to the blue lines shown
above in Figure 4.2.
Figure 4.3 EU28 + Norway Net Government Revenues and Mandated Transfers
(2007 - 2011)
Note: Renewable support data are not available for 2007 and 2008, so we omit estimates of net
values for these years.
The figure shows that there is little variation in net government revenues over time. The most
pronounced change is the drop in net revenues between 2008 and 2009, principally due to
lower oil and gas revenues. Although small in the context of overall quantities, transfers
directed to solar energy have been increasing relatively quickly, due to the rapid deployment
of solar power, which receives assistance from government support schemes. Indeed since
2011, support for solar and wind power has continued to increase significantly. In this study

Energy Taxation & Subsidies in Europe ResultsofNERA’sAnalysis
NERA Economic Consulting 38
we report data up until 2011 as this is the latest year over which comprehensive data exists
across the majority of countries in the EU and Norway.56
Figure 4.2 and Figure 4.3 (above) compare government expenditures, revenues, and
mandated transfers for the different energy sources on an absolute basis. Because the total
energy consumption associated with the five energy sources spans a very wide range, we also
compare them on a per-unit basis. Figure 4.4 presents the results shown in Figure 4.2 in
terms of value per unit of primary energy consumed.57
Wind and solar consumption
correspond to the consumption of electricity that was produced using these respective
technologies.
Figure 4.4 EU28 + Norway Net Government Revenues and Mandated Transfers ($/boe)
(2011)
Source: NERA analysis Note: Values have been converted into barrels of oil equivalent using a conversion rate of
7.33 barrels of oil to 1 tonne of oil.
On a per boe basis, government revenues (before taking into account government
expenditures and mandated transfers) across the different energy categories are broadly
similar for oil ($124 per boe), wind ($95 per boe) and solar ($100 per boe). Government
revenues are around half of these values for gas ($49 per boe), and considerably lower for
coal ($24 per boe). We note that revenues measured on this basis (i.e. per unit of primary
energy consumed), reflect the way in which these energy sources are used, and, in particular,
56 For example, in Spain total support for wind increased by 20 percent between 2011 and 2012 and support for solar
increased by over 30 percent (based on data published by CNE). In Germany total renewables support also increased by
over 30 percent between 2011 and 2012 and is expected to further increase dramatically in 2014 (BDEW. Erneuerbare
Energien und das EEG: Zahlen, Fakten, Grafiken. 24 February 2014).
57 Per unit values are calculated by dividing the data presented in Figure 4.2 by the primary energy consumption of each
energy source (shown above in Figure 4.1), in barrels of oil equivalent (boe). Primary energy consumption is the gross
inland consumption less non-energy use of each energy source. All energy consumption data are taken from Eurostat.

Energy Taxation & Subsidies in Europe ResultsofNERA’sAnalysis
NERA Economic Consulting 39
the relative efficiencies of the energy sources within those uses. Hence, coal revenues are
particularly low because a significant share of coal consumption is used to generate
electricity (over 80 percent), and the efficiency of conversion of coal into electricity is
relatively low, at 30-40 percent. Conversely, solar and wind revenues appear higher than
coal and gas, because the renewables sources are assumed (by definition) to have a
conversion rate from primary energy use of 100 percent. The choice of primary energy as the
denominator in this illustration is therefore purely for convenience, to allow a simple
comparison of the energy sources in relative terms. There are other comparisons that could
be made.
Government expenditures remain negligible for the fossil fuels. For wind and solar power,
government expenditures and mandated transfers are considerable. However, we observe a
distinct difference between government support for wind energy ($109 per boe) and for solar
energy ($821 per boe) in 2011. This difference reflects the higher costs of solar power
generation, compared to wind (which in many European countries has led governments to
offer significantly higher per unit support levels to encourage the development of the solar
power sector and enable it to compete with other technologies in competitive power
markets).58
Figure 4.5 presents similar information, showing the net transfers (blue lines in Figure 4.4)
covering the full period from 2007 to 2011. Like Figure 4.3, it shows relatively consistent
results across years. (Note that because we do not have access to a comprehensive EU-wide
source of RES support data for 2007 and 2008 we do not present any results for wind and
solar for these two years.) For the years over which we do have renewable support data it is
worth noting that solar support, which is increasing over time on an absolute basis (see
Figure 4.3 above), is decreasing when measured in terms of energy consumed. This is
because governments are supporting increasing amounts of solar capacity, but the costs of
generating each unit of solar power are falling.
58 The costs of solar power reflected here are on an annualised cash flow basis, and therefore reflect both the capacity
added in each year as well as the legacy costs of more expensive solar technologies that were installed in earlier years.
The most recent support costs for solar PV are significantly lower than $821/boe (or approximately €350/MWh). For
example, support for new large scale solar PV in the UK is currently less than €150/MWh, and support in Germany has
fallen as low as €137/MWh for new developments at the time of writing. However, the legacy support levels are still
relevant as they are paid each year over the lifetime of support mechanism, and even at current levels, support for solar
(per unit of output) is still high relative to other renewable technologies.

Energy Taxation & Subsidies in Europe ResultsofNERA’sAnalysis
NERA Economic Consulting 40
Figure 4.5 EU28 + Norway Net Government Revenues and Mandated Transfers ($/boe)
(2007 - 2011)
Source: NERA analysis. Note: Renewable support data are not available for 2007 and 2008, so we omit estimates of net
values for these years.
In the following sections we present further details of these results, showing the different
categories of government revenue, expenditure, and mandated transfers to provide a better
understanding of the relative contributions of different taxation and support policies.
4.2. Breakdown of Transfers for Each Energy Source
In this section we present details showing how the overall figures presented above are split
between the various categories of transfers across the energy supply chain (from upstream to
downstream) to make clear the key sources of revenue and expenditure for oil, gas, coal,
wind and solar. We have broken down the different transfers into the following headline
items (the abbreviation in brackets corresponds to the labelling convention used in the charts
below). Items 1-4 provide revenues to the government, whereas items 5-9 represent sources
of direct government expenditures or transfers mandated by government policy. A more
detailed description of the various items, as well as further information on our approach to
quantifying them and the data sources we have drawn on is included in Appendix B.
Government Revenues:
1. Upstream government revenues (UpRev): Taxes, license fees, royalties, dividend
payments, and other revenue-raising instruments applied to resource extraction and
energy production activities, inclusive of corporation tax revenues;
2. Corporation tax on midstream and downstream activities (Corp): Estimated
corporation tax receipts from energy transformation (power generation and refining),

Energy Taxation & Subsidies in Europe ResultsofNERA’sAnalysis
NERA Economic Consulting 41
storage, transportation and retail (including the sale of petroleum products, natural gas,
coal and electricity to businesses and households) parts of the supply chain;
3. Excise duties and other energy taxes (ExD): Excise duties paid on energy consumption
as well as additional, country specific and EU-wide energy taxes;
4. Value Added Tax (VAT): As applied to the consumption of energy products;
Government Expenditures and Mandated Transfers:
5. Upstream government expenditures (UpExp): Payments made to support current
production of energy resources;
6. Electricity generation, energy transport and storage support (Mid): Transfers
supporting “midstream” activities, including energy transformation and power generation
(notably RES support mechanisms), as well as fuel storage and transport;
7. Consumption support (Cons): Payments (often made to low-income households or
remote communities) to support the purchase of energy products;
8. Government payments to cover historic liabilities (Hist): Payments made to
compensate workers and communities in relation to historic production activities. These
occur exclusively in the coal industry and relate to labour compensation, repairing
environmental damages and supporting the decommissioning of mines.
9. Government R&D payments (R&D): Payments made by government to fund research
and development into improving the technology used to produce, transform and consume
the different energy sources.
The following sections present the detailed breakdown of our results for each energy source,
highlighting the orders of magnitude of the different items of government revenue,
expenditure, and mandated transfers.
4.2.1. Oil
The comparison in Figure 4.2, above, shows that the vast majority of government revenues
from the different energy sources we have reviewed are derived from the production and
consumption of oil-based products. Figure 4.6 shows the different sources of government
revenues and expenditures across the supply chain.

Energy Taxation & Subsidies in Europe Results of NERA’sAnalysis
NERA Economic Consulting 42
Figure 4.6 EU28 + Norway Government Revenues, Expenditures, and Mandated
Transfers: Oil (2011)
Source: NERA analysis
Note: The y-axisscale(€bn)variesin charts for oil, gas, coal, wind and solar (Figure 4.6 to
Figure 4.10) to accommodate the different magnitude of the results across the energy sources
Net government revenues from oil in 2011 were €333 billion, as shown by the blue bar on the
right hand side of Figure 4.6. Upstream tax revenues from oil production amounted to €49
billion, with corporation tax on midstream (refining and downstream retail) adding a small
amount. By far the largest contribution to government revenues from oil comes from excise
duties on petroleum products (€182)59
, followed by VAT receipts from their sale to final
consumers. These two items combined provided almost €279 billion to governments across
the EU and Norway in 2011. Government expenditure on oil is negligible (The chart reflects
minor support in France to consumers in the form of subsidies to rural filling stations, as well
as a small amount of R&D spending by governments.)
4.2.2. Gas
Gas provides the second largest contribution to government revenues of the energy sources
reviewed. Net revenues in 2011 were €100 billion, which is a third of what we calculate for
oil. In contrast to oil, significantly less excise duty is levied on direct sales of gas (and on
electricity generated using gas as an input fuel, which we allocate to the fuel). VAT on gas
and on electricity sales60
from gas-fired generation sales (€37 billion) is the largest single
59 Demand for transport fuels tends to be relatively insensitive to price, so excise duties provide a significant source of
stable revenue to governments.
60 For electricity generation, we allocate government receipts on VAT in proportion to each energy source’s share in
electricity generation in each of the 29 countries in each year. A more detailed description of our approach is provided
in Appendix B.

Energy Taxation & Subsidies in Europe ResultsofNERA’sAnalysis
NERA Economic Consulting 43
contributor, followed by upstream tax revenues, at almost €35 billion.61
The majority of the
corporation tax revenue estimate is derived from gas retail and distribution as well as power
generation.62
Figure 4.7 EU28 + Norway Government Revenues, Expenditures, and Mandated
Transfers: Gas (2011)
Source: NERA analysis
Note: The y-axisscale(€bn)variesin charts for oil, gas, coal, wind and solar (Figure 4.6 to
Figure 4.10) to accommodate the different magnitude of the results across the energy sources
As for oil, we have identified only very limited government expenditures to support gas.
There are minor amounts assigned to midstream activities (gas combined heat and power
generation receives FIT payments in Estonia), small amounts of consumption support, and
allocations from government R&D budgets, reflecting spending both on gas production and
combustion technologies, as well as carbon capture and storage (CCS) techniques.
4.2.3. Coal
The coal sector provides revenues to government of approximately €36 billion, driven mainly
by VAT receipts both on coal itself and on power generated using coal as an input. Net
revenues from coal are considerably lower than those for oil and gas, at €33 billion. The bars
61 As noted in the introduction to this chapter, we have not been able to directly assign tax revenues from upstream oil and
gas production to the respective energy sources, as production of both fuels is often carried out at the same site and by
the same company. We have therefore allocated the combined revenues from oil and gas production to the two energy
sources in proportion to their share of estimated total revenue in a given year.
62 As for VAT, we have assigned estimated corporation tax revenues from power generation to each energy source in
proportion to its share of electricity output in each country and year.

Energy Taxation & Subsidies in Europe ResultsofNERA’sAnalysis
NERA Economic Consulting 44
in Figure 4.8 also show there is still a certain amount of support provided by government to
the coal industry, principally across a handful of European countries.
Figure 4.8 EU28 + Norway Government Revenues, Expenditures, and Mandated
Transfers: Coal (2011)
Source: NERA analysis
Note: The y-axisscale(€bn)variesin charts for oil, gas, coal, wind and solar (Figure 4.6 to
Figure 4.10) to accommodate the different magnitude of the results across the energy sources
Excise duties on coal are fairly limited. Of the €7 billion shown here, €0.6 billion are from
sales of coal itself, and the remainder is what we attribute to the electricity sales from power
generated from coal.63
Corporation taxes, estimated at approximately €8 billion, are
principally from coal’s contribution to power generation and the downstream sales of
electricity, with a very limited amount from direct coal supplies for non-electricity generating
use. The coal sector receives the most amount of support out of the fossil fuels included in
this study. Most of this is concentrated in coal mining. For example, in Germany annual
support provided to coal mining companies to keep them in operation is approximately €2
billion. There is also some support provided to coal-fired generators (‘Mid’ in the chart) in
several countries (most notably in Poland) as well as payments made to compensate both
workers and local communities related to historic production. Compensation covers health
issues faced by workers as well as repairs to environmental damage. Total government
support to coal in 2011 was slightly less than €4 billion. This is relatively small alongside
government revenues, but considerably higher than support provided to other conventional,
fossil fuel energy sources.
63 As for VAT and corporation tax, we have allocated excise duties collected on electricity sales to each energy source in
proportion to its share of power generation in each country and respective year.

Energy Taxation & Subsidies in Europe ResultsofNERA’sAnalysis
NERA Economic Consulting 45
4.2.4. Wind
The wind and solar sectors are distinct from the fossil fuels as the energy sources are used
almost exclusively for power generation.64
Net transfers from wind (government revenues
minus government expenditures and mandated transfers) were slightly negative in 2011, at
around negative €1 billion. This is shown below in Figure 4.9. Total revenues (before
expenditures and other transfers) were almost €8 billion. Estimated corporation tax receipts,
excise duties, and VAT (the largest contributor, at over €4 billion) are all based on wind’s
share of total electricity output across the EU and Norway.65
Figure 4.9 EU28 + Norway Government Revenues, Expenditures, and Mandated
Transfers: Wind (2011)
Source: NERA analysis
Note: The y-axisscale(€bn)variesin charts for oil, gas, coal, wind and solar (Figure 4.6 to
Figure 4.10) to accommodate the different magnitude of the results across the energy sources
The overwhelming item of support for wind comes in the form of FIT or supplier obligation /
REC scheme payments to provide production support to wind generators.66
The reported
support is based on data collected by the Council of European Energy Regulators from a
64 Solar technologies are also used to produce useful heat. We have not attempted to quantify the contribution of solar
thermal energy to government revenues.
65 The data for wind cover both onshore and offshore wind. Offshore wind is a less mature technology than onshore wind
and tends to be more expensive. It therefore receives a higher level of support per unit than onshore wind, although over
the period we consider (2007-2011) offshore wind output in Europe was relatively minor in the context of total wind
output.
66 In certain locations, and dependent on conditions, wind farms can be cost-competitive with more conventional thermal
power generation, but overall still require support, particularly in the growing offshore wind sector.

Energy Taxation & Subsidies in Europe ResultsofNERA’sAnalysis
NERA Economic Consulting 46
large sample of European countries. The total estimate for wind of almost €9 billion in 2011
reflects the additional support provided for output above the level of the wholesale price.67
Government spending on R&D in the wind sector of almost €0.2 billion is also included.
4.2.5. Solar
Solar power generation is generally more costly than wind, although solar costs have fallen
dramatically in recent years, leading to increasing deployment of solar capacity in Europe.
Net transfers in 2011 for solar were highly negative, at almost –€15 billion.
Figure 4.10 EU28 + Norway Government Revenues, Expenditures, and Mandated
Transfers: Solar (2011)
Source: NERA analysis
Note: The y-axisscale(€bn)variesin charts for oil, gas, coal, wind and solar (Figure 4.6 to
Figure 4.10) to accommodate the different magnitude of the results across the
energy sources.
We estimate that €2 billion was collected by European governments in revenue from
corporation tax, excise duties and VAT related to the electricity generated by solar. On the
other hand, government support, either via direct payments or through policies obliging
others to fund solar capacity and output, was in excess of €16 billion. Total support for solar
has risen over the three years for which we have pan-European renewable support data, from
€6 billion in 2009, to €8 billion in 2010, and then doubling in 2011. This is due to increasing
roll out of solar capacity rather than increasing costs, as discussed above in section 4.1 (and
shown in Figure 4.5).
67 In the case of FIT payments an estimate of the average wholesale price has been deducted from the total (per unit) FIT
payment to calculate the support provided. Further detail on the data source and our approach is included in Appendix
B.

Energy Taxation & Subsidies in Europe ResultsofNERA’sAnalysis
NERA Economic Consulting 47
4.3. Differences among Individual Countries
Norway is a relatively small economy when set against the rest of Europe, but it has a
disproportionately large oil and gas sector. In Figure 4.11 below we present the headline
results for Norway, alongside those of Germany – a much larger economy, but with
significantly lower oil and gas production. As expected, revenues from the oil and gas sectors
dominate all other transfers in Norway. Total government revenues in Norway across these
two sectors were €49 billion in 2011. However, despite Norway’s leading position in oil and
gas production, and the high tax revenues that they provide, combined government revenues
from oil and gas are actually significantly higher in Germany (at €70 billion in 2011). This is
because revenues from oil and gas consumption (derived from excise duty and, to a lesser
extent, VAT receipts) contribute a significant amount to government revenues in Germany.
Figure 4.11 Comparison of Norway and Germany Net Government Revenues (2011)
We can conclude from this analysis that although Norway’s oil and gas revenues contribute
materially to the overall revenues from oil and gas – and from energy generally – in the 29-
country bloc that we analyse, the main conclusions that we draw would not be significantly
different if we were to exclude Norway and focus only on the EU-28.
4.4. Externalities
This section presents estimates of the cost of the greenhouse gas emissions externality
associated with the use of different fossil fuel based energy sources. This cost differs in
important ways from the categories presented in the preceding sections. The cost does not
reflect any direct transfers between energy sources and the government (or any mandated
transfers). Instead, as explained in section 3.4 above, the cost is borne by society as a whole,
and not just the government.
The left hand bar in Figure 4.12 shows total GHG emissions in the EU28 + Norway that can
be attributed to the three major fossil fuel energy sources from 2007 to 2011.68
Among
68 The figure therefore excludes emissions from some sources – for example, industrial process emissions or non-
combustion emissions from agriculture.

Energy Taxation & Subsidies in Europe ResultsofNERA’sAnalysis
NERA Economic Consulting 48
anthropogenic GHGs, carbon dioxide (CO2) is by far the most abundant, as it is a by-product
of the combustion of hydrocarbons. In addition, other GHGs are also produced – for example,
methane. The figure includes – for the sub-set of emissions covered – all the greenhouse
gases recorded by the UNFCCC expressed in carbon dioxide equivalents (CO2e). To put the
total emissions in context, the middle bar in Figure 4.12 shows the primary energy
consumption of the different fossil fuels in the EU28 and Norway and the right hand chart
indicates the implied emissions factors of the different fuels (calculated by dividing total
emissions by primary energy consumption).
Figure 4.12 GHG Emissions in the EU28 + Norway, 2007 - 2011
Source: NERA analysis of UNFCCC data Note: The figure shows the total emissions associated with each fuel, based on the volume
of each fuel consumed. Estimates include fugitive emissions. Emissions intensities of the three fuels (i.e. tCO2e per toe, boe, MWh, or TJ) differ – coal is more emissions-intensive than oil, which is more emissions-intensive than gas. The volumes of emissions shown in the figure therefore reflect both the emissions intensities of the fuels and the total consumption of each.
Total emissions have declined from 4.3 billion tonnes of CO2e (GtCO2e) to 3.9 GtCO2e over
the period shown. The shares of emissions attributable to individual energy sources have
remained fairly stable over the period, with shares over the period as a whole of 46 percent
for oil, 25 percent for gas, and 29 percent for coal.
As discussed in Appendix C, there are a wide range of values available in the literature for
the shadow price of carbon – i.e. the externality cost associated with a tonne of CO2.69
To
reflect the uncertainty about its true value, we have used low, medium and high estimates of
€10, 30 and 70 /tCO2e for the shadow price of carbon. These values lie within the range that
69 Carbon cost estimates are primarily based on two approaches: estimating the damage caused by emissions; or
estimating the cost of abatement technology that reduces the level of emissions, for the same level of production.
Further detail is provided in Appendix C.
0.00.51.01.52.02.53.03.54.04.5
Total Emissions
GtCO2e
Oil Gas Coal
0.0
0.5
1.0
1.5
2.0
2.5
3.0
3.5
4.0
4.5GtCO2e
Total Emissions
0.0
0.2
0.4
0.6
0.8
1.0
1.2
1.4Gtoe
Primary Energy Consumption
0
1
2
3
4
5tCO2e/
toe
Implied Emissions Factor

Energy Taxation & Subsidies in Europe ResultsofNERA’sAnalysis
NERA Economic Consulting 49
most sources regard as most likely, although the full range of values available is much wider
than this. Figure 4.13 shows the ranges of cost of the GHG externality associated with the
fossil fuel based energy sources. The grey horizontal segments show the cost of the
externality evaluated at the medium shadow price of €30/tCO2e. At this shadow price, the
externality costs would be €53 billion for oil, €29 billion for gas, and €35 billion for coal.
Figure 4.13 GHG Externality Costs - Low, Medium, and High
Source: UNFCCC, NERA analysis of literature as explained in Appendix C
As noted in section 3.4, if the true cost of the externality (whatever the true cost may be) were
reflected in government policies designed to “internalise” it, this would affect not only
government revenues, but also wider economic benefits to consumers and producers. The
ultimate implications for government revenues would depend how the cost is reflected in the
prices of fossil-fuel based products, and the subsequent demand responses to changes in
prices:
In markets with inelastic demand, the cost would simply be passed through to consumers.
The net contribution to government revenues of each of the energy sources via all of the
other fiscal measures and policies would remain unchanged, and there would be
additional government revenues. These revenues, which by assumption would have been
set at a level that reflected the carbon externality, would offset exactly the (social) costs
imposed by the carbon emissions. Ultimately, these costs would be borne by consumers.
If instead, demand did respond to prices (because of substitution to lower-carbon goods,
services, and intermediates), the instrument would affect quantities of consumption and
production, as well as prices, which would have further implications for the values of the
government transfers associated with each of the energy sources. The net contribution of
each energy source would therefore change in ways that cannot be known a priori. In this
case, as above, the total revenues from the instrument would reflect the damage
associated with the carbon externality, but the level of emissions would differ, and
because sales volumes and profits would change, the costs would be shared among
consumers, producers, and the wider economy and government.

Energy Taxation & Subsidies in Europe ResultsofNERA’sAnalysis
NERA Economic Consulting 50
In the extreme case that the imposition of the externality cost resulted in fuel prices that
were so high that the quantity demanded fell to zero, the net contribution of fossil fuels to
government revenues would also be zero.
Thus, one should not simply “net off” the externality costs shown in Figure 4.13 above from
the estimates of net government revenues shown in previous sections..
4.5. Summary of Results
A summary of the results of our analysis on government revenues, government expenditures
and mandated transfers is shown in Table 4.2 below, providing a more granular breakdown of
the data for 2011. The table provides more details for the various “line items” than what we
have presented in the figures above. Measured on an absolute basis, government revenues
from oil production and consumption are by far the highest of the energy sources we have
reviewed (€333 billion in 2011). These are driven by excise duties, with significant
contributions from both VAT payments on the sale of petroleum products as well as upstream
revenues from oil production. Gas revenues are less than half of oil (€100 billion) and coal
revenues are lower still (€36 billion). Government revenues from wind and solar are
relatively small and, in fact, lower than government support to these renewable technologies.
Measured as revenue per unit of energy consumption (boe), oil is still the highest contributor
out of the five energy sources. On a per unit of consumption basis both wind and solar
revenues are higher than gas and coal, which is, in part, explained by the fact that we use
primary energy consumption as the comparator, which reflects the relative efficiencies of
coal and gas in generating electricity.
Unlike oil and gas, coal does receive significant direct government transfers in certain
countries (almost €4 billion in 2011), about two thirds of which subsidises current production
of coal as well as power generation activities. The significant majority of the remaining
subsidy reflects compensatory payments to miners and funds provided to decommission old
sites and repair environmental damage. Wind and solar are the most significant recipients of
government support via mandated transfers, through RES support policies such as FITs. In
2011 wind power received €9 billion of support and solar almost €17 billion. Wind output is
significantly higher, however, so that on the basis of per unit energy consumption, solar is by
far the greatest recipient of government support.

Energy Taxation & Subsidies in Europe ResultsofNERA’sAnalysis
NERA Economic Consulting 51
Table 4.2 Summary Results for 2011
Notes: 1. Total column reflects government revenues minus government expenditure and mandated transfers
2. Subcategories in italics provide a breakdown of the main category results. Only the grey shaded lines are included in the total calculation.
Oil Gas Coal Wind Solar
Categories of Government Revenue
Upstream Taxes (incl. upstream corporation tax) 49.0 34.5 - - -
Corporation Tax (midstream and downstream) 4.2 11.4 7.9 1.8 0.5
Power Generation 0.3 4.4 4.4 1.0 0.3
Power Transmission and Distribution 0.1 1.6 1.7 0.4 0.1
Electricity Retail 0.1 1.5 1.7 0.4 0.1
Gas Retail and Distribution - 3.8 - - -
Coal Supply (excl. Power Generation use) - - 0.1 - -
Crude Refining 0.8 - - - -
Gasoline and Diesel Retail 2.9 - - - -
Excise Duties and Other Energy Taxes 181.9 17.4 6.8 1.7 0.4
VAT 97.5 36.9 21.6 4.4 1.2
Subtotal (government revenues) 332.6 100.2 36.3 7.8 2.0
Resource Extraction Support - - 2.1 - -
Electricity Generation, Energy Transport and Storage Support - 0.0 0.7 8.7 16.4
RES Power Generation - - - 8.7 16.4
Other - 0.0 0.7 - -
Consumption Support 0.1 0.2 0.0 - -
Historic Liability Transfers - - 0.9 - -
R&D Transfers 0.1 0.1 0.1 0.2 0.3
Subtotal (government expenditures and mandated transfers) 0.2 0.4 3.8 8.9 16.7
Net Government Revenues and Mandated Transfers 332.3 99.8 32.5 -1.1 -14.7
EUR Billions
Categories of Government Expenditure and Mandated Transfers

Energy Taxation & Subsidies in Europe Conclusions
NERA Economic Consulting 52
5. Conclusions
We have assembled a comprehensive database to estimate government revenue, expenditure,
and government-mandated transfers for oil, gas, coal, wind, and solar power in all 28 EU
Member States as well as Norway. This database has allowed us to conduct a cross-sector
and cross-country comparison of governments’ relative treatment of different energy sources.
We can also aggregate our results. Some of the key findings of our analysis are:
EU28+Norway governments receive far greater revenues from oil, gas and coal than
these energy sources receive in the form of direct subsidies or other transfers. Oil is
by far the largest contributor to government revenues. In contrast, wind and solar power
are net recipients of support.
On the order of €480 billion in revenues were collected by EU28+Norway
governments in 2011 from the five energy sources. Of this, close to 70 percent, or just
over €330 billion, came from the oil sector. Gas contributed around one fifth of the
revenue, or almost €100 billion. Coal accounted for around €36 billion in revenue, but
also received transfers on the order of €4 billion. We estimate that wind contributed
around €8 billion in government revenue, but received transfers amounting to around €9
billion, implying total net payments to the sector of €1 billion. Finally, we estimate that
in 2011 solar power contributed around €2 billion to government revenues, but received
transfers totalling close to €17 billion.
Duties on motor vehicle fuels account for the largest single source of government
revenue from energy, ahead of VAT. Duties on these fuels yielded over €180 billion in
2011, and accounted for approximately 84 percent of all excise duty revenues from
energy.
VAT paid on energy is also a very significant contributor to government revenues. A large share of VAT is paid on oil through motor vehicle fuels, but there is also a
significant amount of VAT paid on electricity and on fuels used for space heating.
After excise duty and VAT, revenues collected from the upstream oil and gas sector
contribute the most to government coffers, accounting for €83 billion in total. The
production of oil and gas is heavily taxed, with sector profits facing tax rates that can
reach as high as 80 percent – far above the average EU corporation tax of 23 percent.
Both wind and solar power receive net support from government through a
combination of direct payments and mandated transfers. It is clear from our results
that solar power receives the largest net transfer, both in absolute terms and per unit of
energy consumed. In absolute terms, total support for wind and solar has increased over
time, although measured per unit of energy consumption, support has declined over the
period analysed.
The cost of the GHG externality is of a different nature to actual transfers (either direct
transfers to or from governments, or those mandated by government policies). It is borne
by society as a whole, rather than by governments. Moreover, there is uncertainty
surrounding the magnitude of such costs. If such costs were “internalised” through some
government policy, then the impact on net government revenues would be uncertain. We
therefore advise against a simple comparison of the cost of the externality with net
government revenues.
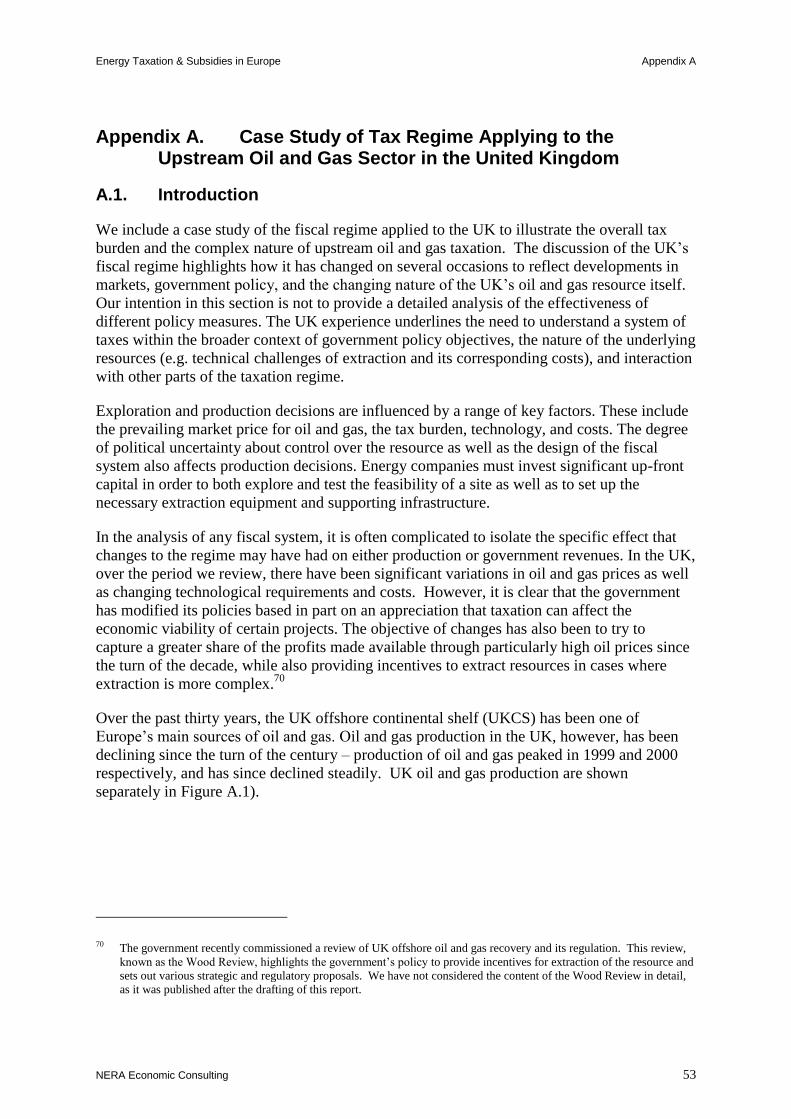
Energy Taxation & Subsidies in Europe Appendix A
NERA Economic Consulting 53
Appendix A. Case Study of Tax Regime Applying to the Upstream Oil and Gas Sector in the United Kingdom
A.1. Introduction
We include a case study of the fiscal regime applied to the UK to illustrate the overall tax
burden and the complex nature of upstream oil and gas taxation. The discussion of the UK’s
fiscal regime highlights how it has changed on several occasions to reflect developments in
markets, government policy, and the changing nature of the UK’s oil and gas resource itself.
Our intention in this section is not to provide a detailed analysis of the effectiveness of
different policy measures. The UK experience underlines the need to understand a system of
taxes within the broader context of government policy objectives, the nature of the underlying
resources (e.g. technical challenges of extraction and its corresponding costs), and interaction
with other parts of the taxation regime.
Exploration and production decisions are influenced by a range of key factors. These include
the prevailing market price for oil and gas, the tax burden, technology, and costs. The degree
of political uncertainty about control over the resource as well as the design of the fiscal
system also affects production decisions. Energy companies must invest significant up-front
capital in order to both explore and test the feasibility of a site as well as to set up the
necessary extraction equipment and supporting infrastructure.
In the analysis of any fiscal system, it is often complicated to isolate the specific effect that
changes to the regime may have had on either production or government revenues. In the UK,
over the period we review, there have been significant variations in oil and gas prices as well
as changing technological requirements and costs. However, it is clear that the government
has modified its policies based in part on an appreciation that taxation can affect the
economic viability of certain projects. The objective of changes has also been to try to
capture a greater share of the profits made available through particularly high oil prices since
the turn of the decade, while also providing incentives to extract resources in cases where
extraction is more complex.70
Over the past thirty years, the UK offshore continental shelf (UKCS) has been one of
Europe’s main sources of oil and gas. Oil and gas production in the UK, however, has been
declining since the turn of the century – production of oil and gas peaked in 1999 and 2000
respectively, and has since declined steadily. UK oil and gas production are shown
separately in Figure A.1).
70 The government recently commissioned a review of UK offshore oil and gas recovery and its regulation. This review,
known as the Wood Review, highlights the government’s policy to provide incentives for extraction of the resource and
sets out various strategic and regulatory proposals. We have not considered the content of the Wood Review in detail,
as it was published after the drafting of this report.

Energy Taxation & Subsidies in Europe Appendix A
NERA Economic Consulting 54
Figure A.1 UK Oil and Gas Production (1975-2013)
Source: DECC Oil and gas: field data; BP Statistical Review
Oil production began to pick up in the 1970s and early 1980s before a brief decline in the
second half of the decade (due in part to an explosion on a large oil and gas platform).71
Output then steadily increased through the 1990s, peaking in 1999, and has since been falling
year-on-year as the resources of the large, older fields are depleted and new developments
tend to be smaller, more complex, and therefore more costly to extract from. The evolution of
gas production has followed a similar trend since 1990, although previously gas production
remained relatively constant even in periods when oil production grew rapidly. Both energy
sources have been subject to the same general taxation regime in the UK throughout the
period we review.
A.2. Taxation Mechanisms
Sub-surface resources in the UK are the property of the Crown. The UK government, acting
on behalf of the Crown, has therefore sought to earn a ‘fair’ return from the extraction and
sale of oil and gas products by allocating production licences to private companies and
recovering value for the government via different fiscal instruments. The UK operates a
concessionary regime whereby the Crown transfers its ownership of the land to companies
that are then allowed to extract and sell the resource. This is distinct from a contractual
regime in which the state retains ownership and contracts a third party company to extract the
resource on its behalf.
Because licensees are granted the right to make use of a state-owned resource, and due to the
significant profits (i.e. economic rents) that can be earned from oil and gas production, the
71 A serious explosion in 1988 halted production on the Piper Alpha platform, which until then had accounted for
approximately 10 percent of oil and gas production on the UK Continental Shelf.
0
200
400
600
800
1,000
1,200
1975 1980 1985 1990 1995 2000 2005 2010
Million Barrels
Oil production Gas production

Energy Taxation & Subsidies in Europe Appendix A
NERA Economic Consulting 55
sector has been subject to a specific taxation regime since the 1970s, which is distinct from
other businesses. The main components of this regime have changed over time and are
described in detail below. They include (or have included) the charging of a royalty, a
Petroleum Revenue Tax (PRT), a ring fence corporation tax (RFCT), and an additional
Supplementary Charge (SC), which has been added to corporation tax since 2002.
A.2.1. Royalties
Initially royalties were one of the core components of the petroleum taxation regime in the
UK. Licenced extraction companies were required to pay 12.5 percent of the gross value of
oil and gas produced, less the cost of transporting and storing the fuels at an onshore terminal.
This measure directly taxed the value of the resource as it was removed from the ground,
regardless of cost (and therefore irrespective of the economic viability of the project) and
hence acts as an increase in operational expenditures.
Fields receiving development consent after March 1982 were no longer required to pay
royalty charges. At the same time, the Government introduced an increase in PRT (see
section A.2.2 below), to make the regime more profit-based, rather than revenue based. From
1 January 2003, royalties ceased to be collected on all fields.
A.2.2. Petroleum Revenue Tax (PRT)
PRT is a tax on net revenues (or profits) from individual production fields, rather than
companies. Losses from one field cannot be used to offset the taxes due on a profitable field,
as would be the case when standard corporation tax is applied to an individual company’s
assets. PRT was introduced in the 1975 Oil Taxation Act as a tax applied to oil and gas
extraction alongside royalties and standard corporation tax. It was the main source of
government revenue from oil and gas production through most of the second half of the
1970s and the 1980s – periods in which oil prices were typically high (although not
throughout the period). PRT is calculated in half-yearly periods.
PRT was designed to apply to particularly large oil fields (such as Brent and Forties) that
were established when it was introduced. The initial headline tax rate was set at 45 percent of
a field’s profits. The rate was increased in 1978 to 60 percent and then again in 1982 (when
royalties no longer applied to new fields) to 75 percent. PRT is applied to profits after any
royalty payable but prior to corporation tax which then applies to the remaining, post-PRT,
amount. For example, a company in 1980 making annual pre-tax profits of £100 would have
been required to pay £60 in PRT. The company would then pay corporation tax (at 52
percent) on the remaining £40, rather than on the full pre-tax profit of £100. The full tax
burden from PRT and corporation tax in this case would be £80.80.72
In order to limit its
impact on smaller (and more expensive) fields the PRT included three main allowances:
Uplift – companies can offset an additional allowance of 35 percent of their capital
expenditures against profit, on top of the actual capital expenditure. This is in lieu of
72 This is a simplified example and assumes that the company has no loss-making fields. PRT is a field- (and company-)
specific tax and losses in one field that a company operates cannot be offset against profits in another field.

Energy Taxation & Subsidies in Europe Appendix A
NERA Economic Consulting 56
deduction of interest charges (which are specifically not allowed to be deducted for PRT
purposes);
Oil Allowance – exempted up to one million tonnes of oil a year from PRT and up to 10
million tonnes over the lifetime of a field (to shelter smaller, marginally economic fields
from PRT);73
Safeguard – provides a safety net to less profitable fields, limiting the PRT liability of a
field in order to ensure a post-tax return on capital of at least 15 percent.74
As oil production began to fall from the late 1980s, the government responded by eliminating
PRT on new fields that received development consent from 1993. Existing (pre-1993) fields
continued to pay PRT, although at a reduced rate of 50 percent. At the same time as the rate
of PRT was reduced, a special relief for exploration and appraisal costs was also abolished.
PRT remains a significant source of government revenue from oil production today even
though it does not apply to new fields.
A.2.3. Ring Fence Corporation Tax (RFCT)
Oil and gas companies pay corporation tax, in a similar way to other businesses operating in
other sectors of the economy, but at a higher rate. Corporation tax is a tax on profits, after
accounting for both capital and operational expenditures in a given period. In the oil and gas
sector, the calculation of corporation tax on profits from extraction activities is kept separate
from the calculation of profits on any other activities. This “ring-fencing” is intended to
prevent companies from using losses incurred elsewhere to offset profits (and associated tax
liability) in the extraction business.
Oil and gas companies had been subject to the same standard rate of corporation tax as other
businesses in the UK until 2008. This standard rate was 52 percent in 1975 and has
decreased over time, falling to 40 percent in the mid-1980s and to 30 percent at the end of the
1990s. Since 2008, the standard rate paid by businesses in the UK has again fallen,
decreasing to 23 percent in 2013. Recent reductions did not apply to oil and gas producers,
however: their corporation tax rate has remained at 30 percent. Where the PRT is charged
(on fields given consent prior to 1993), it is treated as a deduction for tax purposes, as
illustrated in the simple example above (see second paragraph of A.2.2).
A.2.4. Supplementary Charge (SC)
Between 1993 and 2002, fields that received development consent after 1993 were subject
only to the prevailing rate of corporation tax. New fields therefore faced a significantly lower
marginal tax rate than had applied to fields granted extraction licences prior to 1993.
Although it is not straightforward to isolate the impact of policy changes on production, or
revenues, the lower marginal tax rate appears, to some extent, to have had the desired effect
of boosting production (see Figure A.1) by making previously untapped resources
73 This is the allowance provided to certain fields granted development consent after March 1982. The allowance (annual
and cumulative) available to fields granted development consent prior to March 1982 was half these amounts.
74 Nakhle (2008), “Petroleum Taxation – Sharing the Oil Wealth: A Study of Petroleum Taxation Yesterday, Today and
Tomorrow”

Energy Taxation & Subsidies in Europe Appendix A
NERA Economic Consulting 57
economically more attractive.75
Around the time of peak production in 1999, and as oil prices
started to recover from their low levels in 1998, the government applied an additional tax in
order to extract more revenue from the benefits accruing to the sector. Both a reintroduction
of PRT and an additional corporation tax were considered. Neither option was implemented,
however, and in 2002 the government formally introduced a third headline measure, the
Supplementary Charge (SC).
The SC acts in the same way as an additional corporation tax. The rate was initially set at 10
percent, taking the combined corporation tax rate to 40 percent. The only significant
difference between the two is that interest payments cannot be deducted from the profits to
which the SC applies.76
(For example, a company extracting from a “new” field that earned a
profit of £100 before interest payments and taxes in 2003, would have to pay £10 in SC. If
the interest payments were £5, the company would then pay a further £28.50 in standard ring-
fence corporation tax (£95 multiplied by 30 percent), taking the total tax burden on profits to
£38.50). The SC rate was subsequently doubled to 20 percent in 2006 and then increased
again to 32 percent in 2011.
Thus, as of the time of writing, two structures now apply to oil and gas activities:
Fields that received development consent before 1993: PRT, RFCT and SC; and
Fields that received development consent after 1993: RFCT and SC.
At the time of the introduction of the SC, in 2002, the government simultaneously introduced
a 100 percent ‘First Year Allowance’ for capital expenditures for those fields that paid the SC.
This remains in place today and allows companies to deduct their capital costs on plants and
machinery from taxable profits in the same period in which they are incurred. This
accelerated capital depreciation scheme benefits companies by permitting them to defer tax
payments to later years, thereby enhancing the net present value of projects.77
Of course, this
benefit must be seen as part of the wider taxation regime, which still collects substantial
revenues from the production of oil and gas in the UK. Both the depreciation treatment and
the elevated profit taxes are reflected in our inventory of government transfers, because our
analysis is based on the actual tax revenues collected.
The increase in the SC rate was partly justified by the significant rise in the price of oil
observed since the turn of the century from around $20 per barrel in 2001 to over $100 per
barrel (in nominal terms) by 2011. This has provided incentives to tap many fields that were
not previously considered viable. However, under the full corporation tax rate, including the
SC, of 62 percent, certain reserves remained unexploited, and consequently generated no
revenue for the government.
75 Government revenues also increased from 1993 to 1997. Whilst it is not straightforward to directly associate the
revenue change to the policy change, presumably by making more viable the exploitation of certain more costly fields,
the government has earned additional revenue from these fields. The alternative for these specific resources would have
been no production and therefore no government revenue (and no wider economic benefits).
76 The PRT is also deductible against profits used to calculate the SC, as it is for corporation taxes.
77 The standard rate of capital allowance for plants and machinery used in mineral extraction is 20 percent per year on a
reducing balance basis. (HMRC. Capital Allowances Investment Schemes. Available here:
http://www.hmrc.gov.uk/capital_allowances/investmentschemes.htm#f)

Energy Taxation & Subsidies in Europe Appendix A
NERA Economic Consulting 58
In recognition that further development of oil and gas resources on the UKCS relied upon
drilling in smaller fields and at fields with more complex technical requirements, the
government accompanied the increase in SC with a “Field Allowance” scheme (introduced in
200978
and extended in later years).
Under the scheme (which remains in effect) small and technically challenging projects can
now seek approval from the Department of Energy and Climate Change (DECC) to qualify
for the Field Allowance, which exempts them from part, or all, of the SC. This allowance
now covers various offshore fields.
Separately, due to the complexity of production and low margins available from onshore
shale gas extraction in the UK, shale gas sites are expected to be exempt from the SCT –
possibly subject to certain limitations – and therefore to be taxed at the higher oil and gas
corporation tax rate of 30 percent.79
The Field Allowance (or the “Pad Allowance” that has
recently been proposed by the UK government – which refers to drilling sites for
unconventional oil and gas resources, where fields are not well defined) therefore would
reduce the marginal tax rate for some sites, but is intended to increase production by making
oil and gas reserves that otherwise would be left in the ground commercially viable – thereby
increasing government revenues and overall economic activity.
A.2.5. Decommissioning
Decommissioning costs (also referred to as abandonment costs) are treated as capital
expenditure and can therefore be used to reduce tax liabilities on oil and gas production.
Prior to March 2008, if a company were to incur a loss on its activity in a particular year it
was able to ‘carry-back’ expenditure on decommissioning for up to three years. These costs
could therefore offset the amount of tax payable in earlier years and reduced the overall tax
on the asset over a limited period. From March 2008, this period of ‘carry back’ was
extended. Companies are now able to offset their decommissioning costs as far back as April
2002 (when the SCT was introduced), with the offsetting expenditure applied to profits in the
most recent years first.
On top of this, the government has recently sought to provide certainty to oil and gas
production companies with regards to the tax relief they will be eligible for at the point of
decommissioning their activities in a particular site. Following a consultation in 2012, the
government introduced Decommissioning Relief Deeds (DRD) in the 2013 Budget. From late
2013, these contracts can now be agreed between the company subject to decommissioning
costs and the government, which protects the company from any adverse changes to the
treatment of decommissioning costs that may come into force after the agreement of the DRD.
It is therefore an additional measure designed to provide a degree of security to oil and gas
producers with respect to the fiscal treatment of decommissioning costs.
78 See http://www.hmrc.gov.uk/oilandgas/guide/sc.htm
79 This was proposed by the Chancellor of the Exchequer in the 2013 Budget. A consultation regarding the exact detail of
the tax regime and a possible extension to all unconventional hydrocarbon resources has concluded with a final decision
expected in the 2014 Budget. This announcement is expected to provide further detail regarding the level of production
and time period over which the SCT exemption may apply. (HM Treasury. Consultation outcome: Harnessing the
potential of the UK’s natural resources: a fiscal regime for share gas. 10 December 2013).

Energy Taxation & Subsidies in Europe Appendix A
NERA Economic Consulting 59
A.3. Analysis of Tax Revenues and the Marginal Rate
The first production peak on the UKCS was in 1986 (see Figure A.1 above) and up to that
point, the main revenues from upstream oil and gas activity came from PRT. Since then,
RFCT and SC have dominated government receipts. Figure A.2 shows the evolution of
government revenues since 1975, split by the type of tax. The dotted red line shows an
estimate for the production value of the oil only80
(right hand axis), calculated by multiplying
the average annual market price of crude oil by annual UK production.81
Figure A.2 Production Value and Government Revenues by Tax Scheme (Nominal)
Source: HMRC (tax revenues); EIA (crude oil market price); DECC (oil production); Federal
Reserve Bank of Saint Louis (UK/US historic exchange rates) Note: A Supplementary Petroleum Duty (SPD) tax was introduced in 1981, payable on top of
the PRT, but this was removed within two years.
Total annual revenues, measured in nominal terms, first peaked in the mid 1980s at £12
billion, coinciding with record production levels. They then fell dramatically both as a result
of reduced output as well as a reduction in the marginal tax rate in 1993, following the
80 We have not included the production value of gas since gas price data are unavailable for the early part of the period
shown.
81 Note that the production value is based on the crude oil extracted and does not consider the value of the natural gas that
is extracted. We only include oil here as published natural gas prices are available for just a subset of the period covered
by the chart (from 1996 onwards). Gas prices have historically been linked to oil prices and production levels on the
UK Continental Shelf have also been closely linked. Therefore we anticipate that adding gas would not alter the trend
shape, although it would increase the absolute level of the production value.

Energy Taxation & Subsidies in Europe Appendix A
NERA Economic Consulting 60
reduction in the PRT rate and its complete removal for new fields. Since the late 1990s, PRT
revenues have been sustained to some degree by increased oil prices, despite the decline in
remaining proven reserves in PRT-paying fields. However, as the figure makes clear, since
2000 the majority of revenues has come from the combination of standard corporation tax as
well as the SCT.
Figure A.3 shows the marginal rate of tax applied to the profits from oil and gas extraction
activities. As a reference, the figure also shows the standard corporation tax applied to other
areas of the UK economy outside the oil and gas sector (the dotted series). Fields granted
consent prior to 1993 paid both the PRT and standard corporation tax on their profits.82
Their
marginal rate of tax is shown by the blue line. The marginal rate increased from 74 percent in
1975 up to almost 90 percent in 1981, due to the rise in the PRT. It then fell slightly in the
mid 1980s, due to a decrease in the corporation tax rate, and then sharply in 1993 as the PRT
was lowered from 75 percent to 50 percent. In the eight years prior to 1993, the marginal tax
rate for oil and gas companies was consistently 50 percentage points higher than the rate
applied to other sectors of the economy. Since the early 1990s the step changes in the
marginal rate of tax have been due to the introduction and subsequent increase in the SC.
82 Note that royalties were payable per unit of output, rather than profit and therefore are not included in this illustration.
We have approximated the impact of royalties on the marginal rate between 1975 and 1981 by estimating the total
profit across all extraction companies (based on PRT and Corporation Tax payments) and applying the burden of the
PRT, corporation tax as well as royalties to this estimate. This analysis indicates that the marginal tax rate between
1975 and 1981, including the impact of royalties, ranged between 83 and 96 percent. The annual average over this
period was an 88 percent marginal tax rate. This is the same as the rate in 1982 when policy change meant royalties
ceased to be collected from new fields but the PRT was increased from 60 to 75 percent.
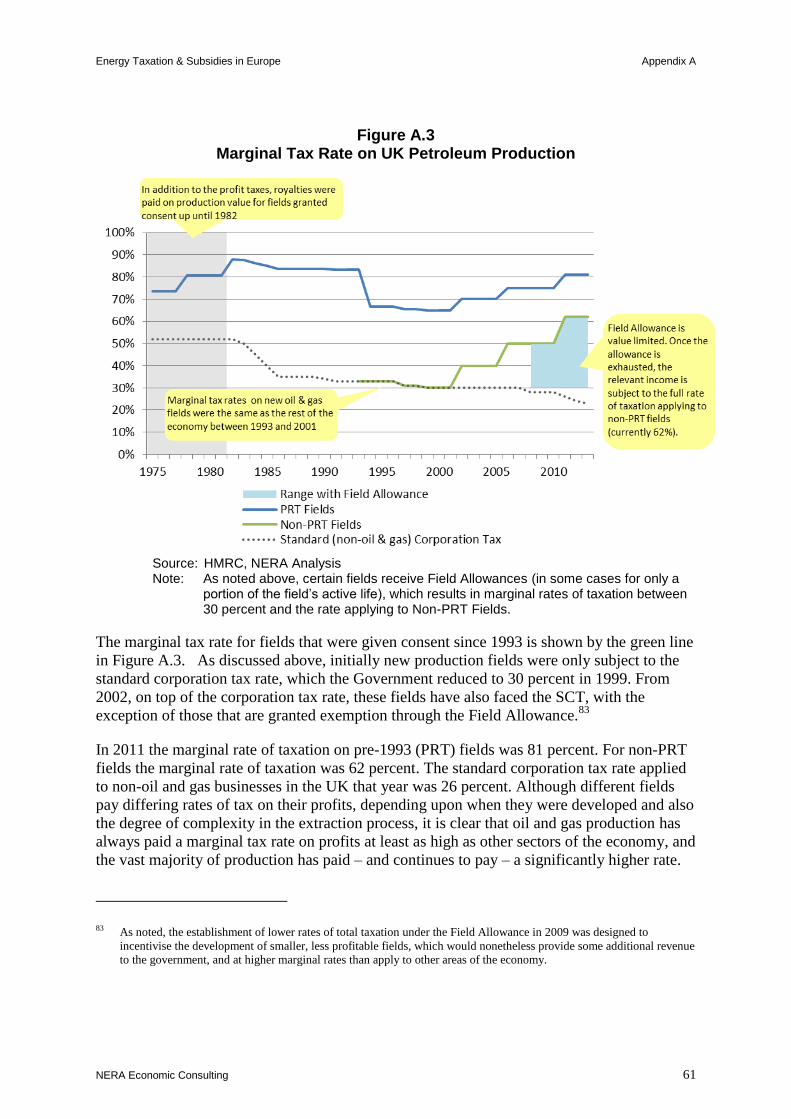
Energy Taxation & Subsidies in Europe Appendix A
NERA Economic Consulting 61
Figure A.3 Marginal Tax Rate on UK Petroleum Production
Source: HMRC, NERA Analysis Note: As noted above, certain fields receive Field Allowances (in some cases for only a
portionofthefield’sactivelife), which results in marginal rates of taxation between 30 percent and the rate applying to Non-PRT Fields.
The marginal tax rate for fields that were given consent since 1993 is shown by the green line
in Figure A.3. As discussed above, initially new production fields were only subject to the
standard corporation tax rate, which the Government reduced to 30 percent in 1999. From
2002, on top of the corporation tax rate, these fields have also faced the SCT, with the
exception of those that are granted exemption through the Field Allowance.83
In 2011 the marginal rate of taxation on pre-1993 (PRT) fields was 81 percent. For non-PRT
fields the marginal rate of taxation was 62 percent. The standard corporation tax rate applied
to non-oil and gas businesses in the UK that year was 26 percent. Although different fields
pay differing rates of tax on their profits, depending upon when they were developed and also
the degree of complexity in the extraction process, it is clear that oil and gas production has
always paid a marginal tax rate on profits at least as high as other sectors of the economy, and
the vast majority of production has paid – and continues to pay – a significantly higher rate.
83 As noted, the establishment of lower rates of total taxation under the Field Allowance in 2009 was designed to
incentivise the development of smaller, less profitable fields, which would nonetheless provide some additional revenue
to the government, and at higher marginal rates than apply to other areas of the economy.

Energy Taxation & Subsidies in Europe Appendix A
NERA Economic Consulting 62
A.4. Conclusions
Resources in the UK continental shelf have provided an important source of revenue to
government over the past four decades. In addition to direct tax revenues, the UK government
has derived other benefits from the development of its oil and gas resources, including the
development of technological expertise and benefits associated with employment connected
to the industry. Successive governments have employed a variety of fiscal instruments to
capture a proportion of profits from oil and gas extraction – to compensate the Crown and
share with society the benefits arising from the extraction and use of national resources. The
focus of the present study is not to analyse the effectiveness of these measures at raising
revenues or promoting growth. Instead, the brief history of the fiscal regime outlined here
serves to illustrate the overall tax burden placed on upstream oil and gas and the sometimes
complex interaction between different instruments.
It is difficult to determine how the rates at which taxes (and other fiscal measures) are set
affect total government revenues from oil and gas extraction. There are a number of other
variables that make an analysis of the effects of government policy difficult. Figure A.3
above shows significant variation in the marginal tax rate applied to oil and gas extraction
profits over time and dependent on the characteristics of the field. Figure A.4 (below)
compares government revenues (which are typically reported April to March in the UK) to
the oil and gas production value (estimated on a calendar year basis). The figure shows the
two series from 1996, when natural gas NBP price data starts to be available. This analysis
suggests tax rates (n.b. on production value, not on profit) ranging from 19 percent in 2000 to
as high as 35 percent in 2011.
Figure A.4 Government Revenue as a Proportion of Oil and Gas Production Value
Source: HMRC (tax revenues); EIA (crude oil market price); BP Statistical Review of World Energy
(natural gas NBP prices); DECC (oil and gas production); Federal Reserve Bank of Saint Louis (UK/US historic exchange rates)
0%
20%
40%
60%
80%
100%
-
5
10
15
20
25
30
35
40
45
50
1996 1998 2000 2002 2004 2006 2008 2010 2012
£bn
Production Value (oil and gas)
Government Revenue Share of Production Value

Energy Taxation & Subsidies in Europe Appendix A
NERA Economic Consulting 63
The average rate of tax on production value (i.e. the ratio of tax receipts to production value)
is shown by the blue line in Figure A.4 (right hand axis) and the estimated total production
value of oil and gas is shown by the grey line (left hand axis). Over the first decade for which
we have sufficient data (1996 – 2005) the average rate was 24 percent. In more recent years,
from 2006 to 2012, the average rate has risen to 28 percent. Total tax receipts reflect a
number of factors, including the volume of production, price of oil, the marginal rates of tax
applied, and costs. Thus, increasing the marginal rate of taxation does not necessarily lead to
higher government tax revenues.
For example, nominal government revenues, depicted in Figure A.2, were at their highest in
2008 at a time when the marginal tax rate on profits was either 75 percent for older PRT
fields or 50 percent for more recent fields. This contrasts with the much earlier peak in
nominal revenues of around the same level (so even higher if measured in real terms) in 1984,
when marginal tax rates were 86 percent.84
In 2008 oil and gas production was only slightly
more than half that of 1984, but the oil price – the main driver of the second peak in revenue
– was more than five times its level in 1984.
84 All fields paid the PRT at this time.

Energy Taxation & Subsidies in Europe Appendix B
NERA Economic Consulting 64
Appendix B. Detailed Approach to Estimating Transfers
This appendix provides further detail on our approach to estimating the different categories of
government revenues and expenditure, expanding on the summary paragraphs included above
in the methodology section (Chapter 3 of the main report). For each category we include
information on the data sources that we have relied upon, any key assumptions that we have
taken, and the estimation techniques used, where actual data on revenue or expenditures are
not readily available.
B.1. Estimating Government Revenues
B.1.1. Government Revenue from Extraction and Production (including Upstream Corporation Tax)
Government revenues from the extraction and production of the different energy sources are
dominated by the oil and gas sector. Countries endowed with oil and gas resources apply
particularly high marginal tax rates to extraction in order to capture a share of the value of the
resource for the state. We have also considered, in separate paragraphs, whether there are any
material government revenues received from the coal, wind and solar sectors associated with
the extraction and production of energy, but found these to be immaterial.
B.1.1.1. Oil and gas
There are various different taxation regimes in Europe to capture state revenue from oil and
gas extraction. Taxation tools used by governments include royalty charges, licence fees,
special hydrocarbon taxes as well as more burdensome corporation taxes. Not only do the
regimes differ across countries, but they have also changed over time. In this study we have
limited our review of upstream tax revenue for the oil and gas sector and the coal sector to the
top six countries in the region in terms of production output, which cover more than 90
percent of total production in the EU28 + Norway. Figure B.1 shows total production of oil
and gas in the region between 2007 and 2011 and the contributions of the top six countries,
(based on production in 2011).85
85 The top six oil and gas production countries in the region have consistently been the same between 2007 and 2011 with
the exception of 2010, in which Romania was the sixth largest producer, displacing Italy. We have focused our detailed
analysis on the top six producers in 2011, which are also the top six when measuring total production over the full 2007
to 2011 period.

Energy Taxation & Subsidies in Europe Appendix B
NERA Economic Consulting 65
Figure B.1 Oil and Gas Production in the EU28 + Norway (2007 - 2011)
Source: EIA and NERA analysis
Norway, the United Kingdom and the Netherlands account for over 80 percent of oil and gas
production in the EU28 + Norway in 2011, with Germany, Denmark and Italy combined
accounting for a further 10 percent. We have reviewed detailed estimates of the government
revenues from the upstream oil and gas sector in each of these six countries from a variety of
sources. For the government revenues associated with the remaining (approximately 10
percent) share of production, we assume that the average revenue per tonne of oil equivalent
for the top six producers is likely to be a reasonable estimate. For the top six producers, we
find an average government revenue of €168 per toe produced in 2011. We have calculated
the average government revenue for each year (2007 – 2011) and applied this rate to each of
the remaining smaller EU producers in that year to estimate total government revenue across
the 29-country bloc.
Government revenues from oil and gas production are estimated at €83 billion in 2011.
Given the joint nature of the oil and gas extraction industry it is standard practice in many
countries to report these revenues together. Attributing government revenues to liquid and
gaseous fuels in these countries therefore requires a degree of judgment. For illustrative
purposes in our main results, we have allocated the revenues across the two fuels according to
their share of total production revenue, calculated by multiplying production, measured in
-
100
200
300
400
500
600
700
2007 2008 2009 2010 2011
Mtoe
Italy
Denmark
Germany
Netherlands
United Kingdom
Norway
EU28 + NorwayTOTAL

Energy Taxation & Subsidies in Europe Appendix B
NERA Economic Consulting 66
tonnes of oil equivalent units, by the annualised price of crude oil and natural gas at the well-
head.86
On this basis we assign approximately €49 billion to oil and €35 billion to gas.
In the following paragraphs we provide detail on the estimates of government revenues from
our review of the top six countries shown in Figure B.1. For the most part we have drawn on
data from National Accounts, supplemented, where necessary, from industry analyses
available in the public domain.
Norway
Norway accounted for almost half of oil and gas production in the region covered by our
study in 2011. It is a major net exporter of energy and the oil and gas extraction industry is a
significant contributor to the overall economy, both in terms of state revenues as well as in
providing direct and indirect employment. Our primary data source for state revenues in
Norway is the Norwegian Petroleum Directorate (NPD), which publishes annual reports on
the industry. The NPD’s “Facts” publication includes state revenues from three principal
sources, including:
the Petroleum Tax, which is similar to corporation tax but includes a special additional
tax due to the high profitability of the sector;
profits earned by state-owned Petoro, which represents Norway’s Strategic Direct
Financial Interest (SDFI) in the sector; and
state dividends from Statoil, Norway’s largest producer, which was originally state-
owned.87
In 2011 the Norwegian state received €28 billion in Petroleum Tax revenues, €16 billion in
profits from the SDFI, and almost €2 billion in dividends from shares in Statoil, giving a total
revenue of approximately €45 billion. In addition, the state collects an Area Fee from licences
to extract. In the NPD data the Area Fee revenue is combined with CO2 and NOx tax
revenues, so it is difficult to isolate the contribution to government revenues from Area Fee
receipts. We have therefore supplemented the NPD data with information from the 2011
Extractive Industries Transparency Initiative (EITI) report, which splits the Area Fee, CO2
and NOx tax revenues. According to the EITI, the Area Fee accounted for 40 percent of the
combined revenues of these three elements, or almost €200 million in 2011. For all other
years we have assumed that 40 percent of the combined Area Fee, CO2 and NOx tax revenues
that are reported by the NPD are attributable to Area Fees.88
These amounts are allocated to
the total government revenues from oil and gas extraction in Norway.
86 Production data in each country and year are obtained from the EIA. Annualised crude oil prices are based on European
Brent prices published by the EIA. Annualised natural gas prices are based on UK NBP prices published by ICIS Heren.
87 For example, see: Norwegian Petroleum Directorate. Facts 2011: The Norwegian Petroleum Sector. Chapter 3. July
2011. We have also reviewed additional material auditing the national reporting for the Extractives Industries
Transparency Initiative, which Norway participates in. The EITI is a non-profit organisation formed of a coalition of
governments and companies whose aim is to improve openness and transparency in the reporting and management of
revenues from resource extraction around the world. For example, see: Deloitte. Extractive Industries Transparency
Initiative Reconciliation of Cash Flows from the Petroleum Industry in Norway 2011.
88 Carbon tax revenues are included elsewhere in our analysis, under the category of ‘excise duties and other energy taxes’.

Energy Taxation & Subsidies in Europe Appendix B
NERA Economic Consulting 67
United Kingdom
The United Kingdom is the second largest oil and gas producer of the countries included in
our study, and the largest in the EU, over the period we have considered. In 2011 the UK
accounted for 20 percent of production in the EU28 + Norway, and almost 40 percent of
production in the EU.UK production has declined over the largest decade due to the depletion
of large oil fields and due to increasing complexity in extraction from new sources. Appendix
A provides a detailed case study describing the UK taxation regime.
We have relied on government revenue data published regularly by Her Majesty’s Revenue
and Customs (HMRC), which oversees collection of government revenues in the UK. For
each accounting year from 2006/7 to 2011/12, running from April to March, HMRC
publishes government receipts from corporation tax (including supplementary charges that
apply only to the oil and gas sector) and the Petroleum Revenue Tax.89
To align these data
with the calendar years that we use for our analysis we have assigned the revenue from the
accounting year to the corresponding calendar year with the most overlap. For example, we
have assigned tax revenues from April 2010 to March 2011 to the 2010 calendar year.
As noted above, the corporation tax component comprises the standard corporation tax,
which is set at a higher level than the corporation tax rate applied to the rest of the UK
economy, plus an additional “supplementary” charge.
The Petroleum Revenue Tax is a legacy tax that only applies to oil and gas fields granted
approval prior to 1993.
In the past the government also collected revenue from royalty payments tied to the
production value of the resource, but the royalty regime has since been phased out in favour
of the above taxes. In 2011 government revenues from the Petroleum Revenue Tax were €2.3
billion, and revenues from corporation taxes were €10.6 billion, resulting in total UK
government revenues of almost €13 billion.
Netherlands
The Netherlands accounted for 15 percent of oil and gas production in the EU28 + Norway in
2011. The majority of this was gas production: the Netherlands is the second largest gas
producer in the region after Norway. The Dutch government earns revenues from gas
extraction via royalties and licence fees paid in return for concession rights, as well as
corporation tax. In addition, the state-owned company EBN maintains a stake in all extraction
activities. The government therefore also receives revenues from dividend payments made by
EBN.
The revenue data for the Netherlands that we use is taken from the country’s National
Accounts, which report oil and gas revenues associated with each relevant fiscal instrument.90
We have also validated this information using the Netherlands Environmental Accounts.91
In
89 HMRC. Statistics of Government Revenues from UK Oil and Gas Production. August 2013.
90 Statistics Netherlands. National Accounts of the Netherlands 2012. September 2013.
91 Statistics Netherlands. Environmental Accounts of the Netherlands 2012. November 2013.

Energy Taxation & Subsidies in Europe Appendix B
NERA Economic Consulting 68
2011 the government received €8 billion in revenue from ‘income from land and subsoil
assets’ (which correspond to royalties and licence fees), €1.6 billion from corporation taxes
and just over €2 billion from dividend payments. Total annual revenues were slightly less
than €12 billion.
Germany
Germany was the fourth largest producer of oil and gas in the EU28 + Norway in 2011,
accounting for 4 percent of the total output. The country’s production is relatively evenly
split between oil and gas. The German state charges royalties on extraction as well as the
standard rate of corporation tax on the profits of extraction companies.
We have identified limited information regarding total government revenues from oil and gas
production in Germany in the public domain. The annual reports produced by the industry
association for German oil and gas producers (WEG) provide information about royalty
payments, which in 2011 totalled approximately €0.9 billion.92
We have not identified any
public source for corporation taxes specific to the sector.
To estimate corporation tax receipts from Germany upstream producers we developed a
proxy for sector profitability that relies on Eurostat’s Structural Business Statistics (SBS).
This dataset includes information about the gross operating surplus attributed to petroleum
and natural gas extraction. Between 2008 and 2011 (data from 2007 is withheld) this ranged
between €640 million and €1.2 billion. This is almost certainly an overestimate of the profit
that would be subject to corporation tax, as it excludes depreciation and capital expenditure.
The standard corporation tax rate in Germany was 30 percent over this period, implying a
range of corporation tax revenues of between €192 and €358 million.
An alternative approach to estimating government receipts from the German upstream oil and
gas sector would be to assign total tax revenues to Germany based on the average revenues
per tonne of oil equivalent of production observed in Norway, the Netherlands, the UK,
Denmark and Italy – that is, adopting the same approach that we have taken for all other EU
countries that are not amongst the top six producers. Using this approach, we would estimate
€3.2 billion in government revenue to Germany. This would require corporation tax receipts
to be of the order of €2.3 billion. There is clearly a significant variation between these two
estimates. In the absence of further publicly available information we have adopted the first
estimation approach, as gross operating surplus provides a reasonable approximation of profit.
Denmark
Denmark was the third largest oil producer in the EU28 + Norway in 2011. Like Germany, it
accounted for 4 percent of total oil and gas production (measured in toe) in the region.
Upstream activities in Denmark are subject to the standard rate of corporation tax, plus an
additional hydrocarbon tax applied to profits. Royalties are also paid to the state (although
these are a relatively minor contributor to government revenues), as is an Oil Pipeline Tariff
92 For example, see: WEG. Jahresbericht 2012 Zahlen und Fakten. June 2013. An alternative industry source suggests
royalty payments may be between 40 and 100 percent higher than the WEG published data over the period concerned.
However, we have relied on the WEG data given that the data are publicly available and more transparent than
alternative sources.

Energy Taxation & Subsidies in Europe Appendix B
NERA Economic Consulting 69
that is charged on the volume of oil transported through the pipeline network. Up until 2012,
under a profit sharing arrangement, all oil and gas production companies were required to pay
the state 20 percent of their pre-tax profits over and above standard corporation tax. In 2012
this system was replaced by direct involvement in the sector by the state in exchange for an
extension to the licence period and additional amendments to the concession.
In 2011 total government revenues from oil and gas extraction were €4 billion, split between
corporation tax (€1.3 billion), hydrocarbon tax (€1.3 billion), royalties (€0.1 million), Oil
Pipeline Tariff (€0.3 billion); and profit sharing (€1.2 billion). These data were collected from
annual publications on the sector by the Danish Energy Ministry.93
Italy
Italy is the sixth largest oil and gas producer in the region, accounting for 3 percent of total
production, and like Germany has a relatively even split between oil and gas output when
measured in tonnes of oil equivalent. The central government receives revenues from
royalties as well as the standard corporation tax. An additional “Robin Hood Tax”94
is
applied on top of the corporation tax to capture a share of windfall profits. Local governments
also receive some revenue from oil and gas extraction activities, but we consider these to be
negligible.95
As was the case for Germany, we have not identified a public source that details precisely the
total government revenues from oil and gas production. Royalty fees are published by the
Italian Directorate-General for Mineral and Energy Sources. These totalled €400 million in
2011.96
We also reviewed a publication by a Nomisma Energia, a consulting firm
commissioned by the government, which presents a chart showing total government revenues,
inclusive of royalties, up until 2011. This indicates total government revenues around €1
billion over recent years (ranging from €0.7 to €1.5 billion).97
This estimate is corroborated
by a presentation by the Italian Petroleum and Mining Industry Association (Assomineria) to
parliament which includes an estimate for total revenues of €1.6 billion in 2012, including
both royalties and corporation taxes.98
The estimates are also similar, although slightly lower
(up to 50 percent in 2011), than alternative non-public estimates we have reviewed from
industry sources.
B.1.1.2. Coal
Our analysis has found no material government revenues from the production of coal across
Europe. As far as we are aware there is no pan-European data source that specifically details
93 For example, see: Energi Styrelsen. Oil and Gas Production and Subsoil Use in Denmark 2012. June 2013.
94 The “Robin Hood Tax” is an additional resource income tax that was introduced in 2008.
95 Wood Mackenzie. Global Economic Model. Q4 2013.
96 Ministero dello Sviluppo Economico. Gettito Royalties Anno 2013. Avaiable here:
http://unmig.sviluppoeconomico.gov.it/unmig/royalties/2013/2013.asp
97 Nomisma Energia. Tassazione della produzione di gas e petrolio in Italia: Un confronto. January 2012.
98 Assomineria. Indagine conoscitiva sulla strategia energetica nazionale e sulle principali problematiche in materia di
energia. September 2013.

Energy Taxation & Subsidies in Europe Appendix B
NERA Economic Consulting 70
government revenues from coal extraction and production. As such we have reviewed the top
six coal-producing countries in the EU and Norway, covering slightly more than 90 percent
of total production in the region. Figure B.2 shows coal production in 2011 from these top six
countries as well as the total production in the EU + Norway.
Figure B.2 Coal Production in EU + Norway (2011)
Source: EIA
In many parts of Europe, especially in recent years, coal production has tended to be loss-
making due to declining coal prices brought about through increased international
competition. The coal sector therefore differs significantly from the oil and gas sector – for
example, it is often relied upon to promote domestic energy self-sufficiency rather than to
generate profits from exports. In the following sections we summarise the data sources that
we have relied on to come up with estimates of the government tax revenues from coal
production in the top six coal producing countries in the EU. As for oil and gas extraction,
our approach is to take the average revenue (measured on a per tonne of oil equivalent basis)
and apply this to production in the remaining countries. However, for coal extraction we have
not found any evidence of significant profits made by the sector and therefore assume there is
no material contribution from corporation taxes.
Germany
Germany is the largest coal producer in Europe. In 2011, Germany coal production accounted
for 34 percent of the total for the EU28 + Norway. According to the OECD inventory, hard
coal production in Germany is “uneconomic” and the costs of producing coal are well above
the price of imports.99
As such the ownership of hard coal mines has been transferred to a
holding company which is heavily supported by the state. Annual income support provided to
coal production by the region of North-Rhine Westphalia ranged between €1.7 and €2.3
99 OECD. Inventory of Estimated Budgetary Support and Tax Expenditures for Fossil Fuels 2013. 2013.
-
100
200
300
400
500
600
700
2008 2009 2010 2011 2012
Mt
Romania
Bulgaria
Czech Republic
Greece
Poland
Germany
EU + Norway

Energy Taxation & Subsidies in Europe Appendix B
NERA Economic Consulting 71
billion from 2007 to 2011. Coal mining is also exempt from the payment of mining
royalties.100
We have not identified any public sources that provide information on possible government
revenues from coal production in Germany. Given that hard coal is loss-making, we assume
that there are no government revenues from this activity in Germany in the form of
corporation tax, royalties or licence fees for extraction. Lignite production also takes place in
Germany, carried out by private companies, without receiving direct support. This is likely to
be directly used in power generation stations. As such it is difficult to distinguish any profits
from the coal production part of the supply chain from the power generation. The profit from
lignite production may well manifest itself in the profits of power generation that uses the
fuel as an input. We examine corporation tax revenues from midstream activities below in
section B.1.2.
Poland
Poland is the second largest coal producer in the EU28 + Norway, accounting for a quarter of
production in 2011. The Polish energy system relies heavily on indigenous bituminous coal,
which provides approximately half of its primary energy supply.101
The state fully owns two
of the three biggest coal producers and holds a majority stake in the remaining company.
According to the OECD inventory current coal production is not subsidised by the state and
contract prices are negotiated freely. However, the OECD inventory report also notes that
several reforms of the industry intended to make it profitable and hand it over to private
companies have proven unsuccessful. We have not attempted to resolve this apparent
contradiction. We have not been able to identify any data sources that provide information
on the tax payments made by the sector over recent years. However, an IISD report on the
coal mining industry includes several estimates of profit between 1990 and 2006. In all but
two years the net financial profit was reported as negative;102
the exceptions were 2004
(profit of $734m) and 2006 ($126m).103
Based on this evidence we have assumed that any
government revenues from coal production in Poland are not material in the context of our
study.
Greece
The third largest coal producer in the EU is Greece. In 2011, 11 percent of coal in the EU28 +
Norway was produced here. The main domestic source of energy in Greece is lignite, which
is principally used for power generation.104
The OECD inventory does not identify any
explicit production support measures for lignite in Greece and as recently as 2009 the
government awarded extraction licences to several private companies. This suggests that
lignite extraction is likely to be commercially viable. Currently, the majority of lignite
100 OECD (2013).
101 OECD (2013).
102 It is not clear from the source whether this refers to profit before or after tax. However, given that it has often been
negative, it is reasonable to assume that at least corporation taxes were zero or negligible.
103 IISD. Lessons learned from the restructuring of Poland’s coal-mining industry. March 2010.
104 OECD (2013).

Energy Taxation & Subsidies in Europe Appendix B
NERA Economic Consulting 72
extraction is carried out by the state-controlled Public Power Corporation (PPC) which uses
the fuel directly as an input to its power generation plants. We assume that there are no, or
limited, profits reported from coal production itself, but that the PPC benefits from “lignite-
fuelled units that are substantially less expensive than other units.”105
Given that the PPC is a
vertically integrated, and state owned, company, we have not identified any direct tax
revenues accruing from coal production in Greece. We have not attempted to quantify any
wider economic impacts (costs or benefits) associated with the existing state ownership
structure.
Czech Republic
The Czech Republic accounted for 10 percent of coal production in the region in 2011. Six
coal mines are currently in operation in the Czech Republic, five of which extract lignite and
the other bituminous coal. CEZ, the largest Czech electricity producer, is the largest
consumer of coal in the country, which it uses for power generation. CEZ also owns a lignite
mining company that accounts for approximately half of all lignite production.106
As in the
Greek case, we assume that government revenues from taxing coal production (for example,
corporation taxes) are limited or negligible because the majority of extracted coal is used as
an input to power generation. It seems likely that potential profits from indigenous coal
production, relative to purchasing the fuel on the market, would therefore be manifested
primarily through profits on sales of electricity.
The Czech state does charge royalties on coal mining leases. These royalties are collected and
directly allocated as compensatory payments to municipalities adversely affected by coal
mining as well as to carry out works to remediate environmental damage. Royalties were
approximately €7m per year over the past five years, so we consider them to be immaterial
for the purpose of our study.107
Bulgaria
Bulgaria was the fifth largest coal producer in the EU28 + Norway, accounting for 7 percent
of the total output in the sector in 2011. According to the IMV analysis of budgetary support
and tax expenditures for fossil fuels, the vast majority (90 percent) of coal production in
Bulgaria is lignite produced in mines located next to four coal power generation plants, which
together generate over 60 percent of Bulgarian electricity.108
Brown coal reserves, in another
area of the country, which the IMV distinguish from lignite reserves, are also used for power
generation. The largest coal mining company is the state owned Bulgarian Energy Holding
(BEH).109
The data we have reviewed suggests that, for the most part, extracted coal is used
directly for power generation by vertically integrated companies. We have not identified any
105 European Commission. Decision on the granting or maintaining in force by the Hellenic Republic of rights in favour of
Public Power Corporation S.A. for extraction of lignite. 5 March 2008.
106 OECD (2013).
107 NERA analysis of ‘OECD (2013)’.
108 IMV Institute. Budgetary Support and Tax Expenditures for Fossil Fuels: An Inventory for six non-OECD EU
Countries. January 2013.
109 IMV Institute. Budgetary Support and Tax Expenditures for Fossil Fuels: An Inventory for six non-OECD EU
Countries. January 2013.

Energy Taxation & Subsidies in Europe Appendix B
NERA Economic Consulting 73
estimates of government revenue accruing directly from coal production activities in Bulgaria
and therefore assume these to be immaterial.
Bulgaria levies a concession charge for the exploration and extraction of natural resources.
However, this can be waived under certain circumstances for a period of up to five years as
per the Law for underground resources.110
We have not identified any estimates for
concession payments made in relation to the extraction of coal in Bulgaria.
Romania
Romania accounted for 6 percent of all coal production in the EU28 + Norway in 2011. The
National Hard Coal Company is the only hard coal producer in Romania, and is fully state
owned. Coal prices were only partially deregulated in 2012, and prior to this, were controlled
by the state. According to the IMV analysis of fossil fuel subsidies in Romania, there
continue to be significant losses made by various coal production units.111
Under EU State
Aid rules, subsidies are being phased out and many coal production sites are facing closure.
We have not identified any data reporting on the financial results of the National Hard Coal
Company, but assume, at least across all its operations, that it is a net loss-making entity. The
IMV study identified direct subsidies to the National Hard Coal Company of approximately
€40 million in 2011, which was slightly lower than the subsidy in previous years. We
therefore do not estimate any government revenues from coal production in Romania.
B.1.1.3. Wind
Governments may receive revenues from wind farms located on public land. For example, in
the UK the Crown Estate owns the seabed up to 12 nautical miles offshore. Offshore wind
developments therefore pay a fee to the Crown Estate as part of their licence conditions. We
do not have comprehensive data on government revenues accruing from the wind sector
across Europe. However, we have estimated the likely magnitude using data from the UK,
which has the largest offshore wind resource in Europe. Between 2009 and 2011 the Crown
Estate earned revenues of between £30m and £33m from its ‘Energy and Infrastructure
Portfolio’.112
This portfolio includes revenues from tidal energy, carbon dioxide and gas
storage, marine minerals, licence fees for cables and pipelines as well as offshore wind rights.
The Crown Estate sources do not break down revenues by individual sources, so we have not
been able to identify the share of this revenue that can be attributed to wind licenses. We
know, however, that it cannot be more than around £30m a year. Another example is Spain,
where wind farms pay local and regional taxes. However, these payments represent negligible
amounts. Based on both UK and Spanish evidence the government revenues from wind are
well below our materiality threshold, so we have not attempted to include estimates of
revenues from land concessions to the wind sector within our dataset.
110 IMV Institute. Budgetary Support and Tax Expenditures for Fossil Fuels: An Inventory for six non-OECD EU
Countries. January 2013.
111 IMV Institute. Budgetary Support and Tax Expenditures for Fossil Fuels: An Inventory for six non-OECD EU
Countries. January 2013.
112 The Crown Estate. Annual Report and Accounts 2013. June 2013.

Energy Taxation & Subsidies in Europe Appendix B
NERA Economic Consulting 74
B.1.1.4. Solar
We do not assign any “upstream” government revenues to the solar sector for land
concessions or other similar fees.
B.1.2. Corporation Tax
Corporation tax is a tax imposed by governments on the profits earned by businesses. The tax
is generally applied as a proportion of profit. It is therefore a useful revenue raising tool for
the state, extracting funds from those organisations that are most able to pay. The rates of
corporation tax in Europe are set by individual countries and differ to some degree. The
standard rate of corporation tax across the EU28 + Norway in 2012 ranged from 10 percent in
Bulgaria and Cyprus to 36 percent in France, with an average rate for the EU27 of 23
percent.113
Total government receipts from corporation taxes in Europe across all sectors of
the economy in 2011 were approximately €322 billion.114
The upstream oil and gas sector is a
significant contributor to overall corporation tax receipts.
Based on the data sources reviewed above in section B.1.1, combined corporation tax
revenues from the top six oil and gas producing countries from 2007 to 2011 ranged between
€28 and €47 billion.115
Including additional hydrocarbon taxes levied on top of corporation
tax raises the total to between €30 and €51 billion over the same five-year period.116
This
contribution alone accounted for 14 percent of all corporation tax receipts across the
European economy in 2011, even though oil and gas production accounted for just 2 percent
of the total value added in the economy (excluding financial and insurance services).117
We
have estimated a further €26 billion in potential corporation tax revenues from midstream and
downstream activities across the different energy sources, as detailed in the discussion below.
Whilst Eurostat and the European Commission publish high level information on corporation
tax rates and corresponding receipts for different countries, we are not aware of any publicly
available data sources that break down corporation tax receipts by sector. Even if such
sector-level data were available, it would be still more complicated to attribute corporation
tax receipts to individual energy sources, given the integrated nature of companies through
113 Eurostat. Taxation Trends in the EU. 2013 Edition. Table 4.
114 We have reviewed corporation tax receipt data from 2007 to 2011. The total amount collected by the EU and
Norwegian governments ranges from €265bn in 2009 to €415bn in 2011 with an annual average of €336bn. As the tax
is a function of company profits receipts are higher in periods of growth. This is borne out by the below average tax
receipts observed in the data for 2009 and 2010. (Source: European Commission, National List of Taxes 2013 and
NERA analysis)
115 This includes the Petroleum Tax in Norway, which is similar to a corporation tax, but includes an additional element
not faced by other sectors of the economy, in a similar way to the UK regime of charging corporation tax as well as an
additional ‘Supplementary Corporation Tax’. However, unlike the UK, the NPD data does not provide a split between
standard corporation tax and the additional contribution included in the Petroleum Tax, so we include the full amount in
this illustration.
116 These include the additional contribution from the Petroleum Revenue Tax in the UK and the Hydrocarbon Tax in
Denmark.
117 Value added is a proxy for GDP calculated by taking the value of production and subtracting the value of intermediary
goods. We have used Eurostat SBS data on the value added at factor cost of different activities in the economy to derive
this estimate. The total value added of the economy excludes financial and insurance services.

Energy Taxation & Subsidies in Europe Appendix B
NERA Economic Consulting 75
the energy supply chain. There are further complications associated with the way that some
companies structure themselves to ensure that their operations are tax-efficient in terms of the
profit they are able to retain.
Our approach, therefore, has been to try to identify the most significant parts of the energy
supply chain in terms of profits earned and then to rely on available data points to create
corporation tax estimates across the energy sources covered by this study. This has allowed
us to assess the materiality of corporation tax revenues from different parts of the energy
supply chain. We have also drawn on Structural Business Statistics (SBS) published by
Eurostat, which report information such as turnover, value added, and gross operating surplus
for different sectors of the economy. SBS gross operating surplus data provides a proxy for
the profits made by a particular sector. It is a measure of gross output, less the cost of
intermediate goods and the cost of labour input. It does not deduct any capital expenditure so
overestimates actual reported profits made by companies operating in a particular sector. The
sectoral breakdown in SBS data is not always appropriate for the energy supply chains we are
examining, and data completeness across European countries is an issue. However, at a high
level the SBS dataset has served to inform and validate several of our estimates.
One exception to the general lack of disaggregated data is corporation tax receipts from the
production of oil and gas (discussed above). This upstream activity is one of the major
contributors to total corporation tax receipts in countries that have significant energy
resources, so governments publish detailed information on tax receipts from energy
extraction. A discussion of potential government revenues from coal production is discussed
above (section B.1.1.2). We do not attribute any corporation tax revenues to coal production
in our estimates. Wind and solar differ from fossil fuels in that the energy resource is not
physically “extracted” from the ground. Instead equipment is used to transform the
abundance of existing wind or solar energy into electrical output. A direct comparison across
fuels is complicated by this difference. This is discussed further in the power generation
subsection of section B.1.2.1 below.
The following two sections provide further information on our estimates for corporation tax
receipts across midstream and downstream activities for all of the energy sources. Absent the
kind of detailed government revenue information that is available for the upstream oil and gas
sector, there is reason to think that the approach we have adopted for other sectors and stages
of the supply chain may over-estimate government receipts from corporation tax, to the
extent that some companies are able to organise their operations in ways that reduce their
corporation tax burden. We have not attempted to quantify this effect, as the contribution to
government revenues from corporation tax outside the upstream oil and gas sector is
comparatively small.
B.1.2.1. Midstream corporation tax
The previous section underlines the important contribution of the oil and gas production
industry to total corporation tax receipts across the region covered by our study, making up
14 percent of total corporation tax in 2011. The lion’s share of corporation tax receipts from
all energy is therefore derived from upstream operations. However, there are various
‘midstream’ and downstream activities that are also relevant. Within ‘midstream’ here we
include activities such as power generation, fuel storage and transportation, processing or
refining of fuels, and trading. It is common for the same company to engage in many or all of

Energy Taxation & Subsidies in Europe Appendix B
NERA Economic Consulting 76
these activities at once, as well as upstream and downstream areas, as a vertically integrated
entity. This makes it particularly difficult to obtain data on profit margins at different stages
of the supply chain. To inform our analysis we have identified data points from publicly
listed companies, country-level data, and where available, pan-European sources and applied
these data as appropriate to arrive at our estimates for the full EU28 + Norway region.
Various data points and estimates are summarised in the following bullet points:
Trading
Trading is commonly used by energy companies as a risk management tool to hedge against
exposure to commodity prices in the futures market, so for the purposes of our analysis we
have assumed that on balance it does not make a significant contribution to company profits.
Any profit that trading activity generates is likely to materialise in either the upstream or
downstream market segments and therefore be visible in the data points that we rely on for
these parts of the supply chain.118
Power Generation
In order to assess the profits made by power producers we have reviewed a number of
sources, focusing on the financial accounts of Europe’s largest electricity generators. These
companies tend to operate across various countries as well as parts of the supply chain. It is
therefore not always possible to isolate the profits earned on power generation in a particular
country from operations in other regions or covering separate activities. These often include
storage, retail supply or energy extraction.
The data points we rely on to estimate profits, and subsequently corporation tax receipts,
from power generation are drawn from Enel, whose main market is in Italy, E.ON, based in
the German market, and Centrica, located in the UK. These companies report measures of the
profitability specific to their power generating activities. We have then divided the reported
profit by the output (in TWh) generated over the same period. The profits reported by this
sample of large power generators cover their portfolio of generation technologies. These
include coal, gas and renewables, notably wind (nuclear activities, where applicable, are often
reported separately). It is however, important to note that these portfolios are weighted
towards conventional thermal technologies rather than renewables.119
Our analysis of 2011 data finds that Enel earned an operating income of approximately €20
million per TWh; E.ON reported earnings before interest and taxation (EBIT) of €25 million
per TWh; and Centrica reported operating profit of €17 million per TWh. We then
supplemented these company specific indicators of profitability with Eurostat SBS data.
Across the EU28 + Norway in 2011, Eurostat report a gross operating surplus for electricity
118 Certain energy companies also engage in speculative trading, that can be profit making. However, gains by one trading
organisation are often offset by losses in another. Also, we consider speculative trading to be too far removed from the
actual energy sources (oil, gas, coal, electricity, and derivatives thereof) to be relevant to the scope of our study.
119 Recent evidence from Germany suggests that the increasing deployment of renewables is altering the profitability of
conventional power generation, as RWE recorded its first annual loss in 60 years in 2013 – attributed, in part, to the
expansion of renewable generation with negligible marginal costs (RWE press release. “RWE posts first net loss in 60
years”, 4 March 2014; and Financial Times. “Germany’s RWE slides into €2.8bn net loss for 2013”. 4 March 2014).
Our results focus on data prior to, and including, 2011 and we do not explicitly quantify such additional impacts of RES
support policies on fossil fuels due to the complexity of capturing different market interactions.

Energy Taxation & Subsidies in Europe Appendix B
NERA Economic Consulting 77
generation of approximately €67 billion. Total electricity production during the year was
slightly over 3,000 TWh, giving an estimate of gross operating surplus of €21 million per
TWh.
The estimates in the previous paragraph are all based on slightly different measures of
profitability. Gross operating surplus, operating income and operating profit are measures
that do not incorporate the capital expenditures, which reduce the profits of a company that
are subject to corporation tax. However, the highest of the estimates, from E.ON, does
include the depreciation of capital assets.
We have chosen to estimate corporation tax receipts from power generation using a proxy for
profitability in the power generation sector of €20 million per TWh. This is in the middle of
the range of the estimates outlined above, yet it is likely to overestimate profitability once
capital expenditures are included.
To estimate corporation tax receipts accruing from power generation we have multiplied the
volume of electricity generation in each country (in TWh) by the above €20 per TWh value
and then applied the relevant corporation tax rate. Within each country we assign corporation
tax revenues to the different energy sources in proportion to their share of total power
generation.120
For the EU28 + Norway we estimate a total of €10.4 billion of corporation tax
receipts to power generation from the energy sources included in our study, attributed as
follows: Coal (€4.4bn); Oil (€0.3); Gas (€4.4); Wind (€1bn); and Solar (€0.3bn).
The actual profitability of power generation varies both by technology and across years. For
example, “spark” and “dark” spreads provide a measure of the difference between the price
of electricity on the wholesale market and the cost of the input fuel used to generate
electricity. “Spark” spreads compare the price of gas to that of electricity, and “dark” spreads
compare the price of coal to electricity. These spreads are a proxy for the short-run
profitability of gas and coal power generation, respectively.121
The two spreads have changed
places with each other (one higher during one period, the other higher during another period)
over time and across countries in recent years in Europe. This suggests that the relative
profitability of generation from the two fuels is also likely to have fluctuated over time.
In contrast, there is no cost of input fuel for wind or solar power generation, so the
profitability of these two sources is almost entirely dependent on the revenue (and hence the
subsidy) they receive (which is determined by the climatic conditions that determine how
much electricity they are able to produce). However, renewable subsidies are, in theory,
designed in such a way that investors can expect to earn, on average, profits similar to
investors in conventional plant. Our approach abstracts from these nuances and simply
assigns estimated corporation tax revenues from power generation to the different energy
120 For example, gas fired power output in Spain in 2011 was approximately 85 TWh, and corporation tax in Spain is 30
percent. The corporation tax that we attribute to electricity generated by Spanish gas capacity is therefore 85 TWh x €20
million per TWh x 30 percent = €550m.
121 As noted above, however, the spark spread and dark spread do not reflect depreciation or other forms of capital
expenditure, and therefore are an imperfect indicator of the profits relevant for corporation tax.
Energy Taxation & Subsidies in Europe Appendix B
NERA Economic Consulting 78
sources in direct proportion to their share of power generation in a given year and country.122
We provide an alternative approach to estimating corporation tax from power generation in
the wind and solar sectors in Box B.1.
Box B.1 Alternative Approach to Estimating Corporation Tax on RES Equipment
Using the approach described above, we estimate government corporation tax
revenues of €1 billion for wind and €0.3 billion for solar from electricity generation.
The capital expenditure on wind and solar power generating equipment and
infrastructure (turbines and solar panels) is particularly high relative to subsequent
operational costs. It is also typically higher, on a per MWh basis, than the cost of
conventional thermal plants. There is therefore a risk that the approach above could
underestimate the actual corporation tax receipts from renewable technologies. An
alternative approach that we consider here is to estimate corporation tax receipts on
the purchase and installation of wind and solar power generation equipment.
To estimate the corporation tax on wind and solar equipment and its installation we
have obtained information on capacity added in each year and multiplied this by an
estimate of equipment and installation costs, per unit of capacity, to obtain the total
capital cost. Wind capacity additions are reported by Eurostat which we have
validated with data from the European Wind Energy Association (EWEA).123
Between 2007 and 2011, annual capacity additions of wind turbines ranged between
8.4 – 10.2 GW. We have relied on solar capacity expansion data from Eurostat. In
2007, solar capacity added was only 1.7 GW, but there has been a dramatic growth in
deployment over the last few years. In 2011 22 GW of new solar capacity was added.
The German market has accounted for almost half of solar capacity additions in the
EU since 2007.
We have reviewed a number of sources to derive approximate estimates of capital
costs for wind and solar power.124
The costs of wind turbines actually increased from
the turn of the century until around 2010, but then began to decline again. (Although
capital costs increased over this time, the overall cost of generating fell.) We assume a
total installed cost of €2 million per MW of capacity for all years and countries. This
122 Clearly in any given year not all generation technologies are equally profitable. However, a more detailed assessment
would require a much more detailed analysis of the European power sector than is possible within the scope of the
current study. As noted above, there are reasons to think that the approach we have adopted should yield estimates of
profitability that are plausible across the relevant energy sources – namely, that spark and dark spreads have not
uniformly favoured one or another fuel over the period and countries in question, and that RES subsidies must be set
taking into account the profitability of conventional generation alternatives. Moreover, even quite large differences in
the total profitability attributed to individual fuels in any one year would not materially change the estimated
government revenues from any of the principal energy sources included in our study, relative to the other sources.
123 Eurostat energy database; and EWEA. Wind in Power Annual Statistics (2009 – 2012).
124 Sources that we reviewed include industry associations (EWEA and EPIA), international organisations (IEA and
IRENA) and government statistics.

Energy Taxation & Subsidies in Europe Appendix B
NERA Economic Consulting 79
is based on the range of $1.4-2.7 million reported by the IEA and similar to estimates
published by EWEA and IRENA.
Solar PV costs have decreased significantly over recent years. We take our central
estimates from an IRENA publication on renewable power generation costs, which
reports that the cost for German residential systems have fallen from around $7
million per MW in 2008 to just $2.2 million per MW in 2012. We have assumed
capital costs of €7 million per MW in 2007, falling by €1 million per year to €3
million in 2011 for all capacity added in the EU + Norway. These costs cover both the
equipment as well as the installation of the system. The significant majority of solar
PV equipment in Europe has been imported from China in recent years, due to its
lower cost. Therefore, for the purposes of estimating the corporation tax paid to
European governments we only include the installation costs. These are
approximately half of the total according to figures published in the IRENA report.
To estimate the corporation tax revenue from wind and solar equipment we have had
to assume a net margin from the provision of capital and installation services.
Assuming that 5 percent of total costs represent company profits and applying the
corporation tax for each country, in each year, we have estimated corporation tax
receipts on wind equipment to range between €242 and €294 million. The
contribution from solar ranges from €105 million in 2007, rising steeply to almost
€0.5 billion in 2011, due to the significant increase in capacity. Therefore, even with
this relatively favourable treatment of wind and solar industries, the corporation tax
receipts are relatively small, and certainly do not change the headline results.

Energy Taxation & Subsidies in Europe Appendix B
NERA Economic Consulting 80
Storage
Energy companies provide storage facilities for stocking oil, gas and coal at various strategic
locations to serve markets across Europe. Storage serves to provide security of supply to end
users. It also allows energy suppliers to manage risk as well as permit flexibility through the
supply chain. Compulsory stocking obligations for oil are in place at a European level to
maintain sufficient reserves in the event of a supply disruption. The reserves that are kept to
fulfil these obligations are provided by a mix of energy companies and national agencies,
depending on the country. Similarly, in some countries, such as Spain, coal power plants are
required to maintain sufficient stockpiles to fuel a certain number of hours of generation.
We have not identified sources that explicitly report the profit from the provision of storage,
as this tends to be a service provided by energy companies that are also engaged in other,
more significant activities such as extraction, refining and power generation. We assume
corporation taxes from storage activities are not material to our study, and therefore do not
include any estimates for this part of the supply chain.
Refining
We have obtained data on crude oil refining activity in the EU as well as profit margin
estimates for simple and complex refining of crude oil. Simple refining is often loss-making
and we therefore attribute no profit to this activity. Refining (gross) margins in North West
Europe (Rotterdam) ranged between $2-7 per barrel over the course of 2007 to 2011, and
remained consistently below $5 per barrel from 2009 until the end of 2011.125
Gross refining
margins only consider the difference in the price of the crude input and refined product
output. An estimate of the net margin on a representative or average “complex” refinery,
taking into account the cost of the crude input as well as opex and capex costs incurred by
refiners, was approximately $2.4 (or €1.7) per barrel in 2009.126
The annual average daily
refining throughput in the EU between 2007 and 2011 ranged between 13.7 and 12.2 million
barrels.127
Assuming an average of 12.5 million barrels a day, this implies an annual throughput of 4.6
billion barrels. Only a proportion of this throughput is profit making, however. Applying a
factor of 40 percent 128
, which is likely to be an overestimate of “complex” refining
throughput, implies that profit is made on around 1.8 billion barrels of crude each year,
generating profits of around €3 billion. We have allocated the estimated throughput to the
different European countries based on their share of total refining capacity.129
Applying the
relevant corporation tax rates for each country yields estimates of corporation tax from crude
oil refining across Europe ranging from €1 billion in 2007 down to €0.8 billion in 2011.
125 BP. Statistical Review of World Energy. June 2013.
126 Pöyry. “Survey of the Competitive Aspects of Oil and Oil Product Markets in the EU”. December 2009.
127 BP (2013).
128 Pöyry (2009) suggests that the share of complex refining capacity out of total capacity in different European regions
ranges between 32 and 42 percent. Refinery complexity is a continuum, and there is no precise definition of what
distinguishes a complex refinery from a simple one, but this value appears to be a reasonable estimate.
129 Refining capacity reported by Europia, available at https://www.europia.eu/Content/Default.asp?PageID=397

Energy Taxation & Subsidies in Europe Appendix B
NERA Economic Consulting 81
We have not identified data that would allow us to estimate profits from gas refining across
European countries. However, we assume that any contribution to government revenues from
gas refining does not exceed our materiality threshold.
B.1.2.2. Downstream corporation tax
The downstream element of the supply chain covers activities such as transporting fuel
directly to consumers and the marketing of the final product – including retail supply of
electricity and gas, heating oil, etc. In the case of transport fuels this is often via a service
station, but for most coal, gas and power the energy is commonly transferred to the end user
either directly or via a network of pipelines or distribution grids.
To estimate corporation tax receipts in this segment of the market we have focused on the
retail supply of electricity, gas and coal to both residential and business customers as well as
petrol and gasoline retail markets. We have also estimated corporation taxes from energy
transportation, including electricity transmission and distribution as well as the distribution of
gas through mains pipelines.
Electricity retail
Our central estimate of profitability in the electricity retail market is based on information
published by Ofgem, the UK energy regulator, in relation to the UK domestic market. Ofgem
collects information on electricity and gas suppliers’ costs and prices, and computes estimates
of the net margin on a typical UK household bill on a monthly basis. In December 2011 the
rolling average net margin for a typical household in a year was £30 (€35).130
There are just
over 26 million households in the UK and total domestic electricity consumption was 112
TWh in 2011. These data points imply a profitability of UK residential electricity supply of
approximately €8 million per TWh. Scaling this up to the size of the total EU28 + Norway
residential market, with a total supply of electricity of 845 TWh in 2011, suggests a total
profit of approximately €6.9 billion.
We do not have publicly available information on the profit margins of non-residential
electricity supply. We have therefore assumed that the two markets yield similar profit per
unit of sales, so the net margin on a non-residential electricity bill is similar to that of the
residential market.131
Applying an estimated profit of €8m per TWh to total non-residential electricity consumption
in the EU28 + Norway, gives estimated annual profits in 2011 of €16.6 billion. As a check on
this estimate, we also calculated total revenues from non-residential electricity supply in the
130 We use the rolling average net margin as it reflects the historical average over the previous 12 months, rather than a
spot net margin which is specific to the month in which it is reported.
131 In practice margins on non-residential supply may be lower than for households because the total energy costs of
customers are higher – particularly for the largest and most energy intensive consumers – providing greater incentive
for firms to “shop around” more actively for the best deal. Additionally, large industrial customers with significant
energy needs are often given the option to purchase their electricity directly from the wholesale market, via traders. The
impact of the assumption about the relative profitability of residential and non-residential electricity supply markets is
fairly immaterial in the context of our results.

Energy Taxation & Subsidies in Europe Appendix B
NERA Economic Consulting 82
region, using data on consumption by sector and prices from Eurostat. Total revenues were
approximately €276 billion in 2011. Our estimated €8.3 billion in profits corresponds to a net
margin of approximately 6 percent. Based on our experience in the market, this appears a
representative profit margin, and in fact may be an overestimate (in the UK, for example,
margins have averaged significantly lower in recent years).
Electricity transmission and distribution
The electricity grid provides a network to transport power from generators to consumers. We
include an estimate of corporation tax receipts from operating the grid as it is a key part of the
electricity supply chain, and to provide a consistent approach to the treatment of gas supply.
To approximate the profitability of the electricity transmission and distribution across the
region we rely on information from the Eurostat SBS database. In 2011 gross operating
surplus from electricity transmission in the EU28 + Norway was €11 billion, with a further
€36 billion from distribution. As discussed above, gross operating surplus is an overestimate
of profit as it does not reflect capital expenditures. As an approximation we have assumed
that actual profits relevant to estimating corporation tax are only half what is reported under
gross operating surplus. Applying this factor, we estimate total profits on electricity
transmission and distribution to be approximately €9 million per TWh supplied.
Applying the country-specific corporation tax rates to these profit estimates gives a range of
total corporation tax revenues from electricity retail, transmission and distribution (produced
by oil, gas, coal, wind or solar generation technologies) of between €6.2 and €7.5 billion over
the period from 2007 to 2011. These totals have then been allocated to the different energy
sources according to their share of generation in each country and year.
Gas retail and distribution
Our approach to estimating corporation taxes for the gas retail and distribution market is
similar to the one described above for electricity. Our estimate of supply margins in the
residential sector are again based on Ofgem’s monthly analysis. The 12-month rolling
average net margin for gas supply in the UK in December 2011 was £40 (€46) per year per
typical household.132
Considering the number of households connected to the gas network in
the UK and their total gas consumption, we have estimated profits in this section of the
market of approximately €4m per TWh. Scaling this estimate up to total residential gas
supply in the EU28 + Norway gives an estimated total profit of €4.2 billion in 2011, and
corresponding corporation tax receipts of €1.2 billion.
For the non-residential supply market, as per the approach taken to estimate profits for
electricity supply, we assume that per unit profits are half those earned in the residential
market. We estimate total non-residential profits from gas supply to be €3 billion across the
region, providing a corporation tax estimate of €0.9 billion.
For gas distribution, we again refer to Eurostat SBS data. The gross operating surplus from
gas distribution in the EU28 in 2011 was €13 billion. If we apply a factor of 50 percent to
132 This is generally reflective of net margins over the period from 2007 – 2011 (based on Ofgem data), although net
margins were slightly lower than this level in 2009.

Energy Taxation & Subsidies in Europe Appendix B
NERA Economic Consulting 83
reflect the capital expenditure that reduces the profit relevant to corporation tax, we estimate
total corporation tax receipts from gas distribution to be €1.8 billion.
Downstream coal supply
The majority of coal consumption is in the power generation sector. However, coal is also an
input to industrial processes and there is a limited market for household consumption of coal,
most notably in Poland. We have carried out an analysis of potential corporation tax receipts
from the sale of coal outside of the electricity sector. Our analysis is based on coal prices
collected from the IEA Data Services and consumption across different sectors, reported by
Eurostat. We have not identified public estimates of the average profit margin made by coal
supply firms. If we assume a retail net margin of 2 percent our analysis suggests total profits
between €186 and €237 million from 2007 to 2011.133
Our estimates for likely corporation
tax receipts therefore are in the range of €43 - 55 million over the period. We therefore
assume that downstream coal supply provides an immaterial contribution to corporation tax
receipts and exclude them from our main results.
Gasoline and diesel retail
The majority of the downstream petroleum market is made up of sales of gasoline and diesel
fuel used for transportation. We have reviewed information regarding the profitability of
filling stations. Retail supply of gasoline and diesel is a particularly competitive market with
low per unit profit margins. However, large volumes of fuel are sold.
The principal data source that we rely on for our estimate is a report by CBRE, a commercial
property consultancy with significant experience in the downstream petroleum market.134
CBRE reported estimates of profit per litre from gasoline and diesel sales for fifteen different
European countries.135
We have compared these profits to end-user prices of gasoline and
diesel published by the European Commission. This implies an average net margin of
approximately 2 percent of gross sales across the countries covered by CBRE’s study. For
comparison, the UK Petroleum Industry Association (UKPIA) publish information on the
spread between the cost of gasoline and diesel from the refinery and the retail price. The data
for 2011 indicated this spread to be 6 percent of the final price. This 6 percent must cover the
cost of transporting fuel from the refinery to a storage facility and then on to the filling
station, marketing and promotion costs, and the operational costs of the filling station.
Anything left over counts towards the retailer’s profit.
Total revenues from the sale of gas and diesel in the EU28 + Norway in 2011 were
approximately €505 billion, based on prices reported by Eurostat and consumption
information from the European Commission Oil Bulletin. Assuming a net margin of 2 percent
suggests EU-wide profits from the supply of gasoline and diesel of €10.4 billion. Applying
133 Even if the profit margin were up to 5 percent of the value of the coal, which is a high margin for the retail of a
commodity, resulting corporation taxes would remain immaterial in the context of our study.
134 CBRE. Market View: European Petroleum Retail Sector. September 2012.
135 The countries include: Austria, Belgium, Bulgaria, Czech Republic, Denmark, France, Germany, Hungary, Italy,
Netherlands, Norway, Poland, Slovakia, Switzerland and the United Kingdom.

Energy Taxation & Subsidies in Europe Appendix B
NERA Economic Consulting 84
the relevant corporation tax rates for each country, we have estimated the contribution to
corporation tax revenues across the region to be of the order of €2.9 billion.
B.1.2.3. Summary of corporation tax receipts
We have reviewed the supply chains of the different energy sources and identified the most
significant areas of profitability. Assessing profits and corporation tax revenues is
complicated by the fact that companies often operate across various parts of the supply chain.
Information on company profits also is often only partially available in the public domain,
and sometimes is not available at all. The information we have identified has allowed us to
develop estimates of the likely corporation tax revenues from the most significant parts of the
supply chain and to gain a sense of their relative order of magnitude both compared to other
corporation tax contributions as well as to overall government revenues. Our estimates should,
however, be treated with appropriate caution. They represent what we consider to be a
reasonable attempt to estimate government revenues across a relatively diverse range of
economic activities, based on the available evidence from a sample of countries and certain
pan-European sources, and given the extent to which they materially affect the key results of
our investigations. They should not be relied upon for purposes other than those for which we
have developed them, and at a country level they may represent significant over- or under-
estimates. Table B.1 summarises the estimates described in this section for 2011 at the EU28
+ Norway level.
Table B.1 Estimated Corporation Tax Revenues for the EU28 + Norway in 2011
Source: NERA analysis based on various sources outlined in text above
Notes: Oil and gas upstream corporation tax revenues are based on data for the top six
producing countries and have been allocated to the two energy sources in proportion
to their share of total oil and gas production value
The summary in Table B.1 shows that corporation taxes recovered on upstream oil and gas
extraction activities account for a large proportion (around 62 percent) of total corporation
tax revenues across the supply chains of the different energy sources. Excluding upstream
revenues, which are recovered in significant amounts only by a handful of countries that have
significant oil and gas reserves, we have estimated corporation tax revenues for the oil sector
Oil Gas Coal Wind Solar
Part of Supply Chain
Upstream 17 24 - - -
Midstream
Trading - - - - -
Power Generation 0.3 4.4 4.4 1.0 0.3
Storage - - - - -
Refining 0.8 - - - -
Downstream
Electricity retail 0.1 1.5 1.7 0.4 0.1
Power transmission and distribution 0.1 1.6 1.7 0.4 0.1
Gas retail and distribution - 3.8 - - -
Coal supply - - 0.1 - -
Gasoline and diesel retail 2.9 - - - -
TOTAL (incl. Upstream) 21.4 35.8 7.9 1.8 0.5
TOTAL (excl. Upstream) 4.2 11.4 7.9 1.8 0.5
€ billion

Energy Taxation & Subsidies in Europe Appendix B
NERA Economic Consulting 85
of €4 billion; €11 billion for gas; €8 billion for coal; €2 billion for wind and €0.5 billion for
solar. After upstream oil and gas revenues, the most significant contributions come from
power generation (split among the relevant technologies), electricity and gas supply, and
gasoline and diesel sales.
B.1.3. Excise Duties and Other Energy Taxes
Excise duty tax revenues are the single largest item among the different categories of
government revenues and expenditures that we have reviewed and included in this study.
According to data from Eurostat, the EU28 + Norway raised over €230 billion from energy
taxes in 2011.
By far the most significant component of energy taxes is excise duties. The remainder is
made up of taxes on greenhouse gas emissions, most notably carbon.136
The European
Commission has published excise duty tables showing the revenue collected by all EU
member states on an annual basis from 2008 until 2012. The tables provide tax receipts from
excise duties applied to different types of fossil fuel energy sources - including fuel oil, LPG,
gasoline, diesel, natural gas, coal and coke - as well as electricity.137
This has formed the
basis of our data for this category of government revenue. We have not identified excise duty
receipts, split by fuel, for 2007. Therefore, for 2007 we have taken total energy taxes in that
year, as reported by Eurostat, and allocated them to the different fuels in proportion to the
average split across oil, coal, natural gas and electricity over the years for which we do have
relevant data (2008 – 2011). Croatia and Norway are not included in the excise duties reports.
We have therefore supplemented European Commission data with additional information for
these two countries. For Norway, we relied on overall energy tax data (discussed in more
detail in the following paragraph). We have allocated energy tax revenues to the respective
fuels in proportion to their share of final energy consumption, measured in tonnes of oil
equivalent units.
As excise duties are a subset of total energy taxes, albeit the significant majority, we have
carried out an analysis of the difference between energy taxes reported by Eurostat and the
excise duty revenues reported by the European Commission’s Taxation and Customs Union
Directorate General (DG TCU). In theory total energy taxes reported by Eurostat should
equal excise taxes plus additional energy taxes and carbon taxes. Between 2008 and 2011 we
have estimated that the auctioning of carbon allowances under the EU ETS raised revenues
ranging from €1 – 1.3 billion.138
Other carbon taxes are in place, notably in Scandinavian
countries, for which we have not obtained estimates.
136 Taxes on NOx and SOx emissions are generally reported to Eurostat by member countries under the umbrella of
environmental taxes. They are therefore not included among energy taxes. We do not include them within our data as it
is not possible to split revenues from pollution taxes that are not associated with energy (for example NOx and SOx tax
revenues are combined with other taxes such as landfill tax for reporting purposes).
137 See, for example: European Commission Directorate General Taxation and Customs Union. Excise Duty Tables: Tax
receipts – energy products and electricity. July 2013.
138 Based on data reported by the European Environment Agency (EEA) emissions trading viewer, and EUA prices
published by Point Carbon.

Energy Taxation & Subsidies in Europe Appendix B
NERA Economic Consulting 86
In 2011 excise duties, reported by DG TCU, accounted for 94 percent of total energy tax
revenues reported by Eurostat in the EU27.139
Revenues from excise duties are broken down
by fuel type (energy tax revenue data are not reported by fuel type). Because energy tax data
are not split by fuel type and because for some countries the data on excise duty receipts
actually exceeds that of energy tax receipts (as noted in footnote 139), we have chosen to
include only the excise duty data.140
Reported energy taxes for the EU27 + Norway in 2011
were approximately €230 billion, of which €216 billion were collected as excise duties.141
At
the level of the EU28 and Norway, our approach therefore under-reports total energy taxes by
approximately €14 billion.142
Figure B.3 shows the government revenues from excise duties
that we calculate for the different energy sources for 2007 to 2011. Between 84 and 87
percent of all government revenues come from sales of oil-based products, such as gasoline
and diesel.
139 This is representative of the years over which we compared the two data sources. In each year between 2008 and 2011
excise duties made up between 94 and 96 percent of total energy tax revenues. Note that there are a few countries and
years in which the data indicate higher excise duties than energy taxes in a given year. The difference is generally
within a few percentage points, and we have not attempted to investigate the reasons for the apparent discrepancies.
140 As noted in the previous paragraph, figures for Norway are based on the energy tax data reported by Eurostat, as only
EU countries are included in the DG TUC excise duty receipts data publication.
141 Eurostat data does not include energy taxes paid in Croatia in 2011. As a result we have reported the value for the EU27
here, rather than the EU28. We expect the contribution in Croatia to be negligible relative to the total.
142 Note that this €14 billion would be allocated across the five energy sources.

Energy Taxation & Subsidies in Europe Appendix B
NERA Economic Consulting 87
Figure B.3 Excise Duty and Other Energy Taxes Government Revenues Allocated to
Energy Sources (2007-2011)
Source: DG TCU (excise duty revenues) and Eurostat (energy taxes and electricity generation). Notes: 1. Allocation among fuels for 2008 – 2011 based on excise duty tax receipts in each year;
2. 2007 data based on average 2008-2012 allocation for each country; 3. Norway data based on energy tax receipts; 4.The“Electricity– Other”categoryrepresentstheshareofelectricitygeneratedbysourcesother than oil, gas, coal, wind and solar. It is shown here for completeness but is excluded from our main results.
As well as including energy taxes collected on the consumption of coal, oil and gas, we have
also included those collected on the consumption of electricity. Electricity excise duties are
relatively small compared to oil and gas revenues, but are nonetheless significant and higher
than the corresponding tax receipts on coal consumption (as shown above in Figure B.3) . We
have allocated excise duties associated with electricity consumption to each energy source
based on its share of electricity production in the relevant year and country. For example, in
2011 excise duties collected on the sale of electricity in Germany were €7.2 billion.
Electricity generated from wind turbines in 2011 accounted for approximately 9 percent of
total electricity output. We therefore allocated just over €600 million (€7.2 billion x 0.09) of
excise duty revenue to wind in Germany in 2011.143
143 The share of electricity generation by technology/fuel for each country and year were obtained from Eurostat. Note that
we do not include all excise duties from the sale of electricity, as our study does not include a range of different
technologies and fuels used to generate electricity, such as nuclear, hydropower, or biomass power generation.

Energy Taxation & Subsidies in Europe Appendix B
NERA Economic Consulting 88
B.1.4. Value Added Tax
After excise duties, value added tax (VAT) on the different energy sources is the second
largest single line item contributing to government revenues. We estimate that annual VAT
contributions to government revenue across the different energy sources range between €127
and €162 billion from 2007 to 2011. VAT is applied to the final price of a good or service.
The rate of VAT varies across countries, and within countries it can also vary by the product
type. For example, in the UK the sale of gas and electricity to domestic customers is subject
to a lower rate of VAT (5 percent) than the standard rate applied to many other goods and
services in the economy (currently 20 percent). VAT rates have also varied over time.
We are not aware of any single data source that breaks down VAT revenues by product type
(or by energy source) across Europe.144
To calculate an estimate of VAT revenues we have
relied on a variety of different data sources, as well as selected assumptions. The three
principal pieces of information required in order to estimate VAT revenues are:
VAT rates, expressed as a percentage, applied to different energy products over recent
years for each country considered in this study;
The final price of the different energy products, inclusive of VAT, for each country and
year;
Final consumption of the different energy products for each country and year.
Both standard and sector specific ‘lower’ rates of VAT are published by the European
Commission.145
Most countries apply a similar rate across all goods and services in the
economy. However, there are various cases, such as the UK residential market, in which
energy is subject to a reduced rate of VAT. Based on the European Commission,
supplemented with country specific research, we created a database with the VAT rate in
each country between 2007 and 2011 applied to petroleum products, natural gas, coal and
electricity.
We obtained price information from a variety of sources. Where possible we collected price
information for both domestic and business consumers. This is because prices differ across
consumer groups and because, in certain instances, VAT rates also differ. End user prices for
natural gas and electricity, for each country in the EU, are published by Eurostat. These are
broken down into residential customer prices and industrial user prices. We used price
information for petroleum products reported in the European Commission’s Oil Bulletin,
supplemented in the case of Norway with data from the Norwegian Petroleum Institute
(Norsk Petroleumsinstitutt).146
In our analysis we used prices for gasoline, diesel, fuel oil,
144 We have reviewed VAT receipts from various individual country tax and customs authorities in Europe for comparison.
In certain cases VAT receipts from petroleum product sales are available, however these tend to be net of
reimbursements made to businesses (for example VAT receipt data on oil products in France obtained from the French
Customs Authorities, CPDP, is approximately 20-30 percent lower than our estimates, which we understand to be
because it excludes receipts from commercial transporters who receive VAT reimbursements).
145 European Commission. Vat Rates Applied in the Member States of the European Union as at 1 July 2013; Eurostat.
Taxation Trends in the EU. 2013 edition.
146 European Commission DG Energy. Market Observatory & Statistics. Oil Bulletin. Available here:
http://ec.europa.eu/energy/observatory/oil/bulletin_en.htm; and Norsk Petroleumsinstitutt. Norsk forbrukerpriser -
årsgjennomsnitt. Available at http://www.np.no/priser/

Energy Taxation & Subsidies in Europe Appendix B
NERA Economic Consulting 89
heating oil, and LPG in each country. Public information on coal prices in different EU
countries is less readily available. We sourced coal prices from the IEA for some countries,
covering end user prices for domestic consumers, prices for industrial users and the price paid
for power generation supplies. These data are incomplete. For some countries we only
obtained prices for particular customer segments. In this case, we applied an average
adjustment factor, derived from other countries with more complete data, to infer, for
example, domestic prices from industrial prices. For countries where we were unable to
obtain price data, we have estimated average prices based on those reported for neighbouring
markets.
Final consumption information for each fuel (the different petroleum products, natural gas,
solid fuels and electricity) was sourced from Eurostat, the EU Oil Bulletin and Norsk
Petroleumsinstitutt (for Norwegian petroleum product consumption). We extracted
consumption data by consumer segments, enabling us to obtain the respective split between
domestic and non-domestic sectors for each fuel type.
Based on these data we then calculated the estimates for government revenues from VAT
following the four steps outlined below. For each country, year, fuel type and customer
segment (residential and non-residential), this involved:
1. Starting with the end-user fuel price per unit, inclusive of all taxes;
2. Identifying the per unit VAT component of the final price, based on the country- (and
fuel-) specific VAT rate;
3. Multiplying the per unit VAT component of the end-user price (2) by the final
consumption of the product.147
Our estimates indicate total VAT receipts across the different energy sources of €162 billion
in 2011. As per our approach to treating excise duties collected on the sale of electricity, we
have allocated the estimated VAT from electricity consumption in proportion to each fuel’s
share of electricity production in the relevant year and country.
In many countries the end user electricity price faced by households and industry includes an
element that is used to provide support to renewable generators. For example, in Germany a
line item on the electricity bill is specifically used to cover the cost of the EEG (the
renewable support scheme in Germany). An alternative approach to allocating the VAT from
electricity sales across the five energy sources would deduct the VAT on this part of the end
user electricity price and, instead, allocate it to the different renewable technologies that it is
used to support. This method should provide results similar to estimating VAT in proportion
to the total revenues of power generators using different technologies, rather than only the
revenues from the electricity market. Adopting this alternative approach would reduce by
approximately €3.6 billion the VAT revenues allocated to oil, gas and coal and would add
approximately €0.8 billion of revenue to wind and over €2 billion to solar. When measured in
terms of barrels of oil equivalent of primary energy consumption our estimates indicate that
wind revenues might increase by approximately $9 per boe and solar revenues by
147 We have not included as “consumption” the transformation of energy products, such as power generation or coke
production, due to data availability. Also, in many countries input fuels to power generation are not subject to VAT.

Energy Taxation & Subsidies in Europe Appendix B
NERA Economic Consulting 90
approximately $100 per boe.148
However, in our main results we adopt the approach of
allocating revenues from sales of electricity to each energy source in direct proportion to their
share of generation, as outlined above, because this approach reflects better the value of the
final end-use product, which is electricity.
B.2. Estimating Government Expenditures and Mandated Transfers
Combined government expenditure on the different energy sources is significantly less than
government revenues received through taxation. However, government spending is heavily
weighted towards wind and solar energy sources and, to a lesser extent, coal. We have
estimated total government expenditures of approximately €30 billion in 2011, which can be
broken down to: €0.2 billion for oil, €0.4 billion for gas, €3.8 billion for coal, €8.9 billion for
wind; and €16.7 for solar. Our analysis has also estimated the corresponding values for the
years 2007-2010.
In estimating government expenditure in the oil, gas and coal sectors we have relied heavily
on the OECD inventory of fossil fuel support as well as the complementary work carried out
by the IVM, on behalf of the European Commission, covering the remaining EU countries
that are not OECD members.149
We have reviewed this work in detail, examining each line
item within the inventory to validate its compatibility with our approach to measuring
government expenditures. The majority of the inventory, both in terms of line items and value,
relates to tax expenditures. As described in the methodological section of this report
(Chapter 3 above) tax expenditures are not relevant to our analysis as they rely on country-
and fuel-specific benchmark tax rates that cannot be compared in the way that is required for
our work. For those line items that do relate to direct government expenditure we have
segmented them into different categories corresponding to different parts of the supply chain
as well as particular types of support that do not directly impact on current production or
consumption.
It is important to note that the OECD inventory is incomplete due to data availability issues
(something the OECD authors are careful to acknowledge). Where possible the OECD
carried out estimations of support levels, however this was not feasible in all instances.
Where data were noted as unavailable we have not attempted to estimate such support
ourselves, as in most cases the amounts are likely to be immaterial, and it is beyond the scope
of our study to carry out a detailed country-by-country review of individual tax items.
We supplement the OECD work with certain additional areas of support that we have
reviewed and consider to warrant inclusion. This includes R&D support for the different
energy sources.
We have estimated the financial support to wind and solar generators provided through Feed-
in-Tariffs and supplier obligation or quota schemes, as well as further support provided
148 Under this alternative approach total net government revenues and mandated transfers across all revenue and
expenditure categories for wind would increase from -$13 per boe (under our standard approach) to approximately -$4
per boe. Total net revenues for solar would increase from -$821 to -$610 boe.
149 Croatia is the only exception to this coverage as they have only recently joined the EU. We have not attempted to
review government support in Croatia.

Energy Taxation & Subsidies in Europe Appendix B
NERA Economic Consulting 91
through electricity grid reinforcement. We also consider non-financial support to renewables
provided through priority grid access, but we find this not to exceed our materiality
thresholds. In the following paragraphs we summarise the data and sources of the different
categories of expenditure included in our report.
B.2.1. Resource Extraction Support
Support for resource extraction is taken from the OECD inventory and is exclusively received
by the coal sector. In several European countries coal extraction is loss-making and has been
supported by governments in order to promote energy security and to manage the declining
competitiveness of the sector relative to imports. We have validated the data in the OECD
inventory against State Aid to coal mining that is reported by the competition authority of the
European Commission.150
The two sources are broadly consistent and we have relied on the
OECD inventory because it provides a more detailed breakdown of the different types of
payment. In all countries support is in the process of being phased out under EU rules.
However, significant transfers have been made over the period of our assessment, most
notably in Germany and, to a lesser extent, Spain. Between 2007 and 2011 support to the
German coal mining industry ranged between €1.5 to €2.5 billion, which was approximately
80 percent of the total coal extraction support across the region.
B.2.2. Electricity Generation and Supply and other Midstream Sectors
B.2.2.1. Electricity Generation Support
The most significant ‘government expenditure’ on the energy sources covered by this study is
support to wind and solar power generation technologies. As discussed in the main report
(section 3.3.3) payments to the wind and solar sector are not, in fact, always in the form of
direct payments from the government. Support is also provided via policy obligations on
electricity suppliers to source a certain quota or share of power from renewable sources. Here
we consider both forms of support; direct payments and supplier obligations, to constitute
government expenditure.
We have relied upon data on renewable energy support for each country collected by the
Council of European Energy Regulators (CEER). CEER have undertaken two surveys of
their members, requesting data on the rates of support for different renewable technologies,
the electricity output supported and total support costs in a given year. These two reports
were published in 2011 and 2013 and include renewable support estimates for the three years
from 2009 to 2011.151
The CEER data on total support costs covers 16 countries for 2009 and 18 countries for 2010
and 2011. Whilst several countries did not provide cost data to the CEER, the figures
represent approximately 88 percent of wind and 95 percent of solar output in the EU28 +
Norway, which we consider to provide sufficient coverage from which to derive a reasonably
150 DG Competition. State Aid to coal mining by Member State (2006-2011). Available at:
http://ec.europa.eu/competition/state_aid/studies_reports/expenditure.html
151 CEER. Report on Renewable Energy Support in Europe. May 2011; CEER. Status Review of Renewable and Energy
Efficiency Support Schemes in Europe. June 2013.

Energy Taxation & Subsidies in Europe Appendix B
NERA Economic Consulting 92
accurate estimate of support. The data that we report, obtained from the CEER, covers
support via Feed-in-Tariff (FIT) or supplier obligation schemes.152
The 2009 data excludes
any additional support provided to the sector in the form of investment grants or loans.
However, the data for 2010 and 2011 does include grant support. Any such one-off payments
are spread across the lifetime of the asset in order to prevent distortions in inter-temporal
comparisons and provide equivalent treatment to that of FIT payments.
Across the countries covered by the CEER reports, total RES support in 2009 was estimated
at €19 billion, rising to €34 billion in 2011. Wind and solar accounted for just over half of all
renewables support in 2009, increasing to approximately 60 percent in 2010 and almost 70
percent in 2011 as solar deployment, which receives one of the highest levels of support per
unit of output, has expanded. These figures are higher than EU level estimates over the same
period referenced by the European Commission in their impact assessment of the proposed
energy and climate change policy framework to 2030.153
We have not identified any more
detailed information about the European Commission approach to calculating these amounts,
and therefore rely exclusively on the CEER data in our analysis.
For those countries included in the CEER dataset that have support information for only
certain years, we have applied the technology specific average per unit support rate from the
year’s in which we have observations to the wind and solar output in the year’s lacking data.
We have calculated the average technology specific support rate across the countries covered
by the study. For the countries that are not included in either CEER report, we have then
applied this average rate to wind and solar output respectively to create an estimate for
support.
As we noted in the government revenue section, the UK applies a Climate Change Levy
(CCL) to sales of electricity, as well as other energy types, to business consumers. Renewable
electricity, that is approved and certified, is exempt from the CCL. The energy regulator
awards Levy Exemption Certificates (LECs) to renewable power generators for every MWh
of output produced that can then be used to avoid payment of the CCL. These certificates
therefore hold an implicit value and are used as an additional means to support renewable
technologies in the UK. We have used data published by HMRC to derive the number of
LECs awarded to wind and solar generators between 2007 and 2011. LECs are often sold
alongside the power that they correspond to, so their price is not publicly observable.
However, we estimate their value to be the rate of CCL as this is the price a consumer would
have to pay without a LEC. It therefore represents the maximum willingness to pay of a
business consumer and is an appropriate estimate of value given that there has been excess
demand for LECs over the period considered.
152 Note, the support under FIT regimes is calculated as the FIT payment, per unit of output, minus an estimate of the
average baseload electricity price over the relevant period (as this proxy for the value of the electricity would otherwise
be earned by the generator). The support under a supplier obligation scheme is calculated by multiplying the number of
RECs or ROCs awarded by an estimate of the market price for these certificates.
153 The European Commission cite RES support in the EU of €13.7 billion in 2009, €18.6 billion in 2010 and €30.1 billion
in 2011. These numbers are not broken down by country or by technology. (European Commission. “Impact
Assessment: A policy framework for climate and energy in the period from 2020 up to 2030.” 22 January 2014.

Energy Taxation & Subsidies in Europe Appendix B
NERA Economic Consulting 93
In addition to renewable electricity generation support, the OECD inventory also identifies
several cases of support for coal and gas power generation. Support is relatively minor -
between 2007 and 2011 total support has ranged between approximately €100 and 700
million – and is largely allocated to the coal sector, where Poland is the most significant
contributor. Similar to the case of support for coal extraction, these transfers tend to support
struggling coal power plants that have obligations to use a certain quota of domestically
produced fuels. There is also minor support, via a FIT scheme, to natural gas power
generation with Combined Heat and Power (CHP) technology in Slovenia.
B.2.2.2. Priority Grid Access
In addition to support through FITs or RECs, renewable electricity generators in some
European countries also receive non-financial benefits through provisions granting “priority
access” to the power grid. Priority grid access provides support to electricity generators and
imposes a cost on the wider industry – and is therefore similar to other mandated transfers.
CEER (2013) reports that nine EU countries provide priority grid connections and twelve EU
countries provide priority grid access to renewable energy generators.154
Estimates of the total value of these provisions are difficult to come by. One way of
estimating their value is to consider what renewable generators would have to pay in a
competitive market for contractual terms that secured priority access to the grid. An
indication of the cost of such contracts can be deduced from the terms agreed between
renewable generators and the retail suppliers to whom they sell their power to gain access to
final customers. Recent National Grid analysis for the UK Department of Energy and
Climate Change (DECC) has examined the discounts, relative to the wholesale market price,
that are typically agreed between intermittent renewable generators in the UK and retail
suppliers under power purchase agreements that provide a firm commitment to buy all power
produced by the renewable generator. DECC’s research suggests that the size of this discount
ranges from 5 to 13 percent of the wholesale electricity price.155
We have investigated the importance of priority grid access for renewable electricity
generators in Europe based on this information. Applying a 5-13 percent discount to a
snapshot of 2011 wholesale electricity prices in the twelve countries that provide priority grid
access to renewable energy sources suggests that the total annual value of this policy across
Europe might have ranged between €300 and €900 million. This is approximately between 1
and 4 percent of the total support that we estimate based on CEER’s analysis in 2011 (€23
billion). We have not attempted to develop more detailed estimates of the total value of this
support.
154 The countries that provide priority grid access are: Belgium, the Czech Republic, Germany, Greece, Hungary, Italy,
Lithuania, Netherlands, Poland, Romania, Slovakia and Spain.
155 National Grid EMR Analytical Report, December 2013, Annex 7
(https://www.gov.uk/government/uploads/system/uploads/attachment_data/file/267614/Annex_D_-
_National_Grid_EMR_Report.pdf).

Energy Taxation & Subsidies in Europe Appendix B
NERA Economic Consulting 94
B.2.2.3. Grid Infrastructure Investment Support
In this section we consider investments in the electricity transmission and distribution grid.
The cost of maintaining and developing the electricity grid is ultimately borne by electricity
consumers, although the precise means of allocating the direct and indirect costs of the
network among different producers and different types of consumer varies across countries.
Transmission system operators (TSOs) invest significant amounts in order to improve the
condition of the network and to manage connections between generating plants, midstream
infrastructure, and customers. Existing power grids in the EU were commonly designed
around a limited number of conventional thermal power generation plants that produce large
amounts of electricity on one site. In recent years the power generation mix has begun to shift
away from thermal generation towards smaller scale renewable plants, which are spread
across many sites in different locations, and this may impose pressures on the network.
The cost that a particular type of generation technology imposes on the grid can depend on
the state of the infrastructure that is in place and the location of the capacity. This varies both
between countries and also within them. Wind and solar technologies may impose a higher-
than-average cost on the grid for two main reasons. Wind farms are often located in remote
areas (including at sea) where wind conditions are optimal, but which tend to be far removed
from demand. In recent years this has required new connections to be developed between the
supplier and the customer. Additionally, wind and solar technologies are intermittent -
meaning that they only generate some of the time, dependent on the strength of the wind and
sun – which may impose additional system costs in terms of reinforcement, balancing and in
requiring increasing amounts of more expensive back up capacity to be available.
The cost of connecting any new generating capacity is ultimately borne by customers, but
depending on the regulatory regime for transmission pricing and cost allocation, the addition
of wind and solar capacity may result in consumers bearing higher transmission and
distribution costs than would be the case if more conventional forms of capacity were
connected. Whether this is categorised under our methodology as a form of government-
mandated transfer depends on the details of the regulatory frameworks. For example, under a
transmission charging regime in which renewables generators must pay for the full
incremental transmission costs that they impose on the grid (including not only their
connection costs, but also the costs of any grid reinforcement that is required to manage
intermittent generation), then for any capacity to be built in the first place, the support that it
receives from government (through FITs, green certificates, and the like) must be enough to
cover the costs that it must pay to the TSO / network. In this case, the FIT or certificate
support captures all of the mandated government transfer. On the other hand, under a
charging regime in which any (RES) generating source must be connected, and any
connection (or other system) costs are simply pooled to be recovered from customers, this
amounts to an additional transfer from customers that has not been reflected in the
government’s main RES support instrument. In the latter case, not accounting for the network
costs might be considered to underestimate the value of the support afforded by government
policy. However, any judgment of support here would first require an endorsement of one or
another “standard” way of allocating costs for network services, which we have sought to
avoid in other contexts for our analysis.
The estimation of the incremental cost, if any, imposed by intermittent wind and solar
generation technologies often requires detailed and complex system modelling. We are not

Energy Taxation & Subsidies in Europe Appendix B
NERA Economic Consulting 95
aware of pan-European data sources available to assist in informing the likely magnitude of
such costs. Various studies forecast necessary spending on upgrading the electricity network
across Europe over the coming decades, but these relate to expected future costs.156
These
studies provide forecasts for future investments, in a world with significantly more
intermittent generation, higher overall electricity demand and sophisticated “smart” grids,
whereas we are interested in the actual spending made by TSOs over the past five years.
Between 2007 and 2011 solar output across the EU28 + Norway has risen by approximately
42 TWh and wind output by 75 TWh. These increases are significantly below the increases in
the Power Perspectives modelling (one-seventh what is projected in the future for solar, and
around 40 percent of what is projected for wind). A crude scaling of the estimated network
costs of €0.1 billion per TWh per year estimated in the Power Perspectives analysis would
suggest that the annual incremental cost imposed by wind and solar on grid investments is
likely to have been of the order of up to €3.5 billion, and possibly significantly less.157
We have not identified relevant data of a pan-European nature that explicitly highlights any
incremental cost imposed on the grid by additional solar and wind capacity between 2007 and
2011. For this reason, and because of the risk of double-counting government-mandated
transfers that are in fact already reflected in estimates of core EU RES support mechanisms,
we do not include any values of such support within our dataset. With significant grid
upgrades expected over the coming years, this may well become a more important item of
support in future years.
156 Examples include the European Commission impact assessment on a proposal for trans-European energy infrastructure
(2011), and ‘Power Perspectives 2030’, a contributing paper to the European Climate Foundation’s (2011) Roadmap
2050. According to the former approximately €140 billion of spending is required in the EU by 2020 (i.e.,
approximately €17 billion per year) on high voltage transmission and smart grid applications at both transmission and
distribution level, on top of maintenance and refurbishment costs. The ‘Power Perspectives’ report expects that the
required spending from 2020 to 2030 on the transmission grid could be as much as €138 billion in a high RES scenario,
or around €14 billion per year. This is around one-tenth of the capital expenditure that is expected to be required for
generation assets during the period. However, much of the grid costs would go to replace outdated grid infrastructure
and is intended to improve connectivity between countries irrespective of the use of RES generation capacity, which is
spending that is not relevant to our study.
The Power Perspectives report models various scenarios. In their base case (“On Track”) it forecasts €68 billion worth
of capital expenditure from 2020 to 2030 in the case where the RES share of total generation is 50 percent in 2030. The
report also considers a “High RES” scenario in which the RES share reaches 60 percent in 2030, with an additional 290
TWh of solar and 190 TWh of offshore wind, relative to the base case. The investment required in the transmission
network over the ten years between 2020 and 2030 in this High RES scenario is expected to be approximately €70
billion higher, at €138 billion.
European Commission working paper. “Impact Assessment accompanying the document: Proposal for a Regulation of
the European Parliament and of the Council on guidelines for trans-European energy infrastructure and repealing
Decision No 1346/2006/EC”. October 2011; and, European Climate Foundation. Power Perspectives 2030: On the road
to a decarbonised power sector. November 2011.
157 This tentative analysis is based on a linear relationship between additional renewable capacity and the required
investment in the grid. In practice the relationship is unlikely to be linear, because below certain penetration levels, the
system impacts of intermittency are more limited. These impacts may have begun to be relevant (at the time of writing)
in some EU countries with high RES penetration, but we suspect that they have not yet been very significant.

Energy Taxation & Subsidies in Europe Appendix B
NERA Economic Consulting 96
B.2.2.4. Other Midstream Support
The only additional government support for midstream activity that we have identified is
provided to Spain. Minor payments are made to support the transportation of coal, as well as
coal stockpiling at power stations in order to ensure sufficient reserves at the plant to fuel
power generation for a given number of days. Data points are taken from the OECD
inventory. Total support for both stockpiling and transportation ranged between €10 and €26
million from 2007 to 2010 and were zero in 2011. These figures are included for
completeness as they form part of the OECD dataset, even though they are immaterial.
B.2.3. Consumption Support
Consumption support in 2011 was €2.4 billion, approximately three quarters of which was
provided to petroleum products, such as transport fuels. Most downstream support in the
OECD inventory is in the form of tax expenditures, which we do not include within our
analysis. However, we do include any tax refunds that are made and these make up by far the
most significant share of this category of expenditure. For example, in France road freight
that can show it purchased diesel within the country is eligible to receive a partial refund on
the excise duty included in the diesel price. This is distinct from a tax expenditure in that the
full excise duty is initially paid and only returned subsequently. However, from the
perspective of incentivizing the use of diesel, it is similar to a tax expenditure. We include tax
refunds principally for consistency as the full tax payment that is initially made is included in
our government revenue data.
Consumption support also includes grants made to support energy use by fuel poor
households that either come directly from government or are funded indirectly through an
uplift on consumer energy bills. Support is also provided to filling stations in remote areas of
France and to subsidise rail transport fuel in Romania, however, these contributions are minor.
We have sourced all data for this category from the OECD inventory.
B.2.4. Historical Liability Transfers
Historic liabilities are exclusively sourced from the OECD inventory and relate to the coal
sector. We have also cross-checked the OECD data with approved State Aid to the coal
mining industry that is reported by the European Commission DG Competition. This
category of government expenditure refers to liabilities incurred by coal producers with
respect to historic production. Examples of support in this area include payments made to
coal miners as compensation for health issues suffered as a result of their working conditions
and as a result of the long term structural unemployment caused by closing down coal
production sites. These payments are approved by the European Commission under State Aid
rules. Other areas of support cover government payments to fund decommissioning of coal
mines and payments made to compensate for environmental damages caused in the past.
Total payments in this category in 2011 were approximately €0.9 million. Germany, Spain,
the Czech Republic and Poland accounted for the majority of these payments.
It is important to note that historic liability transfers do not impact current production levels.
Whilst they do constitute support to the coal industry, and likely reflect an underinvestment
by coal producers in the past, payments are currently made in order to improve social welfare
and not to promote the extraction and use of coal.

Energy Taxation & Subsidies in Europe Appendix B
NERA Economic Consulting 97
B.2.5. Research and Development Transfers
As discussed in the main body of the report, governments make contributions to research and
development (R&D) funding in energy sectors. Government expenditure on energy-related
R&D represents a demand on the public budget. The OECD inventory, which we have relied
on as our principal data source for government expenditures, includes very limited coverage
of R&D support. We have investigated the size of such transfers focusing on specific
countries, using the IEA’s country-specific Energy Policies reviews as well as the
IEA/OECD database of R&D spending.
The IEA/OECD database of R&D support provides a breakdown of government expenditure
on R&D in the energy sector, broken down into different energy sources.158
The data are
collected by the IEA from its members via a questionnaire, circulated to the relevant
government departments responsible for reporting this information. The coverage of the data
is limited to OECD members and, of those, various data points are not reported.159
We have
taken the available estimates for R&D spending in the following sectors: coal, oil & gas,
wind, solar and carbon capture and storage technology (CCS).
To reflect expenditure by those countries that are not in the IEA/OECD database, or that are
missing data points, we have calculated the average spending on each sector over time and
across countries as a fraction of total GDP. We have then used these fractions to estimate the
average expenditure in each energy category across each country for which data are missing.
For example, R&D spending in the wind sector across the 15 countries for which the
IEA/OECD database includes estimates totalled €160 million in 2011. These countries
accounted for a combined GDP of €11.9 trillion in the same year. We then apply the share of
wind R&D in total GDP (0.001 percent) to the GDP of countries with missing data to arrive
at an estimate of expenditure on wind R&D.160
The oil and gas sectors are not separated within the IEA/OECD database. Across all countries
in the study, our estimate for 2011 spending specifically on the combined oil and gas sector is
€161 million. We have split the total for each country based on each energy source’s relative
share of domestic production, measured in tonnes of oil equivalent. In 2011 this leads to €94
million allocated to oil and the remaining €67 million allocated to gas. Because CCS has the
potential to support large-scale fossil fuel combustion across any of the three main fossil fuels,
we have then allocated total CCS R&D spending (€122 million in 2011 for EU28 + Norway)
to each of the fuels in proportion to its share of electricity generation in each country.161
158 The database is available via the OECD iLibrary here: http://stats.oecd.org/BrandedView.aspx?oecd_bv_id=enetech-
data-en&doi=data-00488-en
159 There are 7 countries covered by our study that are not OECD members. These are: Bulgaria, Romania, Croatia, Cyprus,
Malta, Latvia and Lithuania.
160 This approach implicitly assumes that R&D spending is proportional to GDP and the average across the countries for
which we have data provides a representative split for the energy sectors that receive the funds.
161 CCS spending will not necessarily benefit the different energy sources in direct proportion to their current share of
electricity generation. For example, it may disproportionately benefit the coal sector due to the higher carbon content of
coal per unit of energy. CCS technology is also likely to be used in areas other than electricity generation, notably in
energy-intensive industry where combustion takes place on site. However, absent further information on the precise
beneficiaries of CCS R&D funding we have chosen the approach of allocation based on electricity generation. The

Energy Taxation & Subsidies in Europe Appendix B
NERA Economic Consulting 98
Table B.2 provides a breakdown of the allocation of R&D support to the different energy
sources, including the respective shares of the contribution towards CCS.
Table B.2 R&D Support Estimates for EU28 + Norway (2007-2011)
Source: IEA/OECD Database on R&D budgets; IMF World Economic Outlook Database
(GDP estimates) and NERA analysis.
Total R&D support across all years and all energy sources ranges between €594 million in
2007 and €834 million in 2011. This is relatively small in the context of total government
revenues and expenditures, although it is more significant when compared to other
expenditures. Solar technology consistently receives the highest level of support, with the
relative ordering of the other energy sources varying by year.
expenditure is relatively small in the context of total R&D spending on the energy sources and an immaterial data item
in the wider context of our study.
2007 2008 2009 2010 2011
Energy Source
Oil 147 145 118 118 98
Gas 117 126 127 129 146
Coal 86 92 93 69 76
Wind 62 85 103 168 176
Solar 182 276 257 289 338
TOTAL 594 723 699 773 834
€ millions

Energy Taxation & Subsidies in Europe Appendix C
NERA Economic Consulting 99
Appendix C. Shadow Price of Carbon Used in the Study
C.1. Overview of Approaches
There are different approaches available for deriving an estimate of the value of the negative
externality associated with greenhouse gas (GHG) emissions (commonly referred to as the
shadow price of carbon) for use in policy discussions. Two approaches frequently used are:
the social cost of carbon approach, which reflects estimates of the marginal damage to
society caused by emissions. For example, this approach is used by the United States
Environmental Protection Agency (EPA);
the abatement cost approach, which reflects the expected cost of reducing emissions to
achieve an overall target emission level selected to achieve a politically or socially
accepted level of risk related to climate change. This approach is used by the UK
government in its policy and investment appraisal framework.
Social cost of carbon estimates are derived from models that are subject to a high degree of
uncertainty, and the academic and policy literature contains a large number, and a wide range,
of estimates. Abatement costs are often estimated by comparing the relative costs of
technologies that deliver the same product or service but with different carbon intensities, so
the uncertainty associated with these estimates is typically lower – although they can also be
very uncertain, particularly when projecting costs far into the future. Additionally, abatement
costs also may be inferred from market data for emissions that are covered by a cap and trade
system, where the cost of allowances provides a natural estimate of the target-consistent
abatement cost. There are different cap and trade systems that may be considered relevant to
this study, among them the EU ETS and the emissions trading system established under the
Kyoto Protocol.
For the present work, we provide a brief survey of approaches to estimating the shadow price
of carbon, drawing on examples of both the social cost of carbon and the abatement cost
approach. In addition, we have also reviewed market data on emissions allowances in the EU
ETS. We discuss some of the widely used estimates in the following section.
C.2. Review of Estimates Available in the Literature
C.2.1. The United States Environmental Protection Agency
The US EPA conducted significant work in 2010162
to bring together estimates of the social
cost of carbon that had been estimated using three different Integrated Assessment Models
(IAMs).163
In 2013, the EPA published an update of its collected estimates of the social cost
of carbon, following revisions to the underlying models.164
162 EPA (2010), “Technical Support Document: Social Cost of Carbon for Regulatory Impact Analysis”, February 2010
163 The three IAMs used by the EPA are DICE, FUND and PAGE.
164 EPA (2013), “Technical Support Document: Social Cost of Carbon for Regulatory Impact Analysis”, November 2013
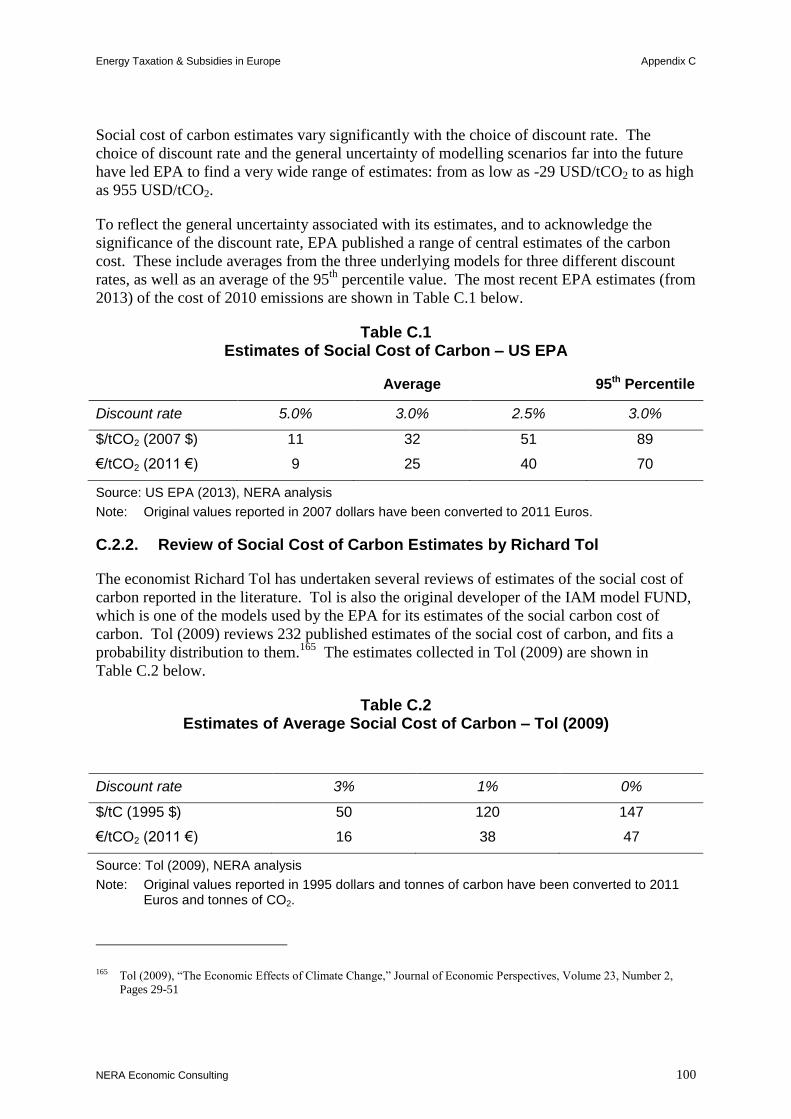
Energy Taxation & Subsidies in Europe Appendix C
NERA Economic Consulting 100
Social cost of carbon estimates vary significantly with the choice of discount rate. The
choice of discount rate and the general uncertainty of modelling scenarios far into the future
have led EPA to find a very wide range of estimates: from as low as -29 USD/tCO2 to as high
as 955 USD/tCO2.
To reflect the general uncertainty associated with its estimates, and to acknowledge the
significance of the discount rate, EPA published a range of central estimates of the carbon
cost. These include averages from the three underlying models for three different discount
rates, as well as an average of the 95th
percentile value. The most recent EPA estimates (from
2013) of the cost of 2010 emissions are shown in Table C.1 below.
Table C.1 Estimates of Social Cost of Carbon – US EPA
Average 95th Percentile
Discount rate 5.0% 3.0% 2.5% 3.0%
$/tCO2 (2007 $) 11 32 51 89
€/tCO2 (2011€) 9 25 40 70
Source: US EPA (2013), NERA analysis
Note: Original values reported in 2007 dollars have been converted to 2011 Euros.
C.2.2. Review of Social Cost of Carbon Estimates by Richard Tol
The economist Richard Tol has undertaken several reviews of estimates of the social cost of
carbon reported in the literature. Tol is also the original developer of the IAM model FUND,
which is one of the models used by the EPA for its estimates of the social carbon cost of
carbon. Tol (2009) reviews 232 published estimates of the social cost of carbon, and fits a
probability distribution to them.165
The estimates collected in Tol (2009) are shown in
Table C.2 below.
Table C.2 Estimates of Average Social Cost of Carbon – Tol (2009)
Discount rate 3% 1% 0%
$/tC (1995 $) 50 120 147
€/tCO2 (2011€) 16 38 47
Source: Tol (2009), NERA analysis
Note: Original values reported in 1995 dollars and tonnes of carbon have been converted to 2011 Euros and tonnes of CO2.
165 Tol (2009), “The Economic Effects of Climate Change,” Journal of Economic Perspectives, Volume 23, Number 2,
Pages 29-51

Energy Taxation & Subsidies in Europe Appendix C
NERA Economic Consulting 101
C.2.3. The UK Department for Energy and Climate Change
The UK Department of Energy and Climate Change (DECC) publishes estimates of the
carbon price based on an abatement cost approach. Estimates produced by DECC distinguish
between:
the carbon price in “traded” sectors, which corresponds to the price in sectors that are
covered by the EU ETS. The estimates of the carbon price essentially reflect a forecast of
the price for emissions allowances; and
the carbon price in “non-traded” sectors, which corresponds to the price in sectors that are
currently not included in the EU ETS. The non-traded price reflects a number of
components of abatement cost, most notably the cost of the technologies believed to be
required to achieve the emissions reductions assigned to these sectors.
The future forecasts of the traded and untraded carbon costs converge by 2030, but there is a
significant difference in costs over the intervening period. This reflects the current low price
of emissions allowances in the EU ETS. The estimates produced by DECC are used in cost-
benefit analysis by UK government bodies, and have also been used by the European
Environment Agency in its analysis of the cost of industrial emissions in Europe.166
The
latest estimates167
produced by DECC for emissions released in 2010 are reported in
Table C.3 below.
Table C.3 Shadow Cost of Carbon Estimates Reported by DECC
Traded Non-Traded
£/tCO2 (2013 £)
€/tCO2 (2010 €)
£/tCO2 (2013 £)
€/tCO2 (2010 €)
Low 12 14 28 32
Central 12 14 56 65
High 12 14 84 96
Source: DECC, NERA analysis
Note: Original values reported in 2013 GBP been converted to 2011 Euros.
C.2.4. The Market Value of Emissions Allowances
As noted above, the price of emissions allowances in the EU ETS (EU allowance units or
EUAs) provides an estimate of the target-consistent carbon abatement cost for those sectors
that it covers. The average annual price of EUAs between 2008 and 2012 is shown in
Figure C.1 below. Prices generally declined over this period– from around €22/tCO2 in 2008,
to around €13-14/tCO2 in 2009-2011 and even further to around €7/tCO2 by 2012.
166 EEA (2011), “Revealing the Costs of Air Pollution from Industrial Facilities in Europe”
167 Produced by DECC at the end of 2013.

Energy Taxation & Subsidies in Europe Appendix C
NERA Economic Consulting 102
Figure C.1 Average annual EUA prices (2008-2012; nominal)
Source: BlueNext, PointCarbon and NERA calculations.
C.2.5. Other Estimates Used
In addition to the estimates reported above, there are a very large number of studies and
reports that have developed and applied estimates of the shadow price of carbon for policy
analysis. Some particularly relevant examples include:
the European Investment Bank (EIB), which uses carbon prices in its cost-benefit analysis
of projects.168
These carbon prices are based on a review undertaken by the Stockholm
Environment Institute (SEI) and commissioned by EIB, drawing on both the abatement
cost and social cost of carbon literature. The EIB used low, central and high values of 11,
28 and 44 €/tCO2 (in 2011 Euros), respectively, for emissions released in 2010.169
The Intergovernmental Panel on Climate Change (IPCC), which discussed the social cost
of carbon in its 2007 report, noted that estimates of the cost of carbon range from -$10/tC
to $350/tC, with a mean value of $43/tC. 170
Stern (2007),171
which comments extensively on the potential social cost of carbon, and
suggests that it might be around $85/tCO2. The values reported in Stern (2007) have been
168 EIB (2008), “The Economic Appraisal of Investment Projects at the EIB”
169 Based on the original values of 10, 25, and 40 €/tCO2 in 2006 Euros.
170 IPPC (2007), “Climate Change 2007, Impacts, Adaptation, and Vulnerability – Working Group II”, Chapter 20
171 Stern (2007), “The Economics of Climate Change – The Stern Review”
0
5
10
15
20
25
2008 2009 2010 2011 2012
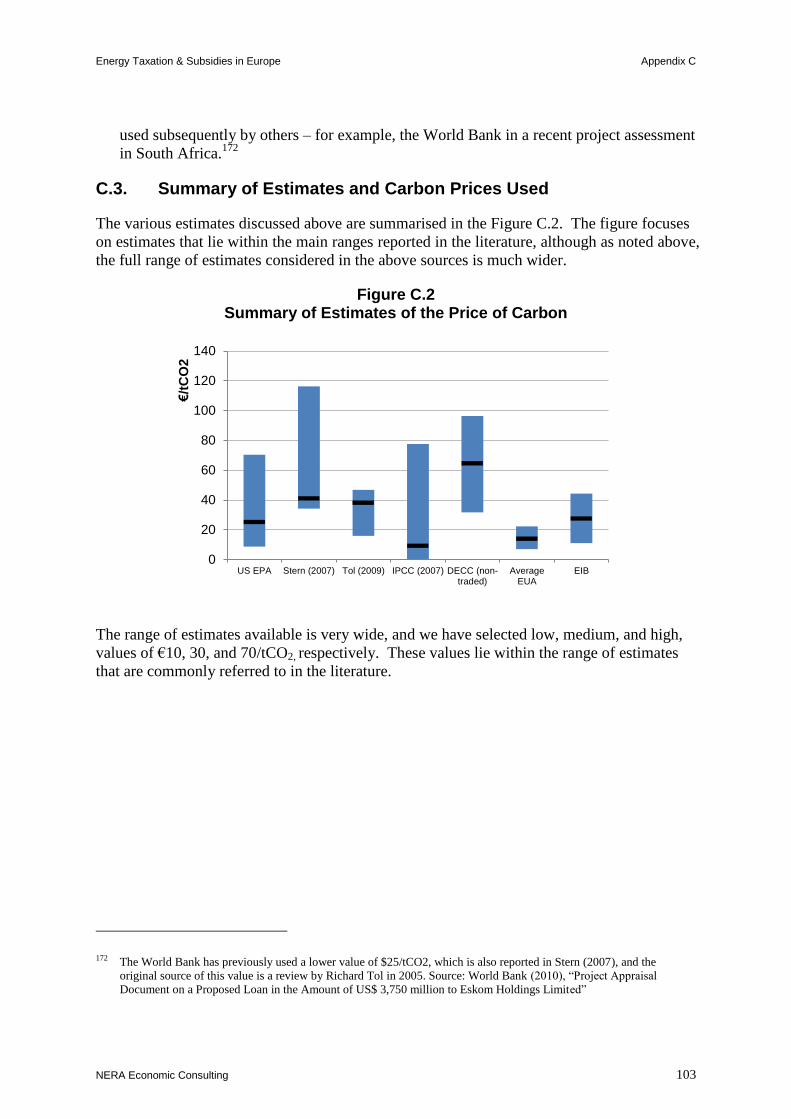
Energy Taxation & Subsidies in Europe Appendix C
NERA Economic Consulting 103
used subsequently by others – for example, the World Bank in a recent project assessment
in South Africa.172
C.3. Summary of Estimates and Carbon Prices Used
The various estimates discussed above are summarised in the Figure C.2. The figure focuses
on estimates that lie within the main ranges reported in the literature, although as noted above,
the full range of estimates considered in the above sources is much wider.
Figure C.2 Summary of Estimates of the Price of Carbon
The range of estimates available is very wide, and we have selected low, medium, and high,
values of €10, 30, and 70/tCO2, respectively. These values lie within the range of estimates
that are commonly referred to in the literature.
172 The World Bank has previously used a lower value of $25/tCO2, which is also reported in Stern (2007), and the
original source of this value is a review by Richard Tol in 2005. Source: World Bank (2010), “Project Appraisal
Document on a Proposed Loan in the Amount of US$ 3,750 million to Eskom Holdings Limited”
0
20
40
60
80
100
120
140
US EPA Stern (2007) Tol (2009) IPCC (2007) DECC (non-traded)
AverageEUA
EIB
€/t
CO
2

Energy Taxation & Subsidies in Europe
NERA Economic Consulting 104
Report qualifications/assumptions and limiting conditions
This report is for the exclusive use of the NERA Economic Consulting client named herein.
There are no third party beneficiaries with respect to this report, and NERA Economic
Consulting does not accept any liability to any third party.
Information furnished by others, upon which all or portions of this report are based, is
believed to be reliable but has not been independently verified, unless otherwise expressly
indicated. Public information and industry and statistical data are from sources we deem to be
reliable; however, we make no representation as to the accuracy or completeness of such
information.
The opinions expressed in this report are valid only for the purpose stated herein and as of the
date of this report. No obligation is assumed to revise this report to reflect changes, events or
conditions, which occur subsequent to the date hereof.
All decisions in connection with the implementation or use of this report are the sole
responsibility of the client. This report does not represent investment advice nor does it
provide an opinion regarding the fairness of any transaction to any and all parties.

NERA UK Limited, registered in England and Wales, No 3974527 Registered Office: 15 Stratford Place, London W1C 1BE
NERA Economic Consulting
15 Stratford Place
London W1C 1BE
United Kingdom
Tel: 44 20 7659 8500 Fax: 44 20 7659 8501
www.nera.com
Related Documents