General disclaimer: data and figures used in this publication is from IEA statistics unless otherwise noted. PAGE 1 PROVIDED BY CIO E N E R G Y Secure Sustainable Together SUPPL Y S E CU R I T Y Emergency Response of partner countries 2014 INDONESIA

Welcome message from author
This document is posted to help you gain knowledge. Please leave a comment to let me know what you think about it! Share it to your friends and learn new things together.
Transcript

General disclaimer: data and figures used in this publication is from IEA statistics unless otherwise noted.
PAGE 1 PROVIDED BY CIO
ENERGY Secure Sustainable Together
SUPPLY SECURITY
Emergency Response of partner countries 2014 INDONESIA

INDONESIA
Overview 2
Table of contents
Table of contents 2 List of Figures 3
Overview 4
1. Energy Outlook 6
2. Oil 8 2.1 Market Features and Key Issues 8
Imports/exports and import dependency 9 Oil Company Operations 10 Taxes and maximum price mechanism 10
2.2 Oil Supply Infrastructure 11 Refining 11 Pipelines and Ports 12 Storage Capacity 12
2.3Oilemergency policy and emergency organisation 13 Emergency response policy 13 Emergency organisation 13 Regional cooperation on oil supply disruptions 14
2.4 Stocks 15 Stockholding structure 15 Crude or products 15 Location and availability 15 Monitoring 16 Stock drawdown and timeframe 16 Financing and stockholding costs 16
3. Other Measures 17 3.1 Demand Restraint 17 3.2 Fuel Switching 18 3.3 Others 18
4. Natural Gas 19 4.1 Market Features and Key Issues 19
Gas production 19 Gas demand 19 Gas import dependency 20 Gas company operation 20
4.2 Natural Gas Supply Infrastructure 22 Ports/LNG terminals 22 Pipelines 23 Storage 23
4.3 Natural Gas Emergency Policy 24 Emergency response measures 24

INDONESIA
Overview 3
5. Electricity 26 5.1 Market Features and Key Issues 26
Supply and demand trends 26 Electricity company operation and market 27
5.2 Electricity Supply Infrastructure 27 Networks 27 Generation capacity and production 28
5.3 Electricity Emergency Policy 30 Emergency management and restoration response 30 Communications 32
List of Figures
Total Primary Energy Supply 6
Energy mix target towards 2050 6
Oil demand by product 8
Import dependency by fuel in 2013 9
Oil Infrastructure Map 11
Oil Consumption by Sector 17
Natural gas production (1970-2012) and projection (2013-2028) 19
Natural gas consumption by sector 20
Natural Gas Infrastructure Map 22
Electricity consumption 26
Electricity generation, by fuel 27
Electricity Infrastructure Map 28
Installed capacity in regional systems 29

INDONESIA
Overview 4
Overview
Indonesia’s Total Primary Energy Supply (TPES) stood at 209 Mtoe in 2011 – a 27% increase from 2002 according to the IEA statistics. With a rapidly growing economy as well as the fourth most populous country in the world, the country’s energy consumption grows at around 7% per year. The National Energy Policy (NEP) forecasts that TPES will reach 400 Mtoe in 2025, 480 Mtoe in 2030 and 1,000 Mtoe in 2050. From IEA data oil has been the dominant energy source since 1999, accounting for 35% of the country’s TPES in 2011, while the Indonesian statistics show that the share of oil in the TPES represented 49% of the TPES in 2010. Natural gas has also played an important role since the 1980s. Its share in the country’s TPES has been stable at around 20%.
As a mature oil producing country, Indonesia is facing decline in large mature oil fields and very limited large new prospects. Indonesia produced 824 kb/d of crude oil in 2013 - a 14% decline from 2007. According to the Indonesian government, the country’s fuel demand rapidly increased from around 1 mb/d in 2008 to 1.3 mb/d in 2013, and it is projected to increase to 1.7 mb/d in 2020. By comparison, the IEA statistics show Indonesian total oil demand has already reached 1.6 mb/d in 2012 and it is expected to exceed 2 mb/d in 2019.
The transport sector accounted for 52% of total oil consumption in 2011. Indonesia’s oil imports in 2011 were 990 kb/d, consisting of 382 kb/d of crude oil and of NGL, and 608 kb/d of refined products. The country maintains subsidies on gasoline, diesel and kerosene. There are 10 refineries with a combined capacity of around 1.2 mb/d. The country has eight main product storage areas with a combined capacity of 30.3 mb which can only meet 18-23 day average oil demand of the country.
The country does not have either public emergency oil stocks or compulsory industry stocks, but relies solely upon operational stocks amounting to 21-23 days of consumption. However, the Indonesian government aims at creating a national energy reserve system which includes Energy Buffer Reserves (EBR) which can be categorised as public emergency stocks. The National Energy Council made a proposal to hold 30 days of net imports. The county also aims at increasing the level of operational stocks to 30 days of consumption. There is no legal framework for demand restraint measures although local governments have implemented demand restrictions in order to control consumption of subsidised fuel.
Indonesia is one of the important natural gas producers/exporters in the region. In 2012 the country produced 76.7 billion cubic metres according to the IEA statistics. Indonesia’s demand for natural gas significantly increased from 35 bcm in 2002 to 39 bcm in 2012. In 2011 the transformation/energy sector was the largest consumer of natural gas in Indonesia, representing about 49% of the country’s total natural gas consumption. In 2010 the Indonesian government introduced a priority allocation mechanism for the use of Domestic Market Obligation (DMO) gas, prioritising gas use for oil and gas production, the fertiliser industry, the power generation sector, and other industrial sectors.
Fast-rising demand and limited interconnections between countries in Southeast Asia have prompted the installation of several LNG regasification terminals in recent years. Indonesia’s first regasification terminal, a floating storage and regasification unit (FSRU) with a capacity of 4.1 bcm in west Java, started receiving deliveries in

INDONESIA
Overview 5
2012. The Lampung FSRU site with a capacity of 2 bcm has also stated its operation in September 2014. The country also plans to construct several FSRU facilities with a combined capacity of around 8 bcm. Those FSRU facilities would contribute to enhancing security of natural gas supply by providing alternative resources, more flexibility and adequate storage to shave peak demand. Indonesian natural gas pipeline network is comprised of fragmented point-to-point grid systems. Most of pipeline networks are not connected each other.
As an exporter of natural gas, the country has not developed any emergency measures for natural gas supply crisis at the government level. However, in order to cope with local gas shortage, system operators implement emergency measures such as pushing back some of lost natural gas production (in case a disruption occurs due to sudden production decrease), allocating gas supply from other gas fields to undersupplied area, and renting fuel power generators.
The country’s domestic electricity production totalled 188 TWh in 2013 - a 40% increase from 2009. Electricity demand is forecast to increase to 287 TWh in 2018 and 386 TWh in 2022. The residential sector was the largest consumer with 41% of total electricity consumption in the same year. By region, Java-Bali consumed 144 TWh, representing 77% of the country’s total consumption in 2013. With regard to electricity generation by fuel, coal provided 52% of total power generation in 2012, followed by natural gas (24%), oil (13%), hydro (8%) and geothermal (4%). Transmission networks in Indonesia are poorly connected. At the end of 2013, total installed generation capacity in Indonesia stood at 47.3 GW - an increase of 15 GW since 2008. Around 70% of the total generation capacity is owned by PLN, while 21% is operated by independent power producers and 4% is operated by private power utilities. Other 5% is operated by Operation Licence non fuel. There are eight main electricity transmission network systems in the country, all of which are operated by PLN.
The country’s electricity system operator, PLN, is responsible for maintaining power system security, reliability, efficiency of transmission/distribution and quality of electricity supply. Measures include provision of emergency management resources, and implementation of appropriate emergency management practices such as over/under frequency load shedding and restoration plans. In the Java-Bali system, the TSO can provide generation reserves such as rotary reserves with a capacity of 815 MW for a unit. PLN sets an internal minimum requirement for operational reserves at its power generations, which includes 7 days of refined products stocks for dual-fuel power generators and around 25 days of coal stocks for coal-fired power generators.

INDONESIA
1. Energy Outlook 6
1. Energy Outlook
Indonesia’s Total Primary Energy Supply (TPES) stood at 209 Mtoe in 2011 – a 27% increase from its consumption in 2002 (165 Mtoe) according to the IEA statistics. With a rapidly growing economy as well as the fourth most populous country in the world, its energy consumption grows at around 7% per year. The country’s National Energy Policy (NEP) forecasts that TPES will reach 400 Mtoe in 2025, 480 Mtoe in 2030 and 1,000 Mtoe in 2050.
Total Primary Energy Supply
Source: Energy Balances of Non-OECD Countries, IEA
With a decline of traditional biofuels and waste consumption, oil has been the dominant energy source since 1999, accounting for 35% of the country’s TPES in 2011 according to the IEA statistics, while the Indonesian statistics show that the share of oil in the TPES represented 38% of the TPES in 2010. In the National Energy Policy, the Indonesian government has a target to decrease its share to 25% in 2025, 23% in 2030 and 20% in 2050.
Energy mix target towards 2050
Source: New National Energy Policy, Indonesia

INDONESIA
1. Energy Outlook 7
Natural gas has also played an important role since mid to late 1990s. Its share in the country’s TPES has been stable at around 20%. The IEA statistics show that natural gas represented 17% of the TPES in 2011, while it accounted for 22% according to the Indonesian government. According to the National Energy Policy, natural gas consumption is considered to be more than doubled from 35 Mtoe in 2010 to 88 Mtoe in 2025.
The share of coal in the TPES was limited to less than 9% until the early 2000s. However, coal consumption has grown since then and its share reached 15% of the TPES in 2011 according to the IEA statistics. It is expected to increase in medium and long term due to its increasing consumption in power generation. Traditional biofuels and waste has been one of the dominant energy sources, representing 25% of the TPES in 2011.
The National Energy Policy gives priority to following key policies: minimising petroleum consumption, maximising renewable energy use, optimisation of natural gas and new energy use, setting coal as a core of national energy supply and setting nuclear energy as the last option. With regard to renewable energy, the Indonesian government considers geothermal and hydro as the most important renewable sources to be enhanced in power generation. As nuclear energy is regarded as a last resort in its general energy policy, there is no concrete plan to build nuclear power plants.
The country maintain subsidies on fossil fuels and electricity, spending around 212 trillion Indonesian Rupiahs (equivalent to USD 18 billion) only for fuel subsidies in 2012, which accounts for almost 20% of governmental budget. The Indonesian government plans to phase out those subsidies when the people’s purchasing power reaches a sufficient level.

INDONESIA
2. Oil 8
2. Oil
2.1 Market Features and Key Issues As a mature oil producing country, Indonesia is facing decline in large mature oil fields and very limited large new prospects. Indonesia produced 824 kb/d of crude oil in 2013 - a 14% decline from 954 kb/d in 2007. Crude oil is produced from the well-explored Sumatra, Java and East Kalimantan basins.
Declines in the onshore Duri and Minas fields and a lack of sizeable new prospects have seen oil production fall by almost half since its peak in 1991. Although the President of Republic of Indonesia set in 2012 the target for domestic oil production at 1 mb/d by 2014, the country’s upstream regulator, SKK Migas, has revised the production target to 818 kb/d in 2014.
According to the Indonesian government, the country’s fuel demand rapidly increased from around 1 mb/d in 2008 to 1.3 mb/d in 2013 - a 24% increase, and it is projected to increase to 1.66 mb/d in 2020. By comparison, the IEA statistics show Indonesian total oil consumption1 has already reached 1.6 mb/d in 2012 and it is expected to exceed 2 mb/d in 2019.2
Oil demand by product
Source: Energy Balances of Non-OECD Countries, IEA
1 This includes NGL/LPG, Naphtha, motor gasoline, aviation fuels, other kerosene, gas/diesel oil, fuel oil, and other products. According to the IEA methodology, total consumption is the gross observed inland consumption (including refinery consumption for oil), before the deduction of amounts returned by the petrochemical industry (backflow).
2The statistical difference between the IEA figure and the Indonesian one can be explained by the difference of definition and methodology applied. While the IEA total oil demand equals to the sum of refined products including ethane, LPG, naphtha, motor gasoline, aviation gasoline, jet gasoline, jet kerosene, gas/diesel oil, other kerosene, residual fuel oil, and other products, Indonesian figure for fuel demand excludes naphtha, LPG and ethane. Furthermore, Indonesian data on demand covers a total of fuel imports and refinery production, whereas according to the IEA definition total oil demand refers to net deliveries including refinery fuel, international marine bunkers and international aviation bunkers.

INDONESIA
2. Oil 9
In 2011, the latest year for which data on consumption by sector is available in the IEA statistics, oil consumption in the transport sector reached 52%, followed by transformation (14%), industry (13%) and residential (8%).
Demand for motor gasoline was almost doubled from 254 kb/d in 2002 to 488 kb/d in 2011, representing 30% of total oil demand. Demand for motor gasoline is projected to increase by 52% from 2013 to 2018. Demand for diesel itself increased by 36% from 2002 to 2011 although the share of diesel remained stable at around 37% during the same period. Demand for diesel is projected to increase by 28% from 2013 to 2018.
Demand for NGL/LPG more than tripled from 33 kb/d in 2002 to 138 kb/d in 2011, while demand for fuel oil decreased from 126 kb/d to 96 kb/d during the same period. The significant increase of NGL/LPG demand has been supported by a governmental conversion programme from kerosene to LPG in the residential sector since 2007. The conversion programme was implemented due to safety reason and relatively low LPG price.
By region, Java-Bali is the largest oil products consumer in the country, representing 59% of the country’s subsidised fuel consumption, followed by Sumatra (23%), Kalimantan (7%), Sulawesi (7%), Nusa Tenggara (2%) and Maluku-Papua (2%).
Imports/exports and import dependency
IEA statistics show that Indonesia’s oil imports in 2011 were 990 kb/d, consisting of 382 kb/d of crude oil and of NGL, and 608 kb/d of refined products. The largest import source was Saudi Arabia with 37% of total crude oil import in 2011, followed by Nigeria (25%), Malaysia (21%), and Brunei (9%). Imported crude oil is refined in two refineries: 71% of total imported crude at the Cilacap Refinery and the other 29% at the Balikpapan Refinery.
Import dependency by fuel in 2013
Source: Pertamina
Regarding refined products, Indonesia imported around 81% of motor gasoline from Singapore in 2012, whereas Korea was the largest import source for diesel, representing 45.5% of total diesel import in the same year.

INDONESIA
2. Oil 10
The country also exported 309 kb/d of crude and NGL and 94 kb/d of products in 2011. The largest destination of crude oil export is Japan with around 21% of total crude export in 2012.
According to Pertamina, the country’s dependency of crude oil import is 32% of total crude oil demand in 2013, and it is projected to increase to 40% in 2015. Gasoline import dependency is also forecast to increase from 63% in 2013 to 77% in 2017, whereas import dependency for diesel will decrease from 26% in 2013 to 5% by 2018. LPG import dependency is forecast to significantly increase from 51% in 2013 to 70% in 2018.
Oil Company Operations
Major crude oil exploration and production is conducted by the country’s state-owned company, Pertamina, as well as international oil companies such as Chevron, Conoco Phillips, CNOOC, Total, Exxon Mobil, Medco and BP. Pertamina also operates eight refineries, while two private companies - TPPI and TWU - run a refinery each.
Pertamina also dominates the retail market, representing 88% of total road fuel consumption in 2012. Over 99% of subsidised fuels (Public Service Obligation fuels or PSO fuels) are sold by Pertamina, while the other marginal share is distributed by private companies such as AKR, SPN and Petronas. The share of PSO fuels represented 62% of in total retail market in 2012. Most of non-subsidised fuels are distributed by Shell, AKR, Pertamina Patra Niaga, Jasatama Petroindo and Petro Andalan Nusantara. There are 6,385 filling stations throughout the country in 2013, over 95% of which is operated by Pertamina.
Taxes and maximum price mechanism
The country maintains subsidies on gasoline (Premium), diesel (Solar) and kerosene as Public Service Obligation (PSO) fuels. According to the Regulation 18/2013 of Minister of Energy and Mineral Resources on Specific Oil Fuel Retail Price for Specific Consumer, retail oil prices are set as follows:
Premium at IDR 6,500 per litre: around IDR 4,000 per litre was subsidised in 2013 on average to keep the price at the pre-set level,
Solar at IDR 5,500 per litre: around IDR 5,500 per litre was subsidised in 2013 on average to keep the price at the pre-set level, and
Kerosene at IDR 2,500 per-litre: around IDR 9,500 per litre was subsidised in 2013 on average at the pre-set level
In order to limit the volume of fuels subsidies for Premium and Solar, the Indonesian government started prohibiting central and local governments, state companies, and local companies in Java-Bali Region from putting Premium in official vehicles. Freight vehicles used for plantations and mining activities are also not allowed to fuel with Solar. Kerosene can be sold only in regions where the conversion programme from kerosene to LPG has not been implemented yet. Those measures are based on the Minister Regulation 6/2014 on User Classification for subsidised fuel as well as the Minister Regulation 1/2013.

INDONESIA
2. Oil 11
2.2 Oil Supply Infrastructure Oil Infrastructure Map
Source: IEA
Refining
The country has 10 refineries with a combined crude distillation capacity of around 1.17 mb/d; eight refineries are operated by Pertamina (some 1 mb/d or 90% of total refining capacity) and the other two are operated by private companies such as TPPI and TWU.
Five refineries are located in Java Island with 51% of total refining capacity, while Sumatra Island has three refineries with 26% of total capacity. Kalimantan and Papua also have one refinery. Only two largest refineries, - Cilacap (348 kb/d) in central Java and Balikpapan (260 kb/d) in east Kalimantan - can process imported sour crude oil as other refineries’ complexity is too low to process such crude.
Domestic refinery production is insufficient for meeting demand in the country. In 2013 domestic production of gasoline was able to meet 38% of domestic oil use while LPG amounted to 49% of domestic demand. Diesel and aviation fuel production met 71% of domestic demand each. Around 80% of demand for kerosene was covered by domestic production in 2013 but domestically produced kerosene is considered to be exported from 2014 as domestic kerosene demand decreases as a result of the conversion programme from kerosene to LPG in the residential sector.
Despite the insufficient domestic refinery production, refineries operate at 70-80% utilisation rate on average, as it is not economically profitable to run refineries at maximum due to aging refining units in those refineries.

INDONESIA
2. Oil 12
In order to eliminate product import deficits, there are plans to build new refineries in Banyuasin (0.8 kb/d) in the south of Jakarta, Tuban (300 kb/d under the joint venture with Saudi Aramco) in east Java as well as in Plaju (300 kb/d) in south Sumatra. Pertamina also plans to construct a refinery with a capacity of 300 kb/d in Balongan II (in west Java under a joint venture with Kuwait Petroleum and Korean SK Energy), Banten (close to Jakarta) or Bontang (in east Kalimantan). However, no final decision has been made for these projects so far, as financial profitability needs to be ensured.
Pipelines and Ports
A big challenge inherent to the country is its refined products distribution, as the country is composed of over 17,000 islands, around 6,000 of which are inhabited. For fuel transportation, the country has over 600 oil tankers with a combined transporting capacity of over 6.2 million kilolitres, 680 tank trunks with a total capacity of 11.1 thousand kilolitres, and 1,030 trains with a capacity of 25 thousand kilolitres in total.
The country has over 25 major crude oil terminals and sea storage facilities with a combined storage capacity of around 10 mb. In addition, Pertamina owns around 17 main oil terminals with a combined hourly discharging capacity of 88,400 kilolitres (or 556 kb per hour). Those ports are oriented toward charging/discharging oil products, especially gasoline and diesel.
The country has nine major product pipelines, eight of which are located in Java. The other pipeline is located in Sumatra connecting Kertapati with Plaju. A combined maximum flow capacity is 3,820 kilolitres per hour (equivalent to 24 kb per hour or 576 kb/d). Those pipelines mainly connect refineries with storage facilities in Java. The country doesn’t have any cross border pipelines with other countries.
Storage Capacity
There are eight regional storage areas throughout the country. Total product storage capacity amounts to 4.8 million kilolitres (equivalent to 30.3 million barrels): 3.5 million kilolitres (or around 22 mb) in Pertamina terminals, 1.2 million kilolitres (or 7.5 mb) in private terminals and 130 thousand kilolitres (or around 820 kb) in floating storage. Pertamina is the main storage stakeholder owning 72% of the country’s total storage capacity. Some 52% of product storage capacity is located in Java-Bali region which is the country’s oil demand centre, followed by Sumatra (26%) and Kalimantan (8%), Sulawesi (7%) and Maluku (4%).
Combined crude oil storage capacity in the country’s main crude terminals and floating facility amounts to 10.3 mb.
Even if all product storage facilities are fully filled with refined products, they can only meet 18-day average oil demand of the country when applying the IEA’s methodology for calculating oil demand (1.6 mb/d). Even with the government’s figure for oil demand (1.3 mb/d), the existing storage capacity can cover around 23-day average total oil demand. Together with crude oil storage capacity, additional 6-8 days can be brought to those figures.
In order to respond to the lack of adequate storage capacity as well as to rapidly increasing oil demand, Pertamina plans to increase its products fuel storage capacity in Sambu and TanjungUban (near Singapore in Sumatra), Kotabaru (in
INDONESIA
2. Oil 13
Kalimantan), Pontianak, Bau-Bau, Banjarmasin and Bitung in addition to construction of new storage sites. The plan on Sambu site aims at doubling its storage capacity to 264 thousand kilolitres (or 1.7 mb). This additional capacity is expected to come online in 2016. The facility will then be expanded up to 800 thousand kilolitres (or 5 mb) by 2020. The project in TanjungUban is expected to expand its existing capacity to 200 thousand kilolitres (1.26 mb). Other private companies also have several plans to increase their product storage capacities up to 5 million kilolitres (or 31.5 mb). Those new storage facilities will double the existing storage capacity of the country.
2.3 Oil emergency policy and emergency organisation
Emergency response policy
The Law 30/2007 on Energy provides the legal basis for the National Energy Council (NEC) to define emergency measures for energy crisis. According to the law, the NEC has developed a draft Presidential Regulation and Procedure for Determining Energy Crisis and Emergency. The draft presidential decree aims at securing stable supply of energy resources such as oil products (including LPG), natural gas and electricity by following measures:
release of Energy Buffer Reserves,
increase of energy imports,
international cooperation,
export restrictions,
energy savings,
demand restraint measures
fuel switching and energy diversification, and
purchase of excess power
The draft decree is expected to enter into force by the end of 2014. Following validation of the presidential decree, the Indonesian government will specify detailed procedure and roles in a ministerial decree. The government has also been preparing a regulation for biofuels in order to be able to increase bio components in transport fuels in case of oil product disruption.
Emergency organisation
The Indonesian government plans to establish a decision making structure for an energy supply crisis in the draft presidential decree. In the plan, the NEC, chaired by the President of Republic of Indonesia, is the permanent core body of the country’s decision making process for energy crisis. The Vice President of Republic serves as

INDONESIA
2. Oil 14
Vice Chairman of the NEC, and the Minister of Energy and Mineral Resources acts as Daily Chairperson of the Council. The NEC is comprised of seven government representatives as well as eight stakeholder representatives including from consumer, academics, industry, and environment expert. Government members include Minister of Finance, Minister of National Development Planning, Minister of Transportation, Minister of Industry, Minister of Agriculture, Minister of Research and Technology, and Minister of Environment. Individual board members - stakeholder representatives - must be approved by the Parliament.
In the event of an oil supply emergency, the NEC Daily Chairman will convene either a NEC board meeting3 or a NEC plenary meeting4 in order to evaluate whether the crisis meets criteria for actions according to the presidential decree. If the disruption is recognised as local one, the Ministry of Energy and Mineral Resources (MEMR) will take the lead to determine measures while the NEC secretariat coordinates for action in case of a national disruption.
Regional cooperation on oil supply disruptions
In 1986 ASEAN countries established the ASEAN Petroleum Security Agreement (APSA), a regional treaty to mitigate the impact of an oil supply disruption in one or more of the ASEAN member countries by activating a sharing scheme – the ASEAN Emergency Petroleum Sharing Scheme – for crude oil and petroleum products. In 1999 ASEAN energy ministers agreed to revise the 1986 APSA in order to incorporate both short-term response measures (e.g. demand restraint, fuel switching and a co-ordinated emergency response mechanism - ASEAN CERM), and medium and/or long-term measures. The ASEAN CERM aims to serve as a framework for regional consultations and co-ordination to facilitate oil allocation on a voluntary and commercial basis in times of oil crisis. After Indonesia had ratified the revised APSA in February 2013, the revised APSA came into effect in March 2013. The country can take advantage of the APSA in domestic oil supply shortage once it is fully operationalised.
3NEC board meeting is convened without the President of Indonesia. In normal time, it is held once a month at least.
4NEC plenary meeting is held under the chairmanship of the President of Indonesia. It is held once every six months.

INDONESIA
2. Oil 15
2.4 Stocks
Stockholding structure
Indonesia does not have either public emergency oil stocks or compulsory industry stocks. The country has just operational stocks in commercial supply chain. However, the Indonesian government aims at creating a national energy reserve system which includes a) Energy Strategic Reserves, b) Energy Buffer Reserves, and c) Operational Reserves.
Energy Strategic Reserves are energy resources which the country will reserve and regulate to ensure long-term energy security. This is basically defined as proven reserves.
Energy Buffer Reserves (EBR) can be categorised as public emergency stocks. EBR will be held by the government based on the Law 30/2007 on Energy. Reserves must be used only for emergency purpose. The NEC made a proposal to hold 30 days of net imports as EBR. The government has a plan to start building EBR stocks from 2017.
Operational Reserves are set to be provided by industry to ensure stable energy supply based on the Law 22/2001 and the Ministry Decree on Downstream Oil and Gas 36/2004. As there is no obligatory amounts set for operational reserves in the legislation, Pertamina holds 21-23 days of stocks in total while private oil companies hold up to 21 days of operational stocks. The Indonesian government aims at increasing it to 30 days of consumption.
Crude or products
As noted above, Indonesia relies solely upon operational stocks equivalent to 20-23 days on average at present. By product, the country holds 14-day crude oil stocks as feedstock of refinery intake, 16-18 days for gasoline, 20-22 days for diesel, 25-30 days for aviation fuels, and 17 days of LPG stocks. Two-third of LPG stocks is held in two domestic floating storage facilities.
Product components in EBR stocks are expected to be crude oil, motor gasoline, diesel, LPG, and aviation fuel. However, the types of stock will be determined in a NEC decree following the presidential decree.
Location and availability
EBR will be located at the centre of the largest energy demand such as Java and close to existing robust energy infrastructures such as east Kalimantan, taking into consideration geographic and geological conditions. EBR location will be discussed and agreed in NEC plenary meeting, and then details would be presented after receiving direction/approval by the President of Republic of Indonesia as the NEC Chairman.
Indonesia has no bilateral stockholding agreement with other countries. However, given the lack of sufficient domestic storage capacity in the country, it is reported that almost one-fifth of product storage in Singapore is used for Indonesia.

INDONESIA
2. Oil 16
According to Pertamina, minimum operating requirement for product is 20 days of stocks: 12 days in marketing depots, 3-4 days in refineries, and 3-4 days for vessels.
Monitoring
The Government Regulation 36/2004 empowers BPH Migas for overall management of stocks which includes: a) determine and manage fuel distribution & reserves, b) supervise domestic fuel distribution & fuel reserve provision, c) manage the utilisation of fuel reserve in case of oil disruptions, d) recommend administrative sanction.
The MEMR will give a licence for downstream activity, decide administrative sanction in case of infringement, and determine annual fuel quota and reserves. According to the legislation, Pertamina operational stocks are reported to BPH Migas every three months at least. Physical inspection is also conducted by BPH Migas.
Stock drawdown and timeframe
As there is no public stocks either compulsory industry stocks, there is no drawdown procedure at present. The President of Republic of Indonesia is expected to make a decision on future EBR stock release according to the decision making procedure stipulated in the draft presidential decree.
Financing and stockholding costs
The current Pertamina operational stocks are borne by fuel subsidy. EBR will be funded gradually according to the country’s financial capability. Initial investment will be made by the government through the state budget. Operational costs will be borne by the government and/or industry. Details will be discussed further among stakeholders.

INDONESIA
3. Other Measures 17
3. Other Measures
3.1 Demand Restraint Like in IEA countries, the transport sector makes up the single largest share of oil consumption in Indonesia. In 2011, the transport sector represented 52% of total oil use in the country, while the IEA average is around 60% for the transport sector. Following the transport sector, the transformation sector represented 14% of total oil demand. The remainder of oil consumed in Indonesia in 2011 was in industry (13%), residential (8%), non-energy use (8%: mostly as feedstocks use in petrochemical industry), and commercial/ agriculture/other (5%).
Oil Consumption by Sector1
Source: Energy Balances of Non-OECD Countries, IEA
There is no legal framework for demand restraint measures, although local governments have implemented demand restrictions in order to control consumption of subsidised fuel according to the Minister Regulation 01/2013 on Control of Fuel Consumption. This is implemented by request from Pertamina when subsidised fuel consumption in regions exceeds regional quota. Local police has been deployed several times to support the demand restrictions. Pertamina has internal priority list of customers such as power plants and demand centre such as Java region.
Pertamina also has an operational allocation system - Fuel Distribution System - for supplying available oil to disrupted areas, even though the government has no specific legal authority to instruct the industry to implement the allocation mechanism. When stock level is below acceptable level in an area, alternative supply will be delivered from available storage nearby the disrupted area. In case that those
1Total Consumption (including refinery consumption), does not include international marine bunkers.

INDONESIA
3. Other Measures 18
alternative supplies are not sufficient, any possible supply will be delivered. This allocation mechanism was activated when there was a tank fire at the Cilacap refinery in April 2011 and when oil supply was halted to a power plant due to pipeline maintenance in July 2008.
3.2 Fuel Switching Fuel switching can be only implemented on power plant. However, it is considered to substitute natural gas to diesel oil in dual-fuelled power plants in case of electricity security; not the other way around. As such there is no policy to promote fuel switching from oil to other fuels.
3.3 Others As many Indonesian oil fields are being depleted and that existing oil fields have no spare capacity for surge production, there is no potential or policy to increase oil production in a short time.

INDONESIA
4. Natural Gas 19
4. Natural Gas
4.1 Market Features and Key Issues
Gas production
Indonesia is one of the important natural gas producers in the region. In 2012 the country produced 76.7 billion cubic metres (bcm) (or 2.7 trillion standard cubic feet -tscf) equal to 38% of the region’s total according to the IEA statistics. Domestic natural gas production has increased from 67.6 bcm (2.4 tscf) in 2001. The Indonesian government forecasts that it will increase to 98.8 bcm (3.5 tscf) in 2017, and then will decrease to less than the half of the yearly peak production equalling to 45 bcm (1.6 tscf) in 2028.
Natural gas production (1970-2012) and projection (2013-2028)
Source: IEA and MENR1
Gas demand
Indonesia’s consumption for natural gas significantly increased from 35 bcm (1.2 tscf) in 2002 to 39.3 bcm (1.4 tscf) in 2012, although there was a 10% decrease from the 2010 level (43.5 bcm or 1.5 tscf).
In 2011 the transformation/energy sector was the largest consumer of natural gas in Indonesia, representing about 49% of the country’s total natural gas consumption, while industry and non-energy use in industry (feedstock use in petrochemical
1IEA annual statistics is used for natural gas production until 2012 while data from 2013 to 2028 is the forecast provided by the Ministry of Energy and Mineral Resources.

INDONESIA
4. Natural Gas 20
industry) represented 36% and 11%, respectively. Domestic demand for natural gas is considered to significantly increase 56 bcm (2 tscf) in 2013 to 105 bcm (3.7 tscf) in 2028.
In 2010, the Indonesian government introduced a priority allocation mechanism for the use of Domestic Market Obligation (DMO) gas. Accordingly, gas use is prioritised in the following order: 1) oil and gas production, 2) the fertiliser industry, 3) the power generation sector, and 4) other industrial sectors. The volume is allocated amongst each sector at prices negotiated between suppler and consumer. Natural gas supply for the residential sector is limited; there are only 19,377 consumers, representing less than 0.1% of the country’s total consumption.
Natural gas consumption by sector
Source: Natural Gas Information, IEA
Gas import dependency
As the largest exporter of natural gas in the ASEAN region, the country exported 39.3 bcm (1.4 tscf) of natural gas in 2012 according to the IEA statistics. In 2012, Korea was the largest importer of Indonesian natural gas (25%), followed by Japan (21%), Singapore (20%), Malaysia (19%) and China (8%). Although long-term exporting contracts with Korea and Japan are extended up to 2022, the country’s export volume is projected to decrease from around 36 bcm (1.3 tscf) in 2013 to 8 bcm (280 billion scf) in 2028. According to the country’s forecast on demand supply balance, the country is projected to start natural gas import from 2017, and it will become a net-importing country in 2022.
Gas company operation
Upstream market players are quite diversified: ten natural gas producing companies have some 85% of total share in the upstream.
The country’s downstream market is, however, dominated by two state-own companies - PGN and Pertagas - as well as a private transmission company, TGI, of which PGN is the largest stakeholder with some 60%. In 2013 Pertagas operates 42% of the country’s transmission system network, followed by PGN (28%) and TGI

INDONESIA
4. Natural Gas 21
(27%). Distribution network is rather monopolised by PGN. However, open access to natural gas transmission and distribution network is guaranteed.

INDONESIA
4. Natural Gas 22
4.2 Natural Gas Supply Infrastructure
Ports/LNG terminals
Indonesia has three operating LNG liquefaction plants (Bontang, Arun and Tangguh) with a combined capacity of 42 million tons per year (or 57 bcm) per year. The country has plans to construct three additional liquefaction plants: two – Donggi-Senoro and Sengkang – in Sulawesi and one in Masela. Additionally, there is a plan to expand the Tangguh plant together with the Abadi Floating LNG (FLNG) project in the remote Arafura Sea. Those projects will boost the country’s combined liquefaction capacity to over 86 bcm (or 3 tscf) per year.
Fast-rising demand and limited interconnections between countries in Southeast Asia have prompted the installation of several LNG regasification terminals in recent years. Indonesia’s first regasification terminal, a floating storage and regasification unit (FSRU) with a capacity of 4.1 bcm (144 bscf) in west Java, started receiving deliveries in 2012. 1.4 bcm (50 bscf) of LNG was supplied from the domestic Bontang LNG plant. In September 2014, the Lampung FSRU site with a capacity of 2 bcm has also stated its operation. A part of Arun liquefaction plant has been under modification to be converted to regasification plant. The country also plans to construct several FSRU facilities with a combined capacity of around 8 bcm (282 bscf). They are planned to be located in Banten and Central Java: all close to the country’s largest demand centre in Java Island. Those FSRU facilities would contribute to enhancing security of natural gas supply by providing alternative resources, more flexibility and adequate storage to shave peak demand.
Natural Gas Infrastructure Map
Source: IEA

INDONESIA
4. Natural Gas 23
Pipelines
The Indonesian natural gas pipeline network is comprised of a number of fragmented point-to-point grid systems. Most of pipeline networks are not connected each other given that the country is composed of more than 17,000 islands as well as that natural gas production fields are located in several islands.
The country also has following five categories for natural gas pipelines:
Category 1: open access
Category 2: upstream dedicated
Category 3: downstream dedicated
Category 4: own use, and
Category 5: city gas network
City gas network is quite limited, as natural gas consumption in the residential sector represents less than 0.1% of total consumption, whereas around half of natural gas is consumed by the transformation/energy sector, followed by industry (36%).
There are three main transmission system operators (TSO) in the country: two state-own companies - PGN and Pertagas - as well as a private transmission company, Trans Gas Indonesia (TGI), the largest shareholder of which is PGN. As of 2013 Pertagas operates 42% of the country’s transmission system network, followed by PGN (28%) and TGI (27%). TGI covers the country’s single cross-border natural gas pipeline with Singapore. Indonesia exports natural gas to Singapore via the TGI pipeline from Natuna islands of Riau and South Sumatra across the Strait of Malacca. In 2012 Singapore imported 7.7 bcm (270 bscf) of natural gas via TGI pipelines from Indonesia.
PGN transmission network covers Southern Sumatra and Western Java (SSWJ) and Northern Sumatra, while Pertagas networks also include Southern Sumatra, Western Java, Banten, Eastern Java, Northern Aceh, Northern Sumatra, and Eastern Kalimantan.
The country’s total transmission network, including upstream networks, is 4,370 km long with a combined maximum flow capacity of 377 mcm/d. However, Indonesian transmission grid does not have any balancing zone as transmission networks are not integrated.
The country’s combined distribution network reaches 7,987 km with a combined capacity of 145 mcm/d. PGN basically dominates the country’s natural gas distribution network which covers Palembang, Banten, Jakarta, Bogor, Bekasi, Karawang, Cirebon, Medan, Batam, Pekanbaru, Surabaya, Sidoarjo and Pasuruan. However, given the distribution network are fully open, there are 19 distribution system operators only in Java and Sumatra regions.
Storage
There are very limited gas storage facilities with a combined annual capacity of 520 thousand cubic metres including the capacity of west Java FSRU site, given that

INDONESIA
4. Natural Gas 24
Indonesia is an exporting country at present. With completion of FSRU construction projects, the country will hold around 650 thousand cubic metres of storage capacity in total by 2015. Withdrawal capacities are unknown for existing and planned LNG facilities.
4.3 Natural Gas Emergency Policy As an exporter of natural gas, the country has not developed any emergency measures for natural gas supply crisis at the government level, although the country plans to take the same decision making process in case of natural gas disruption as in oil disruption.
However, in order to cope with local gas shortage, system operators implement emergency measures such as recovering some of lost natural gas production (in case a disruption occurs due to sudden production decrease), allocating gas supply from other gas fields to undersupplied area, and renting fuel power generators. At the same time, the country has started enhancing gas infrastructure such as floating storage and regasification unit (FSRU) in order to receive alternative natural gas supply as well as to improve peak shaving capacity with storage in FSRU facility.
Emergency response measures
As no measures are expected to be taken in supply side such as surge production or emergency gas stock release (except for pushing back lost production), the country’s emergency response measures focuses on demand side measures. In the event of natural gas supply shortage, following measures will be generally implemented by gas and electricity TSOs:
Optimisation of coal power plants,
If it is not sufficient, alternative fuels are used in dual fuel power plants,
Utilisation of hydro power plant (pump storage), and
Consumer load management
Although there is no regulation or policy to promote fuel switching from natural gas to other fuels, the electricity generator has fuel switching capacity in dual-fuel power plants. While the country’s electricity transmission system operator, PLN, holds 35 gas-fired dual fuel power plants with a total combined capacity of 11,596 MW, around 24 of those plants use natural gas for electricity generation on a business as usual basis, which can replace 281,226 BBTU (equal to 7.4 bcm) of natural gas. Those plants can run mostly with High Speed Diesel. Those dual-fuel gas generators have a minimum fuel stock equivalent to 7 days according to the internal requirement.
In the largest demand centre of the country, Java, PGN plans to use line pack from Southern Sumatra and Western Java (SSWJ) pipelines to cover peak demand. If it is not sufficient, the company has an internal priority customer list as follows:

INDONESIA
4. Natural Gas 25
interruptible contract with power generators which have alternative fuels;
interruptible contract with industry which have alternative fuels;
industry without alternative fuels; and
households
The interruptible contracts represent 20-25% of total consumption in the region.
The country experienced local natural gas supply disruptions in different regions such as Medan in Northern Sumatra and Tarakan in Northern Borneo. In Medan, natural gas was disrupted due to a drastic decline of gas supply from 11 million standard cubic feet per day (MMSCFD) or 311,000 m3 per day to 3.5 MMSCFD (or 99,000 m3 per day) in gas wells managed by Salamander. The Indonesian government pushed back the gas well production and allocated 2 MMSCFD (or 56,600 m3 per day) each for power generation and industry. Meanwhile, PLN run its power plants by renting a fuel generator.
Natural gas disruption in Tarakan also occurred due to declining gas production managed by Medco. Natural gas production decreased from 6 MMSCFD (170,000 m3 per day) to only 0.1 MMSCFD (2,830 m3 per day). Shortage of gas supply from Medco was replaced with additional gas supply from PertaminaBunyu Field about 2 MMSCFD (57,000 m3 per day) initially and then increased to 5 MMSCFD (141,500 m3 per day).

INDONESIA
5. Electricity 26
5. Electricity
5.1 Market Features and Key Issues
Supply and demand trends
The country’s domestic electricity production totalled 188 TWh in 2013 - a 40% increase from 2009. As electricity imports from Malaysia are marginal, net electricity consumption in 2013 was the same as the production. Electricity demand is forecast to increase to 287 TWh in 2018 and 386 TWh in 2022 - with a compound annual growth rate of 8.3%. In 2013, the residential sector was the largest consumer with 41% of total consumption, followed by industry (34%), commercial (19%) and pubic service (6%).
Electricity consumption
Source: Directorate General of Electricity, MEMR
By region, Java-Bali consumed 144 TWh (77% of total consumption) in 2013, while electricity consumption in Sumatra was 26 TWh (14%). Java-Bali is projected to consume 275 TWh in 2022, while Sumatra is expected to consume 66 TWh. Around 80% of the country is distributed with electricity. It is projected to increase the electrification ratio to some 89% by 2017.
Peak demand in the Java-Bali system was recorded on 20 November 2013, reaching some 23 GW. Annual peak demand is recorded either in October or in November which is generally the start of rainy season. Furthermore, the regional demand peaked in early evening as electricity demand in the residential sector hits the highest point for household duties such as preparation of supper.
With regard to electricity generation by fuel, coal provided 52% of total power generation in 2013, followed by natural gas (24%), oil (13%), hydro (8%) and geothermal (4%). While the share of oil in power generation significantly decreased from 36% in 2008, the role of coal has become more important (compared to 35% in

INDONESIA
5. Electricity 27
2008). The country’s electricity transmission system operator, PLN, has an energy mix target for power generation in 2022: 66% from coal, 16% from natural gas, 11% from geothermal, 5% from hydro and 1.7% from oil.
Electricity generation, by fuel
Source: Directorate General of Electricity, MEMR
Electricity company operation and market
PLN has been a vertically integrated electricity company covering generation, network system operations and retail. In 2002, the power sector reform law had been enacted for full liberalisation of power sector and privatisation for competitive electricity market. However, the law was cancelled by the Constitutional Court two years after. While generation sector is open for IPPs and PPUs, grid operation is monopolised by PLN.
Indonesia maintains subsidy on electricity, although the country has been trying to reduce subsidy on electricity. In 2013 the country raised electricity tariffs by 15% given that electricity production costs (IDR 1,272/kWh) much higher than the general market price (IDR 745/kWh) in 2012.
The country reduced subsidy for state-own companies consuming more than 200 kVA and for industry consuming more than 30,000 kVA. Tariff was also adjusted for large household customers consuming more than 6,600 VA, middle business customers consuming between 6,600 VA and 200 kVA, large business customer consuming more than 200 kVA; and middle government institutions consuming between 6,600 VA and 200 kVA.
5.2 Electricity Supply Infrastructure
Networks
Transmission networks in Indonesia are poorly connected. There are eight main electricity network systems in the country: 1) Java-Bali System, 2) Sumatra System, 3) West Kalimantan System, 4) Southern and Central Kalimantan System, 5) Eastern Kalimantan System, 6) Northern Sulawesi System, 7) Southern Sulawesi System, and 8) West Nusa Tenggara System. The country has around 39,395 km long transmission grids and around798,944 km long distribution lines in total.

INDONESIA
5. Electricity 28
There are plans to interconnect neighbouring systems such as between Java-Bali and Sumatra, between Kalimantan systems, and between Sulawesi systems. Interconnection between Java-Bali and Sumatra is expected to become online by 2018, which will allow Java to receive 3,000 MW of electricity from Southern Sumatra.
Electricity Infrastructure Map
As a vertically integrated utility, PLN is the electricity transmission system operator (TSO) and the distribution system operator (DSO) in Indonesia.
Based on the Law 30/2009 on Electricity and the Government Regulation 42/2012 on Cross-Border Power Sale and Purchase, PLN imports electricity from Malaysia through 20 kV distribution lines for Sajingan-Sambas (around 200 kVA) and for Badau-Kapuas Hulu (400 kVA) in west Kalimantan. It is planned to import electricity from Serawak-Malaysia to west Kalimantan with a capacity of 50 MW for off peak and 170 MW for peak hours, through a 275 kV transmission line which is still under construction and expected to be operated on early 2015.
Generation capacity and production
At the end of 2013, total installed generation capacity in Indonesia stood at 47.3 GW - an increase of 15 GW since 2008. Around 70% of this generation capacity is owned by PLN, while 21% is operated by independent power producers (IPPs) and 4% is operated by private power utilities (PPUs). Other 5% is operated by Operation Licence non fuel.
According to the PLN ten-year power development plan towards 2022, the TSO aims to achieve 84.9 GW of installed capacity by 2020 and 96.3 GW of installed capacity by 2022.
INDONESIA
5. Electricity 29
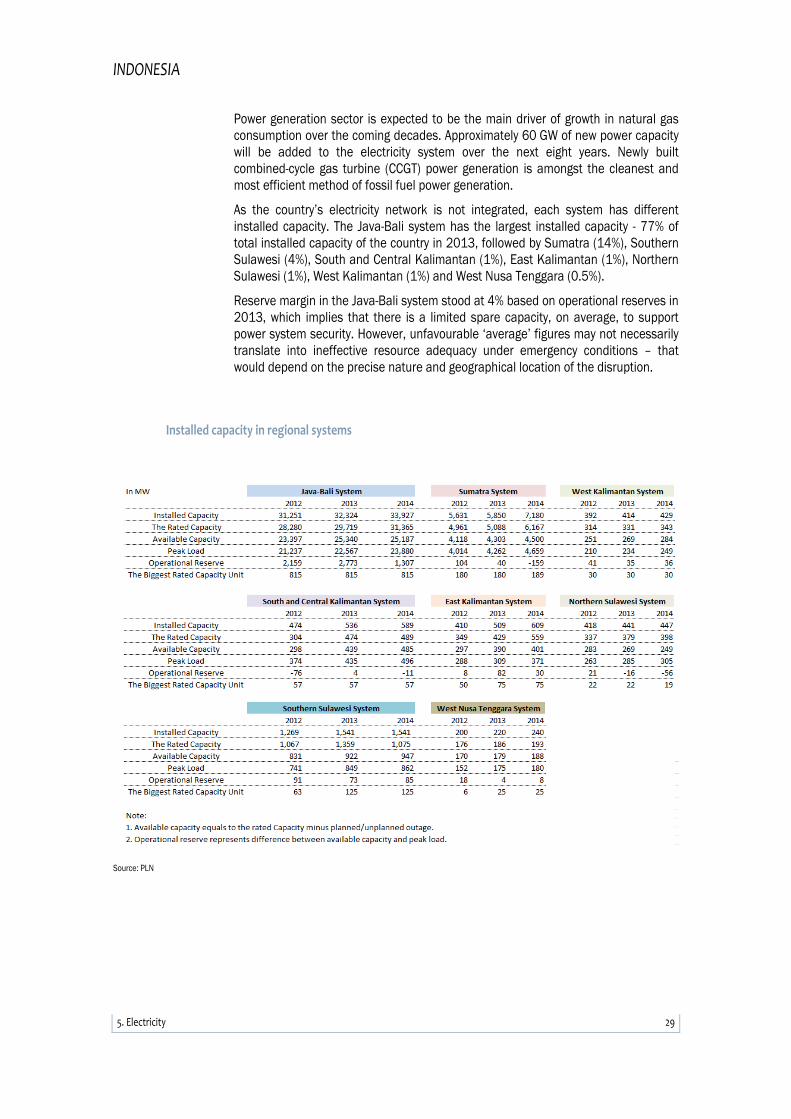
Power generation sector is expected to be the main driver of growth in natural gas consumption over the coming decades. Approximately 60 GW of new power capacity will be added to the electricity system over the next eight years. Newly built combined-cycle gas turbine (CCGT) power generation is amongst the cleanest and most efficient method of fossil fuel power generation.
As the country’s electricity network is not integrated, each system has different installed capacity. The Java-Bali system has the largest installed capacity - 77% of total installed capacity of the country in 2013, followed by Sumatra (14%), Southern Sulawesi (4%), South and Central Kalimantan (1%), East Kalimantan (1%), Northern Sulawesi (1%), West Kalimantan (1%) and West Nusa Tenggara (0.5%).
Reserve margin in the Java-Bali system stood at 4% based on operational reserves in 2013, which implies that there is a limited spare capacity, on average, to support power system security. However, unfavourable ‘average’ figures may not necessarily translate into ineffective resource adequacy under emergency conditions – that would depend on the precise nature and geographical location of the disruption.
Installed capacity in regional systems
Source: PLN

INDONESIA
5. Electricity 30
5.3 Electricity Emergency Policy According to the Law 30/2009 on Electricity, the MEMR and regional/local governments are responsible for electricity supply as regulator. PLN, as the country’s single TSO and DSO1, is responsible for stable supply of electricity. PLN is required to take any necessary measures to ensure security, reliability, efficiency of transmission/distribution and quality of electricity supply. This includes provision of emergency management resources, and implementation of appropriate emergency management practices including over/under frequency load shedding and restoration plans.
Provisions related to electricity are also stipulated in the Government Regulation 14/2012 on Power Supply Business Activities, the Government Regulation 42/2012 on Cross-Border Power Sale and Purchase, and the Government Regulation 62/2012 on Electricity Supporting Business. Based on those government regulations, details are specified in MEMR regulations.
The country does not have an independent electricity regulator; however the Department for Electricity Regulation in the MEMR fulfils the regulatory role for electricity.
Regulation for electricity crisis conditions will be specified in the draft Presidential Regulation and Procedure for Determining Energy Crisis and Emergency and following ministry regulations. Three levels of crisis are expected to be established: 1) corporate level, 2) governor and/or ministry level, and 3) Presidential level.
For the operational level regulation, the country lays down a set of standard and procedures to guarantee safety, reliability and efficiency of operation and system development for electricity in the Minister Regulation 3/2007 on Java-Madura-Bali Electricity Network System (grid code), the Minister Regulation 37/2008 on Sumatra Electricity Network System, and the Minister Regulation 4/2009 on Distribution Network System. Grid codes for other regions are expected to enter into force by the end of 2014.
On the Java-Bali system, 3,852 disruptions were recorded in 2013. It is considered that 15 GWh of electricity was not served in total because of the disruptions. The Sumatra system had 1,548 disruptions (equivalent to 1.2 GWh) in the same year.
Emergency management and restoration response
The system operation control centre (P3B-PLN) will announce emergency conditions for power shortages, 1) if operational reserves drops below than minimum requirement and there is no other way to recover the loss; or b) if monthly operational reserves can be predicted below the minimum requirement and there will be no other way to recover the loss. In the latter case, the P3B-PLN should announce emergency condition at least one week in advance.
After the announcement, the P3B-PLN needs to submit notification on the declaration of emergency condition to:
all networking users through grid operations message system;
Electricity Distribution Business on the volume of required load reduction;
1Two small areas such as Batam in Riau Islands and Tarakan in east Kalimantan are covered by different system operators. Meanwhile, PLN covers over 99% of transmission/distribution networks of the country.

INDONESIA
5. Electricity 31
PLN directors; and
P3B-PLN leader in case it is necessary to activate Emergency Operation Room
Under circumstances where the disruption could be handled only at the operational level, PLN keeps working at the P3B-PLN control centre without activation of the Emergency Operation Room. However, if it needs to involve cooperation beyond the operational level, PLN opens the Emergency Room. The P3B-PLN control centre is equipped with an uninterruptible electricity system, analytical tools, and real time diagnostic tools. Five 150 kV dispatcher centres in the Java-Bali system are also equipped with the same system and tools; those dispatcher centres can serve as emergency control centre in case that the P3B-PLN is not available.
PLN system operators monitor the real time condition by Supervisory Control and Data Acquisition (SCADA) on following status: 1) electrical load on generation and transmission, 2) equipment /installation/generator performance, 3) energy production, 4) status of equipment/installation operation, and 5) operation and reliability indicators. In order to maintain real time condition during crisis, control safety such as network reconfiguration, and load-shedding will be deployed first manually and then automatically if it is not enough.
In the Java-Bali system, PLN can also provide generation reserves such as spinning reserves with a capacity 815 MW at maximum for a unit and minimum requirements for operational reserves at dual-fuel plants.
Although the Indonesian government has not determined the minimum stock on the power plant, PLN sets following internal minimum requirements for operational reserves at its power generations:
7 days of diesel stocks for dual-fuel power generators; and
around 25 days of coal stocks for coal-fired power generators
Around 30-40% of existing capacity in hydropower generations is also considered to be available in normal time.
In case of electricity emergency, the TSO is allowed to buy additional electricity generated by IPPs directly by bypassing the bidding process which needs to be conducted in normal time, if IPPs have surplus generation capacity.
The TSO has developed a load shedding plan for electricity outages. Load shedding aims at keeping the system stability due to decrease of frequency, voltage, as well as transmission load. As such, load shedding management are conducted in following case:
that frequency falls below a specified tolerance while potential operational reserve cannot be expected (deficit power supply);
that it needs to save over load network equipment locally/partially; or
that it is necessary to avoid instable frequency/voltage that can threaten system outages widely

INDONESIA
5. Electricity 32
On the Java-Bali system, the system operator has categorised their customers with priority into the following three cases:
Residential sector
Industry sector
Hospitals, governments, and medical facilities
In order to avoid congestion on the Java-Bali transmission grids, the TSO has installed devices such as under-frequency relay (UFR), open load shedding (OLS), and open generation saving (OGS).
Black starter capacity is equipped in power generations with gas turbines (equivalent to 10-20% of total power generation capacity) and in hydropower stations.
Communications
PLN has developed real time crisis communication policies to manage the information flow with concerned parties for control and measurement system according to the network code. The P3B-PLN will coordinate closely with the APB-PLN (Load Regulatory Area).


This document and any map included herein are without prejudice to the status of or sovereignty over any territory, to the delimitation of international frontiers and boundaries and to the name of any territory, city or area.
IEA Publications 9, rue de la Fédération, 75739 Paris cedex 15
Cover design: IEA. Photo credits: © GraphicObsession

Related Documents