FOREWORD CHAPTER 1 : Overview CHAPTER 2 : Emergency oil response systems in IEA member countries CHAPTER 3 : Natural gas security in the IEA Part 1 The following part 1 is an excerpt from Energy Supply Security 2014 publication and is not intended as a stand-alone publication. ENERGY SUPPLY SECURITY 2014

Welcome message from author
This document is posted to help you gain knowledge. Please leave a comment to let me know what you think about it! Share it to your friends and learn new things together.
Transcript
FOREWORD
CHAPTER 1: Overview
CHAPTER 2: Emergency oil response systems in IEA member countries
CHAPTER 3: Natural gas security in the IEA
Part 1The following part 1 is an excerpt from Energy Supply Security 2014 publication and is not intended as a stand-alone publication.
ENERGY SUPPLY SECURITY 2014
INTERNATIONAL ENERGY AGENCY
The International Energy Agency (IEA), an autonomous agency, was established in November 1974. Its primary mandate was – and is – two-fold: to promote energy security amongst its member
countries through collective response to physical disruptions in oil supply, and provide authoritative research and analysis on ways to ensure reliable, affordable and clean energy for its 29 member countries and beyond. The IEA carries out a comprehensive programme of energy co-operation among its member countries, each of which is obliged to hold oil stocks equivalent to 90 days of its net imports. The Agency’s aims include the following objectives:
n Secure member countries’ access to reliable and ample supplies of all forms of energy; in particular, through maintaining effective emergency response capabilities in case of oil supply disruptions.
n Promote sustainable energy policies that spur economic growth and environmental protection in a global context – particularly in terms of reducing greenhouse-gas emissions that contribute to climate change.
n Improve transparency of international markets through collection and analysis of energy data.
n Support global collaboration on energy technology to secure future energy supplies and mitigate their environmental impact, including through improved energy
efficiency and development and deployment of low-carbon technologies.
n Find solutions to global energy challenges through engagement and dialogue with non-member countries, industry, international
organisations and other stakeholders.IEA member countries:
Australia Austria
Belgium Canada
Czech RepublicDenmark
EstoniaFinland
FranceGermany
GreeceHungary
Ireland Italy
JapanKorea (Republic of)LuxembourgNetherlandsNew Zealand NorwayPolandPortugalSlovak RepublicSpainSwedenSwitzerlandTurkey
United KingdomUnited States
The European Commission also participates in
the work of the IEA.
Please note that this publication is subject to specific restrictions that limit its use and distribution.
The terms and conditions are available online at http://www.iea.org/termsandconditionsuseandcopyright/
© OECD/IEA, 2014International Energy Agency
9 rue de la Fédération 75739 Paris Cedex 15, France
www.iea.org
Secure Sustainable Together
Foreword
ForEword 3© O
ECD/
IEA
2014
The year 2014 is a special one for the International Energy Agency as we celebrate our 40th anniversary. In 1974, the IEA was founded with the primary mission of ensuring and improving global energy security. Today, energy security still remains at the centre of the IEA mandate. This publication returns to that core responsibility, providing an overview of the most recent five-year review cycle of our member countries’ energy security and preparedness.
The world has changed dramatically since the founding of the IEA, driving the Agency to evolve and develop its capabilities accordingly. Oil demand patterns have shifted, and, where IEA members once accounted for around three-quarters of global demand, they now account for less than half. This is a challenge but also an opportunity. The IEA works to strengthen and deepen relationships with key partners, pursuing dialogue and information sharing – including in the area of emergency response. Accordingly, this publication contains overviews of emergency policies in Chile, China, India, and in the countries of the Association of Southeast Asian Nations (ASEAN).
While the IEA continues to evolve in response to changing energy security priorities, one thing remains constant, and that is the need to be prepared. The Emergency Response Review cycle provides regular peer assessments of emergency response mechanisms in each IEA member country. These reviews are not only a powerful tool for maintaining emergency preparedness among IEA members, but they also serve as a means to identify and share best practices among and beyond IEA members, thus helping to enhance an effective response to oil supply disruptions and strengthen energy security worldwide. The global nature of energy markets, and the oil market in particular, demands such breadth.
Still, energy security is no longer just about oil. Secure supplies of natural gas and electricity are also of growing importance for keeping our economies and societies functioning. The Emergency Response Review cycle described in this publication has been the first to start incorporating these expanded priorities. Natural gas security has become an integral part of our review process throughout this past cycle, while the current review cycle, already underway at the time of publication, also incorporates assessments of the electricity security of member countries. The more recent work on electricity is reflected and discussed in an annex to this publication.
Emergency oil stocks are a very powerful policy tool for mitigating short-term physical supply disruptions and for providing liquidity to allow market recovery. The stockholding system has undeniably worked well in the past. A recent IEA study, discussed in this publication, shows that not only has the system provided clear benefits, but it has done so at relatively low cost.
As this publication also demonstrates, emergency stocks are not alone in the IEA toolbox. Demand restraint measures, fuel switching capacity and other measures all contribute to a range of emergency response capabilities available to member countries.
As a result, the IEA stands ready to face future energy security challenges with confidence.
This publication is produced under my authority as Executive Director of the IEA.
Maria van der HoevenExecutive Director
International Energy Agency
Overview
CHAPTER 1
CHAPTER 1 Overview 13© O
ECD/
IEA
2014
Overview
IntroductionAgainst the backdrop of the oil crisis of 1973-74, the need to increase energy security was the main objective for the establishment of the International Energy Agency (IEA). Placing a particular emphasis on oil security, the Agency’s founders – a collective of major energy-consuming countries – sought to create effective mechanisms for implementing policies on a broad spectrum of energy issues: mechanisms that were workable, reliable and could be implemented on a co-operative basis.
Forty years on, ensuring energy security is as urgent as ever. Whilst oil security remains a cornerstone of the IEA, the Agency is progressively taking a more comprehensive approach to emergency preparedness. Through periodic reviews, the Agency has strengthened and sharpened the emergency response mechanisms created to counteract short-term oil supply disruptions (see Chapter 2). The Agency has recently expanded these reviews to cover natural gas security as well (Chapter 3). This work continues to evolve, and the Agency has begun work to incorporate electricity security as part of its assessments of energy security and emergency response capabilities (see Annex A).
Defining energy securityThe IEA defines energy security as “the uninterrupted availability of energy sources at an affordable price”. Energy security has many dimensions: long-term energy security mainly deals with timely investments to supply energy in line with economic developments and sustainable environmental needs. Short-term energy security focuses on the ability of the energy system to react promptly to sudden changes within the supply-demand balance.
Lack of energy security is thus linked to the negative economic and social impacts of either physical unavailability of energy, or prices that are not competitive or are overly volatile. In cases such as the international oil market, where prices are allowed to adjust in response to changes in supply and demand, the risk of physical unavailability is limited to extreme events. Supply security concerns are primarily related to the economic damage caused by extreme price spikes. The concern for physical unavailability of supply is more prevalent in energy markets where transmission systems must be kept in constant balance, such as electricity and, to some extent, natural gas. This is particularly the case in instances where there are capacity constraints or where prices are not able to work as an adjustment mechanism to balance supply and demand in the short term.
Ensuring energy security has been at the centre of the mission of the IEA since its inception. The ability to respond collectively in the case of a serious oil supply disruption with short-term emergency response measures remains one of the core activities of the IEA. The long-term aspect of energy security was also included in the Agency’s founding objectives, which called for promoting alternative energy sources in order to reduce oil import dependency. The IEA continues to work to improve energy security over the longer term by promoting energy policies that encourage diversification, both of energy types and supply sources, and that facilitate better functioning and more integrated energy markets.

EnERgy SuPPly SECuRiTy 2014 14 © O
ECD/
IEA
2014
Figure 1.1 Defining energy security
Affordable/competitive supply
Reliable/uninterruptible supply Accessible/available supply
ENERGY SECURITY
Note: unless otherwise indicated, all tables, figures and boxes in this chapter derive from IEA data and analysis.
Establishment of the IEAThe impetus for the Agency grew out of fundamental changes in economics and politics associated with the international oil market leading up to the Middle East War of 1973-74. Oil demand had grown rapidly in countries belonging to the Organisation for Economic Co-operation and Development (OECD). A few decades earlier, oil had begun to erode the dominance of coal as a power source; by mid-century (1950s), it had taken over as the preferred fuel.
To a large degree, oil fuelled the rapid post-war economic growth achieved in OECD member countries. By the 1970s, petroleum was powering transportation, supplying one-third of industrial sector power and roughly one-quarter of electricity generation. This increase in demand for oil, coupled with a decline in oil self-sufficiency in the United States, created a situation in which OECD dependence on oil imports rose steeply in the years leading up to the crisis. Moreover, the Organization of the Petroleum Exporting Countries (OPEC) commanded a very large spare capacity of oil production, which added downward pressure on oil prices. The low prices and apparent abundance of oil encouraged its growing use.
The most vivid political impact of changing market conditions was the decision by Arab producers to use oil as an economic weapon. In October 1973, several countries belonging to the Organization of Arab Petroleum Exporting Countries (OAPEC, consisting of the Arab members of OPEC plus Egypt and Syria) took concerted action to reduce oil production from about 20.8 million barrels per day (mb/d) to about 15.8 mb/d (global oil demand in 1973 was 57.1 mb/d). Around the same time, OPEC opted to fix prices 400% above previous levels. In a relatively short time, the world’s dominant energy source became scarce and expensive.
Overall, the embargo caused a shortfall in the international oil market that reached 4.3 mb/d. A significant reduction in spare capacity in non-OPEC countries further exacerbated the problem. OAPEC production cuts disrupted essential oil supplies to industrial countries, which could do little in the short run to reduce the price spike.

CHAPTER 1 Overview 15© O
ECD/
IEA
2014
These events alerted policy makers in the industrialised countries to the extent of their dependence on oil imports – and to the inherent vulnerability of this dependence. The 16 countries belonging to the OECD had very limited control over one of the commodities most vital to their economies, with no system in place to counter the potentially serious economic and political consequences of an oil supply disruption. These governments agreed to create the IEA and in November 1974 signed the Agreement on an International Energy Program (I.E.P. Agreement). This treaty laid the foundation for a multi-faceted system aimed at helping member countries cope with short-term oil supply disruptions in a co-ordinated and unified manner and build more resilient markets in the medium and longer term.
Box 1.1 Objectives of the International Energy Agency
The primary function of the IEA is to act as energy policy advisor for the governments of its 29 member countries, as well as the premier international energy forum to bring together both members and non-member partner countries and organisations – all with the aim of promoting reliable, affordable and clean energy for consumers. It was founded during the oil crisis of the early 1970’s, with a mandate to coordinate measures in times of oil supply emergencies. This remains a core mission of the agency.
Governments of IEA member countries commit to undertaking joint measures to mitigate the impact of oil supply emergencies. In support of this commitment, they also agree to share energy information, co-ordinate energy policies and co-operate in the development of rational energy programmes. These provisions are embodied in the Agreement on an International Energy Program (I.E.P.), the treaty pursuant to which the Agency was established in 1974.
Since 1974, the IEA has kept pace with developments in the energy scene. Today the basic aims of the IEA are to:
� maintain and improve systems for coping with oil supply disruptions
� promote energy policies in a global context through co-operative relations with industry, non-member countries, and international organisations
� develop energy market analyses and forward-looking scenarios that can inform sound decisions making
� promote environmental sustainability and climate goals by encouraging the transition to a clean energy economy through technological exchange and sustainable policies.
Evolving oil market conditionsAt the time of the creation of the IEA, oil demand in OECD countries represented nearly three-quarters of global oil demand. The oil crises of the 1970s triggered efforts to switch away from oil use towards other energy sources, such as the launch of large nuclear programmes in several countries. As a result, oil use in power generation dropped significantly. At the same time, a number of OECD countries developed domestic oil production. These factors significantly reduced OECD countries’ dependence on imports; by the mid-1980s, dependence reached its lowest level since the 1960s, when the OECD first became a net oil importer.
Within ten years of having established the IEA, oil demand in OECD countries had fallen substantially and represented less than two-thirds of global oil use. However, by the second half of the 1980s growing demand for transportation fuels re-stimulated oil demand growth in OECD member countries, causing demand to outpace increases in domestic supply. As a result, OECD countries’ dependence on imported oil steadily increased. Oil demand in developing countries, principally in Asia, also began to increase in the late 1980s, resulting in an ever-growing share of global oil demand outside of the OECD.
EnERgy SuPPly SECuRiTy 2014 16 © O
ECD/
IEA
2014
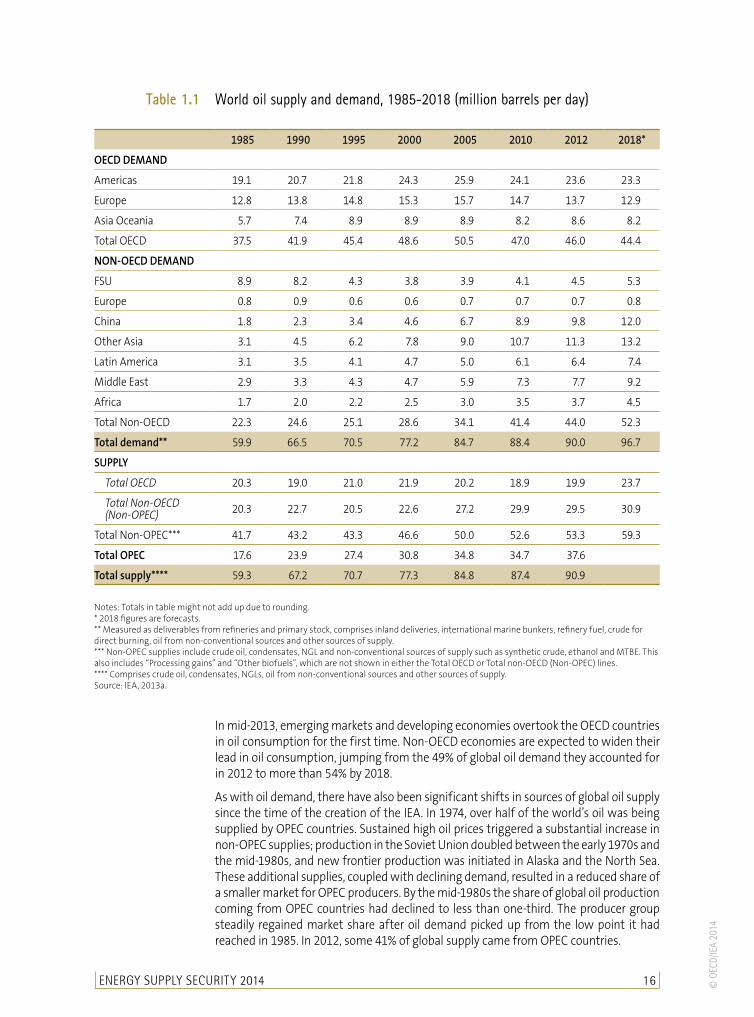
In mid-2013, emerging markets and developing economies overtook the OECD countries in oil consumption for the first time. Non-OECD economies are expected to widen their lead in oil consumption, jumping from the 49% of global oil demand they accounted for in 2012 to more than 54% by 2018.
As with oil demand, there have also been significant shifts in sources of global oil supply since the time of the creation of the IEA. In 1974, over half of the world’s oil was being supplied by OPEC countries. Sustained high oil prices triggered a substantial increase in non-OPEC supplies; production in the Soviet Union doubled between the early 1970s and the mid-1980s, and new frontier production was initiated in Alaska and the North Sea. These additional supplies, coupled with declining demand, resulted in a reduced share of a smaller market for OPEC producers. By the mid-1980s the share of global oil production coming from OPEC countries had declined to less than one-third. The producer group steadily regained market share after oil demand picked up from the low point it had reached in 1985. In 2012, some 41% of global supply came from OPEC countries.
Table 1.1 World oil supply and demand, 1985-2018 (million barrels per day)
1985 1990 1995 2000 2005 2010 2012 2018*
OECD DEMAND
Americas 19.1 20.7 21.8 24.3 25.9 24.1 23.6 23.3
Europe 12.8 13.8 14.8 15.3 15.7 14.7 13.7 12.9
Asia Oceania 5.7 7.4 8.9 8.9 8.9 8.2 8.6 8.2
Total OECD 37.5 41.9 45.4 48.6 50.5 47.0 46.0 44.4
NON-OECD DEMAND
FSU 8.9 8.2 4.3 3.8 3.9 4.1 4.5 5.3
Europe 0.8 0.9 0.6 0.6 0.7 0.7 0.7 0.8
China 1.8 2.3 3.4 4.6 6.7 8.9 9.8 12.0
Other Asia 3.1 4.5 6.2 7.8 9.0 10.7 11.3 13.2
Latin America 3.1 3.5 4.1 4.7 5.0 6.1 6.4 7.4
Middle East 2.9 3.3 4.3 4.7 5.9 7.3 7.7 9.2
Africa 1.7 2.0 2.2 2.5 3.0 3.5 3.7 4.5
Total Non-OECD 22.3 24.6 25.1 28.6 34.1 41.4 44.0 52.3
Total demand** 59.9 66.5 70.5 77.2 84.7 88.4 90.0 96.7
SUPPLY
Total OECD 20.3 19.0 21.0 21.9 20.2 18.9 19.9 23.7
Total Non-OECD (Non-OPEC) 20.3 22.7 20.5 22.6 27.2 29.9 29.5 30.9
Total Non-OPEC*** 41.7 43.2 43.3 46.6 50.0 52.6 53.3 59.3
Total OPEC 17.6 23.9 27.4 30.8 34.8 34.7 37.6
Total supply**** 59.3 67.2 70.7 77.3 84.8 87.4 90.9
Notes: Totals in table might not add up due to rounding. * 2018 figures are forecasts. ** Measured as deliverables from refineries and primary stock, comprises inland deliveries, international marine bunkers, refinery fuel, crude for direct burning, oil from non-conventional sources and other sources of supply. *** Non-OPEC supplies include crude oil, condensates, NGL and non-conventional sources of supply such as synthetic crude, ethanol and MTBE. This also includes “Processing gains” and “Other biofuels”, which are not shown in either the Total OECD or Total non-OECD (Non-OPEC) lines. **** Comprises crude oil, condensates, NGLs, oil from non-conventional sources and other sources of supply. Source: IEA, 2013a.
CHAPTER 1 Overview 17© O
ECD/
IEA
2014
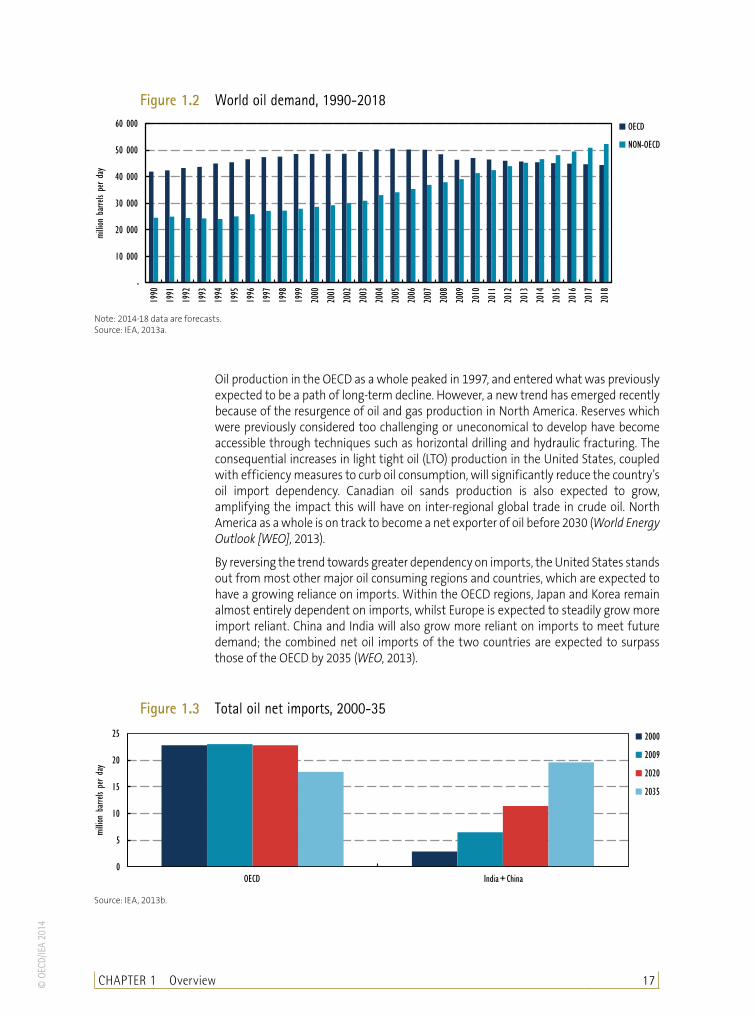
Oil production in the OECD as a whole peaked in 1997, and entered what was previously expected to be a path of long-term decline. However, a new trend has emerged recently because of the resurgence of oil and gas production in North America. Reserves which were previously considered too challenging or uneconomical to develop have become accessible through techniques such as horizontal drilling and hydraulic fracturing. The consequential increases in light tight oil (LTO) production in the United States, coupled with efficiency measures to curb oil consumption, will significantly reduce the country’s oil import dependency. Canadian oil sands production is also expected to grow, amplifying the impact this will have on inter-regional global trade in crude oil. North America as a whole is on track to become a net exporter of oil before 2030 (World Energy Outlook [WEO], 2013).
By reversing the trend towards greater dependency on imports, the United States stands out from most other major oil consuming regions and countries, which are expected to have a growing reliance on imports. Within the OECD regions, Japan and Korea remain almost entirely dependent on imports, whilst Europe is expected to steadily grow more import reliant. China and India will also grow more reliant on imports to meet future demand; the combined net oil imports of the two countries are expected to surpass those of the OECD by 2035 (WEO, 2013).
Figure 1.3 Total oil net imports, 2000-35
0
5
10
15
20
25
OECD India+China
millio
n ba
rrels
per da
y
2000
2009
2020
2035
Source: IEA, 2013b.
Figure 1.2 World oil demand, 1990-2018
-
10 000
20 000
30 000
40 000
50 000
60 000
1990
1991
1992
1993
1994
1995
1996
1997
1998
1999
2000
2001
2002
2003
2004
2005
2006
2007
2008
2009
2010
2011
2012
2013
2014
2015
2016
2017
2018
millio
n ba
rrels
per da
y
OECD
NON-OECD
Note: 2014-18 data are forecasts. Source: IEA, 2013a.
EnERgy SuPPly SECuRiTy 2014 18 © O
ECD/
IEA
2014
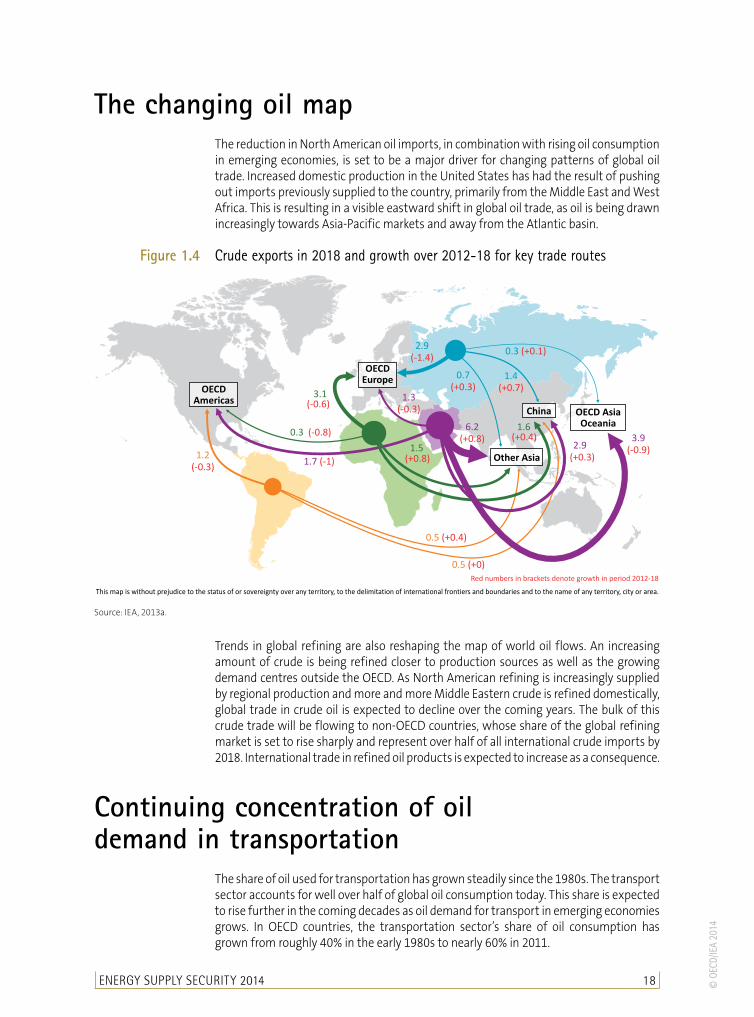
The changing oil mapThe reduction in North American oil imports, in combination with rising oil consumption in emerging economies, is set to be a major driver for changing patterns of global oil trade. Increased domestic production in the United States has had the result of pushing out imports previously supplied to the country, primarily from the Middle East and West Africa. This is resulting in a visible eastward shift in global oil trade, as oil is being drawn increasingly towards Asia-Pacific markets and away from the Atlantic basin.
Figure 1.4 Crude exports in 2018 and growth over 2012-18 for key trade routes
This map is without prejudice to the status of or sovereignty over any territory, to the delimitation of international frontiers and boundaries and to the name of any territory, city or area.
3.1
0.3
Red numbers in brackets denote growth in period 2012-18
OECDEurope
OECD AsiaOceania
OECDAmericas (-0.6)
(-0.8)
1.2
(-0.3)
0.5 (+0.4)
2.9
(+0.3)
6.2
(+0.8) 3.9
(-0.9)
0.5 (+0)
1.7 (-1)
2.9
(-1.4)0.3 (+0.1)
1.4
(+0.7)
0.7
(+0.3)1.3
(-0.3) China
1.5
1.6
(+0.8)
(+0.4)
Other Asia
Source: IEA, 2013a.
Trends in global refining are also reshaping the map of world oil flows. An increasing amount of crude is being refined closer to production sources as well as the growing demand centres outside the OECD. As North American refining is increasingly supplied by regional production and more and more Middle Eastern crude is refined domestically, global trade in crude oil is expected to decline over the coming years. The bulk of this crude trade will be flowing to non-OECD countries, whose share of the global refining market is set to rise sharply and represent over half of all international crude imports by 2018. International trade in refined oil products is expected to increase as a consequence.
Continuing concentration of oil demand in transportation
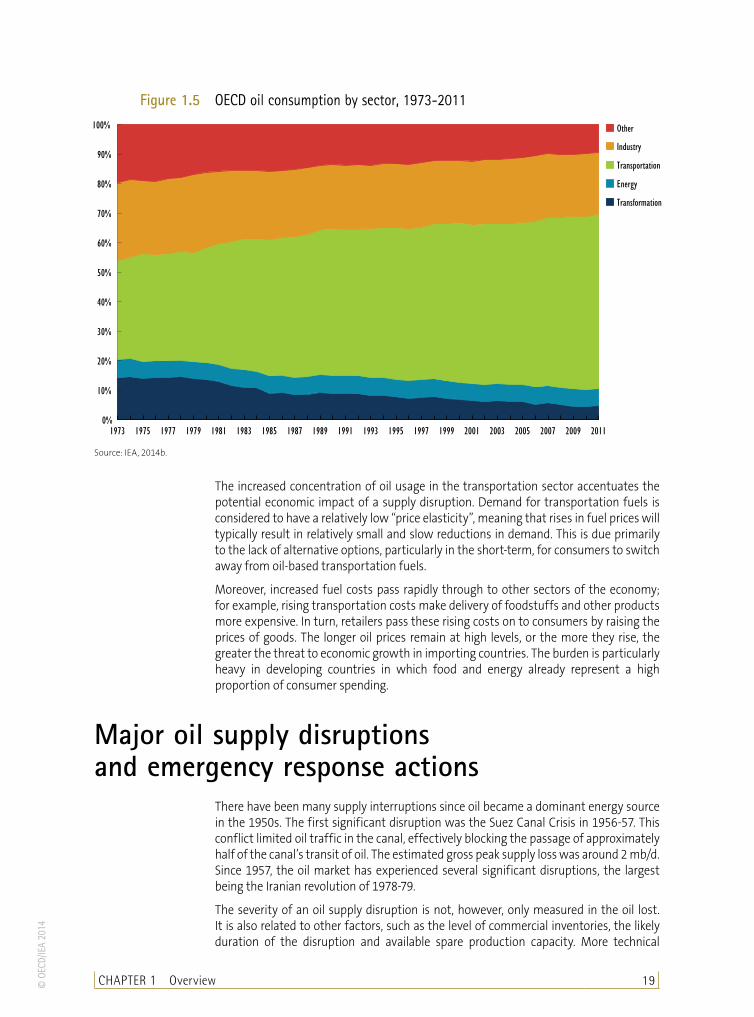
The share of oil used for transportation has grown steadily since the 1980s. The transport sector accounts for well over half of global oil consumption today. This share is expected to rise further in the coming decades as oil demand for transport in emerging economies grows. In OECD countries, the transportation sector’s share of oil consumption has grown from roughly 40% in the early 1980s to nearly 60% in 2011.
CHAPTER 1 Overview 19© O
ECD/
IEA
2014
Figure 1.5 OECD oil consumption by sector, 1973-2011
0%
10%
20%
30%
40%
50%
60%
70%
80%
90%
100%
1973 1975 1977 1979 1981 1983 1985 1987 1989 1991 1993 1995 1997 1999 2001 2003 2005 2007 2009 2011
Other
Industry
Transportation
Energy
Transformation
Source: IEA, 2014b.
The increased concentration of oil usage in the transportation sector accentuates the potential economic impact of a supply disruption. Demand for transportation fuels is considered to have a relatively low “price elasticity”, meaning that rises in fuel prices will typically result in relatively small and slow reductions in demand. This is due primarily to the lack of alternative options, particularly in the short-term, for consumers to switch away from oil-based transportation fuels.
Moreover, increased fuel costs pass rapidly through to other sectors of the economy; for example, rising transportation costs make delivery of foodstuffs and other products more expensive. In turn, retailers pass these rising costs on to consumers by raising the prices of goods. The longer oil prices remain at high levels, or the more they rise, the greater the threat to economic growth in importing countries. The burden is particularly heavy in developing countries in which food and energy already represent a high proportion of consumer spending.
Major oil supply disruptions and emergency response actions
There have been many supply interruptions since oil became a dominant energy source in the 1950s. The first significant disruption was the Suez Canal Crisis in 1956-57. This conflict limited oil traffic in the canal, effectively blocking the passage of approximately half of the canal’s transit of oil. The estimated gross peak supply loss was around 2 mb/d. Since 1957, the oil market has experienced several significant disruptions, the largest being the Iranian revolution of 1978-79.
The severity of an oil supply disruption is not, however, only measured in the oil lost. It is also related to other factors, such as the level of commercial inventories, the likely duration of the disruption and available spare production capacity. More technical

EnErgy Supply SEcurity 2014 20 © O
ECD/
IEA
2014
factors play a role as well, such as the quality of the crude oil lost, seasonality trends and logistical issues. As such, all supply disruptions must be assessed individually.
The market context of an oil supply disruption determines when an emergency action is warranted. If the world market does not have sufficient excess capacity, a relatively small disruption can be quite severe. By contrast, a larger disruption in terms of gross peak
Figure 1.6 Major oil supply disruptions
2.02.0
4.35.6
4.14.3
2.12.6
2.31.5
1.31.5
0.0 1.0 2.0 3.0 4.0 5.0 6.0
Nov 1956 - Mar 1957Jun - Aug 1967
Oct 1973 - Mar 1974Nov 1978 - Apr 1979Oct 1980 - Jan 1981Aug 1990 - Jan 1991
Jun - Jul 2001Dec 2002 - Mar 2003
Mar - Dec 2003September 2005September 2008Feb - Oct 2011
Gross peak supply loss (mb/d)
Libyan Civil War
Hurricanes Gustav/Ike
Hurricanes Katrina/Rita
War in Iraq
Venezuelan strike
Iraqi oil export suspension
Iraqi invasion of Kuwait
Outbreak of Iran-Iraq war
Iranian Revolution
Arab-Israeli War and Arab oil embargo
Six-Day War
Suez Crisis
Box 1.2 The objective of an IEA collective action
The primary purpose of an IEA collective action is to mitigate the economic damage associated with a disruption of oil supply. By temporarily replacing disrupted supplies, the action is intended to help oil markets re-establish the supply/demand balance at a lower price level than would otherwise have been the case.
Managing oil prices is not the purpose of an IEA collective action, however, as high prices can have underlying causes which temporary emergency measures cannot address. Moreover, attempting to manage prices with emergency measures risks masking important market signals, such as the need to invest in supply infrastructure or more fuel efficient technologies, which are essential to assuring supply security in the future.
At the time the IEA was created, policy makers were primarily concerned with the physical unavailability of oil supplies and sought to define a threshold for activating an emergency response based on a specified volume of disrupted oil supply. Oil markets have changed enormously since the first oil shock of 1973-74. As a result of the liberalisation of the oil industry and the development of spot and futures markets, changes in supply and demand are quickly reflected in the international market prices of crude oil and refined products. Increases in spot prices quickly feed through into higher retail prices and the very notion of a “supply shortfall” is misplaced: a reduction of supply would cause prices to rise immediately whilst higher prices would lead to lower demand and bring the market back into balance. However, this rebalancing might require prices to increase substantially in response to a relatively small fall in supply, given the high concentration of oil use in the transportation sector where few short-term alternative options exist.
In the absence of price controls that might cause physical shortages, a sudden fall in global oil supply can cause economic damage through sudden price increases. The purpose of an IEA collective action is to limit the extent and impact of a sudden fall in global oil supply caused by a disruption. In such instances, IEA countries would want to replace lost supplies on a temporary basis in order to prevent economic damage, but they would still allow the market to set the price. Such a move is best described as an effort to stabilise the market rather than to manage prices.
CHAPTER 1 Overview 21© O
ECD/
IEA
2014
supply loss can be manageable in the short term if there is sufficient spare production capacity or commercial oil stocks to offset the oil supply loss.
IEA emergency response mechanisms (described in further detail below) were established to create a concrete and co-operative action plan in the event of a major oil supply disruption. These measures were initially designed to take effect in the event of oil supply disruptions involving a loss of 7% or more of normal oil supply, either for the IEA as a whole or any individual member country. However, as oil markets have evolved, so have the tools of the IEA for responding to supply disruptions. In the event of a supply disruption, a detailed impact assessment is used to determine how and when to resort to emergency measures.
Since the creation of the IEA, member countries have taken collective action on three occasions: in the build-up to the Gulf War in 1991; after hurricanes Katrina and Rita damaged offshore oil rigs, pipelines and oil refineries in the Gulf of Mexico in 2005; and in response to the prolonged disruption of oil supplies from Libya in 2011 (for more information on these actions, see Annex F).
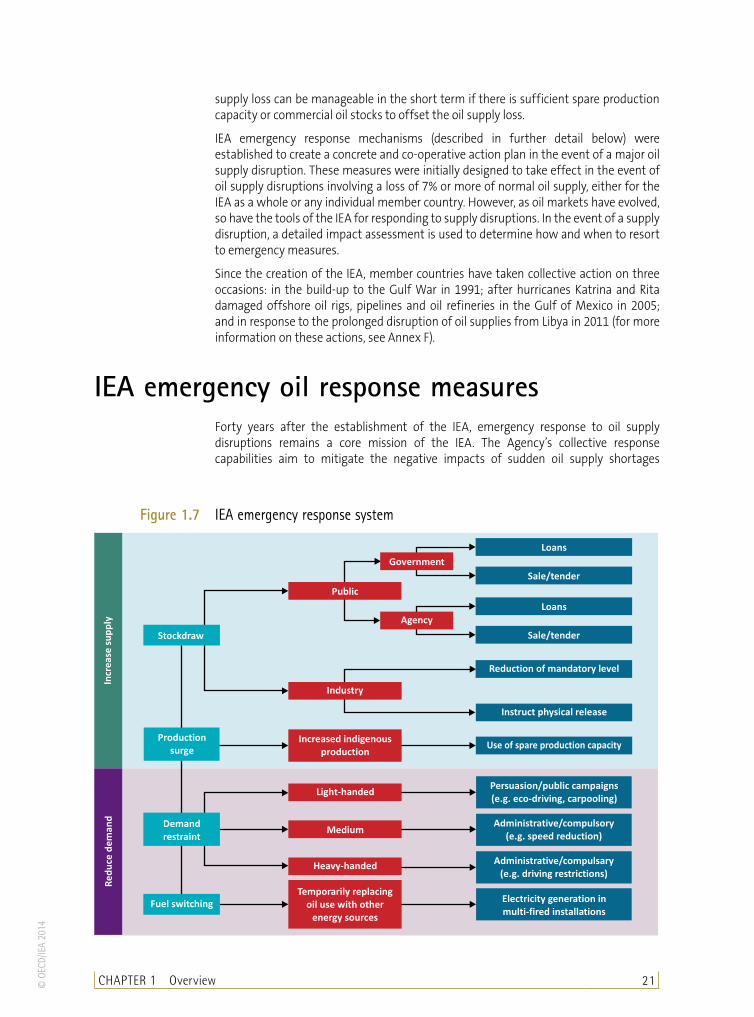
IEA emergency oil response measuresForty years after the establishment of the IEA, emergency response to oil supply disruptions remains a core mission of the IEA. The Agency’s collective response capabilities aim to mitigate the negative impacts of sudden oil supply shortages
Figure 1.7 IEA emergency response system
Production
surge
Stockdraw
Government
Public
Agency
Loans
Loans
Sale/tender
Sale/tender
Reduction of mandatory level
Instruct physical release
Use of spare production capacity
Industry
Increased indigenous
production
Demand
restraint
Fuel switching
Persuasion/public campaigns
(e.g. eco-driving, carpooling)
Administrative/compulsory
(e.g. speed reduction)
Administrative/compulsary
(e.g. driving restrictions)
Electricity generation in
multi-fired installations
Light-handed
Medium
Heavy-handed
Temporarily replacing
oil use with other
energy sources
Incr
ea
sesu
pp
lyR
ed
uce
de
ma
nd

EnERgy SuPPly SECuRiTy 2014 22 © O
ECD/
IEA
2014
by making additional oil available to the global market. This is achieved through a combination of emergency response measures designed to increase supply and reduce demand with stock release as the preferred option.
The IEA emergency policy focuses on alleviating short-term oil supply disruptions. It is not a tool for price intervention or long-term supply management, both of which are more effectively addressed through other policies that the IEA encourages, such as: oil import reduction, energy efficiency, energy diversification, or research, development and investment in alternative energy technologies.
Box 1.3 How does the IEA system work in practice?
In the event of an actual or potentially severe oil supply disruption, the IEA Secretariat first assesses its market impact and the need for an IEA co-ordinated response. The assessment includes an estimate of the market’s net loss of oil, taking into account any spare production capacity that can be quickly brought on line following an exchange of information with producers, producing countries’ governments and international organisations.
This assessment is the basis on which the IEA Executive Director then consults with and provides advice to the IEA Governing Board.1 In the past, this consultation process to determine the need for IEA co-ordinated action and subsequent recommendation has been accomplished within 24 hours.
Once the need for co-ordinated action has been agreed, member countries participate according to national circumstances. Each member country’s share of the total response is generally proportionate to its share of total IEA oil consumption.
Throughout the decision-making and implementation process, IEA stakeholders benefit from the input and advice of industry experts through the IEA Industry Advisory Board (IAB, established in 1975). In order to fulfil its role, the IAB participates regularly in IEA meetings on oil supply security. The IAB membership is drawn from the major oil companies with headquarters in IEA countries.
Measures to increase oil supply
StockdrawAmong the emergency response measures at hand, stockdraw is the most commonly used: it is the most effective first line of defence for providing additional oil to an under-supplied market and can be complemented by other emergency measures during a co-ordinated action.
IEA countries are obliged to hold stock levels equivalent to at least 90 days of their net imports (see Chapter 2, Box 2.1). Stocks are generally held either by industry or a combination of industry and a public entity, i.e. by the government and/or agency established to fulfil this role. During an oil supply disruption, member countries can release stocks through various options. In countries where there is a substantial obligation on industry to hold stocks, the most common course of action is for the government to allow, temporarily, a decrease in industry’s compulsory stockholding levels in line with the country’s share of the total IEA response. For countries with publicly held stocks, stock release typically involves offering specified amounts from these public reserves for sale or lease. (Stockholding arrangements are described in detail in Chapter 2; for a country-by-country analysis, see Chapter 4.)
1. The IEA Governing Board is the IEA highest political decision-making body comprising ministers and/or their representatives.

CHAPTER 1 Overview 23© O
ECD/
IEA
2014
Figure 1.8 Total oil stocks in IEA regions
Europe
Americas
Public IndustryPublic Industry
Public Industry
Asia Oceania
Data as of end June 2013Crude, NGLs and feedstocks Finished product
696
1
642 665
211 255362
510
386
21242
167
This map is without prejudice to the status of or sovereignty over any territory, to the delimita�on of interna�onal fron�ers and boundaries and to the name of any territory, city or area.
Note: oil stocks as of end-June 2013. Source: IEA, 2014b.
Total oil stocks in IEA countries amounted to just under 4.2 billion barrels as of end-June 2013. More than 1.5 billion barrels of this amount was in the form of public stocks, held exclusively for emergency purposes. The 2.6 billion barrels of industry stocks include both stocks held to meet government imposed minimum stockholding obligations and stocks held for commercial purposes.
Figure 1.9 Total oil stocks at year end, 1984-2013*
0
500
1 000
1 500
2 000
2 500
3 000
3 500
4 000
4 500
1984 1986 1988 1990 1992 1994 1996 1998 2000 2002 2004 2006 2008 2010 2012
Millio
n ba
rrels
Industry
Public
*End-year oil stock levels; 2013 is level at end-June. Source: IEA, 2014b.

EnERgy SuPPly SECuRiTy 2014 24 © O
ECD/
IEA
2014
The IEA minimum stockholding requirement does not stipulate the type of oil held; it can be met with stocks of either crude or refined products. In this respect, there are important differences in the composition of stocks held publicly or by industry. At present, some 83% of publicly held stock is in the form of crude oil. By contrast, industry holds roughly 45% in crude oil and the majority in oil products.
Significant regional differences in stockholdings are also evident. In IEA North America, over 65% of all stocks and virtually all public stocks are in the form of crude oil. IEA Europe holds a greater share of oil products, reflecting EU regulations on stockholding (see Chapter 2 and Annex D). In IEA Pacific, three-quarters of all stocks are in the form of crude oil and in IEA North America the vast majority of publicly held stocks (95%) are also crude oil.
The aggregate stock level for IEA countries of 4.2 billion barrels is a significant increase from the mid-1980s, when these barely reached 3.0 billion barrels. The steady growth of aggregate stocks reflects the increase in oil demand and subsequent net imports resulting in larger stockholdings, political decisions by some member countries to increase their public stockholding, as well as increased IEA membership.
Production surgeSurge production is another emergency response measure designed to increase the availability of oil supply. More specifically, it is a short-term measure to increase indigenous oil production within a very short period of time. The measure is limited to member countries with significant levels of production, and the potential volume available in a crisis depends on the amount of spare or surge production capacity maintained in individual member countries.
In the current oil market climate, this option is much less viable: overall, IEA countries have little or no spare capacity. In addition, the need to maintain good oilfield practices limits the extent to which oil production can be increased on a short-term basis.
Measures to reduce oil use
Demand restraintShort-term reductions in the use of oil are an important part of any response to a supply disruption; the most important means of achieving this is through demand restraint measures. One of the key goals of demand restraint measures is to free up oil in an under-supplied market. Such measures are not restricted to one particular sector of consumption. For instance, in the residential sector when oil is used for heating, oil consumption can be substantially reduced through publicity campaigns that encourage people to turn down the thermostat a few degrees during the winter. Where the industry sector uses oil for power, a possible limit on operating times may be effective for reducing consumption.
Because of the high – and increasing – proportion of oil used for transportation, most demand restraint policies focus on this sector. This sector is more multi-faceted and requires a range of measures. At one end of the spectrum, measures can be very light-handed such as encouraging people to drive less, to carpool or to drive more efficiently. At the other extreme, governments can impose very heavy-handed measures, such as rationing or allocation of oil. (See Chapter 2 for more details on demand restraint capabilities in IEA countries.)

CHAPTER 1 Overview 25© O
ECD/
IEA
2014
Fuel switchingFuel switching is another measure that, similarly to demand restraint, seeks to reduce the use of oil during a supply disruption. It is a short-term measure that encourages the use of other energy sources as alternatives to oil. This includes, for example, using coal or natural gas rather than oil in electricity production.
The actual potential to use fuel switching in a crisis has declined significantly in member countries since the 1970s. In particular, the growth in natural gas and gas-only power stations leaves little scope for fuel switching in power generation. Oil-fired electricity generation in IEA countries has declined significantly since 1973, when oil accounted for close to 25% of electricity generation, compared to around 3% in 2012. An increasing share of oil is used in the transport sector. In 1973, this sector accounted for less than 35% of oil consumption; this percentage had increased to nearly 60% in 2011. In the short run, there is virtually no potential to switch to other fuel sources for transportation. (Chapter 2 has a more detailed analysis of fuel switching capabilities in IEA countries.)
Being prepared is keyThe emergency measures available through the IEA would not be sufficient to effectively deal with a disruption in oil supply without continuous monitoring and communicating of regular updates on the global oil market, along with regular training and testing. The IEA pursues a range of preparatory activities, many of which require direct participation by member countries.
IEA analysts continuously monitor the market. The Agency collects comprehensive oil data from OECD member countries on a monthly basis. It also gathers data for non-OECD member countries on a periodic basis, according to availability. In the case of a crisis, the regular reporting of data is complemented by additional information gathered from various sources, including specific emergency questionnaires. IEA oil market analysts use these data for various purposes. Every month, the IEA publishes the Oil Market Report, which highlights results of its in-depth data collection and analysis of the oil market, focusing on current issues such as demand, supply, stocks, price and refining. In addition, the Agency produces internal daily and weekly reports as well as annual Medium-Term Market Reports to analyse market trends five years forward. Its strong analytical capabilities enable the IEA to assess supply disruptions quickly and to provide member countries with timely and appropriate information.
The IEA system’s ability to communicate with its members on a real time basis across continents enables it to reach decisions within hours. It reinforces this ability by periodically conducting emergency response exercises (EREs), which are made up of a series of workshops and exercises to train and test policies, procedures and personnel. In addition to the participation of all member countries, the Agency invites candidate countries and major consuming non-member countries to participate. The objective is to ensure countries’ readiness to act quickly and effectively by simulating the decision-making process.
In a five-year cycle, the IEA Secretariat and member country representatives conduct peer reviews of each IEA country’s national emergency preparedness. These reviews assess procedures and institutional arrangements. Each member country then receives its report with recommendations; reports and recommendations are discussed by all member countries.
A critical component of the IEA crisis management strategy is robust dialogue with major oil producers and the OPEC Secretariat. IEA and OPEC have already co-operated
EnERgy SuPPly SECuRiTy 2014 26 © O
ECD/
IEA
2014
on a number of occasions to mitigate the effects of an oil supply disruption as both organisations have a clear interest in the stability of the world oil market.
Recognising that oil consumption and net imports in some non-member countries are increasing rapidly, the IEA promotes dialogue and information sharing on oil security policies and shares information and experience on creating national emergency oil stocks with key transition and emerging economies, such as China, India and countries of the Association of Southeast Asian Nations (ASEAN). Expanding international co-operation with all players in the global energy markets to improve market transparency through the collection of more accurate and timely data is also a critical component of IEA work towards greater energy security.
Box 1.4 Quantifying energy security
Historically, energy security was primarily associated with oil supply. Whilst oil supply remains a key issue, the increasing complexity of energy systems requires systematic and rigorous understanding of a wider range of vulnerabilities. Disruptions can affect other fuel sources, infrastructure or end-use sectors. Thus, analysis of oil supply security alone is no longer sufficient for understanding a country’s energy security situation as a whole.
One of the ways in which the IEA is responding to this challenge is by developing a comprehensive tool to measure energy security. The Model of Short-term Energy Security (MOSES) examines both risks and resilience factors associated with short-term physical disruptions of energy supply that can last for days or weeks. MOSES extends beyond oil to monitor and analyse several important energy sources, as well as the non-energy components (such as infrastructure) that comprise an energy system. Analysis of vulnerability for fossil fuel disruptions, for example, is based on risk factors such as net-import dependence and the political stability of suppliers. Resilience factors include the number of entry points for a country (e.g. ports and pipelines), the level of stocks and the diversity of suppliers. For more information on MOSES, see Annex B.
An evolving energy landscapeSince the founding of the IEA, considerable changes have taken place in the energy world that have impacted both the nature and scope of energy security. Whilst the share of oil in the world’s energy supply mix has declined, it will remain the most important fuel in the world’s primary energy supply for the foreseeable future. Oil will continue to play a vital role in the economic health of the global economy, particularly in the transportation sector where oil dependency has remained high and there are few viable alternatives. It remains as critical as ever to have effective and rapidly deployable emergency response measures. Yet fundamental changes, such as the growing share of global oil demand from countries outside the IEA and the shifting patterns in global oil market flows require continued vigilance that emergency response systems remain effective.
Natural gas has taken on an ever greater role in the world’s energy mix, growing from 16% to over 21% of total primary energy supply in the period since the IEA was created. In IEA countries, natural gas accounted for over 25% of the total primary energy supply mix in 2012. Natural gas markets have become more integrated, and as most major consumer countries become more reliant on imports, a greater share of gas is supplied via longer pipelines and longer liquefied natural gas (LNG) routes. Given the rising importance of natural gas as an energy source and the increasing physical distances between production and consumption, there is a growing need to assess countries’ vulnerabilities and response options for dealing with a severe disruption. For this reason, the IEA included natural gas in the most recently concluded round of emergency
CHAPTER 1 Overview 27© O
ECD/
IEA
2014
response reviews of member countries. The results of these reviews, covering oil and gas emergency response, are examined in more detail in the following chapters.
In recent years, electricity security has become a growing concern in many emerging markets as well as in OECD countries. Demand for electricity is set to rise faster than any other final form of energy, expanding by more than two-thirds over the period from 2011 to 2035 (WEO, 2013).There is a formidable need for global energy investment to meet growing demand from emerging countries and to replace ageing generation capacity in OECD countries. Another important challenge will be integrating an increasing share of variable renewable energy generation without jeopardising security of supply. Natural gas is gaining prominence as a primary fuel for power generation, providing flexibility to base load and critical peak power and setting the price of electricity. As such, gas and electricity markets are increasingly intertwined in security, cost and reliability. The IEA is undertaking work to expand its analysis to cover electricity security by including the topic in emergency response reviews. Based on these developments, future updates to this publication will include detailed analysis of electricity security in individual IEA countries.
ReferencesInternational Energy Agency (IEA) (2013a), Medium-Term Oil Market Report, OECD/IEA, Paris.
IEA (2013b), “Inter-regional oil net trade in the New Policies Scenario,” World Energy Outlook, OECD/IEA, Paris.
IEA (2014a), Oil, Gas, Coal and Electricity, Volume 2014 Issue 1, Quarterly Statistics, Third Quarter 2013, OECD/IEA, Paris.
IEA, (2014b), Monthly Oil Statistics, OECD/IEA, Paris.
International Monetary Fund (IMF) (2013), World Economic Outlook (WEO), IMF, Washington, D.C.
List of figuresFigure 1.1: Defining energy security 14Figure 1.2: World oil demand, 1990-2018 17Figure 1.3: Total oil net imports, 2000-35 17Figure 1.4: Crude exports in 2018 and growth over 2012-18 for key trade routes 18Figure 1.5: OECD oil consumption by sector, 1973-2011 19Figure 1.6: Major oil supply disruptions 20Figure 1.7: iEA emergency response system 21Figure 1.8: Total oil stocks in iEA regions 23Figure 1.9: Total oil stocks at year end, 1984-2013 23
List of tableTable 1.1: World oil supply and demand, 1985-2018 16
List of boxesBox 1.1: Objectives of the international Energy Agency 15Box 1.2: The objective of an iEA collective action 20Box 1.3: How does the iEA system work in practice? 22Box 1.4: Quantifying energy security 26

CHAPTER 2 Emergency oil response systems in IEA countries 29© O
ECD/
IEA
2014
Emergency oil response systems in IEA countries
CHAPTER 2
IntroductionThe emergency response systems of International Energy Agency (IEA) member countries are mechanisms through which the Agency is able to co-ordinate actions to mitigate the effects of short-term oil supply disruptions. Part of the IEA mandate is to ensure that the measures remain effective as the oil market evolves. To this end, the IEA conducts country-by-country Emergency Response Reviews (ERRs) on a regular basis. While the scope of these reviews has been broadened beyond just oil, reviewing the ability of IEA countries to cope with short-term oil supply disruptions remains a primary focus. This chapter summarises the findings of the oil portion of the latest cycle of reviews, which was concluded in 2012.
Decision-making structureIn most IEA countries, the responsibility for oil security policy ultimately rests with one particular government minister. Security policy encompasses decisions regarding the release of emergency oil stocks or implementation of other emergency measures.
The minister typically delegates responsibility for the preparation and implementation of national emergency measures to the country’s national emergency strategy organisation (NESO), along with the task of liaising with the IEA on matters of international co-ordination during an emergency. The structures of NESOs differ from country to country, reflecting a wide variety of oil supply and political structures.
NESOs also involve oil industry personnel to varying degrees. The permanent core of the NESO structure usually comprises oil market experts from within the government department concerned with energy matters. When activated during an emergency, the NESO structure expands to include a broader range of government offices and industry representatives. Most NESOs have a dual mission: in addition to holding governmental authority for national oil emergency management, they monitor domestic oil market activities.
Stockholding requirementsIn accordance with the International Energy Program (I.E.P.) Agreement, each IEA country has an obligation to hold oil stocks that equate to no less than 90 days of net imports (see Box 2.1). This basic oil stockholding obligation of IEA countries was first formulated in 1974 to establish “a common emergency self-sufficiency in oil supplies.” In 2013, there were three net exporting IEA countries: Canada, Denmark and Norway. These countries do not have a stockholding obligation under the I.E.P. Agreement.
Of the 29 IEA countries, 20 countries also have minimum stockholding obligations as member states of the European Union (EU). A new oil stockholding EU Directive was adopted in 2009, which has brought the EU system closer in line with that of the IEA

EnERgy SuPPly SECuRITy 2014 30 © O
ECD/
IEA
2014
(see Annex D). For the majority of countries that are members of both organisations, the IEA and EU minimum stockholding obligations are now the same, with the additional requirement under the EU rules that at least one-third of the obligation be met with refined product stocks (the IEA stockholding requirement does not specify how the oil is to be held).
For a small number of countries, the minimum stockholding obligation is greater under the EU system than under that of the IEA, as the EU rules require countries to cover either 90 days of net imports or 61 days of consumption, whichever is greater. Thus net exporting countries (e.g. Denmark), or countries with relatively small levels of net imports compared to domestic consumption (e.g. Estonia, United Kingdom), are required to hold 61 days of consumption under the EU requirements compared to no obligation or only a minimal stockholding obligation under the IEA system.
Stockholding systems of IEA countriesStockholding regimes vary across IEA countries, reflecting differences in oil market structure, geography and national policy choices related to emergency response. In the case of countries that are also members of the European Union, the stockholding policy reflects the need to comply with both systems. In general, there are three approaches to guarantee that overall stock levels meet minimum requirements: industry stocks, government stocks and agency stocks. Some countries use only one category of stockholding to meet the minimum obligation; most countries use a combination of categories.
Box 2.1 IEA emergency reserve calculation: Minimum 90 days of net imports
The IEA minimum stockholding obligation is based on net imports of all oil, including both primary products (such as crude oil and natural gas liquids [NGLs]) and refined products. It does not cover naphtha and volumes of oil used for international marine bunkers.
The 90-day commitment of each IEA country is based on average daily net imports of the previous calendar year. This commitment can be met through stocks held exclusively for emergency purposes and stocks held for commercial or operational use, including stocks held at refineries, port facilities and in tankers in ports. The obligation specifies several types of stocks that cannot be counted towards the commitment, including military stocks, volumes in tankers at sea, in pipelines, at service stations or amounts held by end-consumers (tertiary stocks). It also does not include crude oil not yet produced.
Member countries can arrange to store oil outside of their national boundaries and include such stocks in meeting their minimum requirement. This option is particularly important for countries in which storage capacity constraints or supply logistics make domestic storage insufficient. To exercise this option and count the stocks held abroad towards the obligation, the governments involved must sign bilateral agreements assuring the viability of the stocks in an emergency.
When evaluating a country’s compliance with the 90-day obligation, the IEA applies a 10% deduction to its total stocks, net any oil held under bilateral agreements. This accounts for any volumes that are technically unavailable (such as tank bottoms). (See “Annex C: Definitions and methodology” and www.iea.org/ netimports.asp).

CHAPTER 2 Emergency oil response systems in IEA countries 31© O
ECD/
IEA
2014
Stockholding structure
Industry stocks Stocks held by industry, whether for commercial purposes or in order to comply with national stockholding rules, count towards meeting a country’s IEA stockholding commitment. Most member governments require certain companies, such as importers, refiners, product suppliers or wholesalers, to hold a minimum number of days of stocks. Generally, the required amount is set in proportion to the company’s oil import share or its share of sales in the domestic market. These obligated industry stocks are included in the overall industry stock levels reported for a country. IEA data on industry oil stocks, unless otherwise noted, are defined as all primary stocks on national territory, including stocks held by industry to comply with national emergency stockholding rules.
In 2013, 20 out of the 29 countries opted to meet all or part of their obligation by placing a stockholding requirement on industry. Of the 20 countries imposing minimum stockholding obligations on industry, six use this approach to meet the totality of their IEA obligation. They are Greece, Italy, Luxembourg, Sweden, Turkey and the United Kingdom. Norway has no IEA stockholding obligation as a net-exporter, however it places an obligation on companies that produce or import petroleum products in Norway to store product stocks corresponding to 20 days of normal consumption, which would then be used for emergencies. The following countries do not place such an obligation on industry: Australia, Canada, the Czech Republic, Estonia, Germany, Hungary, New Zealand, the Slovak Republic and the United States. Although these countries place no formal obligation on industry, their industry commercial stocks count towards the IEA obligation of 90 days of net imports.
Government stocksGovernment-owned stocks are one of the means by which countries can ensure their IEA minimum stockholding requirement. These are typically financed through the central government budget and held exclusively for emergency purposes. In 2013, eight countries held government stocks: the Czech Republic, Ireland, Japan, the Republic of Korea, New Zealand, Poland and the United States.
Agency stocksSome countries have a stockholding arrangement that involves establishing a separate agency endowed with the responsibility of holding all or part of the stock obligation. The agency structure and arrangements vary from country to country but in all cases are clearly defined by state legislation. Several countries have government-administered schemes (e.g. Belgium, Estonia, Finland, Hungary, Ireland, the Netherlands, Portugal and Spain). Others are industry-led and/or industry-owned entities (e.g. Austria, Denmark, France, Germany and the Slovak Republic).
Public stocksThe IEA refers to government and agency stocks as “public” stocks (including stocks held by industry-owned stockholding agencies). Such stocks have the advantage of providing a clear indication of oil available solely for emergency purposes. In recent years, the role of public stocks has increased noticeably in the overall emergency response potential of the IEA, both in terms of the number of countries holding public stocks and in the total volume being held.
EnERgy SuPPly SECuRITy 2014 32 © O
ECD/
IEA
2014
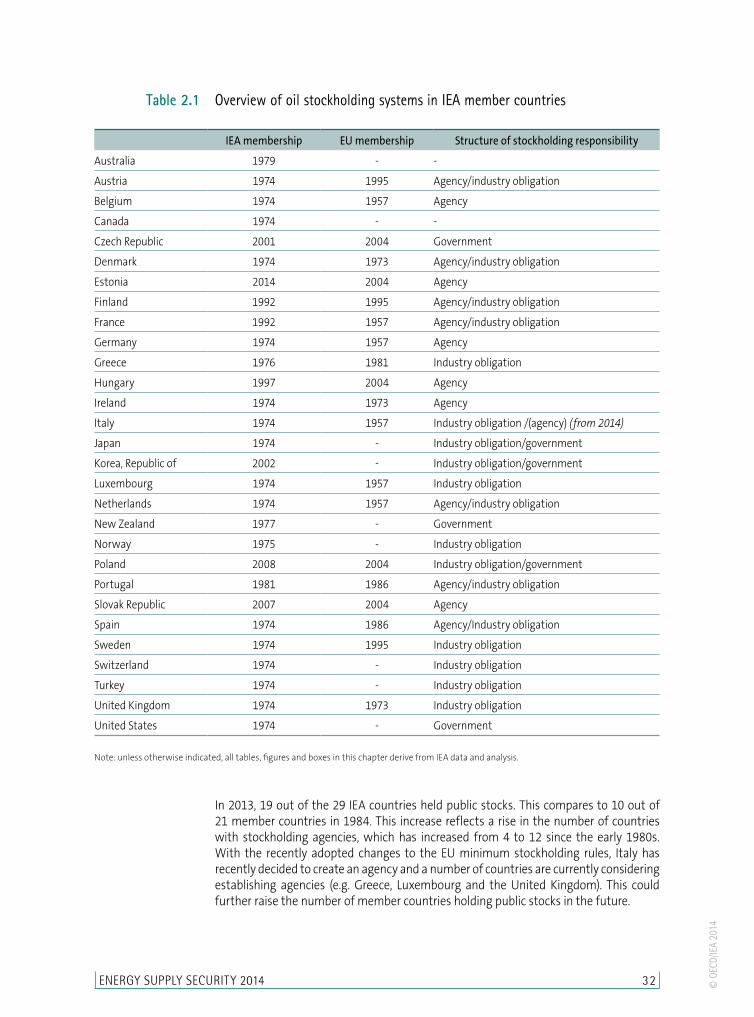
In 2013, 19 out of the 29 IEA countries held public stocks. This compares to 10 out of 21 member countries in 1984. This increase reflects a rise in the number of countries with stockholding agencies, which has increased from 4 to 12 since the early 1980s. With the recently adopted changes to the EU minimum stockholding rules, Italy has recently decided to create an agency and a number of countries are currently considering establishing agencies (e.g. Greece, Luxembourg and the United Kingdom). This could further raise the number of member countries holding public stocks in the future.
Table 2.1 Overview of oil stockholding systems in IEA member countries
IEA membership EU membership Structure of stockholding responsibility
Australia 1979 - -
Austria 1974 1995 Agency/industry obligation
Belgium 1974 1957 Agency
Canada 1974 - -
Czech Republic 2001 2004 Government
Denmark 1974 1973 Agency/industry obligation
Estonia 2014 2004 Agency
Finland 1992 1995 Agency/industry obligation
France 1992 1957 Agency/industry obligation
Germany 1974 1957 Agency
Greece 1976 1981 Industry obligation
Hungary 1997 2004 Agency
Ireland 1974 1973 Agency
Italy 1974 1957 Industry obligation /(agency) (from 2014)
Japan 1974 - Industry obligation/government
Korea, Republic of 2002 - Industry obligation/government
Luxembourg 1974 1957 Industry obligation
Netherlands 1974 1957 Agency/industry obligation
New Zealand 1977 - Government
Norway 1975 - Industry obligation
Poland 2008 2004 Industry obligation/government
Portugal 1981 1986 Agency/industry obligation
Slovak Republic 2007 2004 Agency
Spain 1974 1986 Agency/Industry obligation
Sweden 1974 1995 Industry obligation
Switzerland 1974 - Industry obligation
Turkey 1974 - Industry obligation
United Kingdom 1974 1973 Industry obligation
United States 1974 - Government
Note: unless otherwise indicated, all tables, figures and boxes in this chapter derive from IEA data and analysis.

CHAPTER 2 Emergency oil response systems in IEA countries 33© O
ECD/
IEA
2014
The relative portion of the minimum stockholding obligation covered by public stocks varies from country to country. In most cases, public stocks, including both crude and refined products, cover more than half of the country’s minimum stockholding obligation. In other countries public stocks cover well beyond 90 days of net imports (see Figure 2.2). In some instances, this is because of declining net imports, resulting in a greater number of days’ cover for a given volume of public stocks. In the case of Estonia, the IEA stockholding requirement in terms of net imports is substantially lower than the level of stocks the country must hold to meet its 61 days of consumption as a member of the European Union. Denmark also holds public stocks to meet its EU stockholding requirements; however, as a net-exporter, Denmark has no IEA minimum stockholding requirement.
Figure 2.2 Public stocks as a share of a country’s IEA stockholding obligation
0%
50%
100%
150%
200%
Crude Oil Refined Product
Note: public stock levels at end-June 2013; 100% = 90 days. Source: IEA, 2014.
In ten IEA countries, public stocks are combined with a minimum stockholding obligation on industry. These include Poland, Portugal and Spain, where the proportion of public stock cover is lower compared to other public stockholding member countries. In these countries, the remainder of the IEA minimum requirement is met by stockholding obligations set on industry. In the case of New Zealand, while there is no stockholding obligation set on industry, the country relies on industry’s commercial stocks to cover the bulk of its IEA minimum requirement and holds public stocks in the amount necessary to meet the remaining portion of the 90-day level.
Figure 2.1 Industry versus public stocks as share of total IEA stocks
Public23%
Public37%
Industry63%
Industry77%
1984 2013
Source: IEA, 2014.

EnERgy SuPPly SECuRITy 2014 34 © O
ECD/
IEA
2014
One general attraction of a mixed system, where both public stocks are held and a minimum obligation is set on industry, is that it can improve overall “visibility” of emergency stocks while maintaining an operational link with the oil companies. This should help to ensure rapid drawdown in an emergency. Nevertheless, there is no single, perfect system for maintaining the required minimum stockholding level. Any given stockholding arrangement will have both advantages and disadvantages in terms of efficiency, cost and equity. Ultimately, the choice will depend on the particular country’s circumstances.
Box 2.2 Comparing stockholding arrangements
The arrangement for stockholding (industry, agency, or government, or any combination thereof) may differ from the way in which physical stocks are actually held. For example, obligatory industry stocks may be commingled with operational stocks, with the benefit of ensuring that stocks are ready for use – i.e. they are already “in” the supply chain. However, in some cases it can be difficult to distinguish between operational and obligatory stocks and thus difficult to monitor the stockholding obligation and the availability of these stocks in a crisis. By contrast, it is relatively easy to monitor stocks that are totally segregated from operational stocks (e.g. kept in separate emergency reserves or in single-purpose caverns). Segregation may add visibility to emergency stocks, but it may take longer to release such stocks into the market and, particularly in the case of refined products, it may require a programme of refreshing the volumes in order to maintain quality specifications. Another approach is to hold emergency stocks in tanks located within commercial tank farms, where the location of the volume of emergency stock can be pinpointed at any moment and made available during a crisis. This approach may offer the dual benefits of the held stocks being visible and easy to check, yet also readily available to be quickly brought into the operational system in times of emergency.
A large proportion of the total of IEA publicly held stocks is segregated, i.e. not commingled with industry operational stocks. This is principally because of the large volume of public stocks held in segregated underground salt dome formations in the United States. There are also substantial portions of public stocks held segregated in Belgium, the Czech Republic, Denmark, Hungary and the Slovak Republic (see Table 2.2). Segregated public stocks have the benefit of being highly visible and thus injecting a sense of stability into the market.
Crude oil versus product stocksThe IEA stockholding obligation does not specify whether stocks should be held in the form of crude or refined oil. IEA countries that also belong to the European Union typically hold product stocks based on EU regulations which require that at least one-third of the obligation be covered by product stocks.
The choice between holding reserves in either crude oil or refined products will depend on specific factors in each individual member country. One factor is the financial burden of storage, which can be significantly higher for refined products than for crude oil. Countries with a large refining industry will likely hold more crude oil, which provides greater flexibility in times of crisis. In countries that have limited domestic refining capacity or rely on product imports to meet a large share of domestic demand, there is a greater tendency to hold reserves of refined products.
As of 2013, total oil stocks in IEA countries (including both volumes held exclusively for emergency purposes and those held for commercial or operational use) were weighted towards crude (60%) over petroleum products (40%). This reflects the large volumes

CHAPTER 2 Emergency oil response systems in IEA countries 35© O
ECD/
IEA
2014
of crude in the Strategic Petroleum Reserve (SPR) in the United States and Japan’s government-owned stocks managed by Japan Oil, Gas and Metals National Corporation (JOGMEC). In IEA Europe, the split was reversed, with just over 40% crude and nearly 60% in petroleum products – a direct result of the EU obligation to hold product stocks. Significant differences are also evident from country to country. At one end of the spectrum, Japan holds over 80% of its stocks as crude (nearly all government-owned stocks managed by JOGMEC are crude oil). Similarly, the US government holds all but a fraction of its public stocks in the form of crude oil, while industry holds the majority of its stocks in products. In contrast, Luxembourg and Switzerland hold all or virtually all their stocks in products: the former has no refineries; the latter has only two refineries. To make up for this limited (or complete lack of) refining capacity, both countries have industry-only stockholding arrangements that require product importers to stock a given percentage of their imports.
Location and availabilityIn specific instances, member countries are able to count stocks held in the territory of other countries in order to fulfil their minimum stockholding requirements. This can include stocks held in other countries for logistical purposes, such as at a neighbouring country’s port where volumes are unloaded and delivered by pipeline (e.g. the Italian port of Trieste for Austrian stocks). Stocks counted towards the minimum obligation can also include those held under bilateral agreements between governments, which guarantee access to such stocks during a crisis. This creates efficiencies in stockholding, especially for countries with insufficient storage capacity or in which a major demand centre is located on or near an international border.
Interconnectivity of the oil market infrastructure can also facilitate spare storage capacity or more cost-effective storage by utilising capacity in neighbouring countries. This flexibility is often an important means of enabling industry participants to meet stockholding obligations imposed by the government. In some cases, the stocks held abroad are actually owned by the company or agency with the stockholding obligation. In other cases, the company or agency does not own the stocks but has the right – based on short-term lease contracts or tickets – to purchase them in a crisis (see Box 2.3).
Figure 2.3 Total oil stocks by product and crude, 2013
0%10%20%30%40%50%60%70%80%90%
100%Jap
an
Unite
d Sta
tes
Korea
Norw
ay
Polan
d
Cana
da
Turkey
Germ
any
Netherlan
ds
Austr
ia
Slovak
Repu
blic
Czech
Repu
blic
Belgi
um
Unite
d Kin
gdom
Austr
alia
Spain
Greece
Portu
gal
Hung
ary
Fran
ce
Finlan
d
Denm
ark
New
Zeala
nd
Sweden
Italy
Estonia
Irelan
d
Switz
erlan
d
Luxemb
ourg
IEA
Europe
Total I
EA
Crude Oil Refined Product
Note: total public and industry stock levels at end-June 2013; country results include stocks held abroad to meet IEA obligation. Source: IEA, 2014.
EnERgy SuPPly SECuRITy 2014 36 © O
ECD/
IEA
2014
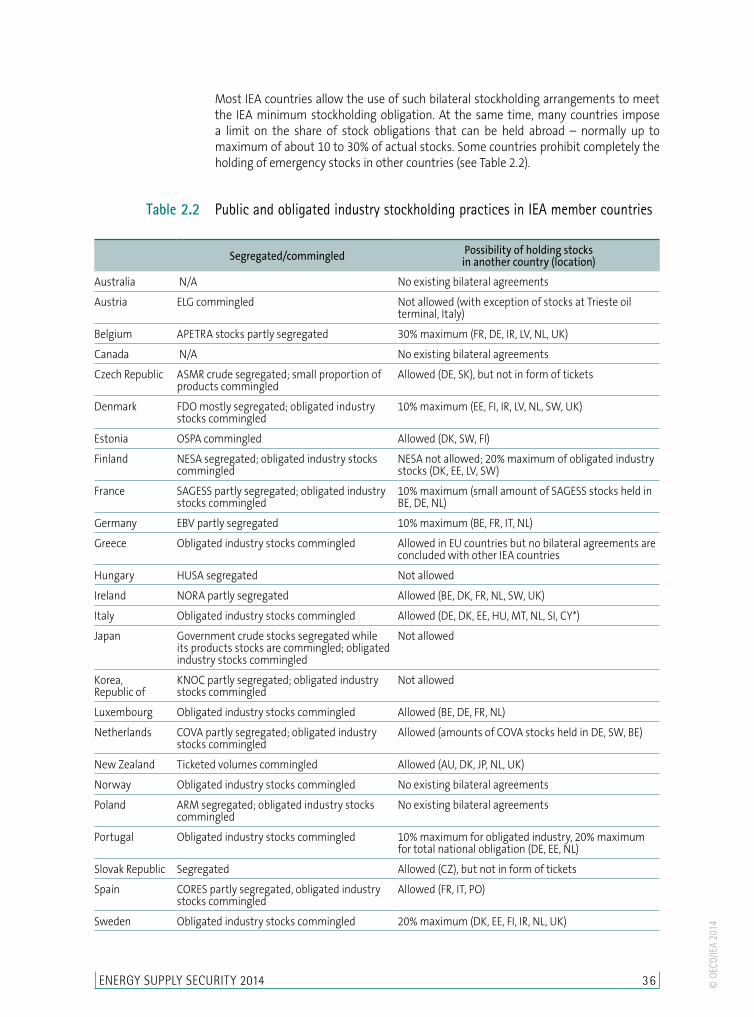
Most IEA countries allow the use of such bilateral stockholding arrangements to meet the IEA minimum stockholding obligation. At the same time, many countries impose a limit on the share of stock obligations that can be held abroad – normally up to maximum of about 10 to 30% of actual stocks. Some countries prohibit completely the holding of emergency stocks in other countries (see Table 2.2).
Table 2.2 Public and obligated industry stockholding practices in IEA member countries
Segregated/commingled Possibility of holding stocks in another country (location)
Australia N/A No existing bilateral agreements
Austria ELG commingled Not allowed (with exception of stocks at Trieste oil terminal, Italy)
Belgium APETRA stocks partly segregated 30% maximum (FR, DE, IR, LV, NL, UK)
Canada N/A No existing bilateral agreements
Czech Republic ASMR crude segregated; small proportion of products commingled
Allowed (DE, SK), but not in form of tickets
Denmark FDO mostly segregated; obligated industry stocks commingled
10% maximum (EE, FI, IR, LV, NL, SW, UK)
Estonia OSPA commingled Allowed (DK, SW, FI)
Finland NESA segregated; obligated industry stocks commingled
NESA not allowed; 20% maximum of obligated industry stocks (DK, EE, LV, SW)
France SAGESS partly segregated; obligated industry stocks commingled
10% maximum (small amount of SAGESS stocks held in BE, DE, NL)
Germany EBV partly segregated 10% maximum (BE, FR, IT, NL)
Greece Obligated industry stocks commingled Allowed in EU countries but no bilateral agreements are concluded with other IEA countries
Hungary HUSA segregated Not allowed
Ireland NORA partly segregated Allowed (BE, DK, FR, NL, SW, UK)
Italy Obligated industry stocks commingled Allowed (DE, DK, EE, HU, MT, NL, SI, CY*)
Japan Government crude stocks segregated while its products stocks are commingled; obligated industry stocks commingled
Not allowed
Korea, Republic of
KNOC partly segregated; obligated industry stocks commingled
Not allowed
Luxembourg Obligated industry stocks commingled Allowed (BE, DE, FR, NL)
Netherlands COVA partly segregated; obligated industry stocks commingled
Allowed (amounts of COVA stocks held in DE, SW, BE)
New Zealand Ticketed volumes commingled Allowed (AU, DK, JP, NL, UK)
Norway Obligated industry stocks commingled No existing bilateral agreements
Poland ARM segregated; obligated industry stocks commingled
No existing bilateral agreements
Portugal Obligated industry stocks commingled 10% maximum for obligated industry, 20% maximum for total national obligation (DE, EE, NL)
Slovak Republic Segregated Allowed (CZ), but not in form of tickets
Spain CORES partly segregated, obligated industry stocks commingled
Allowed (FR, IT, PO)
Sweden Obligated industry stocks commingled 20% maximum (DK, EE, FI, IR, NL, UK)

CHAPTER 2 Emergency oil response systems in IEA countries 37© O
ECD/
IEA
2014
Segregated/commingled Possibility of holding stocks in another country (location)
Switzerland Obligated industry stocks commingled Not allowed
Turkey Obligated industry stocks commingled Not allowed
United Kingdom Obligated industry stocks commingled Allowed (BE, DK, FR, IR, NL, SW)
United States SPR segregated No existing bilateral agreements
Notes: AU=Australia; BE=Belgium; CY=Cyprus1,2; CZ=Czech Republic; DE=Germany; DK=Denmark; EE=Estonia; FI=Finland; FR=France; HU=Hungary; IR=Ireland; IT=Italy; JP=Japan; LV=Latvia; MT=Malta; NL=Netherlands; PO=Poland; SI=Slovenia; SK=Slovak Republic; SW=Sweden; UK=United Kingdom; No industry obligation/no public stocks.1. Footnote by Turkey
The information in this document with reference to “Cyprus” relates to the southern part of the Island. There is no single authority represent-ing both Turkish and Greek Cypriot people on the Island. Turkey recognises the Turkish Republic of Northern Cyprus (TRNC). Until a lasting and equitable solution is found within the context of United Nations, Turkey shall preserve its position concerning the “Cyprus issue”.
2. Footnote by all the European Union member states of the OECD and the European Union The Republic of Cyprus is recognised by all members of the United Nations with the exception of Turkey. The information in this document relates to the area under the effective control of the Government of the Republic of Cyprus.
Stocks held abroad under bilateral agreements can be either in the form of volumes owned or amounts leased as tickets. In practice, the proportion of stocks held abroad is generally small for the IEA as a whole – less than 3% of total stocks. However, it can represent a significant portion of stock cover for some member countries. Because of insufficient domestic storage capacity, Luxembourg has as much as 88% of its stockholding obligation abroad. Some other IEA countries also hold a relatively high proportion of their stockholding obligations abroad (see Figure 2.4).
Box 2.3 Stockholding tickets
Many IEA countries give oil companies or stockholding agencies the choice of meeting their stockholding obligations in two ways: either by owning physical stocks themselves or, for certain amounts, arranging stock cover through leasing agreements, referred to as “tickets”.
Tickets are stockholding arrangements under which the seller agrees to hold (or reserve) an amount of oil on behalf of the buyer in return for an agreed fee. The buyer of the ticket (or reservation) effectively owns the option to take delivery of physical stocks in times of crisis, according to conditions specified in the contract.
Tickets can be issued for either crude or refined products; the agreement specifies the quantity, quality and location of the oil for a specified period (typically a calendar quarter). Tickets can be either domestic contracts or contracts between entities in separate countries (the latter must be within the framework of a bilateral government agreement).
The rationale behind oil stock tickets is that a company holding stocks in excess of its obligation can offer such stocks to cover the obligation of another company or agency, either domestically or abroad. Tickets are sold mainly by refiners with excess inventory as a way to offer compulsory stock obligation cover to third-party buyers. In some cases, a company in one country may provide tickets to one of its own affiliates that operates in another country. In all cases, the ticket seller is prohibited from counting the oil in question towards its own stockholding obligation.
Ticketing is a flexible and, generally, cost-effective way for companies or agencies with insufficient stocks to avoid being in breach of stockholding obligations. It essentially provides an alternative to acquiring oil stocks directly and building and/or renting necessary storage capacity.
Table 2.2 Public and obligated industry stockholding practices in IEA member countries (cont.)
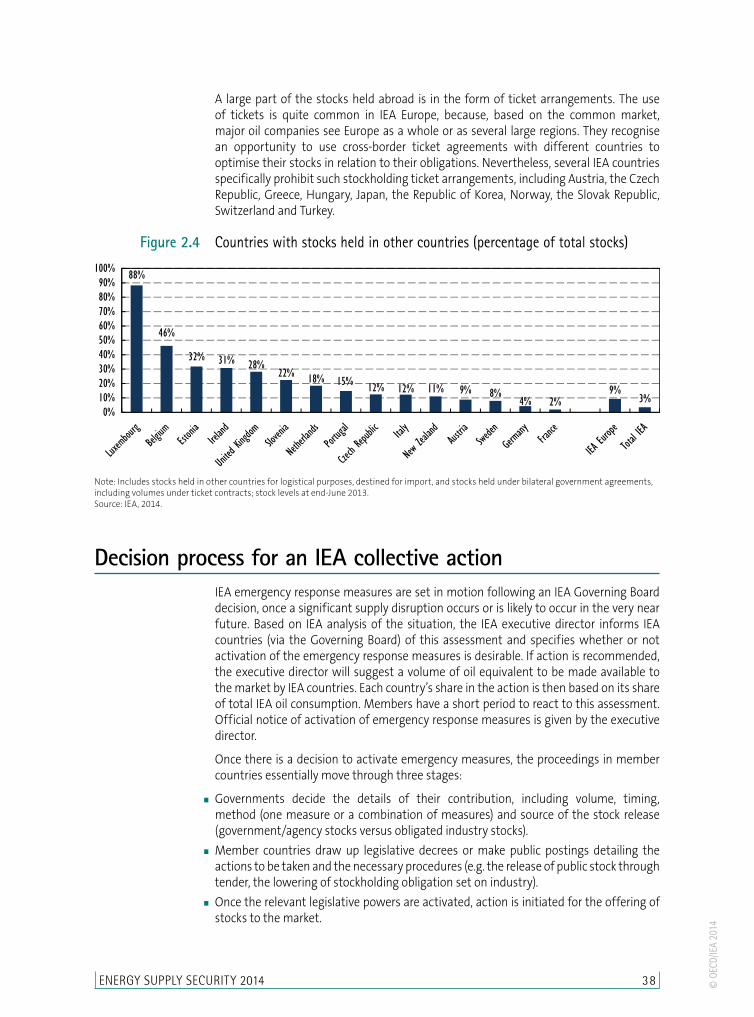
EnERgy SuPPly SECuRITy 2014 38 © O
ECD/
IEA
2014
A large part of the stocks held abroad is in the form of ticket arrangements. The use of tickets is quite common in IEA Europe, because, based on the common market, major oil companies see Europe as a whole or as several large regions. They recognise an opportunity to use cross-border ticket agreements with different countries to optimise their stocks in relation to their obligations. Nevertheless, several IEA countries specifically prohibit such stockholding ticket arrangements, including Austria, the Czech Republic, Greece, Hungary, Japan, the Republic of Korea, Norway, the Slovak Republic, Switzerland and Turkey.
Figure 2.4 Countries with stocks held in other countries (percentage of total stocks)
88%
46%
32% 31% 28%22% 18% 15% 12% 12% 11% 9% 8%
4% 2%9%
3%0%
10%20%30%40%50%60%70%80%90%
100%
Note: Includes stocks held in other countries for logistical purposes, destined for import, and stocks held under bilateral government agreements, including volumes under ticket contracts; stock levels at end-June 2013. Source: IEA, 2014.
Decision process for an IEA collective actionIEA emergency response measures are set in motion following an IEA Governing Board decision, once a significant supply disruption occurs or is likely to occur in the very near future. Based on IEA analysis of the situation, the IEA executive director informs IEA countries (via the Governing Board) of this assessment and specifies whether or not activation of the emergency response measures is desirable. If action is recommended, the executive director will suggest a volume of oil equivalent to be made available to the market by IEA countries. Each country’s share in the action is then based on its share of total IEA oil consumption. Members have a short period to react to this assessment. Official notice of activation of emergency response measures is given by the executive director.
Once there is a decision to activate emergency measures, the proceedings in member countries essentially move through three stages:
� Governments decide the details of their contribution, including volume, timing, method (one measure or a combination of measures) and source of the stock release (government/agency stocks versus obligated industry stocks).
� Member countries draw up legislative decrees or make public postings detailing the actions to be taken and the necessary procedures (e.g. the release of public stock through tender, the lowering of stockholding obligation set on industry).
� Once the relevant legislative powers are activated, action is initiated for the offering of stocks to the market.

CHAPTER 2 Emergency oil response systems in IEA countries 39© O
ECD/
IEA
2014
In most IEA countries, the length of time required to move through these three stages – i.e. from deciding to act to the release of stocks – is two to seven days. Once the stock release procedures have been carried out, the actual physical delivery of stocks to the market can take from one day to as much as three weeks, depending on the emergency stocks structure. In the case of member countries that hold a significant proportion of emergency stocks overseas, the actual physical availability of those stocks in the country itself could take up to six weeks. Such countries may opt instead to swap stocks with another country, which can significantly reduce this period.
Box 2.4 The evolution and flexibility of the I.E.P. Agreement
The 1974 I.E.P. Agreement established IEA emergency response mechanisms to create a concrete and co-operative action plan in the event of a major disruption in oil supply. The I.E.P. Agreement outlines four key response measures: release of stocks; restraint of demand; switching away from oil to other fuels; and increasing domestic oil production. In support of the first measure (release of stocks), the agreement requires that IEA countries hold in reserve oil stocks equivalent to at least 90 days of net oil imports.
IEP measures were initially designed to take effect in the event of oil supply disruptions involving a loss of 7% or more of normal oil supply, either for the IEA as a whole or any individual member country. However, as oil markets have evolved, so have the tools of the IEA for responding to supply disruptions. Today’s reality calls for greater flexibility in determining how and when to resort to emergency measures.
The IEA established the Co-ordinated Emergency Response Measures (CERM), a series of actions that provide a rapid and flexible system of response to actual or imminent oil supply disruptions. CERM measures emphasise and enable the early release of stocks.
Stock drawdownThe exact method of emergency stocks release varies considerably among IEA countries. In practice, the preferred approach in most countries that impose all of the stockholding obligations on industry operators is a uniform reduction in the stockholding obligation by a certain percentage or by a specified number of days of supply. In general, these volumes are made available through the normal channels at market prices. By contrast, Luxembourg convenes a committee of government/industry representatives to determine the release and pricing of obligatory stocks. In Switzerland, the release would be allocated according to individual company needs.
A variety of approaches is also used for the release of government/agency stocks. Several countries would conduct the release from public stockholdings through a tender bidding process (Germany, Japan, the Netherlands, Poland and the United States). Most other countries would make the stock available at prevailing market prices (the Czech Republic, Estonia, Finland, France, Hungary, Ireland, New Zealand, Portugal and Spain). In the Republic of Korea, the government determines the pricing of the release from its stockpile. The Czech Republic, Finland and the United States are examples of countries that sometimes release public stocks in the form of loans.
Financing and feesThe way in which emergency stocks are financed will largely depend on the stockholding system used (e.g. obligated industry stocks or public stocks; government based or industry-based stockholding agency).

EnERgy SuPPly SECuRITy 2014 4 0 © O
ECD/
IEA
2014
In the case of countries imposing stockholding obligations on industry, the associated costs are imposed on companies through minimum requirements usually set in proportion to a company’s oil import share or its share of sales in the domestic market. The stockholding obligation for refineries is set higher in some countries (Italy, Turkey and the United Kingdom) because of their high level of operating stocks. Ultimately, the costs of obligated industry stocks are borne by the final consumers. Of the 20 countries imposing a stockholding obligation on industry, only three (Japan, Luxembourg and Switzerland) have schemes in place to provide companies with financial support to offset the costs of holding obligated stocks.
In the case of public stocks, an important differentiation must be made between the initial set-up/capital costs and the running costs associated with the government/agency stockpiles. In both cases, the financing methods vary across the 19 IEA countries which hold public stocks.
In several IEA countries with government-held stockpiles or stockholding agencies, the initial set-up/capital costs of the stockpile were financed from the central government budget (the Czech Republic, Estonia, Finland, Japan, Republic of Korea, Poland, the
Box 2.5 Costs, benefits and financing of holding emergency oil stocks
In order to assist non-IEA countries which are considering establishing oil stockholding systems for dealing with supply disruptions, the IEA has published a paper that draws together analysis of the costs and benefits of emergency stocks, in addition to exploring options for financing the establishment of these stocks (IEA, 2013).
With regard to benefits, emergency oil stocks primarily function like an “insurance” against oil supply disruptions. Significant economic benefits are derived primarily from offsetting oil supply losses and thereby reducing potentially significant oil price increases. These consist of reduced GDP losses and reduced import costs. Using a model to simulate tens of thousands of possible oil supply disruption scenarios and market outcomes, the paper estimates that global net benefits derived from existing emergency stocks amount to USD 41 per barrel per year. This figure equals some USD 3.5 trillion over a 30-year period considered in the paper. This represents a conservative estimate of global benefits, as it does not include benefits derived from mitigating domestic or product supply disruptions; these are highly country-specific and depend to a large extent on the local context. For example, the benefits obtained during domestic disruptions not only depend on the size and duration of the disruption, but also on the location of emergency stocks.
The cost of stockholding depends on the size and type of storage facilities (aboveground tanks or underground caverns) as well as the composition of stocks (crude oil or petroleum products). Total yearly costs range from USD 7 to USD 10 per barrel, reflecting the fact that holding emergency stocks in underground caverns is about 30% cheaper than holding oil in aboveground facilities. The acquisition of stocks represented at least 50% and up to 85% of the overall costs, based on oil price levels at the time of the study. The expenditures for building the storage facilities and the related infrastructure amount to up to one-fifth of yearly costs. The share of expenses for operating and maintenance of the storage sites varies considerably between storage options, amounting to as little as 5% for caverns and as much as 25% for aboveground facilities. Refreshment of oil products and land costs both represent a marginal proportion of overall costs.
There are several ways of financing the acquisition and maintenance of emergency oil stocks as reflected in the distinct practices adopted by IEA countries. Financing mechanisms can generally be divided into two categories: financing of public stocks and financing of obligated industry stocks. The different approaches highlight the flexibility in financing emergency stocks and reflect efforts to keep the burden on the state budget, industry and final consumers at a minimum. In many countries, the cost to the final consumer amounts to less than USD 0.01 per litre of fuel.

CHAPTER 2 Emergency oil response systems in IEA countries 41© O
ECD/
IEA
2014
Slovak Republic and the United States). Funds from the central budget also financed New Zealand’s purchase of stock tickets. By contrast, in the other ten IEA countries with public stocks, the initial establishment of the emergency stocks was financed through bank loans or in the form of bonds issued by the stockholding agency. In the cases of Austria, Germany, Hungary and the Netherlands, government loan guarantees were used in the initial set-up phases to allow the agencies to borrow at lower interest rates on financial markets.
The running costs of the public stockholding agencies are typically financed through one of three principal methods: from the central government budget, through a levy paid by market operators or through a direct tax paid by final consumers. In six IEA countries, running costs are financed through the central government budget (the Czech Republic, Japan, the Republic of Korea, New Zealand, Poland and United States). In most other IEA countries with stockholding agencies, the running costs are recouped either through a fee (levy) paid by market operators directly to the agency or via a tax imposed on final consumers by central governments which is then passed on to the stockholding entity.
Table 2.3 Financing for government/agency stocks
Initial set-up costs Running costs
Government budget
Government-backed loan
Bank loans/ bonds
Government budget
Levy on industry Tax
Austria X X
Belgium X X
Czech Republic X X
Denmark* X
Estonia X X
Finland X X
France X X
Germany X X
Hungary X X
Ireland X X
Japan X X
Korea X X
Netherlands** X X
New Zealand*** X
Poland X X
Portugal X X
Slovak Republic X X
Spain X X
United States X X
* In Denmark running costs are covered by the financial surplus the Danish stockholding agency built up in the early 1990s in the wake of falling demand and rising indigenous output, together with the amortisation of storage facilities. ** In the Netherlands running costs are covered by a levy on final consumers. *** New Zealand has not built up a physical reserve for emergencies. The difference between operating industry stocks and the IEA obligation is entirely covered by stockholding tickets. Therefore, there have been no set-up costs. Source: IEA, 2013.

EnERgy SuPPly SECuRITy 2014 42 © O
ECD/
IEA
2014
In general, the levy is charged to market operators, such as refiners, importers and producers, according to the volume of product sales and deliveries into the domestic market (Belgium, Germany, Ireland, Portugal and Spain), on crude/product import volumes (Hungary, Portugal), or on the volume to be stored (Austria). In all cases, the final consumer bears the costs covered by the fee via retail prices. Denmark discontinued its levy in 1992 after finding that the stockholding agency could cover running costs from a considerable financial surplus built up in previous years. France covers the costs of obligatory stocks through a monthly fee charged to industry by the Professional Committee for Strategic Petroleum Stocks (CPSSP), the organisation responsible for ensuring that national stockholding obligations are met. In Austria, the storage agency Erdöl-Lagergesellschaft (ELG) is financed by annual storage fees charged to companies.
Other response measuresIn addition to stockdraw, IEA countries have at their disposal a number of tools that can be used on their own or in combination with stockdraw during a co-ordinated action. Surge production, similarly to stockdraw, increases the supply of oil on a short-term basis, while demand restraint and fuel switching are both designed to help temporarily curb the use of oil. In some instances, IEA countries may take other, temporary, emergency response measures in order to help oil markets rebalance supply and demand during a disruption.
Surge productionIEA countries with domestic oil production may be able to raise indigenous production for a short period of time in order to increase available supplies in a crisis situation. This measure is limited to member countries with significant levels of production. The potential volume available in a crisis is dependent upon the amount of spare production capacity maintained in the country. The extent of such capacity would depend on particular circumstances and would be constrained by the need to maintain good oil-field practices.
The IEA considers the aggregated capacity of its member countries to increase oil production to be insignificant, as producers generally maximise production rates and do not maintain stand-by spare production capacity. However, during a disruption, member country governments may take steps to facilitate bringing on line any additional production possible. This can include temporarily relaxing regulations that may apply in normal times, primarily for oil-well safety conditions. Typically, such surge production can only be achieved over a short period of time (e.g. a number of months) and carries the risk of damaging wells and reservoirs.
Demand restraintDemand restraint measures aim to rapidly reduce oil consumption in a crisis. This can be done, over short periods of time, either by reducing the amount of oil actually used or by limiting the amount of oil supply available to consumers. In both instances, the degree to which measures are applied can range from light-handed (such as public information campaigns to promote voluntary actions) to more medium and heavy-handed compulsory measures (such as driving restrictions or fuel rationing).

CHAPTER 2 Emergency oil response systems in IEA countries 43© O
ECD/
IEA
2014
Figure 2.5 Oil consumption by sector in IEA countries
14.0%
5.7%
36.6%
24.7%
19.0%
Transformation Energy Transportation Industry Other
4.8%
59.2%
21.0%
9.4%
1975 2011
5.7%
Source: IEA, 2014.
Demand restraint measures are not limited to a specific sector of consumption. For example, oil use in the industry sector could be cut by limiting the operating times of particular segments of industry that have high levels of oil consumption. Measures to reduce oil consumption in the “other sectors” (which include residential use) could include encouraging residents of homes with oil heating to lower the thermostat in winter.
The transportation sector warrants special attention. Demand for oil in the transportation sector has grown steadily over the past 30 years, both in terms of volume and share of total oil demand. In addition, the IEA expects transportation to account for nearly all future growth in oil demand. Currently, transportation consumes more than half of all oil used in IEA countries. This includes all transport activities, such as aviation, road, rail and other modes, such as inland water navigation. Because road transportation represents roughly 85% of all oil consumption in the transport sector and offers the greatest potential for reductions during a crisis, many short-term measures to cut back on oil demand during a crisis tend to focus on road transportation.
Figure 2.6 Transport sector share of total oil consumption (total IEA), 1973-2011
0%
10%
20%
30%
40%
50%
60%
70%
1973 1975 1980 1985 1990 1995 2000 2005 2011
% sha
re of
total
oil
consum
ption
Road
Aviation
Other
Source: IEA, 2014.
Saving oil: Focus on road transportationIn general, there are two types of policy approaches to reducing oil usage in road transportation. One approach focuses primarily on providing people with less energy-intensive travel options to reduce fuel consumption. These options tend to offer people

EnERgy SuPPly SECuRITy 2014 4 4 © O
ECD/
IEA
2014
more choices in transportation, such as better or cheaper public transit, carpooling, or the promotion of “eco-driving” (efficient driving styles and vehicle maintenance steps). They may also reduce oil consumption through options that reduce the need for transportation generally (such as promoting telecommuting [working from home] and compressed work weeks) or that avoid driving in peak traffic hours (such as flexible work schedules).
The second policy approach is more restrictive in nature, essentially limiting travel options or requiring shifts in behaviour. This approach includes measures such as driving bans, mandatory carpooling, speed limit reductions or forced changes in work schedules. More restrictive options tend to result in greater estimated reductions in fuel consumption. However, they may also be more “expensive” to society and unpopular – and, therefore, less politically feasible.
Most light-handed demand restraint measures are relatively inexpensive to implement, mainly requiring a good public information campaign with related support through the
Box 2.6 Examples of transport demand restraint measures
� Eco-driving includes a wide array of behavioural changes such as more efficient driving styles (e.g. changes in acceleration/deceleration and gear shifting patterns), optimal tyre inflation, reducing vehicle weight and other steps. An aggressive and comprehensive public information campaign on the benefits of eco-driving could yield substantial fuel savings. Some countries already run information campaigns of this type at least occasionally; stronger efforts could generate much better compliance, especially during emergencies.
� Telecommuting and flexible work schedules can save substantial fuel and can potentially be implemented very quickly. A well-organised “emergency telecommuting” programme could yield large reductions in fuel use, particularly if employers agree in advance to participate and designate certain employees to telecommute during predefined situations.
� Measures to increase carpooling, if successful, can provide rapid, large reductions in oil demand. However, success may be very dependent on the level of incentives given to drivers, which could make this option quite costly. Restrictive options that require carpooling (such as restricting certain traffic lanes to carpools) are likely to be most effective, but may be seen as inequitable unless relatively limited in application. Programmes focused only on provision of information (such as setting up a website to help potential car poolers find each other) will likely be more popular, but less effective.
� Restrictions on driving, such as odd-even licence plate driving bans, can potentially lead to very large savings. However, they may restrict mobility much more than some other measures and, therefore, will be unpopular. Multiple-vehicle households tend to be less affected by this type of policy, which may make this option seem less equitable than some others. If conducted over longer periods, the effectiveness of such policies may decline as travellers develop strategies to work around the regulations.
� Reducing speed limits on motorways can be very effective for saving fuel, particularly because cars and trucks use much more fuel per kilometre as speeds increase above 90 km/h (about 55 mph). However, success depends on an adequate enforcement regime. Providing clear information to the public regarding the strong links between lower speeds and fuel savings may help increase compliance during an emergency. An appropriate infrastructure must be put in place ahead of time (such as variable speed limit signs) to support rapid change of posted speed limits.
� More information on demand restraint measures can be found in the IEA publication Saving Oil in a Hurry (IEA, 2005)
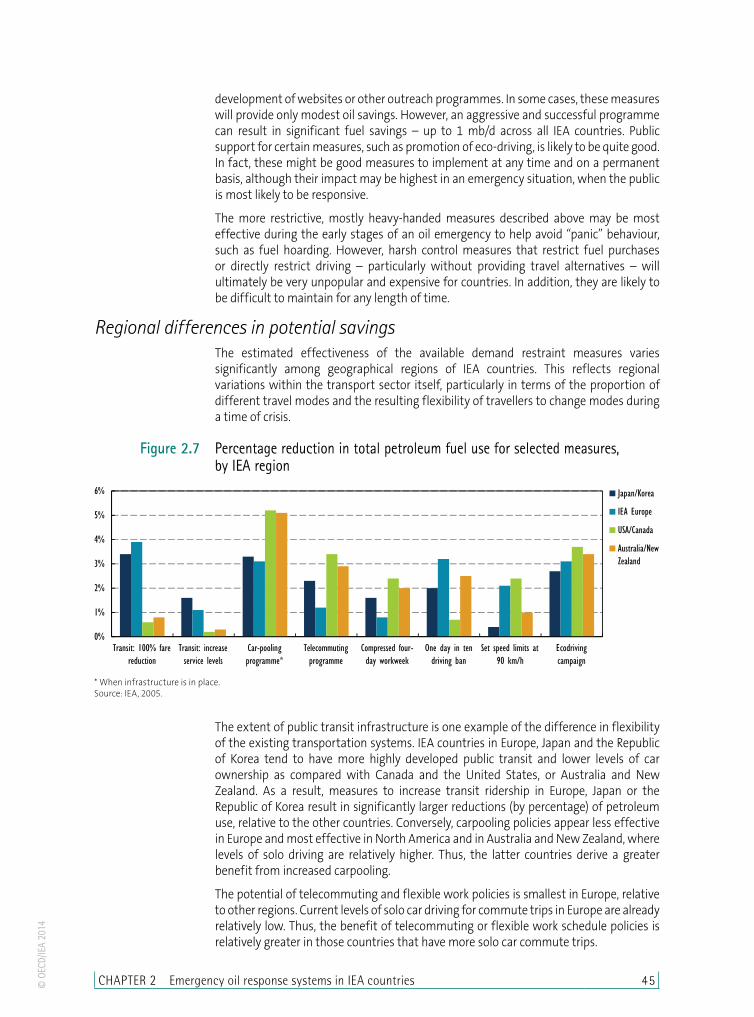
CHAPTER 2 Emergency oil response systems in IEA countries 45© O
ECD/
IEA
2014
development of websites or other outreach programmes. In some cases, these measures will provide only modest oil savings. However, an aggressive and successful programme can result in significant fuel savings – up to 1 mb/d across all IEA countries. Public support for certain measures, such as promotion of eco-driving, is likely to be quite good. In fact, these might be good measures to implement at any time and on a permanent basis, although their impact may be highest in an emergency situation, when the public is most likely to be responsive.
The more restrictive, mostly heavy-handed measures described above may be most effective during the early stages of an oil emergency to help avoid “panic” behaviour, such as fuel hoarding. However, harsh control measures that restrict fuel purchases or directly restrict driving – particularly without providing travel alternatives – will ultimately be very unpopular and expensive for countries. In addition, they are likely to be difficult to maintain for any length of time.
Regional differences in potential savingsThe estimated effectiveness of the available demand restraint measures varies significantly among geographical regions of IEA countries. This reflects regional variations within the transport sector itself, particularly in terms of the proportion of different travel modes and the resulting flexibility of travellers to change modes during a time of crisis.
Figure 2.7 Percentage reduction in total petroleum fuel use for selected measures, by IEA region
0%
1%
2%
3%
4%
5%
6%
Transit: 100% farereduction
Transit: increaseservice levels
Car-poolingprogramme*
Telecommutingprogramme
Compressed four-day workweek
One day in tendriving ban
Set speed limits at90 km/h
Ecodrivingcampaign
Japan/Korea
IEA Europe
USA/Canada
Australia/NewZealand
* When infrastructure is in place.Source: IEA, 2005.
The extent of public transit infrastructure is one example of the difference in flexibility of the existing transportation systems. IEA countries in Europe, Japan and the Republic of Korea tend to have more highly developed public transit and lower levels of car ownership as compared with Canada and the United States, or Australia and New Zealand. As a result, measures to increase transit ridership in Europe, Japan or the Republic of Korea result in significantly larger reductions (by percentage) of petroleum use, relative to the other countries. Conversely, carpooling policies appear less effective in Europe and most effective in North America and in Australia and New Zealand, where levels of solo driving are relatively higher. Thus, the latter countries derive a greater benefit from increased carpooling.
The potential of telecommuting and flexible work policies is smallest in Europe, relative to other regions. Current levels of solo car driving for commute trips in Europe are already relatively low. Thus, the benefit of telecommuting or flexible work schedule policies is relatively greater in those countries that have more solo car commute trips.

EnERgy SuPPly SECuRITy 2014 46 © O
ECD/
IEA
2014
Driving bans appear most effective in Europe and least effective in North America. In this case, the difference is a function of the relative levels of household car ownership. Average car ownership per household is highest in North America, which means that households are more likely to have at least one car available on any given day that a driving ban is enforced (such bans are usually set by licence plate number).
Speed limit reduction and enforcement policies appear most effective in Europe and North America, where there is relatively higher motorway usage and, in the case of Europe, higher maximum speed limits. Thus, relative to other IEA countries, Europe and North America derive greater benefit from a speed reduction.
Table 2.4 Oil-saving effects of measures, summed across all IEA countries
Potential oil savings by category, if implemented in all IEA countries Measure
VERY LARGE More than 1 million barrels/day
Carpooling: Large programme to designate emergency carpool lanes along all motorways; designate park-and-ride lots; inform public and match riders.
Driving ban: Odd/even licence plate scheme; provide police enforcement; appropriate information and signage.
LARGE More than 500 000 barrels/day
Speed limits: Reduce highway speed limits to 90 km/h; provide police enforcement or speed cameras, appropriate information and signage.
Transit: Set fares for public transit at zero.
Telecommuting: Large programme, including active participation of businesses; public information on benefits of telecommuting; minor investments needed in infrastructure to facilitate.
Compressed work week: Programme with employer participation; public information campaign.
Driving ban: One in ten days based on licence plate; provide police enforcement and signage.
Eco-driving: Promote efficient driving styles and vehicle maintenance steps, intensive public information campaign.
MODERATE More than 100 000 barrels/day
Transit: Reduce current public transit fares by 50%.
Transit: Increase weekend and off-peak transit service; increase peak service frequency by 10%.
Carpooling: Small programme to inform public, match riders.
SMALL Less than 100 000 barrels/day
Bus priority: Convert all existing carpool and bus lanes to 24-hour bus priority usage; convert some other lanes to bus-only lanes.
Source: IEA, 2005.
Fuel switchingFuel switching is another measure that IEA countries can employ in order to contribute to a collective emergency response. Switching away from oil into other energy sources reduces the use of oil, thereby making additional supply available to the market.
The role of oil in economic sectors has changed significantly since the creation of the IEA, consequently reducing the scope for rapidly switching away from oil during a disruption. The share of oil in the overall energy supply mix of IEA countries has dropped from 54% to around 35%, reflecting increased use of natural gas and the development of nuclear energy replacing oil in electricity generation. In 1973, oil was used for 26% of the total electricity generated in all IEA countries; by 2012, this share was roughly 3%.
CHAPTER 2 Emergency oil response systems in IEA countries 47© O
ECD/
IEA
2014
Oil use has also changed, becoming increasingly concentrated in the transportation sector and within the industry sector in the petrochemical industry. In both cases the potential for fuel switching is limited. The share of all oil being used for heat and power generation has decreased significantly, from a peak of around 30% in 1973-74 to less than 7% in 2011 (less than 3 mb/d). Short-term fuel switching is only truly possible within these two sectors; thus, its potential to be effective in a time of crisis is likely to be less effective.
Examples of IEA co-ordinated actions illustrate a significant change in fuel switching as a potential emergency response measure in an oil supply disruption. In 1991, IEA countries decided to activate a contingency plan to address a possible oil supply shortfall during the First Gulf War by making 2.5 mb/d of oil available to the market. Approximately 2.7% of the total volume (67 kb/d) was to come from fuel switching. In the IEA collective actions in 2005, following Hurricane Katrina, and in 2011, in response to disrupted supplies from Libya, none of the oil made available came from fuel switching.
Other short-term emergency response measuresIn some instances, IEA countries may seek to provide additional flexibility during a crisis in order to help rebalance supply and demand, through the temporary relaxation of specific regulations. This can be in the form of relaxing product quality specifications for a limited period of time, such as allowing winter fuel grades to be used out of season, in order to rapidly increase supplies available to consumers in a crisis. Both Austria and the United States have the ability to take such emergency measures, the latter having done so as recently as October 2012 in the aftermath of Hurricane Sandy.
Another example of providing greater flexibility to markets in response to a crisis is the relaxation of regulations regarding where emergency oil stocks are held. In both France and Spain, requirements for emergency oil stocks to be proportionally distributed across the country can be relaxed in order to allow for a geographical exchange, where emergency stocks in one area are swapped with commercial stocks held elsewhere in the country. This allows for emergency stocks to be used to help re-establish regional imbalances in supply and demand, while maintaining the country’s overall emergency stockholding level. While not intended as a means for contributing to an IEA collective action, such flexibility measures can be particularly useful for dealing with regional or local disruptions.
Concluding remarksThe measures described in this chapter are the primary means through which IEA countries participate in a collective response during a short-term oil supply disruption. Each country determines which emergency response measures are most appropriate, depending on their domestic market conditions. IEA countries can take different measures in a co-ordinated manner, relying on a single measure or a combination of several measures. Chapter 4, entitled “Emergency response systems of individual IEA countries”, describes in detail the oil infrastructure and emergency response policies of individual IEA countries.

EnERgy SuPPly SECuRITy 2014 4 8 © O
ECD/
IEA
2014
ReferencesIEA (2014), Monthly Oil Statistics, OECD/IEA, Paris.
IEA (2013), Focus on Energy Security: Costs, Benefits and Financing of Holding Emergency Oil Stocks, IEA Insight Series, OECD/IEA, Paris. www.iea.org/publications/insights/FocusOnEnergySecurity_FINAL.pdf
IEA (2006), Energy Prices and Taxes, Vol. 2005/4, OECD/IEA, Paris.
IEA (2005), Saving Oil in a Hurry, OECD/IEA, Paris. www.iea.org/publications/freepublications/publication/name,3967,en.html
List of figuresFigure 2.1: Industry versus public stocks as share of total IEA stocks 33Figure 2.2: Public stocks as a share of a country’s IEA stockholding obligation 33Figure 2.3: Total oil stocks by product and crude, 2013 35Figure 2.4: Countries with stocks held in other countries (percentage of total stocks) 38Figure 2.5: Oil consumption by sector in IEA countries 43Figure 2.6: Transport sector share of total oil consumption (total IEA), 1973-2011 43Figure 2.7: Percentage reduction in total petroleum fuel use for selected measures,
by IEA region 45
List of tablesTable 2.1: Overview of oil stockholding systems in IEA member countries 32Table 2.2: Public and obligated industry stockholding practices in IEA member countries 36Table 2.3: Financing for government/agency stocks 41Table 2.4: Oil-saving effects of measures, summed across all IEA countries 46
List of boxesBox 2.1: IEA emergency reserve calculation: Minimum 90 days of net imports 30Box 2.2: Comparing stockholding arrangements 34Box 2.3: Stockholding tickets 37Box 2.4: The evolution and flexibility of the I.E.P. Agreement 39Box 2.5: Costs, benefits and financing of holding emergency oil stocks 40Box 2.6: Examples of transport demand restraint measures 44

Natural gas security in IEA countries
CHAPTER 3
CHAPTER 3 Natural gas security in IEA countries 49© O
ECD/
IEA
2014
IntroductionEnergy markets have changed substantially since the creation of the International Energy Agency, and policy makers in IEA member countries today recognise that energy security is represented by more than just oil supply. Natural gas is playing an ever-growing role in the energy balances of IEA countries, making gas security a key element in energy security. Unlike the case of oil, however, there is no framework for taking collective action in response to a natural gas disruption, and IEA countries do not have the equivalent treaty requirements to establish emergency response mechanisms for natural gas. Instead, each IEA country agrees to review its gas emergency response policy, to share best practices and to explore together ways to reinforce gas security, individually and collectively.
Assessing a country’s exposure to a possible gas disruption, as well as its ability to respond in such a crisis, was an integral part of the most recently completed cycle of Emergency Response Reviews (ERRs). The mechanisms and policies of individual IEA countries for responding to gas emergencies are described in the country profiles provided in Chapter 4. This chapter provides an overview of key issues related to gas security and of the emergency response policies in IEA countries.
The growing role of gas in energy securityNatural gas has been seen as a secure fuel for many decades. As historically most gas was sourced close to consumption centres, inter-regional trade was relatively small, and supplies were primarily transported by pipelines based on long-term contracts. Despite recurrent political tensions, European markets were well supplied. Transit issues, in particular, were rarely troublesome. Likewise, liquefied natural gas (LNG) supplies to Japan and the Republic of Korea have been very stable for many years.
Several considerable changes have taken place since, which give greater importance to the inclusion of gas in energy security policies. First, the share of natural gas in the total primary energy supply (TPES) of IEA countries has increased considerably, from 19% in 1973 to 26% in 2012, as natural gas has become the fuel of choice for electricity production. This was particularly the case in Europe, where the share of gas in the power generation mix soared from just 6% in 1990 to 24% in 2012, with around 80% of incremental power generation from the year 2000 coming from natural gas. At the same time, roughly one-quarter of European gas demand is in the residential sector, where home heating is accounted for, making security of gas supplies of particular importance in winter months. Second, the natural gas market is becoming more global, thanks to the development of longer pipelines and, more significantly, inter-regional trade of LNG. Between 2012 and 2018, the volume of gas supply traded between regions is expected to grow by 30%. These growing inter-linkages mean that the impact of gas supply disruptions will no longer be limited to one or two countries, but could have a global impact.
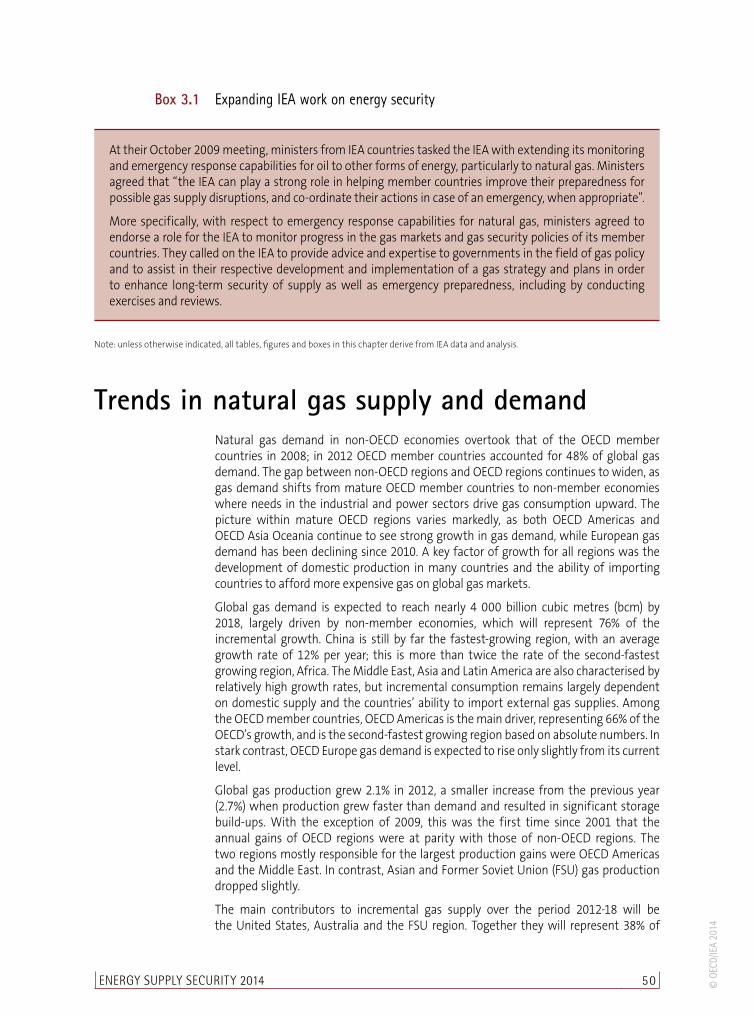
ENERgy SuPPly SECuRITy 2014 50 © O
ECD/
IEA
2014
Box 3.1 Expanding IEA work on energy security
At their October 2009 meeting, ministers from IEA countries tasked the IEA with extending its monitoring and emergency response capabilities for oil to other forms of energy, particularly to natural gas. Ministers agreed that “the IEA can play a strong role in helping member countries improve their preparedness for possible gas supply disruptions, and co-ordinate their actions in case of an emergency, when appropriate”.
More specifically, with respect to emergency response capabilities for natural gas, ministers agreed to endorse a role for the IEA to monitor progress in the gas markets and gas security policies of its member countries. They called on the IEA to provide advice and expertise to governments in the field of gas policy and to assist in their respective development and implementation of a gas strategy and plans in order to enhance long-term security of supply as well as emergency preparedness, including by conducting exercises and reviews.
Note: unless otherwise indicated, all tables, figures and boxes in this chapter derive from IEA data and analysis.
Trends in natural gas supply and demandNatural gas demand in non-OECD economies overtook that of the OECD member countries in 2008; in 2012 OECD member countries accounted for 48% of global gas demand. The gap between non-OECD regions and OECD regions continues to widen, as gas demand shifts from mature OECD member countries to non-member economies where needs in the industrial and power sectors drive gas consumption upward. The picture within mature OECD regions varies markedly, as both OECD Americas and OECD Asia Oceania continue to see strong growth in gas demand, while European gas demand has been declining since 2010. A key factor of growth for all regions was the development of domestic production in many countries and the ability of importing countries to afford more expensive gas on global gas markets.
Global gas demand is expected to reach nearly 4 000 billion cubic metres (bcm) by 2018, largely driven by non-member economies, which will represent 76% of the incremental growth. China is still by far the fastest-growing region, with an average growth rate of 12% per year; this is more than twice the rate of the second-fastest growing region, Africa. The Middle East, Asia and Latin America are also characterised by relatively high growth rates, but incremental consumption remains largely dependent on domestic supply and the countries’ ability to import external gas supplies. Among the OECD member countries, OECD Americas is the main driver, representing 66% of the OECD’s growth, and is the second-fastest growing region based on absolute numbers. In stark contrast, OECD Europe gas demand is expected to rise only slightly from its current level.
Global gas production grew 2.1% in 2012, a smaller increase from the previous year (2.7%) when production grew faster than demand and resulted in significant storage build-ups. With the exception of 2009, this was the first time since 2001 that the annual gains of OECD regions were at parity with those of non-OECD regions. The two regions mostly responsible for the largest production gains were OECD Americas and the Middle East. In contrast, Asian and Former Soviet Union (FSU) gas production dropped slightly.
The main contributors to incremental gas supply over the period 2012-18 will be the United States, Australia and the FSU region. Together they will represent 38% of

CHAPTER 3 Natural gas security in IEA countries 51© O
ECD/
IEA
2014
additional gas supplies. This is a substantial break away from the trend observed in the previous decade when non-OECD regions represented 90% of additional supply.
Global gas trade is anticipated to expand by 30% from 2012 levels over the medium term, reaching almost 700 bcm by 2018. Global LNG trade is expected to grow slightly faster than pipeline trade and gain 31%, thanks to rapidly expanding LNG liquefaction and import capacity built in new markets.
Table 3.1 Natural gas supply and demand, 1985-2018 (billion cubic metres)
1985 1990 1995 2000 2005 2010 2012 2018*
OECD DEMAND
Americas 579 625 721 794 770 850 893 977
Europe 288 323 388 475 543 567 513 525
Asia Oceania 58 84 104 131 153 198 229 261
Total OECD 926 1 032 1 213 1 400 1 466 1 615 1 635 1 763
NON-OECD DEMAND
FSU/non-OECD Europe 614 762 611 597 653 681 677 709
China 13 16 18 28 49 109 149 295
Other non-OECD Asia 38 67 109 152 220 283 286 360
Latin America 46 58 70 94 122 152 160 190
Middle East 55 88 134 179 262 370 407 492
Africa 24 35 44 55 87 105 113 154
Total non-OECD 789 1 025 986 1 105 1 394 1 700 1 792 2 200
Total demand 1 715 2 057 2 199 2 505 2 860 3 315 3 427 3 962
OECD SUPPLY
Americas 583 643 716 760 738 816 885 994
Europe 217 211 258 303 314 300 277 253
Asia Oceania 19 28 36 42 45 60 66 159
Total OECD 819 881 1 010 1 105 1 097 1 176 1 228 1 406
NON-OECD SUPPLY
FSU/non-OECD Europe 683 831 721 725 812 842 865 954
China 13 15 18 27 49 95 109 173
Other non-OECD Asia 75 115 163 216 275 326 315 367
Latin America 46 60 72 103 145 163 173 200
Middle East 58 92 141 202 309 462 537 607
Africa 45 64 79 119 180 209 206 252
Total Non-OECD 920 1 178 1 194 1 392 1 771 2 097 2 205 2 553
Total supply 1 739 2 059 2 203 2 498 2 868 3 274 3 433 3 959
Note: Totals in table might not add up due to rounding. * 2018 data are forecasts. Source: IEA, 2013a.
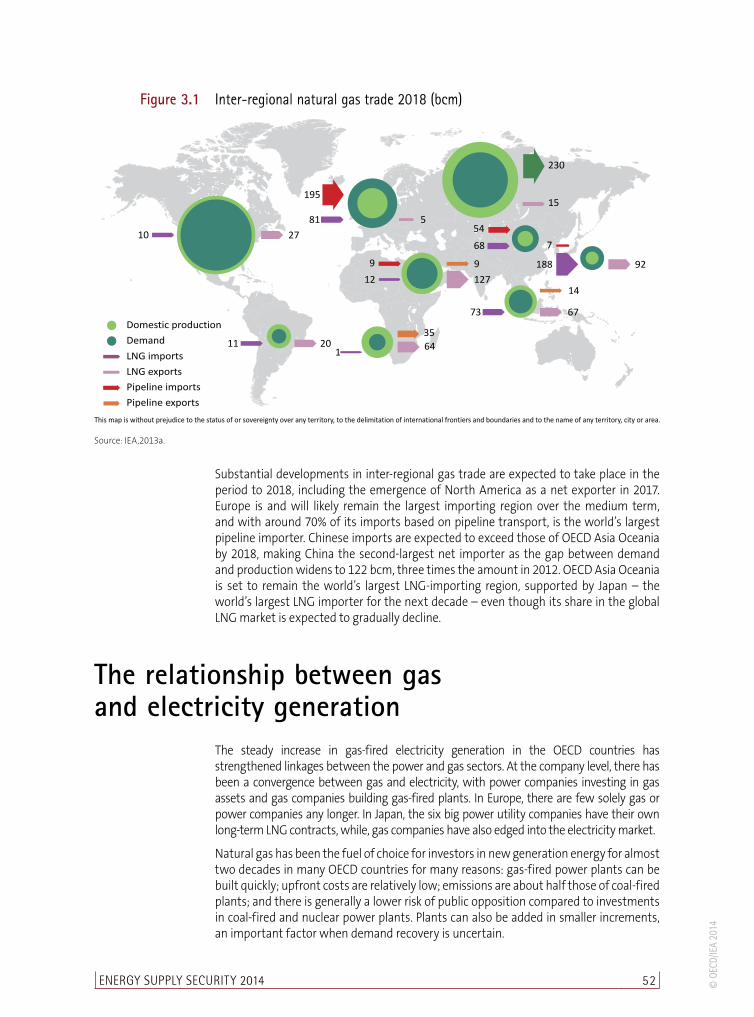
ENERgy SuPPly SECuRITy 2014 52 © O
ECD/
IEA
2014
Figure 3.1 Inter-regional natural gas trade 2018 (bcm)
Domestic production
Demand
LNG imports
LNG exports
Pipeline imports
Pipeline exports
10
111
20 64
35
81
195
5
12
9
127
67
92188
7
14
73
68
54
9
230
15
27
This map is without prejudice to the status of or sovereignty over any territory, to the delimitation of international frontiers and boundaries and to the name of any territory, city or area.
Source: IEA,2013a.
Substantial developments in inter-regional gas trade are expected to take place in the period to 2018, including the emergence of North America as a net exporter in 2017. Europe is and will likely remain the largest importing region over the medium term, and with around 70% of its imports based on pipeline transport, is the world’s largest pipeline importer. Chinese imports are expected to exceed those of OECD Asia Oceania by 2018, making China the second-largest net importer as the gap between demand and production widens to 122 bcm, three times the amount in 2012. OECD Asia Oceania is set to remain the world’s largest LNG-importing region, supported by Japan – the world’s largest LNG importer for the next decade – even though its share in the global LNG market is expected to gradually decline.
The relationship between gas and electricity generation
The steady increase in gas-fired electricity generation in the OECD countries has strengthened linkages between the power and gas sectors. At the company level, there has been a convergence between gas and electricity, with power companies investing in gas assets and gas companies building gas-fired plants. In Europe, there are few solely gas or power companies any longer. In Japan, the six big power utility companies have their own long-term LNG contracts, while, gas companies have also edged into the electricity market.
Natural gas has been the fuel of choice for investors in new generation energy for almost two decades in many OECD countries for many reasons: gas-fired power plants can be built quickly; upfront costs are relatively low; emissions are about half those of coal-fired plants; and there is generally a lower risk of public opposition compared to investments in coal-fired and nuclear power plants. Plants can also be added in smaller increments, an important factor when demand recovery is uncertain.
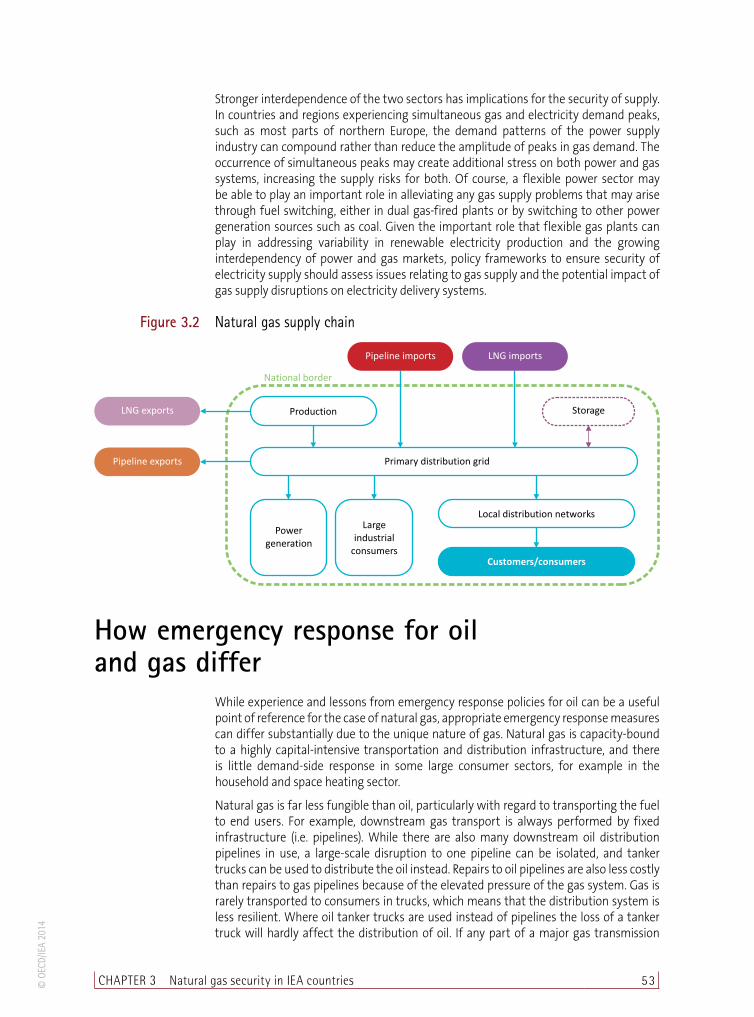
CHAPTER 3 Natural gas security in IEA countries 53© O
ECD/
IEA
2014
Stronger interdependence of the two sectors has implications for the security of supply. In countries and regions experiencing simultaneous gas and electricity demand peaks, such as most parts of northern Europe, the demand patterns of the power supply industry can compound rather than reduce the amplitude of peaks in gas demand. The occurrence of simultaneous peaks may create additional stress on both power and gas systems, increasing the supply risks for both. Of course, a flexible power sector may be able to play an important role in alleviating any gas supply problems that may arise through fuel switching, either in dual gas-fired plants or by switching to other power generation sources such as coal. Given the important role that flexible gas plants can play in addressing variability in renewable electricity production and the growing interdependency of power and gas markets, policy frameworks to ensure security of electricity supply should assess issues relating to gas supply and the potential impact of gas supply disruptions on electricity delivery systems.
Figure 3.2 Natural gas supply chain
Pipeline exports
LNG exports Storage
Primary distribution grid
Production
Local distribution networks
Power
generation
Large
industrial
consumersCustomers/consumers
National border
Pipeline imports LNG imports
How emergency response for oil and gas differ
While experience and lessons from emergency response policies for oil can be a useful point of reference for the case of natural gas, appropriate emergency response measures can differ substantially due to the unique nature of gas. Natural gas is capacity-bound to a highly capital-intensive transportation and distribution infrastructure, and there is little demand-side response in some large consumer sectors, for example in the household and space heating sector.
Natural gas is far less fungible than oil, particularly with regard to transporting the fuel to end users. For example, downstream gas transport is always performed by fixed infrastructure (i.e. pipelines). While there are also many downstream oil distribution pipelines in use, a large-scale disruption to one pipeline can be isolated, and tanker trucks can be used to distribute the oil instead. Repairs to oil pipelines are also less costly than repairs to gas pipelines because of the elevated pressure of the gas system. Gas is rarely transported to consumers in trucks, which means that the distribution system is less resilient. Where oil tanker trucks are used instead of pipelines the loss of a tanker truck will hardly affect the distribution of oil. If any part of a major gas transmission

ENERgy SuPPly SECuRITy 2014 54 © O
ECD/
IEA
2014
pipeline is destroyed, supply downstream is typically stopped until the damage can be repaired or the pipeline replaced; alternative arrangements by road are not an option.
Furthermore, gas transport is more difficult to scale up than oil transport. Indeed, the available spare capacity, either physically or contractually, is sometimes limited in existing gas pipelines. By contrast, in the case of extreme oil demand, more oil trucks can deliver more oil to petrol stations via the road system, and there are generally empty tanker trucks available at any one time in any one region; such immediate overland transport solutions are unheard of for natural gas.
Box 3.2 Natural gas disruptions in the past
A number of gas supply disruptions have occurred over the last decade, arising from weather-related catastrophes (e.g. hurricanes), accidents (e.g. fires, explosions) and contractual disputes.
Recent significant gas crises occurred in the United States (2005 and 2008), the United Kingdom, Italy and Ukraine (2006); Turkey, Greece and Australia (2008). At the beginning of 2009, Europe suffered its worst gas supply disruption to date, with Russian supplies transiting Ukraine interrupted for almost three weeks; in total some 7 billion cubic metres (bcm) of supply was lost, including 2 bcm of supply for Ukraine. Coming at a time of very high demand because of cold weather, this crisis had a far greater impact than even the hurricane-induced shortages in the United States in 2005 and 2008. Some Eastern European countries with heavy reliance on Russian gas and only limited storage capabilities were especially badly affected, with major industrial closures and real hardship in the domestic sector.
Possible emergency response measures for natural gas
Natural gas emergency response policies are designed to cope, temporarily, with extraordinary events impacting normal market functioning. It is important to note that sharp or sustained increases in gas demand can produce similar effects to those produced by a sudden reduction in supplies. Such increases in demand are not only driven by extreme cold weather – which leads to a rise in gas demand for space heating (either directly, when gas is used in residential heating, or indirectly, from additional gas-fired power generation) – but also extreme hot weather leading to a rapid rise in gas-fired power demand to run air conditioners.
To some extent, such seasonal fluctuations can be predicted and should not be classified as gas crises. Well-designed markets can ensure that market participants are well placed to deal with such situations. Emergency gas measures should only be considered as a protection of last resort, after the market has proven itself unable to withstand the impact of a gas supply disruption.
The following section briefly outlines a portfolio of measures that could reasonably be taken in the event of a crisis in the gas market. Issues related to emergency stockholding, analogous to those in place in the oil market, are examined before considering other possible actions for mitigating gas crises.
Emergency gas stocksGas stocks are a central part of the gas industry’s structure, responding to normal but often large seasonal and even daily demand fluctuations. Emergency gas stocks are

CHAPTER 3 Natural gas security in IEA countries 55© O
ECD/
IEA
2014
defined as physical stockpiles of natural gas which are not available to the market under normal conditions. As in the case of oil, emergency gas stocks can be either government-owned volumes or consist of stocks held by industry, based on a government-imposed stockholding obligation. In either case, the stocks are held with the aim of protecting consumers against non-market risks. A non-market risk may be understood as a risk that cannot be expected to be covered by the market under normal conditions, and thus falls outside the reliability standards of a particular market.
Different options exist for the storage of gas, depending on a given country’s geological structure, budget and security and commercial requirements. Gas storage can be underground (in depleted oil or gas reservoirs, aquifers or salt cavern formations) or aboveground (in liquid form, as LNG). The rate at which gas can be put into or taken out of storage (injection/withdrawal rates) varies substantially from one storage type to another. It is likely that a mix of fast and slow withdrawal gas storage would be needed in order to enable a complete emergency gas storage capability with a range of withdrawal rates.
Geological, or technical, barriers are perhaps the greatest impediment to developing sizeable gas storage facilities throughout the IEA countries. Natural gas, like any other gas, needs to be fully contained at all times to prevent it mixing with the air and/or escaping. As well as needing confinement, natural gas has a lower energy density than oil which means that, at standard temperature and pressure, a volume of gas contains much less energy than the same volume of oil. If storage is to be economical, the energy density of gas needs to be increased – gas must therefore be stored either at very high pressures or at low enough temperatures (-160°C) so that it forms a liquid.
The operating costs for storing gas either under high pressure or in a liquefied form are well beyond those for oil storage. High pressure environments require specialist materials such as thick steel pipelines and powerful compressors. Storing natural
Box 3.3 Costs of emergency gas stocks
Conceptually, gas stocks are often viewed as the equivalent of “emergency oil stocks”; in fact, gas and gas storage differs markedly from oil. A fundamental difference is cost. Initial capital costs of building gas storage facilities can range from between five to seven times the costs of underground oil storage facilities per tonne of oil equivalent (toe) stored. The capital cost of LNG storage facilities can be up to ten times the cost of stocks in oil tanks or approximately 50 times the cost of underground oil storage per toe stored.
Furthermore, the volume of gas that is required to be maintained in a gas storage site emptied of useful working gas – referred to as the “cushion gas” – can vary significantly according to the type of storage. Whereas cushion gas can be limited to around 25% of total gas in the case of most salt caverns, it approaches 50% for depleted fields, and can reach up to 80% for aquifers. In certain cases, depending on the market price for gas, cushion gas can account for up to half the cost of the investment.
Variable costs for maintaining gas in storage are also significant. Variable costs for gas storage are determined by various economic factors such as interest rates, cost of maintenance and cost of personnel, but also include another factor specific to gas storage – gas leakage. The variable cost of maintaining enough gas in emergency storage to satisfy a 90-day net import standard across the IEA countries is estimated at between 10% and 20% of the capital cost of the facilities per year.
Assuming suitable sites within the IEA countries could be found, the cost of developing gas storage in depleted fields is estimated at up to EUR 1.00 per cubic metre of working gas. The cost of developing salt cavern storage is higher, approximately twice the cost per cubic metre of working gas.
ENERgy SuPPly SECuRITy 2014 56 © O
ECD/
IEA
2014
gas under high pressures will typically only be pursued if there is suitable geology for underground storage, such as in depleted oil fields.
When using depleted fields for gas storage, the pressure of the field must be maintained at all times, otherwise the geological structure could be altered. This means that even when the field is technically empty of working gas it must have sufficient gas in store to maintain sufficient pressure to maintain the geological structure. The volume of gas left in a gas storage site emptied of useful working gas is referred to as the “cushion gas”. The volume of cushion gas required to develop a large underground storage facility can account for up to half the cost of the investment.
Alternatives to emergency gas stocks: other possible emergency measures
In the absence of emergency gas storage, or in combination with the release of gas stocks, other tools can be designed to alleviate disruptions in gas supply. Governments may use some of the tools discussed below to reduce the economic or social impacts of an unforeseen disruption in supplies or a surge in demand for gas.
Supply responseGas markets with access to spare import capacity from LNG terminals or unused pipeline or interconnector capacity might be able to benefit from some type of supply response to a gas emergency if contractual circumstances permit.
In the pipeline market, this response would rely on there being unused pipeline capacity with associated production flexibility. Some of this import capacity can be used by the capacity owner to increase purchases from upstream suppliers, if supply is available and contractual conditions allow. Alternatively, the capacity could be made available to the market by the system operator if the capacity holder is unable, or unwilling, to secure additional gas supplies.
In the LNG market, a supply response would rely on the market’s ability to purchase additional LNG tanker cargoes. There are two sources of available LNG cargoes; the “spot” LNG market and LNG cargoes diverted from their original destination by agreement of stakeholders. As the LNG spot market expands, a flexible supply response is possible in each regional IEA market. With spare LNG receiving capacity, regions could buy gas from the uncommitted “spot” LNG market. However, this market is global; increased buying by one region reduces supply in the other two and puts global pressure on prices.
When LNG production trains run at less than 100% capacity, it may be possible, within the framework of existing long-term LNG contracts, for customers to request that suppliers increase production. LNG cargoes can also be released from fulfilling their normal obligations under long-term contracts and diverted to alternative destinations, if both buyers and sellers agree. This would, in effect, swap cargoes from the long-term contract market into the global “spot” market, but would only be a net gain in supply if the buyer could also decrease domestic demand or draw down gas from storage. A combination of reduction in demand in unaffected regions and increased production and cargo diversion could constitute a global LNG response to a supply emergency.
CHAPTER 3 Natural gas security in IEA countries 57© O
ECD/
IEA
2014
Demand responseDemand response occurs when customers decide to modify their consumption depending on the price of gas in a market. In some cases, there is often a time lag in wholesale price changes filtering through to certain classes of consumer, for instance those in the residential sector. This time lag might justify government action to make domestic gas consumers aware of a supply disruption. Short-term gas-saving measures might be required to reduce demand over relatively short periods. Given the increasing use of gas in power generation, similar measures could be used to stimulate demand-side reactions in the electricity sector.
One way of allocating natural gas when supply is disrupted is to ration its use through demand restraint, whereby natural gas consumption is restricted. Such a policy goes beyond the voluntary limitation that occurs when customers decide to modify their consumption depending on the price of gas in the market. Governments could impose strict limitations on gas consumption in specific sectors (e.g. industry) in order to assure supplies to predetermined priority customers (e.g. households or vital services such as hospitals). In liberalised markets this is normally an explicit provision in the network code governing the physical operation of the gas system.
Interruptible contractsInterruptible customers are industrial customers who consume large volumes of gas per year and agree to have their gas supply interrupted for a maximum number of days in a year in order to obtain a reduction in gas price. On average, customers with these contracts agree to a maximum of 10 to 20 days of zero supply (if necessary) in a year. Generally, large gas consumers on interruptible contracts receive volume-related discounts on wholesale gas costs, in addition to a reduction in transportation costs designed to offset the potential loss of supply.
While interruptible customers are certain to have their gas supplies cut in a supply disruption, the volume saved is unlikely to be sufficient to completely mitigate a large-scale disruption. Nonetheless, this option can be useful as part of a suite of tools for dealing with such interruptions.
Fuel switchingGas customers who can rapidly switch to an alternative fuel offer a very useful type of demand response for managing a gas emergency situation. In most cases the choice of alternative fuel is technically limited to oil or oil products, as oil can be injected into gas turbines or sprayed into boilers.
While there is a penalty in terms of efficiency and increased maintenance, some gas-fired power stations in Europe and North America can often switch to light oil (gasoil) and some in Korea and Japan can often burn crude oil if necessary. In order for these plants to switch fuel several conditions must be met, including adequate stores of oil available at the site. Governments can set specific obligations to maintain minimum stock levels of alternative fuels for use in a gas crisis. Of course, the power sector and district heating plants can, and do, switch between fuels and power plants regularly in some countries as part of normal (or even abnormal) market functioning. This highlights the importance of having a diverse range of energy sources1 for power generation, to provide maximum flexibility in the event of a natural gas emergency.
1. Including renewables, nuclear and coal in addition to natural gas, oil and petroleum products.

ENERgy SuPPly SECuRITy 2014 58 © O
ECD/
IEA
2014
Overview of gas security of IEA countriesIEA countries show a marked diversity in their demand, supply and market conditions with respect to natural gas. The three major OECD regions provide stark contrasts, from the isolated and LNG-dependent markets of OECD Asia Oceania, to the strongly interconnected, pipeline-based markets of North America, to the varied markets of Europe. These factors will determine how countries perceive the risks associated with a gas disruption and the appropriate emergency response measures required to mitigate such events.
The section below provides an overview of the role of natural gas in IEA countries and of the emergency measures they have in place for responding in a gas crisis.
The role of natural gas in IEA countriesThe role of natural gas in the primary energy supply mix of IEA countries varies substantially, ranging in share of TPES from over 40% in the Netherlands to 2% in Sweden. However gas makes up a substantial share of the supply mix for the vast majority of IEA countries, accounting for over 10% of TPES in 26 of its 29 members; gas exceeds 30% of TPES in seven IEA countries.
In many IEA countries, the power sector is particularly dependent on natural gas. The share of gas in electricity output is in excess of 20% in 15 countries, and over 40% in 6 countries.
Figure 3.3 Natural gas in IEA countries: 2012
0%
10%
20%
30%
40%
50%
60%
70%
Netherlan
ds
Italy
Hung
ary
Unite
d Kin
gdom
Cana
da
Turkey
Irelan
d
Unite
d Sta
tes
Slovak
Repu
blic
Austr
alia
Luxemb
ourg
Belgi
um
Japan
Spain
Austr
ia
Germ
any
New
Zeala
nd
Denm
ark
Portu
gal
Norw
ay
Korea
Czech
Repu
blic
Fran
ce
Greece
Polan
d
Switz
erlan
d
Estonia
Finlan
d
Sweden
Share of gasin TPES
Share of gasin electricityoutput
Source: IEA, 2013b.
Peak demand exceeds average demand by more than 50% in 24 of 29 IEA countries, and exceeds average demand by a factor of as much as 100% for more than half of IEA countries. This can be due to seasonal factors where heating is the main end use; in France, for example, January demand can be four times August demand. This volatility of demand can be exacerbated by the increasing role of gas in power generation – especially where such power meets peak demand, fills gaps when other plants are unexpectedly unavailable, and/or is increasingly used as backup for variable renewables – resulting in quite sharp demand peaks for gas. Regions with these demand patterns require flexible arrangements to ensure secure supply, including differing types of storage (including storage with quicker drawdown rates to meet power sector needs), as well as the more traditional long-term supply contracts.

CHAPTER 3 Natural gas security in IEA countries 59© O
ECD/
IEA
2014
Import dependencyMost IEA member countries depend on imports to meet their domestic gas needs. Only six member countries are not dependent on imports; of the six, five are net exporters. At the other end of the spectrum, 16 IEA countries have an import dependence exceeding 90% with 9 of these countries being essentially 100% dependent on imports to meet domestic gas demand. Regionally, high levels of dependence on imported gas are mainly found in most of Europe and in Asia (Japan and Korea). Member countries in North America, Oceania and the European countries adjacent to the North Sea are relatively well-endowed in terms of gas resources and thus not exposed to the same inherent import risk.
Figure 3.4 Natural gas import dependence: 2012
0%
20%
40%
60%
80%
100%
120%
Belgi
um
Estonia
Finlan
d
Luxemb
ourg
Portu
gal
Sweden
Switz
erlan
d
Greece
Spain
Korea
Fran
ce
Turkey
Czech
Repu
blic
Japan
Slovak
Repu
blic
Irelan
d
Italy
Germ
any
Austr
ia
Hung
ary
Polan
d
Unite
d Kin
gdom
Unite
d Sta
tes
Austr
alia
Cana
da
Denm
ark
Netherl
ands
New
Zeala
nd
Norw
ay
Source: IEA, 2013c.
Most IEA countries benefit from relatively diversified sources of imported gas. This is particularly the case for LNG-importing countries in both Asia and Europe, where specific policies have been put in place in order to limit import reliance on any one country. The greatest exposure to a single supplier is in Eastern Europe, where countries from the Baltic to the Balkans show a common structural reliance on Russian pipeline gas imports.
Gas storage capacityGas storage is a valuable tool for responding to demand swings and supply disruptions, as demonstrated by the 2009 crisis. Commercial storage capacity has been developed in the vast majority of IEA countries as a means of addressing both seasonal variations in demand and situations of peak demand. In some instances, specific volumes of this capacity are used to hold gas stocks for emergency purposes. This is the case in several European IEA countries which impose some form of gas storage obligation, in some cases requiring the transmission system operator (TSO) to book a share of the country’s commercial storage capacity to meet its security standards. In Hungary, a dedicated stockholding agency holds just under 1 bcm of gas as government-controlled emergency storage. These storage measures provide a powerful tool for correcting acute, short-term market shortages.
Underground storage remains the most common means of holding gas stocks; however the potential to develop underground storage capacity varies according to each country’s geology. Some countries have resorted to developing LNG storage as an alternative, although this is more limited in size due to higher related costs.

ENERgy SuPPly SECuRITy 2014 6 0 © O
ECD/
IEA
2014
Four IEA countries have no gas storage facilities at present. Estonia uses neighbouring underground storage facilities in Latvia, while Luxembourg is well connected to storage facilities in neighbouring countries through four interconnecting points. Similarly, Switzerland uses underground storage in France to balance the Swiss gas network. Norway, which is a large net exporter of gas with only small volumes of domestic consumption, has not developed any significant storage capacity.
The number of LNG regasification terminals has grown significantly within IEA countries in recent years, providing both a source of stable, flexible and diversified gas supply, and a place of short-term storage at the terminal site. Practically all storage capacity in Japan, Korea and Greece is held at LNG regasification sites; both Japan and Korea have built a large number of LNG terminals across the countries, thus forming a highly resilient basis for their gas supplies. LNG storage also accounts for a large share of national storage capacity in Belgium (25%), Portugal (40%) and Spain (27%). The United States has built numerous LNG terminals, but at present most are significantly under-utilised because of the substantial level of domestic gas production. The low level of import dependence in the United States means that domestic storage already provides a very high level of resilience.
Taking both underground and LNG storage capacities together, 14 member countries have storage capacity that can meet at least 10% of annual demand; storage capacity surpasses 20% of annual demand for eight countries. Only three countries have gas
Figure 3.5 Storage capacities as a percentage of annual demand
0%10%20%30%40%50%60%70%80%90%
Estonia
Luxemb
ourg
Switz
erlan
d
Norw
ay
Finlan
d
Sweden
Greece
Cana
da
Irelan
d
Belgi
um
Austr
alia
Turkey
Unite
d Kin
gdom
Japan
New
Zeala
nd
Polan
d
Korea
Netherlan
ds
Portu
gal
Spain
Unite
d Sta
tes Italy
Germ
any
Denm
ark
Czech
Repu
blic
Fran
ce
Slovak
Repu
blic
Hung
ary
Austr
ia
LNG storage,as % annualdemand
Undergroundstorage, as %annualdemand
Sources: IEA, 2013c.
Figure 3.6 Storage send-out capacities as a share of peak demand
0%20%40%60%80%
100%120%140%160%180%200%
Estonia
Luxemb
ourg
Switz
erlan
d
Norw
ay
Finlan
d
Sweden
Irelan
d
New
Zeala
nd
Spain
Turkey
Austr
alia
Unite
d Kin
gdom
Netherlan
ds
Belgi
um
Polan
d
Czech
Repu
blic
Italy
Greece
Denm
ark
Slovak
Repu
blic
Cana
da
Fran
ce
Germ
any
Hung
ary
Korea
Unite
d Sta
tes
Austr
ia
Japan
Portu
gal
Maximum send-outfrom LNG, as %peak demand
Maximum send-outfrom UGS, as %peak demand
Sources: IEA, 2013c.

CHAPTER 3 Natural gas security in IEA countries 61© O
ECD/
IEA
2014
storage capacity that surpasses 50% of annual demand. In Hungary, this has been achieved through government-designed public stockbuilding; Austria’s high gas storage levels are commercially-developed depleted production fields.
Assuming storage capacities are filled to their maximum levels (as is usually the case at the beginning of winter), and that the volumes can be dispatched to demand centres, 12 IEA countries could meet 80% or more of their peak demand by means of a theoretical maximum drawdown on their storage. Six countries could theoretically cover all their peak demand in this way.
External infrastructure resilienceDeveloping domestic storage capacity is not the only way to enhance gas security: establishing interconnections with neighbouring countries is another key means of improving a country’s resilience. Indeed, it is worth noting that some countries (e.g. Czech Republic, Luxembourg, Slovak Republic, Sweden and Switzerland) are connected to storage sites located in neighbouring countries.
Eight IEA countries have a maximum inflow pipeline capacity that exceeds their peak demand, thus providing a large degree of security of supply; maximum inflow capacity could theoretically cover more than 70% of peak demand in 11 IEA countries. It should be noted, however, that the pipeline infrastructure in most of these countries is well-developed because it often serves as a transit route. As such, although the capacities are high, the total volume of gas transiting through these inflow points cannot be considered to be accessible to the countries themselves.
Not all IEA countries are reliant on pipeline supplies, however, and LNG supplies are of vital importance to otherwise isolated gas markets such as Japan and Korea. LNG supplies have also played an important role in strengthening the resilience of the gas markets of Western Europe. Five countries (Greece, Japan, Korea, Portugal and Spain) theoretically could cover their peak demand with their LNG import capacity alone.
Diversification of entry points and supplies is a key measure of external resilience, although the ability of a country to diversify its supply sources depends significantly on
Figure 3.7 Import diversity of supplies
0%10%20%30%40%50%60%70%80%90%100%
0.000.100.200.300.400.500.600.700.800.901.00
Estonia
Finlan
dSw
eden
Slovak
Repu
blic
Irelan
dPo
land
Czech
Repu
blic
Unite
d Sta
tesHu
ngary
Switz
erlan
dPo
rtugal
Austr
iaGr
eece
Luxemb
ourg
Unite
d Kin
gdom
Germ
any
Turkey
Belgi
um Italy
Spain
Fran
ceJap
anKo
reaCana
da*
Denm
ark*
Austr
alia*
Netherlan
ds*
New
Zeala
nd*
Norw
ay*
Her�nd
ahl-H
irschma
n ind
ex (2
011) HHI
Importdependence
* Not applicable - net exporter or no imports. Note: The Herfindahl-Hirschman Index, an economic concept widely applied in anti-trust and competition law, is defined in this context as the sum of the squares of the market shares of the countries of imports for any given country. The index ranges from 0 (high diversity of supply) to 1.0 (one monopolistic supplier). It is worth noting that the index does not take into account the level of import dependence. (Therefore marginal net importers, if they only import from one source will appear with an index of 1.)

ENERgy SuPPly SECuRITy 2014 62 © O
ECD/
IEA
2014
its inherent geography. The external resilience of certain Central and Eastern European countries is inherently weak, with many depending on just one dominant entry point and supplier (namely, Russia). This is also the case in Finland (depending on Russia) and Sweden (depending on Denmark), both of which are 100% dependent on a single entry point and supplier. Many European countries are currently investing in making key gas pipelines reversible so as to provide additional resilience in the event of a crisis.
Policies and emergency measuresThe majority of IEA countries have taken specific steps to develop natural gas emergency policies, including establishing a gas-specific national emergency strategy organisation (NESO) or dedicated emergency organisation structure for dealing with gas disruptions. Countries that have not designed any such policies or do not have a NESO structure are for the most part either gas exporters and/or have highly resilient systems with numerous entry points (e.g. North America and Japan and Korea).
Box 3.4 European Union regulation on gas security
Following the Russia-Ukraine gas dispute in January 2009, the European Union sought to establish common standards for security of gas supply for the whole European Union. To this end, the European Parliament adopted a regulation to safeguard security of gas supply, which entered into force on 2 December 2010.
According to the regulation, EU member states must designate a particular regulatory or government authority with specific responsibility for gas supply security. This designated authority is responsible for monitoring gas supply developments, assessing risks to supplies, establishing preventive action plans and setting up emergency plans. EU member states are also committed to collaborating closely in a crisis, including through a Gas Coordination Group and through shared access to reliable data and information regarding supply.
The regulation establishes a common indicator for gas security, known as N-1. This refers to a situation where the most significant element of a country’s gas network is out of operation, such as an import pipeline or production facility. The N-1 standard is used to define the country’s supply standard, which ensures that vulnerable customers, particularly households, continue to receive gas supplies even under exceptionally difficult supply circumstances.
EU member states are required to carry out an assessment of security of gas supply based on a number of common elements set out in the regulation. These include assessments of the N-1 and supply standards, a description of the market, stress tests and interaction with other member states. On the basis of the risk assessment, each country then prepares preventive action plans and emergency plans which must be updated every two years.
Source: European Parliament (2010), “Report on the proposal for a regulation of the European Parliament and of the Council concerning measures to safeguard security of gas supply and repealing Directive 2004/67/EC”, 29 March 2010, www.europarl.europa.eu/sides/getDoc.do?type=REPORT&reference=A7-2010-0112&language=EN.
Nine IEA countries have specific policies designed around implementing interruptible contracts, or have based the resilience of their systems partly on flexible interruptible contracts. Six IEA countries have developed fuel-switching policies. It should be noted that the percentage of gas-fired plants that can switch fuels has decreased over the last decade, reflecting the progressive roll out of combined cycle gas turbine (CCGT) plants. Indeed, the greater efficiency of these plants means that they are less flexible and thus less able to switch fuels easily.

CHAPTER 3 Natural gas security in IEA countries 6 3© O
ECD/
IEA
2014
A number of IEA countries (all of which are in Europe) have placed some form of stockholding obligation on their gas industry. Seven countries have placed a gas stock obligation on their domestic players, and eight countries have imposed an obligation on certain gas-consuming industry players to hold stocks of an alternative fuel (e.g. gasoil, for gas-fired power plants) to be used in the event of a gas disruption. Combined with the public stocks that Hungary has at its disposal, half of the member countries of the IEA have developed specific stockholding measures related to gas that would provide strong resilience in the event of a disruption.
Table 3.2 Overview of gas emergency policies in IEA member countries
NESO for gas disruption
Able to cope in an N-1 situation
Policy promoting
interruptible contracts
Policy promoting
fuel switching
Government/ agency
stockholding
Gas stock obligation
Alternative fuel
obligation
Australia yes yes
Austria yes yes
Belgium yes
Canada yes
Czech Republic yes yes
Denmark yes yes yes
Estonia yes yes
Finland yes yes yes
France yes yes
Germany yes yes
Greece yes yes yes yes yes
Hungary yes yes yes yes
Ireland yes yes yes yes
Italy yes yes yes yes yes
Japan yes
Republic of Korea yes
Luxembourg yes
Netherlands yes
New Zealand yes yes yes yes
Norway yes
Poland yes yes yes yes
Portugal yes yes yes yes
Slovak Republic yes yes yes
Spain yes yes yes yes
Sweden yes
Switzerland yes yes yes yes
Turkey yes * yes yes yes yes
United Kingdom yes yes yes yes
United States yes
22 24 8 7 1 7 8
* Information unavailable

ENERgy SuPPly SECuRITy 2014 6 4 © O
ECD/
IEA
2014
Concluding remarksAs in the case of oil, each country determines which natural gas emergency response measures are most appropriate, depending on its domestic market conditions and policy preferences. Chapter 4 describes in further detail the gas markets and emergency response policies of individual member countries.
ReferencesInternational Energy Agency (IEA) (2013a), Medium-Term Gas Market Report, OECD/IEA, Paris.
IEA (2013b), Energy Balances of OECD Countries, OECD/IEA, Paris.
IEA (2013c), Natural Gas Information, OECD/IEA, Paris.
List of figuresFigure 3.1: Inter-regional natural gas trade 2018 52Figure 3.2: Natural gas supply chain 53Figure 3.3: Natural gas in IEA countries: 2012 58Figure 3.4: Natural gas import dependence: 2012 59Figure 3.5: Storage capacities as a percentage of annual demand 60Figure 3.6: Storage send-out capacities as a share of peak demand 60Figure 3.7: Import diversity of supplies 61
List of tablesTable 3.1: Natural gas supply and demand, 1985-2018 51Table 3.2: Overview of gas emergency policies in IEA member countries 63
List of boxesBox 3.1: Expanding IEA work on energy security 50Box 3.2: Natural gas disruptions in the past 54Box 3.3: Costs of emergency gas stocks 55Box 3.4: European union regulation on gas security 62

www.iea.org/books
PDF versions at 20% discount
nlinebookshop
Tel: +33 (0)1 40 57 66 90
E-mail: [email protected]
International Energy Agency9 rue de la Fédération
75739 Paris Cedex 15, France
Secure Sustainable Together

This publication reflects the views of the International Energy Agency (IEA) Secretariat but does not necessarily reflect those of individual IEA member countries. The IEA makes no representation or
warranty, express or implied, in respect to the publication’s contents (including its completeness or accuracy) and shall not be responsible for any use of, or reliance on, the publication.
This document and any map included herein are without prejudice to the status of or sovereignty over any territory, to the delimitation of international frontiers and boundaries and to the name of
any territory, city or area.
The paper used for this document has received certification from the Programme for the Endorsement of Forest Certification (PEFC) for being produced respecting PEFC’s ecological,
social and ethical standards. PEFC is an international non-profit, non-governmental organisation dedicated to promoting Sustainable Forest Management (SFM) through independent third-party certification.
IEA Publications 9, rue de la Fédération, 75739 Paris cedex 15Typesetted in France by Jouve
Printed in France by Chirat, June 2014 Cover design: IEA. Photo credits: © GraphicObsession.
PEFC Logo
Related Documents