Energy savings of tissue machines Flexible application of technologies in different locations Master’s Thesis within the Innovative and Sustainable Chemical Engineering programme ZHE WEN Department of Energy and Environment Division of Heat and Power Technology CHALMERS UNIVERSITY OF TECHNOLOGY Göteborg, Sweden 2012

Welcome message from author
This document is posted to help you gain knowledge. Please leave a comment to let me know what you think about it! Share it to your friends and learn new things together.
Transcript

Energy savings of tissue machines Flexible application of technologies in different locations
Master’s Thesis within the Innovative and Sustainable Chemical Engineering
programme
ZHE WEN Department of Energy and Environment Division of Heat and Power Technology
CHALMERS UNIVERSITY OF TECHNOLOGY Göteborg, Sweden 2012


MASTER’S THESIS
Energy savings of tissue machines
Flexible application of technologies in different locations
Master’s Thesis within the Innovative and Sustainable Chemical Engineering
programme
ZHE WEN
SUPERVISOR(S):
Mikael Wiklund
Anders Ottosson
EXAMINER
Mathias Gourdon
Department of Energy and Environment
Division of Heat and Power Technology
CHALMERS UNIVERSITY OF TECHNOLOGY
Göteborg, Sweden 2012

Energy savings of tissue machines
Flexible application of technologies in different locations Master’s Thesis within the Innovative and Sustainable Chemical Engineering
programme
ZHE WEN
© ZHE WEN, 2012
Department of Energy and Environment
Division of Heat and Power Technology
Chalmers University of Technology
SE-412 96 Göteborg
Sweden
Telephone: + 46 (0)31-772 1000
Chalmers Reproservice Göteborg, Sweden 2012

I
Energy savings of tissue machines
Flexible application of technologies in different locations Master’s Thesis in the Innovative and Sustainable Chemical Engineering programme
ZHE WEN Department of Energy and Environment Division of Heat and Power Technology Chalmers University of Technology
ABSTRACT
Nowadays tissue makers are facing many energy related challenges – the increasing energy price, the regulations from government about limitation of energy consumption and various demands from customers in different locations of the world concerning how to increase the energy efficiency and improve their working environment. As one of the leading tissue machine manufacturers, Metso Paper is making great efforts to reduce the energy consumption and increase the energy efficiency of tissue machines.
New technologies are developed to reduce the energy consumption and the heat exchanger network is studied to find more valuable heat. To know how to combine the new technologies developed in Metso Paper, a model is developed so that the energy and economic evaluation could be carried out for three different configurations (STD, BAT and BDG) in different locations. Heat recovery is carried out for the drying section of a standard DCT 200 tissue machine in Luleå (Sweden) and Lagos (Nigeria) where district heating and district cooling are in demand respectively. Pinch technology which is a systematic tool for heat analysis is used for process integration. Finally different heat exchanger networks are suggested in these two locations.
It is found from the simulation results of the model that the new-developed technologies could bring significant energy savings. The interactions between different components of tissue machines are studied so it is now clear that the electricity production from the turbine will be influenced by the choice of the headbox etc. From the economic evaluation, it is found that the BAT configuration is more profitable for Sweden while BDG is more suitable for Russia.
By studying heat recovery in the drying section, it is discovered that the hot moist air from the turbo blower should be considered as a hot stream if it is available. Adsorption chillers should be used in Lagos to transfer the excess heat into the cooling water. With the low gas price in Lagos, the steam generator could be removed so that more excess heat could be used to make the cooling water.
Key words: tissue machine, energy efficiency, model, heat recovery, adsorption chillers

II

III
Contents ABSTRACT I
CONTENTS III
PREFACE V
NOTATIONS VII
1 INTRODUCTION 1
1.1 Purpose 1
1.2 Limitations 1
1.3 Method 1
2 METHODOLOGY 3
2.1 Pinch technology 3
2.1.1 Process and utility streams 3
2.1.2 Thermal data extraction 3
2.1.3 Minimum temperature difference 3
2.1.4 Composite curves and grand composite curves 4
2.1.5 Process integration 4
2.2 Economic evaluation 4
2.2.1 Investment cost of a heat exchanger 5
2.2.2 Payback period 6
2.2.3 Annuity method 6
3 THE TISSUE MACHINE 9
3.1 Stock preparation 9
3.2 Headbox 10
3.3 Press section 10
3.4 Drying section 10
4 A MODEL FOR CONFIGURATION ANALYSIS 13
4.1 Best Available Technologies 13
4.1.1 ViscoNIP press 13
4.1.2 Yankee head isolation 15
4.1.3 New headbox 16
4.1.4 Turbine 18
4.1.5 Others 19
4.2 Three configurations 19
4.3 Interactions among components 20
4.4 Input data 21
4.5 Process of the calculation for energy consumption 21

IV
4.6 Economic evaluation 23
5 HEAT RECOVERY OF DRYING SECTION 25
5.1 Hot and cold streams 25
5.2 Minimum temperature difference 25
5.3 Pinch analysis for Luleå and Lagos 26
5.3.1 Data collection in Luleå 26
5.3.2 Heat integration in Luleå 29
5.3.3 Data collection in Lagos 30
5.4 Economic evaluation 31
5.4.1 Economic evaluation in Luleå 32
5.4.2 Economic evaluation in Lagos 32
6 RESULTS 35
6.1 Simulation results of the configuration model 35
6.1.1 Results of energy consumption 35
6.1.2 Results of economic evaluation 37
6.2 Results of heat recovery in drying section 39
6.2.1 Heat recovery system in Luleå 39
6.2.2 Heat recovery system in Lagos 43
7 CONCLUSIONS 45
8 FUTURE WORK 47
9 REFERENCES 49
10 APPENDIX 51
V
Preface In this project, a model is built up to analysis the energy consumption and economic results for tissue machines with different configurations. In addition, heat recovery is carried out for the drying section of a standard DCT 200 tissue machine in two locations. This project is cooperated by Metso Paper Karlstad and Heat and Power Division in Chalmers University of Technology and it lasted from 1st January to 29th May in 2012.
I would thank my supervisor Mikael Wiklund for all of his great support and data support as well as Anders Ottosson for his good suggestions. Besides I want to express my thanks to my examiner Mathias Gourdon in Chalmers University of Technology for his great help in the whole process. Also, I want to thank all people in the company who gave me the valuable help as it is impossible to finish the work without their supports.
Karlstad, June 2012
Zhe Wen

VI
VII
Notations Abbreviations
AS Active steam
BAT Best available technologies
BDG Budget
CC Composite curve
CEPCI Chemical Engineering Plant Cost Index
CP Heat capacity flow rate
DH District heating hot water
EEM Energy Efficiency Management system
GCC Grand composite curve
HA Hood moist air
ISBL Inside battery limits cost
PA Preheated fresh air
PBP Payback period
PW Process water
STD Standard
TB Turbo blower
Symbols
��� Area of heat exchangers
bar(g) Gauge pressure
Ce, Equipment cost
Cp Specific heat capacity
� Annual energy cost saving
∆��� Condensate enthalpy
� Capital investment cost
� ����� Efficiency of drying section
��� Annual net profit
Q Duty of heat exchangers
� Annuity factor
� �� Dew point of the moist air
������ Final temperature of the moist air
∆��� Mean logarithmic temperature difference

VIII
∆Tmin Minimum temperature different
������ Start temperature of the moist air
T� !"#$% Total thermal energy saving
U Overall heat transfer coefficient
&����� Final humidity of the moist air
&����� Start humidity of the moist air
1
1 Introduction Nowadays tissue makers are facing many challenges related to energy – the increasing energy cost, the regulations from government about limitation of energy consumption for per ton produced tissue, various demands from customers in different locations of the world concerning how to recover heat from the production lines, etc.
In Sweden, the guideline of annual energy consumption set by the government was 2,950 kWh per ton produced tissue from July 1, 2010 which was a challenge for many tissue makers (Wiklund, 2010). Metso Paper has been endeavouring in decreasing the energy consumption by developing new technologies, increasing the energy efficiency by e.g. better mill design and improving heat recovery process.
Decreasing the energy consumption of the tissue production to an acceptable level is a global strategy of Metso. However, the customers are distributed all around the world so there are large local differences in fuel prices, climates, customer demand etc. Local differences should be respected when applying new technologies and recovering the excess heat.
1.1 Purpose
There are mainly two purposes in this project. The first one is to investigate the degree of energy reduction by applying new technology concepts e.g. new press roll and better stock preparation system etc in different configurations and perform economic evaluation of different configurations depending on different local conditions.
The second purpose is to examine different heat recovery approaches for the waste heat of tissue machines based on different climates and customer demand e.g. using waste heat for district heating in a European tissue mill and producing cooling air in an African tissue plant.
1.2 Limitations
For the first task, data of the energy consumption can only be provided from a machine of standard configuration, so that every single new technology needs to be studied by e.g. performing thermo dynamical analysis or calculating mass and energy balance to get its influence to the consumption of electricity, gas and steam with the intention that the total consumption of other configurations could also be obtained. For the second task, part of the data used in heat recovery is provided from a simulation program which was developed in Metso and used to simulate the drying process. More accurate data such as data from a logging system of a tissue mill is not available in this project.
1.3 Method
A literature review is carried out first for the process of tissue production, pinch technology and the technologies for producing cooling effect by waste heat. For the first task, a model is built in excel to analyze the influence of new technologies and an

2
economic evaluation would be carried out by an excel program which was developed by Metso in 2008. For the heat recovery part, pinch technology is used to make the process integration. Pro-Pi, which was developed by Chalmers University of Technology, is used for the pinch analysis. In addition, many small models are developed by excel for different processes, e.g. model for evaluating the cooling effect of chillers at different local situations, so that, once better data are available in the future, new analysis could be made in a short time.

3
2 Methodology For the heat recovery part, pinch technology is used to carry out the process integration so that new scenarios of waste heat recovery could be obtained.
2.1 Pinch technology
Pinch technology is a systematic method to analyze the heating and cooling demands of an industrial process which could be used to build up new heat exchanger network or retrofit the existing ones. In this thesis, pinch technology is used to carry out process integration. Some of the important concepts and processes of pinch technologies are discussed in the following sections.
2.1.1 Process and utility streams
In pinch analysis two kinds of streams need to be extracted i.e. process streams and utility streams. The process streams include hot streams and cold streams. A hot stream is a material stream that must be cooled or available to be cooled while a cold stream is the one must be heated (Harvey, 2010). What needs to be noticed is that the absolute temperature of the steams will not determine if they are hot streams or cold streams, e.g. a stream with a high temperature could still be a cold stream if it needs to be heated. The utility streams are the external utilities used to heat or cool the process and could also be divided into hot utilities (for instance steam at different pressure levels) and cold utilities (such as cooling water or cooling air).
2.1.2 Thermal data extraction
After the identification of the process and utility streams, thermal data need to be extracted. In pinch analysis several parameters are needed for the process streams, i.e. start and target temperature of the streams and the enthalpy difference after heat exchange. Sometimes the enthalpy difference of a stream is not provided directly, instead the heat capacity flow rate (CP) which is the product of flow rate and specific heat capacity of a stream.
The utility streams will not be included in pinch analysis directly but the data of heat capacity and temperature level should be extracted for further analysis.
2.1.3 Minimum temperature difference
The minimum temperature difference (∆Tmin) is the minimum acceptable temperature difference between a hot stream and a cold stream in a heat exchanger. A larger temperature difference between the streams means lower capital cost for the heat exchanger while a smaller temperature difference would bring larger saving in utilities, so the choosing of ∆Tmin is a compromise between capital cost and utility cost. Besides, the choice of ∆Tmin is always based on experience and both global and individual values could be set.
4
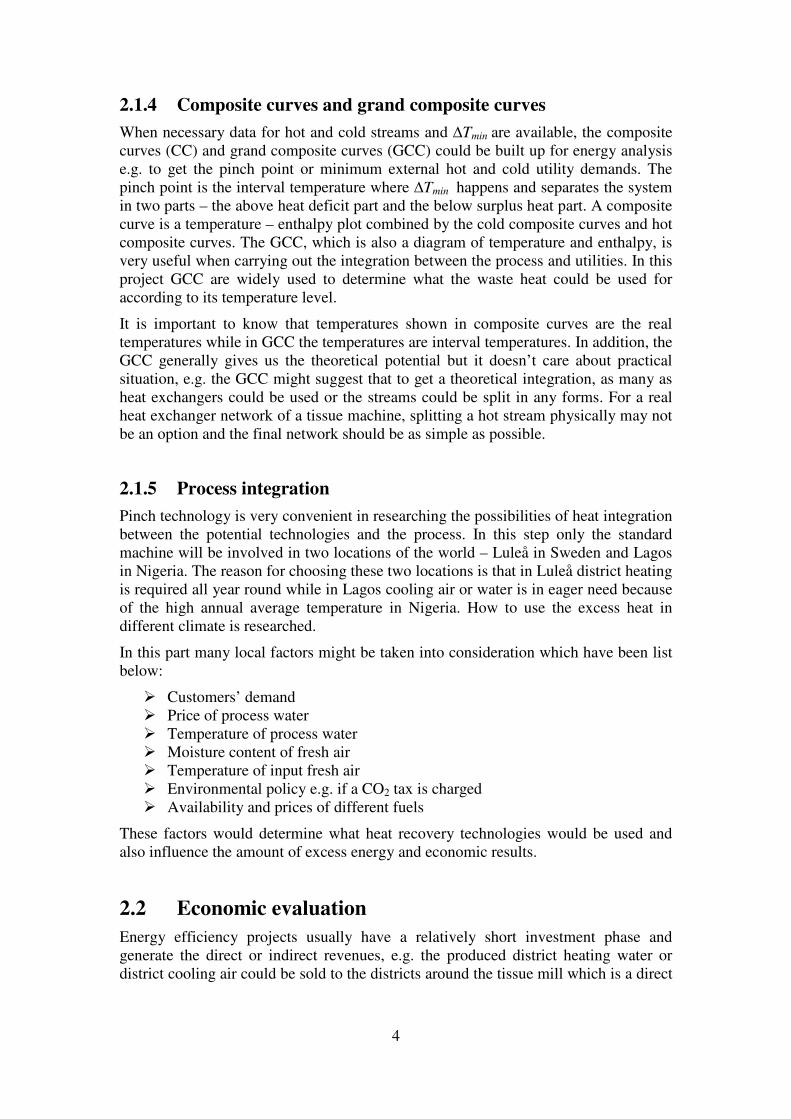
2.1.4 Composite curves and grand composite curves
When necessary data for hot and cold streams and ∆Tmin are available, the composite curves (CC) and grand composite curves (GCC) could be built up for energy analysis e.g. to get the pinch point or minimum external hot and cold utility demands. The pinch point is the interval temperature where ∆Tmin happens and separates the system in two parts – the above heat deficit part and the below surplus heat part. A composite curve is a temperature – enthalpy plot combined by the cold composite curves and hot composite curves. The GCC, which is also a diagram of temperature and enthalpy, is very useful when carrying out the integration between the process and utilities. In this project GCC are widely used to determine what the waste heat could be used for according to its temperature level.
It is important to know that temperatures shown in composite curves are the real temperatures while in GCC the temperatures are interval temperatures. In addition, the GCC generally gives us the theoretical potential but it doesn’t care about practical situation, e.g. the GCC might suggest that to get a theoretical integration, as many as heat exchangers could be used or the streams could be split in any forms. For a real heat exchanger network of a tissue machine, splitting a hot stream physically may not be an option and the final network should be as simple as possible.
2.1.5 Process integration
Pinch technology is very convenient in researching the possibilities of heat integration between the potential technologies and the process. In this step only the standard machine will be involved in two locations of the world – Luleå in Sweden and Lagos in Nigeria. The reason for choosing these two locations is that in Luleå district heating is required all year round while in Lagos cooling air or water is in eager need because of the high annual average temperature in Nigeria. How to use the excess heat in different climate is researched.
In this part many local factors might be taken into consideration which have been list below:
� Customers’ demand � Price of process water � Temperature of process water � Moisture content of fresh air � Temperature of input fresh air � Environmental policy e.g. if a CO2 tax is charged � Availability and prices of different fuels
These factors would determine what heat recovery technologies would be used and also influence the amount of excess energy and economic results.
2.2 Economic evaluation
Energy efficiency projects usually have a relatively short investment phase and generate the direct or indirect revenues, e.g. the produced district heating water or district cooling air could be sold to the districts around the tissue mill which is a direct

5
revenue while the produced steam will decrease part of the primary fuel consumption in a boiler within the mill which is an indirect revenue.
In this project, heat recovery is mainly realized by using heat exchangers so the traditional approach to calculate the investment cost of a heat exchanger will be introduced in this chapter. In addition, several economic indicators are used in this project e.g. payback period, net present value and annuity method.
2.2.1 Investment cost of a heat exchanger
The investment cost of a heat exchanger is generally estimated by the area of the heat exchanger which could be obtained from Equation 2.1 (Sinnot & Towler, 2009). In this equation ��� is the area of the heat exchanger (m2), ' is the duty of the heat exchanger (kW), ( is the overall heat transfer coefficient which is checked from the tool book according to the fluids on both sides of the heat exchanger and ∆��� is called mean logarithmic temperature difference that would be read from Pro-pi once the heat exchanger network is finished.
��� )*
∆+,-./ (2.1)
In this project all new-installed heat exchangers are assumed to be the most typical U-tube shell and tube type and the construction material is assumed to be cast-iron. The
purchased equipment cost ($) on a US Gulf Coast basis in 2007 (0�,2��3) is calculated
by Equation 2.2 (Sinnot & Towler, 2009).
0�,2��3 ) 24000 7 46 . ���9.2 (2.2)
The heat exchanger purchasing cost obtained from Equation 2.2 is for the year 2007 which is a historical data and should be transferred into the cost in 2012 by Equation 2.3.
0�,2�92 ) 0�,2��3 .<=�� �� �> �� ���� 2�92
<=�� �� �> �� ���� 2��3 (2.3)
In 2007 the annual average Chemical Engineering Plant Cost Index (CEPCI) in America was 525 and in 2012 it is assumed to be 589.
So far the equipment purchasing cost for a heat exchanger in 2012 could be calculated. However, the total investment cost is far more than this as costs for installation, piping, instruments etc should also be taken into consideration. Equation 2.4 gives the relation between the total inside battery limits (ISBL) cost and other factors while values for different factors are shown in Table 2.1. (Sinnot & Towler, 2009)
0 ) 0�,<? 2�92 . @A1 7 CD . C� 7 EC�� 7 C�� 7 C� 7 CF 7 C� 7 C�GH (2.4)
In Equation 2.4, Ce, CS is the purchased equipment cost for carbon steel.
6
Table 2.1 Typical factors for estimation of capital cost
Item Value
fp Piping 0.8
fm Material cost factor, Carbon steel 1
fer Equipment erection 0.3
fel Electrical 0.2
fi Instrumental and control 0.3
fc Civil 0.3
fs Structures and buildings 0.2
fl Lagging and paint 0.1
In this project the unified unit for money is Euro, so the final capital cost should be transferred into Euro from US dollar. The ratio between Euro and US dollar is set at 0.772 as the average ratio in 2012.
2.2.2 Payback period
The payback period which is also called payback time means the time to recoup the capital investment from the annual energy saving when the project is related to energy efficiency (Harvey, 2010). The expression is shown in Equation 2.5
F
IPBP 0
=
(2.5)
Where PBP is the payback period, � is the capital investment cost and � is the annual energy cost saving.
The PBP is an important indicator as it shows the time it takes to start making profit, but PBP does not consider the time value of money and shows no project earnings after the investment cost is recovered. So, other indicators that consider time value of money should also be used especially for the project that lasts for a long period.
2.2.3 Annuity method
The energy projects generally have a long lifetime, so the time value of money should also be taken into consideration. Annuity method is an alternative used for energy saving projects and the annual net profit (���) is used which has been shown in Equation 2.6.
0a r*IFNP −=
(2.6)
Where � is the annuity factor used to convert the investment cost at time point 0 to a serious of identically sized yearly payment. The ��� tells the investors how much money will be earned for a typical year of the project.
Economic evaluation would be carried out for both tasks. In task one, the total capital cost for every component of three configurations will be provided directly by Metso to get the total investment cost for every configuration. Also, the specific energy consumption (consumption of the electricity, gas and steam) are available for every

7
configuration after analysis by the model. With the local energy price, some economic indicators can be provided to the customer, e.g. the payback period. The economic evaluation in this part is carried out for every configuration instead of each component.
For the heat recovery part, both payback period and annuity method is used for equipment that produces direct or indirect revenues. The important equipment include e.g. the steam generator, the heat exchanger for the district heating production, the absorption chillers or adsorption chillers which are suitable to be installed in tissue plants located in Africa to produce the cooling air for district cooling.

8

9
3 The tissue machine Tissue is a collective name for crepe paper for sanitary and household purpose which is widely used all around the world. To get the final products with required quality, the raw materials will go through a series of important processes – stock preparation, forming, pressing, drying, and creping etc. A picture of tissue production process is shown in Figure 3.1. Some of the processes and components of the tissue machine involved in this project are discussed below to give a basic introduction of a tissue machine.
Figure 3.1 The process of tissue production (Metso Paper Karlstad AB, 2008)
3.1 Stock preparation
To get appropriate raw materials, the stock must be prepared carefully. The stock preparation involves a series of processes including pulping, beating, refining, fractionation and screening etc. It should be made clear that for different raw materials, product grades and mill conditions the stock preparation system could also be different.
Pulpers are commonly combined by a circular trough with a powerful rotor located centrally at the bottom and a bottom screen for removing the foreign substances. Both batch pulping and continuous pulping could be used in this process. For continuous pulping, bales of pulp are placed on a conveyor belt and then dumped into the pulper at the same rate as the defibered stock which is continuously pumped out at the bottom. (Gavelin, 1999) For batch pulping, pulping in each batch is finished according to specific demand and the process would take about 15 to 20 minutes.
Beating pulp could increase the tensile strength and softness of the fibres and also gives the paper a suitable adhesion to the Yankee dryer. Excessive beating should be avoided so it is important that the strength is specific.
Refiners are generally used to correct the longitudinal tensile strength which is a vital factor of the product quality. (Gavelin, 1999) Surface qualities of the fibers are built up on the refiner plate which is the point-of-contact of the refiner and also the place where electricity energy from the refiner motor are transferred into mechanical force performing on the fibers.

10
3.2 Headbox
The headbox is the component located close to the forming section of the paper machine in which the pulp is distributed onto the wire. Together with the forming section, it plays a key role in the production of high quality paper as the hydraulic performance of the headbox largely determines the properties of the product. The well-prepared stock is distributed across the headbox with the aid of a header which is a tapered pipe connected to a stock nozzle. (Gavelin, 1999)
Headbox sprays stock uniformly across the forming section with a high-speed stock jet through a slice lip. In tissue production, there is usually a speed difference between the jet and wire to obtain good formation. This is mainly because a difference in jet and wire speeds will orientate the fibres in the longitudinal direction, which will bring a favourable effect on the formation. (Gavelin, 1999)
The velocity inside the headbox is chosen to give clean surfaces, good distribution of fibres and a suitable internal turbulence without unnecessary loss of pressure. (Gavelin, 1999) The consistency of fibres in the headbox could be as low as 0,2% to acquire a high-quality formation and varies with the jet speed. Besides, a higher consistency is at all times preferred to save the power used for pumping as long as the formation is acceptable.
3.3 Press section
The stock jet from the headbox will go through the forming roll first and then be transferred by the felt to the press section. The dryness of the web is around 16% before the press and the web needs to be dewatered by mechanical pressing before being picked up at the drying section otherwise much more energy would be consumed in the drying section and the surface quality of the tissue will be poor. There are several reasons to install the press section – to dewater the web as much as possible, to pick up the wet web and transfer it to the Yankee cylinder and to rearrange the fibres in the web and create an intensive and smooth surface for the tissue.
The felt plays an essential role in this section. Firstly, it absorbs the water that dewatered from the web during pressing. Secondly, it uniformly distributes the pressure from the press to the web so that homogeneous dryness and surface properties of the web could be obtained. Thirdly, it works as the conveyer belt which drives the rolls and transfers the web to the cylinder. The cleanness influences the function of the felt to a large extent so shower water and blowing air are needed constantly to keep the felt clean. After pressing, the dryness of the web would reach between 35% and 42% and the web is sent to the drying section. (Gavelin, 1999)
3.4 Drying section
The drying section is the heart of the tissue machine because more than 70% of the energy is consumed in the Yankee cylinder and hood which are two main components of this section. The single large cylinder is generally made of cast-iron inside which steam at specific pressure is used to heat the paper sheet that is wrapped outside of the cylinder. In addition, a hood is arranged above the cylinder and hot air is blown onto the paper to increase the rate of drying.

11
The cylinder has other functions except for heating and drying the paper sheet – it transports the sheet from the press roll to the reel roll during the drying process, acts as the basement for the pressing process and also provides a base for the creping process. (Gavelin, 1999)
The Yankee hood is combined by two parts – the dry end and wet end. The web is first picked up and dried at the wet end then further dried and creped at the dry end. Figure 3.2 describes the structure of the drying section with the air supply system. Fresh air is preheated by the exhaust humid air from the wet end then supplied to burners at both dry and wet ends as the combustion air where gas is used as the hot utility to heat the air to a higher temperature. Besides, part of the preheated air is supplied to the dry end as the make-up air. Several fans are involved in the air supply system, i.e. two combustion air fans, two recirculation fans and an exhaust air fan. There is also a counter flow which is drawn from the dry end and used to make up the air supply for the wet end.
When the tissue sheet is dried to demanded dryness e.g. 95%, creping is finished at the dry end of the cylinder to give the paper a lower density, improved softness and better extensibility. Finally, the tissue is reeled on the reel roller as the product.
Figure 3.2 The drying section with air supply system

12
13
4 A model for configuration analysis To decrease the energy consumption and enable the tissue machines to be more sustainable, a range of new technologies are developed in recent years in tissue-making industry. It is essential to understand how these new technologies work and what kind of roles they play in energy savings. Besides, it is also important to know the energy efficiency when different components are combined together because there might be interactions between the chosen components. To solve these problems, a model is developed to study the energy savings of tissue machines with different configurations.
4.1 Best Available Technologies
The new technologies in Metso are called Best Available Technologies (BAT) including e.g. the new press called ViscoNIP that could be used to replace the traditional single press so that the dryness of the tissue after press will increase by about 5%. The consumption of steam and gas would be decreased significantly in the drying section when the dryness increases. A turbine can also be installed to transfer the kinetic energy of the jet spraying out of the headbox into electricity and fulfills part of the electricity demand in the mill. A headbox with optimized turbulence generator and smaller lip opening is another alternative to decrease the electricity consumption. There are totally seven BAT involved in this model and they are introduced below.
4.1.1 ViscoNIP press
As mentioned in Chapter 3, the most energy-consuming component for a tissue machine is the drying section. Therefore, the most effective way to reduce energy consumption is to improve the dryness of the web after press. Among all BAT, the ViscoNIP press is proven to be the most outstanding option in energy saving as a significant energy saving could be achieved by just increasing the dryness with 1%.
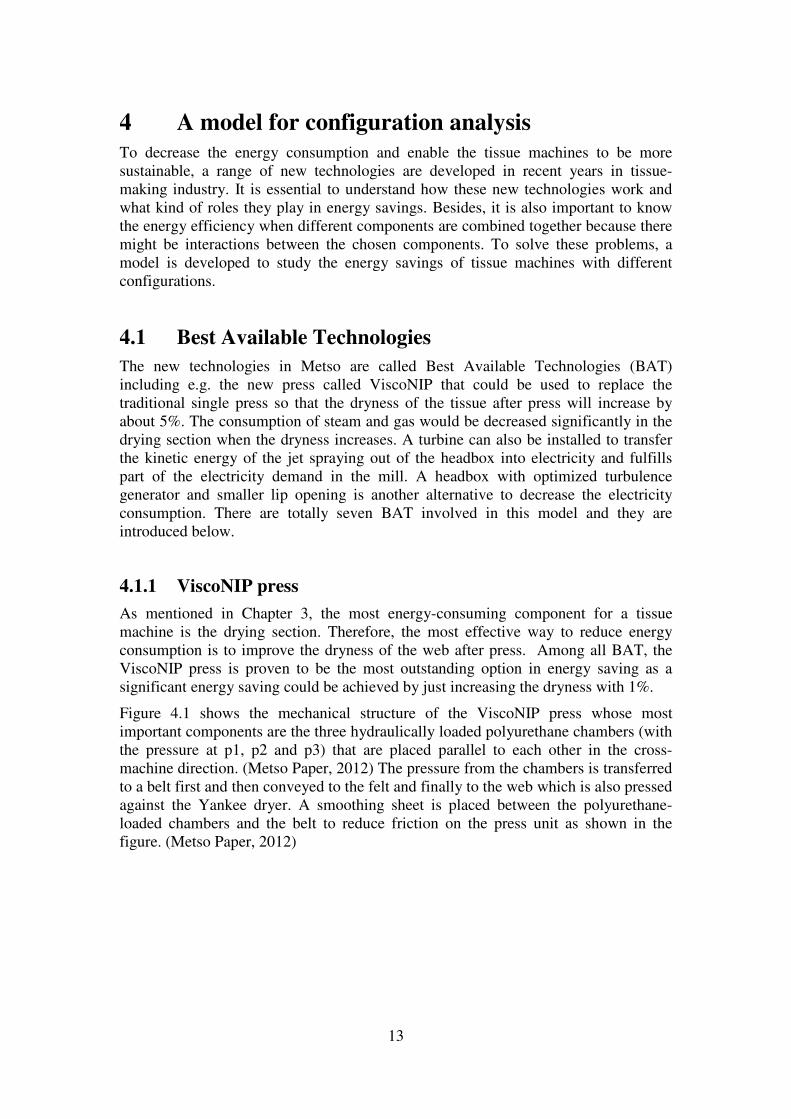
Figure 4.1 shows the mechanical structure of the ViscoNIP press whose most important components are the three hydraulically loaded polyurethane chambers (with the pressure at p1, p2 and p3) that are placed parallel to each other in the cross-machine direction. (Metso Paper, 2012) The pressure from the chambers is transferred to a belt first and then conveyed to the felt and finally to the web which is also pressed against the Yankee dryer. A smoothing sheet is placed between the polyurethane-loaded chambers and the belt to reduce friction on the press unit as shown in the figure. (Metso Paper, 2012)
14
Figure 4.1 The structure of the ViscoNIP press (Metso Paper, 2012)
Pressure of each chamber (p1, p2 and p3) can be loaded individually so that the individual pressure is controllable. The varying pressure enables the operators of the press to customize the pressure curve that best fulfills product-quality or higher-dryness specifications. The pressure curve can even be changed when the machine is in running which brings substantial flexibility. (Metso Paper, 2012)
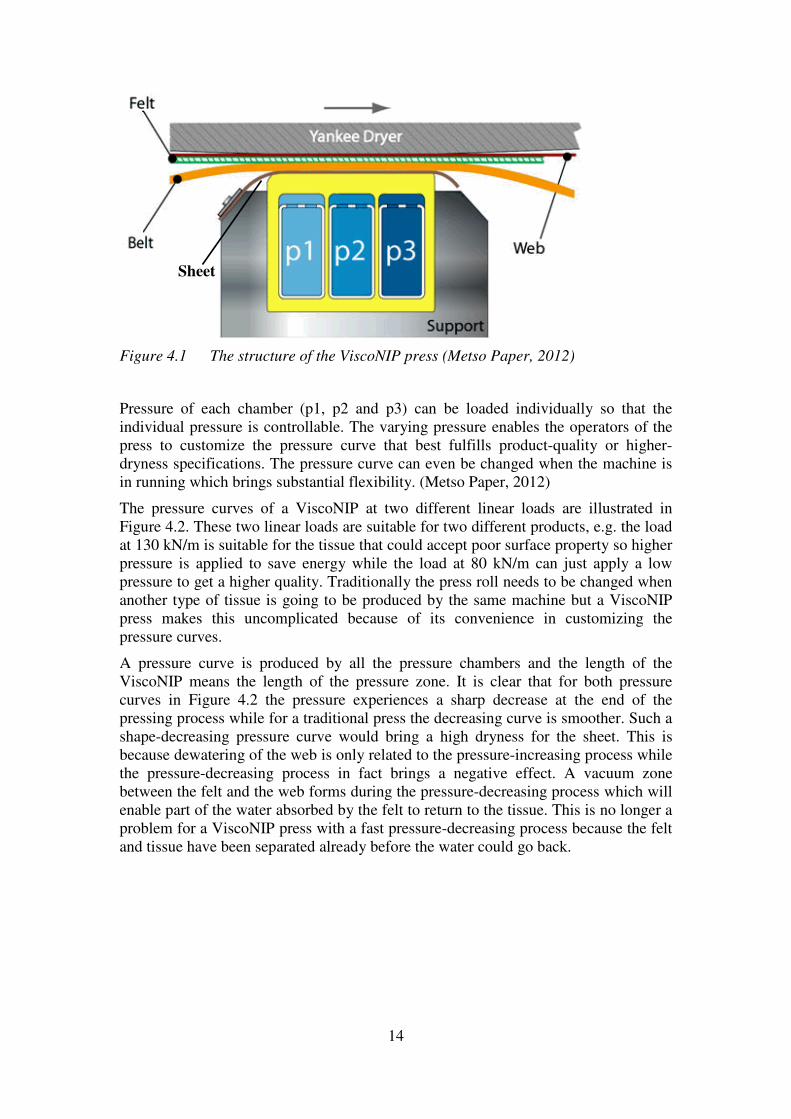
The pressure curves of a ViscoNIP at two different linear loads are illustrated in Figure 4.2. These two linear loads are suitable for two different products, e.g. the load at 130 kN/m is suitable for the tissue that could accept poor surface property so higher pressure is applied to save energy while the load at 80 kN/m can just apply a low pressure to get a higher quality. Traditionally the press roll needs to be changed when another type of tissue is going to be produced by the same machine but a ViscoNIP press makes this uncomplicated because of its convenience in customizing the pressure curves.
A pressure curve is produced by all the pressure chambers and the length of the ViscoNIP means the length of the pressure zone. It is clear that for both pressure curves in Figure 4.2 the pressure experiences a sharp decrease at the end of the pressing process while for a traditional press the decreasing curve is smoother. Such a shape-decreasing pressure curve would bring a high dryness for the sheet. This is because dewatering of the web is only related to the pressure-increasing process while the pressure-decreasing process in fact brings a negative effect. A vacuum zone between the felt and the web forms during the pressure-decreasing process which will enable part of the water absorbed by the felt to return to the tissue. This is no longer a problem for a ViscoNIP press with a fast pressure-decreasing process because the felt and tissue have been separated already before the water could go back.
Sheet
15
Figure 4.2 The pressure curves of the ViscoNIP press (Metso Paper, 2012)
4.1.2 Yankee head isolation
It is discussed in Section 3.4 that steam at specific pressure is used inside the Yankee cylinder to dry the tissue sheet wrapping the dryer. The heat from the saturated steam is the latent heat which is released from the process of the condensation. However, for a Yankee cylinder there are two sides which are called Yankee dryer heads where condensation is also occurring but there is no tissue to heat. So condensation on the heads will just increase the temperature of the air surrounding the heads by thermal radiation. This is both heat-consuming and negative to the environment surrounding the machine especially for the mills located in the warm climate.
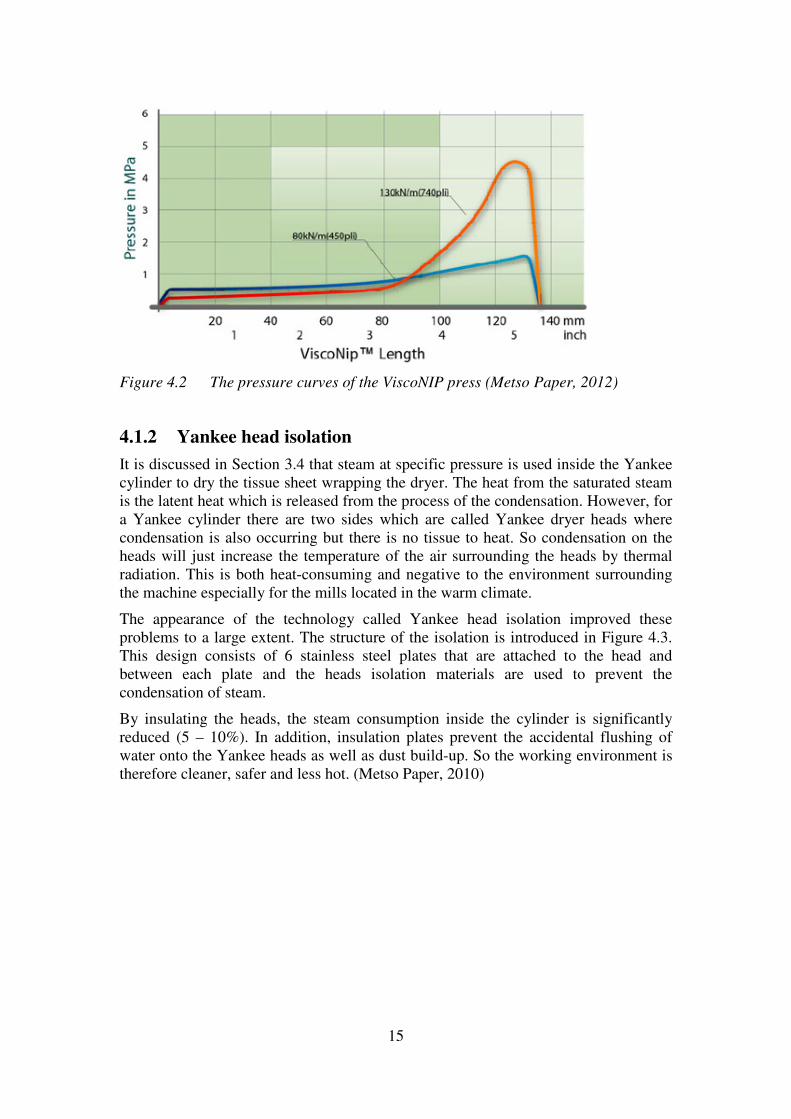
The appearance of the technology called Yankee head isolation improved these problems to a large extent. The structure of the isolation is introduced in Figure 4.3. This design consists of 6 stainless steel plates that are attached to the head and between each plate and the heads isolation materials are used to prevent the condensation of steam.
By insulating the heads, the steam consumption inside the cylinder is significantly reduced (5 – 10%). In addition, insulation plates prevent the accidental flushing of water onto the Yankee heads as well as dust build-up. So the working environment is therefore cleaner, safer and less hot. (Metso Paper, 2010)

16
Figure 4.3 Yankee Dryer head isolation (Metso Paper, 2010)
4.1.3 New headbox
The new headbox developed in Metso has two main improvements related to energy saving – the optimized turbulence generator and the improved nozzle geometry. With better internal turbulence, the consistency of the stock in the headbox could be increased when the final quality of the tissue is not influenced. It has been discussed in Section 3.2 that a higher consistency means saving in pump power as the flow of the stock can be decreased.
The stock jet sprays out from the nozzle of a headbox and is dewatered in the forming section. The structure of the nozzle is demonstrated in Figure 4.4. To obtain a good forming the speed of the jet from headbox is set 100 m/min slower than the machine speed in this project which is a typical value in tissue industry. So the speed is constant even though the nozzle is reshaped. The width of the nozzle is determined by the width of the tissue on reel so it is also specified. The only changeable value is the opening of the slice lip and the lip opening becomes smaller when the consistency of the stock in the headbox is allowed to be higher.

17
Figure 4.4 Structure of the nozzle
There is a pump locating on the floor of the mill which is connected with the headbox. When the stock is transported from the pump to the nozzle it passes through some valves, a filter and a perforated plate inside the headbox and the pressure loss caused by them should not be ignored. The gravitational potential energy of the jet should also be taken into consideration since the headbox is about 3 meters higher than the floor. So the power into the pump is transferred into three parts. An energy balance is shown in Equation 4.1.
)1.4()2
(2
g
vlh
gqP ++=
η
ρ
All the notations are explained below with units.
P – Power consumption of the pump (W)
ρ – Density of the stock (kg/m3)
g – Gravity acceleration (m/s2)
q – Volume flow rate (m3/s)
η – Efficiency of the pump
h – Height of the headbox (m)
l – Total pressure loss expressed by a length (m)
v – Velocity of the jet (m/s)
The total pressure loss is expressed as a length while the volume flow rate q is
calculated from Equation 4.2
)2.4(vswq ∗∗=
Where w is the width of the nozzle, s is the opening of the slice lip and v is the jet velocity and all of them could be found from Figure 4.4.
18
According to these two equations, a smaller lip opening, in combination with a higher consistency, could bring a large power saving when the tissue machine is running at a high speed, e.g. 2000 m/min.
4.1.4 Turbine
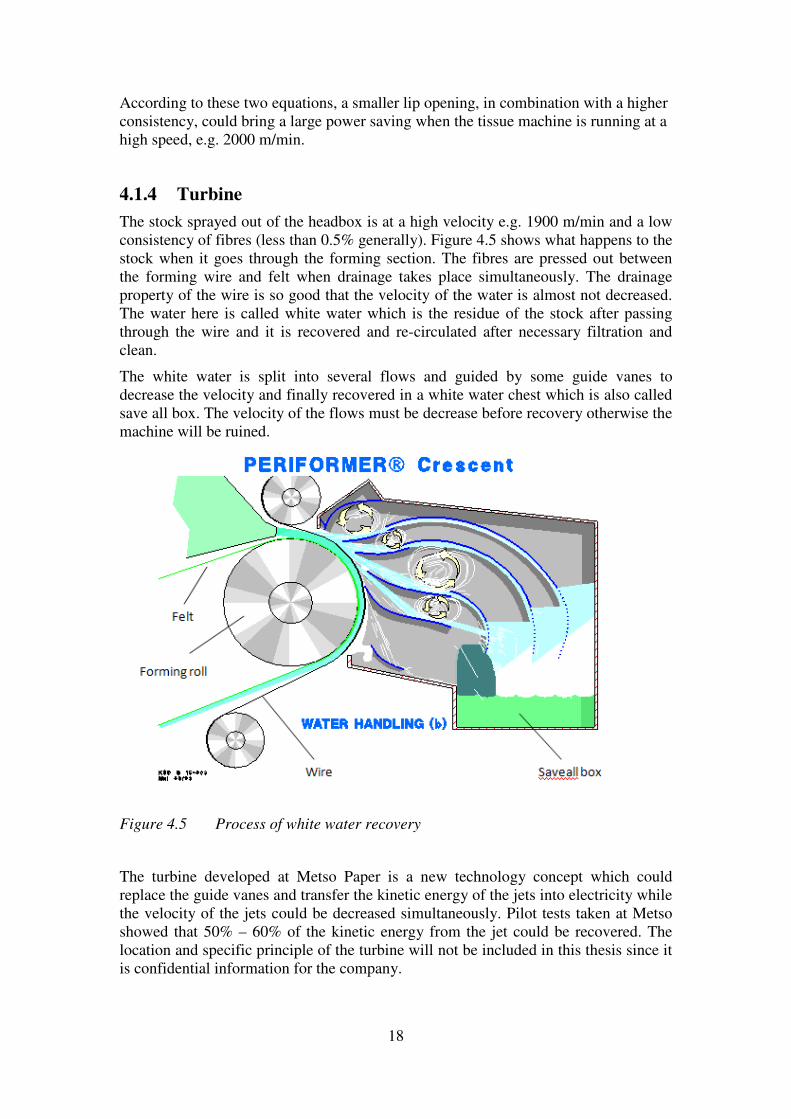
The stock sprayed out of the headbox is at a high velocity e.g. 1900 m/min and a low consistency of fibres (less than 0.5% generally). Figure 4.5 shows what happens to the stock when it goes through the forming section. The fibres are pressed out between the forming wire and felt when drainage takes place simultaneously. The drainage property of the wire is so good that the velocity of the water is almost not decreased. The water here is called white water which is the residue of the stock after passing through the wire and it is recovered and re-circulated after necessary filtration and clean.
The white water is split into several flows and guided by some guide vanes to decrease the velocity and finally recovered in a white water chest which is also called save all box. The velocity of the flows must be decrease before recovery otherwise the machine will be ruined.
Figure 4.5 Process of white water recovery
The turbine developed at Metso Paper is a new technology concept which could replace the guide vanes and transfer the kinetic energy of the jets into electricity while the velocity of the jets could be decreased simultaneously. Pilot tests taken at Metso showed that 50% – 60% of the kinetic energy from the jet could be recovered. The location and specific principle of the turbine will not be included in this thesis since it is confidential information for the company.

19
4.1.5 Others
Besides the four important BAT mentioned above there are other three new technologies involved in this model – new stock preparation system, hood sensors and an Energy Efficiency Management (EEM) system. A general introduction of them is necessary even though they are not as important as the others in energy savings.
It is discussed in Section 3.1 that the refiner is a vital component of the stock preparation system which transfers electricity energy into mechanical force to correct the longitudinal tensile strength of the fibers. In the new stock preparation system more efficient refiners are used so that the electricity consumption is decreased.
The hood sensor is installed to test the humidity of the exhaust air. Pilot machine test shows that the total specific energy consumption will decrease if exhaust air humidity increase when keeping the production unchanged. The discharged hood air is at a high and stable humidity when the sensor is installed. Higher exhaust air humidity means more water is taken away from the tissue and indicates a high-efficient hood system.
The EEM system is an energy monitoring and control system for the tissue machine. The online monitoring enables the operators to get hourly reports of the energy consumption so as to make adjustment to the machine if it works abnormally and thus energy savings are obtained.
4.2 Three configurations
Some of the BAT discussed above have been widely used in standard-configuration DCT 200 tissue machines e.g. the Yankee head isolation and the EEM system. The installation of a new Yankee head isolation could be finalized in just one week and the payback time is relatively short which makes it to be favoured by customers. However, energy savings of other new technologies should also be investigated. Besides, it is important to know that if different components have the interactions to each other.
In this thesis, the only available data are some basic data and the specific energy consumptions (consumption of steam, gas and electricity) of a standard DCT 200 tissue machine. So the machine with standard configuration is set as the reference scenario. Another two scenarios – the Budget and BAT configurations are put forward to investigate their energy consumptions.
The standard machine involves two new technologies (Yankee head isolation and the EEM system) and is the most typical configuration of today’s tissue machines. The BAT configuration contains all the seven BAT discussed in Section 4.1. The Budget configuration is the configuration with no BAT thus it is the cheapest components which still could produce the tissue with necessary quality. All these three configurations are illustrated in a scope list that is a configuration table shown in Table 4.1.

20
Table 4.1 The scope list table
Scope list
Components/Configurations BDG STD BAT
Press style Single(BDG) Single(STD) ViscoNIP
Turbine - - +
Stock preparation +5% Reference -10%
Headbox Lip opening (mm) 12 11 9
Yankee head isolation - + +
Hood sensor - - +
EEM system - + +
In the table the components that are not compulsory for a tissue machine are signed with a "+" or "-" where the "+" means new technologies are used in a configuration while the "-" means they are not. "BDG", "STD" and "BAT" represent the Budget, Standard and BAT configurations respectively. For the STD configuration the regular single press is used while for BDG a cheaper press is used. The slice lip openings of the headbox for three configurations are 12, 11, and 9 mm respectively which are the most typical values. The power consumption for stock preparation is assumed to be 10% less in the BAT configuration and 5% more in the BDG configuration compared to the reference scenario which is based on the experience.
What can be estimated is that the BAT scenario would be very attractive in utilities saving but simultaneously is the most expensive configuration in capital cost. The BDG scenario, as mentioned above would be the cheapest in capital cost but also be the most energy intensive configuration. The STD scenario is a compromise between the other two and would has an intermediate energy consumption and capital cost.
In the project five machines which have the same configuration but produce tissue with different basis weights are considered. Basis weight is an indicator of the thickness which means the weight of tissue whose size is one square meter. Five machines with different basis weight (13, 16, 18, 22, and 37 g/m2) are studied together to find the relationship between energy consumption and different thickness.
4.3 Interactions among components
Some of the components listed in Table 4.1 are independent of others when carrying out the energy analysis, i.e. the press, stock preparation system and the headbox. The others, however, are influenced by other components.
The turbine could recover the kinetic energy of the stock jet from the headbox, which means the opening of the nozzle can influence the amount of generated power when the width of the nozzle and the velocity of the jet are constant. In other words, the power production from the turbine is influenced by the choice of the headbox. Another obvious example is that in Table 4.1 the Yankee head isolation is installed in both STD and BAT configurations, but it makes more sense to the STD machine compared to a BAT machine. This is because in the BAT machine, the flow rate of the steam is decreased by the ViscoNIP (The pressure would be maintained by the

21
special mechanical structure in the cylinder) and there is not so much steam condensation on the heads of the cylinder.
In a word, it is necessary to consider the interactions between different components when calculating the energy savings otherwise the result would be inaccurate.
4.4 Input data
The available input data are from standard DCT 200 machines with five different basis weights. The data include some basic data related to the machines and specific energy consumptions for every STD machine with a special basis weight tissue. The basic data and energy consumption data are provided in Table 4.2 and Table 4.3 respectively.
Table 4.2 Basic data for standard DCT 200 machines
Basis weight at reel (g/m2) 13 16 18 22 37
Machine speed (m/min) 2 000 2 000 2 000 1 710 925
Width at reel (m) 5,5 5,5 5,5 5,5 5,5
Dryness at reel 95% 95% 95% 95% 95%
Crepe ratio 20% 20% 20% 20% 10%
Dryness after STD press 38% 39% 40% 41% 42%
Production at reel (ton/day) 165 203 228 238 244
Table 4.3 Specific energy consumptions for machines with STD configuration
Basis weight at reel (g/m2) 13 16 18 22 37
Electricity (kWh/ton) 483 407 384 286 149
Steam (kWh/ton) 800 685 609 582 569
Gas (kWh/ton) 766 893 910 870 850
Total consumption (kWh/ton) 2049 1985 1903 1738 1568
The electricity are used in almost every section of the machine to prepare the stock, drive the rolls, pump the air in the hood and make the vacuum zones where they are needed. The steam and gas are only used in the drying section where the steam is used inside the cylinder and the gas is burned to heat the air in the hood. The unit of the energy is kWh/ton which is the amount of energy consumed for every ton of produced tissue. It is clear that the total consumption of energy decreases significantly when the basis weight of the tissue increases which is mainly influenced by the electricity consumption.
4.5 Process of the calculation for energy consumption
Table 4.3 provides the specific and total energy consumptions for the STD configuration. To get the similar results for BDG and BAT configurations, a process in defined which is shown in Figure 4.6.

22
Figure 4.6 Process of the calculation
From the flow chart it is clear that the core idea is trying to get some “relative values” from the existing data and relations. Finally the energy consumption for BAT and BDG configurations could be obtained from the existing data of reference scenario.
In the second step of the process, relative value is calculated for every single component in BDG and BAT configurations compared to the same component in STD configuration. The interactions should be taken into consideration in this step e.g. the lip opening should be set at different values when different headbox are chosen. The old-fashioned components are used in BDG configuration and newest components are used in BAT configuration so it could be expected that the relative value of energy consumption for a BAT component is negative compared to a standard component while it is positive for a BDG component. The detailed calculation process for the second step is available in Appendix A. Then the total energy saving (negative value) and extra energy consumption (positive value) could be acquired for BDG and BAT configurations respectively. Finally the specific and total energy consumptions could be calculated for BDG and BAT configurations.

23
4.6 Economic evaluation
Economic evaluation will be carried out for both BAT and BDG configurations at different locations of the world with different fuel prices.
Metso Paper has provided the investment cost for all components so the total investment of all configurations could be calculated. Then similar to the energy analysis, the total investment cost of BAT and BDG configurations are compared with the STD configuration. The “relative investment cost” and “relative energy saving” compared to the standard configuration are obtained for further evaluation. The process of economic evaluation is shown in Figure 4.7.
Figure 4.7 Schematics of the economic evaluation process
INEW and ISTD indicate the total investment cost for BDG/BAT and standard configurations respectively. A machine with BAT configuration is more expensive but will have lower energy consumption compared to a standard machine, while a BDG configuration is cheaper and more energy-consuming. The payback time and annual net profit would be calculated for investing in a BAT/BDG configuration instead of a standard one.

24
The investment cost for every component and different configurations are demonstrated in Table 4.4. The numbers are not exactly accurate as they are confidential for the company but useful economic results could still be obtained.
Table 4.4 Investment cost for components and configurations (k€)
Components/Configurations BDG STD BAT
Press style 1520 1900 2650
Turbine - - 700
Stock preparation 68 85 90
Headbox Lip opening (mm) 1900 1900 1900
Yankee head isolation - 90 90
Hood sensor - - 50
EEM system - 40 40
Total investment cost 3488 4015 5520
It can be seen from the table that generally a new-style component will be more expensive. However, for the headbox the adjustment of the lip opening will not bring extra investment cost.
Russia and Sweden are chosen in the model as two different locations of the world with different fuel prices which are shown in Table 4.5. The prices of energy are also provided by Metso Paper.
Table 4.5 Fuel prices in different countries (€/MWh)
Fuel price/Country Russia Sweden
Electricity price 60 77
Steam price 18 57
Gas price 11 51
25
5 Heat recovery of drying section
In tissue industry it is important to develop and apply new technologies to decrease the energy demand for the tissue machine as discussed in Chapter 4. However, it is also essential to recover as much excess heat as possible to increase the overall energy efficiency. The challenge is to apply technologies that not only make use of the heat losses, but also could transfer the excess energy into more valuable forms. To realize this target, a systematic heat analysis tool called pinch technology is used in this chapter to integrate the thermal energy and build up the reasonable heat exchanger networks in different locations of the world.
5.1 Hot and cold streams
In this project two hot process streams would be taken into consideration– the hot moist air from the Yankee hood and hot moist air from the turbo blower. The turbo blower is a new-developed surrounding equipment in tissue industry and is introduced in detail in Appendix B. By using the turbo blower to replace the vacuum pumps, the electricity consumption is decreased and heat recovery becomes practical and convenient.
The cold process streams are not totally specified in this project. However, several alternatives could be taken into consideration since they are quite typical in the tissue mill e.g. active steam used in the thermocompressor to produce the low pressure steam, fresh air which needs to be preheated, water for district heating, process water etc. The principle and structure of the thermocompressor is also explained in Appendix B.
What needs to be noticed is the target temperature of the hot moist air, both for the Yankee hood and turbo blower as they are going to be discharged to the atmosphere and the target temperature could be “soft”, determined by the degree of heat recovery. When the tissue mills are located in different climates, the discharge temperature would be different, e.g. in a cold place the target temperature could be relatively low while for a warmer location the target temperature should be higher according to the chimney effect. The chimney effect means there must be a reasonable temperature difference between the exhaust gas and outdoor air so that the gas is discharged naturally. The temperature difference forms the difference in density between the gas and outdoor air thus the flow is driven by buoyancy.
5.2 Minimum temperature difference
As discussed in Chapter 2, the choice of ∆Tmin is always based on experience and both global and individual values could be set. In this thesis individual values are set for different streams, 10 K is used for a liquid stream and 20 K is chosen for a gas stream. The individual ∆Tmin in this project are shown in Table 5.1.
26
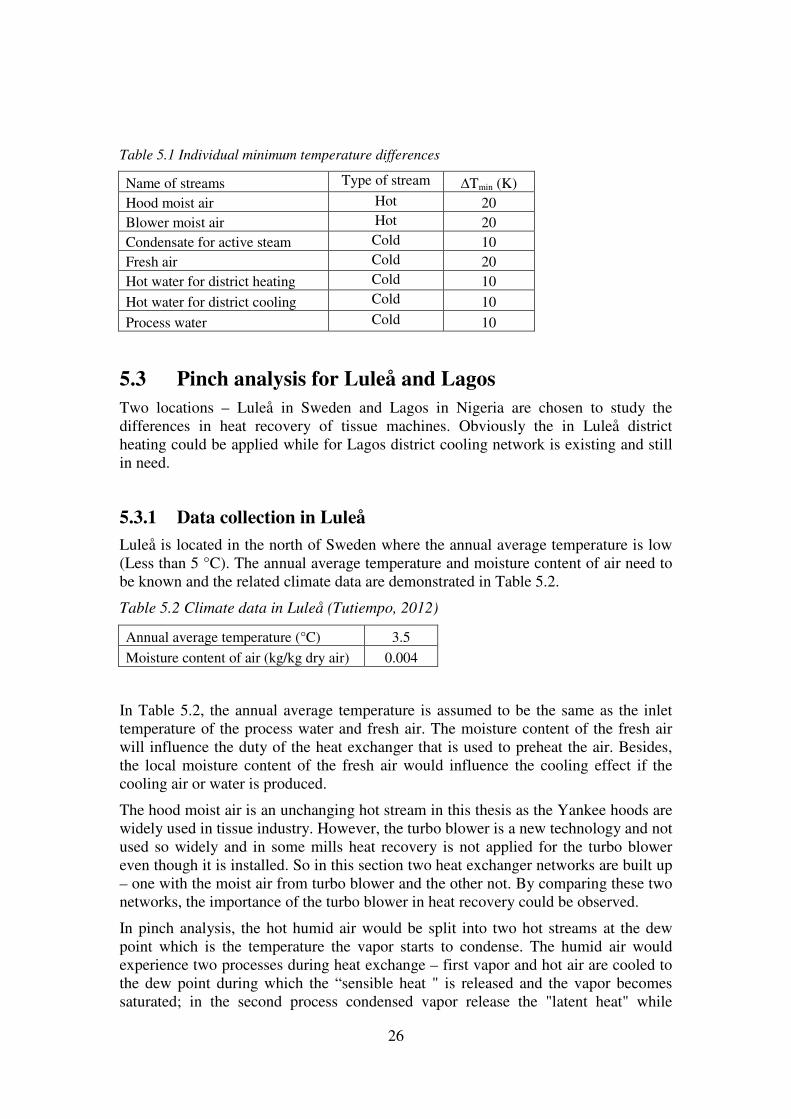
Table 5.1 Individual minimum temperature differences
Name of streams Type of stream ∆Tmin (K)
Hood moist air Hot 20
Blower moist air Hot 20
Condensate for active steam Cold 10
Fresh air Cold 20
Hot water for district heating Cold 10
Hot water for district cooling Cold 10
Process water Cold 10
5.3 Pinch analysis for Luleå and Lagos
Two locations – Luleå in Sweden and Lagos in Nigeria are chosen to study the differences in heat recovery of tissue machines. Obviously the in Luleå district heating could be applied while for Lagos district cooling network is existing and still in need.
5.3.1 Data collection in Luleå
Luleå is located in the north of Sweden where the annual average temperature is low (Less than 5 °C). The annual average temperature and moisture content of air need to be known and the related climate data are demonstrated in Table 5.2.
Table 5.2 Climate data in Luleå (Tutiempo, 2012)
Annual average temperature (°C) 3.5
Moisture content of air (kg/kg dry air) 0.004
In Table 5.2, the annual average temperature is assumed to be the same as the inlet temperature of the process water and fresh air. The moisture content of the fresh air will influence the duty of the heat exchanger that is used to preheat the air. Besides, the local moisture content of the fresh air would influence the cooling effect if the cooling air or water is produced.
The hood moist air is an unchanging hot stream in this thesis as the Yankee hoods are widely used in tissue industry. However, the turbo blower is a new technology and not used so widely and in some mills heat recovery is not applied for the turbo blower even though it is installed. So in this section two heat exchanger networks are built up – one with the moist air from turbo blower and the other not. By comparing these two networks, the importance of the turbo blower in heat recovery could be observed.
In pinch analysis, the hot humid air would be split into two hot streams at the dew point which is the temperature the vapor starts to condense. The humid air would experience two processes during heat exchange – first vapor and hot air are cooled to the dew point during which the “sensible heat " is released and the vapor becomes saturated; in the second process condensed vapor release the "latent heat" while

27
uncondensed vapor and dry air go on to release "sensible heat" until the target temperature. The dew point is determined by the original humidity of the air and could be checked from a Mollier chart. The input data of the humid hood air are from a simulation program that was developed in Metso for a standard DCT200 tissue machine. The input data for calculating the heat content of the two processes mentioned above are shown in Table 5.3.
Table 5.3 Input data for heat content of hood moist air
Start temperature of hot moist air (°C) 332
Moisture content of start hot moist air (kg/kg dry air) 0.51
Flow rate of the hot moist air (kg dry air/s) 8.6
Dew point (°C) 78.9
Temperature discharging to the atmosphere (°C) 40
Final moisture content (kg/kg dry air) 0.05
Cp air (kJ/kg K) 1.006
Cp condensate(kJ/kg K) 4.2
Cp vapor (kJ/kg K) 1.84
Enthalpy of condensation (kJ/kg) 2501
In the table Cp is the specific heat capacity and the enthalpy of the condensation means latent heat of the condensation. The final discharging temperature is assumed to be 40 °C in Luleå which is reasonable according to the low annual average temperature. By checking from the website, the dew point could be found at 78.9 °C and the final moisture content could be checked from the Mollier chart and is around 0.05 kg vapor /kg dry air. (Humcal, 2012)
The theoretical calculation of the heat content is in Appendix C and the results which are used in pinch analysis are shown in Table 5.4.
Table 5.4 Data of hood moist air for pinch analysis
Name Type Tstart (°C) Ttarget (°C) Q (kW)
Hood air1 Hot 332 78.9 4234
Hood air2 Hot 78.9 40 10285
The target temperature for both the hood and blower moist air are set at 40 °C in Luleå. This is because the annual average temperature in Luleå is very low and the low target temperature could be expected. However, it should be kept in mind that the streams would be discharged into the atmosphere so there is no problem if the final temperature is higher than
40 °C.
The input data and the final extract data used in pinch analysis for the blower moist air are similar to the hood air. The input data is from the manufacturer of the blower which are shown in Table 5.5

28
Table 5.5 Input data for heat content of blower moist air
Temperature of hot moist air (°C) 123
Moisture content (kg/kg dry air) 0.103
Flow rate of the hot moist air (kg dry air/s) 8.07
Dew point (°C) 53
Temperature discharging to the atmosphere (°C) 40
Final moisture content (kg/kg dry air) 0.05
The dew point for the blower moist air is at 53 °C (the original moisture content is lower than the hood air), so the stream will also be divided into two parts at the dew point. The extracted data is demonstrated in Table 5.6.
Table 5.6 Data of blower moist air for pinch analysis
Name Type Tstart (°C) Ttarget (°C) Q (kW)
Blower air1 Hot 123 53 675
Blower air2 Hot 53 40 1204
In all the cold streams, only the fresh air that needs to be preheated is specified and its input data are available in Table 5.7.
Table 5.7 Input data for fresh air
Target temperature (°C) 200
Flow rate of the air (kg dry air/s) 7.98
In Table 5.2 the annual average temperature determines the inlet temperature of the air and the moisture content could be considered to get the useful data in pinch analysis which is shown in Table 5.8.
Table 5.8 Data of fresh air for pinch analysis
Name Type Tstart (°C) Ttarget (°C) Q (kW)
Fresh air Cold 3.5 200 1589
For other cold streams, the flow rate or heat content is unknown which would be determined by heat integration in pinch analysis. However, the temperature levels are available and would be very useful later in the heat integration. The cold streams and their start and target temperatures are shown in Table 5.9.
Table 5.9 Temperature levels for other cold streams
Name Type Tstart (°C) Ttarget (°C)
Active steam Cold 205 205
District heating water Cold 50 90
Process water Cold 3.5 60

29
The active steam is used as the inlet steam of the thermocompressor and its absolute pressure is 17 bar. In Luleå the typical delivery temperature of the district heating water is about 90 °C while the return hot water is at around 50 °C (Elfgren, 2010). The process water is assumed to be obtained from the local lake or river and heated to around 60 °C before being used within the mills.
5.3.2 Heat integration in Luleå
It could be concluded from Table 5.4 and 5.6 that for both the two hot streams, the heat content above the dew point is much smaller than the one below the dew point. This is because the high humidity of the streams gives a considerable contribution to the latent heat. However, the heat above the dew point has higher temperature which means the heat is probably more valuable since it is possible to transfer it into more profitable forms.
It is assumed that the cold streams at higher temperature level is more profitable than the one at lower temperature level, e.g. the hot water for district heating would be produced as much as possible before producing the process water. Generally, this assumption would be reasonable according to the experience e.g. the steam at higher pressure (also means higher temperature) is normally more expensive. According to this assumption, pinch analysis would be carried out step by step and more valuable cold streams will always be produced first. So the main target of the heat recovery part in this project is to use the excess heat at high temperature to heat the cold stream also at high temperature level.
In Section 2.1.4, it is mentioned that the GCC is helpful in heat integration to show the process in a straightforward way so the GCC for the two hot streams are shown in Figure 5.1 and first the active steam would be integrated with the background GCC.
It needs to be kept in mind that all the temperatures in the GCC are not the real temperatures. For the active steam whose real temperature is at 205 °C, the internal temperature used in the GCC should be 210 °C by adding half of its individual ∆Tmin.
From the GCC, it could be read that the largest production for the 17 bar active steam is at about 1900 kW. When the active steam touches the background GCC, it means the ∆Tmin is reached and no further heat exchange is possible.
Figure 5.1 GCC for heat integration with the active steam
30
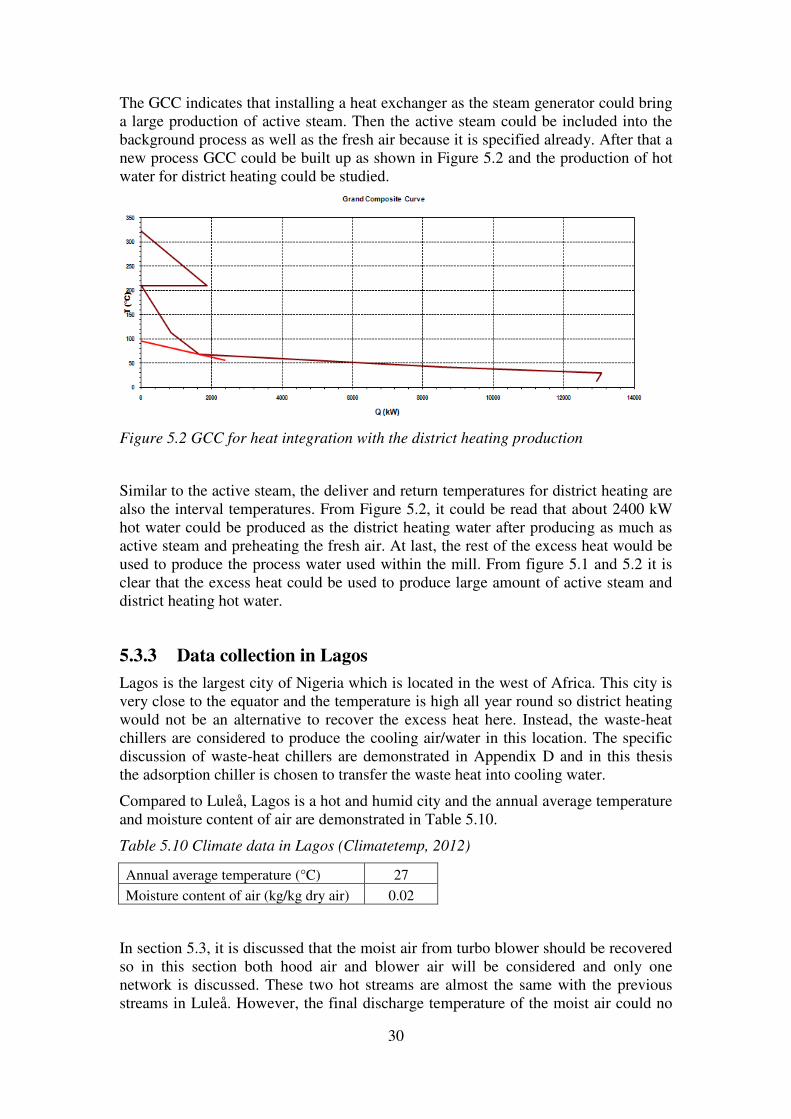
The GCC indicates that installing a heat exchanger as the steam generator could bring a large production of active steam. Then the active steam could be included into the background process as well as the fresh air because it is specified already. After that a new process GCC could be built up as shown in Figure 5.2 and the production of hot water for district heating could be studied.
Figure 5.2 GCC for heat integration with the district heating production
Similar to the active steam, the deliver and return temperatures for district heating are also the interval temperatures. From Figure 5.2, it could be read that about 2400 kW hot water could be produced as the district heating water after producing as much as active steam and preheating the fresh air. At last, the rest of the excess heat would be used to produce the process water used within the mill. From figure 5.1 and 5.2 it is clear that the excess heat could be used to produce large amount of active steam and district heating hot water.
5.3.3 Data collection in Lagos
Lagos is the largest city of Nigeria which is located in the west of Africa. This city is very close to the equator and the temperature is high all year round so district heating would not be an alternative to recover the excess heat here. Instead, the waste-heat chillers are considered to produce the cooling air/water in this location. The specific discussion of waste-heat chillers are demonstrated in Appendix D and in this thesis the adsorption chiller is chosen to transfer the waste heat into cooling water.
Compared to Luleå, Lagos is a hot and humid city and the annual average temperature and moisture content of air are demonstrated in Table 5.10.
Table 5.10 Climate data in Lagos (Climatetemp, 2012)
Annual average temperature (°C) 27
Moisture content of air (kg/kg dry air) 0.02
In section 5.3, it is discussed that the moist air from turbo blower should be recovered so in this section both hood air and blower air will be considered and only one network is discussed. These two hot streams are almost the same with the previous streams in Luleå. However, the final discharge temperature of the moist air could no

31
longer be set at 40 °C due to the chimney effect. Instead, 60 °C is assumed to be the target temperature In Lagos. The dew point for the hood and blower moist air is still at 78.9 and 53 °C respectively, which means the hood air would still be split at the dew point in pinch analysis while there would be just one stream for the blower moist air as its dew point is lower than the discharge temperature.
By using equations in Appendix C, all the data of hot streams needed in pinch analysis would be available and shown in Table 5.11.
Table 5.11 Data of hot streams in Lagos
Name Type Tstart (°C) Ttarget (°C) Q (kW)
Hood air1 Hot 332 78.9 4234
Hood air2 Hot 78.9 60 7869
Blower air Hot 123 60 608
The inlet temperature of the fresh air is assumed to be the same as annual average temperature and the humidity would also have some influence to the heat content. The data for fresh air are shown in Table 5.12.
Table 5.12 Data of fresh air in Lagos
Name Type Tstart (°C) Ttarget (°C) Q (kW)
Fresh air Cold 27 200 1440
For other cold streams, the temperature level for steam is still the same while the inlet temperature for the process water increases to the local average temperature. Hot water that would be used to drive the adsorption chiller is produced. As discussed in Appendix D, the inlet and outlet hot water temperature is 90 and 80 °C respectively, accordingly the produced hot water’s inlet temperature should be 80 °C while the outlet is 90 °C. All the data of the cold streams are shown in Table 5.13.
Table 5.13 Data of other cold streams for pinch analysis
Name Type Tstart (°C) Ttarget (°C)
Active steam Cold 205 205
Hot water for cooling Cold 80 90
Process water Cold 27 60
Pinch technology is used again in Lagos to integrate the streams and the whole process is very close to the case in Luleå except that the some inlet temperatures are changed. The GCCs built up for Lagos show the similar information so they are not demonstrated in this section any more.
5.4 Economic evaluation
The economic evaluation would be carried out for Luleå and Lagos separately. The active steam generator and the heat exchanger for district heating are taken into consideration for both heat exchanger networks in Luleå. However, in Lagos the

32
adsorption chiller should also be considered when evaluating the economic results for district cooling. The exchangers of fresh air and process water are very common in many tissue mills and not included in the thesis.
5.4.1 Economic evaluation in Luleå
The steam generator could produce the 17 bar active steam. However, the price for the steam is generally not easy to be found directly. A typical approach to estimate its price is to assume that the steam is produce by a gas boiler with a reasonable efficiency so that the price can be calculated from the local price of the gas. A tissue machine could run for around 350 days per year and in Sweden biogas is assumed to be used to produce the steam. The efficiency of a biogas gas boiler is assumed to be 0.8 which would be reasonable nowadays. (Memorandum, 2009)
The price of biogas in Sweden is assumed to be around 0.045 €/kWh so the price and annual revenue of steam saving could be calculated. All the related data are shown in Table 5.14.
Table 5.14 Price and annual revenue of steam in Luleå
Machine runing time (day) 350
Price of biogas (€/kWh) 0.045
Efficiency of boiler 0.8
Price of active steam (€/kWh) 0.056
Annual revenue (k€) 863
The average price of the produced hot water for district heating is found to be about 0.04 €/kWh in Sweden and a delivery loss is assumed to be 20% since the hot water might be transported for a long distance. (Nordic energy perspectives, 2009) The related economical data are shown in Table 5.15.
Table 5.15 Price and annual revenue of district-heating hot water
Price of district heating in Sweden (€/kWh) 0.04
Delivery loss 20%
Annual revenue (k€) 650
The payback time and annual net profit are chosen to be the economic indicators in this thesis and the annuity factor is assumed to be 0.1.
5.4.2 Economic evaluation in Lagos
There is only one suggested heat exchanger network in Lagos and the economic evaluation is carried out for the active steam and the cooling air/water production.
In Nigeria the primary energy to produce the steam is assumed to be the natural gas and the price of industrial natural gas in Nigeria is extremely low, which is found to be just 0.007 €/kWh. (Michael, 2012) It would lead to a low price in the active steam and the annual revenue will be decreased significantly. The related results are shown

33
in Table 5.16. Here the efficiency of the boiler is assumed to be 0.9 according to a more mature technology for the natural gas boiler.
Table 5.16 Price and annual revenue of steam in Lagos
Machine running time (day) 350
Price of natural gas (€/kWh) 0.007
Efficiency of boiler 0.9
Price of active steam (€/kWh) 0.008
Annual revenue (k€) 122
The produced hot water will be used as the heat source for the adsorption chiller and the COP is assumed to be 0.7. According to Equation D1 in Appendix D, the cooling capacity (kW) could be obtained. The revenue is an indirect income due to the saving in electricity because an electrical air-conditioner would be used if the adsorption chiller is not applied. However, the COP of electrical air-conditioners is generally much higher than the adsorption chillers e.g. 3 to 4, so normally for producing the cooling air the traditional air-conditioner would be better except that the waste heat is available. The annual electricity saving is calculated by Equation D2 and D3 in Appendix D. The annual revenue could be obtained if the power price is available.
The energy prices in Nigeria are very different – the price of the gas is extremely low while the electricity price is rather high. The price of electricity is found to be around 0.1 €/kWh. (Allafrica, 2012) The related data are shown in Table 5.17.
Table 5.17 Price and annual revenue of district-cooling hot water
Investment cost of adsorption chiller (k€) 300
Price of electricity (€/kWh) 0.1
Machine running time (day) 350
COP of the adsorption chiller 0.7
COP of air-conditioner 3
Annual electricity saving (MWh) 2458
Annual revenue (k€) 246
The investment cost for an adsorption chiller with cooling capacity at 900 kW is assumed to be 300 k€. The total investment cost for district cooling should consider both the hot-water heat exchanger and the adsorption chiller.

34

6 Results
6.1 Simulation r
In Chapter 4 the input data and theory are introduced and a model is developed in excel based on that. The calculation of relative energy consumptions for all components is shown in Appendix A. Then the total BAT and BDG configurations are calculated and their specific energy consumption and economic results are discussed in this section.
6.1.1 Results of energy
The total relative energy consumption for BDG and BAT configurations are demonstrated Figure 6.1 and
Figure 6.1 Extra energy consumption for BDG configuration
In Figure 6.1, all the relative values are positive which indicates extra energy consumption in BDG compared to STD configuration. The extra electricity consumption for BDG configuration decreasethe tissue increases.
This means for a machine used to produce high basis weight tissue, the components related to power consumption could be oldconsumption is small. The biggest extra consumption is the steam, this is because the STD machine uses the Yankee head isolation while the BDG machine does not which could be found in the scope list table.
35
Simulation results of the configuration model
In Chapter 4 the input data and theory are introduced and a model is developed in The calculation of relative energy consumptions for all
components is shown in Appendix A. Then the total relative energy consumption for figurations are calculated and their specific energy consumption
and economic results are discussed in this section.
Results of energy consumption
The total relative energy consumption for BDG and BAT configurations are and 6.2.
Extra energy consumption for BDG configuration
, all the relative values are positive which indicates extra energy consumption in BDG compared to STD configuration. The extra electricity consumption for BDG configuration decreases significantly when the basis weight of
This means for a machine used to produce high basis weight tissue, the components related to power consumption could be old-fashioned because the difference in energy
e biggest extra consumption is the steam, this is because the STD machine uses the Yankee head isolation while the BDG machine does not which could be found in the scope list table.
model
In Chapter 4 the input data and theory are introduced and a model is developed in The calculation of relative energy consumptions for all
energy consumption for figurations are calculated and their specific energy consumption
The total relative energy consumption for BDG and BAT configurations are
, all the relative values are positive which indicates extra energy consumption in BDG compared to STD configuration. The extra electricity
the basis weight of
This means for a machine used to produce high basis weight tissue, the components fashioned because the difference in energy
e biggest extra consumption is the steam, this is because the STD machine uses the Yankee head isolation while the BDG machine does not which
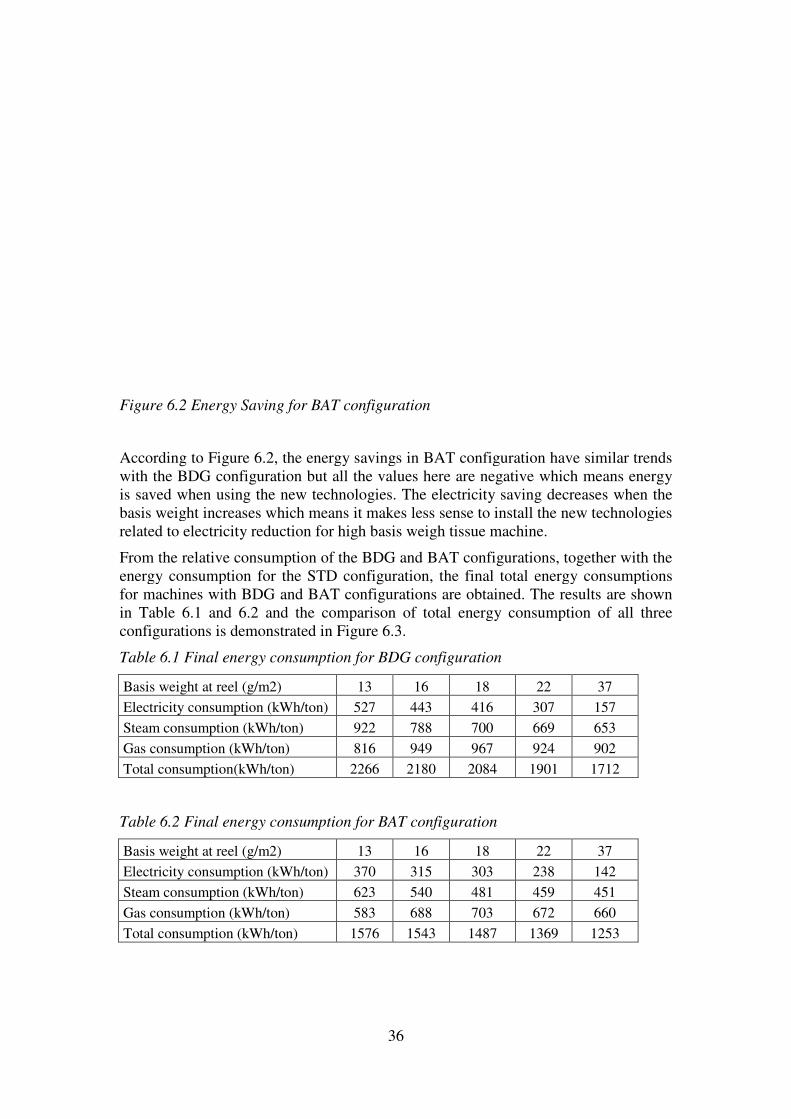
Figure 6.2 Energy Saving for BAT configuration
According to Figure 6.2, the energy savings in BAT configuration have similar trends with the BDG configuration but all the values here are negative which means energy is saved when using the new technologiesbasis weight increases whicrelated to electricity reduction for high basis weigh tissue machine
From the relative consumption of the BDG and BAT configurations, together with theenergy consumption for the for machines with BDG and BAT configurations in Table 6.1 and 6.2 and the comparison of total energy consumption of all three configurations is demonstrated in Figure
Table 6.1 Final energy consumption for BDG configuration
Basis weight at reel (g/m2)
Electricity consumption (kW
Steam consumption (kWh/ton)
Gas consumption (kWh/ton)
Total consumption(kWh/ton)
Table 6.2 Final energy consumption for
Basis weight at reel (g/m2)
Electricity consumption (kW
Steam consumption (kWh/ton)
Gas consumption (kWh/ton)
Total consumption (kWh/ton)
36
Energy Saving for BAT configuration
, the energy savings in BAT configuration have similar trends with the BDG configuration but all the values here are negative which means energy
the new technologies. The electricity saving decreases when the basis weight increases which means it makes less sense to install the new technologies
reduction for high basis weigh tissue machine.
From the relative consumption of the BDG and BAT configurations, together with theenergy consumption for the STD configuration, the final total energy consumptions
machines with BDG and BAT configurations are obtained. The results are shown and the comparison of total energy consumption of all three
configurations is demonstrated in Figure 6.3.
Final energy consumption for BDG configuration
13 16 18 22
Wh/ton) 527 443 416 307
h/ton) 922 788 700 669
h/ton) 816 949 967 924
h/ton) 2266 2180 2084 1901
Final energy consumption for BAT configuration
13 16 18 22
Wh/ton) 370 315 303 238
h/ton) 623 540 481 459
h/ton) 583 688 703 672
h/ton) 1576 1543 1487 1369
, the energy savings in BAT configuration have similar trends with the BDG configuration but all the values here are negative which means energy
. The electricity saving decreases when the new technologies
From the relative consumption of the BDG and BAT configurations, together with the energy consumptions
obtained. The results are shown and the comparison of total energy consumption of all three
37
157
653
902
1712
37
142
451
660
1253
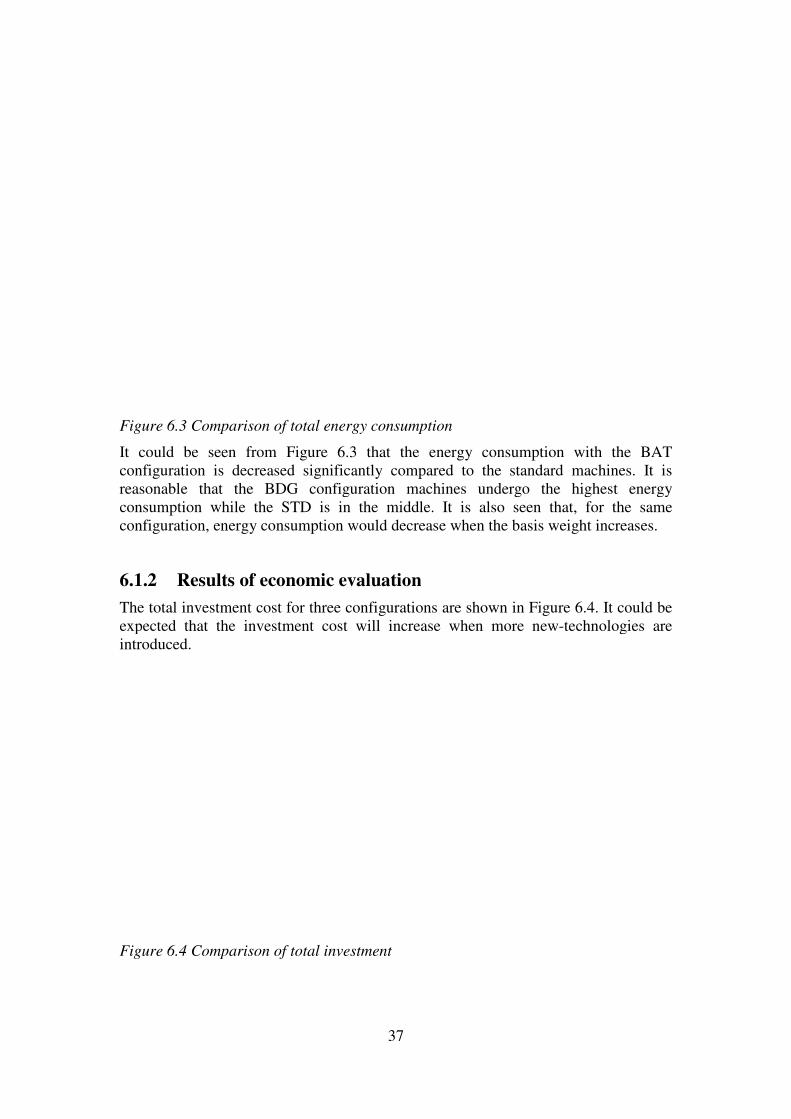
Figure 6.3 Comparison of total energy consumption
It could be seen from Figure configuration is decreased significantly compared to the standard machines. It is reasonable that the BDG configuration machines undergo the highest energy consumption while the STD is in the middle. It is also seen that, for the same configuration, energy consumption woul
6.1.2 Results of economic evaluation
The total investment cost for three configurations are shown in Figure expected that the investment cost will increase when introduced.
Figure 6.4 Comparison of total
37
omparison of total energy consumption
It could be seen from Figure 6.3 that the energy consumption with the BAT decreased significantly compared to the standard machines. It is
reasonable that the BDG configuration machines undergo the highest energy consumption while the STD is in the middle. It is also seen that, for the same configuration, energy consumption would decrease when the basis weight increases.
Results of economic evaluation
The total investment cost for three configurations are shown in Figure expected that the investment cost will increase when more new-technologies
omparison of total investment
.3 that the energy consumption with the BAT decreased significantly compared to the standard machines. It is
reasonable that the BDG configuration machines undergo the highest energy consumption while the STD is in the middle. It is also seen that, for the same
d decrease when the basis weight increases.
The total investment cost for three configurations are shown in Figure 6.4. It could be technologies are

The payback time and annual net profit for Sweden and Russia when money is invested in a BAT machine.
Figure 6.5 Payback time for Sweden and Russia (investing in B
Figure 6.6 Annual net profit for Sweden and Russia (investing in BAT configuration)
From Figure 6.5 and 6.6, Sweden is more profitablemuch higher annual net profit.
Correspondingly, if investing in a BDG configuration, the investment cost could be saved at the beginning and then offset by the extra energy consumption. net profit is demonstrated in Figure 6.
38
The payback time and annual net profit are shown in Figure 6.5 and 6.for Sweden and Russia when money is invested in a BAT machine.
Payback time for Sweden and Russia (investing in BAT configuration)
Annual net profit for Sweden and Russia (investing in BAT configuration)
, it is obvious that investing money in the BAT machine in profitable than in Russia because of the shorter payback period and
much higher annual net profit.
Correspondingly, if investing in a BDG configuration, the investment cost could be saved at the beginning and then offset by the extra energy consumption.
et profit is demonstrated in Figure 6.7 for Sweden and Russia.
and 6.6 respectively
AT configuration)
Annual net profit for Sweden and Russia (investing in BAT configuration)
BAT machine in than in Russia because of the shorter payback period and
Correspondingly, if investing in a BDG configuration, the investment cost could be saved at the beginning and then offset by the extra energy consumption. The annual
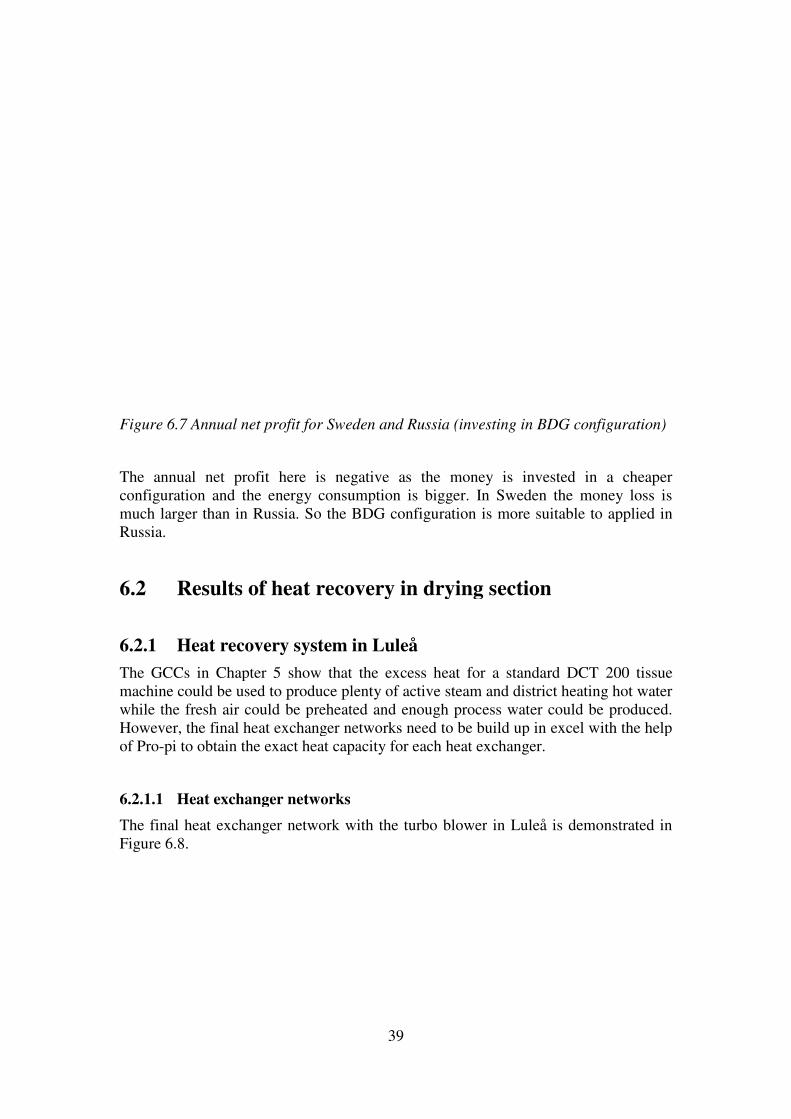
Figure 6.7 Annual net profit for Sweden and Russia (investing in BDG configuration)
The annual net profit here is negative configuration and the energy consumption is much larger than in Russia. So the BDG configuration is more suitable to applied in Russia.
6.2 Results of heat recovery in drying section
6.2.1 Heat recovery s
The GCCs in Chapter 5 show that the excess heat for a standard DCT 200 tissue machine could be used to produce plenty of active steam and district heating hot water while the fresh air could be preheated and enough process water could be proHowever, the final heat exchanger networks need to be build up in excel with the help of Pro-pi to obtain the exact heat capacity for each heat exchanger.
6.2.1.1 Heat exchanger networks
The final heat exchanger network with the turbo blowerFigure 6.8.
39
Annual net profit for Sweden and Russia (investing in BDG configuration)
The annual net profit here is negative as the money is invested in a cheaper configuration and the energy consumption is bigger. In Sweden the money loss is much larger than in Russia. So the BDG configuration is more suitable to applied in
Results of heat recovery in drying section
Heat recovery system in Luleå
The GCCs in Chapter 5 show that the excess heat for a standard DCT 200 tissue machine could be used to produce plenty of active steam and district heating hot water while the fresh air could be preheated and enough process water could be proHowever, the final heat exchanger networks need to be build up in excel with the help
to obtain the exact heat capacity for each heat exchanger.
Heat exchanger networks
heat exchanger network with the turbo blower in Luleå is demonstrated in
Annual net profit for Sweden and Russia (investing in BDG configuration)
invested in a cheaper In Sweden the money loss is
much larger than in Russia. So the BDG configuration is more suitable to applied in
The GCCs in Chapter 5 show that the excess heat for a standard DCT 200 tissue machine could be used to produce plenty of active steam and district heating hot water while the fresh air could be preheated and enough process water could be produced. However, the final heat exchanger networks need to be build up in excel with the help
demonstrated in
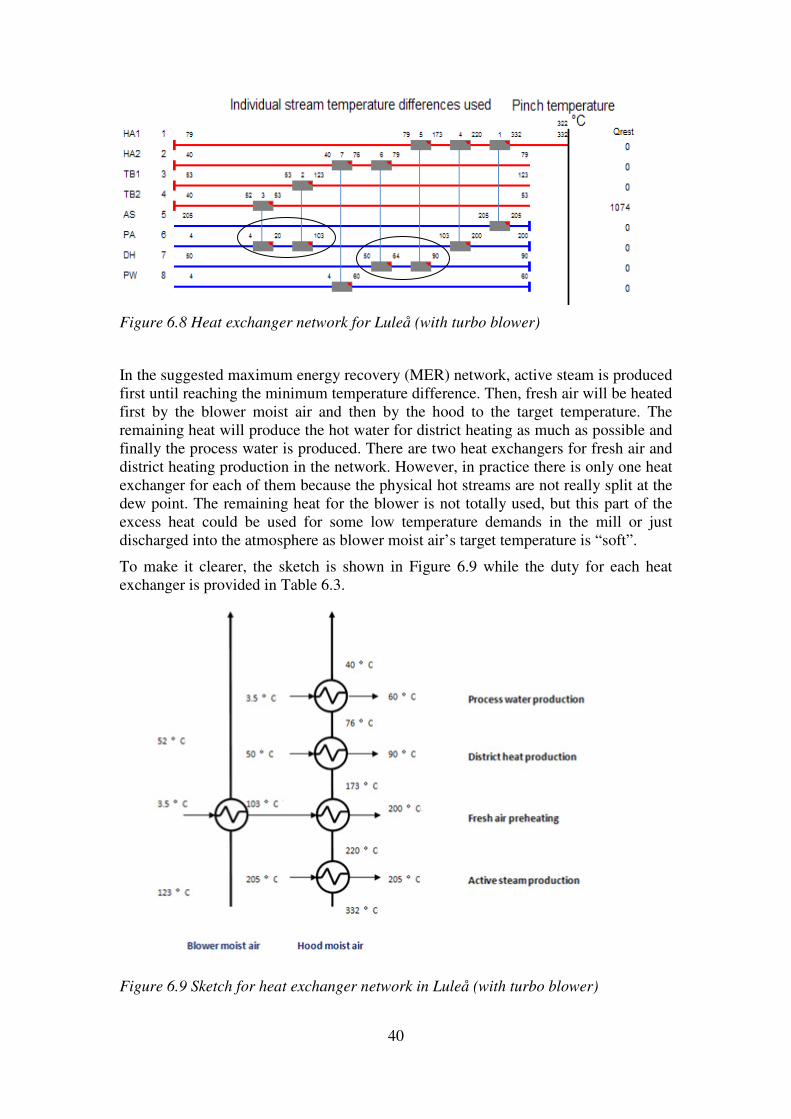
40
Figure 6.8 Heat exchanger network for Luleå (with turbo blower)
In the suggested maximum energy recovery (MER) network, active steam is produced first until reaching the minimum temperature difference. Then, fresh air will be heated first by the blower moist air and then by the hood to the target temperature. The remaining heat will produce the hot water for district heating as much as possible and finally the process water is produced. There are two heat exchangers for fresh air and district heating production in the network. However, in practice there is only one heat exchanger for each of them because the physical hot streams are not really split at the dew point. The remaining heat for the blower is not totally used, but this part of the excess heat could be used for some low temperature demands in the mill or just discharged into the atmosphere as blower moist air’s target temperature is “soft”.
To make it clearer, the sketch is shown in Figure 6.9 while the duty for each heat exchanger is provided in Table 6.3.
Figure 6.9 Sketch for heat exchanger network in Luleå (with turbo blower)

41
Table 6.3 Duty of heat exchangers in Luleå (with turbo blower)
Heat exchanger Heat content (kW)
Active steam production 1873
Fresh air preheating in blower 805
Fresh air preheating in hood 784
District heat production 2417
Process water production 9445
From the duties of the stream generator and heat exchanger for district heat production it could be seen that the suggested network is very close to the theoretical network suggested by the GCCs shown in Section 5.3.2.
If the turbo moist air is not used as a hot stream, the integration process would be similar and the final network and duty of heat exchangers are shown in Figure 6.10 and Table 6.4 respectively.
Figure 6.10 Sketch for heat exchanger network in Luleå (without turbo blower)
Table 6.4 Duty of heat exchangers in Luleå (without turbo blower)
Heat exchanger Heat content (kW)
Active steam production 1873
Fresh air preheating 1589
District heat production 1183
Process water production 9874
If the hot moist air from the turbo blower is not included, the fresh air will be preheated directly by the hood air after the steam production. The district heating

42
production is reduced significantly. So it could be concluded that it is beneficial to recover heat for the turbo blower if it is available in the mill.
6.2.1.2 Economic results
In Section 2.2.1 the evaluation of the total investment cost for a heat exchanger is introduced. By using Equation 2.1 to 2.4, the investment cost for the steam generator and district-heating heat exchanger in the network with the turbo blower are shown in Table 6.5.
Table 6.5 Total investment cost for heat exchangers in Luleå (With the blower)
Name Duty (kW) Size (m2) Total investment cost (k€)
Active steam generator 1873 357 220
District-heating heat exchanger 2417 905 540
The annual revenues for steam and district heating production are discussed in Section 5.4.1 so the final economic results in Luleå with the blower are shown in Table 6.6.
Table 6.6 Economic results in Luleå (with turbo blower)
Name Total investment cost
(k€) Payback time
(years) Annual net profit
(k€)
Active steam generator 220 0.25 863
District-heating heat exchanger 540 0.83 596
It seems that for both the steam generator and the district-heating heat exchanger the economic results are very good in Luleå. The payback time is short especially for the steam generator and the annual net profit is very attractive.
For the network without the hot stream from the turbo blower, the production of district heating is decreased significantly. And the Economic results are shown in Table 6.7
Table 6.7 Economic results in Luleå (without turbo blower)
Name Total investment cost
(k€) Payback time
(years) Annual net profit
(k€)
Active steam generator 220 0.25 870
District-heating heat exchanger 378 1.19 280
The economic result shows that when no heat recovery is carried out for the turbo blower, the steam production would not be influenced. The investment cost of district-heating heat exchanger would be smaller but at the same time the payback time will be relatively longer and the annual net profit is almost halved. Thus from an economic point of view the turbo blower should be considered in the heat recovery system.

43
6.2.2 Heat recovery system in Lagos
The structure of heat recovery system in Lagos is similar to that in Luleå. However, the economic results could be quite different as the local situation is so different.
6.2.2.1 Heat exchanger networks
The sketch of the final heat exchanger network in Lagos in shown in Figure 6.11 and the according duties of the heat exchangers are shown in Table 6.8.
Figure 6.11 Sketch for heat exchanger network in Lagos
Table 6.8 Duties of heat exchangers in Lagos
Heat exchanger Heat content (kW)
Active steam production 1873
Fresh air preheating in blower 608
Fresh air preheating in hood 832
Hot water for cooling 1254
Process water production 7964
From Table 6.8 it is seen that the production capacity for hot water is 1254 kW. With the COP of the adsorption chiller, the cooling capacity could be obtained. A typical value for the COP of today’s adsorption chillers is about 0.7, which means the cooling that could be delivered to the mill from a standard machine is 878 kW. This would be meaningful for the tissue mill and surrounding residential area.
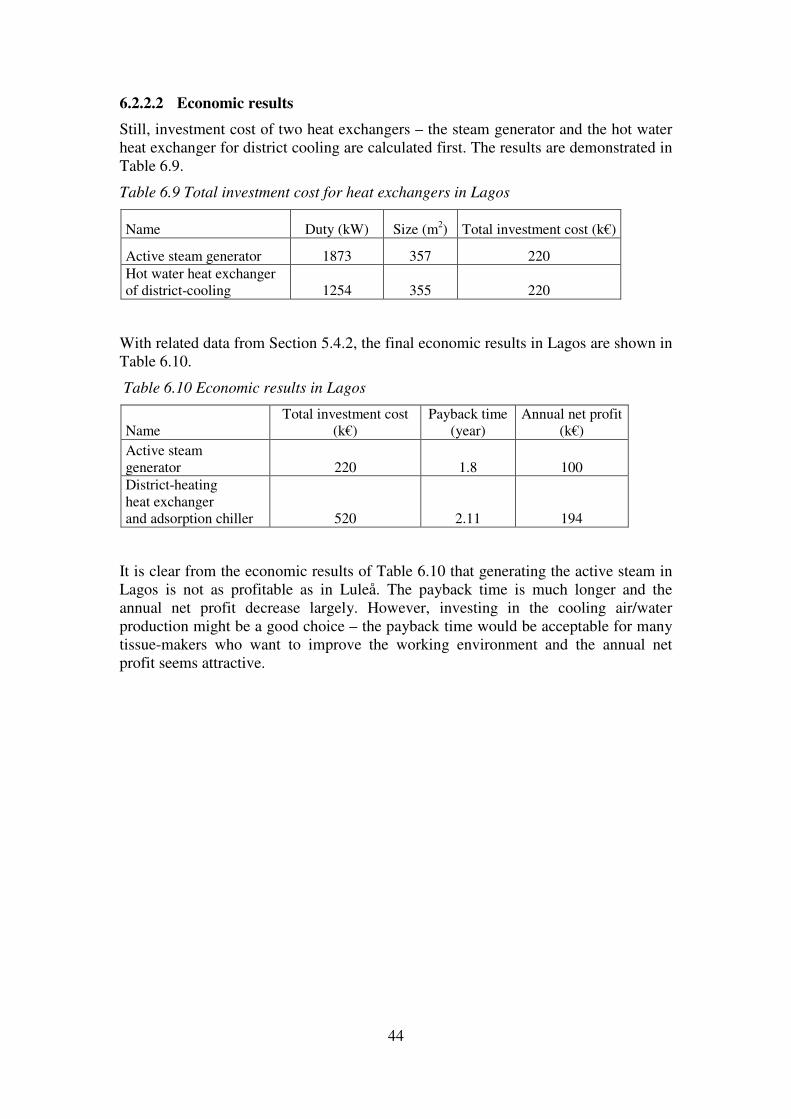
44
6.2.2.2 Economic results
Still, investment cost of two heat exchangers – the steam generator and the hot water heat exchanger for district cooling are calculated first. The results are demonstrated in Table 6.9.
Table 6.9 Total investment cost for heat exchangers in Lagos
Name Duty (kW) Size (m2) Total investment cost (k€)
Active steam generator 1873 357 220
Hot water heat exchanger of district-cooling 1254 355 220
With related data from Section 5.4.2, the final economic results in Lagos are shown in Table 6.10.
Table 6.10 Economic results in Lagos
Name Total investment cost
(k€) Payback time
(year) Annual net profit
(k€)
Active steam generator 220 1.8 100
District-heating heat exchanger and adsorption chiller 520 2.11 194
It is clear from the economic results of Table 6.10 that generating the active steam in Lagos is not as profitable as in Luleå. The payback time is much longer and the annual net profit decrease largely. However, investing in the cooling air/water production might be a good choice – the payback time would be acceptable for many tissue-makers who want to improve the working environment and the annual net profit seems attractive.

45
7 Conclusions Many conclusions could be drawn from the model. The BAT configuration could decrease the total energy consumption significantly which means new developed technologies bring large energy savings. Energy consumption will decrease when the basis weight of tissue increase. The interactions among components are very important e.g. the improved headbox will reduce the power production of the turbine. Besides, good suggestion could be provided to the tissue makers e.g. it makes less sense to install new technologies related to electricity saving for tissue machines producing high basis weigh tissue. For different local fuel prices, a location with high energy price is more suitable for the BAT configuration while a location with low energy price is more suitable for the BDG configuration.
From the results of the heat recovery part, it could be concluded that moist air from turbo blower should be taken into consideration if it is available. In Luleå, heat exchanger should be installed to produce the district heating while in Lagos heat exchanger combined with an adsorption chiller could be used to produce the cold water for district cooling. In addition, invest money in district heating in Luleå is more profitable compared to invest money in district cooling in Lagos. Finally it is found that in Lagos the suggested network is not good enough from the economic point of view. The potential solution might be removing the steam generator and use more heat to produce the cooling water.

46

47
8 Future work The quality of the outcomes is mainly determined by the input data so more accurate input data are needed to get reliable results. Besides, more serious economic evaluation should be carried out if the project is going to be applied in industry, e.g. the electricity consumption in the adsorption chiller should be considered to get more practical results. The assumptions used in the calculation of different components need to be checked carefully to increase the reliability of the model.
In addition, the model developed in this thesis work would be used in a new project that is called Energy Efficiency Labeling System in Mesto Paper Karlstad and a ranking system would be developed as the model could give the energy consumptions at different configurations.

48

49
9 References Allafrica. (2012). Retrieved June 2012, from http://allafrica.com/stories/201202130811.html
Climatetemp. (2012). Retrieved June 2012, from http://www.climatetemp.info/nigeria/
Elfgren, M., Grip, C., Wang, C., Karlsson, J. (2010). Possibility to Combine Exergy
with other Process. p. 1376.
Emissionless. (2006). Hot water powered adsorption chillers. Emissionless Pty.Ltd.
Energyc2. (2012). Retrieved June 2012, from http://www.energyc2.com
Gavelin, G. (1999). Tissue Paper. Karlstad: Valmet-Karlstad AB.
Harvey, S. (2010). Industrial Energy Systems. Gothenburg: Chalmers University of Technology.
Humcal. (2012). Retrieved June 2012, from http://www.humidity-calculator.com/index.php
Kadant . (2009). Thermocompressors – Engineered for efficiency . Kadant Jonhson Inc.
Metso Paper. (2012). AdvantageTM
ViscoNip. Karlstad: Metro Paper Inc.
Metso Paper . (2010). Energy saving platform. Karlstad: Metro Paper Inc.
Metso Paper Karlstad AB.(2008). Complete tissue technology program –
AdvantageTM
DCTTM
. Karlstad: Metro Paper Inc.
Michael, J. (2009) . Nigeria Natural Gas: A Transition from Waste to Resource. Retrieved June 2012, from http://www.worldenergysource.com/articles/text/economides_WE_v7n1.cfm
Nordic energy perspectives. (2009). The Future of Nordic District Heating. Nordic energy perspectives.
Rogers, J., McPherson, C. (2009). Biogas Alternatives Identification Technical.
Retrieved June 2012, from http://www.oregon.gov/energy/renew/docs/creff/klamathfallsbiogas.pdf?ga=t
Sinnot, R., Towler, G. (2009). Chemical engineering design. Elsevier Ltd.
Solair. (2009). Adsorption chillers. Retrieved June 2012, from http://www.solair-project.eu/142.0.html
Tutiempo. (2012). Retrieved June 2012, from http://www.tutiempo.net/en/Climate/Lulea_Kallax/21860.htm
Wiklund, M. (2010). Save your energy – proven concepts create lasting results. Results Pulp & Paper, 40 pp.

50

51
10 Appendix Appendix A - Energy savings for different components
Appendix B - Surrounding equipment of the tissue machine
Appendix C - Calculation of the heat content of the hood air
Appendix D - Waste-heat chillers

52

53
Appendix A – Energy savings for different components
In Appendix A the specific data and calculation for important components will be demonstrated.
Press section
The input data for the calculation of the press is shown is Table A.1.
Table A.1 Basic input data for press calculation
Dryness on reel 95%
Temperature of water entering the drying section (°C) 50
Saturated temperature for water in hood (°C) 100
Specific heat capacity of water (kJ/(kg*k)) 4,18
Evaporated Enthalpy of water in hood (kJ/kg) 2257,4
Total enthalpy to evaporate water in hood (kJ/kg) 2466,4
Total enthalpy to evaporate water in hood (kWh/ton water) 685,1
Efficiency of drying 65%
Dryness increase with ViscoNIP 5%
Dryness decrease with Single press (BDG) 1%
Water entering the drying section experiences two processes – becoming saturated and evaporating into vapour. The entering temperature is close to the temperature of the white water and the saturated temperature is 100 °C as the pressure in the hood is close to the atmosphere pressure to keep the air balance. The drying efficiency is defined as the ratio of energy used for drying and the total thermal energy input in drying section.
In this project the after-press dryness for STD configuration at every basis weight is available and comparing to that a 5% dryness increase is assumed for the ViscoNIP press while a 1% dryness decrease is assumed for a press used in BDG configuration. So the final dryness table is available in Table A.2.
Table A.2 Dryness after press for three different presses
Basis weight at reel (g/m2) 13 16 18 22 37
Single press dryness in BDG 37% 38% 39% 40% 41%
Single press dryness in STD 38% 39% 40% 41% 42%
ViscoNIP press dryness in BAT 43% 44% 45% 46% 47%
The relative thermal energy consumption due to press in BAT and BDG configurations are determined by the difference in dryness comparing to the STD machine since the dryness difference can determine the difference in amount of evaporated water and the relative thermal energy consumption.
A mass balance (Equation A1) is used to calculate the amount of water that could be avoided to be evaporated in hood when substituting a STD press with a ViscoNIP. The equation for using a BDG press is similar.
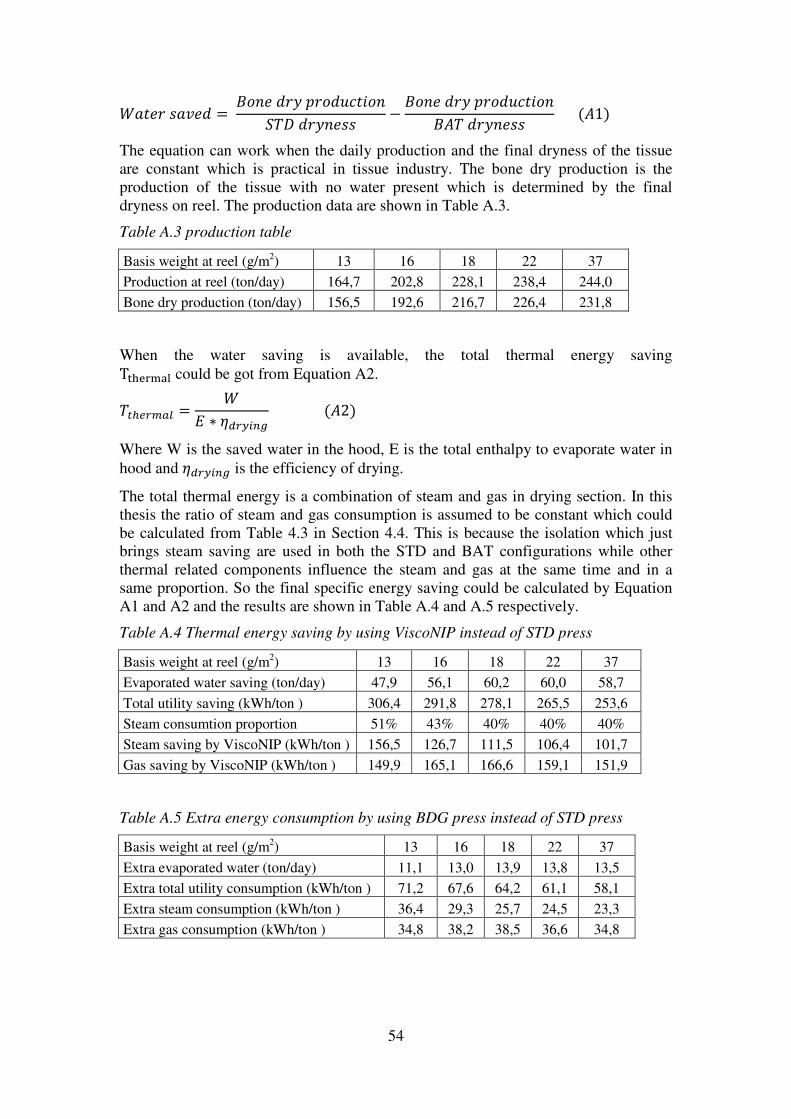
54
IJKL� MJNLO ) PQRL O�S T�QOUVKWQR
X�Y O�SRLMMZPQRL O�S T�QOUVKWQR
P�� O�SRLMM E�1G
The equation can work when the daily production and the final dryness of the tissue are constant which is practical in tissue industry. The bone dry production is the production of the tissue with no water present which is determined by the final dryness on reel. The production data are shown in Table A.3.
Table A.3 production table
Basis weight at reel (g/m2) 13 16 18 22 37
Production at reel (ton/day) 164,7 202,8 228,1 238,4 244,0
Bone dry production (ton/day) 156,5 192,6 216,7 226,4 231,8
When the water saving is available, the total thermal energy saving T� !"#$% could be got from Equation A2.
��[����� )I
\ . � ����� E�2G
Where W is the saved water in the hood, E is the total enthalpy to evaporate water in
hood and � ����� is the efficiency of drying.
The total thermal energy is a combination of steam and gas in drying section. In this thesis the ratio of steam and gas consumption is assumed to be constant which could be calculated from Table 4.3 in Section 4.4. This is because the isolation which just brings steam saving are used in both the STD and BAT configurations while other thermal related components influence the steam and gas at the same time and in a same proportion. So the final specific energy saving could be calculated by Equation A1 and A2 and the results are shown in Table A.4 and A.5 respectively.
Table A.4 Thermal energy saving by using ViscoNIP instead of STD press
Basis weight at reel (g/m2) 13 16 18 22 37
Evaporated water saving (ton/day) 47,9 56,1 60,2 60,0 58,7
Total utility saving (kWh/ton ) 306,4 291,8 278,1 265,5 253,6
Steam consumtion proportion 51% 43% 40% 40% 40%
Steam saving by ViscoNIP (kWh/ton ) 156,5 126,7 111,5 106,4 101,7
Gas saving by ViscoNIP (kWh/ton ) 149,9 165,1 166,6 159,1 151,9
Table A.5 Extra energy consumption by using BDG press instead of STD press
Basis weight at reel (g/m2) 13 16 18 22 37
Extra evaporated water (ton/day) 11,1 13,0 13,9 13,8 13,5
Extra total utility consumption (kWh/ton ) 71,2 67,6 64,2 61,1 58,1
Extra steam consumption (kWh/ton ) 36,4 29,3 25,7 24,5 23,3
Extra gas consumption (kWh/ton ) 34,8 38,2 38,5 36,6 34,8

55
Yankee head isolation
It needs to be noticed that in the scope list table the STD configuration has included the Yankee head isolation. As described before, the isolation is installed to prevent the condensation of the steam on the heads of the cylinder. As a result, other components which decrease the steam consumption will bring a negative effect to the effect of the isolation as discussed in Section 4.3. This means the isolation will save more steam when installed in a STD machine compared to a BAT machine. In the project a steam saving of 8% is assumed when the isolation is installed and the results are shown in Table A.6.
Table A.6 Relative steam consumption by Yankee head isolation
Basis weight at reel (g/m2) 13 16 18 22 37
Steam consumption for STD (kWh/ton) 800,0 685,0 609,0 582,0 569,0
Steam saved by other components before isolation (kWh/ton) 192,7 158,1 139,6 133,2 128,1
BAT steam consumption before isolation (kWh/ton) 676,9 586,4 522,4 499,4 490,4
Steam saved for STD (kWh/ton) 69,6 59,6 53,0 50,6 49,5
Steam saved for BAT (kWh/ton) 54,2 46,9 41,8 40,0 39,2
Extra steam consumption in BAT (kWh/ton) 15,4 12,6 11,2 10,7 10,2
Extra steam consumption in BDG (kWh/ton) 69,6 59,6 53,0 50,6 49,5
The headbox
It is discussed in Section 4.1.3 that the lip opening of the headbox becomes smaller when higher turbulence is achieved inside and the power used in the pump could be saved. There are three lip openings according to three different configurations which are illustrated in Table A.7.
Table A.7 Lip opening of the headbox
BDG STD BAT
Lip opening (mm) 12 11 9
To get the power consumption in the pump, Equation 4.1 and 4.2 are used and the basic input data are shown in Table A.8.
Table A.8 Basic data to calculate the pump power
Density of stock (kg/m3) 1000
Gravitational acceleration (m/s2) 9,8
Head box outlet width (m) 5,5
Pump efficiency 85%
Height of Headbox (m) 3
Total pressure loss expressed in length (m) 20
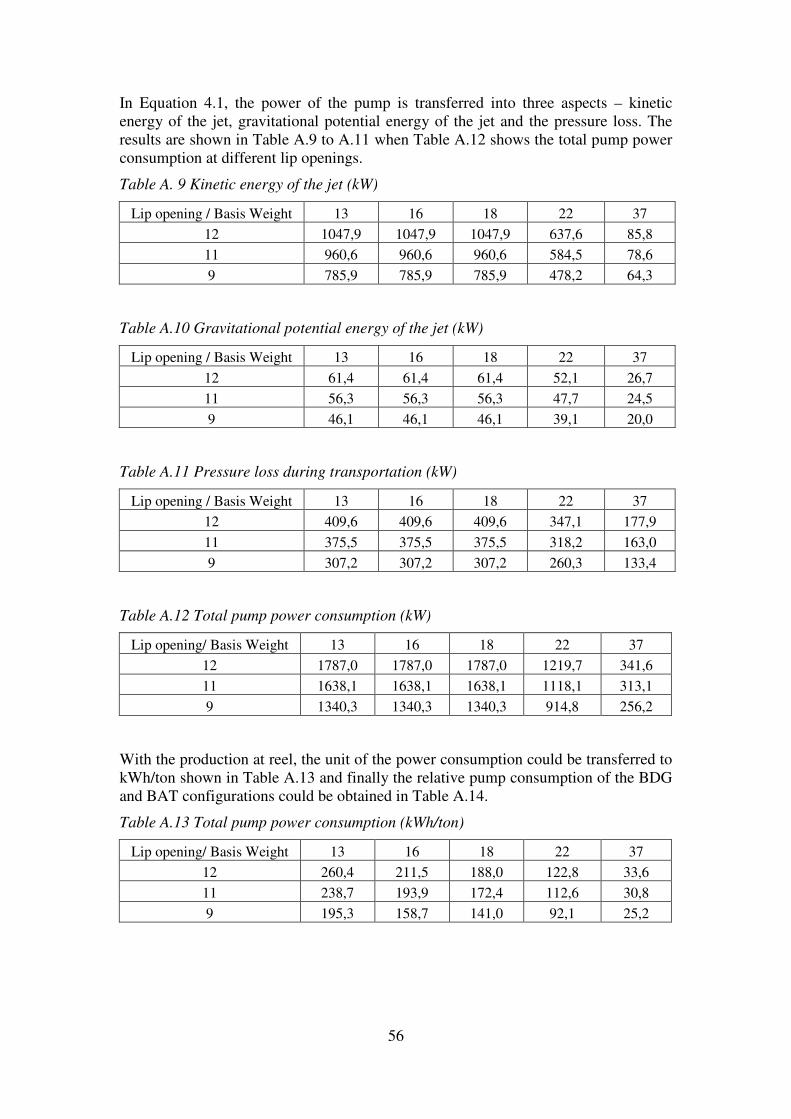
56
In Equation 4.1, the power of the pump is transferred into three aspects – kinetic energy of the jet, gravitational potential energy of the jet and the pressure loss. The results are shown in Table A.9 to A.11 when Table A.12 shows the total pump power consumption at different lip openings.
Table A. 9 Kinetic energy of the jet (kW)
Lip opening / Basis Weight 13 16 18 22 37
12 1047,9 1047,9 1047,9 637,6 85,8
11 960,6 960,6 960,6 584,5 78,6
9 785,9 785,9 785,9 478,2 64,3
Table A.10 Gravitational potential energy of the jet (kW)
Lip opening / Basis Weight 13 16 18 22 37
12 61,4 61,4 61,4 52,1 26,7
11 56,3 56,3 56,3 47,7 24,5
9 46,1 46,1 46,1 39,1 20,0
Table A.11 Pressure loss during transportation (kW)
Lip opening / Basis Weight 13 16 18 22 37
12 409,6 409,6 409,6 347,1 177,9
11 375,5 375,5 375,5 318,2 163,0
9 307,2 307,2 307,2 260,3 133,4
Table A.12 Total pump power consumption (kW)
Lip opening/ Basis Weight 13 16 18 22 37
12 1787,0 1787,0 1787,0 1219,7 341,6
11 1638,1 1638,1 1638,1 1118,1 313,1
9 1340,3 1340,3 1340,3 914,8 256,2
With the production at reel, the unit of the power consumption could be transferred to kWh/ton shown in Table A.13 and finally the relative pump consumption of the BDG and BAT configurations could be obtained in Table A.14.
Table A.13 Total pump power consumption (kWh/ton)
Lip opening/ Basis Weight 13 16 18 22 37
12 260,4 211,5 188,0 122,8 33,6
11 238,7 193,9 172,4 112,6 30,8
9 195,3 158,7 141,0 92,1 25,2

Table A.14 Relative pump consumption for BDG and BAT
Basis weight
Total extra consumption for BDG (kWh/ton)
Total power saving for BAT (kWh/ton)
For the total energy saving in BAT or extra energy consumption in BDGpump consumption will decrease when the basis weight increases.adjustment in the headbox is more profitable to low basis weight tissue to high basis weight machines.
The turbine
Only in the BAT configuration the turbine is used and it will recover part of the kinetic energy from the jet. In this project 50% of the kinetic energy is assumed to be transferred into electricity in the turbine. The basic data for the turbine are shown Table A.15 and the power production is shown in Table A.16 and Figure A.1.
Table A.15 Basic data for the turbine
Jet power recovery
Density of stock (kg/m3)
Head box outlet width (m)
Lip opening (mm)
Table A.16 Electricity produced from
Basis weight
Electricity production by turbine
Figure A.1 Electricity produced from the turbine
57
Relative pump consumption for BDG and BAT
Basis weight 13 16 18 22
Total extra consumption for BDG (kWh/ton) 21,7 17,6 15,7 10,2
aving for BAT (kWh/ton) 43,4 35,3 31,3 20,5
energy saving in BAT or extra energy consumption in BDGwill decrease when the basis weight increases. This means the
adjustment in the headbox is more profitable to low basis weight tissue to high basis weight machines.
Only in the BAT configuration the turbine is used and it will recover part of the kinetic energy from the jet. In this project 50% of the kinetic energy is assumed to be transferred into electricity in the turbine. The basic data for the turbine are shown
5 and the power production is shown in Table A.16 and Figure A.1.
Basic data for the turbine
50%
1000,0
5,5
9
produced from the turbine (kWh/ton)
13 16 18 22 37
Electricity production by turbine 57,2 46,5 41,3 24,1 3,2
Electricity produced from the turbine
37
10,2 2,8
20,5 5,6
energy saving in BAT or extra energy consumption in BDG, the relative This means the
adjustment in the headbox is more profitable to low basis weight tissue machines than
Only in the BAT configuration the turbine is used and it will recover part of the kinetic energy from the jet. In this project 50% of the kinetic energy is assumed to be transferred into electricity in the turbine. The basic data for the turbine are shown in
5 and the power production is shown in Table A.16 and Figure A.1.

58
Similar to the headbox, when the basis weight increases the electricity production of the turbine will decrease. Especially for the basis weight of 37 g/m2, installing a turbine is not profitable.
The other components are relatively simple and the calculation process will not be discussed in detail in this section.
59
Appendix B – Surrounding equipment of the tissue machine
A good understanding of the surrounding equipment is meaningful for the heat recovery of the waste heat as potential process streams might be closely related.
Turbo blower
The turbo blower is a new-developed surrounding component in paper industry used to replace the previous-used vacuum pumps. Vacuum is required at some parts of the machine, e.g. in the suction press roll to dewater the paper web and in the felt suctions to blow the fibres outside of the felt.
The electrical motor is the core component of the turbo blower where electricity drives the motor to continuously remove the gas from the vacuum chamber to the atmosphere. During the rotation of the motor, air is drawn from the inlet side and discharged out from the outlet side at a higher temperature and pressure (From pressure close to vacuum to atmosphere pressure).
There are mainly two benefits to use the turbo blower to replace the vacuum pumps. The first one is that the blower offers a significant power saving because there is no need to provide a constant power supply any more to maintain a constant vacuum environment. The other benefit is that by using the turbo blower, the outlet air is at a much higher temperature so that heat recovery becomes easier and practical. This is because for a traditional vacuum pump, temperature of the outlet flow is typically at about 40 °C while for a turbo blower the exhaust temperature is at around 110 to 130 °C. In Chapter 5, the exhaust air from the blower is used as one of the hot streams. The energy efficiency is significantly increased by recovering the high-temperature waste heat from it.
It might be interesting to know that from the function point of view, the turbo blower is a vacuum-maker, so it is also called vacuum blower. However, it could work like a heat pump when low temperature and pressure moist air is compressed to high temperature and pressure and the blower transfers heat to a high temperature “heat sink” in the process.
Thermocompressor
In pulp and paper industry thermocompressors are widely used to boost the low pressure steam from the cylinder. In a thermocompressor high-pressure active steam is introduced in a converging nozzle to convert pressure energy to kinetic energy according to Bernoulli equation for steam shown in Equation B1.
)1(2
2
BCV
P =+ρ
Where P is the pressure, ρ is the density, V is the velocity and C is a constant.
The suction steam is entrained and mixed with the active steam so that the mixed steam is accelerated to high velocity with a uniform profile in the mixing chamber. Then the mixed flow enters into the diffuser section whose area expands gradually and the velocity of the mixing flow would decrease while the pressure will increase

60
according to Equation B1 again. Finally the steam is discharged to the process at an intermediate pressure. The structure of the thermocompressor is shown in Figure B.1
Figure B.1 Structure of a thermocompressor (Kadant, 2009)
For a standard tissue machine, a typical pressure level of the steam used in the cylinder is 8 bar(g), which is 9 bar in absolute pressure. After condensation and delivering the latent heat to the paper sheet, the condensate needs to be discharged from the cylinder in time to allow the machine to work continuously. The condensate is discharged by a pressure difference of the condensate between the inlet and outlet of the header which is about 1.3 bar typically. However, the condensate from the cylinder is not a pure liquid flow since it is mixed with the blowing-out steam. A vessel is used to separate the blowing steam and condensate so that the lower-pressure steam could be recovered by a thermocompressor. The active steam is 16 bar(g) which is produced from e.g. a boiler within the mill. The sketch map is shown in Figure B.2 to explain how a thermocomressor is combined with a standard tissue machine to recover the pressure-decreased steam.
In fact, the so-called thermocomressor is a type of heat pump which is called thermal vapour recompression (TVR) that is driven by heat, not mechanical energy. The coefficient of performance (COP) is defined as the relation between the condensation heat of the steam leaving the TVR and heat input with the motive vapour. (Harvey, 2010)

61
Figure B.2 The steam recovery system by a thermocompressor

62

63
Appendix C - Calculation of the heat content of the hood air
For heat content of the hood air above the dew point, Equation C1 could be used as shown below.
'�]9 ) ^��� . 0 ��� . E������ Z � ��G 7 ^��� . &����� . 0 ��=� . E������ Z � ��G (C1)
In Equation C1 ^��� is the flow rate of the dry air and is always constant during the whole process, &����� is the original moisture content which will not change until the dew point. ������ and � �� mean start temperature and dew point respectively.
When the temperature is lower than the dew point, condensation starts and heat content is expressed in Equation C2.
'�]2 ) ^��� . 0 ��� . A� �� Z ������D 7 ∆��� . ^��� . E&�����Z &�����G (C2)
∆��� is the latent heat of the vapor and &����� is the final moisture content of the stream. It
could be seen from Table 5.3 in Chapter 5 that &����� is very small so the uncondensed vapor
is ignored in Equation C2.

64
65
Appendix D – Waste-heat chillers
One task of this project is to investigate ways to use the waste heat of the moist air from the wet end of the Yankee hood and turbo blower efficiently. In a physical location where district heating is in need this might not be a problem because using the waste heat to produce district heating water is a tradition in European countries. However, in other locations in the world, air conditioning is an eager demand e.g. in Africa where the temperature is high all year round.
Traditional air conditioners are driven by electricity, but the price for electricity is relatively high in those regions and the primary energy to generate electricity is generally not very sustainable. Oil and gas are in large storage in some countries in Africa so the electricity is also not environmentally friendly there.
To solve these problems, some technologies could be investigated to transfer the waste heat into cooling with the intention that cheap cooling air or water could be available for industries and establishments close to the tissue machines. Inherently, this is beneficial both from economic and environment point of view. To fulfill this demand, the absorption chillers and adsorption chillers are chosen and described in detail below.
Absorption chillers
An absorption chiller is a chiller that uses a heat source e.g. solar energy, gas, waste heat from industrial process etc to drive a cooling system. Absorption chillers are very attractive to be used to substitute the mechanical air conditioners if waste heat is available. Its core principle is the difference of boiling point between pure water and some solutions e.g. lithium bromide (LiBr) solution. Nowadays the most typical commercial working fluid is combined by lithium bromide and water where the lithium bromide is the absorbent and water is the refrigerant. Another couple is water and ammonia that is always used in small scale chillers but water here is the absorbent while ammonia is used as the refrigerant.
Figure D.1 demonstrates the structure of a classic absorption chiller which is mainly combined by four components – evaporator, absorber, generator and condenser all of which in fact are high efficient heat exchangers.

66
Figure D.1 Structure of a single effect absorption chiller (Energyc2, 2012)
The pressure in evaporator is almost vacuum so that the boiling point of the entering pure water is very low e.g. 5 °C. The chilled water entering evaporator is a hot stream that would provide the heat to the pure water and the heat of the chilled water is taken away due to strong evaporation with the intention that cold water is produced. The usual inlet temperature of the chilled water is at about 12 °C while the outlet temperature is at around 7 °C.
The low-pressure pure water evaporates into low pressure vapour and goes into the absorber chamber where the vapour is absorbed by concentrated lithium bromide solution that has a high affinity to water. The pressure in this chamber is almost the same as in the evaporator (In fact it should be slightly lower to provide a driving force for the moving of the vapour) and the process of absorption could maintain a low pressure environment although extra equipments such as a vacuum pump should also be applied. It is good to know that if the turbo blower (described in Appendix B) is available for a tissue machine it could be utilized to replace the vacuum pump used in evaporator and absorber chambers. Besides, it is also good for the heat recovery from the blower since the blower capacity might be enlarged.
By means of absorbing low pressure vapour constantly, the concentrated solution is diluted and pumped to the generator where external heat is used to desorb the solution. In this compartment steam or hot water is used to regenerate the vapour under the situation that boiling point of the solution has been lifted significantly compared to the pure water in the evaporator. Based on the lifting of the boiling point, the vapour with higher pressure and temperature is produced from the solution and enters into the condenser while the solution in the generator becomes concentrated and returns to the absorber. Between the concentrated and diluted solutions a heat exchanger could be built up to enable internal heat exchange and give higher heat efficiency.
67
In the condenser the high pressure and temperature vapour is condensed by the external cooling water and then the condensate goes through a throttling valve to reduce the pressure and finally returns to the evaporator so that a whole circle is finished. From the whole structure, low pressure and temperature vapour from the evaporator becomes high pressure and temperature vapour after going through the absorber and generator therefore together their function is the same as the electrical mechanical compressor used in a traditional air conditioner.
Actually, the absorption chillers are the first type of absorption heat pump. External heat is input in the generator as the high temperature driving force to take away the low temperature heat in the chilled water in the evaporator and plenty of medium-temperature heat is produced in absorber and condenser. To make sure that the chillers work efficiently, heat produced in the absorber and condenser needs to be taken away by cooling water.
Adsorption chillers
Absorption chillers have been widely used for many years in industry to recover the low grade waste heat. However, because of using of lithium bromide as the absorbent their maintenance cost could be very high which makes them not very attractive economically. The appearance of adsorption chillers solved this problem to some extent due to the simplicity in structure and operation.
Unlike absorption chillers, solid water-affinity materials are used in adsorption chillers so less electricity is consumed in the chillers and the maintenance becomes easier and cheaper. The most general working group for an adsorption chiller today is water and silica gel where water is the refrigerant and silica gel works as the sorbent.
As shown in Figure D.2 the structure of an adsorption chiller is much simpler than the absorption chiller. Similar to an absorption chiller, it also includes a condenser and an evaporator while it has two extra chambers - adsorption chamber and desorption chamber to replace the absorber and generator.
The principle of an adsorption chiller is more or less close to an adsorption chiller. The pressure in the evaporator is also almost vacuum so that the boiling point of water fluid in this chamber is so low that chilled water could be induced as the low temperature hot stream. The water inside evaporator chamber evaporates and enters the adsorption chamber where silica gel is available and adsorbs the vapor. The adsorption process could maintain a low pressure circumstance for the evaporator and adsorption chambers. Heat is produced during the process of adsorption which should be taken away by cooling water to keep a relatively constant temperature for a high efficient adsorption. Simultaneously, hot water is used in the desorption chamber to desorb the vapor from the silica gel. The produced vapor enters into the condenser where cooling water is used to condense the vapor. Finally the condensate goes through a throttling valve to reduce the pressure and returns to the evaporator. When the sorption material in the adsorption chamber becomes saturated with water to a certain degree, the adsorption and desorption chambers will be switched. (Solair, 2009)

68
Figure D.2 Structure of a simple adsorption chiller (Solair, 2009)
The adsorption chillers generally are just driven by hot water whose inlet temperature could ranges from 90 to 50 °C whilst the outlet temperature of chilled water ranges from 3 to 9 °C. (Emissionless, 2006)
An important concept for a waste-heat chiller (both for absorption and adsorption chillers) is the coefficient of performance (COP) which is defined as the ratio of produced cooling effect (kW) in evaporator to input heat (kW) in generator as shown in Equation D1.
0_� ) <==���� ������� E`aG
���� ��b� E`aG (D1)
Similarly the expression of COP for a traditional air-conditioner is shown in Equation D2.
0_� ) <==���� ������� E`aG
c��F���F��� ��b� E`aG (D2)
In an industrial process hot water might be produced and used as the driving heat for a waste-heat chiller. By doing that, electricity could be saved and Equation D3 is introduced to explain how to get the annual electricity saving.
�RRUJd LdLVK�WVWKS MJNWRe )
�=� ����� �= bF��=� E`aG.<fghijklmnlik onp,,lq.r�F[��� �b����� ���� E[G
<fgspq otuvpkptulq (D3)
The COP for an adsorption chiller is as high as 0.75 nowadays which makes it very attractive to make the cooling water or air.
Comparison of absorption and adsorption chillers
There are significant improvements for adsorption chillers compared to absorption chillers from economic, environment and safety point of view.

69
The adsorption chillers could be driven by a wider hot water temperature range e.g. 90 to 50 °C as mentioned before. This is because cooling capacity of an adsorption chiller is not as sensible as an absorption chiller when the temperature of hot water fluctuates which is shown clearly in Figure D.3. It is apparent that when the hot water temperature decreases, the cooling capacity decreases significantly for an absorption chiller.
Figure D.3 Capacity of chillers with inlet hot water temperature (Emissionless,
2006)
The simple structure and operation makes the maintenance cost for an adsorption chiller exceptionally low since only basic and infrequent maintenance is in need. Besides, no corrosive solution inside the equipment enables it to enjoy a longer annul operation time e.g. more than 8000 hours. The electricity consumption is also quite low since there are no internal solution pumps. The permanent silica gel could last for more than 30 years before losing function. Also, fluctuations of temperature of cooling water has a smaller influence to the capacity of an adsorption chiller as there is risk of crystallization for an absorption chiller when the cooling water temperature is too low. (Emissionless, 2006) Compared to an absorption chiller, the pay-back period of an adsorption chiller is greatly shorter since their purchase prices are similar.
For environment aspect, the only liquid used inside an adsorption chiller is water, so it is attractive to be a sustainable chiller when LiBr in absorption chillers is hard to disposal in natural world and unfriendly to surrounding environment. Besides, with less moving parts, a quieter working environment could be expected for an adsorption chiller.

70

ro
be
rt e
ne
ro
th r
ob
er
t pal
Konsekvensanalys-biobränsle för eldning i en befintlig processugn i ett oljeraffinaderi
2008
chalmers univers ity of technologyse 412 96 Göteborg, SwedenPhone: + 46 - (0)31 772 10 00Web: www.chalmers.se
Konsekvensanalys-biobränsle för eldning ien befintlig processugn i ett oljeraffinaderiExamensarbete inom civilingenjörsprogrammet
robert enerothrobert pal
Institutionen för Energi och miljöAvdelningen för Värmeteknik och Maskinlärachalmers tekniska högskolaGöteborg 2008
Related Documents