Energy requirements from infancy to adulthood3 Al?: i Cli,, Nuir 1995:62(suppl): 1047S-52S. Printed in USA. © 1995 American Society for Clinical Nutrition 10475 Nancy F Butte, Jon K Moon, William W Wong, Judy M Hopkinson, and E 0 ‘Brian Smith ABSTRACT To investigate how age and body composition affect energy requirements, the sedentary daily expenditure (SDE) and basal metabolic rate (BMR) of 101 infants, 82 girls, and 27 adults were measured. Energy expenditure was scaled for differ- ences in body size to test the effects of age and body fatness. A power function was superior to linear models. For all subjects, WTO.o3 (where WT is weight) or FFMo3 (where FFM is fat-free mass) explained 94% of the variability in BMR, and \VT#{176} or FFM#{176}7’ explained 97% of the variability in SDE. The effects of height and fat mass (kg or % body wt) on BMR and SDE scaled for weight or fat-free mass were age dependent. Best-fitted expo- nents rebating BMR or SDE to body size differed between children (0.4()-4).52) and infants (1.04-1.30) (P 0.001). Human energy requirements from infancy to adulthood appear to be a power, not a linear, function of body weight and composition. Am J C/in Nutr I995;62(suppl): 1047S-52S. KEY WORDS Sedentary daily expenditure, basal meta- bolic rate, infants, children, adults, energy requirements INTRODUCTION Because dietary energy is required primarily to replace ex- pended energy, human energy requirements have been esti- mated from measurements of energy expenditure (EE). Only during early infancy does the energy cost of growth represent a sizable portion of the total energy requirement. By 12 mo of age, < 5% of the total energy requirement is partitioned to growth (1). During the adolescent growth spurt, < 5% of the total energy requirement is used for growth. Basal metabolic rates (BMRs) provide the foundation for estimating human energy requirements when allowances are made for physical activity and growth ( 1 , 2). This approach has been advocated for infants and young children; however, energy re- quirements for infants and young children have been based on observed energy intakes because of a lack of knowledge of the incremental increase required above basal expenditure. Although it is reasonable to do so, given the volume of data across sex and age groups (3), estimating energy requirements from BMR requires extrapolation from a brief, standardized measurement to a daily energy requirement. In an alternative approach put forth by Ravussin et al (4) and Webb and Sangal (5), energy requirements are based on measurements of seden- tary daily expenditure (SDE). SDE encompasses components of 24-h energy expenditure that by convention are excluded from BMR, ie, thermic effect of feeding, spontaneous physical activity, and sleeping metabolic rate (SMR). Therefore, SDE should be more representative of an individual’s energy re- quirement than BMR is. Therefore, the purpose of this study was to measure SDE and BMR of infants, children, and adults to investigate how factors of age and body composition modulate energy requirements across the life span. SUBJECTS AND METHODS Subjects A total of 210 healthy subjects participated in the study. These subjects included 101 infants (50 male, 51 female) aged 3-18 mo, 82 girls aged 9-16 y, and 27 adults (6 male, 21 female) aged 20-46 y. Physical characteristics of the subjects are given in Table 1. All adults and parents or guardians of the children and infants gave written informed consent before the start of testing. The study was approved by the Institutional Review Board for Human Research at Baylor College of Medicine. Methods Energy expenditure of the adults and children was measured for 24 h in one of four room respiration calorimeters (two each of 19 m3 and 31 m3) (6). Each chamber has its own micropro- cessor-based gas analyzers for carbon dioxide (Ultramat SE; Siemens, Karbsruhe, Germany) and oxygen (Oxymat SE; Siemens) that enable continuous data collection at 1-mm inter- vals. Thermal-mass controllers (740 and 830; Sierra Instru- ments, Monterey, CA) regulate air flow through the chambers to maintain constant carbon dioxide concentration (0.45%) and gauge pressure (13.3 Pa). Temperature was maintained at 24- 26 #{176}C. Performance tests by infusion of nitrogen and carbon dioxide blends showed that individual measurements can be made with errors of ± 3.0% (95% CI). Energy expenditure was I From the USDA/ARS Children’s Nutrition Research Center, Depart- ment of Pediatrics, Baylor College of Medicine, Houston. 2 This work is a publication of the US Department of Agriculture (USDA)/Agricultural Research Service (ARS) Children’s Nutrition Re- search Center, Department of Pediatrics, Baylor College of Medicine and Texas Children’s Hospital, Houston. This project was funded in part with federal funds from the USDAJARS under Cooperative Agreement 58-6250-1-003. The contents of this publication do not necessarily reflect the views or policies of the USDA, nor does mention of trade names, commercial products, or organizations imply endorsement by the US Government. 3 Address reprint requests to NF Butte, Children’s Nutrition Research Center, 1 1(X) Bates Street, Houston, TX 77030. by guest on July 13, 2011 www.ajcn.org Downloaded from

Welcome message from author
This document is posted to help you gain knowledge. Please leave a comment to let me know what you think about it! Share it to your friends and learn new things together.
Transcript

Energy requirements from infancy to adulthood�3
Al?: i Cli,, Nuir 1995:62(suppl): 1047S-52S. Printed in USA. © 1995 American Society for Clinical Nutrition 10475
Nancy F Butte, Jon K Moon, William W Wong, Judy M Hopkinson, and E 0 ‘Brian Smith
ABSTRACT To investigate how age and body composition
affect energy requirements, the sedentary daily expenditure (SDE)
and basal metabolic rate (BMR) of 101 infants, 82 girls, and 27
adults were measured. Energy expenditure was scaled for differ-
ences in body size to test the effects of age and body fatness. A
power function was superior to linear models. For all subjects,
WTO.o3 (where WT is weight) or FFM�o3 (where FFM is fat-free
mass) explained 94% of the variability in BMR, and \VT��#{176} or
FFM#{176}7’explained 97% of the variability in SDE. The effects of
height and fat mass (kg or % body wt) on BMR and SDE scaled
for weight or fat-free mass were age dependent. Best-fitted expo-
nents rebating BMR or SDE to body size differed between children
(0.4()-4).52) and infants (1.04-1.30) (P 0.001). Human energy
requirements from infancy to adulthood appear to be a power, not
a linear, function of body weight and composition. Am J C/inNutr I995;62(suppl): 1047S-52S.
KEY WORDS Sedentary daily expenditure, basal meta-
bolic rate, infants, children, adults, energy requirements
INTRODUCTION
Because dietary energy is required primarily to replace ex-
pended energy, human energy requirements have been esti-
mated from measurements of energy expenditure (EE). Only
during early infancy does the energy cost of growth represent
a sizable portion of the total energy requirement. By 12 mo of
age, < 5% of the total energy requirement is partitioned to
growth (1). During the adolescent growth spurt, < 5% of the
total energy requirement is used for growth.
Basal metabolic rates (BMRs) provide the foundation for
estimating human energy requirements when allowances are made
for physical activity and growth ( 1 , 2). This approach has been
advocated for infants and young children; however, energy re-
quirements for infants and young children have been based on
observed energy intakes because of a lack of knowledge of the
incremental increase required above basal expenditure.
Although it is reasonable to do so, given the volume of data
across sex and age groups (3), estimating energy requirements
from BMR requires extrapolation from a brief, standardized
measurement to a daily energy requirement. In an alternative
approach put forth by Ravussin et al (4) and Webb and Sangal
(5), energy requirements are based on measurements of seden-
tary daily expenditure (SDE). SDE encompasses components
of 24-h energy expenditure that by convention are excluded
from BMR, ie, thermic effect of feeding, spontaneous physical
activity, and sleeping metabolic rate (SMR). Therefore, SDE
should be more representative of an individual’s energy re-
quirement than BMR is.
Therefore, the purpose of this study was to measure SDE and
BMR of infants, children, and adults to investigate how factors
of age and body composition modulate energy requirementsacross the life span.
SUBJECTS AND METHODS
Subjects
A total of 210 healthy subjects participated in the study.
These subjects included 101 infants (50 male, 51 female) aged
3-18 mo, 82 girls aged 9-16 y, and 27 adults (6 male, 21female) aged 20-46 y. Physical characteristics of the subjects
are given in Table 1. All adults and parents or guardians of the
children and infants gave written informed consent before thestart of testing. The study was approved by the Institutional
Review Board for Human Research at Baylor College ofMedicine.
Methods
Energy expenditure of the adults and children was measured
for 24 h in one of four room respiration calorimeters (two eachof 19 m3 and 31 m3) (6). Each chamber has its own micropro-
cessor-based gas analyzers for carbon dioxide (Ultramat SE;
Siemens, Karbsruhe, Germany) and oxygen (Oxymat SE;
Siemens) that enable continuous data collection at 1-mm inter-
vals. Thermal-mass controllers (740 and 830; Sierra Instru-
ments, Monterey, CA) regulate air flow through the chambers
to maintain constant carbon dioxide concentration (0.45%) and
gauge pressure (13.3 Pa). Temperature was maintained at 24-
26 #{176}C.Performance tests by infusion of nitrogen and carbon
dioxide blends showed that individual measurements can bemade with errors of ± 3.0% (95% CI). Energy expenditure was
I From the USDA/ARS Children’s Nutrition Research Center, Depart-
ment of Pediatrics, Baylor College of Medicine, Houston.2 This work is a publication of the US Department of Agriculture
(USDA)/Agricultural Research Service (ARS) Children’s Nutrition Re-search Center, Department of Pediatrics, Baylor College of Medicine and
Texas Children’s Hospital, Houston. This project was funded in part with
federal funds from the USDAJARS under Cooperative Agreement
58-6250-1-003. The contents of this publication do not necessarily reflectthe views or policies of the USDA, nor does mention of trade names,
commercial products, or organizations imply endorsement by the US
Government.
3 Address reprint requests to NF Butte, Children’s Nutrition Research
Center, 1 1(X) Bates Street, Houston, TX 77030.
by guest on July 13, 2011w
ww
.ajcn.orgD
ownloaded from
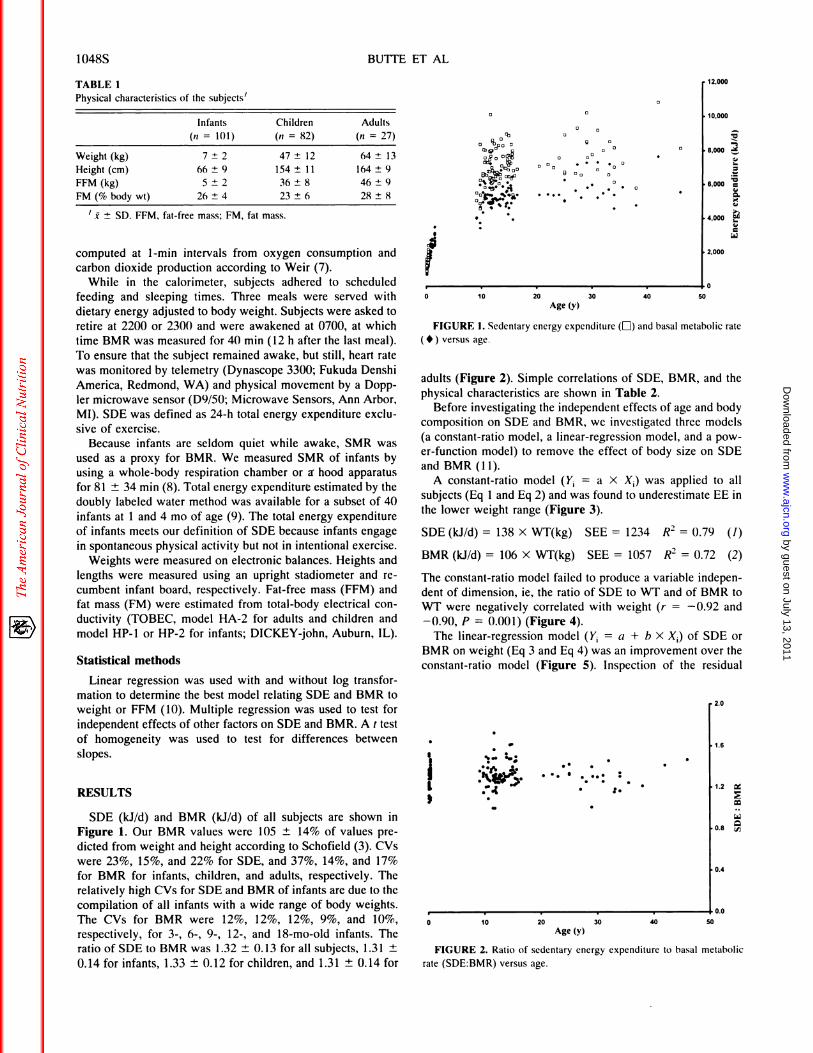
TABLE 1Physical characteristics of the subjects’
‘ I ± SD. FFM, fat-free mass; FM, fat mass.
a
� a
�i#{149},w �
S 0
12,000
10,000
.�
8,000 �0�
6,000
4,000
2,000
1’0 10 20 30 40 50
..:: :��#{149}
1.6
1.2 �
0
0.8 c,�
0.4
0 10 20 30 40 50Age (y)
1048S BUTTE El AL
FIGURE 2. Ratio of sedentary energy expenditure to basal metabolic
rate (SDE:BMR) versus age.
Infants
(ii 101)
Children
(n = 82)
Adults
(n 27)
Weight (kg) 7 ± 2 47 ± 12 64 ± 13
Height (cm) 66 ± 9 154 ± 11 164 ± 9
FFM(kg) 5±2 36±8 46±9
FM(%bodywt) 26±4 23±6 28±8
computed at 1-mm intervals from oxygen consumption andcarbon dioxide production according to Weir (7).
While in the calorimeter, subjects adhered to scheduledfeeding and sleeping times. Three meals were served withdietary energy adjusted to body weight. Subjects were asked toretire at 2200 or 2300 and were awakened at 0700, at which
time BMR was measured for 40 mm (12 h after the last meal).
To ensure that the subject remained awake, but still, heart rate
was monitored by telemetry (Dynascope 3300; Fukuda Denshi
America, Redmond, WA) and physical movement by a Dopp-
ler microwave sensor (D9/50; Microwave Sensors, Ann Arbor,MI). SDE was defined as 24-h total energy expenditure exclu-
sive of exercise.Because infants are seldom quiet while awake, SMR was
used as a proxy for BMR. We measured SMR of infants by
using a whole-body respiration chamber or a hood apparatus
for 81 ± 34 mm (8). Total energy expenditure estimated by the
doubly labeled water method was available for a subset of 40
infants at 1 and 4 mo of age (9). The total energy expenditure
of infants meets our definition of SDE because infants engagein spontaneous physical activity but not in intentional exercise.
Weights were measured on electronic balances. Heights andlengths were measured using an upright stadiometer and re-
cumbent infant board, respectively. Fat-free mass (FFM) and
fat mass (FM) were estimated from total-body electrical con-
ductivity (TOBEC, model HA-2 for adults and children and
model HP-i or HP-2 for infants; DICKEY-john, Auburn, IL).
Statistical methods
Linear regression was used with and without log transfor-
mation to determine the best model relating SDE and BMR to
weight or FFM (10). Multiple regression was used to test for
independent effects of other factors on SDE and BMR. A t test
of homogeneity was used to test for differences between
slopes.
RESULTS
SDE (kJ/d) and BMR (kJ/d) of all subjects are shown in
Figure 1. Our BMR values were 105 ± 14% of values pre-
dicted from weight and height according to Schofield (3). CVs
were 23%, 15%, and 22% for SDE, and 37%, 14%, and 17%
for BMR for infants, children, and adults, respectively. Therelatively high CVs for SDE and BMR of infants are due to the
compilation of all infants with a wide range of body weights.The CVs for BMR were 12%, 12%, 12%, 9%, and 10%,
respectively, for 3-, 6-, 9-, 12-, and 18-mo-old infants. The
ratio of SDE to BMR was 1.32 ± 0.13 for all subjects, 1.31 ±
0.14 for infants, 1.33 ± 0.12 for children, and 1.31 ± 0.14 for
Age (y)
FIGURE 1. Sedentary energy expenditure (E) and basal metabolic rate
(#{149})versus age.
adults (Figure 2). Simple correlations of SDE, BMR, and the
physical characteristics are shown in Table 2.
Before investigating the independent effects of age and bodycomposition on SDE and BMR, we investigated three models
(a constant-ratio model, a linear-regression model, and a pow-
er-function model) to remove the effect of body size on SDE
and BMR (11).
A constant-ratio model (Y1 = a X X) was applied to all
subjects (Eq 1 and Eq 2) and was found to underestimate EE in
the lower weight range (Figure 3).
SDE (kJId) = 138 X WT(kg) SEE = 1234 R2 = 0.79 (1)
BMR (kJ/d) = 106 X WT(kg) SEE = 1057 R2 = 0.72 (2)
The constant-ratio model failed to produce a variable indepen-dent of dimension, ie, the ratio of SDE to WT and of BMR to
WT were negatively correlated with weight (r = -0.92 and
-0.90, P = 0.001) (Figure 4).The linear-regression model (Y a + b X X.) of SDE or
BMR on weight (Eq 3 and Eq 4) was an improvement over the
constant-ratio model (Figure 5). Inspection of the residual
2.0
by guest on July 13, 2011w
ww
.ajcn.orgD
ownloaded from

SDE=138Wt R2=0.79
0 10 20 30 40 50 60 70 80 90
Weight (kg)0 10 20 30 40 50 60 70 80 90
Weight (kg)
ENERGY REQUIREMENTS 10495
FIGURE 3. Constant-ratio model of sedentary energy expenditure (LI)and basal metabolic rate ( #{149}) versus weight.
FIGURE 4. Regression of sedentary energy expenditure (El) and basalmetabolic rate ( #{149}), standardized by weight, versus weight.
TABLE 2
Simple correlations between sedentary daily expenditure (SDE), basal metabolic rate (BMR), and physical characteristics’
All Infants
SDE BMR
Children
SDE BMR
Adults
SDE BMRSDE BMR
Weight 0.94 0.95 0.84 0.94 0.79 0.73 0.68 0.74
FFM 0.96 0.96 0.86 0.96 0.77 0.72 0.89 0.77Height 0.95 0.96 0.83 0.93 0.61 0.56 0.78 0.65
FM 0.74 0.82 0.72 0.80 0.69 0.64 0.11 0.31Percentage FM -0.04 -0.08 0.51 0.09 0.50 0.48 -0.07 0.06
‘ FFM, fat-free mass; FM, fat mass.
plots on weight indicated a positive bias with infants and a
negative bias with children and adults.
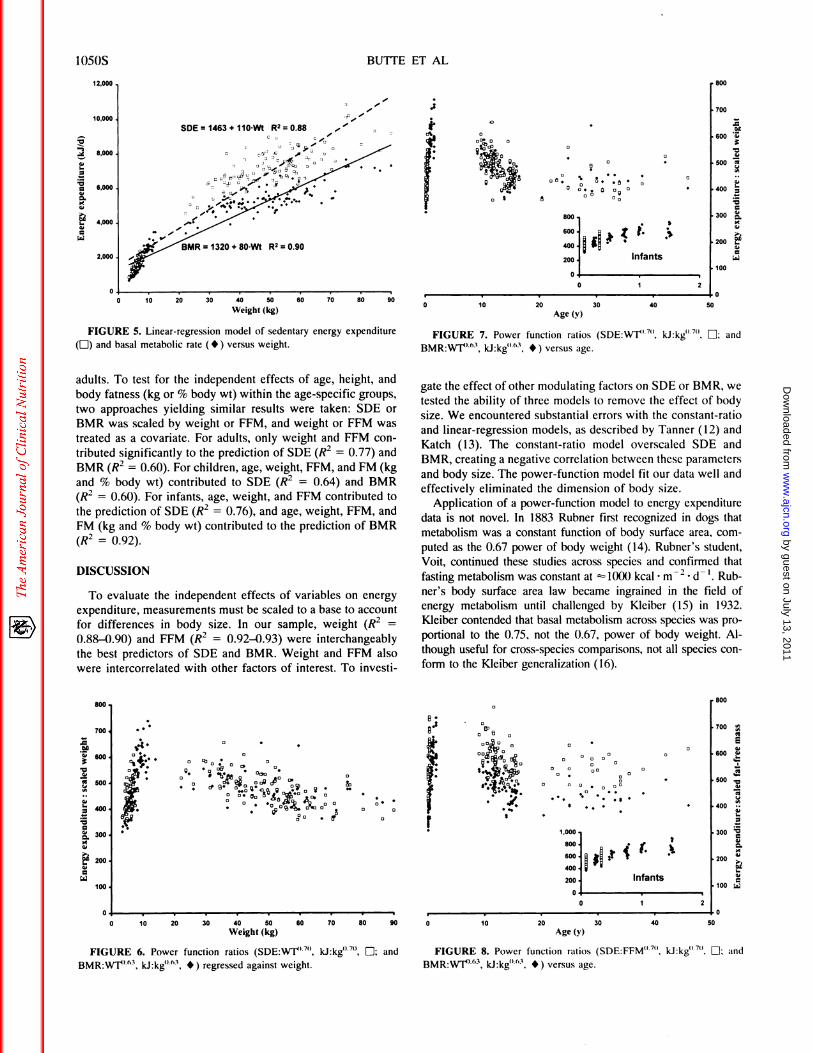
SDE (kJ/d) = 1463 + 1 10 X WT(kg) SEE = 979 R� = 0.88
(3)
BMR (kJ/d) = 1320 + 80 X WT(kg) SEE = 653 R2= 0.90
(4)
The linear model assumes an additive error term, which isquestionable because rates of EE diverge with an increase in
scale. Commonly, EE is adjusted for body weight by treating it
as a covariate, in which case body size is assumed to be related
linearly to EE. Clearly, in our data the relation between SDE or
BMR and weight was curvilinear with a strong linear compo-
nent.
A power-function model (Y1 = a X X1 b) that uses a multi-
plicative error term was fitted using linear regression on bog-
transformed variables (Eq 5 and Eq 6).
SDE (kJ/d) = 463 x WT(kg)#{176}7#{176}SEE = 794 R2 = 0.97
(5)
BMR (kJ/d) = 471 X WT(kg)#{176}63 SEE = 552 R2 = 0.94
(6)
When the power function ratios (SDE:WT 0.70 or BMR:WT#{176}63)were regressed against weight, the respective correba-
tions were equal to -0.1 1 (P = 0.10) and -0.17 (P = 0.01)indicating satisfactory scaling of EE for body weight (Figure
6). Similar analyses of SDE and BMR on FFM were also
14,000
12.000
� 10,000
� 8,000.�
�6,000
� 4,000
2,000
performed. Nearly identical coefficients were attained for
FFM.
SDE (kJ/d) = 563 x FFM(kg)#{176}7#{176}SEE = 1324 R2 = 0.97
(7)
BMR (kJ/d) = 571 x FFM(kg)#{176}63 SEE = 854 R2 = 0.94
(8)
The power function ratios of SDE:WT#{176}70, BMR:WT#{176}63, SDE:FFM#{176}70, and BMR:FFM#{176}63 are plotted against age in Figure
7 and Figure 8.Independent effects of age, height, and body fatness on
SDE:WT#{176}7#{176}and BMR:WT#{176}63 were tested using multiple re-
gression. Age, height, FM (kg), and FM (% body wt) were
tested as independent variables. Because of the imbalance in
sex in our data, sex was included in the model to control for
potential bias and to increase precision. Significant effects ofheight and FM (kg or % body wt) on SDE:W1�7#{176} were found,
but these effects were confounded by age. Significant effects of
height and % FM on SDE:FFM#{176}7#{176}and of height and FM onBMR:WT#{176}63 and BMR/FFM��63 were also confounded by age.
FM (% body wt) contributed significantly to the variance seenin BMR:FFM#{176}63.
To resolve the two-way interactions of age X height or age
x FM for SDE:WT�7#{176} and BMR:WT�63, power-function
models of SDE or BMR on weight or FFM were derived
separately for children and infants (Table 3). The best-fit
exponents for infants differed from those for children (P =
0.001). Sample size was insufficient to define the exponents for
350
.� 300� 250
� 200
=.� 150.�
8.� 100
i� 50
by guest on July 13, 2011w
ww
.ajcn.orgD
ownloaded from
SDE1463+11OWt R2=O.88
12,000
10,000
8,000
6,000
4,000
2,000
.�
-,
.�
a.�
a
a
#{149}0
800
0� 0
0�#{149}
0
I
‘; 5005. 0
0#{149}�
I
700
.a
600
500
400
300 8.
200
100
z 1
Infants
0 10 20
0
30 40 50
800
700
50� 600
.�
� 500
�400
a
8. 300
It::
o�j�#{149}#{149} 0 ‘b0 #{149} 0
:�‘2 � c�
00 1’: #{176}:� � :. �a00 et IIi
0�e
S
. . .0’
800
700 �
E
600
500 .�
400
300
00
as200
100 �
1,000.
800.
200. Infants
0 2
1OSOS BUTTE ET AL
0 10 20 30 40 50 60 70 80 90
Weight (kg)
FIGURE 5. Linear-regression model of sedentary energy expenditure
(LI) and basal metabolic rate ( #{149}) versus weight.
adults. To test for the independent effects of age, height, and
body fatness (kg or % body wt) within the age-specific groups,
two approaches yielding similar results were taken: SDE orBMR was scaled by weight or FFM, and weight or FFM was
treated as a covariate. For adults, only weight and FFM con-
tributed significantly to the prediction of SDE (R2 = 0.77) and
BMR (R2 = 0.60). For children, age, weight, FFM, and FM (kgand % body wt) contributed to SDE (R2 = 0.64) and BMR(R2 0.60). For infants, age, weight, and FFM contributed tothe prediction of SDE (R2 = 0.76), and age, weight, FFM, and
FM (kg and % body wt) contributed to the prediction of BMR
(R2 0.92).
DISCUSSION
To evaluate the independent effects of variables on energyexpenditure, measurements must be scaled to a base to account
for differences in body size. In our sample, weight (R2 =
0.88-0.90) and FFM (R2 = 0.92-0.93) were interchangeably
the best predictors of SDE and BMR. Weight and FFM also
were intercorrebated with other factors of interest. To investi-
800
600 �I :1 k
400 � �
200
0
Age (y)
FIGURE 7. Power function ratios (SDE:WT�7#{176}, kJ:kg#{176}7#{176},LI: and
BMR:WT#{176}�’3, kJ:kg#{176}�3, #{149}) versus age.
gate the effect of other modulating factors on SDE or BMR, we
tested the ability of three models to remove the effect of body
size. We encountered substantial errors with the constant-ratio
and linear-regression models, as described by Tanner (12) andKatch (13). The constant-ratio model overscaled SDE andBMR, creating a negative correlation between these parameters
and body size. The power-function model fit our data well and
effectively eliminated the dimension of body size.
Application of a power-function model to energy expendituredata is not novel. In 1883 Rubner first recognized in dogs that
metabolism was a constant function of body surface area, com-
puted as the 0.67 power of body weight (14). Rubner’s student,
Voit, continued these studies across species and confirmed that
fasting metabolism was constant at = 1000 kcal . m2 � d �. Rub-ner’s body surface area law became ingrained in the field of
energy metabolism until challenged by Kleiber (15) in 1932.
Kbeiber contended that basal metabolism across species was pro-
portional to the 0.75, not the 0.67, power of body weight. Al-
though useful for cross-species comparisons, not all species con-
form to the Kleiber generalization (16).
0 10 20 30 40 50 60 70 80 90
Weight (kg)
FIGURE 6. Power function ratios (SDE:W1�7#{176}, kJ:kg#{176}7#{176},LI; and
BMR:W14163, kJ:kg#{176}�’3, #{149}) regressed against weight.
0 10 20 30 40 50
Age(y)
FIGURE 8. Power function ratios (SDE:FFM�7#{176}. kJ:kg#{176}7#{176},LI: and
BMR:WT#{176}63, kJ:kg#{176}�’3, #{149}) versus age.
by guest on July 13, 2011w
ww
.ajcn.orgD
ownloaded from

ENERGY REQUIREMENTS 105 IS
TABLE 3
The best-fit exponents (h) in the power-function model relating energy expenditure to weight (WT) or fat-free mass (FFM)’
SDEaXW14’ BMRaXW1�’ SDEaXFFM1’ BMR=aXFFMh
Infants 1.04 ± 0.10 1.23 ± 0.04 1.30 ± 0.12 1.29 ± 0.03
Children 0.44 ± 0.04 0.40 ± 0.04 0.52 ± 0.04 0.46 ± 0.05
‘.t SE. SDE, sedentary daily expenditure; BMR, basal metabolic rate.
Across all ages, SDE was standardized by the 0.70 power of
WT or FFM, and BMR was scaled by the 0.63 power of WT or
FFM. Inspection of Figure 8 shows that SDE and BMR per unit
body size increased during infancy, declined throughout child-
hood, and leveled off in adulthood.
Several investigators have noted that the BMR per unit bodyweight during growth differed from adult values. The greater
proportion of metabolically active organs in infants compared
with children and adults contributes to their higher metabolic
rates. The proportion of organ weight is fairly constant at 15%body weight throughout infancy, and organ metabolic rate
remains constant from infancy to maturity (17). Holliday et ab
(17) found that the best-fit exponent relating weight and BMR
of infants up to 10-12 kg was 1.0; beyond 12 kg, the exponentdecreased to 0.58. Karlberg (18) and others confirmed that
BMR of infants was more or less proportional to body weight;
the exponents of body weight reported were 0.918 (18), 1.09
(19), 1.1 1 (20), and 1.20 (21). Metabolic rate increases more
rapidly than body size, probably due to relative losses of
extraceblular fluid and increases in body cell mass (21). These
compositional changes in FFM contribute to the increased
metabolic rate of FFM seen during infancy.
The decline in SDE and BMR relative to weight or FFM seenduring childhood is due to the slower growth of organs with
high metabolic rates (eg, brain, liver, heart, and kidney) relative
to those with lower metabolic rates (eg, muscle, bone, and fat).
Organ weight is 8% of body weight in adolescents and 6% inadults (22). Muscle and skeletal mass increase steadily
throughout childhood. The percentage of body fat declines in
the midchildhood years, and then increases during the adobes-
cent growth spurt in girls (23).
Factors underlying the variability in SDE and BMR havebeen investigated in several studies of adults. In 177 adults,
Ravussin et al (4) found that FFM was the single best predictor
of SDE; weight, height, % FM, but not age and sex, were alsoindependent predictors of SDE. BMR was related to FFM, but
not to FM. The ratio of SDE to BMR was 1.27 ± 0.12, similar
to the mean value and variance observed in our room calorim-
eters. In 37 men and women, Webb and Sangal (5) reported
that the best prediction equation for SDE combined FFM and
body mass index (R2 = 0.92). FM also improved the prediction
of SDE in this study.In a compilation of adult studies, FFM was the best predictor
of resting metabolic rate (RMR), explaining 53-88% of itsvariability (24). FM made a significant contribution to the
prediction of RMR in obese individuals. The contribution of
FM to RMR was not supported for the general population
because of the relative constancy of FM in nonobese individ-
uabs. It is of interest that FM as a predictor of BMR and SDE
emerged strongest in our data set of children. These girls were
not obese, but were entering or were in their adolescent growth
spurt, a time of considerable fat deposition.
Weinsier et al (22) compiled 3 1 data sets (ii 1 1 1 1) com-
prising a wide range of ages from infants to adults and found
the relation between RMR and FFM to be nonlinear. RMR felldisproportionately to the rise in FFM. The slopes relating RMRand FFM were significantly higher for infants than for adoles-
cents and adults due to the increasing proportion of less met-
abolicalby active muscle mass.
In children aged 6-10 y, FFM was identified as the strongest
independent predictor of RMR (25). FFM predicted 74% of thevariability of TEE and 88% of the variability in BMR in young
children (26, 27). In nonobese and obese adolescents aged
12-18 y, FFM accounted for 85% ofthe variability in TEE and
87% of the variability in BMR (28). Heretofore, SDE values
for children had not been published.The standardized measurement of basal metabolism was
developed in an effort to compare metabolic rates rather than to
establish minimal metabolism within and between species.
Standardization ensured comparability, but also diminishedobservable biological variability between individuals. In themeasurement of SDE, factors known to influence metabolismsuch as cold- and food-induced thermogenesis, muscular
movement, and sleep are included, which therefore makes the
measurement more encompassing of individual variability. In
our study, the ratio of SDE to BMR averaged 1.3 from infancyto adulthood. We found that factors affecting BMR similarlyinfluenced SDE. FFM and weight were the strongest determi-nants of SDE and BMR. However, the relation between SDE or
BMR and weight or FFM was a function of age. Other mod-
ulating factors were age-specific. In adults, age, height, and
body fatness did not contribute independently to the prediction
of SDE or BMR. In infants and children, age and FM were
identified as independent predictors of SDE and BMR. Be-
cause the relation between SDE or BMR and weight or FFM
was found to be a function of age, separate predictive equations
for SDE and BMR should be developed for infants, children,
and adults. U
We thank A Adolph, M Puyau, and F Vohra for performing the energy
expenditure measurements; L Clarke and M Llaurador for performing the
mass spectrometric measurements; and C Heinz, K Wallace, and J Stuff for
technical assistance.
REFERENCES
1. FAO/WHO/UNU. Energy and protein requirements: report of a joint
FAO/WHO/UNU expert consultation. World Health Organ Tech Rep
Ser l985;724.2. National Research Council. Recommended dietary allowances. 10th
ed. Washington, DC: National Academy Press, 1989.
3. Schofield WN. Predicting basal metabolic rate, new standards and
review of previous work. Human Nutr Clin Nutr 1985;39C:5-41.
4. Ravussin E, Lilloja 5, Anderson TE, Christin L, Bogardus C. Deter-
by guest on July 13, 2011w
ww
.ajcn.orgD
ownloaded from

1052S BUTTE ET AL
minants of 24-hour energy expenditure in man. Methods and results
using a respiratory chamber. J Clin Invest 1986;78:1568-78.
5. Webb P, Sangal S. Sedentary daily expenditure: a base for estimating
individual energy requirements. Am J Clin Nutr 1991;53:606-1 1.
6. Moon JK, Vohra FA, Puyau MR, et al. Exercise evaluation in fast
response room respiration calorimeters. FASEB J 1993;7:A61 1(abstr).7. Weir JB. New methods for calculating metabolic rate with special
reference to protein metabolism. J Physiob (Lond) 1949;109:1-9.8. Moon JK, Jensen CL, Butte NF. Fast-response whole body indirect
calorimeters for infants. J Appl Physiol 1993;74:476-84.9. Butte NF, Wong WW, Ferlic L Smith EO, Klein PD, Garza C. Energy
expenditure and deposition of breast-fed and formula-fed infants dur-ing early infancy. Pediatr Res 1990;28:631-40.
10. Snedecor OW, Cochran WG. Statistical methods. Ames, IA: IowaState University Press, 1967.
I 1. Nevill AM, Ramsbottom R, Williams C. Scaling physiological mea-
surements for individuals of different body size. Eur J �ppl Physiol
1992;65:1 10-7.12. Tanner JM. Fallacy of per-weight and per-surface area standards, and
their relation to spurious correlation. J Appl Physiol 1949;2:1-15.
13. Katch VL. Use of the oxygen/body weight ratio in correlational
analyses: spurious correlations and statistical considerations. Med Sci
Sports 1973;4:253-7.
14. Blaxter K. Energy metabolism in animals and man. Cambridge, UK:
Cambridge University Press, 1989.
15. Kieiber M. Body size and metabolism. Hilgardia 1932;6:315-53.
16. Huyssen V, Lacy RC. Basal metabolic rates in mammals. Taxonomicdifferences in the albometry of SMR and body mass. Comp Biochem
Physiol A 1985;81A:741-54.
17. Holliday MA, Potter D, Jarrah A, Bearg S. The relation of metabolic
rate to body weight and organ size. Pediatr Res 1967;1:185-95.18. Karlberg P. Determinations of standard energy metabolism (basal
metabolism) in normal infants. Acta Paediatr 1952;41(suppl 89):9-14.19. Benedict FG, Talbot FB. Metabolism and growth from birth to pu-
berty. Washington, DC: Carnegie Institution of Washington, 1921.
20. Janet H, Bochet M. Basal metabolism of infants. (Sur le metabolisme
basal du nourrisson.) Bull Soc Pediatr (Paris) 1933;31:359 (in French).
21. Sinclair JC. Metabolic rate and body size of the newborn. Clin Obstet
Gynecob 1971;14:840-54.
22. Weinsier RL, SchuLz Y, Bracco D. Reexamination of the relationshipof resting metabolic rate to fat-free mass and to the metabolically
active components of fat-free mass in humans. Am J Clin Nutr 1992;
55:790-4.23. Forbes GB. Human body composition. Growth, aging, nutrition, and
activity. New York: Springer-Verlag, 1987.24. Nelson KM, Weinsier KM. Long CL, Schutz Y. Prediction of resting
energy expenditure from fat-free mass and fat mass. Am J Clin Nutr
1992;56:848-56.
25. Maffeis C, SchuLz Y, Micciolo R, Zoccante L, Pinelli L. Resting
metabolic rate in six- to ten-year-old obese and nonobese children.
J Pediatr 1993;122:556-62.26. Goran MI, Carpenter WH, Poehlman ET. Total energy expenditure in
4- to 6-yr-old children. Am J Physiol 1993;264:E706-1 1.27. Fontvieille AM, Harper IT, Ferraro RT, Spraul M, Ravussin E. Daily
energy expenditure by five-year-old children, measured by doublylabeled water. J Pediatr 1993;123:200-7.
28. Bandini LB. Schoeller DA, Dietz WH. Energy expenditure in obese
and nonobese adolescents. Pediatr Res 1990;27:198-203.
by guest on July 13, 2011w
ww
.ajcn.orgD
ownloaded from
Related Documents