EGY1 Energy Department Paper No. 1 Energy Pricing in Developing Countries: A Review of the Literature October 1981 World Bank Energy Department Public Disclosure Authorized Public Disclosure Authorized Public Disclosure Authorized Public Disclosure Authorized

Welcome message from author
This document is posted to help you gain knowledge. Please leave a comment to let me know what you think about it! Share it to your friends and learn new things together.
Transcript
EGY1Energy Department Paper No. 1
Energy Pricing in Developing Countries:A Review of the Literature
October 1981
World Bank Energy Department
Pub
lic D
iscl
osur
e A
utho
rized
Pub
lic D
iscl
osur
e A
utho
rized
Pub
lic D
iscl
osur
e A
utho
rized
Pub
lic D
iscl
osur
e A
utho
rized
This paper is one of a series issued by the EnergyDepartment for the information and guidance of Bankstaff. It may not be published or quoted as repre-senting the views of the Bank Group, and the BankGroup does not accept responsibility for its accuracyor completeness.
Copyright c 1981Energy Department
World Bank1818 H Street, N.W.
Washington, D.C. 20433, USA
ENERGY PRICING
IN DEVELOPING COUNTRIES
Part I. A Review of the LiteraturePart II. Classified Bibliography
DeAnne Julius, EGYMeta Systems, Consultants
October 1981
Energy DepartmentWorld Bank
1818 H Street, N.W.Washington, D.C. 20433, USA
Table of ContentsText Bibliography
Page No. Page No.
Chapter I. Introduction, Summary and Conclusions .............. 1 -
I.1 Background and Objectives .......... ......... 1 -
1.2 Organization of the Literature Review .. ....... 1 -
1.3 Summary Overview of the Literature ........... 4 -
Chapter II. Economic Theory of Exhaustible andRenewable Resources ................................ 14 121
II.1 Basic Results: Competitive Model, Relation toOptimal Depletion Program .. ................. 14 122
11.2 Market Structure ................................... 21 12911.3 Taxation and Leasing ......................... 23 13111.4 Renewable Resources .......................... 24 13311.5 Social Benefit Cost Analysis and Energy Projects ... 26 135
Summary and Conclusions ............................ 31 -
Chapter III. Analysis of International Energy Markets ......... ,. 33 139III.1 International/Regional Energy Supply and Demand .... 33 140111.2 OPEC Supply and Price Behavior ..................... 39 145
Conclusion ......................................... 43 -
Chapter IV. Aggregate Energy/Output Relationships ....... 45 149IV.1 Energy Consumption and Economic Growth ............. 45 150IV.2 Energy Policy Modeling ............................... 54 157
Conclusion ......................................... 58 -
Chapter V. Demand for Energy by End-Use Sector ................. 60 161V.1 Industrial-Manufacturing Sector ........ .......... 5V.2 Household (Residential) Sector ......... 76 168V.3 Transport Sector .................... 85 171V.4 Agricultural Sector ............................... 88 173
Conclusion ................................... .. 94 -
Chapter VI. Integrated Energy Sector Studies andDemand/Investment/Pricing by Individual Fuel Types 95 177
VI.1 Integrated Energy Sector Studies................... 95 178VI.2 Crude Oil/Natural Gas--Pricing Policies 100 180VI.3 PetroleumProducts................... 103 185VI.4 Coal/Lignite........................................ 106 187VI.5 Electricity ba............... . ....... 108 189VI.6 Renewable Energy Resources ......................... 114 195
Conclusion.................................... 116 -
Annex: A Methodological Note on the Scope of Review and LiteratureSearch and Selection ........................................ 199
Abbreviations for Periodicals .................................... 118
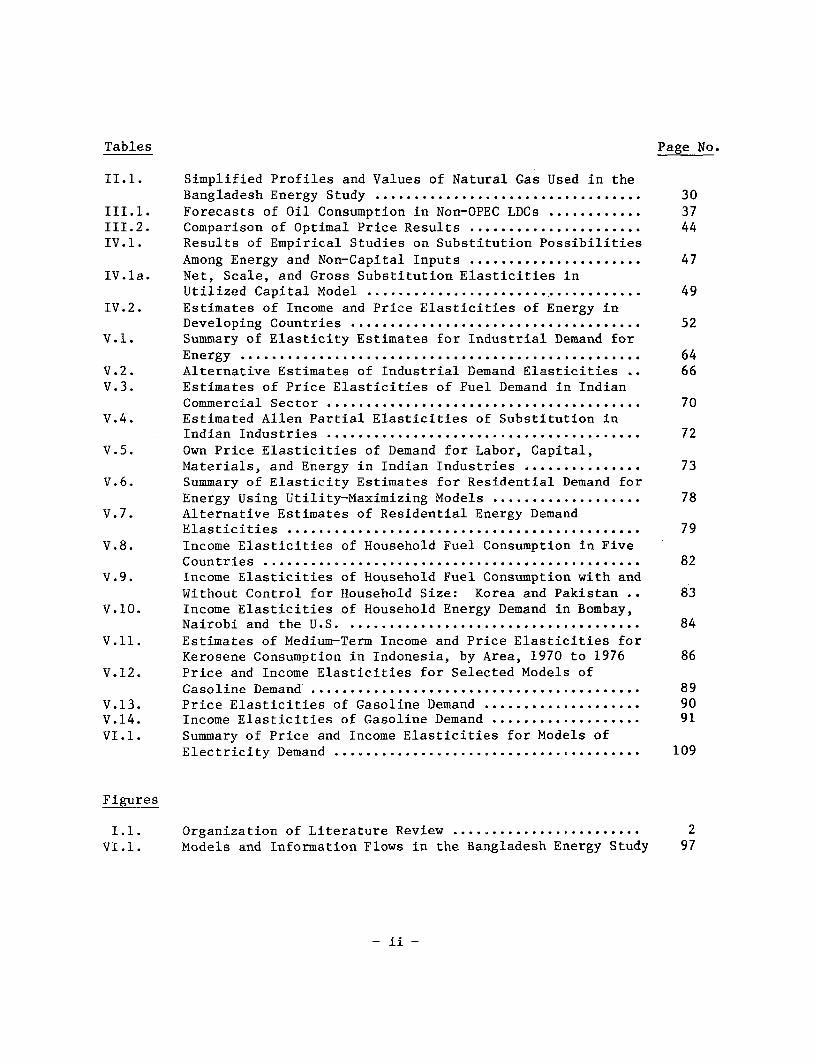
Tables Page No.
II.1. Simplified Profiles and Values of Natural Gas Used in theBangladesh Energy Study ....................... ........ 30
III.1. Forecasts of Oil Consumption in Non-OPEC LDCs ............ 37111.2. Comparison of Optimal Price Results ................... 44IV.1. Results of Empirical Studies on Substitution Possibilities
Among Energy and Non-Capital Inputs ................... 47IV.1a. Net, Scale, and Gross Substitution Elasticities in
Utilized Capital Model .............................. .... 49IV.2. Estimates of Income and Price Elasticities of Energy in
Developing Countries ............................ ...... 52V.1. Summary of Elasticity Estimates for Industrial Demand for
Energy ......................................... ......... 64V.2. Alternative Estimates of Industrial Demand Elasticities 66V.3. Estimates of Price Elasticities of Fuel Demand in Indian
Commercial Sector .......................... ........... 70V.4. Estimated Allen Partial Elasticities of Substitution in
Indian Industries ............................. ........ 72V.5. Own Price Elasticities of Demand for Labor, Capital,
Materials, and Energy in Indian Industries ............... 73V.6. Summary of Elasticity Estimates for Residential Demand for
Energy Using Utility-Maximizing Models ................... 78V.7. Alternative Estimates of Residential Energy Demand
Elasticities ............................... ............ 79V.8. Income Elasticities of Household Fuel Consumption in Five
Countries ............................................... 82V.9. Income Elasticities of Household Fuel Consumption with and
Without Control for Household Size: Korea and Pakistan .. 83V.10. Income Elasticities of Household Energy Demand in Bombay,
Nairobi and the U.S............................... ...... 84
V.11. Estimates of Medium-Term Income and Price Elasticities forKerosene Consumption in Indonesia, by Area, 1970 to 1976 86
V.12. Price and Income Elasticities for Selected Models ofGasoline Demand ........................................... 89
V.13. Price Elasticities of Gasoline Demand .................... 90V.14. Income Elasticities of Gasoline Demand ................... 91VI.1. Summary of Price and Income Elasticities for Models of
Electricity Demand ............................ ......... 109
Figures
I.1. Organization of Literature Review ... 2.................. 2
VI.1. Models and Information Flows in the Bangladesh Energy Study 97
- ii -
Chapter I
Introduction, Summary and Conclusions
1.1 Background and Objectives
The availability and cost of energy emerged as a major developmentconstraint in the 1970s. The decade ended with the international price ofcrude oil doubling in a single year to almost $30 per barrel, presagingcontinued stress during the 1980s. The impact of these increases on theless developed countries (LDCs) has been well documented, as have theirefforts to expand the production of indigenous energy resources. At thesame time, there is a growing recognition that demand management policieswhich encourage energy conservation and more efficient use can play animportant role in easing energy constraints.
The prices of energy products, both for the appraisal of investmentprojects and for the marketplace, are a central tool of energy policy. Theoptimal choice of project design and development strategy hinges upon usingthe appropriate price of energy inputs in the project selection process.In the marketplace, adequate price incentives must be provided to producersto stimulate exploration and development of indigenous supplies of oil, gas,coal, hydropower and other energy resources. Energy consumers -- many of whomare producers of other goods -- should face prices that encourage them to useenergy efficiently and to select the right form of energy for their particularneeds.
The objective of this study is to provide a critical review of thetheoretical and empirical literature applicable to energy pricing decisions indeveloping countries. This includes an assessment of the current state of theliterature, a discussion of the major contributions in each subject area, and anidentification of important gaps. A bibliography of nearly one thousandarticles and other published and unpublished material is included, of whichabout 450 are mentioned in the text. It is hoped that this study will provideplanners with an analytical framework and access to existing empirical evidencewhich will allow them to evalute investment plans and demand/supply management.
1.2 Organization of the Literature Review
In order to address the issues involved in energy pricing in a syste-matic fashion, the survey of the literature is organized into 19 major topics,which are grouped under five categories, as shown in Figure 1.1. Each categorycorresponds to a chapter in the report. Numerous cross references in the textindicate related sections of the literature. Typically, the theoretical dis-cussion of a particular topic is connected with empirical attempts to describeor forecast its behavior. For example, those concerned with renewable resourceswould want to read both the theoretical discussion in Chapter II and thediscussion of the residential/commercial and agricultural end-use sectors(Chapter V and the studies of demand, investment and pricing by energy type inChapter VI). Other important connections can be made, for example, betweenenergy demands at the macro and sectoral levels and between studies of separate
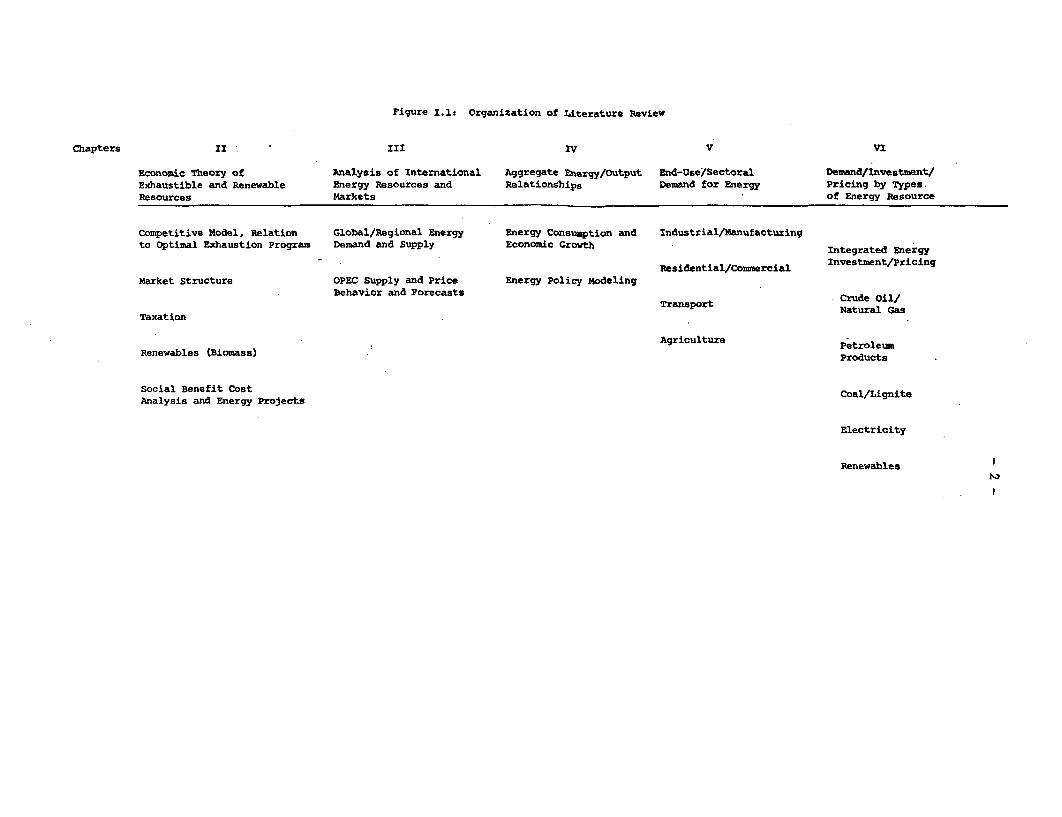
Figure I.1t Organization of Literature Review
Chapters II III IV V VI
Economic Theory of Analysis of International Aggregate Energy/Output End-Use/Sectoral Demand/Investment/Exhaustible and Renewable Energy Resources and Relationships Demand for Energy Pricing by Types.Resources Markets of Energy Resource
Competitive Model, Relation Global/Regional Energy Energy Consumption and Industrial/Manufacturingto Optimal Exhaustion Program Demand and Supply Economic Growth Integrated Energy
Residential/ommercial Investment/PricingMarket Structure OPEC Supply and Price Energy Policy Modeling
Behavior and Forecasts Crude Oil/
TaxationTransport Natural Gas
Agriculture PetroleumRenewables (Biomass) ProuProducts
Social Benefit Cost Coal/LigniteAnalysis and Energy Projects .
Electricity
Renewables
-3-
end-use sectors and fuel types. By both classifying the literature into majortopics and subtopics, and by describing the important connections betweenthem, we hope to maximize the usefulness of this survey to the reader.The second part of this volume includes a classified bibliography for the
chapters II through VI, broken down by topic.
Chapter II reviews the economic theory of exhaustible resources andits relation to social cost benefit analysis. Major topics include the charac-terization of socially efficient plans for the consumption of exhaustibleresources, their associated price paths, and their relation to allocationsarising in competitive markets; the effects of extraction costs, uncertainty,and an open-economy; the effects of monopolistic or oligopolistic markets;taxation and leasing policy; renewable resources; and issues of cost benefit
analysis such as determining the social discount rate.
Chapter III focuses on studies of world energy supply and demand,with emphasis on OPEC behavior and its implications for the future path ofworld oil prices. A number of different market models and forecasts arecompared.
Chapter IV deals with studies of relations between energy and aggregatedemand. These range from the simple calculation of energy/GDP ratios to moresophisticated multi-sectoral models where demand is sensitive to energy prices.The results of some models which examine the affects of pricing policies onaggregate variables are also surveyed.
Chapters V and VI analyze overall energy demand and supply into theseparate elements of end-use sectors and energy types, respectively. ChapterV deals only with energy demand because the primary issue in sectoral demandanalysis is the relation between a given energy mix and output. Sectorsexamined include manufacturing, household/residential, transportation, and
agriculture. On the other hand, the discussion of energy types in Chapter VIinvolves questions of demand, investment and pricing because the problem is howto produce and distribute each energy type to meet the end-use demands. Energytypes examined include crude oil, natural gas, refined products, coal, electri-city, and renewable resources. Existing pricing policies for a number ofenergy types are discussed and evaluated.
The concluding section of each of the Chapters II to VI contains adiscussion of the gaps in literature in individual areas.
-4-
1.3 Summary Overview of the Literature
(Chapter II) Economic Theory of Exhaustible and Renewable Resources
The economic theory of exhaustible resources bears on a number ofimportant pricing and investment issues concerning indigenous energy resources.For project analysis, the most important issue is how to determine the "valuein the ground" of a given resource. Even though these resources are availableto society without cost, economic theory implies that in most cases theirefficient allocation requires that some scarcity value be attributed to them.This is because their present consumption entails some cost to society interms of the value of alternative uses either today or in the future. Thisscarcity value ("rent" or "user cost") is shown to depend on a number offactors, including the size of the initial stock of the resource, the discountrate, the availability and price of substitutes, extraction costs, and un-certainty. The basic theoretical result is that the resource should beviewed as an asset and, in an efficient intertemporal allocation of resources,the net marginal return on this asset (including changes in the unit valueof the stock, changes in the size of the stock, and savings in extractioncosts) should be the same as for other assets in the economy, e.g., capital,as well as the social rate of discount. It is shown under what assumptionsallocation by competitive markets is socially efficient, both in partialand general equilibrium frameworks.
The basic model has been extended to deal with a more realisticdescription of resource extraction economics and possibilities of substitu-tion. These include extraction costs which vary with the rate of extractionand the size of the stock, the possibility of a backstop technology whichmight substitute for the resource in the future, the possibility of increasingreserves through exploration, and uncertainty about future demand, reserves,and extraction costs. Some aspects of resources, such as external effectsarising from extraction from a common pool and externalities in the collectionand dissemination of information, imply that competitive markets will not leadto an efficient allocation of resources.
Of particular concern to developing countries is the pricing ofresources that are tradeables or substitutes for tradeables. While thisquestion has not received much attention in the formal literature, there issubstantial agreement in the less formal literature on how the topic is tobe treated in practice. Static trade theory teaches that the relevantopportunity cost of a resource for a "small" country is the world price,either c.i.f. or f.o.b., depending on whether it substitutes for an importor an export. In an intertemporal framework it is important to considerthe present value of future prices in determining the relevant opportunitycost. In general, the time of exhaustion of a resource and its substitutionfor a traded resource cannot be decided independently of the plan of invest-
ments being considered. Thus, where investments are particularly lumpy, suchas for an LNG project, the partial equilibrium assumption of a shadow pricingframework may not be valid for exhaustible resources.
There are several other important issues as well. A great deal ofthe literature on exhaustible resources focuses on the behavior of noncompe-titive resource markets. This body of theory has been used to forecast thelikely behavior of petroleum prices under the OPEC cartel. The potentialemergence of substitutes at higher oil prices (a "backstop" technology inthe extreme case), other changes in demand, and the size of reserves outsidethe cartel are shown to be important limiting factors on cartel behavior.
Another segment of the literature on exhaustible resources dealswith questions of taxation and leasing policies. It is primarily concernedwith the effects of different tax policies on an efficient intertemporalallocation of resources, but it is also related to issues of how taxationand pricing policies can be used to achieve other non-efficiency goals.Much of the literature can be seen in relation to the received notion that itis relatively efficient to tax natural resources heavily because they aresupplied inelastically. This may be a fair approximation for known reserves,although some distortions of both the timing and overall amount of extractioncan still occur. However, the presumption is less certain when applied toexploration, because of the uncertainties, high costs, and informationexternalities involved. Taxation may also be used to correct externalitieswhich occur in the extraction of either exhaustible or renewable resources.
Renewable resources are those which have some natural rate ofreplenishment. They may be durable (e.g., forests) or nondurable (e.g. hydroand solar energy). If they are considered as an asset, part of their returnmay accrue through price increases and part through physical growth of theresource. The classic example of renewable resources considered in theliterature is that of fishery, although fuelwood is probably the most relevantexample for LDCs. The theory focuses on two main inefficiencies that mayoccur under competitive exploitation of the resource. First, overexploitationof a given stock may occur because individuals do not take into accountexternal effects due to their own actions. Second, the size of the stock willnot be optimal because individuals regard the stock as a free good and merelymaximize present profits rather than maximizing the present value of thestock.
Most of the theoretical literature on exhaustible or renewableresources is devoted to questions of "first best" pricing. However, for it tobe applicable to the problems of energy pricing in LDCs, the framework mustbe expanded to deal with fiscal distortions in an economy such as taxes andsubsidies as well as non-efficiency goals such as income distribution andenergy independence. More research needs to be done on the effect of alter-native social discount rates on price and extraction paths. For goods suchas renewables which are not tradeables, a number of methodological problemsneed further attention and case studies. There is a need for models thatinclude external effects due to erosion and the substitution possibilitiesamong food, fuel, fertilizer and fodder uses. In summary, although theliterature in general is quite developed and has been extended to cover anumber of real world complications, the parts of the theory most applicable toLDCs need further attention.
- 6 -
(Chapter III) Analysis of International Energy Markets
The analysis of global energy resources and trade may help provideboth a long term perspective on resource availability and usage patterns anda short- to medium-term outlook for the price of traded energy resources,principally oil. Three approaches have been used for analyzing the long-termprospects in world oil trade: In the energy balances approach, differentscenarios with consistent overall energy demand-supply balances are createdto project the future market situation. Projections of known and discoverableenergy resource supplies and of energy demand disaggregated by fuel typesand regions are made based upon rather judgmental factors. Explicit priceand income effects of fuel demand are not introduced, and a price-quantityadjustment process is not specified. Analyses of this type have either usedhistorical aggregate trends to forecast energy demands by country or region,or historical econometric price and income elasticities based on single-region data applied to all regions with judgmental parametric modifications.These price and income elasticity estimates or assumptions for particularregions (for both demand and supply) vary considerably among models, partlydue to differences in specification, methodology, and data base, and partlydue to differences in judgment. There is no consensus among the availablestudies on the total availability of global energy resources, their recover-ability, and potentials for use, or on future demands, and the range of"plausible" scenarios is wide. Nonetheless these are frequently used formaking judgmental and tentative projections of exhaustibility, price move-ments, and prediction of required "transition periods" from exhaustibleto non-exhaustible resources, or doomsdays.
In the second approach, formally consistent algebraic models arecreated to simulate the effects of changes in different exogenous parameterson overall energy demand and supply. Static simulation models are analogousto the energy-balance approach; dynamic simulation models incorporate somesort of adjustment mechanism and may be used to evaluate the benefits ofcertain pricing strategies. Oil supplies and price are exogenous in thesetwo approaches; the major focus is on the demand side.
Optimization models try to forecast the future oil supply and pricebehavior, principally of OPEC, using different sets of criterion functionsand behavioral rules, and different specifications of market structure. The
criterion functions usually involve a combination of discounted or undiscounted
total expected revenue streams, "oil in ground" still remaining at the end of
the planning period, or consumer surpluses for OPEC domestic consumers (ifexport and domestic prices are different). The optimal OPEC pricing strategiesin these models are dependent upon the assumptions made about discount rates,internal OPEC structure, size of OPEC reserves, non-OPEC sources of supply,and demand for OPEC exports. The relative importance of these factors varies
across models, and their price-supply projections are not easily comparable.
World energy modeling - via specifying quantitative estimates of
world energy demands and supplies, and incorporating energy sector activities
by fuel types - can ideally serve the dual purposes of providing a surrogfe
for future prices which can be used for decisions on optimal exhaustion
and providing shadow prices for fuel inputs by region and activity. Thecurrent state of the world energy modeling activity falls short of theseobjectives, but improvements are possible. One such area is improvement inthe methodologies for economic growth projections and for estimates of futureenergy/GDP elasticities. Related to this are improvements in the inter-national linkage models for the OECD countries to incorporate a sophisticatedenergy trade model. The impact of reduced OECD economic growth or foreigntrade policies of OECD countries on LDC expected growth prospects can also bestudied with a view to analyzing the balance of payment constraints onLDC oil imports. However, judging from the current status of data avail-ability and conceptual applicability, it seems unlikely that disaggregatedLDC energy demands can be simply incorporated into existing global energymodels to produce better projections of LDC energy/growth relationships.Further, the notable lack of agreement among modelers working on OECD countriesdoes not bode well for similar large, cross-country exercises on LDCs. Per-haps more can be gleaned from careful analysis of individual countries (seebelow).
(Chapter IV) Aggregate Energy/Output Relationships
This chapter deals with studies of aggregate relationships betweenmacroeconomic activity and energy use. Although such studies sometimesanalyze individual sectors, unlike the sector studies described in Chapter V,they focus on the relation of the individual sectors to the economy as awhole. The first part presents results from a number of studies of energy/economic relationships for both developed and developing countries, togetherwith an analytical framework on interfactor substitution based on Berndt andWood (1977, 1979). The studies use a variety of techniques including econo-metric models, input-output analysis and end-use analysis. Some of theeconometric analyses include price terms. Several studies forecast futureenergy demands based on the estimated relationships. The second part discussespolicy models which examine the effects of different demand management andregulatory policies on GDP forecasts and observed economic/energy relation-ships.
Berndt and Wood (1977) have laid out the conceptual issues involvedin aggregate energy economic growth projections. In modeling the relationshipbetween aggregate energy demand and output growth, there are two extremealternative assumptions that can be employed: One is that output (for example,GNP) and energy demand are related by a fixed or time-trended ratio. In thiscase only one level of energy demand is consistent with a (exogenouslyforecast) level of output. This assumption ignores (a) price-induced composi-tional changes in GNP, (b) improvement of energy efficiency by retrofittingand similar measures, (c) substitution of other inputs for the capital-energycomposite (determined by (b) as constrained by technical possibilities)through the employment of new technologies. The alternative assumption isthat the ratio between energy demand and output level is quite flexible sothat different energy demand levels (within a range) can be consistent witha given level of output. This assumption ignores, in contrast to the pointsraised above, that (a) technical substitution possibilities may be quitelimited, depending on the time horizon and particular applications, and (b)even when substitution possibilities are present, some of the substitution
-8-
is likely to involve new capital equipment with different technologicalcharacteristics which, while reducing the energy/other inputs ratio and thetotal costs of production, may yet increase the total demand for energy ifthe output increases are large enough.
Berndt and Wood (1977) also introduce a concept of "utilized capital"- the aggregate of capital and energy - to analyze relationships between thisand other inputs in production. Under the separability assumption of capital(K) and labor (L) from energy (E) and other material inputs (M), the K-L sub-stitution does not depend upon E and M, and both K and L substitute equallywith E and M. Similarly, the assumption of separability of (K and E) from(L and M) means that the K-E substitution does not depend upon L and M,and that both K and E substitute equally for L and M.
Analysis of aggregate energy/output relationships in LDCs is inan early stage not extending much.beyond the crude aggregate or sectoralratios determined for relatively short time-series, or simple regressionelasticities. The relationship between energy consumption and levelsof population, income, economic structure, and energy prices in developingcountries has been quantified in several studies. The broad conclusionsare that the long-run income elasticities are greater than unity, rangingbetween 1.3 to 1.9 depending on the income level category. It has alsobeen shown that inclusion of the structural variables, defined as the sharesof major economic sector (agriculture, mining, manufacturing) in GDP wouldgive relatively lower estimates of income elasticity of energy use. Most ofthe estimates for long-run aggregate price elasticities range between -0.28and -0.38 (although there are notable--mostly higher--exceptions) which appearto indicate that the impact of higher prices is relatively less than that ofincome changes. In view of data limitations (relatively short term time-series) the available results cannot be used to elicit a dynamic adjustmentpath.
The energy/GDP relationships described above have been used toforecast LDC energy demand in a number of studies. Overall, aggregateenergy consumption/demand projections for the LDCs are not very robust.The projections are critically dependent on projections for aggregate economicgrowth and on the assumed or estimated price and income elasticities.
We have also reviewed some of the energy policy models developedfor the United States, particularly the integrated energy/economic modelswhich couple energy system models with macroeconomic or input-output models ofthe economy. The combination of process analysis-type energy system modelsand macroeconomic models helps to identify the integral relationships betweenthe energy sector and the rest of the economy, to analyze the impact ofvarious energy policies on aggregate economic growth via simulation techniques,and to evaluate regulatory options on total energy supply development (suchas a nuclear moratorium). These analyses often highlight the question ofinterfuel substitution and resource definition in a more comprehensive frame-work. Included in this section are some of the major energy policy modelsdeveloped in the US: the Manne (1976a, 1979) ETA/ETA-Macro Models, Brookhaven
Energy System Optimization Model (BESOM) (Hoffman and Cherniavsky) (1974),Hudson-Jorgenson (1974b) DRI model, Project Independence Evaluation Study(PIES), and the work of the Committee on Nuclear and Alternative EnergySystems (CONAES) at the US National Academy of Sciences (NAS).
The applicability of such studies to LDCs is questionable, thoughthey do provide qualitative guidelines in thinking about various possibleinterrelationships. The main problem with applying US or PECD models todeveloping countries is the importance of structural factors (such as sectoraleconomic growth rates and the size and structure of the industrial sector indetermining energy-growth links. A possible fertile area for future researchwould be the application of literature on the structure of development to LDCenergy demand projections.
Relative factor (including energy) prices are but a minor determinantof the developing countries' industrial structures, particularly when these arechanging rapidly. Income effects have already been alluded to. Non-price con-siderations - from government regulations to "quality" and "convenience"characteristics - also influence the choice among various fuel types, andbetween different technologies and sets of capital equipment and thus theaggregate factor choices as well. How important such non-price factors arein the developing countries has not been studied.
Although energy costs are small as a proportion of GDP in developingcountries, they bulk much larger in relation to the balance of payments foroil-importing countries. The literature on the role of the balance of paymentsas a constraint to growth could usefully be applied to explicitly address thelink between higher energy costs and economic growth. Another issue whichdeserves more attention is the effect of short-term price disturbances on theeconomy. An evaluation of the costs of such disturbance could form the basisfor assessing various strategies to reduce the vulnerability of an economyto such shocks.
(Chapter V) Demand for Energy by End-Use Sectors
The available literature classified by end-use sectors (industry,
households, transport, etc.) presents methodological issues and empiricalresults on income and price elasticities, inter-fuel substitution and inter-factor substitution/complementarity. Although several methodologies havebeen used to estimate the relevant elasticity coefficients, the use oftranslog cost functions is found to be advantageous in estimating own- and
cross-price elasticities and inter-factor and inter-fuel substitution. Theranges of estimates that result from comparisons of the many studies arefairly broad, so summary tables have been prepared. One general conclusion isthe sensitivity of elasticity estimates to the particular econometric specifi-cation used.
The questions of energy demand and interfactor and interfuel sub-
stitution in developing countries have been studied at various levels ofsophistication. Two available studies have used the translog cost functionto estimate relations between energy and non-energy inputs in India's indus-trial sector and interfuel substitution in India's commercial energy sector.
- 10 -
The results show that factors other than labor (capital and materials) appearto be fairly good substitutes for energy. The elasticity of substitutionbetween capital and energy varies sigfnificantly among subgroups in theindustrial sector. The conclusion drawn is that since factors other thanlabor appear to be fairly good substitutes for energy, lack of energy aloneshould not be a severe bottleneck to the continued growth of India's manufac-turing sector. However, this conclusion needs to be viewed in the context ofgeneral shortages of capital and other scarce raw materials where savings andforeign exchange constraints may be critical.
These results as well as the general applicability of the translogcost approach to LDCs should be viewed with caution for the following reasons:(a) data on energy demand usually refer to energy consumption which may besupply constrained; (b) much of energy consumption in LDC is accounted for bythe government and public enterprises who may not base energy decisions oncost minimization on account of operating constraints or diverse managementobjectives; (c) user choices among alternative energy sources will usually bedetermined not only by economic considerations, but also, and more importantly,by the qualitative factors of security of supply and ease of use; and (d) formany LDCs the structure of the economy is changing rapidly which will biasparameter estimation for models based on a static structure of energy demand.
Some results available on the analysis of industrial energy demandfor four developing countries -- Brazil, India, Korea and Kenya -- show that:(a) in some cases, composition of fuel sources (mix of oil, coal, etc.)appears more significant in explaining energy demand than does the structureof industrial output; (b) the evidence of the link between the structure ofindustry and the growth of energy demand was mixed: in Kenya the industrialenergy demand grew faster than industrial output, while in Brazil rapid industrygrowth has been accompanied by comparable energy demand increases despite thegreater role of heavy industries in total output; (c) energy-intensivenessin LDC manufacturing sectors, except where the capital stock is relativelynew, is usually greater than in similar industrial countries; (d) energysavings through housekeeping measures and minor investments are possible inall industries, but new technologies are expected to be the determiningfactors in long-run industrial energy demand. However, energy efficiency isusually not the only consideration in technological choice; other factors suchas capital costs and availability of raw materials must also be consideredetc.; (e) interfuel substitution, despite considerations of economic efficiency,may nevertheless conflict with strict conservation efforts for particularfuels. A major gap is the lack of plant-by-plant studies on these technical-economic aspects of industrial energy conservation.
The empirical results for gasoline demand in the transport sector indeveloped countries show that the long-run price elasticity of gasoline demandis considerably larger than the short-run price elasticity. The length of theadjustment period thus seems to be the critical factor in assessing priceresponsiveness. Work by Pindyck (1979d) suggests that it may be as long as 25years. The results for diesel oils, jet fuel and aviation gasoline in developedcountries show a price elasticity of less than -1. The available results fordeveloping countries are confined to Greece, Spain, Turkey, Brazil and Mexico.
- 11 -
The long-run income (GDP) elasticities for motor gasoline and diesel oils usedin the transport sector range from 1.22 to 1.94. There is an almost totalabsence of any in-depth analysis of energy demand, interfuel substitution andinter-modal substitution in the transport sector in developing countries.
The results on household (residential) energy demand in developedcountries show that the own-price elasticity of aggregate energy use inthe residential sector appears to be quite large (-1.1) in the long run.There is considerable variation in price elasticities for individual fuels.Own (total) price elasticities for solid and liquid fuel fall within the rangeof -1 and -1.25, those for natural gas are about -1.7, and those for electri-city are between 0 and -0.4. The above elasticities for the US and Canada are
about half as large as those for European countries. The use of pooledinternational data gives higher estimates, possibly because it is more likelyto elicit long-run elasticities.
Estimates for income elasticities of household energy consumption(total) range between 0.6 and 0.8 in developing countries for which studiesexist. In urban areas, the income elasticity of consumption of commercialfuels is much higher than for non-commercial fuels while in rural areas theelasticities for the two fuel categories are more nearly equal, althoughdisaggregation by income groups may give better insights in the compositionof fuel consumption. Availability of fuels may be an important determinanthere. The studies show that household size affects the estimates of incomeelasticity, although there is little agreement on the magnitude of thiseffect. It does appear, however, that estimating income elasticities withoutcontrolling for household size leads to overestimates of the true elasticities.
Several studies also show that the household consumption of electri-city, LPG, and gas increases dramatically with income, and is a result of tworeinforcing effects: (i) an increase in total fuel consumption among higherincome households; and (ii) their strong tendency to substitute electricityand gas for kerosene, coal, wood, or non-commercial fuels. These results arealso confirmed by relatively higher income elasticities for cleaner and moreconvenient fuels (electricity, kerosene, gas). These conclusions have signi-ficant implications for demand projections for these fuels over time asincomes rise. However, reliable time-series data for intercountry comparisonsof household fuel consumption, particularly of non-commercial fuels, arestill badly needed for proper policy evaluation.
The distributional impact of energy price increases on householdshas not been studied in detail. The results for the US show that both directand indirect impacts of price increases and taxes are regressive. The esti-mates for Indonesia and India show that although kerosene expenditures form asmall proportion (4 percent) of total household expenditures, these are a muchhigher proportion of the out-of-pocket expenses of poor households, especiallyin rural areas.
Overall energy use in agriculture, as well as the scope of inter-factor and interfuel substitution for major operations (ploughing, irrigation,fertilizers), in developing countries has not received much attention in the
- 12 -
literature. Some preliminary estimates of energy use by level of mechanizationshow that commercial energy input per hectare increases with levels of mechani-zation. Available data are inadequate to explain the variations in energyinput by size of farm, cropping pattern, type and level of irrigation, andtype of mechanization.
With the exception of the agricultural sector, the literature on thesubject area covered in this chapter is fairly extensive. Nearly all of it,however, has focused on the industrial countries. Applying those results tosectoral energy usage in LDCs reveals major gaps in knowledge. In the transportsector, for example, where virtually no work on energy use for LDCs has takenplace, the OECD models of gasoline demand for private passenger-transport arelikely to be relevant for only a small portion of the transport sector inmost LDCs. In the industrial sector much of the existing literature ondeveloped countries is relevant, but more detailed analysis needs to beundertaken of the five or six industries that bulk large in LDC industrialenergy consumption (i.e., cement, fertilizer, iron and steel, machinery,petrochemicals, pulp and paper). The broader question of whether the patternsof industrialization in LDCs and the composition of industrial sector outputis biased toward high energy-intensity also needs to be addressed.
Another area requiring further research is that of patterns of energyusage and composition of energy resources in LDC agriculture. Particularlyin light of the recent evidence on technological change in agriculture, cross-sectional comparisons of changes in energy usage patterns would be helpful.Studies on energy-intensities of different crops and on energy requirements ofalternative technologies for various agricultural operations also need to bemade.
(Chapter VI) Integrated Energy Sector Studies and Demand/Investment/Pricing by Individual Fuel Types
Issues related to demand, investment planning and pricing in theenergy sector have been studied both in an integrated framework and byindividual fuel type. Demand and investment planning studies have beenconducted at different levels of sophistication. Some studies for Bangladesh,Mexico, India, Pakistan, and Turkey use formal models (programming or simulationmodels) whereas some other studies for Thailand, Philippines, Sri Lanka,Pakistan and India use less formal approaches.
Integrated sector studies suggest that investment and pricingdecisions in the energy sector require an integrated framework so that signi-ficant linkages among sub-sectors (coal, oil, gas, electricity) are explicitlyrecognized. The interdependence among sub-sectors arises because of the flexi-bility in operation of oil refineries, options in producing different levelsof coal/gas/crude oil and significant possibilities of interfuel substitutionin most of the end-uses. It has been argued that partial analyses limited toindividual energy source are likely to ignore significant substitution pos-sibilities on demand and supply sides and, hence, may result in inconsistentor sub-optimal choices by producers and consumers.
- 13 -
With the exception of electricity tariffs, the literature on pricingof individual fuels is remarkably sparse. Almost nothing has been writtenon the economic issues involved in setting coal and natural gas prices. Muchof the literature on investment and capacity expansion in petroleum tends tobe fairly technical, with data requirements beyond the range available in manydeveloping countries, and also very location-specific. However, both theENERGETICOS model for Mexican energy sector development (though somewhatdated) and the variety of investment studies done for the Bangladesh EnergyStudy suggest potentially useful areas of further research, refinement, andapplicability of other developing countries. The Bhatia (1976) study onpetroleum refining industry in India is also significant for suggestingsimilar work using process analysis models elsewhere. More work is necessaryhere to study the end-use market characteristics of the petroleum products,and the links between those products and other fuels.
Electric sector investment and capacity expansion studies have beenapplied to various developing countries., Possibilities of substitution betweenelectricity and other energy sources at the end-use level need to be studiedfor various end-uses and for different technologies, to determine what policyleverage is possible in shifting a country's overall energy use towards oraway from electricity. Such work would be of considerable use in integratedenergy sector investment planning.
The general conclusion of this chapter is that energy pricing policiesfor individual fuels should be developed within the context of overall energystrategy. Unless substitutions in end-use are clearly identified, and priori-ties for development of indigenous resources are set, the prices of individualenergy products cannot be properly determined. At the same time, more workshould be done on the sub-sector issues involved in coal and gas pricing andon the likely long-term trends in relative petroleum product prices.
- 14 -
Chapter II
Economic Theory of Exhaustible and Renewable Resources
Introduction
The economic theory of exhaustible and renewable resources bears ona number of important pricing and investment issues. This Chapter presents abrief non-technical tour of the economic literature. It leans heavily on theexcellent presentation in Dasgupta and Heal (1979). Other good introductionsmay be found in Peterson and Fisher (1977), Nordhaus (1979), and Micro-Economic Associates (1978). An introduction to the mathematical techniquesemployed in the literature may be found in Intriligator (1971). In general,it must be said that the applicability of the literature to actual problems isstill problematic. Although it deals with very simple models, it is notdifficult to add enough complications to invalidate simple rules relating tothe growth rate of the net resource price and the interest rate.
Energy resources vary by two main attributes, their durability andtheir natural rate of replenishment. Nondurable resources include wind, sun-light, running water, and animal and crop residues. Their present consumptionis not a drain on the wealth of future generations. Durable resources areboth replenishable, such as wood, and non-replenishable, such as coal or oil.Their consumption reduces the future stock available. The following discus-sion is devoted mainly to durable non-renewable resources, but some attentionis given to durable renewables as well.
II.1 Basic Results: Competitive Model, Relation to Optimal Depletion Program
It is simplest to begin with resources that have no appreciable rateof replenishment. The pathbreaking works of Gray (1914) and Hotelling (1931)established the conditions for competitive equilibrium in the resource market.Because resources in the ground are unproductive, the only way that resourceowners can earn a return on them is through capital gains resulting fromprice increases. In an equilibrium with some positive extraction of theresource, the rent or price "in the ground" of the resource must be rising
at the market rate of interest. If the price is rising faster, resourceowners hold all of the resource off the market. If the price is rising moreslowly, all resource owners sell the resource and hold the market asset
instead. This is the fundamental result of exhaustible resource theory,and is referred to as the Hotelling Rule. 1/
1/ The rule is somewhat deceptive in its elegant simplicity. It is oftencited as being directly usable in empirical applications. However, itwill be seen in later sections that various factors such as non-constant
extraction costs and effects of extraction rates on the total stock
complicate this relationship.
- 15 -
Hotelling, as well as Dasgupta and Heal (1974) and Solow (1974b),shows that the Hotelling Rule is a necessary condition for the maximizationof the present value of consumers' and producers' surplus in a partialequilibrium framework. (In the absence of extraction costs, this is thearea under the demand curve.) This implies that a central planner wishingto maximize this surplus would follow the same rules as those which charac-terize a competitive market. To maximize the present value of the surplus,the present value of the marginal surplus in each period must be equal.This requires that the undiscounted marginal surplus grow over time at therate of interest. But the marginal surplus is equal to the price (in thissimple world without extraction cost). Thus a second requirement forefficiency is that the resource price should be set so that the resourceis just exhausted when demand is just choked off by the rise in price.
However, a number of stringent conditions must be fulfilled forcompetitive markets to attain this socially efficient path. 2/ These arereviewed in Dasqupta and Heal (1979), pp.1 0 8-1 1 1 . There must be a completeset of futures markets in the initial period. All participants must bepresent at the beginning. Each agent faces a single budget (wealth) con-straint; i.e., capital markets are perfect. If full information is notavailable about the time when the resource is exhausted, competitivemarkets may not set the proper initial price. If the price is set too low,the resource will be exhausted prematurely. If the price is set too high,demand may be choked off before the resource is exhausted, which would beinefficient.
The non-participation of future generations implies that their pre-
ferences are not represented. The market rate of interest may diverge fromthe social rate of discount. Although individuals have rational groundsfor discounting future benefits because of uncertainty or simply impatience,this is not necessarily appropriate for society as a whole. See Solow(1974b) and Koopmans (1977) for discussions of this. 3/
Other possible sources of market imperfections are externalities.Typically, common resource pools such as oil fields or forests are depletedtoo rapidly or reduced to an inefficient steady-state size because individualactors ignore the opportunity cost of the total resource stock in theirprivate calculations. Market imperfections due to non-competitive marketsare discussed in Section 11.2.
2/ We note without further discussion the general point that any com-petitive equilibrium reflects a certain initial distribution of
wealth which may not be socially "desirable," however defined.
3/ The literature on the appropriate social discount rate is still
quite controversial. See, for example, Arrow and Kurz (1970),Marglin (1967, 1976).
- 16 -
The above results apply to a partial equilibrium model. Dasguptaand Heal (1974), Solow (1974b) and Stiglitz (1974a) have derived the con-ditions for a competitive equilibrium and their relationship to a sociallyoptimal growth path for a general equilibrium model. The model has anexhaustible resource, which together with capital and labor is used to producea homogeneous good which can either be consumed or added to the capital stock.A social welfare function which is a function of consumption in each period isto be maximized.
As would be expected, the optimal path of consumption over timedepends on the specification of the welfare function and the technicalproduction possibilities. Dasgupta and Heal (1979) examine two cases of thewelfare function: maxi-min and utilitarian. In the former, the problem is tofind the highest level of consumption sustainable for the foreseeable future.Since the resource is exhaustible, the crucial question is whether a positivelevel of consumption can be maintained indefinitely or whether productionbased on exhaustible resources is doomed to decline to zero in the long run.This is shown to depend on the elasticity of substitution between capitaland the resource. (In the simplest model, labor is fixed.) If the elas-ticity is greater than one, then capital can grow fast enough to offset thedecline in the resource. As the resource dwindles toward zero, its marginalproductivity approaches infinity. If the elasticity is one, positive consump-tion can be maintained if the share in income of capital is greater than theshare of the resource. In this model, an efficient growth path implies thatthe growth rate of the rent of the resource is equal to the social marginalproductivity of capital at each point in time. This is the general equili-brium equivalent of the Hotelling Rule.
With a utilitarian welfare function, a welfare maximum implies thatthe present value of the marginal utility of consumption in each period isconstant. An important descriptive variable is the consumption rate of in-terest, i.e., the marginal rate of substitution between consumption in differ-ent periods on an efficient consumption path. This rate is shown to be equalto the discount rate plus a term reflecting the growth rate of consumption andthe elasticity of utility with respect to consumption. This is known as theRamsey Rule. 4/ The rate is also equal to the marginal product of capitaland hence, by the Hotelling Rule, to the rate of growth of the rent of theresource. The resource is never exhausted in finite time as long as either(a) it is essential for production or (b) its marginal productivity approachesinfinity as the amount of the resource approaches zero.
Dasgupta and Heal (1974) derive some more specific results aboutthe path of consumption over time using a Cobb-Douglas production function.In a world without technological change, consumption approaches zero ifthe discount rate is positive. If the discount rate is zero, consumptiongrows over time at a rate depending on the elasticity of marginal utility
4/ In honor of his pioneering description of the optimal consumptionpath in Ramsey (1928).
- 17 -
with respect to consumption. The limiting case of zero elasticity producesthe same results as the maxi-min welfare function. If there is technologicalchange and it can be characterized as "resource-augmenting", i.e. equivalentto exponential growth of the resource, then the resource is effectively notexhaustible after all. Positive consumption can be maintained indefinitelyeven if there is no substitutability between capital and the resource(Dasgupta and Heal (1979), p. 207).
Needless to say, a great many assumptions must be made and condi-tions satisfied to assure the existence and optimality of these paths. Prac-titioners argue that the simplicity of the models helps reduce the problemto its fundamental issues (Dasgupta and Heal (1979), p. 9). Critics such asGeorgescu-Roegen (1979) maintain that such simple models are seriously mis-leading because they ignore physical resource and thermodynamic constraints.
Technological Complications
The foregoing discussion has assumed there are no real-worldcomplications such as extraction costs, exploration costs, resources ofvarying grades, etc. In the simplest case of constant marginal extractioncosts, these costs form a wedge between the price paid by the purchaser andthe net return (user cost) of the resource. Since the latter rises at therate of interest, the former rises more slowly. If extraction costs decline,the gross resource price might even decline over some period. Matters aremore complex if the rate of extraction affects the amount of remaining stock.Such an effect occurs in oil fields, for example. This case is analyzed inCummings (1969), Weinstein and Zeckhauser (1975), Heal (1976), and Solow and
Wan (1976). In essence this condition blurs the distinction between arenewable and non-renewable resource, since higher rates of depletion reducethe overall stock. In an efficient growth path the rent of the resource
grows at less than the rate of interest because of the capital gain resultingfrom the increased future output due to saving one current unit of the
resource.
Similarly, if average extraction costs increase with the rate of
extraction, the net price of the resource grows at less than the rate of
interest. The difference is made up by the cost savings resulting from the
fact that the marginal unit of the resource was stored rather than extracted,(Dasgupta and Heal (1979), p. 168). This result is particularly significant
for small deposits of a resource where the shape of extraction costs could
drastically affect the timing of extraction.
Solow and Wan (1976), Weitzman (1976) and Sweeney (1977) have
analyzed the case of multiple grades, i.e., stocks of the resource with
different extraction costs. The fundamental result is that extraction of
a particular grade does not begin until all cheaper grades are exhausted.
This follows from having a positive rate of interest, so that it is better
to delay higher extraction costs. The gross price of the resource grows inpiece-wise continuous fashion, with the kinks occurring at the point of switch-ing from one grade to the next. The gross price never jumps discontinuously.
- 18 -
Otherwise a gain could be made by saving some of the lower cost resource andusing it in a later period when its value has risen more than the rate ofinterest.
Suppose a substitute product is available for the resource atessentially constant cost and effectively unlimited supply. Because theproduct is a substitute, its cost puts an upper bound on the price of theresource. Possible examples are fusion power or (as an approximation) shaleoil. Such a product is commonly referred to as a "backstop technology." Theproblem is to determine the optimal time to switch to the backstop technologyfrom the resource. Given this, one can work backward using the HotellingRule to determine the current price of the resource. Nordhaus (1973) uses aprogramming model with a backstop technology to determine the current competi-tive rent on oil. Heal (1976) considers the case where the marginal extrac-tion cost may be large in early periods because of the effect of extraction onfuture costs. As the backstop is approached, the effect of extraction on costdiminishes, so the resource rent declines and the gross price may actuallydecline as well.
In a world of certainty (uncertainty is discussed in the nextsection) the nature of exploration may not seem intuitively clear. However,it can be viewed as an investment which increases the stock of the resource.Such a characterization implies that resources are perhaps more like conven-tional capital goods than is usually considered (Peterson and Fisher (1977),p. 695). Major questions include the timing of the exploration and theeffects of the interest rate and market structure (see next subsection) onthe amount of "investment." Peterson (1975b) shows that a rise in the interestrate could accelerate extraction initially but retard it in the longer run asreduced investment in exploration reduces the total amount of the stock avail-able for extraction. Peterson (1975b), Gaffney (1967) and Herfindahl andKneese (1974) note that there may be market failure even in competitivemarkets if firms are not able to appropriate the full benefits of theirexplorations. 5/
Uncertainty
Many kinds of uncertainty surround natural resource extraction.These include the size or time of discovery of new deposits and the avail-ability of alternative technologies or other changes in demand. In general,since most utility or welfare functions considered imply risk aversion, onewould expect uncertainty about the future availability of resources to implya slower rate of extraction. Much of the literature is concerned with waysuncertainty can be taken into account by adjusting either the price pathof the resource or the discount rate. The presence of uncertainty meansthat it may be worthwhile to expend effort to acquire information. However,
5/ Investment in research and development to lower extraction costs ordevelop a backstop technology is very similar. See Dasgupta, Healand Majumdar (1976) and Vousden (1977).
- 19 -
the presence of externalities involved in information gathering makes itvery unlikely that the optimal amount of information will be acquired ordiseminated in competitive markets. 6/
Dasgupta and Hill (1974) consider a model where a backstop-typetechnology with known characteristics will become available at an unknownand exogenous date. They show that a simple rise in the discount rateadequately reflects this uncertainty only when existing stocks of capitaland the resource lose all value when the new technology is available.Dasgupta and Stiglitz (1976) make the introduction of the backstop endogenousand consider different regimes of ownership of the resource and the newtechnology. 7/ Long (1975) considers the effect of the probability ofexpropriation on a firm-s rate of extraction. Changing the discount rate isshown to be a poor proxy for this.
Dasgupta and Heal (1979), pp. 427-435. present a model where ex-ploration reveals whether further amounts of the resource are available. Thequestion is when to incur the costs of the exploration. They derive a contin-gent commodity price path for the resources, depending on whether or not moreresources are discovered, which is a straight-forward extension of the Hotel-ling Rule to the case of contingent commodities. 8/ Before or after the pointof exploration, the resource rental grows at the rate of interest. After theexploration, price rises or falls discontinuously depending on whether or notmore of the resource is found. In any period, however, the price for suredelivery of the resource is the average of the price under each state ofnature weighted by the probability of that state occurring. It grows at therate of interest as well. However, it is not shown whether or not the levelof the average price at any time is greater than the certainty-equivalentprice.
A major problem arises if a central planning agency solves thisproblem and announces the optimal exploration date. Obviously speculatorshave a large incentive to make the exploration themselves and make huge
6/ There is a large literature on the definition of and the necessaryconditions for the existence of a competitive equilibrium underuncertainty. The source of this theory is the Arrow-Debreu theoryof contingent commodity markets. See Radner (1970, 1974) andGuesnerie and Montbrial (1974). Another large literature dealsexplicitly with the implications for competitive equilibrium oftreating information as another good. These are well summarizedin Dasgupta and Heal (1979).
7/ Dasgupta, Heal and Majumdar (1976) and Vousden (1977) also considerthe effect of uncertainty on investment in research and development.
8/ Suppose that on a certain date there are a number of possible statesof the world, each with some probability of occurring. A contingentcommodity is a good available in a particular state of nature. See
Dasgupta and Heal (1979), p. 379ff.
- 20 -
capital gains on the outcome. On the other hand, speculators themselvescannot reap all the benefits of their exploration if their actions alertother investors. Gilbert (1975a, b) has also dealt with private and socialincentives for collecting information. He argues that too much informationis acquired by speculators in trying to predict future prices and not enoughfor predicting actual resource depletion. Gilbert (1980) also derives theoptimal amount of exploration and storage with uncertain reserves.
Pindyck (1979c) develops a model where only future demands andresource reserves are uncertain and vary in a continuous gradual way ratherthan in the discrete jumps discussed above. Present demand and reservesare known with certainty. He finds that neither demand nor reserve uncer-tainty affects price dynamics in competitive or monopolistic markets iffirms are risk-neutral, demand is linear, and extraction costs are constant.Hotelling's Rule still applies. Relaxing these assumptions affects boththe price and extraction paths, however. Exploration has value only ifextraction costs depend on reserves.
A certain literature has grown up around the notions of "irrevo-cable decisions" and "option values." 9/ The basic idea is that somedecisions such as the exhaustion of resources are irrevocable because theyforeclose certain production and consumption possibilities to society inthe future. In the presence of uncertainty, society may prefer moreflexible strategies which increase the number of options open to it in thefuture. This may imply that risk premiums or "option values" should beattached to the prices of resources subject to exhaustion. Dasgupta and Heal(1979), pp. 149-50, argue that the mere fact of irrevocability or exhaustionis not economically significant. What matters is the likely impact on futureconsumption possibilities. If capital or other inputs can be substituted forthe resource, then society is not necessarily worse off. On the other hand,"slowly" revocable decisions may be quite costly as well.
Open Economies
The case of an open economy, where an exhaustible resource or asubstitute may be imported or exported, is very important for LDCs. However,the literature on exhaustible resources in open economies is quite small.According to Dasgupta and Heal (1979), p. 313, if an economy is small, boththe price of the resource (assuming it is tradable) and the rate of return onother assets are given exogenuously. Therefore, if the country (in somesense) is risk-neutral, production and price paths are determined independent-ly of the characteristics of the country's own welfare function. This is astraightforward extension of the result from trade theory that a country'soptimal production point is determined by fixed terms of trade, regardless of
9/ Two of the original sources are Arrow and Fisher (1974) and Henry(1974a, b).
- 21 -
its own preferences. Of course this assumes away all imperfections incapital markets. If the country has some market power in the resourcemarket but not in the asset market, then it produces so that marginal rent,not rental price, grows at the rate of interest.
Aarestad (1978) analyzes a model of an open economy which canaccumulate capital either through saving or by trading an exhaustibleresource. 10/ It is assumed that the price of the resource is exogenous andthat there is an exogenous upper bound on the extraction rate of the resource.He derives the optimal extraction and consumption paths for the country.The extraction rate depends on the original capital intensity of the economyand the rate of increase of the resource price. Extraction rates increaseover time only if the price rise exceeds some minimum rate.
The situation is more complicated if the resource is not tradeddirectly. There is no explicit theoretical model with this feature, butthe problem is discussed in Munasinghe (1980a), Munasinghe and Schramm (1980),Siddayao (1980), and Jacoby and Stern (1980). If the resource is not a subs-titute for a tradable good, then the pricing and extraction of the resourcefollow the pattern for the closed economy model. Munasinghe and Schramm(1980), pp. 17-19, argue that if the resource is tradable or is a substitutefor a tradable, the rental price of the resource depends on the time when thesubstitution takes place. If the resource has an essentially infinite supplyand its use does not affect imports or exports at the margin, then there isno resource rent and its opportunity cost is the full marginal supply cost.On the other extreme, if export or substitution possibilities exist, the rentquickly rises to the level indicated by the world price of the substitute.They assert that most cases will fall in between these extremes with only agradual transition to world price pricing as domestic reserves are exhausted.
However, it is not clear from their discussion whether they consider a case
where both the domestic resource and the imported substitute are used simul-
taneously for an extended period of time. This might happen if the reservesof the resource are not very large but the extraction rate is constrained sothat only a fraction of domestic demand is met. In this case, Jacoby andStern (1980), pp. 7-25, argue that the resource should be priced accordingto the world price, since a reduction in its use would require added
imports. 11/
11.2 Market Structure
The theory of imperfectly competitive markets does not have direct
implications for the pricing of resources in project evaluation (unless
the country has market power). However, it does provide a basis for predict-
ing future movements of world energy prices. See the related discussion of
models of OPEC behavior in Section 111.2 as well.
10/ See also Vousden (1974).
11/ These issues are discussed for individual fuel types in Chapter VI.
- 22 -
A monopolist seeking to maximize the present value of profits fromthe sale of the resource will allocate sales over time so that the presentvalue of marginal rental rather than rental price is equal in all periods.Therefore the marginal rental grows at the rate of interest. However, therental price does not generally grow at the rate of interest unless the ratioof price to marginal rental is constant, i.e., the demand curve has constantelasticity. 12/ For example, if a price rise makes demand less elastic, theprice rises faster than marginal rental. The question is: how do the mono-polistss extraction and price paths compare with the competitive ones?Several authors, including Weinstein and Zeckhauser (1975), Stiglitz (1976)and Kay and Mirrlees (1975), cite cases where the monopolist's extractionpath is faster than the competitive one because if demand is inelastic itwants to reduce the amount of the resource available as quickly as possible.However, the consensus argument (Dasgupta and Heal (1979), p. 328, Petersonand Fisher (1977), p. 695) advanced by Stiglitz (1976) is that demand islikely to be more elastic at higher prices because more substitutes will beavailable. Therefore the monopolist will extract the resource more slowly toretard the time when its price enters the elastic range of demand.
In the case of imperfect competition, it is well known that nosingle model of market behavior is widely accepted. The case of duopolywith a Cournot-Nash equilibrium is reviewed in Dasgupta and Heal (1979)p.337. In such an equilibrium, each resource owner maximizes his ownprofits in response to the policy of the other. The analysis is similar tothe case of monopoly although the divergence from the competitive path isless. As the number of participants increases, the solution approaches thecompetitive extraction path.
A case with obvious applications to predicting OPEC behavior isa von Stackelberg-type model with a cartel and a competitive fringe. Thisand similar models have been analyzed in Dasgupta and Stiglitz (1976),Khalatbori (1976), and Gilbert (1978). The competitive fringe acts as adrag preventing the cartel from setting the profit-maximizing price. Thebest policy from the cartel's point of view is to keep prices low at firstand allow the competitive fringe to meet most of demand so that its stocks arequickly depleted. 13/ Simulations of OPEC behaviour by Cremer and Weitzman(1976) and Pindyck (1976) generally confirm this analysis. 14/ The Cremerand Weitzman study has the price of oil rising hardly at all in real terms(about $10/barrel) in the first 20 years from 1975, with OPEC productiononly a fourth of the total. However, after forty years the price of oilrises to $21/barrel and OPEC production occupies 80 percent of the total.The estimates of non-OPEC reserves were found to significantly affect OPEC'spredicted behaviour.
12/ This argument also assumes constant extraction costs.
13/ See also Salant (1976) and Schmalensee (1976).
14/ See also Hnyilicza and Pindyck (1976).
- 23 -
Some authors, including Dasgupta and Stiglitz (1976) and Heal(1976), have examined the case of a cartel in the presence of a backstoptechnology. The backstop puts a ceiling on the price the cartel can charge,so it holds price just below the backstop level until the resource isexhausted. Some initial price rise may occur depending on demand conditions.
11.3 Taxation and Leasing
Dasgupta and Heal (1979) give a good summary of the allocativeeffects of a number of tax schemes relative to a pre-tax competitive equi-librium. 15/ A surprising number of different schemes turn out not toaffect the competititve rate of extraction, at least in a simple model wherethe amount of the resource is fixed. This is because, like land, the totalamount of the resource is supplied inelastically in the long run, so the onlyproblem arises with the effect of the tax on the timing of the extraction.As long as the per unit tax rises at the rate of interest and is less thanthe unit rental, the competitive extraction rate is unaltered. The taxsimply imposes a capital loss on the resource owners. Such taxes include asales tax equal to the tax rate on interest income, and a "true economic"depreciation allowance. A royalty based on the gross price of the resourceis equivalent to an increase in extraction costs. It results in higherinitial prices and slows the rate of extraction. A depletion allowanceintroduces a distortion as well if it is based on the gross price rather thanthe rental price, leading to an excessive extraction rate. 16/
Taxation is more likely to have distorting effects on extractionif the stock of the resource is endogenous, either through exploration orthe effect of extractive rates. Intuitively, if the supply of the resourceis elastic, the standard presumption in favor of relatively heavy taxationof resources is reduced. Any tax which reduces the marginal return on theresource will reduce exploratory activity, and hence the available stock ofthe resource. A depletion allowance which accelerates extraction alsoreduces the amount of resource (Dasgupta, Heal and Stiglitz (1980), p. 30).
The effects of leasing of prospective reserves can be consideredas taxation under uncertainty about reserve size. Leland, Norgaard andPearson (1974) argue that if firms are risk-averse, the front end paymentsrequired by normal leasing procedures may result in insufficient developmentof government reserves. This suggests that some of the risk should be borneby the lessor government, e.g. royalty or profit-sharing. However, these
15/ Examples of the effects of taxation of petroleum products are given inSection VI. 3.
16/ Many of the above ideas first appear in Gaffney, ed. (1967), particularlythe contributions by Scott, Herfindahl, Steele and Vickrey. A wealth ofinstitutional detail on the U.S. is also included. See also the con-tributions to Brannon, ed. (1975), and McDonald in Kalter and Vogely,ed. (1976).
- 24 -
mechanisms also have efficiency losses. For example, if royalties are too
high, a firm may not find it profitable to develop a reserve after it exploresit, even if some oil is discovered. (Peterson and Fisher (1977), p. 698.) 17/
Leasing procedures imply certain strategic behaviour by biddersthat could be taken advantage of by the lessor. Rothkopf (1969) and Wilson(1975) find that if the lessor passively accepts the highest bid, then theexpected winning bid is less than the expected value of the reserve. Thisis because bidders would win a disproportionate share of contracts for whichtheir evaluations were too high unless they scaled down their bids. Theexpected winning bid increases with the number of bidders. Gaskins and Vann(1975) provide some empirical evidence for this effect.
A separate literature has grown up around the issue of correctivetaxation for market imperfections due to common resources. Such problemsare more applicable to fisheries than mines or resource fields because of
the difficulty of appropriating the resource. (See the section on renew-able resources below). This is also not likely to be a problem if theexploring and extracting agent is a single government body, or holder of
a lease which is likely to be the case in LDCs. Peterson (1975b) discussesboth extractive and informational externalities in oil exploration andsuggests appropriate tax remedies.
11.4 Renewable Resources
Renewable resources are those which exhibit some significant naturalrate of regeneration. Forests which provide fuelwood are perhaps the mostrelevant examples for LDCs. 18/ The classical example in the literature is thefishery. Helpful summaries are given in Dasgupta and Heal (1979) and Petersonand Fisher (1977). The basic theoretical work includes Smith (1968, 1975yand Brown (1974).
Introduction of the natural growth rate implies a modified versionof the Hotelling Rule for extraction over time. The rate of increase of theresource rent plus the growth rate of the resource (i.e., the own rate ofreturn of the resource) should equal the interest rate. In other words, theprice increase need not be as fast because the resource owner is compensatedpartially by the physical increase in the stock. Since in most biologicalpopulations the rate of growth of the stock depends nonlinearly on the size ofthe stock, the equilibrium rule also determines a steady state size of the
17/ For a simulation study of several different leasing policies in anIndian setting, see Tyner (1978). His results are discussed at greaterlength in Chapter VI.
18/ For references to forestry with applications to U.S. policy, see GaffneVY(1960), Samuelson (1974), and Howe (1976).
- 25 -
resource. It is a general result that this steady state is equal to the"maximum sustainable yield" of the resource only when the social discountrate is zero (Dasgupta and Heal (1979), pg. 129). 19/
If the renewable resource is treated as a "commons" (i.e., itis not owned by the extractors) and is exploited under competitive marketconditions with free entry, there are two sources of inefficiency. In thecase of a fishery, a static externality occurs because individual boats donot take into account the "crowding" effect their fishing effort has onraising the fishing costs of other boats. 20/ Since the social marginal costthen exceeds the private marginal cost (equal to average costs under freeentry), this leads to an excessive number of boats. Similar externalitiesoccur in, for example, an oil field with multiple wells or a woodlot withmany collectors. The second inefficiency is dynamic and occurs becauseindividual fishermen do not own the fishery. Regarding it as a free good,they simply maximize current profits without regard to the effects oftheir efforts on the value of the stock. In general, this leads to over-fishing in the short run but in the longer run reduces the fishery to asmaller than optimal size. 21/ In a similar way, one would expect to seetoo rapid a depletion of a forest if ownership is not well defined, andhence its "user cost" not captured.
The above description suggests the nature of the corrective taxinstruments that would be needed for competitive markets to yield theoptimal outcome. A tax on each fish would have two components: the usercost implied by the above discussion about the relationship between thenatural growth rate and the interest rate, and an externality tax equal tothe gap between social and private marginal cost. 22/ Although a number ofstudies have noted the problem of externalities, 23/ none has been found whichaddresses the issue of user cost. Even those studies which do recognize, forexample, the effects of erosion on firewood collection have not dealt with it
19/ It is important to keep in mind that the simplest cases of exhaustibleand renewable resources usually analyzed have quite different properties.The exhaustibility of the exhaustible resource implies a rental pricegrowing at the rate of interest. Models of renewable resources tend tostart with the case of a constant price and a steady state size of theresource with equal rates of growth and extraction. However, if theresources are substitutes, these assumptions may be inconsistent.
20/ In the case of fuelwood there may be added externalities due to erosion.See Munasinghe (1980a).
21/ See Peterson and Fisher (1977), pp. 688-89.
22/ See Peterson and Fisher (1977), p. 690.
23/ See Bhatia and Niamir (1979), Bhatia (1977), Parikh and Parikh (1977),Sanghi and Day (1976), and FAO (1979).
- 26 -
in the quantitative ways suggested by a shadow pricing framework. This is duemostly to a severe lack of information. For example, using branches and twigsfor fuelwood has far less environmental impact than using cut logs, so it isnecessary to determine the specific kind of collection taking place. 24/
One issue that has received a great deal of attention is how toidentify and value the alternate uses of a resource and the other inputsreleased by using the resource in a given investment to make the relevantcomparisons for a social cost benefit analysis. For example, the imputedbenefits of biogas may vary substantially depending on whether it is assumedto replace kerosene for lighting or cow-dung for cooking. 25/ Moreover, theopportunity cost of cow-dung depends upon a number of factors difficult toestimate, including whether it is used primarily for manure or soil structure,and the amount and form of nitrogen it contains. 26/ Because many fuelsources may not have markets, valuing them is a complex matter requiringshadow prices for different kinds of labor and land. These issues arediscussed at greater length in Chapter VI.
11.5 Social Benefit Cost Analysis and Energy Projects
Given the simplicity of the models discussed above, one may wellask what relevance their results have for the energy planner in a developingcountry. A more realistic framework would include many more constraints,both institutional and those implied by a feasible planning methodology.Institutional constraints would include distortions of various factor prices.Planning constraints arise because of limitations on data and other resources.Lastly, the government will have many socio-political goals besides those ofeconomic efficiency, such as income distribution and independence from externalshocks. Nevertheless, even within this more restricted framework there maystill be room for significant choices in the pattern of extraction and useof indigenous energy resources. In this case, "correct" pricing of theseresources, both for evaluation of investments and allocating demand, is stillimportant. What is needed is to embed the previous insights from exhaustibleresource theory into a more explicit social benefit cost framework. In thissection we give a brief overview of the essential methods and requirementsof social cost benefit analysis and discuss one application found in theliterature for determining the user cost of natural gas.
Overview of Social Benefit Cost Analysis
It is beyond the scope of this report to review the theoreticalunderpinnings of social benefit cost analysis. What follows is a summaryof the stages of analysis, the kinds of information required, and a briefliterature review of some of the more important works in the field.
24/ See Bhatia and Niamir (1979).
25/ deLucia and Bhatia (1980), p. 15.
26/ Ibid., pp. 18-19.
- 27 -
Some of the basic sources for project evaluation are Little andMirrlees (1968, 1974) and UNIDO (1972), 1978). 27/ Their approaches arebasically similar, although the UNIDO approach is more practical becauseit does not assume that the project evaluator has the ability to correctexisting distortions in the economy. The UNIDO method can be broken downinto the following five stages, each of which leads to a measure of thesocial benefit of the project:
(M) Calculation of financial profitability at marketprices;
(ii) Shadow pricing of inputs and outputs to obtain netbenefits at economic (efficiency) prices,
(iii) Adjustment for the project's impact on savings andinvestments,
(iv) Adjustment for the project-s impact on incomedistribution; and,
(v) Adjustment for the project-s production of goodswhose social values differ from their economicvalues.
The first step is to determine whether decentralized economic unitswould be led by the market to make the proposed investment. The second stepdetermines whether the project is socially efficient after correcting fordistortions in market prices and the discount rate arising from taxes, subsidiesand other constraints. The third step relates to economies with sub-optimalgrowth rates where a premium is needed to reflect the higher marginal value ofinvestment over consumption. The fourth and fifth steps implicitly or explic-itly are adjustments for a social welfare function that may, for example, putspecial weight on the incomes of certain groups or the consumption of certainkinds of goods.
The above discussion suggests that a social benefit cost analysisrequires reasonable estimates of the following national or regional parameters:(i) social rate of discount, (ii) shadow price of labor, (iii) shadow foreignexchange rate; (iv) shadow price of investment (savings); and (v) weights onincome distribution. In many cases, the estimates of these parameters arespecified by the national/regional planning agencies, and project authorities
27/ Theoretical discussions relating to cost-benefit analysis as well ascase studies are available in Roemer and Stern (1975), Dasgupta andPearce (1972), Marglin (1967), Mishan (1976), Lal (1974) and Harberger(1971). Manuals and guidelines for project appraisal have been issuedby the World Bank (L. Squire and H.G. van der Tak (1975), OverseasDevelopment Administration, London (1972) and the U.S. Agency forInternational Development (1974).
- 28 -
must use them on a uniform basis. However, in the absence of officiallyspecified values for these variables, efforts may be required to estimatethem for individual countries. 28/
Discount Rate
Because of the key role that the discount rate plays in the deter-mination of the price of exhaustible resources and the many thorny issuesinvolved in determining it, some discussion of these issues is appropriatehere. This discussion is derived from that in Jacoby and Stern (1980).
Selection of an appropriate rate of discount has been the mostcontroversial issue in social cost-benefit analysis, and the projectappraisal literature abounds with competing recommendations as to whatthe discount rate should be. 29/ Controversy over the appropriate rate ofdiscount would not arise in an undistorted economy as there would existonly one (market) rate of interest which simultaneously would be the(social) marginal efficiency of investment and the consumption rate ofinterest. In an economy with perfectly functioning capital markets, butone in which taxes are levied on savings and on income from capital, thesocial discount rate r , is a weighted average of the consumption andinvestment rates of inierest r and r., the weights being the shares of(increments to) borrowing that come at the expense of consumption andat the expense of foregone investment. To put the matter differently:the economic rate of return r. is what the funds now channeled to the newinvestment project would have earned if the new project were not undertaken,while the rate of time preference r measures the opportunity cost of theadditional savings or reductions in consumption that occur in response tothe funding needs of a new project. Note that in this case the socialdiscount rate will generally be below the economic return to investmentand above the consumption rate of interest.
Some authors argue that the above analysis is invalid because govern-ments are unable to achieve an optimal level of savings. An alternativeprocedure is to shadow price capital and discount future costs and benefits ata consumption rate of interest (see UNIDO, 1972 and Little and Mirrlees, 1974).There are, however, also reasons for questioning this approach. First, if thegeneral public recognizes that public sector depreciation funds or net incomemust be partly saved rather than consumed, or if government policy is such asto ensure this outcome, the social discount, rd, defined above is appropriate(Sjaastad and Wisecarver, 1977). Second, data limitations may severely restrictthe analytic tools that could be used in estimating a shadow price of capital
.and a consumption discount rate.
28/ The studies available include Mishra and Beyer (1976, Appendix III)for India, Roemer and Stern (1975) for Ghana, World Bank (197 7a)for Ivory Coast, World Bank (19 79g) for Colombia, FAO (1979) forKorea, and deLucia and Jacoby (1980) for Bangladesh.
29/ See, for example, Harberger (1973) and Sjaastad and Wisecarver (1977).
- 29 -
Application to Natural Gas Valuation
The choice of discount rate is particularly important in estimatingthe "user cost" of depletable resources. The application of a high discountrate results in a low present value of the resource and would thereforeencourage maximum immediate use for domestic purposes and perhaps export.The application of a low discount rate results in a high present value of theresource, and would discourage immediate use and practically exclude theconsideration of export opportunities. Jacoby and Stern (1980) present adetailed analysis of how to determine the "value in the ground" of naturalgas in Bangladesh. 30/
They argue that the opportunity cost of the natural gas is either theprice of imported oil it substitutes for in other uses domestically or thef.o.b. export price if the gas is exported. The problem is to determine thetime when the substitution takes place. In the analysis, they assume thatthere are no constraints on the production and transport of gas, so thatall demand for gas can be met by domestic supplies as long as reserves ofgas exist. This implies that the relevant opportunity cost of the gas is theprice of imported oil at the time the domestic gas runs out. Since theprice of oil is assumed to be exogenous, it is the "backstop" price whichdetermines the price of gas at the time of substitution. As discussed inSection II.1, this price, together with the size of the reserve, the specifi-cation of demand, extraction costs, and the discount rate, determines theprice path and rate of extraction of the gas reserve.
In the Bangladesh calculations, there was insufficient basis forestimating the demand function D(p). Rather, the study used a simple fore-cast of gas use D based on plans already adopted by the government forvarious forms of homestic and industrial consumption. Such an evaluationof the opportunity cost of gas, pt, is only self-consistent if the marginalgas use in each period, as determined largely by government planners, actuallyhas a benefit equal to p . This was assumed to be the case for uses ofnatural gas outside the particular choices under investigation in the study.Uncertainty about demand was modeled by examining the effects of severaldifferent demand scenarios on the model.
In the Banglades 2Energy Study, the quantity of gas reserves in
Bangladesh was set at 9xl0 SCF. It is possible to calculate the reserveadequacy, i.e., the number of years for which the gas reserve can meet
domestic demand for particular programs of gas-using projects. In the
scenarios prepared, three levels of adequacy were used; 30, 40, and 50 years.
Three different price paths of world oil were also considered.
Discount rates used in the gas calculation were somewhat lower than
those used in the investment analysis. For example, in the reference case 10
percent was used for the gas calculation and 15 percent for the investment
30/ See Chapters 7-10 in de Lucia, Jacoby, et al, (1980).
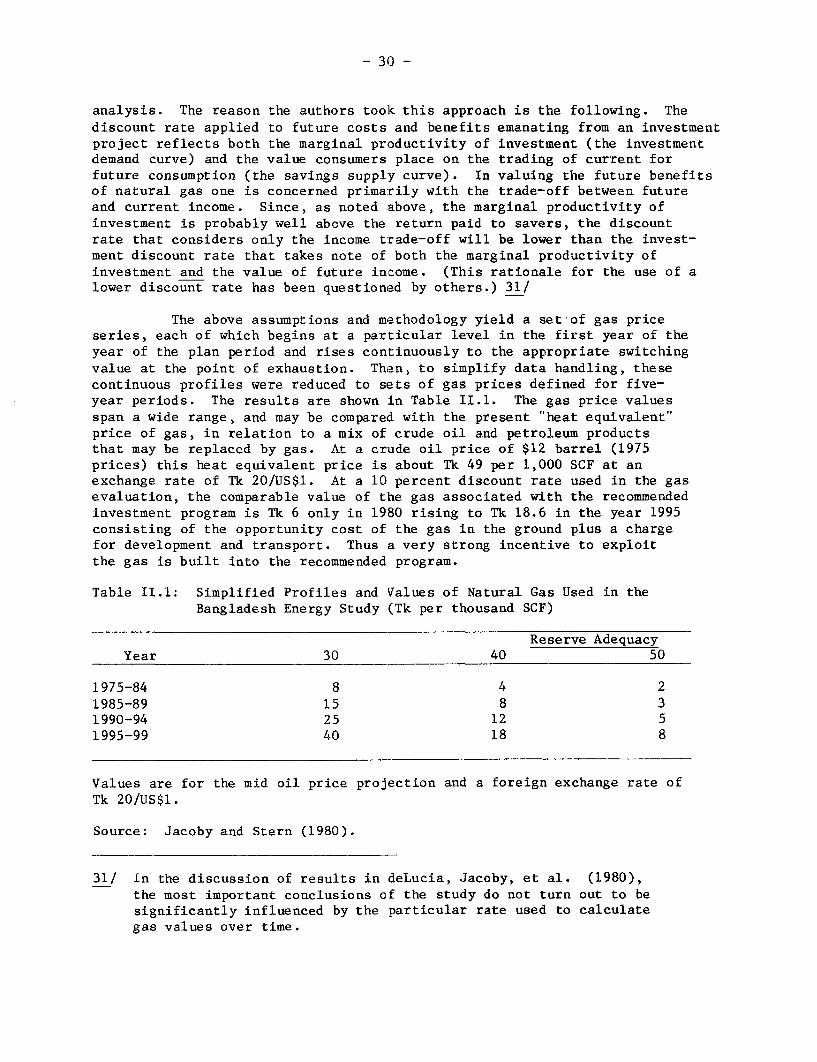
- 30 -
analysis. The reason the authors took this approach is the following. Thediscount rate applied to future costs and benefits emanating from an investmentproject reflects both the marginal productivity of investment (the investmentdemand curve) and the value consumers place on the trading of current forfuture consumption (the savings supply curve). In valuing the future benefitsof natural gas one is concerned primarily with the trade-off between futureand current income. Since, as noted above, the marginal productivity ofinvestment is probably well above the return paid to savers, the discountrate that considers only the income trade-off will be lower than the invest-ment discount rate that takes note of both the marginal productivity ofinvestment and the value of future income. (This rationale for the use of alower discount rate has been questioned by others.) 31/
The above assumptions and methodology yield a set,of gas priceseries, each of which begins at a particular level in the first year of theyear of the plan period and rises continuously to the appropriate switchingvalue at the point of exhaustion. Then, to simplify data handling, thesecontinuous profiles were reduced to sets of gas prices defined for five-year periods. The results are shown in Table II.1. The gas price valuesspan a wide range, and may be compared with the present "heat equivalent"price of gas, in relation to a mix of crude oil and petroleum productsthat may be replaced by gas. At a crude oil price of $12 barrel (1975prices) this heat equivalent price is about Tk 49 per 1,000 SCF at anexchange rate of Tk 20/US$l. At a 10 percent discount rate used in the gasevaluation, the comparable value of the gas associated with the recommendedinvestment program is Tk 6 only in 1980 rising to Tk 18.6 in the year 1995consisting of the opportunity cost of the gas in the ground plus a chargefor development and transport. Thus a very strong incentive to exploitthe gas is built into the recommended program.
Table II.1: Simplified Profiles and Values of Natural Gas Used in theBangladesh Energy Study (Tk per thousand SCF)
Reserve AdequacyYear 30 40 50
1975-84 8 4 2
1985-89 15 8 31990-94 25 12 51995-99 40 18 8
Values are for the mid oil price projection and a foreign exchange rate of
Tk 20/US$1.
Source: Jacoby and Stern (1980).
31/ In the discussion of results in deLucia, Jacoby, et al. (1980),the most important conclusions of the study do not turn out to besignificantly influenced by the particular rate used to calculategas values over time.
- 31 -
Summary and Conclusions
The literature on the theory of exhaustible resources has grownenormously in the last several years and has been extended to encompass anumber of important real world complications. The basic feature of exhaus-tible resources is that their efficient allocation implies that somescarcity value be attributed to them because their present consumptionentails some cost to society in terms of the future consumption foregone.This scarcity value was shown to depend on a number of factors, includingthe size of the initial stock relative to consumption, the discount rate,the availability and price of substitutes, extraction costs, and uncertain-ty. The basic theoretical result is that the resource should be viewed asan asset; in an efficient intertemporal allocation of resources, the netmarginal return on this asset (including changes in the unit value of thestock, changes in the size of the stock, and savings in extraction costs)should be the same as for other assets in the economy, e.g. capital, aswell as the social rate of discount. It was shown under what assumptionsallocation by competitive markets is socially efficient, both in partialand general equilibrium frameworks.
The basic model has been extended to deal with a more realisticdescription of resource extraction economics and possibilities of substi-tution. These include extraction costs which vary with the rate of extrac-tion and the size of the stock, the possibility of a backstop technologywhich might substitute for the resource in the future, the possibility ofincreasing reserves through exploration, and uncertainty about future demand,reserves, and extraction costs. Some aspects of resources, such as externaleffects arising from extraction from a common pool and externalities in thecollection and dissemination of information, imply that competitive marketswill not lead to an efficient allocation of resources. Divergences betweensocial and private rates of return may also cause the competitive extractionpath to differ from one that is socially efficient.
Thus far little attention has been devoted to the case of anopen economy where the resource may either be used domestically, substi-tute for an import, or be exported. (Much of the discussion of backstoptechnologies is formally similar, however.) In part, the problem becomessimpler beause the world price of the resource or its substitute is assumedto be exogenous. This is analogous to the result from static trade theorythat if a country's terms of trade are fixed, its optimal production pointdoes not depend on its preferences. There is general agreement that evenif a resource is not traded, as long as it substitutes at the margin for a
traded good, the world price of the traded good, suitably adjusted fortransport costs, etc., determines the opportunity cost of the resource.However, a number of problems remain in determining the timing of the
substitution (and thus the meaning of marginal use) and its effect onthe opportunity cost. More work needs to be done to link the theoretical
models with the methodology for empirical studies of depletable resource
(especially natural gas) utilization.
- 32 -
A great deal of the literature on exhaustible resources focuseson the behavior of noncompetitive resource markets. This body of theoryhas been used to forecast the likely behavior of petroleum prices underthe OPEC cartel. Such forecasts form the main use of this theory that isrelevant to developing countries, since few have the ability to affectworld resource prices. The potential emergence of substitutes at higheroil prices (a "backstop" technology in the extreme case), other changesin demand, and the size of reserves outside the cartel are shown to beimportant limiting factors on cartel behavior.
The literature on the taxation of natural resources has analyzedthe allocative effects of various kinds of taxes using relatively simpleassumptions about extraction costs, uncertainty, etc. In general, taxationcan have more serious distorting effects when the amount of explorationeffort significantly affects the reserves available. A related literature onleasing derives the responses of firms to various bidding and leasing arrange-ments.
The theory of renewable resources is formally very similar tothat of exhaustible resources, the main complication being that the stock ofthe resource has a growth rate which depends on endogenous variables such asthe size of the stock as well as certain other parameters. Thus, if theresource is considered as an asset, part of its return may accrue throughprice increases and part through physical growth of the resource. The classicexample considered in the literature is the fishery, although fuelwood isprobably the most relevant example for LDCs. There is a need for modelswhich include factors important in the case of fuelwood or agriculturalresidues, e.g., external effects due to erosion, and substitution possibili-ties among food, fuel, fertilizer, and fodder uses.
Most of the theoretical literature on exhaustible or renewableresources is devoted to questions of "first best" pricing. However, for itto be applicable to the problems of energy pricing in LDCs, the frameworkmust be expanded to deal with institutional distortions in an economy suchas taxes and subsidies as well as nonefficiency goals such as income dis-tribution, financial viability of agencies, and energy independence. Thisis the link between energy pricing and social benefit cost analysis. Theliterature devoted to this link is still quite scanty. One important issueraised by Jacoby and Stern (1980) was how to separate the determination ofthe social rate of discount and that of the shadow price of capital, and,more realistically, how to proceed when data to calculate these are lacking.Because of the crucial role of the discount rate in the pricing of exhaus-tible resources, further work is needed in this area. An area where thegeneral principles are agreed upon but the details remain to be elaboratedis that of shadow pricing inputs such as labor and land in the evaluationof investments in renewable resources. Little or no literature has beendirected to questions of how to price resources in the presence of other
distortions in the economy or to meet non-efficiency objectives such asincome distribution and energy self-sufficiency.
- 33 -
Chapter III
Analysis of International Energy Markets
Introduction
The dramatic increases over the last thirty years in the volume ofinternational petroleum trade, and the more recent rise of the Persian Gulfand North African producers to their commanding market share position, haveproduced conditions so that it is relevant to discuss the "global energymarket." Although petroleum accounts for only a part of the total energyresources, some of which are not tradable, the potential substitutabilitybetween petroleum and other types of energy implies that national energyplanning decisions need to take into account the likely path of futurepetroleum prices and its effect on other energy resource markets. This hasbecome all the more necessary since the dramatic increases in the worldprice of oil since 1973.
In this chapter we examine the literature concerned with inter-national energy resource flows and markets. In Section III.1 we reviewsome of the descriptive, scenario-building approaches to international energydemand and supply such as Workshop on Alternative Energy Strategies (WAES)(1977), World Energy Conference (WEC) (1978a,b), and others. We shall alsoinclude some of the more formal models of international energy demand, such asHouthakker and Kennedy (1978), which attempt to simulate the impact of changesin assumed values of different parameters (e.g., price and income growthrates).
III.1 International/Regional Energy Supply and Demand
Studies of global energy supply and demand can be divided by geo-graphical coverage (most of them are limited to "world outside communistareas" [WOCA], and their level of coverage is not uniform across regions), bytime horizon (short, medium, or long term), or by their purpose (descriptive,simulation, scenario-buildinq, normative). They can be further identified bythe range of activities they cover, the number of energy resources theyinclude, inclusion of interfuel and interfactor substitution possibilities,endogenous determination of some of the demands, and by the mathematicaltechniques they employ. There are also diverse world views and institutional/political assumptions which guide the methodologies and substantive resultsof individual studies, but we shall ignore such considerations in this liter-ature review. 1/
We shall here follow Gately (1979) and Ulph (1980), classifyinganalyses of world energy markets in three categories: (a) energy balanceapproach; (b) simulation studies, and (c) optimization models.
1/ The reader should also refer to Section IV.1, which deals with energydemand at the national level.
- 34 -
Energy balance approaches are rather informal, lacking explicitformulations of functional relationships among variables, but richer ininstitutional and social-environmental details of the scenarios they workwith; the scenarios have an assumed price path, with additional assumptionsabout world economic growth, oil reserves, availability of substitutes, andenergy policy stances by governments. They do not consider how differentcomponents would evolve over time or respond to exogenous changes simul-taneously. The test of consistency is applied primarily to the balancing ofenergy supplies and demands, but not as to whether potential imbalances wouldtrigger off expectations of price rises, changing the assumptions about thescenarios; equilibrating mechanisms are not specified. Examples of energybalance approach include OECD (1977), WAES (1977), and U.S. CIA (1977). WEC(1978b) is also included here, though their demand models are considerablymore sophisticated.
Simulation models deal with a set of hypothetical price paths, usingassumptions on the values of parameters such as demand growth rates, discountrates and price elasticities of demand and non-OPEC supply. These models areless analytical than the optimization models, in that endogenous determinationof some of the variables is not attempted, but they are more analytical thanthe energy balance approach. The simulation models include Blitzer-Meeraus-Stoutjesdijk (1975), Kennedy (1974), Kalymon (1975, model II), Ben Shahar(1976), Eckbo (1976), Fischer-Gately-Kyle (1975), Houthakker-Kennedy (1978),U.S. FEA (1974), and Ezzati (1976a,b).
Usually the projections are made using one-time (current) estimatesof reserves and comparing them with projections of demand growth under aceteris paribus assumption, which, of course, would result in projecting a"gap" between supply and demand at a future date. Such is the view adoptedby some major studies such as WAES (1977), WEC (1978b), U.S. CIA (1977), andOECD (1977). Critics of these procedures essentially argue that the ceterisparibus assumption is invalid both in the medium and long terms since additionsto reserves of conventionally-produced petroleum (CPP), both within OPEC andelsewhere, continue to be made, and changes in technology and economics, inthe production and recovery as well as in end uses, can be expected to changethe essentially static views of scenarios. 2/ We shall take up some of thesalient elements of this debate in Section 111.2 as well.
World Energy Conference (WEC) (1978a,b,c)
The overall approach of the WEC is one of scenario building. 3/Assumptions are made about growth of demand and supply, modified to produceconsistent scenarios. Primary energy is forecast based upon assumptions about
2/ Representative of this view is the quote from Adelman and Friis (1974,pp. 275), "Oil resources are of course finite since the earth is finite,but nobody knows where the limits are."
3/ The energy demand model used by WEC is developed by Cavendish Laboratorygroup at Cambridge University, UK. See Eden (1979).
- 3 5 -
income growth and energy prices using a simple constant elasticity demandfunction: income elasticities are 0.95 in the OECD region and 1.1 elsewhere,and price elasticity is 0.3 everywhere. World income growth is assumed to beeither 4.2 percent (high) or 3.0 percent (low) annually. Average primaryenergy prices in 1974 terms are assumed to behave in one of three ways: nochange, 80 percent rise (with oil prices rising 400 percent); and 120 percentrise (with oil prices rising 800 percent) over the entire time range till 2000.All of the projections based on price rise produce inconsistent scenarios,therefore, demand projections for oil are revised. For this, an oil demandmodel using disaggregated sectoral and fuel demands is developed, assumingseparate constant elasticity demand functions for each sector. Transportsector and feedstock demands for oil are then scaled down; in other sectors,demand for fuel oil is constrained by supply limitations and other fuels'shares are increased. Since even these adjustments produce an inconsistencywith high income growth scenarios, further adjustment is made employing lowerincome (i.e., output) elasticity for energy, reflecting conservation possi-bilities. Thus energy conservation and income growth appear to involvetradeoffs. As in other models based on supply constraints, this is essentiallybecause of the binding (exogenous) supply constraints and because prices arenot allowed to vary to equilibriate demand and supply.
Workshop on Alternative Energy Strategies (WAES) (1977)
The WAES approach is similar to the WEC one: demand and supply areprojected for each region under four sets of income, price and policy assump-tions. Explicit income/price elasticities are absent. Adjustments forinconsistency are again made by assumptions of fuel substitution and strongerconservation measures. The time period is divided into 1977-1985 and 1985-2000.In the first period, all four possible combinations are consistent with highgrowth scenarios requiring stronger conservation measures. In the secondperiod, three more sets of assumptions about additions to oil reserves, OPECproduction ceiling, and replacement fuels (coal or nuclear) are also employed.Again, consistent scenarios depend upon the availability and choice of replace-ment fuels. Non-conventional sources of energy are excluded from the supplyside.
The WAES study involved considerable effort on the part of indi-vidual country teams, 4/ and the range of methodologies at the national levelvaries widely from detailed econometric studies of individual sectors for theUS to crude energy/GDP ratios. Integration of individual country studies foreach time period, fuel and scenario was made in two ways. In the unconstrainedversion, simple aggregation was used, resulting in imbalances between oilimport demands and oil exports, for example, or surpluses of coal or nuclearpower. The alternative choice via a constrained integration using an LPGlobal Energy Minimization Model was to allocate fuels to various demandcategories so as to minimize total fuel costs. This results in substantialswitches to coal and nuclear power.
4/ "Separate volumes for country demand and supply projections are publishedin Basile, ed. (1977), and Martin, ed. (1977).
- 36 -
Wolf, Jr., et al. (1980) have used a detailed econometric model toforecast the total oil consumption of non-OPEC LDCs in the years 1980, 1985and 1990. They estimate short-run, medium-term and long-term income and priceelasticities of oil consumption for 77 LDCs, using an instantaneous adjustmentmodel and a lagged-adjustment model separately. Separate estimates are alsoderived using country dummy variables. Based on assumptions about aggregateeconomic growth and population growth, oil consumption requirements in 1980,1985 and 1990 are forecast using the regression estimates of elasticities andtwo forms of the dependent variable-aggregate and per capita. Their resultsshow the relative effects of different sources of uncertainty in each par-ticular scenario. Table III.1 presents some of the results on LDC oil consump-tion forecasts.
Other studies in the same category are US C.I.A. (1977), OECD (1977),and IIASA. 5/ The CIA report uses simple energy/GDP ratios to project CECDtotal energy demand, then reduces it to allow for assumed conservation impact,and adds in the rest of the WOCA demand based on energy/GDP projections. (GDPgrowth rates are given assumed values.) OECD energy production is similarlyforecast based on current and projected developments. Simple aggregation,combined with projection of a rising Soviet demand for oil imports, results inprojecting a "gap" by the mid-1980s, at which point prices are supposed to risesharply. The OECD study is similar to the WAES study, based on scenariobuilding. Demand projections are made using energy/GDP ratios and assumedincome elasticities (aggregate), then by a series of steps similar toWAES or CIA, net oil import demand is arrived at.
For all these studies, oil import demand is treated as a residual(=Total energy demand - non-oil production- oil production - non-oil netimports) and since all of the variables involve considerable uncertaintyor errors in judgement, the range of error for oil import demand can in somecases be several times larger.
IIASA has engaged in both large scale global energy system modelingand in maintaining an updating system for cataloging energy system modelingelsewhere. 6/ Their own work includes both a broad global system analysis,concentrating on persistent long-term trends in the global economy (population,demographic shifts, trade) as they relate to energy questions, and specific
5/ Hafele (1981).
6/ Results of IIASA work are available in IIASA Research Reports, publishedindividually until 1979 and in the journal IIASA Reports from 1980 on-wards. (Parikh and Parikh, 1980, for example). A complete presentationis available in (Hafele, (1981), which could not be included in thisreview. See Beaujean, Charpentier, and Nakicenovic (1977) for IIASA'scontinuous review of energy models. IIASA's other works on global energyresources are reported in Grenon, ed. (1979a,b). IIASA-sponsored con-ferences included IIASA (1979), Nordhaus, ed. (1977).
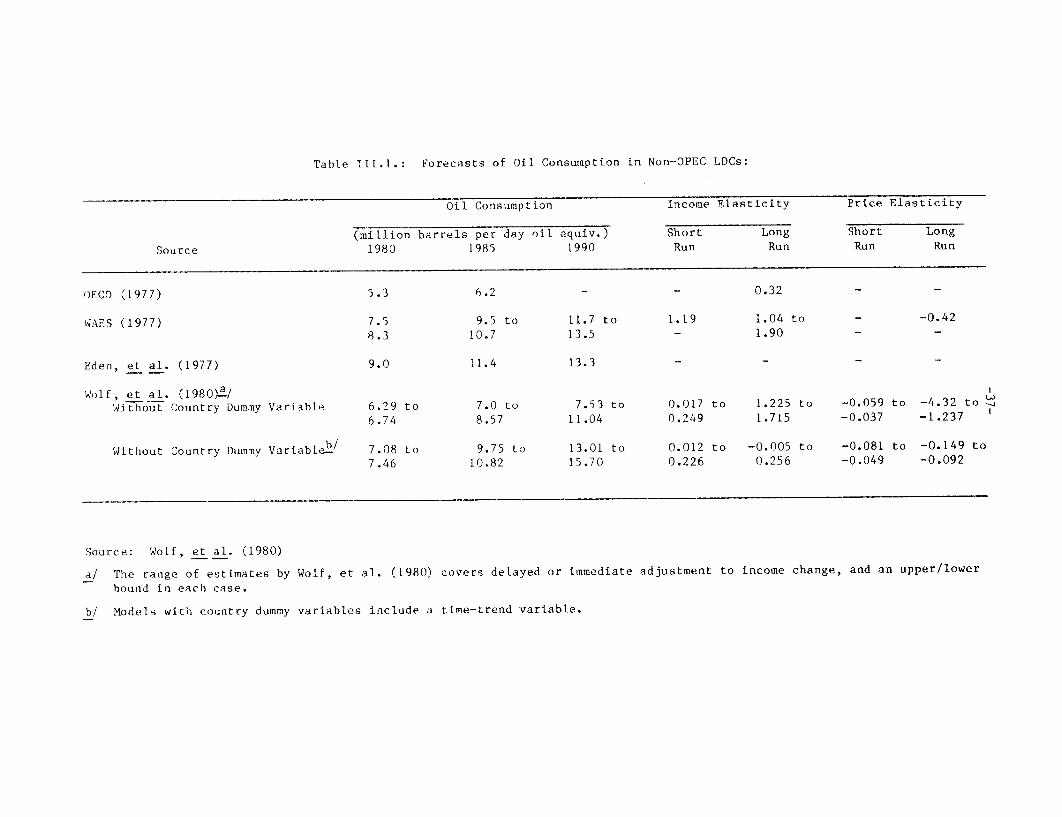
Table I1.I.: Forecasts of Oil Consumption in Non-OPEC LDCs:
Oil Consumption Income Elasticity Price Elasticity
(million barrels per day oil equiv.) Short Long Short Long
Source 1980 1985 1990 Run Run Run Run
OECD (1977) 5.3 6.2 - - 0.32 -
WAES (1977) 7.5 9.5 to 11.7 to 1.19 1.04 to - -0.42
8.3 10.7 13.5 - 1.90 - -
Eden, et al. (1977) 9.0 11.4 13.3 - - - -
Wolf, et al. (1980).±Without Country Dummy Variable 6.29 to 7.0 to 7.53 to 0.017 to 1.225 to -0.059 to -4.32 to
6.74 8.57 11.04 0.249 1.715 -0.037 -1.237
Without Country Dummy Variableb/ 7.08 to 9.75 to 13.01 to 0.012 to -0.005 to -0.081 to -0.149 to
7.46 10.82 15.70 0.226 0.256 -0.049 -0.092
Source: Wolf, et al. (1980)
a/ The range of estimates by Wolf, et al. (1980) covers delayed or immediate adjustment to income change, and an upper/lower
bound in each case.
b/ Models with country dummy variables include a time-trend variable.
- 38 -
projections for global energy demand and supply in medium term range. For theformer, a good summary is available in Hafele and Sassin (1977). The discus-sion here on the latter is adopted from Basile (1980).
Their approach is also one of scenario-building based on assump-tions about population and economic growth rates regionally. The world isdivided into seven regions: North America; Soviet Union and Eastern Europe;Western Europe, Japan; Australia, New Zealand, South Africa and Israel; LatinAmerica; Africa (except Northern and South Africa); China and CentrallyPlanned Asian Economies. Based on the basic demographic and economic growthassumptions, energy consumption patterns are calculated. Combined withassumptions or judgements about secondary fuel mix and substitutions, theenergy supply and conversion picture is assessed. Two'other models analyzeeconomic impacts and macroeconomic scenarios.
Kennedy (1974) presents an international, multi-commodity model,including such activities as production of crude oil, transportation, refining,and consumption of refinery products (gasoline, kerosene, distillate fuels,and residual fuel). The (non-Communist) world has been divided into sevenregions: United States, Canada, Latin America, Western Europe, Africa, Asia,and the Middle East. Regional crude oil supply equations, producer demandequations, refining technology, as well as governmental policy parameters areexogenous inputs to the model, which then determines crude oil production,international transport of oil, refinery capital structure, refinery outputand consumption of oil products by region. The impact of governmental fiscalor regulatory measures is analyzed by simulations.
Houthakker and Kennedy (1978) present a variant of Kennedy's earliermodels. Theirs is a model characterizing the market structure, which is usedto simulate the effects of changes in such exogenous factors as tanker tech-nology, the cost of finding and producing oil in remote areas, and changes ingovernmental policies on trade, environmental restrictions, and taxation.The model is organized into four submodels including crude oil production,transportation, refining, and consumption of products. It is a regional,multi-market, qeneral equilibrium model. The (non-Communist) world isdivided into US, Canada, Latin America, Europe, the Middle East, Asia, andAfrica. Demand projections are made in line with assumed income and priceelasticities and income growth rates at the aggregate level; supply projec-tions are similarly made in terms of supply elasticities, information on newconventionally produced petroleum (CPP) sources and new fuels, governmentsubsidies of oil production, refining costs, and trade restrictions. Foreach region and commodity the model determines the equilibrium prices andquantities of consumption, production refinery capital structure, and patternof trade flows.
Brodman and Hamilton (1979) have made a comparison of 78 studiesdealing with energy demand and supply projections in the year 1985. The rangeof sophistication of these studies varies; however, they report that thelowered expectations of aggregate economic growth projections account for asignificant reduction in projected energy demands in the post-1973 studies. Agradual revision of energy/GDP elasticity parameters also seems to have taken
- 39 -
place in these models. Highest standard deviations were reported in thetotal OECD domestic production (particularly Canada) of CPP and the totalOECD nuclear power generation capacity on the supply side. 7/
111.2 OPEC Supply and Price Behavior
The analyses we have reviewed in Section III.1 - both the energybalance studies and the forecasting models - have a common characteristic,namely that they regard the world energy prices and supplies as exogenous.Since in most aggregate cases oil (CPP) is taken as the residual fuel (i.e.,the energy demand not met by other fuels), the world price and supply of oilbecome the most important issues. Further, nearly all analyses also assumeOPEC to be the marginal supplier, i.e., providing all the oil that is not metby non-OPEC sources; here again the issue of demand responses to price orOPEC-s pricing strategy are important to analyze.
We do not discuss here the whole range of issues involved in analyz-ing the market structure of the world petroleum industry, but refer the readerto Adelman (1972), Jacoby (1973), Blair (1976), Penrose (1968) and Mikesell(1971). An important characteristic of this market is its non-competivenature and the roles of different economic agents - oil companies, producercountry governments, consumer country governments, and final industrial andhousehold consumers. We concentrate on the behavior of the producer countrygovernments since that determines the production and pricing decisions ofOPEC.
Official pronouncements of OPEC and its member governments, aswell as several analyses of world energy markets reviewed in III.1, stronglysuggest that the world petroleum supplies are expected to be exhausted in amedium-term span of less than forty years, i.e., by 2020. They thereby alsosuggest a scenario for sharply rising oil prices, even in a competitivemarket, as extraction costs rise and the quantity demanded at any given price(in the vicinity of the current prices) exceeds the quantity that may besupplied, by OPEC and non-OPEC producers combined. Further, they also suggestthat the current "high" (as compared to pre-1973 or pre-1971 prices) pricesmay be explained by OPEC's considerations of exhaustibility. Some of theanalytical models of OPEC behavior (such as Blitzer-Meeraus-Stoutjesdijk,1975) we shall review in this subsection also incorporate such objectives asmaximizing the "value in the ground" for OPEC.
Several authors take a strong exception to such views; M.A. Adelmanand other members of the World Oil Project at MIT are representative. Accord-ing to their view, (a) projections of "gaps" in the world petroleum market are
7/ Also see Allen, Edmonds and Kuenne (1979) who similarly emphasize theimportance of economic growth projections and energy/GDP ratio parameters.They report that with a 1985 estimate of OPEC installed capacity of 37 to41.5 million barrels per day (mmbd) and an average 1985 OPEC oil demandprojection of 39 mmbd, accuracy of demand projections within 4 or 5 mmbdbecomes crucially important, and such accuracy is plainly unachievable.
- 40 -
seriously flawed since they assume non-clearing markets and ignore the usualprice-quantity adjustments that may be expected; (b) projections of demand forOPEC oil are also subject to considerable uncertainty and qualifying assump-tions; and that, (c) OPEC supply and price behavior cannot be explained interms of its considerations of exhaustibility.
Following their argument, and the discussion in Section II.1, theoptimal rate of depletion of an oil reservoir depends on expected prices,costs, and discount rates. For a competitive firm, present and future pricesand discount rates are external facts. It makes decisions for expansiondepending upon asset management choices. The comparison of present and futureprices must have a specific time frame: for example, at 7 percent interestrate, and an expected price rise at the same rate, the net value of a barrelten years hence, discounted to the present, would be a little greater than itsvalue today (assuming constant costs). But, as Adelman and Jacoby (1979a)argue, it does not follow that prices would continue to rise for thirty orforty years in the same fashion, there is a prohibitive uncertainty and riskin forecasting prices that far ahead. It ought to be recognized that, atthe current output levels and current levels of proved reserves, the -excess-capacity' members of OPEC such as Saudi Arabia or Kuwait have roughly threeto six decades before exhaustion. This means that the barrel of oil notproduced today is going to wait for decades for production. By restrictingoutput, Saudi Arabia is not appreciating the value of oil-in-ground, thepresent value of the far-off benefits is essentially zero, even withoutallowing for inherent risks. Under a cartel, even if the future value of thebarrel not produced today were zero, it would not be produced today. Thecomparison of oil price changes with interest rates is simply irrelevant fora monopolist or a cartel.
It is difficult to judge from the observed behavior of OPEC whetherto regard it as a cartel or a dominant-firm monopoly. It is possible that thetruth may alternate, depending upon market conditions. If OPEC can be thoughtof as composed of a two-part cartel, with "core" and "price-taker" countries,at times the price-taker countries may produce at full capacity and the corehas to be the residual supplier, whereas at other times the entire cartel hasto agree on sharing production.
Adelman (1978) also argues that there is a great uncertainty asto the net residual demand for OPEC oil: the uncertainty emanates fromvarious factors which potentially can be expected to reduce the demand forOPEC oil: increased natural gas production as well as crude oil production inthe non-OPEC sources of supply (United States, North Sea, Mexico), variationinduced by macroeconomic fluctuations, oil trade of the communist countries.He argues that potential reduction in demand, under the current circumstances,would strain OPEC, but that if Saudi Arabia were really the restrictor ofthe last resort, it would not have an interest in raising the price, sincethe proportionately much greater benefits would occur to other members ofOPEC. The alternative of market sharing is not very practical, he argues:
"(A)ny model of the OPEC nations as either a cartel or a dominantfirm monopoly is much too simple. Both models have elements
- 41 -
of the truth. Indeed, the knowledqe that Saudi Arabia could ifneed be serve as restrictor of last resort is a strong backstopto the cartel. It strengthens the willingness of the other largeproducers to restrain output." (p. 12)
Depending upon which view is taken - to treat OPEC as a monolithicmonopoly, as a dominant-firm monopoly, or as a two part cartel - one mayspecify bahavioral rules and objective functions to study alternative pricingstrategies OPEC may adopt. Now we shall review some of the dynamic simulationand optimization models for this purpose. 8/ Due to complexities of modeling,these models use relatively simple demand and supply specifications, and thegenerality of conclusions on optimal price paths is limited only to theseforms.
Ezzati (1976b) has used a static simulation structure similar tothat of Kennedy to identify the 1980 equilibrium in the world petroleummarket. He employs a set of macroeconometric models for each of the OPECcountries, embedded in a model of the world oil market, to examine the impacton OPEC stability of the problems raised by imbalances between actual anddesired export revenues of each individual country. The major difference isin the elasticities employed, and the results differ considerably. He usesalternative OPEC tax rates ranging from $4 to $18 per barrel and argues thatthe (then) present OPEC prices are not optimal (i.e., too low) in terms ofmaximizing revenue and that a $14 to $16 price range would satisfy this
purpose.
Blitzer-Meeraus-Stoutjesdijk (B-M-S, 1975), Eckbo (1976), Gately-Kyle-Fischer (1978), and Ben-Shahar (1976) present further developments usingstatic or dynamic simulation techniques. Dynamic simulation allows consider-able room to discuss variations in OPEC prices and market adjustments. B-M-Ssuggest that there is a tradeoff for OPEC between higher prices today (permit-ted by an inelastic short-run demand curve) and market share in future (asnon-OPEC production and alternative fuels reduce the demand for OPEC oil).They use several criterion functions to identify the "best" pricing strategythat can meet the dual objectives of revenue maximization and maintenance ofmarket share: these include (1) the present value of the net revenue streamover the planning period plus the present value of oil left in the ground(at the end of this period), (2) the present value of net foreign assetholdings in each period, plus the present value of oil left in the ground, and(3) undiscounted values of the net foreign asset holdings plus of oil left inthe ground. (The planning horizon extends until 1995). B-M-S evaluate the
relative merits of different price trajectories for either of the two situa-tions where OPEC as a whole has to prorate output or where, as a two-partcartel, the "core" OPEC countries act as price-maintaining residual suppliers.In Kalymon (1975), optimal price trajectories are derived both for monolithic-OPEC and for several sub-OPEC coalitions. The objective function is the
8/ Reviews of OPEC models are presented in Gately (1979), Hammoudeh (1980)and Choucri (1979). Also see Gately's (1980) brief note where hesuggests that the 1985 oil prices may be as high as forty-two 1979
dollars.
- 42 -
present value of net benefits accruing to the price-setting residual supplier,which is the sum of net revenue from oil sales to both domestic and foreignconsumers and the consumers' surplus obtained by domestic buyers. Thisseparation of demand functions permits an examination of optimal price dis-crimination policies. The results show both domestic and export pricesincreasing steadily, reaching the substitution price (of the "backstop, fuel,specified exogenously) within a planned exhaustion period of fifty-two years.The sensitivity analyses he has performed for the equilibrium prices show thatthe discount rate, substitution price, and export market growth are thecrucial parameters.
The Cremer-Weitzman (1976) model employs two types of economicagents: OPEC and "the competitive fringe." The net OPEC demand here isexplicitly derived as the difference between the total demand and the com-petitors' production. OPEC chooses the prices so as to maximize its dis-counted profits given the competitive reaction functions. Knowing thoseprices, the competitors maximize their discounted profit given their cumula-tive cost function and capacity constraint. Saudi Arabia is not consideredseparately as a price setter. Instead the study considers OPEC as consistingof the oil producing countries in North Africa and the Persian Gulf, becausethe authors believe they constitute the "monopoly kernel of OPEC."
Cremer-Weitzman predict that prices do not increase significantlyduring the first twenty years, but increase sharply in later periods. If thefringe is able to increase capacity without limit, prices would be dampened inthe first twenty years but would remain practically unchanged for later years.The authors also perform sensitivity analyses with respect to discount ratesfor OPEC and the fringe and the assumed demand growth rates. Moderate changesin costs and reserves have negligible effect on prices and production.
The Hnyilicza-Pindyck (1976) model is based on the Pindyck (1976)model of cartelization of exhaustible resources. It divides the cartel intotwo groups: "savers" (Saudi Arabia, Iraq, Libya, Kuwait, Bahrain, and Qatar)and "spenders" (Iran, Venezuela, Indonesia, Algeria, Nigeria). The formerhave large reserves and are interested in holding the prices low (theirdiscount rate being lower) so as to maintain both production and revenuesfairly high, whereas the latter have a higher discount rate, and an immediaterevenue need that can be met by higher current prices and close-to-capacityproduction. (Higher prices imply lower capacity utilization for the "saver"countries.) The model computes optimal bargaining solutions using Nash-Cournottheory for alternative assumptions about market shares (fixed or variable).
Pindyck (1978) develops another dynamic optimal pricing model for amonopolistic oil cartel, with an objective to maximize discounted profits.The demand equation is based on aggregate time series data and allows for asimple one-year adjustment lag, as well as an autonomous demand growth.Average costs are supposed to increase with resource depletion, so exhaustionconstraint is not introduced explicitly. Adjustment lags in the model resultin projecting that the optimal price strategy would be to increase pricesinitially, then reduce and increase them gradually as the cost considerationspredominate.
- 43 -
Eckbo (1976a) similarly uses two OPEC views to examine the optimalprice trajectory: a monolothic-OPEC version, and another version where OPECis divided into three subgroups: the "core," the "price-pushers," and the"expansionist fringe." A variety of market sharing rules are also examined.These simulations point to potentially severe problems of output restrictionsfor OPEC.
Other studies on optimal OPEC pricing and production behaviorinclude Ezzati (1978), Ben-Shahar (1976), Bohi-Russell (1975), Tourk (1977),Kosobud and Stokes (1980 a,b), and Fixler and Ferrar (1975). The two surveysby Hammoudeh (1980), and Gately (1979) provide further references. Table111.2, adapted from Hammoudeh (1980), presents some of the results of themodels of OPEC price behavior. With the exception of Ezzati, the "finalprice" projections for years ranging from 1990 to 2047 are uniformly at orbelow actual prices in 1980.
Conclusion
Analysis of global energy markets, particularly the forecastsof OPEC supply and price behavior, are beset with problems of considerable
uncertainty and judgmental errors. There is first of all the uncertaintyabout the total energy demands, which emanates from the inability to forecast
aggregate national/regional economic growth rates, and the wide margins forjudgmental errors in using aggregate energy/GDP elasticity parameters. Next,there are the uncertainties about non-oil energy resources as well as the
non-OPEC sources of oil, including Mexico. It is also unclear how effective
energy conservation programs, particularly those using pricing instruments,will be over the medium and long term. If drastic recessionary measures are
used to control energy demand (particularly oil imports) this may result in
significant welfare losses. Finally, there is also the uncertainty about OPECobjectives, how OPEC pricing decisions are or would be made, and how unfore-
seen political events may affect the availability or price of OPEC oil. In
view of the uncertainty and unreliability of the forecasts of future pricepaths, policy makers should evaluate their plans against a variety of importsupply and price scenarios.
An entirely different set of questions arises with respect to sharp
price rises, temporary or permanent. Global energy studies have little to say
in this respect, probably because such situations are largely unpredictable
and also because analysis of options is country specific. Analytical research
on these subjects is lacking. For both project evaluation purposes as well as
market pricing the time horizon is essentially long-run. However, an appro-
priate methodology for devising contingency plans to deal with sharp price
rises or temporary supply shortages would be useful for many LDCs who are
essentially marginal actors in the global energy market.
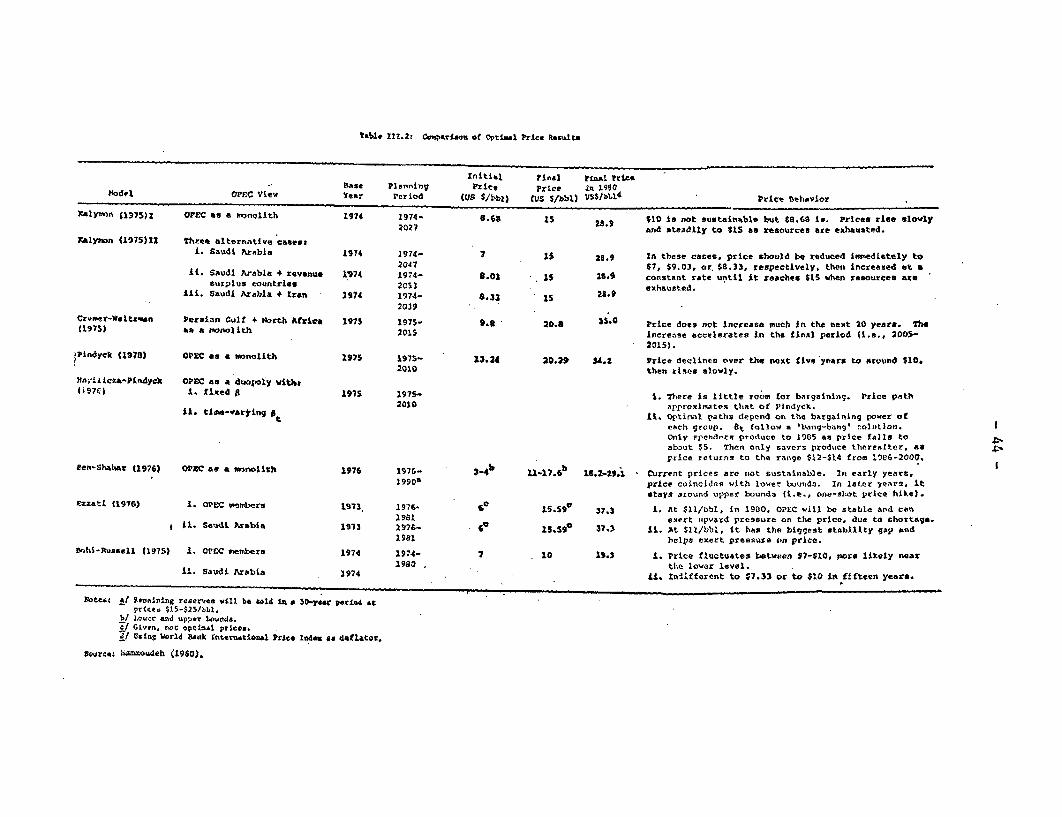
Table 1I.2t Cosparson of Optimal Price Results
Initial final rinAl is.Base planning Price Price in 191014d4,l OPEC View Year Period (US (US (US/bbl) S$/blt Price behavior
$10 is not sustainnble but $6.68 Is. Prices rise slowlyXAlYm)n (1975)1 OPEC as a mnolith 1974 1974- 8.68 i 28.9 ndseiyto$.asrorcsare exhausted.8'2027 and steadily to $ as resourcesKalymon (1975)12 three alternative cases
1. Saudi Arabia 1974 1974- 7 15 1g.g In these cases, price should be reduced Ihediately to2047 $7, $9.03, or. $6.33, respectively, then increased at a11. Saudi Arable + revenue 1974 19744- 8.03 i1 26.9 constant rate until it reaches $15 when resources are
surplus countries 2053 exhausted.iLL. Saudi Arabia + tran 1974 1974- 8.33 15 huse
2039Cremer-eltsan Persian Gulf + North tfrica 197$ 1975- 9.8 20.8 3 Price does not increase mouch in the next 20 years. The(197S) as a monolith 2015 increase accelerates in the final period (i.e., 2005-
2015).Plndyck (1978) OPEC as a anolith 1975 1975- 13.24 20.29 34. Price declines over the next five years to around $10.
2010 then rises slowly.Mnvilicza-Pindyck OPEC as a duopoly Viths(i97c 1. Kixed a 1975 1975- 1. There is little room for bargaining. Price path
2010 aprroximates that of Pindyck.1. timea-varying ti. Optirnil paths depend on the bargaining power ofeach group. Bt follow a 'bang-bang rolutlon.
Only rpendors produce to 1905 as price falls toabout $5. Then only seavers produce thereafter, as
& 1price returns to the range $12-S14 from 196-2000.fen*Shahar (1976) OPEC as a uoonolith 1976 1976- 3-4 U-17.66 18.2-29.1 Current prices are not sustainable. In early years.
1990s price coincides with lo.er bounds. in later ye%rs, itstays around upper bounds (i.e., one-sot price hike).
XzZatt (1976) 1. OPEC Mebers 1973. 1976 15.59 37.3 1. At $11/bbl, in 190. OPEC will be stable and can1961 exert upward pressure on the price, due to shortage.
t IL. Sa*44t Axabia 1973 1976- o15.sd9 37.1 11. At $1l/bbl, it has the biggest stability gap and1981 helps exert pressure on price.
Wohi-russell (1975) 1. OPEC meibers 1974 1974- 7 10 19.) 1. Price fluctuates between $7-410, Fore likely near1980 the lower level.
11. Saudi Arabia 1974 I. Zndifferent to $7.33 or to $10 in fifteen years.
Notes. a/ Iterinint reserves will be sold in a 50-year period atprices $15-525/bbl.
b/ Lowr and upper bounds./1 Given. noc optInal prices.
Using World Bank International Price index a d4flatot,
Sourcs. bannoudeh (1980).
- 45 -
Chapter IV
Aggregate Energy/Output Relationships
Introduction
This chapter deals with studies of aggregate relationships betweenmacroeconomic activity and energy use. Although such studies sometimesanalyze individual sectors, unlike the sector studies described in Chapter V,they focus on the relation of the individual sectors to the economy as awhole. Section IV.1 presents results from a number of studies of energy/economic relationships for both developed and developing countries, togetherwith an analytical framework on interfactor substitution based on Berndt andWood (1977, 1979). The studies use a variety of techniques including econo-metric models, input-output analysis and end-use analyses. Some of theeconometric analyses include price variables. Several studies forecast futureenergy demands based on historically estimated relationships. In Section IV.2we report on policy models which examine the effects of different interven-tions on GDP forecasts and economic/energy relationships. The focus of thesemodels is to predict the effects of demand management and regulatory policies,not to evaluate investment plans. (For the latter, see Section IV.1).
IV.1 Energy Consumption and Economic Growth
Analyses of relationships between aggregate economic growth andenergy consumption are used to project future energy demands, to compare(either historically or cross-sectionally) the variations in aggregate energyintensity, and to analyze the impacts of availability and price of energyinputs at the macroeconomic level. Here we discuss some of the conceptualissues involved in energy/economic interactions, the relationship betweenenergy consumption and economic growth and projections of aggregate energydemand in developing countries based upon energy/output ratios (assumed orestimated).
Berndt and Wood (1977) have laid out the conceptual issues involvedin aggregate energy economic growth projections. In modeling the relationshipbetween aggregate energy demand and output growth, there are two extremealternative assumptions that can be employed: one is that output (for example,GNP) 1/ and energy demand are related by a fixed or time-trended ratio. Inthis case only one level of energy demand is consistent with a (exogenouslyforecast) level of output. This assumption ignores (a) price-induced compo-sitional changes in GNP, i.e., reduction in the utilization rate of theexisting capital stock in energy-intensive applications with correspondingunemployment, and increases in utilization rates elsewhere to produce substi-tute outputs; (b) within the limits of technical possibilities of substitution
1/ With modification the argument is similar for sectoral aggregate output.
- 46 -
between existing capital stock and energy inputs, improvement of energyefficiency by retrofitting and similar measures, (c) substitution of otherinputs for the capital-energy composite (determined by (b)), again constrainedby technical possibilities, and (d) employment of new technologies and moreenergy efficient capital stock, with the related increase in substitution ofother factors (referred to in (c) above). In the very short run it may bejustified to ignore (b), (c), and (d), though (a) should not be ignored.
The alternative assumption is that the ratio between energy demandand output level is quite flexible so that different energy demand levels(within a range) can be consistent with a given level of output. This assump-tion ignores, in contrast to the points raised in (a) to (d) above, that (e)technical substitution possibilities may be quite limited, depending on thetime horizon and particular applications, so that desired compositionalchanges; substitution between capital, energy, and other inputs; and changesfor increased efficiency may not be forthcoming; and (f) even whan substi-tution possibilities are present, some of the substitution is likely toinvolve new capital equipment with different technological characteristicswhich, while reducing the energy/other inputs ratio and the total costs ofproduction, may increase the total demand for enerqy if the output increasesare large enough.
Berndt and Wood (1977) also introduce a concept of "utilized capi-tal" - the aggregate of capital and energy - to analyze relationships betweenthis and othar inputs in production. Under the separability assumption ofcapital (K) and labor (L) from energy (E) and other material inputs (M), theK-L substitution does not depend upon E and M, and both K and L substituteequally with E and M. Similarly, the assumption of separability of (K and E)from (L and M) means that the K-E substitution does not depend upon L and M,and that both K and E substitute equally for L and M.
Using this framework, it is clear that to study the question ofaggregate energy demand and economic growth empirically, one should studyvarious elasticities of subsitutions -6EK- difL- JEM- as well asT(K, E)LandT -K, E)M. Most of the econometric studies on interfactor substitutionthat Berndt and Wood have reviewed use historical data prior to energy priceincreases in early 1970s, and assumed instantaneous adjustment. Except forHudson-Jorgenson (1974b), and Hayilicza (1976), the studies have only usedmanufacturing sector data, so that the effect of compositional changes inoutput is not analyzed. (Studies on interfactor substitution in the manu-facturing sector are reviewed in Section IV.2.) Table IV.1, adapted fromBerndt and Wood (1977), summarizes the studies on substitution possibilitiesbetween energy (or, the energy-capital composite) and non-capital inputs.Most studies find cross-elasticities between E and L to be positive and
significantly different from zero; although E-L substitution possibilitiesexist, they appear to be limited.
Table IV.1a, from Berndt and Wood (1979), presents evidence onsubstitution possibilities between capital and energy within the "utilizedcapital" composite. An explanation of the three kinds of elasticity measure-ments would require a lengthy theoretical discussion; the reader should
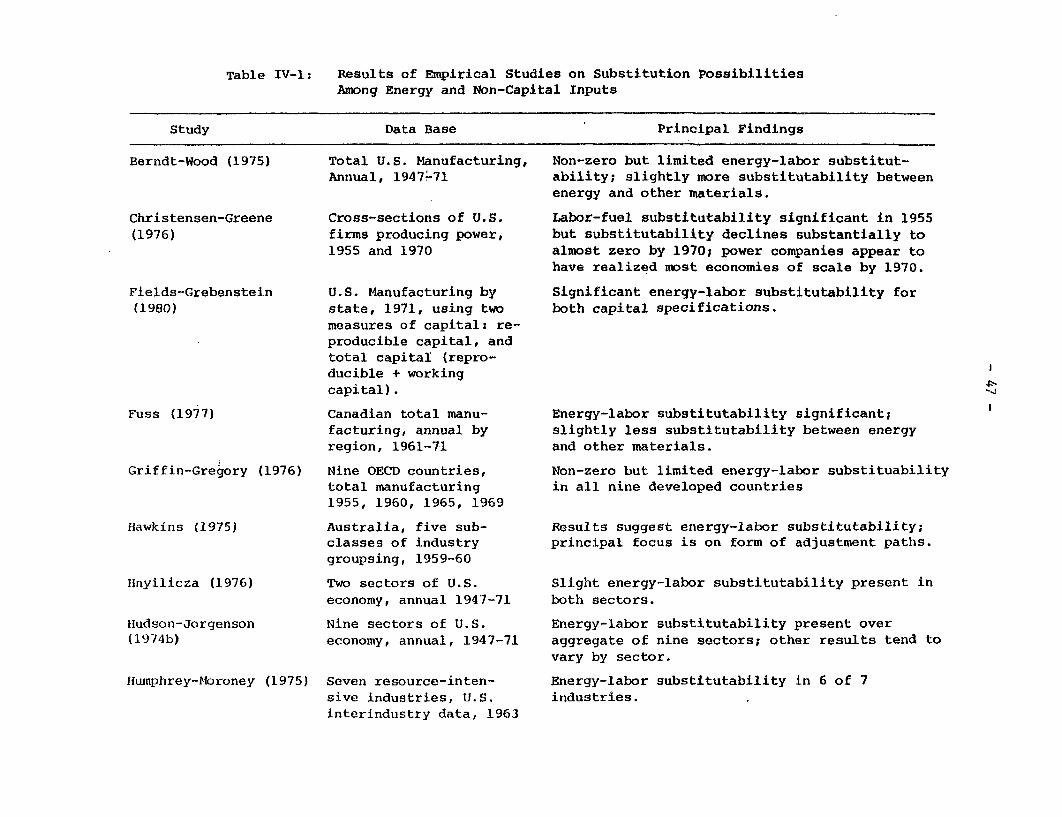
Table IV-1: Results of Empirical Studies on Substitution PossibilitiesAmong Energy and Non-Capital Inputs
Study Data Base Principal Findings
Berndt-Wood (1975) Total U.S. Manufacturing, Non-zero but limited energy-labor substitut-
Annual, 1947-71 ability; slightly more substitutability betweenenergy and other materials.
Christensen-Greene Cross-sections of U.S. Labor-fuel substitutability significant in 1955(1976) firms producing power, but substitutability declines substantially to
1955 and 1970 almost zero by 1970; power companies appear tohave realized most economies of scale by 1970.
Fields-Grebenstein U.S. Manufacturing by Significant energy-labor substitutability for(1980) state, 1971, using two both capital specifications.
measures of capital: re-producible capital, andtotal capital (repro-ducible + working
capital).
Fuss (1977) Canadian total manu- Energy-labor substitutability significant;facturing, annual by slightly less substitutability between energyregion, 1961-71 and other materials.
Griffin-Greory (1976) Nine OECD countries, Non-zero but limited energy-labor substituabilitytotal manufacturing in all nine developed countries
1955, 1960, 1965, 1969
Hawkins (1975) Australia, five sub- Results suggest energy-labor substitutability;classes of industry principal focus is on form of adjustment paths.groupsing, 1959-60
Hnyilicza (1976) Two sectors of U.S. Slight energy-labor substitutability present ineconomy, annual 1947-71 both sectors.
mudson-Jorgenson Nine sectors of U.S. Energy-labor substitutability present over(1974b) economy, annual, 1947-71 aggregate of nine sectors; other results tend to
vary by sector.
Hfumphrey-Moroney (1975) Seven resource-inten- Energy-labor substitutability in 6 of 7sive industries, U.S. industries.interindustry data, 1963
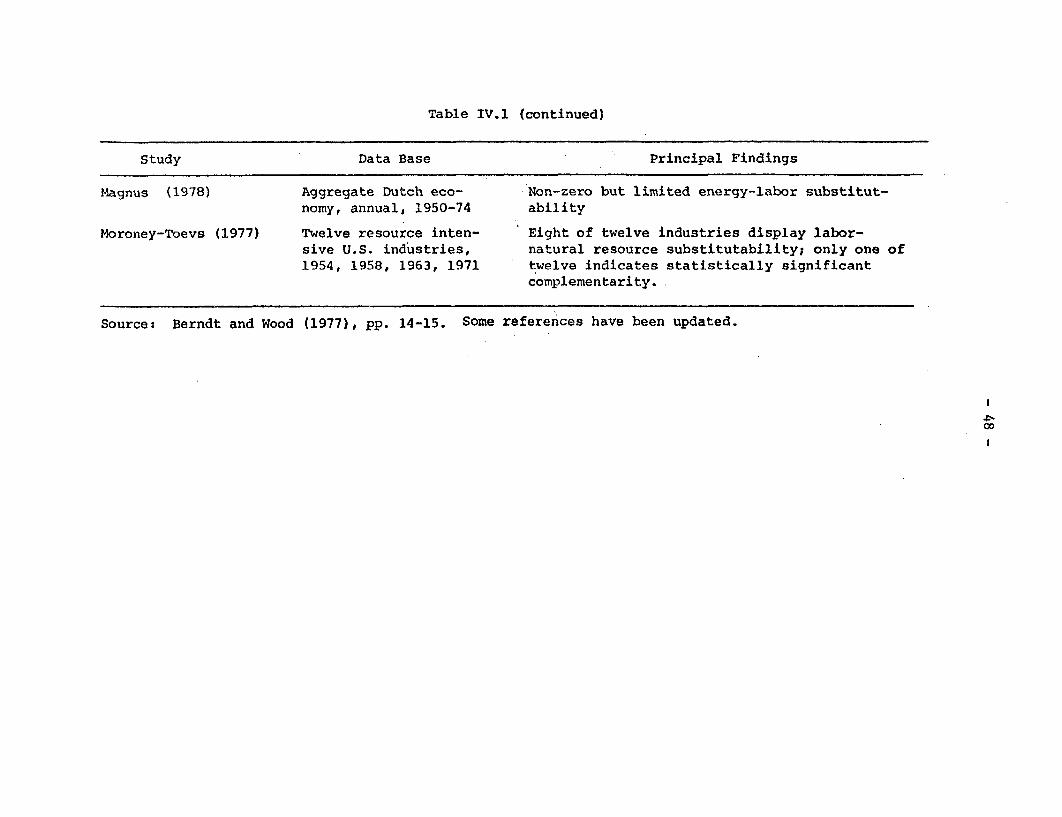
Table IV.1 (continued)
Study Data Base Principal Findings
Magnus (1978) Aggregate Dutch eco- Non-zero but limited energy-labor substitut-nomy, annual, 1950-74 ability
Moroney-Toevs (1977) Twelve resource inten- Eight of twelve industries display labor-sive U.S. industries, natural resource substitutabilityl only one of1954, 1958, 1963, 1971 twelve indicates statistically significant
complementarity.
Source: Berndt and Wood (1977), pp. 14-15. Some references have been updated.
0D
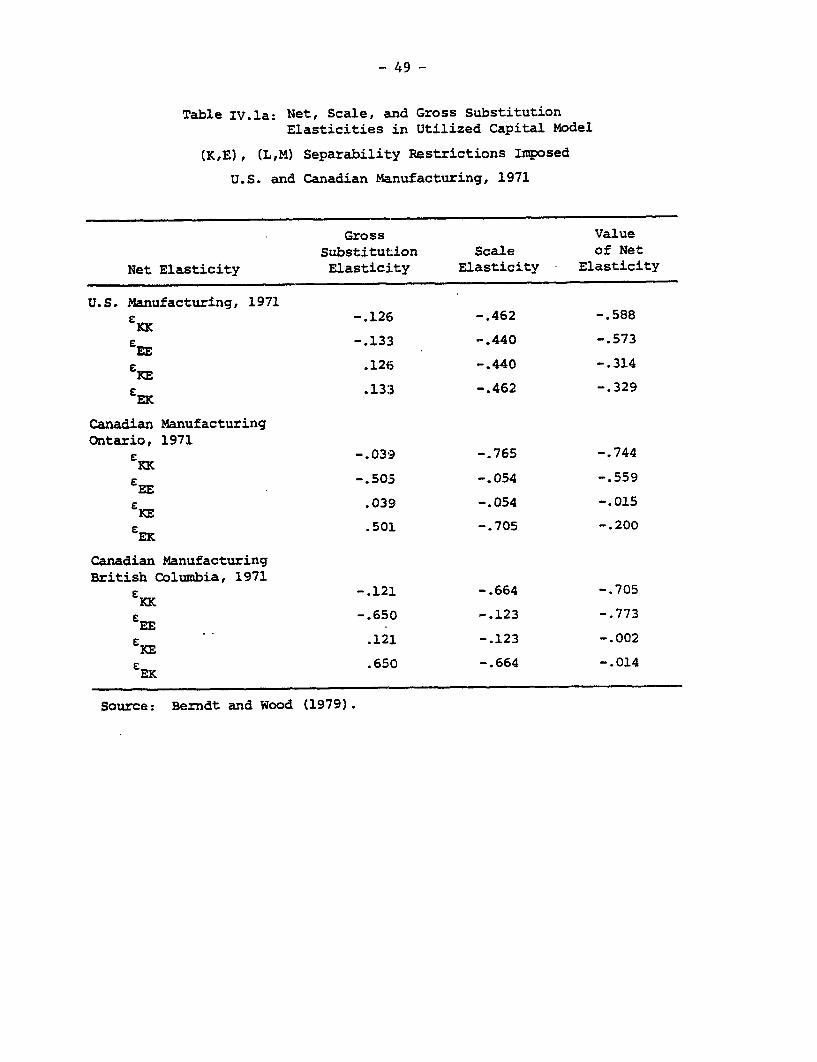
- 49 -
Table IV.1a: Net, Scale, and Gross SubstitutionElasticities in Utilized Capital Model
(K,E), (L,M) Separability Restrictions Imposed
U.S. and Canadian Manufacturing, 1971
Gross Value
Substitution Scale of NetNet Elasticity Elasticity Elasticity Elasticity
U.S. Manufacturing, 1971EKK -. 126 -. 462 -. 588
e -. 133 -. 440 -. 573
SKE .126 -. 440 -. 314
CEK .13:3 -. 462 -. 329
Canadian ManufacturingOntario, 1971
C -. 039 -. 765 -. 744
eEE -. 505 -. 054 -. 559
CKE .039 -. 054 -. 015
SER .501 -. 705 -. 200
Canadian ManufacturingBritish Columbia, 1971
E -. 121 -. 664 -. 705
e -. 650 -. 123 -. 773EE-CKE .121 -.123 -.002
E .650 -.664 -.014
Source: Berndt and Wood (1979).
- 50 -
consult the source, as well as other studies auch as Berndt and Wood (1975),Fields-Grebenstein (1980), Fuss (1977), Magnus (1978), and Griffin and Gregory(1976). A comparison of their results is complicated, since they employdifferent conceptual frameworks and methodologies.
Aggregate Energy Demand Forecasts in LDCs 2/
The analytical work reviewed so far may not be of direct relevanceto developing countries, though it does provide a framework in which therelationships between energy prices and aggregate economic growth can beanalyzed. Unfortunately, many of these questions - such as the effect ofenergy price rises on sectoral composition of demand and output or on capitalformation - have not been studied for the developing countries. Data limi-tations as well as conceptual complexities make such work very difficult.However, some studies have been made to estimate price and income elasticitiesof commercial energy demand in several LDCs and to use them for predictivepurposes.
Most of the available material and methodologies have been surveyedin Mukherjee (1977) and Dunkerley et al. (1980). The methodologies usedinclude econometric models, end-use analyses, input-output models and "Refer-ence Energy Systems". A detailed discussion of this literature is not possi-ble here; we mention the highlights. Mukherjee has critically reviewed themethods of projection in US, UK, Canada and India and has suggested an approachfor developing countries. Dunkerley et al, give a review of projections inBrazil, Egypt, India, Indonesia, Korea, Mexico and Turkey. We will justmention a few new references and government reports which may be useful.Kaushik and Bhatia (1980) present an analysis of the demand, supply andbalance of payments position of 20 major oil-importing developing countries.Dunkerley, Knapp and Glatt (1980) have presented analyses of energy consump-tion by fuel and by end-use for a number of countries and discuss a number ofsupply issues in the context of the part played by governments. Strout (1979)has discussed industrial growth options and energy use in developing countrieswith an example from Korea. Other demand projection studies include Gillis(1980) for Indonesia and Government of India (1979) for India.
Leigh-Strasser-Trehan-s (1980) work on aggregate energy and economicdevelopment concludes that the correlation between commercial energy consump-tion and GDP per capita is significantly higher for countries with higherGDPs. High income LDCs (above $250 GNP per capital) have closely correlatedenergy consumption and GDP, while low income LDCs (below $250 GNP per capita)commonly show little relationship between commercial energy consumption andGDP. These conclusions are based on a linear regression analysis of data for
81 countries. The study has also analyzed sectoral energy consumption datafor 16 countries and the results of the sectoral time-series linear regressionsshow that industrial GDP and energy consumption show a strong linear relation-ship in all 16 nations studied. GDP share of transportation, and energyconsumption by transportation are significantly and linearly correlated in 11
2/ See also Sections III.1 and V.1.
- 51 -
of the 16 nations. The time-series data on non-commercial energy consumptionfor 15 nations have also been analyzed and the conclusions are that non-commercial energy comprises a substantial portion of the total energy consumedin many LDCs; per capita consumption of non-commercial energy shows minimal oreven negative increases over time. The study also shows that for certaingroups of countries, higher values of total energy consumption for given GDPare associated with higher values for Quality of Life Index while for mostgroups no such relationship exists.
Choe (1978) has used pooled time-series of cross-section data for35, non-OPEC developing countries for the period 1960-75 period to projectthe demand for primary energy up to 1985. In the demand equations used, percapita consumption of energy is expressed as a function of per capita grossdomestic product (GDP), price of energy, and lagged per capita consumption ofenergy. 3/ The equation is estimated separately for Upper Middle Income,Intermediate Middle Income, Lower Middle Income, and Low Income countries. 4/In regressions for each income group, dummy variables are introduced for eachcountry and each observation is weighted by the average energy consumption ofthe country in the period. Country dummies help eliminate between-countryvariations in energy consumption from estimates of the coefficients while theweighting scheme adopted recognizes the importance of large countries interms of energy consumption. It is noted in the study that the simple approachused is not expected to capture all the underlying factors that determined thehistorical energy consumption trends. Particularly, the estimates of incomeelasticity may be biased on account of the following two factors in developingcountries: (a) If the significance of non-commercial energy has been declin-ing over time, an estimate of income elasticity of commercial energy alone
3/ The energy demand function to be estimated is:LN (EN/POP) = a + B * LN (GDP/POP) + y * LN (ENP) +0* LN (EN /POP ) + Lkwhere u is the error term and
EN: total consumption of primary energy expressed in oil equivalents
ENP: index of average price in real terms to consumers of primaryenergy
GDP: Gross Domestic Product in constant 1970 U.S. $
POP: Mid-year Population. The subscript (-1) denotes one-year laggedvalues of respective variables. This model gives:
Short Run Income Elasticity = B and Long-Run Income Elasticity = B (1-cl)
Short Run Price Elasticity = y and Long Run Price Elasticity = y/(l-d)
4/ See Table IV.2.
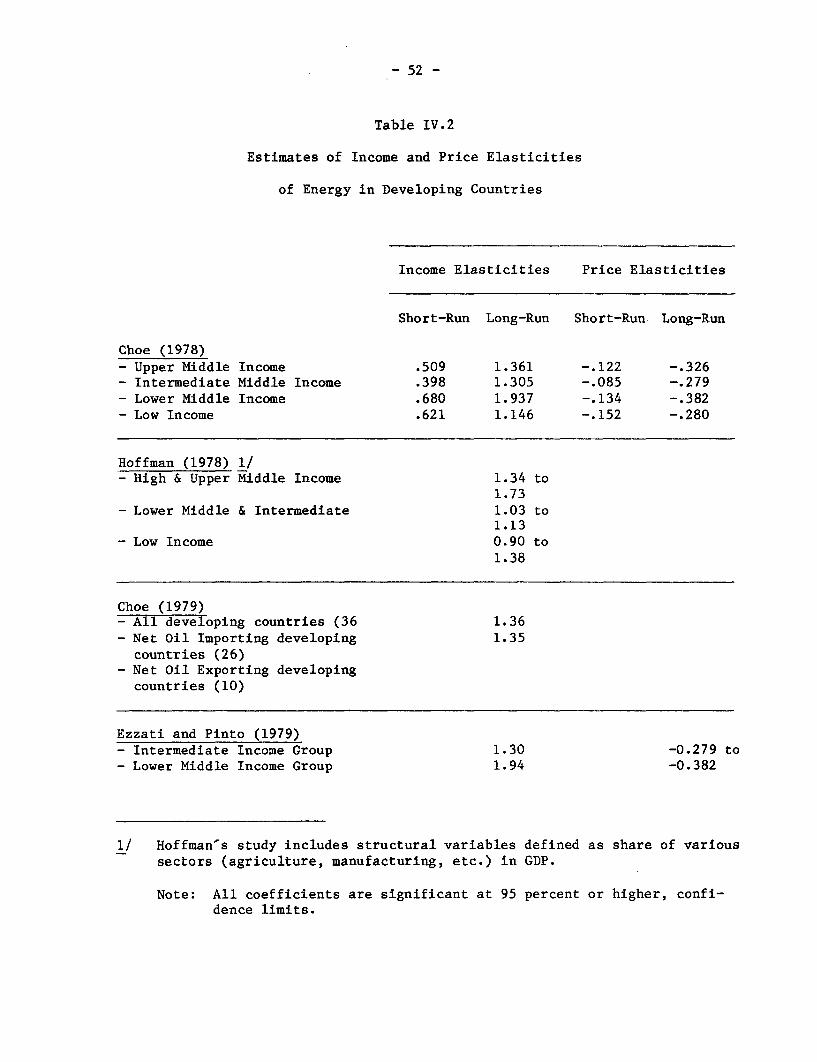
- 52 -
Table IV.2
Estimates of Income and Price Elasticities
of Energy in Developing Countries
Income Elasticities Price Elasticities
Short-Run Long-Run Short-Run Long-Run
Choe (1978)- Upper Middle Income .509 1.361 -.122 -.326- Intermediate Middle Income .398 1.305 -.085 -.279- Lower Middle Income .680 1.937 -.134 -.382- Low Income .621 1.146 -.152 -.280
Hoffman (1978) 1/- High & Upper Middle Income 1.34 to
1.73- Lower Middle & Intermediate 1.03 to
1.13- Low Income 0.90 to
1.38
Choe (1979)- All developing countries (36 1.36- Net Oil Importing developing 1.35
countries (26)- Net Oil Exporting developing
countries (10)
Ezzati and Pinto (1979)- Intermediate Income Group 1.30 -0.279 to- Lower Middle Income Group 1.94 -0.382
1/ Hoffman's study includes structural variables defined as share of varioussectors (agriculture, manufacturing, etc.) in GDP.
Note: All coefficients are significant at 95 percent or higher, confi-dence limits.
- 53 -
would overstate the true overall income elasticity; (b) In cases where there
is a shift in the fuel mix from coal to more efficient oil/natural gas/electricity, an aggregation of the fuels based on their inherent energy valuesrather than usable energy would result in an underestimate of the income
elasticity. Since these trends have been particularly important in the case
of India and Brazil which account for a substantial share of total energy
consumption in developing countries, it is necessary to keep this in mind
while interpreting the results from the above study.
In another study, Choe (1979) has estimated long-run income and
price elasticity of energy demand by using time-series-cross-section data for26 net oil-importing and 10 oil-exporting developing countries. His conclu-
sions show that income elasticity of the developing countries is substantiallyhigher than unity, in the neighborhood of 1.3 on average. The estimates ofprice elasticities appear to indicate that the impact of a price increase is
only small in the first year, peaks in the medium term and fades away afterthat. In view of the data limitations (relatively short time series and not
much variation), the results cannot be used to elicit a dynamic adjustmentpath.
Ezzati and Pinto (1979) have also referred to the World Bank workon long-run income and price elasticities of energy demand for intermediateand lower middle income countries where the long-run income elasticities werefound to be greater than unity; 1.3 in the case of intermediate group and1.94 in the case of lower middle income group of countries. Price elastici-ties were found to be smaller (long-run elasticities -0.279 to -0.392) inabsolute value than income elasticities, implying that price effects may be
swamped by the effect on energy demand of growth in real output.
Hoffman (1978) has explained the variations in energy consumption bylevels of population, income and economic structure variables. The structuralvariables, defined as the shares of major economic sectors (agriculture,mining, manufacturing, etc.) in GDP, are expected to show the impact ofstructural change on energy demand, given a certain level of income. Theseparation of the income effect and structural effect allows one to assess theimpact of energy demand of alternative strategies with regard to sectoralgrowth and permits one to relate energy demand to structural changes plannedby a country's policy makers. The results have been obtained by using pooledtime-series/cross-section data for a number of developing countries categorizedby region and income levels. The main conclusions are: (i) the impact ofstructural change on energy demand is considerable and much of the substantialdifference between measured income elasticities for developing and thosefor developed countries results from the fact that the first undergo a faststructural change whereas the latter have ceased to do so; and (ii) thecoefficient for the percentage share of agriculture is generally negative andthat of manufacturing and electricity positive. The transport share is notoften significant, but then mostly positive.
Hoffman (1979) has also presented results using structural variablesin a log-linear model for two country groups--Southern Europe and Low Income
- 54 -
Africa South of Sahara. The structural variables have been quantified interms of the share of agriculture, mining and construction and manufacturingand electricity in GDP. His observation is that "the introduction of thestructural variables leads to very low income elasticities suggesting thatthe high income elasticities usually calculated for developing countries arelargely the result of structural change toward activities with high energyintensities."
Strout (1980) has reviewed some projection models to assess theirlong-run forecasts of energy demand. He finds that the assumptions of priceelasticities and the level of increase in energy prices are crucial variables,uncertainty about which may affect future growth in energy consumption.
Overall, aggregate energy consumption/demand projections for theLDCs are not very robust, though the studies reviewed here do provideuseful "ball-park figures." These projections are critically dependent onprojections for aggregate economic growth and on the assumed/estimated priceand income elasticities. Econometric studies assume the stability of underly-ing demand curves and a symmetry in quantity response to price changes, andsuch assumptions may not be valid for economies undergoing rapid structuralchange. Finally, the price paths for imported energy resources are verydifficult to forecast. The combined impact of unexpected price changes andgovernmental policy responses is both difficult to model and forecast.
IV.2 Energy Policy Modeling
Analysis and modeling of the overall energy system, including supplyand demand from all end-use sectors as well as all fuels and energy forms,is useful both to forecast total energy demand and to situate energy planningin larger contexts of public policy. These analyses often highlight thequestion of interfuel substitution and resource definition in a more compre-hensive framework. Depending upon the focus, coverage and size, these studiescan range from energy balance studies such as we discussed in Chapter III tothe sectoral models discussed in Chapter V to the studies in Bangladesh,India, and Mexico reported in Chapter VI. The borderline is not always clear,since models or their components are developed with a variety of purposes inmind or can be adapted as needs arise.
A particular variant of energy policy models is the integratedenergy/economic models - those produced by coupling energy system models
with macroeconometric or input-output models of the overall economy. Whereasin many sectoral or energy system models output demands are required to bespecified exogenously as model inputs, one has to recognize that these demands
are linked to the macroeconomic structure and trends of the overall economy,including demographic structures and taste patterns. The combination of
process analysis-type energy system models and macroeconomic models thus helps
identify relationships between the energy sector and the economy. These
models are also used to analyze the relationships between economic growth and
energy in a short to medium term horizon.
- 55 -
In this section we briefly review the major energy policy modelsdeveloped in the US: the Manne (1976a,b: 1979) ETA/ETA-Macro models, the
Brookhaven Energy System Optimization Model (BESOM) (Hoffman and Cherniavsky(1974)) the Hudson-Jorgenson (1974b) DRI model, the Project IndependenceEvaluation Study (PIES), and the work of Committee on Nuclear and AlternativeEnergy Systems (CONAES) at the US National Academy of Sciences (NAS). 5/
Some of the other relevant studies have been included in Section 111.2already. 6/
The process type of energy system model encompasses all alternativefuels and energy sources and frequently employs network analysis in order torepresent technical detail and to capture the interfuel substitution possi-bilities. The network is used to represent the spatial or interregional flowsof energy as well as the alternative processes and fuels that may be used inspecific demand sectors. This representation of the energy system may beaugmented with optimization or simulation techniques or used simply as aframework to exhibit information and options.
The model developed by Baughman (1972) to study interfuel competi-tion uses systems dynamics to simulate the flow of resources (coal, oil,natural gas, nuclear fuel) to the various demand sectors - (residential,com-
mercial,industrial, transportation, and electricity). The model has beenapplied at the national level. It includes representation of the economiccost structure of the energy system along with investment decisions and
physical constraints on the supply of coal, oil, natural gas, and nuclearfuels. Demands are developed in two components, a base demand that is notsensitive to price, and a market-sensitive demand that includes incrementaland replacement demands. The model is used to simulate interfuel competitionand to develop the quantities and prices of fuels and energy sources thatare used over time as demands for, and the availability and cost of, resourceschange. The model has been used to develop projections of oil and gasuse as relative prices change.
The Reference Energy System (RES) approach was developed by Hoffman(1974) and applied to the assessment of new energy technologies and policies.This approach gives a network description of the energy system in which thetechnical, economic, and environmental characteristics of all processesinvolved in the supply and utilization of resource and fuels are identified.All steps in the supply chain (the extraction, refining, conversion, storage,transmission, and distribution activities) are included along with the utiliz-ing device (combustor, air conditioner, internal combustion engine, etc.) Thesystem is used to evaluate the role of new technologies and the possibilities
5/ This review is adopted in part from Hoffman and Wood (1976), Koreisha(1980), Just and Lave (1978, 1979) and Manne, Richels and Weyant (1978).
6/ No models for other countries are therefore included in this section.However, see the descriptions of the investment planning models forMexico and Bangladesh in Section VI.l.
- 56 -
of interfuel substitution. Substitution is heavily dependent on the charac-teristics of utilizing devices, and these devices are represented in thenetwork for all functional end-uses such as space heating, air conditioning,and automotive transport. The resource, economic, and environmental impactsof new energy technologies are determined by inserting them into the referencesystem at appropriate levels and efficiency and recalculating the energyflows, cost, and emissions.
A number of LP models that are similar to those employed for optimiza-tion of the generating mix in the electric sector have been developed for theanalysis of the complete energy system including both the electric and thenonelectric sectors. The Brookhaven Energy System Optimization Model (BESOM),developed by Hoffman & Cherniavsky (1974, for example), was designed todetermine the optimal allocation of resources and conversion technologies toend-uses in the format of the Reference Energy System. This model focuses onthe technical structure of the energy system including the conversion effi-ciencies and environmental effects of supply and utilizing technologies. Itis currently applied at the national level. The model may also be formulatedfor regional or interregional analysis. A wide range of interfuel substi-tutability is incorporated in the model, and the load-duration structure ofelectrical demands may be expressed. The model is quantified for a futurepoint in time. The energy sources compete in the optimization process toserve specific functional demands such as space heat, petrochemicals, andautomotive transport. The energy demands to be satisfied and the constraintson specific energy sources and environmental effects are specified exogenously.These may be input as either fixed or price-sensitive constraints. The energysources provided in the model include a number of alternative central-stationelectric systems, general-purpose fuels delivered directly to the consumer,and special systems such as solar energy and decentralized electric generators.The optimization may be performed with respect to dollar cost, social cost,environmental effects, resource consumption, or some combination of thesefactors. The model has been applied to study the optimal implementation madefor new energy technologies, break-even costs for new technologies, andstrategies of interfuel substitution to conserve scarce resources.
Time-phased LP models have also been developed by Nordhaus (1973)and Manne (1976a). The Nordhaus model covers five regions of the world andnine time periods and includes all major competing resources. The backstoptechnology that is introduced provides a long-term substitute of possiblyhigher cost but almost infinite availability, which can be used to replacescarce or finite resources when they run out. This backstop technology hasbeen taken to be the nuclear breeder reactor producing electricity and hydro-gen for electric and nonelectric demands, respectively. The cost and effi-
ciencies of all resources and technologies are reflected in the model alongwith demand and resource constraints. This model has been used to study theoptimal allocation of scarce resources over time and, specifically, to evalu-
ate current fuel production costs and the scarcity cost premium associated
with the requirement that a more costly form of energy must be substituted at
some future time for any scarce resources that are used at an earlier date.
- 57 -
Manne's ETA (for Energy Technology Assessment) and ETA-MACRO modelswere used by several energy research projects, including Nuclear Energy PolicyStudy Group (NEPSG, 1977) and Modeling Resource Group (MRG) of the CONAESStudy (NAS, 1978, 1979). 7/ ETA-MACRO is a single integrated model incorpo-rating resource depletion and transition to new energy technologies, price-induced conservation, and effects of rising energy costs upon physical capitalaccumulation over time. It has two submodels: (a) ETA, a process analysisfor energy technology assessment; 8/ and (b) a macroeconomic growth modelallowing interfactor substitution. ETA is concerned with finding equilibriumpatterns of development in the energy industry. The supply side is modeledas an LP specification of the alternative technologies, using two forms ofenergy: electricity (without regard for time variations), and non-electricenergy (combining liquid and gases on a Btu basis). The possible technologiesfor generating electricity are fossil fuel, hydro and others, LWR (light waterreactor), LMFBR (liquid metal fast breeder reactor), and an unspecified"backstop technology." Cost constraints, constraints on capacity growth, orother policy constraints (import controls, depletion regulations, etc.)specify the complete supply picture. Demands for the two types of energy areestimated using assumed values of own-elasticities.
By itself, ETA can be used to simulate responses to policy recommen-dations such as a nuclear moratorium in the US or postponing development ofbreeder reactors (NEPSG, 1977) or specified imports/depletion controls (NAS,1980). The macro model uses a four factor aggregate production function(capital (K), labor (L), electricity (E), non-electric energy (N)), withunitary elasticity of substitution between two pairs of factors, K-L and E-N,and a constant elasticity of substitution between these two pairs. 9/ Aseventy-five year planning horizon, 1975-2050, is employed, divided insixteen five-year periods. A "putty-clay" model is employed to take intoaccount the short-run and long-run interfactor substitution responses tohigher energy prices. This model is optimized intertemporally over theplanning period using different discount rates and different values of theelasticity of substitution (between energy inputs and K-L inputs). In theparticular policy scenario analyzed for the CONAES study, it is found that a"no nuclear" policy would have negligible macroeconomic effects, but consider-able impacts within the energy sector. A higher elasticity of substitutionwould make the macroeconomic impact even smaller, since energy demand growthis smaller, depletion is slower, and there is more time for a transition tofuture high cost alternative energy sources. Manne (1979) also suggests that,in general, energy policy results for the US may turn out to be invariant to
7/ Manne (1976 a,b) has emphasized that the model results are dependent uponinput assumptions; the results described in Manne (1979) are in line withwhat he describes as "MRG ground rules."
8/ See Manne (1976a).
9/ For an analytical discussion on production theory, assumptions allowingfor such separability and their interpretation, see Berndt (1978a), Berndtand Wood (1977), and Hogan (1978, 1979a).
- 58 -
macroeconomic growth criteria (exogenous specifications of desired growth),and that, apart from labor force and labor productivity growth rates, thecrucial econometric parameter is the elasticity of substitution betweenenergy and other inputs.
The DRI model was first used in conjunction with the Ford FoundationEnergy Project, and later combined with the Brookhaven models (see Hoffman andJorgenson (1978)). Developed principally by Hudson and Jorgenson (1974b),withother DRI models, it is an econometric model consisting of a macro growthmodel and a 9-sector general equilibrium model specifying energy-economyinteractions. The macro model provides forecasts of the main components ofaggregate demand, together with those of wage and capital rental rates.Production in each of the nine sectors is modeled using translog cost func-tions, combined with an aggregate KLEM (capital, labor, energy, materialintermediates) production function, and an interfuel substitution model. Themodel allows for a full range of responses to (exogenously forecast) risingenergy costs: interfuel substitution, interfactor substitution and changesin the composition of final demand.
Other major energy policy studies for the US include Landsberg, ed.(1979) and Schurr, et al. (1980). The Ridker and Watson (1980) study at RFFis primarily aimed at environmental assessment, and uses an energy submodelfor this purpose. Stobaugh and Yergin (1979) employ an informal methodologyto examine various policy alternatives. Several surveys of policy modelingtechniques and substantive results have appeared recently: in addition tothose cited already, these include Brock and Nesbitt (1977), Brooks andHollander (1979), Greenberger and Richels (1979), Hogan and Weyant (1980),Joskow (1980), Just and Lave (1979a and b), Kuh and Wood (1979), and Planco,Inc. (1979).
Conclusion
In summary, analysis of aggregate energy/output relationships indeveloping countries is in rather beginning stages, not extending much beyondthe crude aggregate or sectoral energy/output ratios determined from relativelyshort time-series, or simple regression elasticities. While data limitationmay not allow any more sophisticated analyses, two issues need to be thoughtthrough in greater detail for some of the large energy consumers: (1) sectoralcomposition of energy demand, and (2) demographic influences on energy consump-tion. Several authors have suggested that LDC energy demands, particularlyfor oil and gas, may rise much faster in the next forty years than those inDCs, and that the E/GDP ratios may be higher, both overall and at the margin,than in the case of DCs. While this suggests that the history of energyconsumption and energy "transitions" in LDCs may be quite different from that
in the case of DCs, it is necessary to address directly the questions of whatthese differences may be, what they originate from, and what alternativescenarios are likely. For example, it is suggested that such differences arelikely to arise from the higher level of energy intensities embodied in thetechnologies the LDCs are adopting for their industrialization, as well asfrom rapid and unprecedented high rates of urbanization. The exact nature of
many interacting influences has not been analyzed. The models reviewed here
- 59 -
are not likely to be useful for such a purpose, even in a preliminary andqualitative way. The IIASA work referred to in Chapter III seems to be abeginning in this direction.
Energy/output models for the US abound and, by contrast with thoseavailable on LDCs, are quite robust in their technical specification. Theirdata requirements, however, are correspondingly large and their structure(and therefore conclusions) specifically reflect the resource base andinstitutional setting of the U.S. For these reasons, they cannot be easilymodified for analyses of other countries' energy demand prospects. There isa dearth of "intermediate size" energy models in the literature that couldprovide LDCs with better policy guidance than can simple energy balance oraggregate elasticity approaches, but without the complexity, cost, and datarequirements of the major industrial country models.
- 60 -
Chapter V
Demand for Energy by End-Use Sector
Introduction
Energy demand analysis at a disaggragate level is carried out in twomain ways - focusing on major end-use sectors such as industry, agriculture,transport, etc., taking into account a mix of different energy inputs for eachsector; and focusing on individual fuel sources such as petroleum products,natural gas, electricity, coal, and renewables. While there is obviously anoverlap between the two, each approach has distinct advantages and usefulnessand requires different kinds of data depending on the level of disaggregation.
In this Chapter we review the available literature on energy demand
classified by the major end-use sectors. The works covered include energydemand studies which discuss methodological issues and empirical resultson income and price elasticities, interfuel substitution, and interfactorsubstitution/complementarity. 1/ The empirical results provide insights intothe long-run response of energy demand to price and income changes, thepossibilities of conservation of energy or substitution of one form of energyfor another and the ways in which energy demand differs in the industrializedand less developed countries. In Chapter VI, we shall discuss some of thedemand studies for individual fuels. The overlap between this Chapter andChapter VI occurs mainly in the literature on the transport sector andgasoline demand, and that of the agricultural sector of the LDCs and theconsumption of traditional, renewable energy resources.
Most of the econometric studies on energy demand carried out inthe developed countries (as well as some studies for LDCs) have used pre-1973data. Thus there is some doubt as to the stability of the underlying demandpatterns and of consumer responses to price changes based on the historicalstudies.
There is a large number of sectoral demand studies on the developedcountries. We have selected the most important ones for review, and usePindyck (1979d) as a vehicle for comparing some of the methodological proce-dures and results of the various studies. The studies differ considerably intheir time and locational coverage, in the level of disaggregation, both bythe kind of economic activity and by location, in the model specifications, andfinally in the data used. Translog cost functions have been used for quantify-ing interfactor and interfuel substitution possibilities for the US, Canada,some European countries and India. Several studies of developing countrieswhich do not estimate price elasticities but do describe sectoral energy-demandrelationships are also discussed.
1/ Some discussion of interfactor substitution is presented in Section IV.1.
- 61 -
There are two important survey articles and two studies on multi-sectoral energy studies that deserve particular attention in this field.Edmonds (1978) has provided a detailed review of theoretical and empiricalresearch on various price elasticities of demand for energy. He presents agood catalog of methodologies used, and a comparative summary of results ofdifferent studies. He concludes that aggregate energy demand does appear tobe price-inelastic, particularly in the short-run, although individual fuelsgenerally have higher price elasticities than the aggregate. Interfuelsubstitution possibilities and adjustment lags are the important determinantsof demand response. Whether historical observations can be used for pre-dictive purposes, and what kind of policy interventions can influence thesetwo factors are important questions worthy of further research.
Another review paper by Hartman (1979) provides an excellentsummary and critique of the models used for sectoral demand studies. Hefinds that considerable improvements have been made recently in energy demandmodeling techniques, particularly in three respects: explicit dichotomizationof the short-run and long-run; appropriate treatment of new technologies anddynamic modeling of commercial and industrial demand.
Multisectoral demand estimates are developed by combining thevarious sectoral models for an economy. Energy demand analysis in individualsectors has been studied in parts by Cirillo (1980), McGranahan, Mitchell,Mubayi and Stern (1979); Bronheim, Nathans and Palmedo (1975); and BNL (1978).
In the Cirillo study, energy-using sectors and subsectors aredivided into elements with common characteristics. The subsectors are thendisaggregated by end-use device classifications; for example, in the industrialsector useful energy demand categories (indirect heat, direct heat, electric,internal combustion, mechanical drive, etc.) are matched by typical end-use
devices in each category, e.g., boilers, kilns, furnaces, engines, etc. Thenthe current energy consumption pattern is established by sector and level ofactivity, and projections are made based on assumptions for economic growth,sectoral consumption, changes in energy-using processes and the efficiency ofenergy-using devices. The results of this model were compared with studiesconducted under the International Energy Development Program of the U.S. Thelatter made estimates of the impact of an energy conservation program usingenergy/GNP ratios with an elasticity of 0.9. When this was compared to thedetailed sectoral analysis, it was discovered that the impact of the conserva-tion program was overestimated by about 30 percent. Nonetheless, for develop-ing countries, the disaggregated methodology seems to be of limited usefulnessin view of the long-scale data collection efforts entailed.
The Reference Energy Systems (RES) approach has been used by theBrookhaven National laboratory in their studies of the Dominican Republic, andPeru. 2/ The RES is described in Chapter 4, and consists of estimatingenergy demands of specific end-use, energy conversion technology, fuel mixes
2/ See McGranahan, Mitchell, Mubayi, and Stern (1979), and BNL (1978).
- 62 -
and resources used to satisfy these demands. Associated with each energy flowor branch in the RES network is a series of coefficients of three types:efficiency, environmental and economic.
A detailed and computerized version of the RES can be used forevaluating the energy system impacts of policy (conservation, fuel substitu-tion, pricing, etc.) on technological options. The RES can also be used alongwith the macro models (including input-output models) to predict energydemand implications of various growth scenarios. The major difficulty in theapplication of RES to developing countries seems to be the costs of collectingrequired information. Although availability of RES for several countries willfacilitate the processes of constructing RES for another country, the level ofdetail is such that lack of information may be a serious ,bottleneck.
The final example of detailed multisectoral energy demand analysisis deLucia and Tabors (1980b) for Bangladesh. The ultimate objective of thisanalysis was to derive a set of scenarios of kWh and Btu demands, subdividedby market area, and disaggregated by sector and fuel. The demand scenariosfor Btus are aggregated to a 5-sector level, whereas electric power isaggregated to a single series for each market region. Estimates of energydemand for fertilizer and agricultural pumping are derived from a separateagriculture model. Similarly, household energy demand estimates are based ona separate analysis of population growth and distribution scenarios. Industry,transport, and trade/ service sector energy demand estimates were calculatedfrom the sectoral forecasts of growth (derived from another macro analysis)and estimates of sectoral energy/output ratios.
Finally, all the sectoral demands were reaggregated and carriedover to the fuel-supply model, and the regional forecasts of electric powerdemand. 3/ The particular merit of this study lies in the recognition ofintersectoral linkages, regional disaggregation, and the application of awide spectrum of methods in energy demand estimation and projection in adeveloping country context.
V.1 Industrial-Manufacturing Sector
Developed Countries
Pindyck (1979d) is a useful reference on theoretical as well asempirical issues in the structure of energy demand for the industrial, residen-tial and transportation sectors of the economy. The empirical results aredesigned to test the long-run response of energy demand to price and incomechanges, the possibilities for interfuel substitution, the substitutability ofenergy with other factors of industrial production, the impact of energy pricechanges on macroeconomic output, and the ways in which energy demand differsin the industrialized versus the less developed countries. Since he brings
3/ The fuel-fertilizer model is described by deLucia and Houghton (1980) andthe electric power system model by Jocoby and Lesser (1980).
- 63 -
together a unified framework on studying these issues and compares his studieswith others in the literature on energy demand, the theoretical assumptionsand empirical estimates are discussed here in some detail.
The basic approach in the book is to specify and estimate consistentmodels that simultaneously describe the demands for energy and other competingcommodities as well as the demands for individual fuels within the energysector. For example, in the case of the industrial sector, energy has beentreated together with other factor inputs in a model that simultaneouslyaccounts for the demands for capital, labor and energy. Similarly, the priceof energy has been derived from a sub-model that described the interrelateddemands for each of the four fuels (coal, oil, natural gas, and electricity).The approach followed by Pindyck is to use a translog cost function 4/(instead of a translog production function) because it is considered moreappropriate, to take prices as exogeneous than quantities. Although thedetails of the methodology can be found in the book, it may be useful toreview the procedure involved in applying the translog cost function in atwo-stage model of industrial energy demand.
The first step is to estimate the fuel-share equations 5/ (for coal,oil, gas and electricity) which give the estimates for own- and cross-pricepartial elasticities for the four fuels. Various versions of the model havebeen estimated by pooling international time-series/cross-section data for theUS, Canada, Japan and developed European countries. A summary of some of theelasticity estimates is presented in Table V.1. Perhaps the most importantresult is that the own-price elasticity of aggregate industrial energy demandappears to be significantly larger than had been thought previously and energyand capital appear to be substitute rather than complementary factors ofproduction. 6/ The total own-price elasticities of coal and natural gas arelarge so that there is considerable room for interfuel substitution in the
aggregate. The own-price elasticities of electricity and oil are found to bebelow one in magnitude (especially for Europe and Japan). Pindyck finds itdifficult to justify the relatively lower elasticity coefficients for oil.
4/ The translog production function and cost functions were introduced byChristensen, Jorgenson and Lau (1971, 1973). Applications of the translog
cost function can be found in Berndt and Christensen (1973), Berndt andWood (1975), Fuss (1977), Griffin and Gregory (1976), Halvorsen (1979b)and Hudson and Jorgenson (1974b).
5/ The factor share equations are:
S. =o +S i .. log P where the P. are the prices for coal, oil natural1 1 J 1j I th
gas and electricity and Si indicates the cost share of the fuel i fuel
input. These equations are estimated subject to the parameter restrictions.
= -l = ) andJ, = 0ii ' ij Ji i ji
6/ See the discussion of Berndt and Wood (1977, 1979) in Section IV.1.
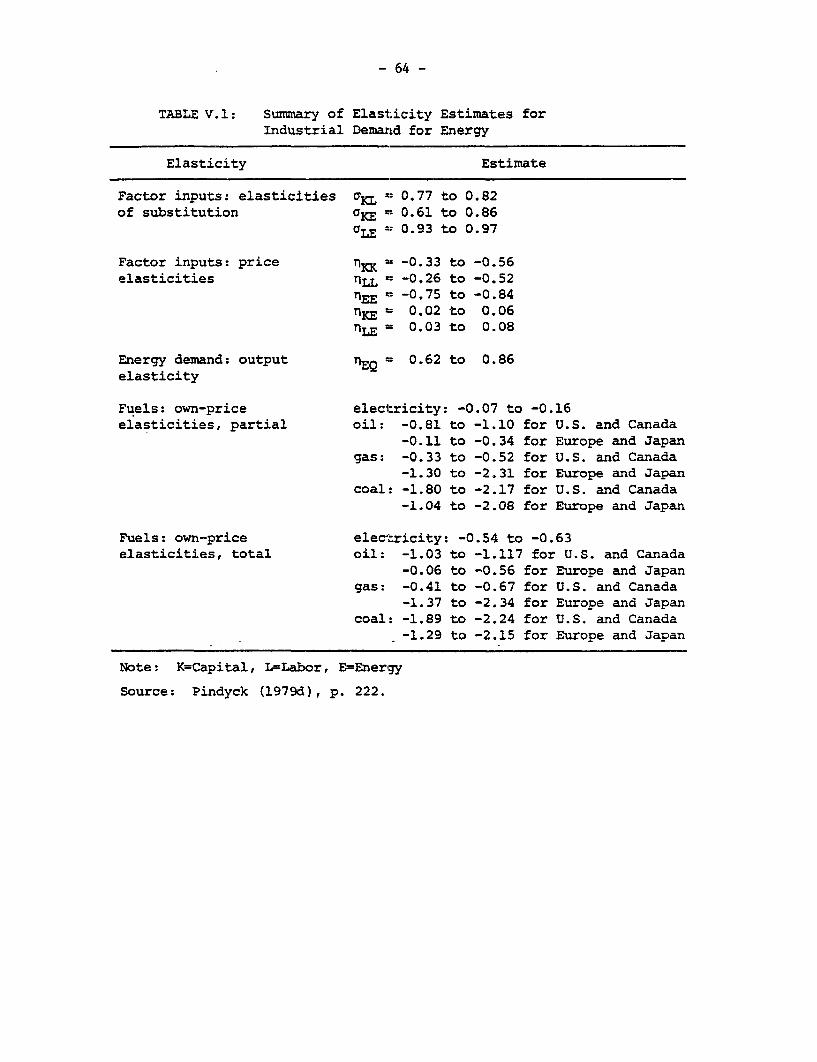
- 64 -
TABLE V.1: Summary of Elasticity Estimates forIndustrial Demand for Energy
Elasticity Estimate
Factor inputs: elasticities CKL 0.77 to 0.82of substitution aKE 0.61 to 0.86
aLE =0.93 to 0.97
Factor inputs: price IKK -0.33 to -0.56elasticities nLL -0.26 to -0.52
TIEE =-0.75 to -0.84nKE 0.02 to 0.06nILE =0.03 to 0.08
Energy demand: output TIEQ 0.62 to 0.86elasticity
Fuels: own-price electricity: -0.07 to -0.16elasticities, partial oil: -0.81 to -1.10 for U.S. and Canada
-0.11 to -0.34 for Europe and Japangas: -0.33 to -0.52 for U.S. and Canada
-1.30 to -2.31 for Europe and Japan
coal: -1.80 to -2.17 for U.S. and Canada-1.04 to -2.08 for Europe and Japan
Fuels: own-price electricity: -0.54 to -0.63elasticities, total oil: -1.03 to -1.117 for U.S. and Canada
-0.06 to -0.56 for Europe and Japangas: -0.41 to -0.67 for U.S. and Canada
-1.37 to -2.34 for Europe and Japancoal: -1.89 to -2.24 for U.S. and Canada
-1.29 to -2.15 for Europe and Japan
Note: K=Capital, L=Labor, E=Energy
Source: Pindyck (1979d), p. 222.
- 65 -
The corresponding estimates of total own-price elasticity for electricity arelower than in other studies by Halvorsen (1976b), Fuss (1977) and Berndt andWatkins (1977). The estimate for oil is -2.82 in the US and -1.30 in Canada.See Table V.2.
There is mixed evidence on the substitutability of energy andcapital. Berndt and Wood (1979), Fuss (1977) found energy and capital to bestrong complements. This result was based on the time-series data for asingle country and may have captured a short-run relationship. Griffin andGregory (1976) found strong evidence of capital energy substitutability andtheir estimate of the Allen elasticity of substitution is close to one. Theuse of international data by Griffin and Gregory (1976) and Pindyck (1979d) ismore likely to permit estimation of the long-run cost function. Halvorsen andFord (1979) found considerable variation across industries in the elasticityof substitution for capital and energy. 7/
The elasticities obtained in the first step of the Pindyck work arepartial price elasticities; when applied to fuels they account only forsubstitution between fuels under the constraint that the total quantity ofenergy consumed remains constant. 8/ In addition, these parameter estimatesare used to obtain an aggregate price index for energy in the industrialsector. This price is used as an instrumental variable for the price ofenergy in the next step where the factor share equations
S. ='C +y^ log Q. +A>(. log P1 1 313Q J
are estimated with i and j equal to capital, labor and energy and Q equal tototal output. 9/ After estimating these equations under various restrictions,
7/ See also Williams and Laumas (1980), discussed later in this section.
8/ In fact, if the price of a particular fuel increases, the demand for thatfuel will decrease for two reasons: interfuel substitution, resultingfrom changing relative fuel prices, and a decreased use of all energy,resulting from an increase in the aggregate price of total own-priceelasticity which is given b". * +1 S where *.. is total
own-price elasticity of each fuel- isEEariial priceelasticity; and
EE is the own-price elasticity of energy. The estimates of totalcross-price elasticity can also be computed along the same lines.
9/ The function is homothetic wheny, = 0, i.e., the cost function would be- Qi
homothetic if it could be written as a separable function of output andfactor prices.
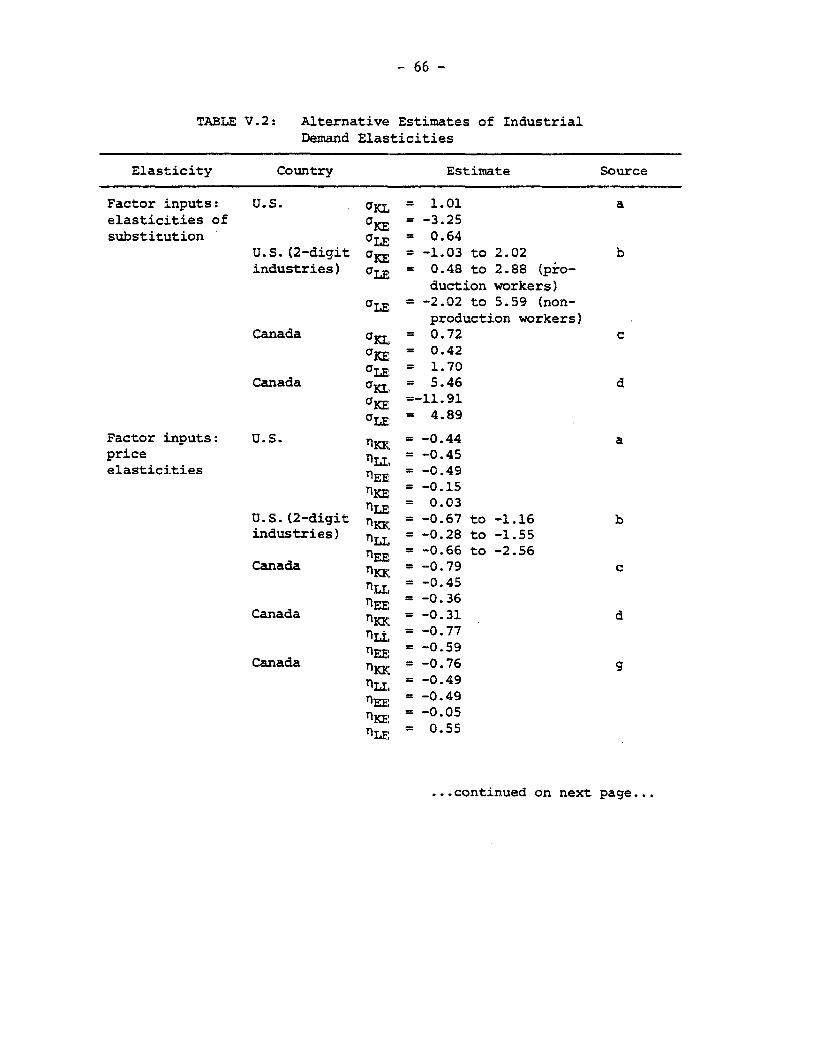
- 66 -
TABLE V.2: Alternative Estimates of IndustrialDemand Elasticities
Elasticity Country Estimate Source
Factor inputs: U.S. GKL = 1.01 aelasticities of aKE = -3.25substitution YLE = 0.64
U.S.(2-digit aKE = -1.03 to 2.02 bindustries) aLE = 0.48 to 2.88 (pio-
duction workers)
aLE = -2.02 to 5.59 (non-production workers)
Canada an = 0.72 c
aKE = 0.42
aLE = 1.70Canada aiL = 5.46 d
aKE =-11.91GLE = 4.89
Factor inputs: U.S. KK = -0.44 aprice LL = -0.45elasticities IEE = -0.49
KE = -0.15
TLE = 0.03U.S.(2-digit KK = -0.67 to -1.16 bindustries) LL = -0.28 to -1.55
= -0.66 to -2.56CanadaK = -0.79 c
LL = -0.45
EE = -0.36Canada KK = -0.31 d
Li, = -0.77
TEE= -0.59Canada KK = -0.76 g
LL = -0.49
EE= -0.49
T1K = -0.05TILE = 0.55
...continued on next page...
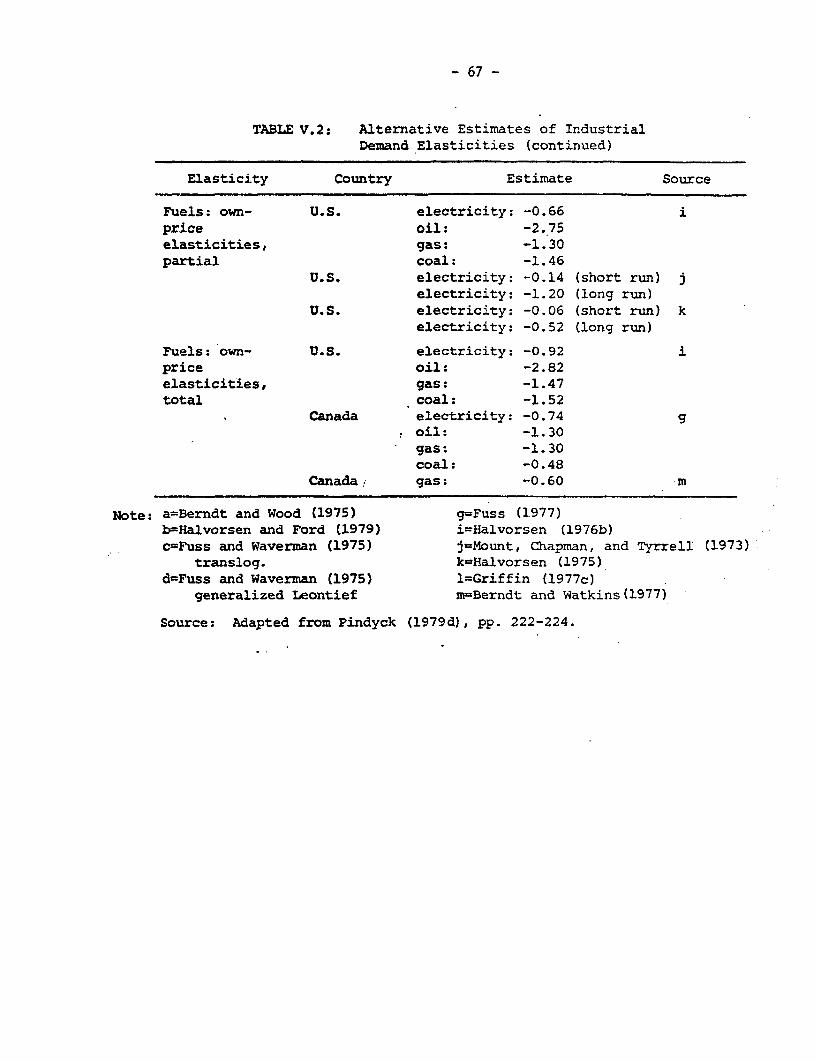
- 67 -
TABLE V.2: Alternative Estimates of IndustrialDemand Elasticities (continued)
Elasticity Country Estimate Source
Fuels: own- U.S. electricity: -0.66 iprice oil: -2.75elasticities, gas: -1.30partial coal: -1.46
U.S. electricity: -0.14 (short run) jelectricity: -1.20 (long run)
U.S. electricity: -0.06 (short run) kelectricity: -0.52 (long run)
Fuels: own- U.S. electricity: -0.92 iprice oil: -2.82elasticities, gas: -1.47total coal: -1.52
Canada electricity: -0.74 goil: -1.30gas: -1.30coal: -0.48
Canada, gas: -0.60 m
Note: a=Berndt and Wood (1975) g=Fuss (1977)b=Halvorsen and Ford (1979) i=Halvorsen (1976b)c=Fuss and Waverman (1975) j=Mount, Chapman, and Tyrrell (1973)
translog. k=Halvorsen (1975)d=Fuss and Waverman (1975) 1=Griffin (1977c)
generalized Leontief m=Berndt and Watkins(1977 )
Source: Adapted from Pindyck (1979d), pp. 222-224.
- 68 -
the resulting parameters are used to obtain elasticities of substitution 10/and demand elasticities for the three factors and, together with the partialfuel price elasticities obtained earlier, to obtain total elasticities ofdemand for each of the four fuels.
The translog cost function has also been used to estimate elasti-cities of substitution between the four major energy sources (coal, fuel oil,electricity and gas), and elasticities of demand for these as inputs for theAustralian manufacturing industry by Duncan and Binswanger (1976). Theirresults show the demand for electricity to be rather inelastic. The own-priceelasticity for fuel oil is elastic in both skins and leather industry (-2.44)and rubber (-1.21) and inelastic in miscellaneous products industry (-0.46).It appears that a one percent rise in the price of fuel oil will have a smallnegative effect on the demand for electricity in sawmills and joinery industry(0.20 percent), wood furniture industry (-0.07) and miscellaneous productsindustry (-0.20 percent). In sawmills (and joinery) and miscellaneous pro-ducts, the results indicate that there will be an elastic response in coaldemand to the price rise in fuel oil.
Fuel substitution and price response in UK industry has been studiedby Bossanyi and Stanislaw (1979). Decreasing sectoral energy/output ratios,rather than structural change, are found to account for changes in the energy/GDP ratio. The response of energy consumption to price has been quantified byestimating elasticities from time-series data. In the empirical model used,
10/ A convenient way of describing the substitutability of various factorsof production is through the 'Allen partial elasticity of substitution.'This elasticity measures the percentage of change in the ratio of twofactors resulting from a percentage change in their relative prices. Ifthe Allen elasticity of substitution between two factors is positive, thefactors are called substitutes, while if the elasticity is negative thefactors are complements. The elasticities of substitution in translogcost function can be estimated in terms of the parameters and estimatedexpenditure shares:
ij = Y + S Sij i j for i j
s.s.
and -.. = . + S.2 - 3
S. 21
The own- and cross-price elasticities of demand are related to theelasticities of subsititution as follows:
} =- S and .= S(ii ii i ij ij j
- 69 -
price elasticities are assumed constant, i.e., they neither vary over time noras a function of the prices or the size of the price changes. This assumptionmight not be valid for various reasons, however, it is suggested that theestimated value for a large aggregate sector is a reasonable average forthe sector over the time period considered. In addition to the fuel prices(coal, oil, gas, electricity) the model also includes labor price, temperatureand industrial output. The results support the view that fuel prices aresignificant in explaining changes in fuel consumption and in accounting forinterfuel substitution. However, other variables such as labor costs, temper-ature, and business cycle fluctuations also contribute to changes.
Developing Countries
Estimation of industrial/manufacturing energy demand in the develop-ing countries has been attempted in a relatively small number of studies. Thequestions of interfuel and interfactor substitution have been difficult tostudy due to data limitations and methodological problems. We have alreadymentionad deLucia and Tabors (1980b) work as a part of the Bangladesh EnergyStudy. Among other works we have found in this area (and discuss below) areUri (1979b) and Williams and Laumas (1980), applying translog cost functionsto data from India's industrial and commercial sectors, respectively; Desai(1980b), and Schramm and Munasinghe (1980), which use relatively simplertechniques.
Uri (1979b) has used an approach similar to that followed by Berndtand Wood (1975), Berndt and Jorgenson (1973) and Pindyck (1979d) in which costshare equations are estimated for three fuel inputs namely, coal, oil andelectricity. The share equations are estimated with pooled annual datacompiled for 1960 through 1971 by five subsectors: (i) mining and manufactur-ing, (ii) transportation, (iii) domestic, (iv) agriculture and (v) commercial.The results as reported in Table V.3 show a wide variation in subsector priceelasticities of demand. The differences are entirely attributable to energyshare composition. For example, mining and manufacturing with the highestcost share of coal (42 percent) has the most inelastic demand for coal (-0.15)while the transportation sector with a cost share of 3 percent has a priceelasticity of -0.32). The magnitude of the cross price elasticities can beconsidered in order to determined the main channels of energy substitution.As shown in Table V.3, higher oil prices will create a signifiant stimulus tocoal and somewhat less of a stimulus to electrical energy consumption.Although there is considerable subsector variation, the general observationseems to be that the primary alternative to oil will be coal.
The relation between energy and non-energy inputs in Indian manu-facturing is explored by Williams and Laumas (1980). Recognizing that miningand manufacturing sectors accounted for 52.9 percent of the total commercialenergy consumed in 1970-71 in India, they examine the substitution possibili-ties among energy inputs and other factors of production using a translog costfunction. The methodology is similar to that used by Uri (1979b). Thetranslog cost function is used to derive estimates of the elasticities ofsubstitution between factors of production and estimates of the price elas-function. The methodology is similar to that used by Uri (1979b). The
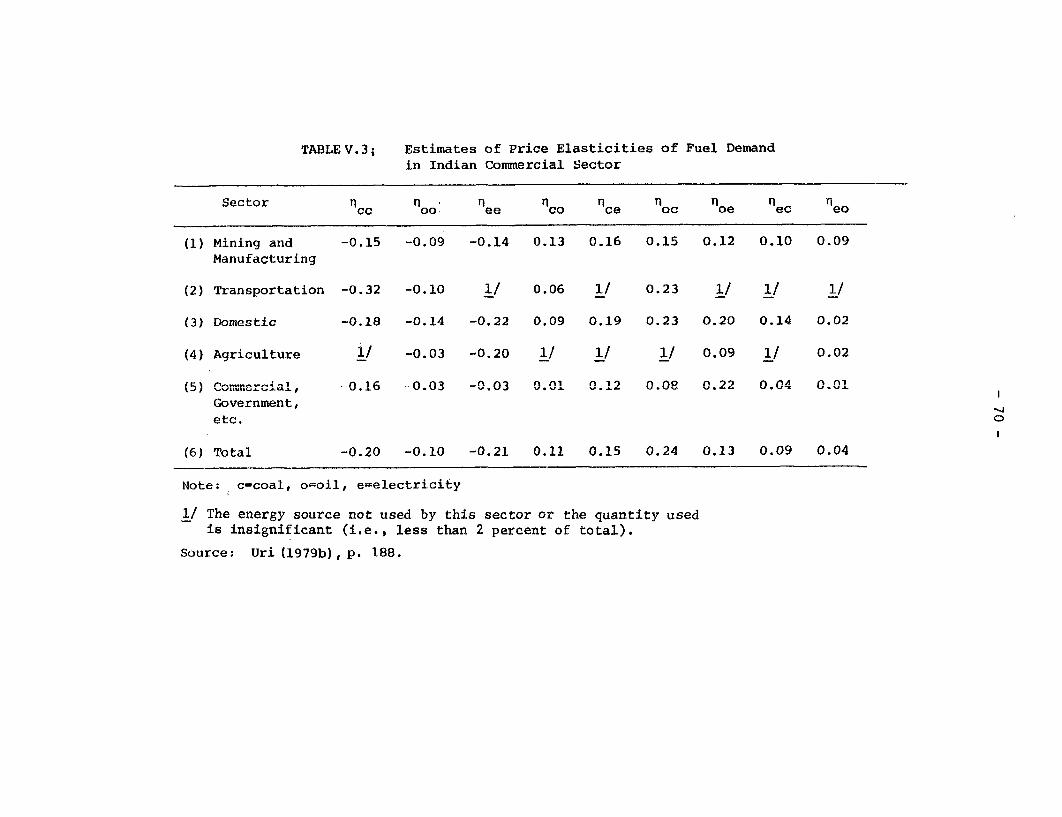
TABLE V.3; Estimates of Price Elasticities of Fuel Demand
in Indian Commercial Sector
Sector n n o ni nI n i n nc oo. ee co ce oc oe ec eo
(1) Mining and -0.15 -0.09 -0.14 0.13 0.16 0.15 0.12 0.10 0.09
Manufacturing
(2) Transportation -0.32 -0.10 1/ 0.06 1/ 0.23 1/ 1/ 1/
(3) Domestic -0.18 -0.14 -0.22 0.09 0.19 0.23 0.20 0.14 0.02
(4) Agriculture 1/ -0.03 -0.20 1/ 1/ 1/ 0.09 1/ 0.02
(5) Commercial, -0.16 -0.03 -0.03 0.01 0.12 0.08 0.22 0.04 0.01
Government,
etc. >
(6) Total -0.20 -0.10 -0.21 0.11 0.15 0.24 0.13 0.09 0.04
Note: c=coal, o=oil, e=electricity
1/ The energy source not used by this sector or the quantity usedis insignificant (i.e., less than 2 percent of total).
Source: Uri (1979b), p. 188.
- 71 -
translog cost function is used to derive estimates of the elasticities ofsubstitution between factors of production and estimates of the price elas-ticities of demand for these inputs. The factor-share equations have beenestimated by using cross-section data for manufacturing industries for 1968.The results of elasticities by substitution between Labor (L), Capital (K),Energy (E) and Materials (M) for eight industry groups are presented in TableV.4. Estimates of own-price elasticities of demand for the four factors aregiven in Table V.5.
The results can be summarized as follows:
(i) For each of the product groups, the elasticities of sub-stitution for capital and enerqy (a- ), capital and labor
materials and labor (r-L) and capital and materials
KM),are positive, so that these input pairs are substitutablefor one another. Labor and energy (r-) are complements forproduct groups which account for 55 percent of the sampleoutput, e.g., Food and Beverages, Machinery (except Electricaland Basic Metal Products) and Metal Products (except Machineryand Transportation Equipment). Labor and energy are substitutesfor the remaining subgroups. All industries except Machineryshow a high degree of substitutability between materials andenergy.
(ii) The elasticity of substitution between capital and energy(r- ) varies between 0.43 for product group Machinery (exceptKE
Electrical and Basic Metal Products) and 1.245 for TransportEquipment. For the textile product group, is equal to 0.915.
(iii) Estimates of own-price elasticity of various demand inputsshown in Table V.4 show considerable variation across indus-tries. In general the own-price elasticity estimates of thedemand for energy tend to be somewhat higher than those forlabor, capital and raw materials. While the range for energyis -.24 to -2.05, the range for labor is -.62 to -1.15. Forexample, in the case of textiles, own-price elasticity forenergy is -0.93 compared with own price elasticity of -0.799for labor.
The conclusions drawn by the authors are: (a) For most industriesfactors other than labor appear to be fairly good substitutes for energy, and,hence, lack of energy or rather, increases in energy input prices, alonecannot be a severe bottleneck to the continued growth of India's manufacturingsector; and, (b) The own-price elasticity of energy is generally higher thanthe own-price elasticity of other inputs indicating that energy input canallow a fair amount of adjustment in a firm's production response to factorprice changes.
It is difficult, at this stage, to make a judgement about the data,methodology and assumptions made in the two studies on India cited above.However, the results on capital-energy or labor-energy substitution possi-bilities should be reviewed with care. Since capital is also relatively
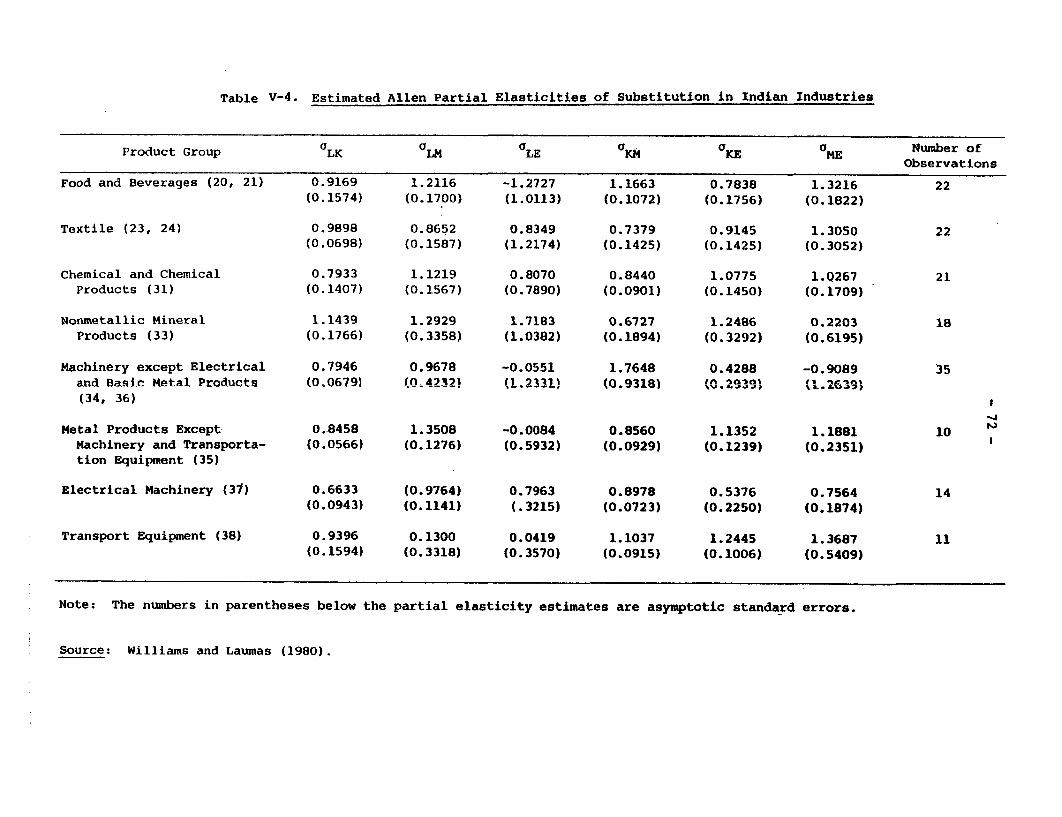
Table V-4. Estimated Allen Partial Elasticities of Substitution in Indian Industries
Product Group OLK LM aLE KM UKE ME Number ofObservations
Food and Beverages (20, 21) 0.9169 1.2116 -1.2727 1.1663 0.7838 1.3216 22(0.1574) (0.1700) (1.0113) (0.1072) (0.1756) (0.1822)
Textile (23, 24) 0.9898 0.8652 0.8349 0.7379 0.9145 1.3050 22(0.0698) (0.1587) (1.2174) (0.1425) (0.1425) (0.3052)
Chemical and Chemical 0.7933 1.1219 0.8070 0.8440 1.0775 1.0267 21Products (31) (0.1407) (0.1567) (0.7890) (0.0901) (0.1450) (0.1709)
Nonmetallic Mineral 1.1439 1.2929 1.7183 0.6727 1.2486 0.2203 l8Products (33) (0.1766) (0.3358) (1.0382) (0.1894) (0.3292) (0.6195)
Machinery except Electrical 0.7946 0.9678 -0.0551 1.7648 0.4288 -0.9089 35and Basic Metal Products (0.0679) (O4232) (1.2331) (0.9318) (0.2939) (1.2639)(34, 36)
-j
Metal Products Except 0.8458 1.3508 -0.0084 0.8560 1.1352 1.1881 10Machinery and Transporta- (0.0566) (0.1276) (0.5932) (0.0929) (0.1239) (0.2351)tion Equipment (35)
Electrical Machinery (31) 0.6633 (0.9764) 0.7963 0.8978 0.5376 0.7564 14(0.0943) (0.1141) (.3215) (0.0723) (0.2250) (0.1874)
Transport Equipment (38) 0.9396 0.1300 0.0419 1.1037 1.2445 1.3687 11(0.1594) (0.3318) (0.3570) (0.0915) (0.1006) (0.5409)
Note: The numbers in parentheses below the partial elasticity estimates are asymptotic standard errors.
Source: Williams and Laumas (1980).
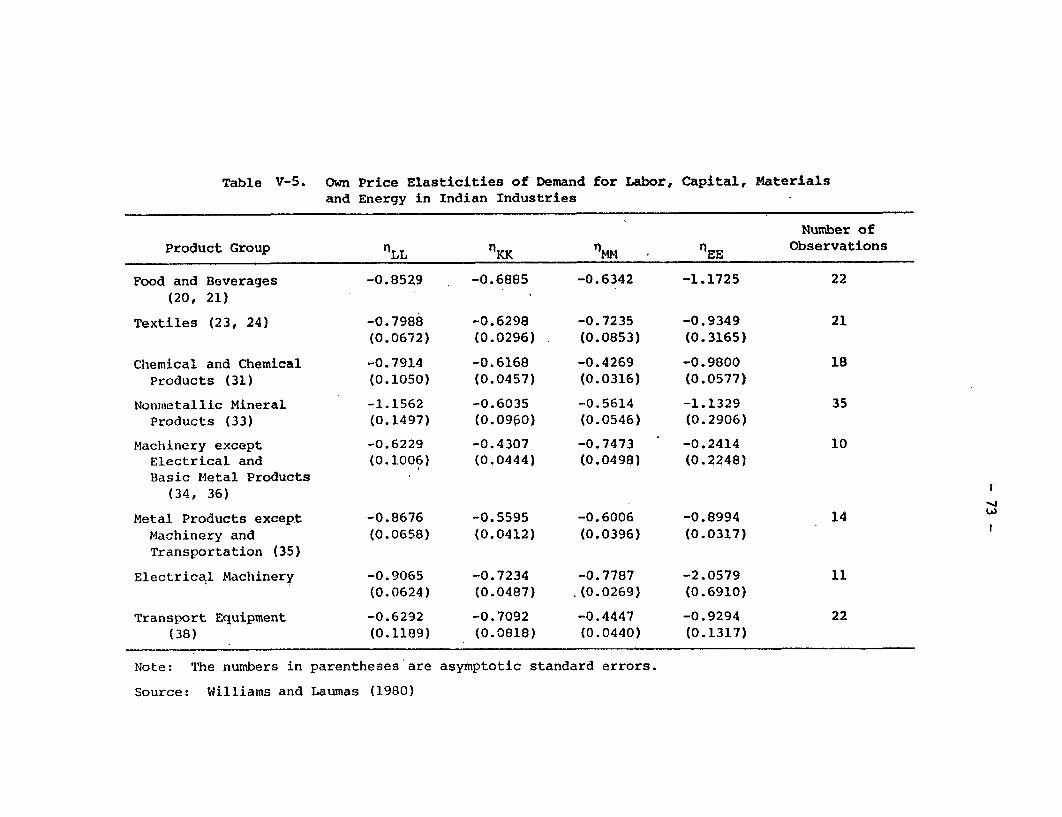
Table V-5. Own Price Elasticities of Demand for Labor, Capital, Materialsand Energy in Indian Industries
Number of
Product Group DLL KK MM O EE observations
Food and Beverages -0.8529 -0.6885 -0.6342 -1.1725 22
(20, 21)
Textiles (23, 24) -0.7988 -0.6298 -0.7235 -0.9349 21(0.0672) (0.0296) (0.0853) (0.3165)
Chemical and Chemical -0.7914 -0.6168 -0.4269 -0.9800 18
Products (31) (0.1050) (0.0457) (0.0316) (0.0577)
Nonmetallic Mineral -1.1562 -0.6035 -0.5614 -1.1329 35
Products (33) (0.1497) (0.0960) (0.0546) (0.2906)
Machinery except -0.6229 -0.4307 -0.7473 -0.2414 10
Electrical and (0.1006) (0.0444) (0.0498) (0.2248)
Basic Metal Products
(34, 36)
Metal Products except -0.8676 -0.5595 -0.6006 -0.8994 14
Machinery and (0.0658) (0.0412) (0.0396) (0.0317)
Transportation (35)
Electrical Machinery -0.9065 -0.7234 -0.7787 -2.0579 11(0.0624) (0.0487) .(0.0269) (0.6910)
Transport Equipment -0.6292 -0.7092 -0.4447 -0.9294 22
(38) (0.1189) (0.0818) (0.0440) (0.1317)
Note: The numbers in parentheses are asymptotic standard errors.
Source: Williams and Laumas (1980)
- 74 -
scarce in developing countries, the scope of its substitution for energy maynot be of much help. On the other hand, Williams and Laumas (1980) find thatlabor is substitutable for capital only in a few industries, accounting forless than half of the sample output. This result notwithstanding, there isneed to study interfuel and interfactor substitution possibilities at a moredisaggregated, sub-industry or a manufacturing-unit level, where the locationalcharacteristics of input supplies are implicitly taken into account.
The applicability of the translog approach in the LDC context needsto be carefully reviewed for the following reasons: (a) Data on energy demandusually refer to energy consumption rather than demand. (b) The bulk ofenergy consumption may be accounted for by the government and public enter-prises 11/ who are less likely to base energy decisions on cost minimizationon account of operating constraints or management objectives other than profitmaximization. (c) In the household sector, consumption decisions may be morea function of supply availability than price. (d) User choices among alterna-tive energy sources will usually be affected by auxiliary costs associatedwith each fuel source, and by non-price considerations which may outweighprice differentials. (e) For many LDCs the structure of the economy may bechanging fast due to industrial modernization, urbanization, and the suddenintroduction of commercial energy supplies into particular regions of acountry (for example, rural electrification). In this setting, the structureof energy demand itself will be changing rapidly and this will bias parameterestimation for models based on a static structure of energy demand.
Jankowski (1980) has presented an analysis of industrial energydemand for four developing countries -- Brazil, India, Korea, and Kenya --with a view to assessing the potential conservation of energy. In this study,industrial energy demand is a function of the absolute size of the industrialsector, the structure of output and the energy intensity of production.
The four countries selected differ significantly in terms of levelof per capita income, share of industrial output in GDP and growth rates ofindustrial output. The structure of industrial output is studied at disaggre-gated level and energy demand is also considered by fuel. The evidencebetween the structure of industry and growth of energy demand was mixed. In
11/ For example, estimates show that over half of the motor gasolineconsumption in India is due to the government and organized industry andtrade. Since private enterprise can often pass on the higher energycosts to consumers due to their monopolistic positions or via government'sraising the price of the final product (such price fixing is common forcommodities in shortage such as cotton textiles), or by winning specialtax reductions from the government, the incentives for cost minimizationare not very strong. Besides, energy costs represent a relatively smallportion of the total input costs in many industries, and managementskills are probably used more to reduce other (non-energy) unit inputcosts, meet with operating constraints, and a whole array of managementobjectives other than profit maximization.
- 75 -
one case -- Kenya -- the industrial energy demand grew faster than industrieswhile in Brazil, rapid industry growth has been accompanied by comparableenergy demand increases despite the greater role of heavy industries in totaloutput. In India, the structure of fuel sources -- namely the high dependenceon coal -- appears more significant in explaining industrial energy demandthan does the structure of its output mix. He has noted large differences inenergy intensity of industrial output (energy requirements per unit of output)both among and within manufacturing subsectors. These differ from one unit toanother due to the type of process used, the ages of plants and capacityutilization.
Jankowski finds that energy-intensiveness in LDC manufacturingsectors, except where the capital stock is relatively new, is usually greaterthan in similar industrial countries. Specific energy requirements for ironand steel, cement, pulp and paper, chemicals and basic metals have beenreviewed in many developed and developing countries. It is suggested thatenergy savings through housekeeping measures and minor investments are possiblein all industries, but new technologies are expected to be the determiningfactors in long-run industrial energy demand. However, energy efficiency isusually not the primary factor in technology choice and the latter may bedetermined by capital costs, availability of raw materials, etc. Interfuelsubstitution may thus conflict with strict energy conservation efforts. Heconcludes that there remains a great need for further plant-by-plant study onall of these aspects of industrial energy conservation.
Desai (1980b) has provided a detailed documentation of interfuelsubstitution in the Indian economy during the period 1960-1977. He hasanalyzed interfuel shifts in the industrial sector, power generation, railways,agriculture, and domestic cooking and lighting. His analysis of the industrialsector shows that in the sixties there was a distinct shift to oil mainlybecause of availability of increasing quantities of furnace oil from domesticrefineries. This growth continued into early seventies resulting in fuel oilimports. However, with higher oil import prices after 1973-74, rationing andhigher domestic prices resulted in substitution of coal for furnace oil until1977, after which non-availability of coal slowed down the inter-fuel shifts.For example, in the case of cement production, which is a heat consumingprocess, the proportion of oil in the energy input rose from virtually zero in1960 to 11 percent in 1965 and fell to 1 percent in 1977. These results arealso confirmed by detailed data on cement in two states - Gujarat and Tamilnadu.His analysis for nine major industries consuming fuel oil shows significantvariations in the ratios of oil input to industry output during the period1972-77. Although the reasons for these variations have not been explained,this does indicate the possibilities of interfuel substitution.
Desai (1980a) has analyzed fuel consumption in thermal power plants
for selected years during 1955-1977 in India. He finds that fuel efficiencyof steam plants has steadily improved from 18.3 percent in 1955 to 26.2percent in 1977. The proportion of oil in the total heat input increased from
1 percent in 1955 to 12.5 percent in 1970 and to 10.5 percent in 1977.However, significant shifts back from oil to coal after 1973 could not be
accomplished since coal mines are concentrated in the Northeast, and there are
- 76 -
severe transport bottlenecks for coal. These results are also confirmed bydata on three individual states which are located near the refineries and areaway from coal mines. His tentative conclusion is that use of oil in steamgeneration and other purely thermal uses was not associated with a higher fueleficiency than was the use of coal. The relative prices of furnace oil andcoal have been such that furnace oil has been two to three times as costly perunit of energy as coal during the period 1970-79. Thus, although there was nogeneral cost incentive to use furnace oil, it found markets near refineries,away from coalfields and in industries where it offered some non-price advan-tages over coal. (For example, greater controllability of process, readyavailability, no ash disposal problem, etc.).
Schramm and Munasinghe (1980) have analyzed the interrelations oftechnical, economic, social and organizational aspects of user choice amongalternative energy sources with a case study on tobacco curing in Thailand.The alternatives examined are woodfuel, lignite, lignite briquettes, anddiesel - both at current and projected price levels, using both market pricesand shadow prices. The results show that the use of lignite briquettes inplace of diesel oil would be economic both in terms of social and financialconsiderations if 1979 petroleum-product world prices are assumed to prevailin the future. However, the study emphasizes that user choices among alterna-tive energy sources will usually be determined only partially by the financialcosts of each alternative fuel compared on a net heat content basis, but moresignificantly by the "auxiliary costs" to the user of utilizing each one ofthem. These will be made up by the costs of labor, capital and land relatedto receiving, unloading, storage, handling, and also reflect such otherfactors as ease of control in use and potential risks, waste material disposaland system maintenance. Reliability of supply and transportation, uniformityof quality, and the effect on the quality of processed materials will be otherimportant considerations. Work habits and the availability of experiencedoperators may also significantly affect use if the choice is between customarily-used energy materials and new alternatives of unknown characteristics.
V.2 Household (Residential) Sector
Developed Countries
The household demand for energy has been the focus of a number ofrecent studies, but the evidence on the role of energy in the consumptionbasket and on interfuel substitution is still mixed. Some of the majorstudies on this subject are Adams and Griffin (1974), Pindyck (1979d, 1980a),Nordhaus (1977), and Griffin (1977c) for international comparisons; and Baugh-man and Joskow (1974a,b), Joskow and Baughman (1976), Nelson (1975), Halvorsen(1975), and Mount, Chapman and Tyrrell (1973, 1974) for the U.S. Some ofthese deal with aggregate energy use by the residential consumers, whereassome use fuel consumption and price data for individual fuels, usuallycombined with regional/locational disaggregation. In addition, the twosurvey articles by Taylor (1975, 1977) on electricity demand are also useful.
Broadly, the models can be classified into two types: deriveddemand models and utility-maximizing models. In the first type, energy
- 77 -
demand, and in particular the characteristics of the interfuel substitution,are expected to be highly dependent on the stock of energy-using appliances,at least in the short run. The second approach considers durable goods as aseparate consumption category and assumes that consumers make two simultaneousutility-maximizing decisions in purchasing fuels. With the amount of money tobe spent on energy taken as given, consumers allocate these expenditures amongfuels - oil, natural gas, coal and electricity. Consumers further decide whatfraction of their total consumption budget will be spent on energy as opposedto other categories of consumption such as food and clothing. Thus, thismodel is a two-part approach where, under certain assumptions, the expenditure-shares among different categories of consumption goods (including energy) aswell as shares of different fuels are determined simultaneously.
Pindyck (1979d) has used the following procedure for applying theindirect translog utility function to a two-part model of the residentialdemand for energy. The first step is to estimate the translog price aggre-gator that will be used to obtain an aggregate price index for energy. Thisinvolves first estimating the share equations corresponding to a homothetictranslog function. 12/ Next the expenditure-share equations are estimated forthe six categories of consumption expenditures. The estimated aggregatedprice index for energy is used as an instrumental variable for the price ofenergy in the estimation of these equations. After estimating the shareequations the parameters are used to obtain elasticities of demand for energyand the other consumption categories. The expenditure-share equations arenext applied to the breakdown of energy expenditures into expenditure on indi-vidual fuels. 13/ The models have been estimated using pooled time-series/cross-section data for nine countries (including the US). The results of thePindyck study and a comparison with other estimates are available in TablesV.6 and V.7. Since the results are based on pooling international time-series/cross-section data, the sample was large enough to yield low-varianceestimates of essentially long-run elasticities.
One of the important conclusions of Pindyck's study is that theown-price elasticity of aggregate energy use in the residential sector appearsto be much larger in the long-run than had been thought previously. He hasobtained an estimate of this elasticity of about -1.1. This is at the upperend of the range of estimates found by others and certainly higher than theconsensus range of estimates (-0.25) used for policy analysis and forecastingin the US. There is also considerable variation in price elasticities for
12/ The equation used for the four-fuel categories is:
S. =2( + . .. log P. i = 1...4i i J 3
13/ In estimating these equations restrictions of homotheticity are imposed apriori, as required for a two-stage model of utility maximization.Homotheticity of the indirect utility function means that the expenditureshares S are independent of total expenditures M, and this implies thatthe income elasticities of demand for every good are the same and equalto unity.
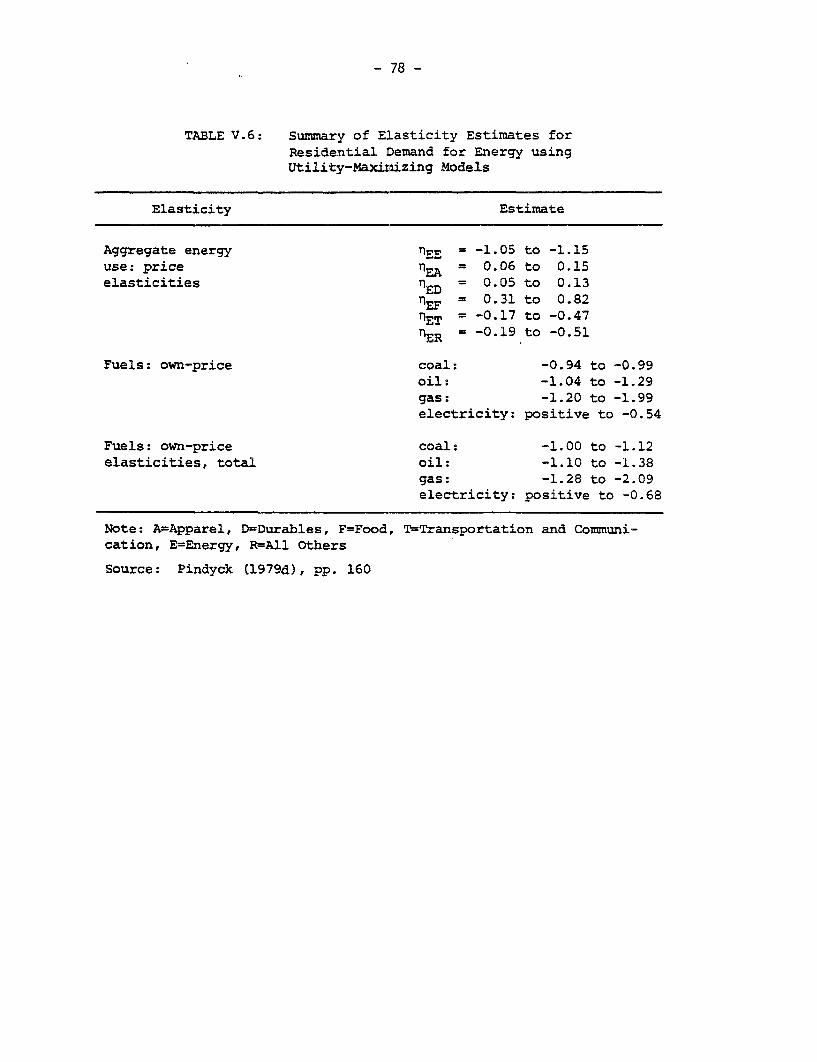
- 78 -
TABLE V.6: Summary of Elasticity Estimates forResidential Demand for Energy usingUtility-Maximizing Models
Elasticity Estimate
Aggregate energy nEE = -1.05 to -1.15use: price nEA = 0.06 to 0.15elasticities TED = 0.05 to 0.13
nEF = 0.31 to 0.82
nET = -0.17 to -0.47nER = -0.19 to -0.51
Fuels: own-price coal: -0.94 to -0.99oil: -1.04 to -1.29gas: -1.20 to -1.99electricity: positive to -0.54
Fuels: own-price coal: -1.00 to -1.12elasticities, total oil: -1.10 to -1.38
gas: -1.28 to -2.09electricity: positive to -0.68
Note: A=Apparel, D=Durables, F=Food, T=Transportation and Communi-cation, E=Energy, R=All Others
Source: Pindyck (1979d), pp. 160
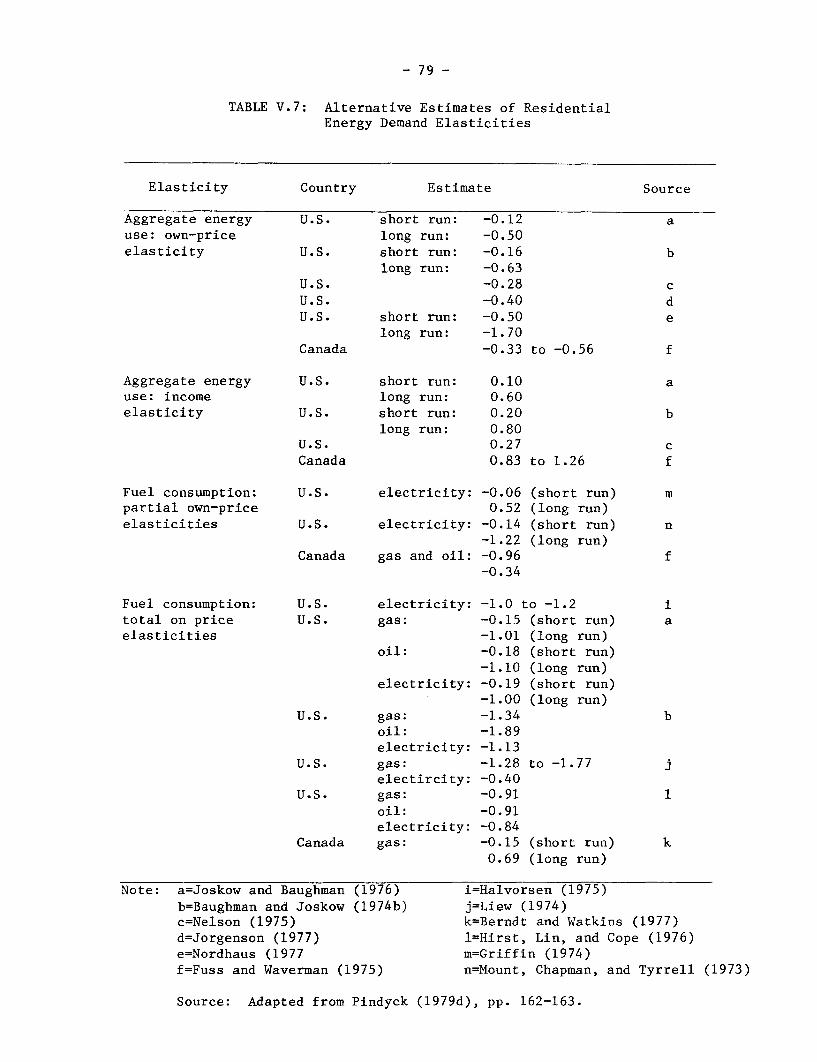
- 79 -
TABLE V.7: Alternative Estimates of ResidentialEnergy Demand Elasticities
Elasticity Country Estimate Source
Aggregate energy U.S. short run: -0.12 ause: own-price long run: -0.50elasticity U.S. short run: -0.16 b
long run: -0.63U.S. -0.28 cU.S. -0.40 dU.S. short run: -0.50 e
long run: -1.70Canada -0.33 to -0.56 f
Aggregate energy U.S. short run: 0.10 ause: income long run: 0.60elasticity U.S. short run: 0.20 b
long run: 0.80U.S. 0.27 cCanada 0.83 to 1.26 f
Fuel consumption: U.S. electricity: -0.06 (short run) mpartial own-price 0.52 (long run)elasticities U.S. electricity: -0.14 (short run) n
-1.22 (long run)Canada gas and oil: -0.96 f
-0.34
Fuel consumption: U.S. electricity: -1.0 to -1.2 itotal on price U.S. gas: -0.15 (short run) aelasticities -1.01 (long run)
oil: -0.18 (short run)-1.10 (long run)
electricity: -0.19 (short run)-1.00 (long run)
U.S. gas: -1.34 boil: -1.89electricity: -1.13
U.S. gas: -1.28 to -1.77 jelectircity: -0.40
U.S. gas: -0.91 1
oil: -0.91electricity: -0.84
Canada gas: -0.15 (short run) k0.69 (long run)
Note: a=Joskow and Baughman (1976) i=Halvorsen (1975)b=Baughman and Joskow (1974b) j=Liew (1974)c=Nelson (1975) k=Berndt and Watkins (1977)
d=Jorgenson (1977) 1=Hirst, Lin, and Cope (1976)e=Nordhaus (1977 m=Griffin (1974)f=Fuss and Waverman (1975) n=Mount, Chapman, and Tyrrell (1973)
Source: Adapted from Pindyck (1979d), pp. 162-163.
- 80 -
individual fuels. Own-price elasticities (total) for solid and liquid fuelfall within the range of -1 and -1.25, those for natural gas to be about -1.7,and those for electricity to be between 0 and -0.4. It is also found thatwhen US and Canada are pooled separately, the above elasticities for the USand Canada are about half as large as those for the European countries.Pooling US and Canada separately yields elasticities for electricity near -1for these countries but near 0 for some of the European countries. Whencompared with other estimates, these elasticities are generally higher thanthose estimated by others. A major reason for this is the use of pooledinternational data which is more likely to elicit long-run elasticities. Itis further postulated that the median lag (or adjustment speed) for theindividual fuel elasticities may be around six to nine years.
The impact of energy price increases on households in the US hasbeen studied by Stucker (1976). The methodology uses households' directexpenditure on energy from household budget studies. The indirect consumptionof energy is estimated by applying production coefficients - derived frominput-output analysis - to the household's non-energy expenditures. Thus,total energy requirements are obtained and stated as percentages of householdincome for five types of fuel - crude petroleum, coal, refined petroleumproducts, electricity and natural gas. These percentages allow one to esti-mate the impact of increases in any of the energy prices on the householdsassuming, as a first approximation, that the price changes result in nosubstitution among goods in general or energy forms in particular either inproduction or in consumption. These estimates have to be viewed as upperbounds on national average budget impacts and may also not be relevant formedium and long-run. The conclusions for the US can be summarized as follows:(a) Direct energy expenditures are usually regressive in their structure;lower income households spend a greater portion of their consumption budget(and their income) on energy purchases than wealthier families; (b) Indirector induced energy expenditures also appear to be regressive, although less sothan the direct expenditures; (c) The indirect energy requirements are defi-nitely important in assessing the impact of price changes. They probablyrepresent over half of all energy transactions, and estimates of price changeeffects that ignore these transactions will be substantially understated; (d)All of the obvious types of energy taxes are probably regressive, utility gastaxes are probably the more regressive, and taxes on refined petroleum pro-ducts - including gasoline - the least.
Developing Countries
The nature of residential consumer demand for energy in many develop-ing countries tends to be very different from that in the developed countries,and would show considerable variation, particularly between urban and ruralareas. For example, whereas the industrial sector may predominantly rely oncommercial fuels, a significant part of the total residential consumption ofenergy comes from non-commercial or traditional sources. For non-commercialsources, price data are by definition absent, and quantity data may be obtainedonly from a combination of surveys and guesswork. Even for commercial fuels,retail data are usually difficult to obtain or unavailable, except for electri-city, and these data may not be easily comparable across various regions of
- 81 -
the country. Energy consumption overall, or of one fuel over another, may bedetermined more by availability rather than price differences. Finally, amuch larger proportion of the total household energy consumption in LDCs islikely to be devoted to cooking and lighting purposes rather than spaceheating or appliance usage. The urban/rural difference or income groupdifferences in this respect are also likely to be more dramatic in LDCs. Forall of these reasons, the analysis of household/residential energy consumptionin LDCs is not very amenable to econometric modelling or other sophisticatedtechniques. However, in some isolated cases such studies have been made.The rest of the work in this area has relied upon simple, informal analyses.
Fernandez (1980) has analyzed data on household energy consumptionin eight non-OPEC developing countries to explore the level and composition oftotal fuel consumption by households at different income levels within eachcountry. Comparisons are made between urban and rural areas in the samecountry as well as among countries. In addition, for two countries the effectof household size on fuel consumption is explored. The data show that non-commercial fuels are the dominant energy source in both urban and ruralhouseholds at all but the highest income levels. The results on incomeelasticity of fuel consumption indicate that the elasticity of consumption ofall fuels combined is in the range of 0.6 to 0.8. (See table V.8). In urbanareas, the elasticity of consumption of commercial fuels is much higher thanfor non-commercial fuels while in rural areas the elasticities for the twofuel categories are more nearly equal. Although these findings should beregarded with caution because of technical difficulties in estimating theelasticities, it is clear that fuel consumption increases noticeably amonghigher income households within each country. The study also shows (based onthe analysis of data from Korea and Pakistan) that although household sizeaffects the estimates of income elasticity, no conclusions are possibleregarding the magnitude of the influence of household size. It does appear,however, that estimating income elasticities without controlling for householdsize leads to overestimates of the true elasticities as shown in Table V.9 forKorea and Pakistan. Another conclusion of the study is that electricity andgas consumption increase dramatically among higher income groups. This largeincrease is the result of two reinforcing effects: (i) an increase in totalfuel consumption among high income households, and (ii) their strong tendencyto substitute electricity and gas for non-commercial fuels. The study hasemphasized the need for reliable data on the quantities of fuels, especiallynon-commercial fuels, consumed by households which are comparable amongcountries.
Cody (1980) compares estimates of income elasticity of residentialdemand for energy in Bombay and Nairobi with those in the US and hypothesizes
about structural differences in the income-energy use relationship. Thefindings indicate that aggregate energy demand is moderately income elastic inall three samples and the LDCs are not significantly different than the US in
this respect. However, the findings are distinctly different for specificfuels, particularly electricity. Household demand patterns for kerosene,solid fuels, LPG and electricity in LDCs differ from those in the US becausehouseholds in the latter countries demonstrate strong social preferences for
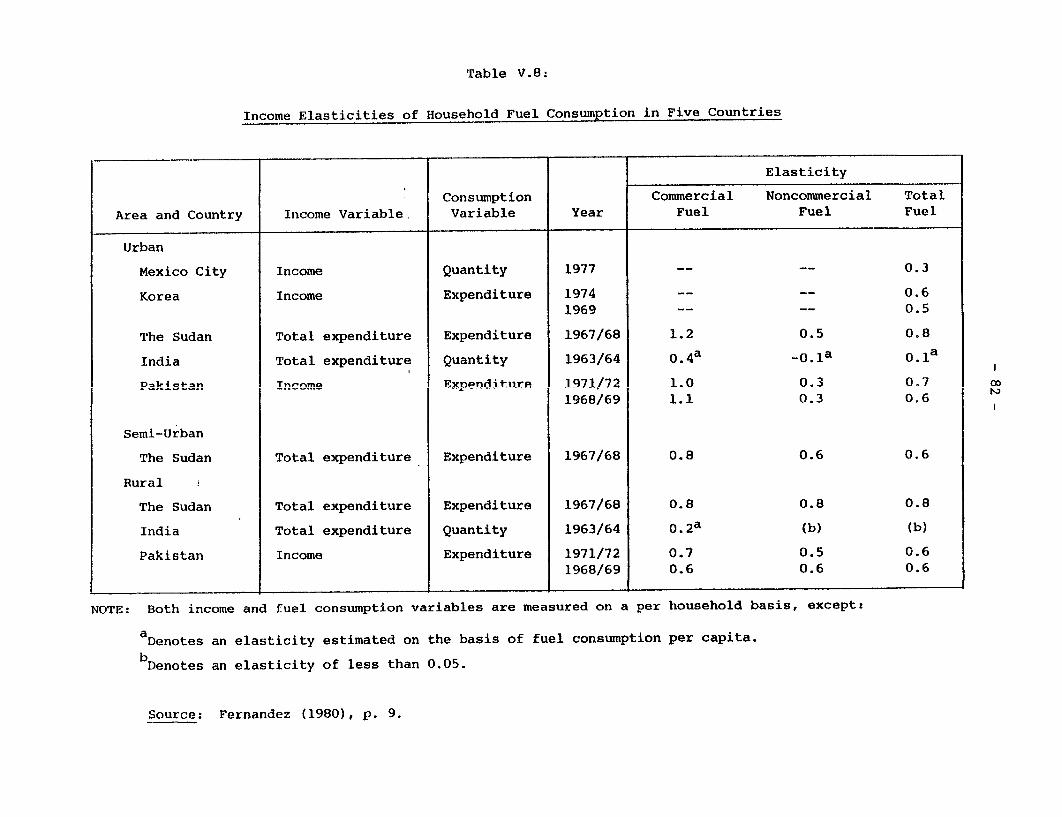
Table V.8:
Income Elasticities of Household Fuel Consumption in Five Countries
Elasticity
Consumption Commercial Noncommercial Total
Area and Country Income Variable. Variable Year Fuel Fuel Fuel
Urban
Mexico City Income Quantity 1977 -- -- 0.3
Korea Income Expenditure 1974 -- -- 0.6
1969 -- -- 0.5
The Sudan Total expenditure Expenditure 1967/68 1.2 0.5 0.8
India Total expenditure Quantity 1963/64 0 .4a -0.1a 0.1a
Pakistan Income Expenditure 1971/72 1.0 0.3 0.7 001968/69 1.1 0.3 0.6
Semi-Urban
The Sudan Total expenditure Expenditure 1967/68 0.8 0.6 0.6
Rural
The Sudan Total expenditure Expenditure 1967/68 0.8 0.8 0.8
India Total expenditure Quantity 1963/64 0 .2a (b) (b)
Pakistan Income Expenditure 1971/72 0.7 0.5 0.6
1968/69 0.6 0.6 0.6
NOTE: Both income and fuel consumption variables are measured on a per household basis, except:
a Denotes an elasticity estimated on the basis of fuel consumption per capita.
bDenotes an elasticity of less than 0.05.
Source: Fernandez (1980), p. 9.
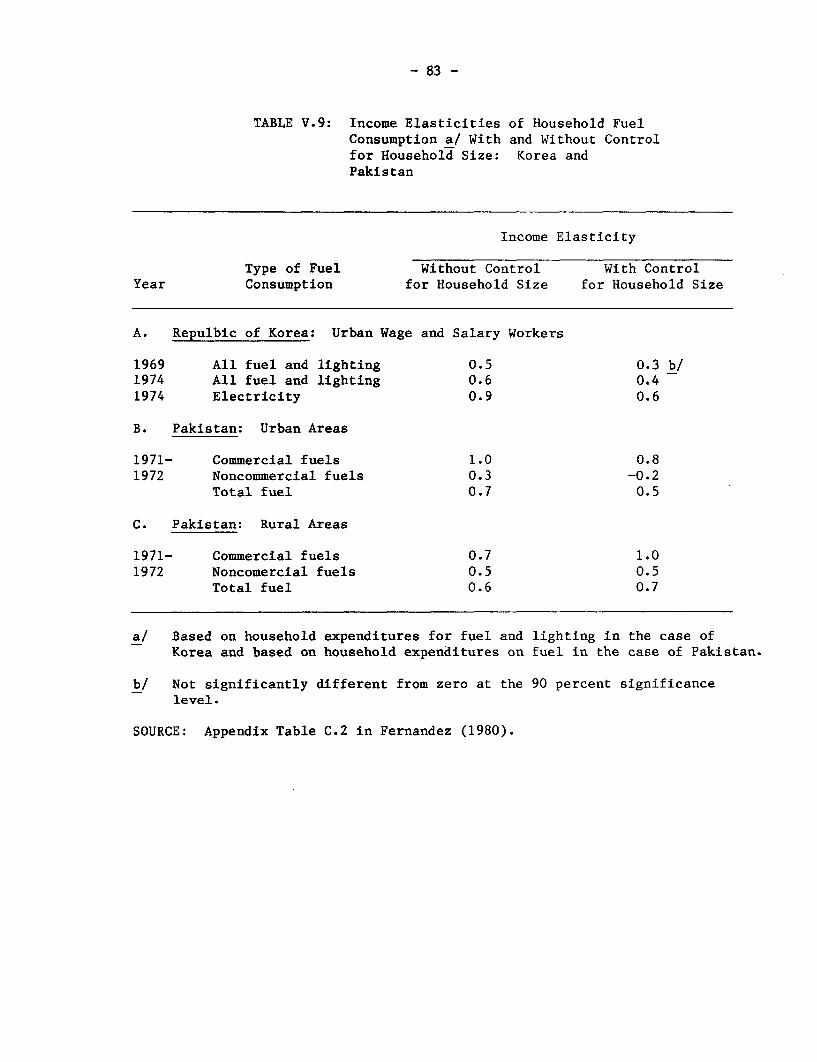
- 83 -
TABLE V.9: Income Elasticities of Household FuelConsumption a/ With and Without Controlfor Household Size: Korea andPakistan
Income Elasticity
Type of Fuel Without Control With ControlYear Consumption for Household Size for Household Size
A. Repulbic of Korea: Urban Wage and Salary Workers
1969 All fuel and lighting 0.5 0.3 b/1974 All fuel and lighting 0.6 0.41974 Electricity 0.9 0.6
B. Pakistan: Urban Areas
1971- Commercial fuels 1.0 0.81972 Noncommercial fuels 0.3 -0.2
Total fuel 0.7 0.5
C. Pakistan: Rural Areas
1971- Commercial fuels 0.7 1.01972 Noncomercial fuels 0.5 0.5
Total fuel 0.6 0.7
a/ Based on household expenditures for fuel and lighting in the case ofKorea and based on household expenditures on fuel in the case of Pakistan.
b/ Not significantly different from zero at the 90 percent significancelevel.
SOURCE: Appendix Table C.2 in Fernandez (1980).
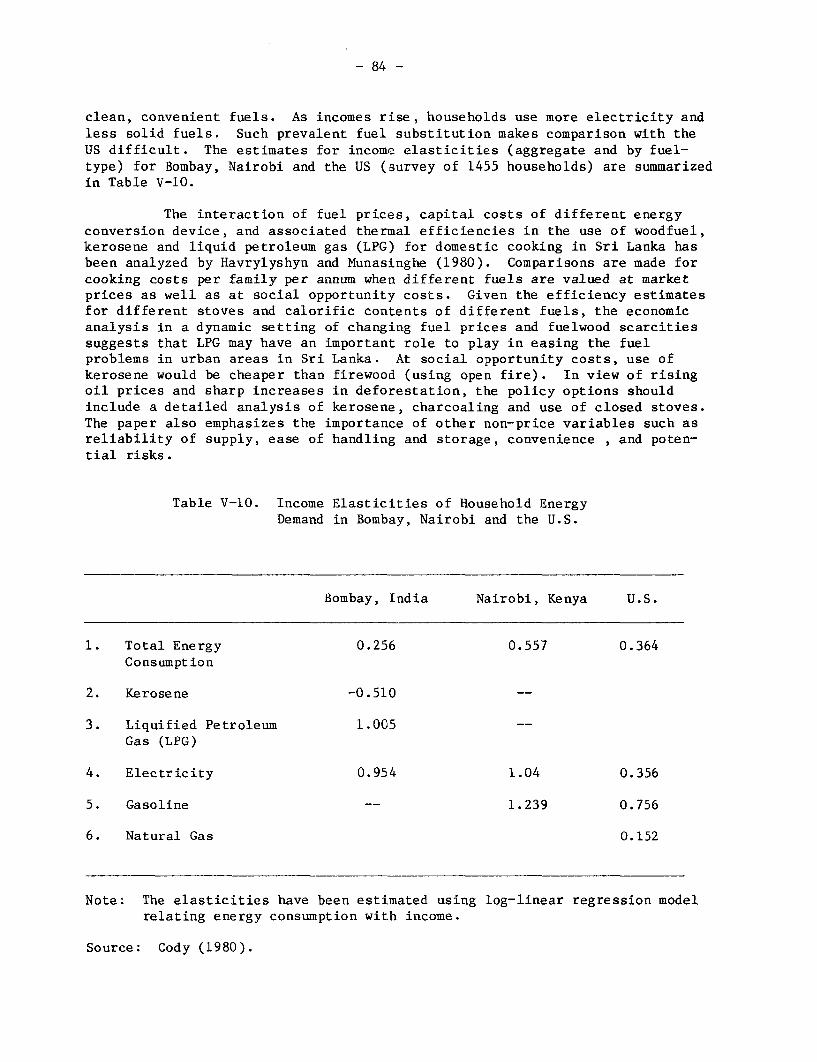
- 84 -
clean, convenient fuels. As incomes rise, households use more electricity andless solid fuels. Such prevalent fuel substitution makes comparison with theUS difficult. The estimates for income elasticities (aggregate and by fuel-type) for Bombay, Nairobi and the US (survey of 1455 households) are summarizedin Table V-10.
The interaction of fuel prices, capital costs of different energyconversion device, and associated thermal efficiencies in the use of woodfuel,kerosene and liquid petroleum gas (LPG) for domestic cooking in Sri Lanka hasbeen analyzed by Havrylyshyn and Munasinghe (1980). Comparisons are made forcooking costs per family per annum when different fuels are valued at marketprices as well as at social opportunity costs. Given the efficiency estimatesfor different stoves and calorific contents of different fuels, the economicanalysis in a dynamic setting of changing fuel prices and fuelwood scarcitiessuggests that LPG may have an important role to play in easing the fuelproblems in urban areas in Sri Lanka. At social opportunity costs, use ofkerosene would be cheaper than firewood (using open fire). In view of risingoil prices and sharp increases in deforestation, the policy options shouldinclude a detailed analysis of kerosene, charcoaling and use of closed stoves.The paper also emphasizes the importance of other non-price variables such asreliability of supply, ease of handling and storage, convenience , and poten-tial risks.
Table V-10. Income Elasticities of Household EnergyDemand in Bombay, Nairobi and the U.S.
Bombay, India Nairobi, Kenya U.S.
1. Total Energy 0.256 0.557 0.364Consumption
2. Kerosene -0.510 --
3. Liquified Petroleum 1.005 --
Gas (LPG)
4. Electricity 0.954 1.04 0.356
5. Gasoline 1.239 0.756
6. Natural Gas 0.152
Note: The elasticities have been estimated using log-linear regression modelrelating energy consumption with income.
Source: Cody (1980).
- 85 -
The demand for kerosene in Indonesia has been analyzed by Strout(1978). Estimates obtained for medium-term income and price elasticities forkerosene consumption, by area (urban, rural and by region) for 1970 to 1976
are reproduced in Table V-li. The (implicit) price elasticities have correctsigns indicating that consumption falls as prices rise. The results supportthe belief that an average medium-run price elasticity for the country as awhole probably lies close to -0.5. The longer-run Indonesia-wide income(expenditure) elasticity appear to be about 0.78 (for kerosene). The relation-ship between kerosene and fuelwood prices has been studied under alternativeassumptions about cross-price elasticities. Projections for future kerosene
consumption have been made for 1985 based on assumptions about future popula-tion growth, income growth, and two price change scenarios: (a) no change inreal prices of kerosene, and (b) removal of kerosene subsidy and an approximatedoubling of the kerosene prices. He concludes that (a) a doubling of kerosene
prices would reduce kerosene consumption by a considerable amount in the mediumterm; (b) there would be no need to subsidize diesel/residual fuels whichcompete with kerosene; (c) since kerosene expenditure by middle and lowerincome groups may amount to 4 percent of their annual budget, a doubling of
kerosene prices would mean a 4 percent increase in living costs for thesegroups; (d) in relative terms, the average rural consumer would be less hurtinitially than the urban consumer because a small fraction of the farmer'sannual expenditure goes for kerosene.
However, Wilcox (1980) has argued that the relevant criterion is notthe kerosene expenditure as proportion of total expenditure but its share intotal out-of-pocket expenditures in low income households, especially in rural
areas. Using Indian data on kerosene consumption levels at different income
levels and other variables from a variety of sources, Wilcox concludes that:
(a) the demand for kerosene is highly inelastic, and households currently
using kerosene for lighting in both urban and rural areas lack substitutes;
(b) the price rise (or removal of subsidies) would impose a heavy burden on
all households using kerosene, especially in rural areas where there are nosubstitutes for lighting, and kerosene expenses are a significant proportionof total out-of-pocket expenses; and (c) secondary expenditure adjustments
occurring because of a removal of subsidy would likely result in decreasedfood expenditures, especially milk and milk products.
Finally, Cecelski, Dunkerley and Ramsay (1979) have reviewed avail-able information on household energy consumption by the poor in rural and
urban areas of the Third World. They also present data on cost factors in
renewable energy sources and discuss cultural and equity constraints condition-
ing energy usage. Their major finding is that energy consumption by the rural
and urban poor in much of Africa and Asia amounts to about 10 Gigajoules (0.3
tons of coal equivalent) per head per year and as incomes rise and as urbaniza-tion continues, consumption of commercial fuels will rise sharply.
V.3 Transport Sector
Transportation sector energy demand in developed and developing
countries may differ in a number of ways: by the share of different modes in
the total transport (passenger cars versus railways and bus transport), by
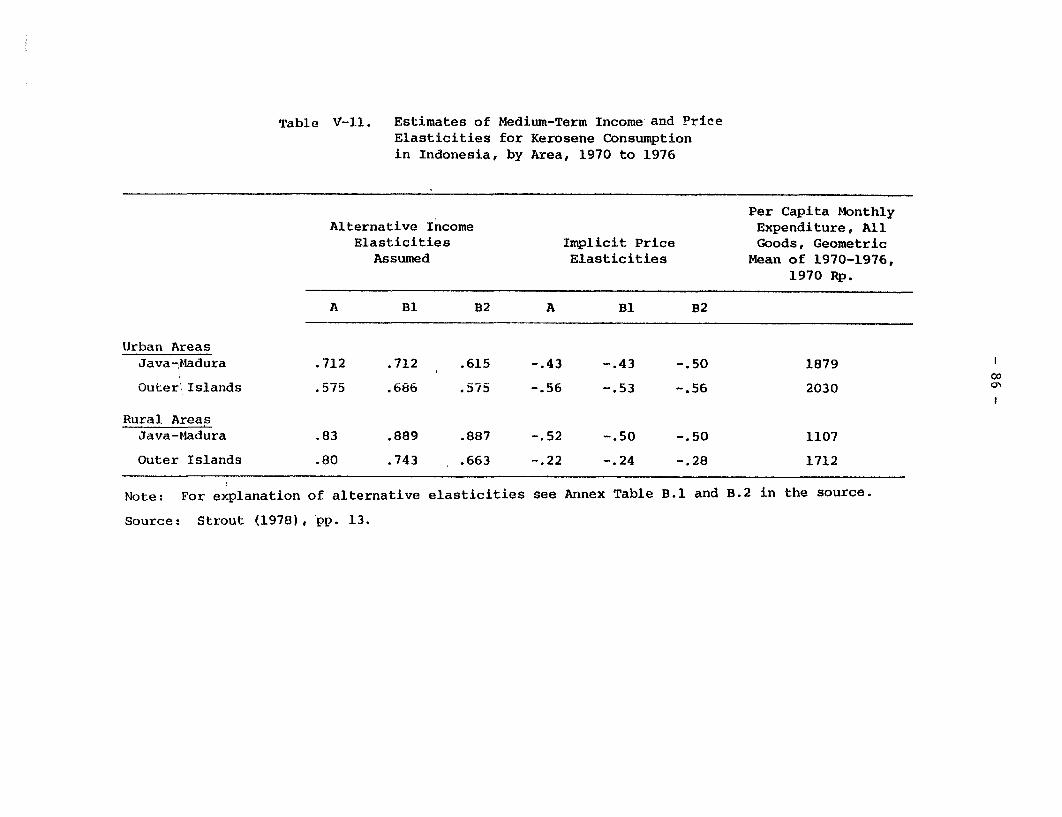
Table V-11. Estimates of Medium-Term Income and PriceElasticities for Kerosene Consumptionin Indonesia, by Area, 1970 to 1976
Per Capita MonthlyAlternative Income Expenditure, All
Elasticities Implicit Price Goods, GeometricAssumed Elasticities Mean of 1970-1976,
1970 Rp.
A B1 B2 A Bi B2
Urban AreasJava-Madura .712 .712 .615 -.43 -.43 -.50 1879
Outer Islands .575 .686 .575 -.56 -.53 -.56 2030
Rural AreasJava-Madura .83 .889 .887 -.52 -.50 -.50 1107
Outer Islands .80 .743 .663 -.22 -.24 -.28 1712
Note: For explanation of alternative elasticities see Annex Table B.1 and B.2 in the source.
Source: Strout (1978), pp. 13.
- 87 -
the different activities and end-users that a particular mode may serve (e.g.,railways used more heavily for passenger transport relative to freight indeveloping countries), and finally by the different technologies and fuelneeds (coal versus electricity in railways). For this and various otherreasons, overall comparisons of transport sector energy demand patterns andresponses between developed and developing countries are generally unlikely tobe very useful. However, for particular modes of transportation and particularfuels, such comparisons may be of considerable use - it is plausible tosuggest that Indian or Brazilian passenger automobile use of motor gasolinemay be quite comparable to similar cases in developed countries.
Unfortunately, we have not been able to find any significant studieson transport sector energy demand in developing countries. It may be that aheavy involvement of governments and public sector undertakings in LDC trans-port sector, and prevalence of complex tax/subsidy structures, make conven-tional econometric studies on the transport sector extremely difficult. Wetherefore review some of the work on developed countries reported in Pindyck(1979d) and others.
Pindyck (1979d) has presented results on the transportation demandfor energy in terms of separate models for motor gasoline, diesel fuel,aviation gasoline and jet fuel, using pooled cross-section data for 11 OECDcountries. The model for motor gasoline treats gasoline demand as a deriveddemand dependent on the stock of cars and the average size and horsepower (orfuel efficiency) of this stock, as well as on price and income directly. Themodel specification, similar to that of Adams, Graham and Griffin (1974), issuch that the stock and characteristics of cars are endogenous (and dependentin part on the price of gasoline) and in turn are explanatory variables ofgasoline demand. The model explains the annual consumption of gasoline as theratio of the total traffic volume (which in turn is product of average trafficvolume per car and stock of cars) to the average fuel efficiency of the stockof cars. Three equations determine the stock of cars, one for new registra-tions, a second for the depreciation rate and the third an accounting identity.Two more equations complete the model: one explains average traffic volumeper car, and the second explains average fuel efficiency. Short- and long-runelasticities with respect to the price of gasoline, the price of cars and percapital GDP have been calculated. The results show that the price elasticityof gasoline demand is very large in the long-run -- above one in each of theeleven developed countries studied and close to two in Norway. For the elevencountry aggregate the price elasticity exceeds one after fifteen years andreaches a value of 1.31 after twenty-five years. These results indicate thatalthough the lags are considerable, gasoline demand may be much more priceelastic in the long-run than was found in earlier studies by Houthakker,i.e., Verleger and Sheehan (1976), Ramsey, Rasche and Allen (1975) and Fussand Waverman (1975) in which the range of estimates for the US and Canada was-0.22 to -0.70. In Adams, Graham and Griffin (1974) the gasoline priceelasticity was estimated at -0.92. Pindyck concludes that higher gasolineprices could be a very effective means of reducing consumption, although anumber of years would have to pass for the effects of price increases to takeplace.
- 88 -
Similarly Sweeny (1975, 1978a, b; also see 1979b) presents a modelof demand for gasoline in the US; he estimates the demand for vehicle miles,of which the demand for gasoline is a derive demand, as a function mainly ofreal disposable per capita income and costs of such travel, and then usesthese with estimates for average mpg for the entire vehicular fleet to projectthe demand for gasoline. The model is used to analyze fuel conservationpolicies. The results are shown in Table V-12.
The demand elasticities for diesel, jet fuel and aviation gasolinein the transportation sector are also estimated in Pindyck (1979d) by usingsimple log-linear equations with a Koyck lag adjustment (that is, with alagged dependent variable) to explain the dynamic adjustment of demand tochanges in price or income. The equations are estimated using ordinary leastsquares for each of the two sets of countries in Europe, US and Canada. Thedata cover the period 1955 to 1973. The results show that long-run priceelasticities are less than -1 in the case of all products (except motorgasoline) in Europe. Tables V.12, V.13, and V.14 summarize some of theseresults.
In the only available study we have found of transportation demandfor energy in developing countries, Diwan (1978) shows that in the Indiantransport sector, the share of railways in both goods and passenger traffichas declined rapidly between 1960 and 1973 while that of roads has risenrapidly. Since railways use coal (along with diesel and electricity) and roadtransport uses only diesel fuel, over time there has been a substitution ofcoal by oil in the transport sector. Over the decade 1961-71, the use of coalhas remained virtually constant while that of oil has tripled. It is furtherpointed out that road transport is far more energy intensive (trucks burnnearly six times as much fuel as railroads) than rail transport. Theseconclusions should be treated as tentative and there is need for furtheranalysis with regard to the competitive versus complementary nature of roadtransport and the relative efficiencies of different modes of transport.
V.4 Agricultural Sector
Studies on energy and agriculture can be divided into (i) literatureon energy-use in agriculture (or food production, transport and distribution)in developed countries, (ii) studies in developing countries where agricultureis considered both a user of energy as well as a source of energy for othersectors (e.g., domestic cooking), and (iii) analyses of socio-economic andtechnological factors involved in interfuel substitution (including animateenergy) for irrigation pumping, land preparation, etc. The first categoryincludes Pimentel (1977), Leach (1979a,b), Lockeretz (1977), Heichel (1974,1976). These studies have not been included here since these relate exclu-sively to developed countries and their results and concerns are not veryapplicable to developing countries. The literature in the second category onenergy-use and the contribution of the agricultural sector in developingcountries has been extensively documented recently in a paper prepared for theAgricultural and Rural Development Division of the World Bank. This paper(Bhatia (1980c)) reviews the available literature on energy-use at the farm,
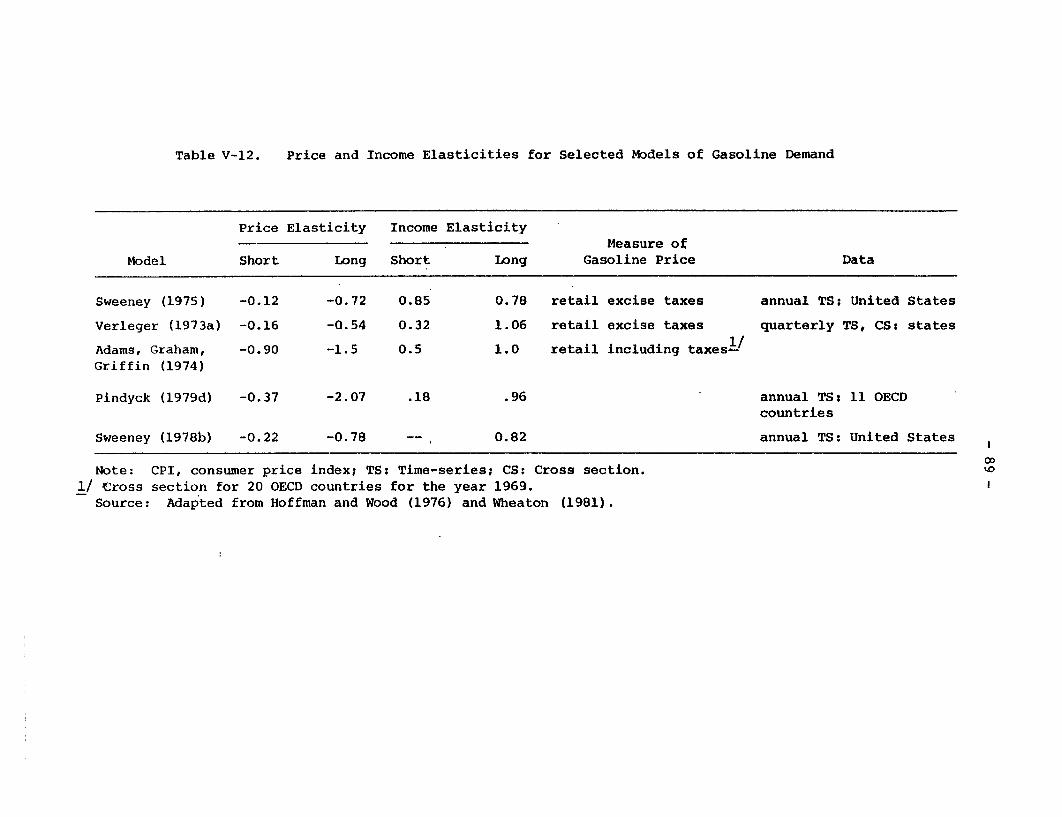
Table V-12. Price and Income Elasticities for Selected Models of Gasoline Demand
Price Elasticity Income Elasticity
Measure of
Model Short Long Short Long Gasoline Price Data
Sweeney (1975) -0.12 -0.72 0.85 0.78 retail excise taxes annual TS: United States
Verleger (1973a) -0.16 -0.54 0.32 1.06 retail excise taxes quarterly TS, CS: states
Adams, Graham, -0.90 -1.5 0.5 1.0 retail including taxesiGriffin (1974)
Pindyck (1979d) -0.37 -2.07 .18 .96 annual TS: 11 OECDcountries
Sweeney (1978b) -0.22 -0.78 -- 0.82 annual TS: United States
00Note: CPI, consumer price index; TS: Time-series; CS: Cross section. 10
1/ Cross section for 20 OECD countries for the year 1969.
Source: Adapted from Hoffman and Wood (1976) and Wheaton (1981).
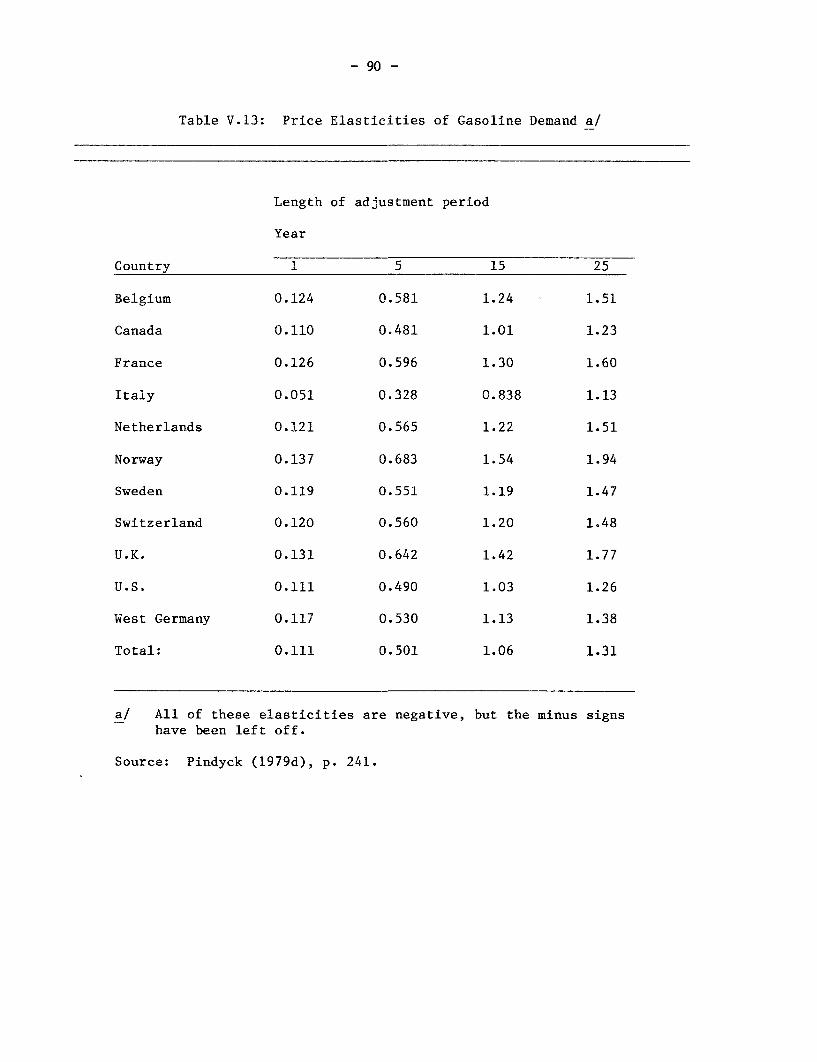
- 90 -
Table V.13: Price Elasticities of Gasoline Demand a/
Length of adjustment period
Year
Country 1 5 15 25
Belgium 0.124 0.581 1.24 1.51
Canada 0.110 0.481 1.01 1.23
France 0.126 0.596 1.30 1.60
Italy 0.051 0.328 0.838 1.13
Netherlands 0.121 0.565 1.22 1.51
Norway 0.137 0.683 1.54 1.94
Sweden 0.119 0.551 1.19 1.47
Switzerland 0.120 0.560 1.20 1.48
U.K. 0.131 0.642 1.42 1.77
U.S. 0.111 0.490 1.03 1.26
West Germany 0.117 0.530 1.13 1.38
Total: 0.111 0.501 1.06 1.31
a/ All of these elasticities are negative, but the minus signshave been left off.
Source: Pindyck (1979d), p. 241.
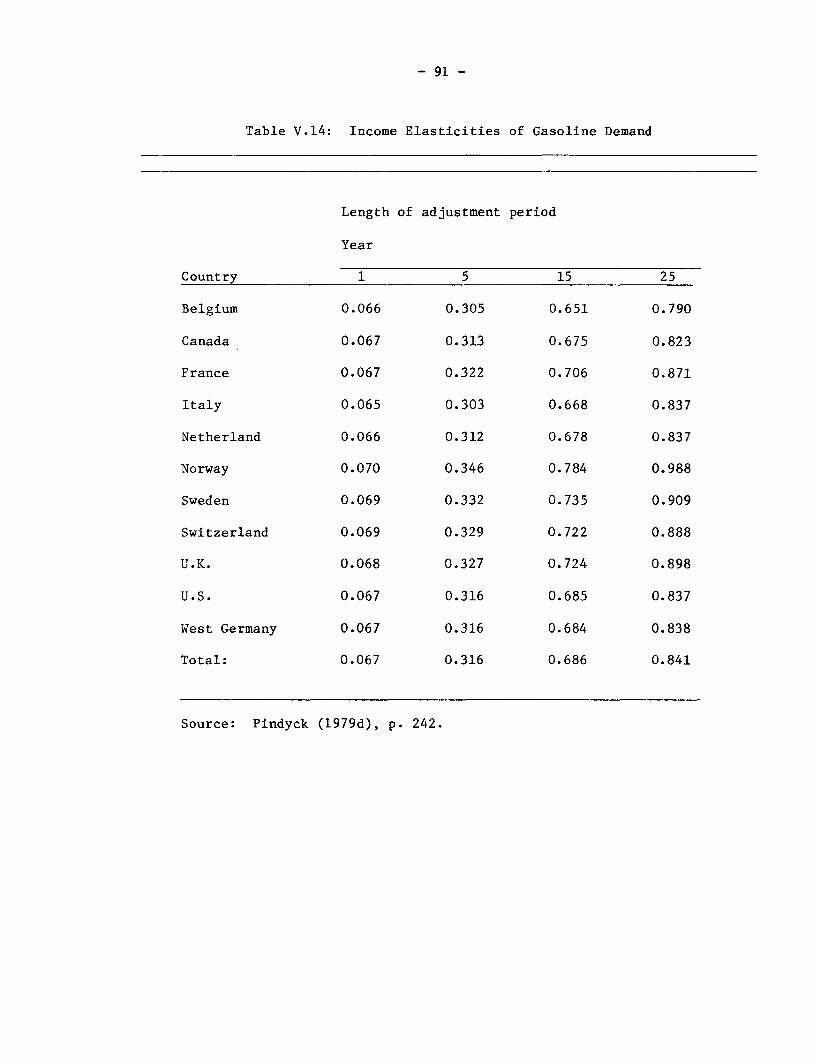
- 91 -
Table V.14: Income Elasticities of Gasoline Demand
Length of adjustment period
Year
Country 1 5 15 25
Belgium 0.066 0.305 0.651 0.790
Canada 0.067 0.313 0.675 0.823
France 0.067 0.322 0.706 0.871
Italy 0.065 0.303 0.668 0.837
Netherland 0.066 0.312 0.678 0.837
Norway 0.070 0.346 0.784 0.988
Sweden 0.069 0.332 0.735 0.909
Switzerland 0.069 0.329 0.722 0.888
U.K. 0.068 0.327 0.724 0.898
U.S. 0.067 0.316 0.685 0.837
West Germany 0.067 0.316 0.684 0.838
Total: 0.067 0.316 0.686 0.841
Source: Pindyck (1979d), p. 242.
- 92 --
village, region and national level in selected developing countries as well asthe net contribution of the agricultural sector in providing crop residues and
animal residues for cooking in rural/urban areas. Since this paper alsoincludes an extensive bibliography 14/ in this area, we have not attempted todiscuss them here.
As the economics of energy substitution would be affected by thechanges in relative prices of diesel oil and electricity, the following fourmost recent papers 15/ have been included: Bhatia (1980a), deLucia andLesser (1980), Rogers and Hurst (1980), Ghate (1980) and Patel and Gupta(1979). These papers explicitly consider conditions under which inter-fuelsubstitution is possible in agriculture. 16/
In Bhatia (1980a), four energy alternatives are considered forirrigating a five-acre farm in the eastern Gangetic plains of India: diesel,electricity, biogas (methane from cowdung) and photovoltaics. The comparisonis made in terms of present value of costs of "equivalent systems" (whichprovide irrigation) at shadow prices. The results show that if the totalcapital costs associated with providing electricity to irrigation pumps isconsidered (instead of the subsidized cost of connection) and electricity ispriced at its shadow price (rather than subsidized rates), use of biogas withdiesel oil is the most economic alternative for irrigating small farms. If anescalation of 3 percent per annum (in real terms) is assumed for dieselprices, use of diesel oil (in diesel engines or dual-fuel engines with biogas)will be economic wherever the capital costs of electric connection exceed Rs.2500-3000 ($300-400) per pumpset. At the current level of capital costs, thephotovoltaic system considered is far more expensive (about 2.5 to 3 timesthe costs of diesel/biogas alternatives) even under the assumption of risingdiesel prices (3 percent per annum). deLucia and Lesser (1980) present asample analysis of renewable energy technologies (biogas, pyrolysis gas fromagricultural residues, and diesel oil) in the context of Thailand villages.Use of the gasifier is found attractive both for medium and large farmsbecause it has lower capital and operating costs. However, this strongeconomic attractiveness is overshadowed by 1) the lack of technical certainty,and 2) the availability of residues. The study emphasizes the need for a
14/ Some of the more important references would include: Bajracharya (1979),Briscoe (1979a,b), Makhijani and Poole (1975), NCAER (1978), Stout(1980), Pimentel and Pimentel (1979), Bhatia (1976a), Kuether and Duff(1979), Revelle (1976, 1978), Tyers (1978), Gavan and Tyers (1980), Smil(1978), Pimentel, Beyer and Mubayi (1976), and Desai (1978).
15/ Other references are: Tabors (1979), Smith, D.V. (1979), Parikh andParikh (1977), Tewari (1978), French (1979), Mubayi, Lee and Chatterjee(1980), and Bhatia and Niamir (1979).
16/ Other studies are available in the agricultural sector: Adams and Tyner(1977) in comparing fertilizer production from biogas plants versuslarge chemical fertilizer factories. A discussion on the use of animalpower vis-a-vis tractors is also available in Bhatia (1980c).
- 93 -
comprehensive analysis of interrelations among food, fodder, fertilizer andfuel uses for animal and crop residues in the rural Third World. The biogasplants also appear to be attractive, especially for the small farms. Theimportance of R&D work in producing smaller engines (1/2 to 2 hp) and firming-up technical data on biogas units and gasifiers is also emphasized.
The paper by Rogers and Hurst (1980) discusses the techno-economicaspects of a "self-energized irrigation pump," or one based upon the incre-mental increases in agricultural residues due to the irrigation intervention.The potential for such "self-energization" is shown under a variety of assump-tions about the amount of pumping, crop types, crop yields, and pumping systemefficiencies. The results show that for an unirrigated crop yield of one ton/hectare, a 50 percent increase in crop yield (which seems very likely) wouldprovide enough additional crop residues to be processed through a gasifierto run an engine for 1500 hours/year. Although the technology is said to havegreat potential for a large number of small farmers, the immediate obstaclesare 1) that there are no off-the-shelf small gasifiers, 2) that there are nofield data to use to motivate farmers to take-up the innovation, and 3) thatthe current government and private technology distribution systems do not havepersonnel trained in the use of such technologies.
Ghate (1980) has compared a windmill (with a capital cost of $700)which produces 11,000 cubic meters of water per year with an equivalentirrigation system run by diesel oil and electricity. He finds that windmillsare potentially competitive with diesel systems in the low wind-speed condi-tions of Ghazipur, Northern India, and the cost differential between the twoshould improve in favor of windmills as they prove their dependability and asdiesel becomes more expensive. However, his conclusion is that windmills donot as yet constitute a viable solution to the problem of small farmer irriga-tion because (a) given the hourly windspeed frequency distribution, thewindmill runs for only about 40 percent of the time during the year; and (b)about half the actual water discharge is accounted for by four months (Marchto June) which does not relax the irrigation constraint on the most profitablecropping pattern.
One of the important aspects of adjustments to higher energy pricesin agriculture is the possibility of conservation in the use of diesel oil(or electricity). In one of the studies reported in Pate and Gupta (1979) thescope for conservation has been found to be quite significant in the Gujaratstate of India. It has been observed that in pump irrigation efforts areusually not made to select the appropriate size of engine, size and type ofpump, sizes of delivery and suction pipes, etc. As a result, farmers end upwith a less-than-optimum combination of different parts which results in muchhigher fuel consumption than that under normal conditions. With appropriatetests and advice, farmers can be made to invest a small amount in the pumpwhich can reduce fuel consumption significantly. It was found that due toinappropriate pumps/pipes, etc., the actual diesel consumption was 40-50percent higher than the normal consumption. By investing Rs. 500 ($70) insuggested changes, the farmers could achieve annual savings of Rs. 500 inconsumption of diesel and lubricating oils. Since there are over 0.36 million
- 94 -
pumpsets in Gujarat consuming about 0.4 million litres of diesel per year, itwas estimated that even a 25 percent reduction in diesel consumption would besignificant. However, to achieve substantial reduction in diesel consumptionan elaborate organization of trained workers to advise the farmers and tocarry out actual modification would be required.
Conclusion
In general, the subject area covered in this chapter has been fairlywell-attended to in the literature. While most of the attention has naturallyfocused on the industrial countries, some attempts have been made on developingcountries, mainly in the household and agricultural sectors. Studies on thetransportation sector in developing countries are lacking although this may bebecause the type of models applied to gasoline demand for private transporta-tion cannot be applied to the case where railways and public transportationare the major modes.
Studies on interfactor and interfuel substitution in the industrialsectors of developing countries are also rare - with the exception of India,where two such studies have been made. There is a large amount of literatureon capital-labor substitutability in industry, particularly on the microlevelempirical side, which may be used to examine energy-labor and energy-capitalsubstitutability and complementarity. Since the industrial sectors of LDCsand developed countries resemble each other more than do their respectivehousehold or agricultural sectors, much of this literature is probably useful,at least as a starting point, for LDC analyses.
A broader question is how the patterns of industrialization in LDCsand the composition of industrial sector output affects energy consumption.It has been suggested, for example, that industrial expansion in many LDCs hasbeen biased towards capital-goods and consumer-durable sectors, which not onlytend to be capital-intensive, but their direct and indirect (including infra-structural) energy requirements also tend to be high.
- 95 -
Chapter VI
Integrated Energy Sector Studies and Demand/Investment/PricingBy Individual Fuel Types
Introduction
This chapter examines the literature on energy/economic relation-ships broken down by fuel type. Focusing on fuel types rather than sectorsenables one to examine issues of both supply and demand. A closely relatedtopic is, of course, pricing, both for project analysis and actual demand/supply management. The fuel types covered are crude oil, natural gas, petro-leum products, coal/lignite, electricity and renewables. A separate sectiondealing with integrated studies with multiple fuel types is also included.
A separate section on demand is presented for electricity. Forstudies on the demand for petroleum products, the reader is referred to therelevant descriptions of end-use sector demand in Chapter V. Chapter IV,which discusses aggregate relationships between GDP and energy use, shouldalso be consulted. Discussions of investment planning are available for allfuel types except crude oil. An integrated model of investment planning forBangladesh is described in detail. The structure of planning models whichinclude exhaustible resources draws on the theory of exhaustible resourcesgiven in Section II.1 and 11.5.
Sections on pricing are presented for all fuel types except re-newables. Several common themes run through the discussions, includingquestions of how to price tradeables and non-tradeables, and how to adjustefficiency prices to account for distortions in the economy and other policyobjectives such as income distribution and dependability of supply. Thisis closely related to the discussion of open economies in Section II.1 andthe framework of social benefit cost analysis in Section 11.5. The sectionon crude oil includes examination of leasing policies, attempts by govern-ments to allocate rent generated by domestic production of resources, andsome studies on the impacts of changes in energy prices. The effects oftaxes and subsidies on consumption both in developed and developing countriesare treated in the section on petroleum products. These should be comparedwith the theoretical literature on taxation and leasing in Section 11.3.
VI.1 Integrated Energy Sector Studies
Investment
The available literature on energy sector studies has been dividedinto two groups: (a) studies which use formal models in analyzing inter-dependence among energy sub-sectors such as those by de la Garza and Manne(1973) for Mexico and deLucia and Jacoby (1980) for Bangladesh; and (b) studiesand government reports which do consider interrelations among sub-sectors but
- 96 -
do not use any formal models in quantifying these linkages. The latter cate-gory includes Henderson (1975), Pachauri (1977), Tyner (1978), and Governmentof India (1974, 1979). The latter is discussed in this section while the otherthree are discussed in Section VI.2 since they relate mostly to oil and gas.
de la Garza and Manne - Mexico: The energy sector model ENERGETICOSallows for substitution between alternative processes within Mexico's energyproducing industries: petroleum, gas and electricity. In addition, the modelquantifies the elasticity of demand with respect to the price of energy prod-ucts by including process substitution activities within the steel industry.
For ENERGETICOS the optimization is phrased as one of choosing in-vestments in alternative processes so as to meet the output targets at minimumdiscounted costs, taking account of intersectoral flows. With this formula-tion, the principal source of interdependence arises from the intersectoralflows of industrial fuel, i.e., natural gas and residual fuel oil used forelectricity generation. The model is essentially a multiperiod linear pro-gramming model which ignores the regional dimension of investment choices.The model also evaluates effects of the foreign exchange premium and discountrate on choices in petroleum, electricity and steel industries. The resultsprovide marginal costs of supplying crude oil, refinery gas, liquified petro-leum gas (LPG), gasoline, kerosene, diesel oil and residual fuel oil for eachyear within the planning horizon of 1976-80.
deLucia and Jacoby - Bangladesh
The Bangladesh Energy Study (BES) by deLucia, Jacoby, et al., (1980)presents an integrated framework for analyzing pricing and investment deci-sions in the energy sector. Figure VI.1 shows the various models and linkagesin the BES along with the judgements on inputs and side analyses done for con-sistency checks. As shown in the middle panel of the Figure, the overalldemand study uses a combination of an agriculture sector study, a macro-economic forecasting exercise, and an estimation of the energy demand asso-ciated with particular levels of economic activity. The supply analysisinvolves the joint use of a model for the electric system and one for fuelsand fertilizers. 1/
The agricultural model results are used in the overall analysis inthree ways. First, estimates of foodgrain production, output of export crops,and value-added in the agricultural sector became inputs to the analysis ofthe macroeconomy. Second, a major part of total demand for commercial energyis due to fertilizer and pumping demands in agriculture, and these quantitiesbecame part of the overall farm sector analysis. Third, the production oftraditional energy sources (e.g., rice and jute waste) is influenced signifi-cantly by patterns of growth and crop mix, and these outputs of the agricul-tural analysis became an important input to the supply analysis.
1/ See Jacoby and Lesser (1980), and deLucia and Houghton (1980).
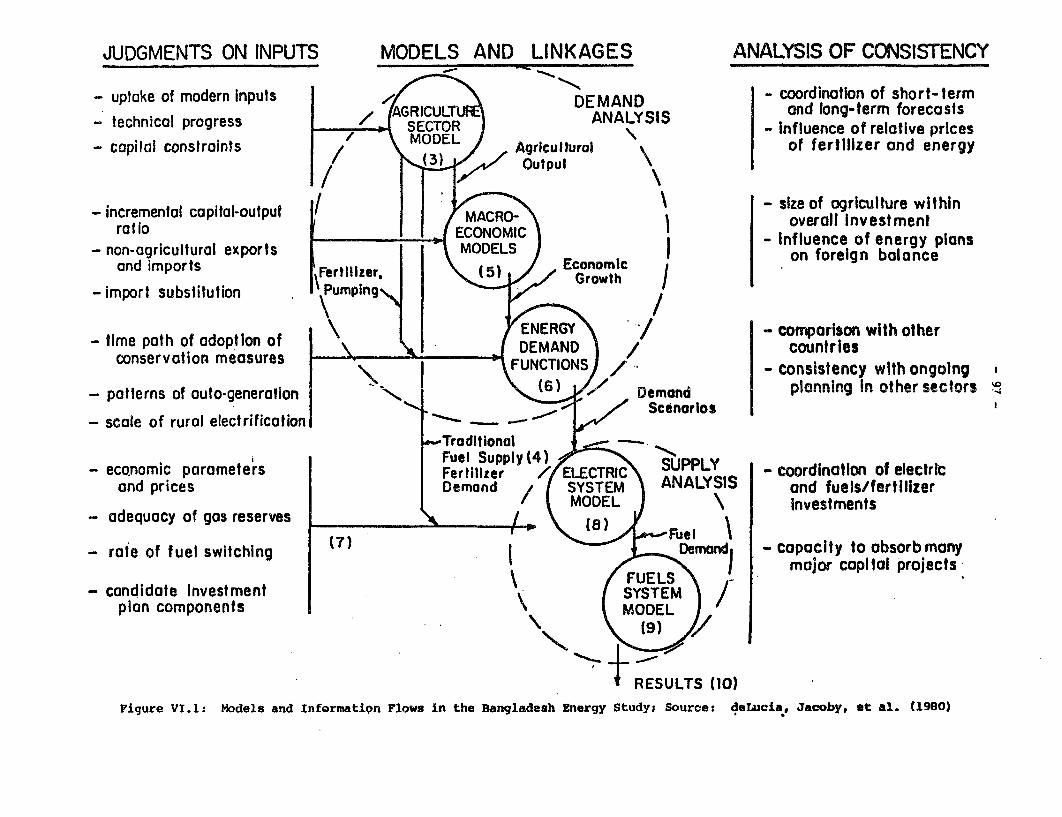
JUDGMENTS ON INPUTS MODELS AND LINKAGES ANALYSIS OF CONSISTENCY
- uptake of modern inputs - coordination of short-termGIUDEMAND and long-term forecasts- technical progress SC0R ANALYSIS influence of relative prices
- capital constraints Agricultural of fertilizer and energyL3) Output
- incremental capital-output / - size of agriculture withinratio overall Investment
MOEL - Influence of energy plans- non-agricultural exports on foreign balance
and imports Fertlizer,
- import substitution . umping
- time path of adoption of comparison with otherconservation measures countries
conervtio meaure - consistency with ongoing
- patterns of auto-generalion planning In other sectors
-scale of rural electrificationoTraditional
Fuel Supply (4)- economic parameters Fertilizer /ELECTRIC SUPPLY - coordination of electric
and prices Demand / SYSTEM ANALYSS and fuels/fertilizer
- adequacy of gas reserves MDLInvestments
- rate of fuel switching Demand - capacity to absorb manyI major capital projects
- candidate Investment osr- m
plan components foec st
Figure V1.1: Models and Informatipn Flows in the Bangladesh Energy Study; Source: deLucia, Jacoby, et al. (1980)
- 98 -
The macroeconomic analysis results give estimates of national econo-mic growth to the year 2000, along with a breakdown of likely growth by eco-nomic sector. In the energy demand analysis these results are combined withenergy input-output coefficients for the various industrial sectors, and withanalyses of energy demand for transportation, household, and commercial com-ponents of the economy. The end-product is an internally consistent energyforecast by region of the country, broken down into demand for electric power(kWh) and demand for nonelectric energy (Btus), and including sufficientcharacterization and end-use demand to allow fuel-specific supply analysis.
The last stage in the sequence of BES studies is the analysis of theelectric power and fuel and fertilizer systems. Electric sector modelling isone of several methods used for studying power systems and planning capacityexpansion. One output of this model is the demand of the electric powersector itself for natural gas, coal, and oil-based fuels. These data, plusother fuel demands, are input to another model of the systems that providenatural gas production and transmission, oil refining, and oil transportation.At this stage in the analysis, the importance of the interaction among dif-ferent parts of the energy system becomes evident. For example, the possibleconstruction of a natural gas pipeline to Chittagong, an investment which isultimately dependent on plans for the number and location of new fertilizerplants and heavily influenced by the associated changes that will be calledfor in the location and size of electric generation plants and transmissionlines.
The models (shown in Figure VI.1) and various scenarios for keyeconomic parameters such as the discount rate are combined for an assessmentof alternative development schemes. First, the country is divided into marketareas. This is done because, in Bangladesh, the transport link between areasis of particular interest. For imports and exports, the appropriate interna-tional markets must be identified.
Energy demand estimates are then disaggregated according to fueltype and the internal breakdown of market regions. The two supply analysismodels shown in Figure VI.1 are designed to deal with these markets andproduct definitions. Both are simulation models with imbedded optimization(mathematical programming) procedures to estimate system operating costs.The two systems models are designed to make it easy to test alternativepatterns of system investments, while allowing flexibility in testing alter-native judgments about input assumptions of the type shown in the left-handpanel of Figure VI.l.
Alternative investment schemes were evaluated in an iterative pro-cedure. For the electric and fuel systems, several overall national invest-ment programs were constructed in order to compare schemes with and withoutsome element, so that the relative economics of that element could be studied.The procedure involves the construction of an investment program, simulatingits costs, comparing it with others, revising or defining other alternatives,simulating again, etc. Over fifty separate sector investment schemes wereanalyzed during the study.
- 99 -
Working Group on Energy Policy - India
The report of the Working Group on Energy Policy of the Governmentof India (1979) contains a chapter on costs and prices in the energy sector.This chapter analyzes data on trends in energy prices during 1961-78, dis-cusses the profitability of the commercial energy sector for 1977-78, presentsestimates for effective subsidies in the energy sector, and analyzes theincidence of energy costs in industry in the year 1975-76. The report showsthat although there have been sharp increases in energy prices since 1974,the change in relative prices in India has not been as large. Relative tothe all-commodities price index, the change between 1961 and 1978 is only 19percent, i.e., the index for prices of fuel, power and lubricants (base 1961-62 = 100) was 388.5 as compared to the corresponding index of 325.4 for pricesof all commodities. The report shows that the petroleum sector has a rate ofprofit (gross rate of return, i.e., gross profit as percent of total capital)which is substantially higher (27.4 percent) than for the public sector as awhole (8.6 percent); the electricity sector is slightly below the average(8.5 percent) and the coal sector is considerably below it (0.6 percent).This is partly due to the effective subsidies in electricity and coal indus-tries and partly on account of the administered prices (including transferprices) for crude oil, petroleum products, coal and electricity. The detailsof the methodology of pricing oil products and electricity in India have beendiscussed elsewhere in sections VI.2, VI.3, and VI.5. The report of the Work-ing Group also provides useful data on the average incidence of fuel cost inindustry which is shown to be equal to 6.8 percent. There are a number ofindustries, accounting for as much as 45 percent of the total industrial pro-duction, where energy cost as a percentage of value of production is lessthan 3 percent. These figures are used to imply that for a 20 percentincrease in energy prices the required increases in industrial prices wouldbe less than 2 percent for these industries. The incidence of energy costsin railways has been estimated at 14 percent, and that for road transport at28 to 31 percent. Thus, a 20 percent increase in energy prices may requirean increase in freight rates of the order of 6 percent. In the case of powersector, the incidence of fuel costs as a proportion of total costs works outto about 35 percent for a pithead thermal station. Assuming that coal-basedthermal power accounts for about 60 percent of generation, a 20 percentincrease in fuel prices would require an increase in electricity price ofabout 4 percent if the profitability of electricity supply undertakings isnot to be eroded. It is also mentioned that these increases are based onfirst-order effects and do not include the cascading effect of energy pricechanges, i.e., the inclusion of the effect of energy price changes in pricesof other inputs.
On energy pricing policies, the report suggests the basic objectiveis to ensure that prices: (a) generate sufficient surpluses to facilitate thefinancing of investments in the energy sector; (b) induce economies in the useof energy in all sectors; and, (c) encourage the desired forms of interfuelsubstitution. The report points out that the present pricing policies do notserve the first two objectives while the third objective is being met onlypartially. The report then goes on to suggest that the first priority at thisstage must be to raise energy prices so that they at least reflect long-run
- 100 -
marginal costs and allow for a reasonable return. However, the details aboutthe estimation of long-run marginal costs have not been given, nor is there adiscussion of pricing tradeables (or substitutes of tradeables) at theiropportunity costs of imports/exports. As discussed later in sections VI.2and VI.4, this ambiguity leads to distortions in pricing of crude oil and oilproducts.
The report also discusses the issue of differential prices across thecountry. It is suggested that the system of pricing should be structured to atleast approximate the real costs of supplying energy to each area. In the caseof the coal sector, this may involve a system of zonal pricing while in thecase of the electricity sector it would at least require a tariff schedulethat distinguishes beween peak and offpeak on a diurnal and seasonal basis.The report also recognizes the need for some surveillance and regulation (insome cases subsidies) of the prices of so-called non-commercial energy sources.
VI.2 Crude Oil/Natural Gas -- Pricing Policies
Crude Oil
The pricing of domestic crude oil (and associated natural gas)arises mainly in the context of agreements for oil exploration and develop-ment, especially with foreign oil companies. The works of Tyner (1978) andSiddayao (1978) are the two major studies on developing countries in the areaof evaluation of petroleum leasing policies and agreements. Tyner has usedan analytical model based on Monte Carlo simulations for the evaluation ofpetroleum leasing policy in India. His generalized leasing model is appliedto compare the Indian production sharing leasing system with the followingsystems in use or proposed in other parts of the world: US bonus biddingsystem, annuity capital recovery profit share system, British type profitshare system, variable rate royalty system and Peruvian leasing system. Hisconclusions are that in its own institutional setting, the Indian systemappears to be superior to the other alternatives and currently "the Governmentof India is doing a better job of collecting economic rent than the othercountries evaluated." His suggestions are that India should continue tolease offshore areas to foreign companies using the current system (or anyother capital recovery system) in which the return to capital is allowed bypermitting recovery of three times the original cost through cost oil andprofit oil. In his analysis, the mean of the annual price change distributionwas set equal to zero which implies that the expected real price would notchange through time (although the actual prices would). It is not clear howsensitive the results would be to changes in the real price of crude oil overtime.
Siddayao (1978) has analyzed the various economic and politicalfactors relating to the use of off-shore petroleum resources of SoutheastAsia. The study points out that the problem of disputes relating to off-shorepetroleum resources may not be considered separately from a nation's energypolicy within the framework of its economic development program. In the con-text of rising import costs of oil, the author has examined the cost to anation's economic well-being of non-access to potential petroleum resources
- 101 -
within its boundaries. The study has demonstrated the economic benefits ofcooperation in petroleum exploration in the ASEAN countries and has alsoemphasized the importance of a climate of stability concerning property rightsfor attracting foreign investments in petroleum exploration and development.
Natural Gas
Siddayao (1980) has reviewed the pricing of natural gas in Thailand,Bangladesh and Pakistan. Munasinghe and Schramm (1980) also discuss theissues of natural gas pricing in Thailand while deLucia and Jacoby (1980) havepresented both theoretical arguments and empirical estimates in the contextof gas pricing in Bangladesh. Munasinghe and Schramm (1980) have suggestedthat five basic principles can be used to delineate the appropriate range ofgas prices. First, delivered prices should not be higher than the economiccosts (at shadow prices) of the next best alternative fuel delivered to theparticular user. Second, these delivered prices should not be higher thanthe net financial costs of alternative fuels unless the user is a governmententity. Third, gas should not be sold at a delivered price lower than itsfull, marginal economic cost of supply. Fourth, the price of the gas shouldbe lower than its highest economic value in its next best alternative use nowor in the future. Finally, revenue flows to both gas producing and supplyingcompanies or agencies should be high enough to cover their full accountingcosts, including depreciation and sufficient return on capital to keep themfinancially viable. It is recognized that these basic principles only circum-scribe price ranges, but do not determine specific prices per se. All they dois to set the outer bounds which are basically determined by the opportunitycost of alternative resource uses and availabilities and the principle offinancial viability. The authors then estimate the value of natural gas asmeasured by its replacement costs. The maximum economic value of gas for usein two power plants in Thailand is determined by the economic costs of fueloil that it will replace. The economic costs of fuel oil will depend on thelevel of new petroleum refining capacities in the future.
If Thailand continues to be net importer of fuel oil (i.e., newrefineries are not set up), the economic costs consist of the sum of c.i.f.costs of fuel oil adjusted for shadow price of foreign exchange 2/ plusdomestic costs of transport, storage, etc. If the need for additionalrefinery capacity is justified on the expanding needs for gasoline and dieselfuels, fuel oil will be an inevitable by-product whose economic value will bedetermined by its f.o.b. (export) price. In addition, there is need foradding a special risk premium to the estimated economic costs of fuel oil inorder to recognize that there is no risk of non-availability in the case ofdomestic natural gas. Given an import cost of B1.75 per litre of fuel oil
2/ If foreign exchange is considered the numeraire, the economic costs willbe the c.i.f. price expressed in local currency at the prevailing rate ofexchange plus domestic storage and delivery costs, adjusted by the esti-mated current standard conversion factor to express them in equivalentborder prices. For details see Munasinghe and Schramm (1980), Squire andvan der Tak (1975).
- 102 -
and assuming a risk premium of 10 percent, the economic cost of imported fueloil (at early 1979 prices) was estimated to be equal to B1.93/litre or B0.501per KWH of electricity. According to the authors, the marginal economiccosts of natural gas should include (i) the foreign exchange well-head pricepaid to the drilling company, net of royalties; (ii) the 0.M.&R. costs foreach field; (iii) the investment and O&M costs of the pipeline network neededto bring the gas to markets; (iv) the investment costs needed to modifyexisting installations for the use of gas instead of alternative fuels; and(v) the net differentials in operating costs, including differentials in fueluse efficiencies resulting from the use of gas instead of other fuels. Theestimated marginal economic cost of gas (at early 1979 prices) in Thailand issignificantly lower than that of oil.
Siddayao (1980) has noted that the price of gas discovered inThailand is indexed to the world market prices of fuel oil. She has arguedthat since the reserves of Thai gas are not sufficiently large to allow itto export gas as LNG, the replacement cost concept should not be used forshadow pricing natural gas. Besides, LNG prices have not kept up with crudeoil prices even at the buyers end. This means that even at the most favor-able possible price, the f.o.b. price of Thai natural gas would have to befar below that of crude oil to allow for transport costs and processing costsat the arrival terminal. Thus, she argues, it would make no economic sensefor a country to sell its natural gas overseas at a price lower than what itwould pay for fuel oil, making the gas essentially a non-tradeable item.Hence, the gas price should be based on the full economic cost which includesa sufficient rate of return to the investor.
In Pakistan, natural gas prices have been fixed by the governmentat historically low levels to provide adequate incentive for its utilization.Gas prices have been lowest for the industrial sector while prices for com-mercial and domestic sector have increased faster. As a result of relativelylow prices, the share of natural gas in total energy consumption increasedfrom 37 percent in 1970 to 49 percent in 1978. Since 1973 price increases
have been affected to align gas prices with domestic oil prices. This hasresulted in an increase of 95 percent in the price for residential sector andby 200 percent for general industry. Siddayao has raised here, again, theissue of pricing a domestic resource at alternative opportunity cost.
Some of the major studies on gas pricing for the US are Camm (1978,
1979), Pindyck (1978c), and MacAvoy and Pindyck (1973, 1975). Camm's con-clusion is that "average cost" pricing of natural gas in the US encouragesoverconsumption of gas and discourages entry of new residential and commercial
energy technologies. He finds that "average cost" pricing presents final con-sumers with a price for gas that is based on a weighted average of the priceutilities and pipelines pay for gas, a weighted average significantly lower
than the real replacement cost of gas. He has analyzed three alternativepolicies: marginal cost pricing with consumer compensation, average costpricing with taxes and/or subsidies and utility ownership of new energy tech-
nologies. He concludes that full ranking of the alternatives will requireadditional information on the administrative and political nature of the
- 103 -
alternatives. Pindyck (1978c) uses an econometric policy model to forecastthe regional effects on the industry of the higher prices proposed by theFederal Power Commission. The model contains equations explaining productionand demands in both the market for reserve additions and the market for whole-sale deliveries. The supply side covers details of extension and revisionof reserves which are a function of prices, direct drilling costs, capitalcosts and existing reserve levels. Production of gas depends on the size of
the reserve base and on prices that buyers are willing to pay for increaseddeliveries. Wholesale demand for gas is estimated as a function of prices,income, value-added, capital investment and a depreciation rate for gas-burningappliances. The use of the model shows that FPC's new area rates will go along way toward clearing natural gas markets during this decade.
VI.3 Petroleum Products 3/
Investment - Petroleum Refining
In the case of the petroleum refining industry, the availableliterature may be divided into: (a) process analysis or programming models
which yield "economic prices" (or shadow prices) as dual variables as a partof their solution, and (b) econometric models, separately or along with theprocess analysis models, which relate supply conditions to product prices andprovide linkages with the rest of the economy. The major studies in the firstarea are: Manne (1958), Griffin (1971), Adams and Griffin (1972), Manne(1973), and Bhatia (1976). The second category includes papers by Adams andGriffin (1969), Rice and Smith (1977), and Arrow and Kalt (1979). Most ofthese studies are for the US with the exception of those by de la Garza andManne (1973) and Bhatia (1976).
Since the work on Mexico has already been discussed in Section VI.1,we present here some details of Bhatia (1976) as an illustration of the typeof results one can obtain from programming models. Bhatia uses a multipurposeinterregional programming model for analyzing technological and locationalchoices in the petroleum and fertilizer industries in India. It is a partialequilibrium model, which taxes prices of capital, labor, and foreign exchange,and discount rates, as givens, and minimizes the total cost of meeting exo-genously determined demand for petroleum products and nitrogenous fertilizersfor a target year. The model results indicate optimum levels of (i) foreigntrade in crude oils, petroleum products, and fertilizers; (ii) processactivity levels in refining such as simple refining, hydrocracking, coking,etc., at each location; and (iii) transportation of crude oils, intermediateproducts, and final products. In addition to the optimal levels of theseactivities, the model results also indicate values of dual variables asso-ciated with the following constraints: petroleum products requirements andfertilizers at demand points, available of indigenous crude oil at various
3/ Demand for petroleum products cuts across all the major sectors coveredin Chapter V. Rather than reproduce all those results here, the readeris referred to Sections V.2 through V.5 for the manufacturing, residen-tial/commercial, transportation and agricultural sectors.
- 104 -
locations, and existing capacities of process units. These dual variablescan be interpreted as "economic prices" or shadow prices for various petro-leum products at different locations and the shadow prices of indigenouscrude oils at the oil fields. The advantage of the programming model is thatit permits simultaneous evaluation of various supply and demand options,investments in various process units and interregional transport of surplusoil products in such a way that the resulting shadow prices (dual variables)reflect the optimum development of petroleum industry in a particular country.The data requirements and computer needs are such that these LP models can beformulated and evaluated quite easily for an individual country or a group ofcountries. It is suggested that these "economic prices" could be used as ex-refinery prices for oil products.
The problems of joint production in industries such as petroleumrefining have been studies by Griffin (1971, 1977a), Vinod (1968, 1976) andDhrymes and Mitchell (1969). The paper by Griffin (1979d) aims at distillingthe complex process analysis representation of petroleum refining into a singleequation, statistical approximation to the joint production technology. Thisalternative provides both a direct source of price and substitution elastici-ties and a convenient forum for microeconometric modeling exercises. This"pseudo data" approach to joint production avoids the multicollinearity prob-lems of time series data and allows a complex technology to be characterizedin a statistical price possibility frontier. However, the extent of theimprovement offered by this approach ultimately rests on the quality ofengineering process models which are difficult to build and evaluate. It issuggested that for short term forecasting time series approach could be used.
Petroleum price regulation, especially the question of decontrol ofcrude oil prices in US, has been analyzed by Arrow and Kalt (1979). Their con-clusions are that decontrol of oil prices would result in a net gain to thenation, i.e., those who would benefit from decontrol would gain more thanthose who would lose. Their analysis indicates that even under standards ofsocial justice that find the prospective transfer of income from consumers toproducers highly inequitable, the efficiency gains from decontrol are dominantover the distributional losses. If the removal of price controls is accom-panied by a windfall-profits tax that offsets the regressiveness of decontrolwithout destroying the incentives which foster efficiency, it is suggestedthat decontrol should be supported.
Taxation
In view of the direct importance of taxes and subsidies on petro-leum products for the final end-use consumption patterns, we will also reviewsome of the works in this area. Gasoline taxation in selected OECD countriesfor the period 1970-79 has been analyzed in a paper by Tait and Morgan (1980).After the oil price increases in 1973 and 1974, higher gasoline taxation wasadvocated as an instrument to supplement market forces in reducing the oilimports of OECD countries. A study of seven major industrial countries(Canada, France, Germany, Italy, Japan, UK and US) shows that the effective
- 105 -
tax rate 4/ on gasoline declined until 1977 when four countries (France,Germany, UK, Italy) raised the level of gasoline taxation enough to createsmall increases in the effective tax rate. By 1979, Germany and UK had againallowed the effective rate of tax to fall below the 1976 rate. It is foundthat the real value of gasoline taxation per gallon declined in six of theseven countries after 1975. This trend generally reflected the fact that thespecific component of gasoline taxation was not adjusted upward sufficientlyto match the rising price level over the period. The paper also considersthe issues relating to the role of gasoline taxation in reducing dependenceon oil imports, resource allocation and economic growth, its effects on incomedistribution, rate of inflation and balance of payments. The tentative con-clusion is that the importance of concerns for control of inflation, equityand growth is often exaggerated, and the costs appear to be more modest thansuggested in public debate.
The question of the cost of subsidy on kerosene has been discussedat length by Munasinghe and Schramm (1980) in the context of Sri Lanka.Assuming that 15 percent of the total sales of 69 million gallons of keroseneare diverted to uses other than cooking and lighting, the cost of leakagewould be about Rs. 50 million @ Rs. 5.5 per gallon (the difference betweenthe market price of Rs. 3.5 and the imported cost of kerosene of Rs. 9 in1979). They also argue that the total cost of the subsidy could be definedto include not only this leakage, but also that portion benefitting domesticusers who earn above a certain level of income. If one million householdsare taken as forming a potential low income target group, their consumptionwould be around 20 million gallons, leaving a residual of 50 million gallonsgiving a "cost" estimate of Rs. 250 million. Their paper also presents anestimate of Rs. 150 million as the cost of subsidies on diesel oil andsuggests alternatives to diesel/kerosene subsidies in Sri Lanka.
Gillis (1980) estimates apparent budgetary subsidies/taxes on oilproducts in Indonesia for the period 1969-70 through 1980-81. He finds thatthe average subsidy increased from $1.57 per barrel in 1977-78 to $9.97 perbarrel in 1980-81. He has also presented estimates of economic costs of oilsubsidies defined as the difference between what Indonesia could receivefor refined oil products when sold on the world market, versus what itreceives when these products are consumed domestically. For 1980-81, theeconomic cost of subsidy is calculated at nearly US$2.7 billion or roughlytwice the budget subsidy. These costs are large relative to Indonesia'seconomy, around 5 percent of GDP in 1979-80.
The role of petroleum taxes in energy conservation has been reviewedin Saito (1976), Seidel (1978) and Wright (1980). Saito's analysis of changesin taxes of petroleum products for 1973-74 shows that the motivation of
4/ The effective rate of taxation is calculated as the value of gasoline taxper gallon divided by the net-of-tax price per gallon. The values for1979 were: Canada 48 percent, France 180 percent, Germany 126 percent,Italy 209 percent, Japan 72 percent, UK 47 percent, and US 18 percent.
- 106 -
raising taxes in non-oil producing countries for conservation was tempered byconcern over the impact increased petroleum product prices would have on theindustrial and agricultural sectors as well as on lower-income groups. Seidel(1978) makes a systematic microeconomic comparison of two excise taxes (ongasoline itself and on gas-using cars) as factors which alter both the pur-chase and use of automobiles. He finds that a car tax has an income effectwhile a gasoline tax has both an income and a substitution effect. Bothtaxes could have differential impacts on income groups depending on how theseare collected. He suggests that the program which achieves significantefficiency as measured by net social cost will give us the best chance ofultimately solving the equity problems which will arise. Wright (1980) usesa partial equilibrium model to estimate the cost to the society of long-runreductions of aggregate energy input. The conclusion is that the net socialcost attributable to such conservation measures is likely to be much lessthan the cost of energy saved and claims of significantly greater cost con-sequences must be based on the argument that tax-induced price increasesaggravate other existing distortions in the economy.
VI.4 Coal/Lignite
Studies on the coal sector are relatively few: The World Coal Study(1980), Sassin and Hafele (1979), Ormerod and Sadnicki (1979), Hughes (1978),Government of India (1980b), Siddayao (1980), Naganna (1977) and Coal IndiaLimited (1976). The first three studies are concerned with the prospects ofcoal as a major energy resource, and the latter three analyze coal pricingissues.
Supply Prospects
The World Coal Study (WOCOL) report analyzes the supply prospectsand environmental aspects of meeting a high proportion of future energy needsby coal in 16 countries that use 75 percent of the world's energy. Theirconclusions are: (a) economically recoverable reserves of coal are very large--many times those of oil and gas--and capable of meeting increasing demandswell into the future; (b) coal will have to supply between one-half and two-thirds of the additional energy needed by the world during the next 20 yearsand after; (c) coal can be mined, moved and used in most areas in ways thatconform to high standards of health, safety and environmental protection bythe application of available technology and without unacceptable increasesin cost; (d) the amount of capital required to expand the production, trans-port and user facilities to triple the use of coal is within the capacity ofdomestic and international markets, though difficulties in financing largecoal projects in some developing countries may require special solution.
The paper by Sassin and Hafele (1979), however, is not so optimisticabout the role of coal in the evolution of the global energy system. Theirconclusions are: (a) it is highly unrealistic to interpret the large global
coal resources as sufficient for a long-term primary energy option. Coal isnot a real competitor or alternative to other primary energy sources; (b) coal
transport constitutes the main technical constraint for long-term use of coal;
- 107 -
(c) even assuming the most efficient use of coal as a feed material for syn-thetic liquids, the required coal supply exceeds present maximum productionestimates for the next 50 years.
Pricing
The question relating to pricing of coal in developing countrieshas been discussed in the reports by Coal India Limited (1976), Governmentof India (1980b) and Siddayao (1980). The report of Coal India Limited, apublic sector coal company, discusses the approach or philosophy of pricingas well as issues of cost structure in coal mining, dual pricing and impacton customers' economy. This report also reviews the earlier reports on coalpricing by the Bureau of Costs and Prices, the Fernandes Committee and theChakravarty Committee. The conclusions of the report may be summarized as(a) the costs of coal for the industrial sector are about one-third of theeffective cost of alternative petroleum-based fuel, (b) a 20 percent increasein the price of coal will increase the general price level by 0.56 percentonly, (d) full costs of capital (20 percent on equity), stores, power ratesand welfare expenses should be covered in fixing the price of coal, (d) acommitment charge should be given by major customers which would imply adual pricing policy with a different price for smaller parties.
Siddayao (1980) has reviewed coal pricing in the Philippines andreports that there are suggestions to peg coal prices at 65 percent of fueloil price to encourage a shift to coal. This price is assumed to cover thecosts of production (including basic return on investment) and is above thespot market price for Taiwan coal. Siddayao has also considered the argumentsfor and against the suggestion: why should the Philippines not assign it(coal) a shadow price equal to the cost of alternative fuel, i.e., fuel oilor even at the price of imported coal (allowing for the difference in equity).She has argued that there are several reasons for not pricing coal at itsreplacement costs: First, the country is attempting to promote a shift awayfrom liquid fuels, most of which are imported, and impose a burden on foreignexchange. Second, there is a social long-term value to be attached to diver-sification away from liquid fuels where import dependence is high and thestability of supply sources is uncertain. Thirdly, there is a severe economicpenalty to a society that artificially overprices a domestic resource espe-cially where the possibility of such resource being exported is almost non-existent within the planning time frame. This cost is reflected as aninflationary factor that is unnecessarily imposed on the economy.
Reference should also be made to the studies on interfuel substitu-tion in industrial and transport sectors (Sections V.2 and V.4), especiallyworks by Pindyck (1979d), Uri (1979a,b), Williams and Laumas (1980), Desai(1980b) and Jankowsky (1980).
Naganna-s (1977) paper is one of the few available studies on thecost and input structure of coal mining in a developing country. The paperpresents the results of a field survey conducted on the input structure of18 bituminous coal mines which accounted for about 5 percent of the totalcoal output in India. One of the striking points noticed in his data is that
- 108 -
the "cost" of production of coal (traditionally defined to include wages,materials and capital inputs), is rather low, approximately equal to $2.2 perton. Even if increases in wages and material costs are taken into account,the coal costs may not be higher than $5 per ton. If corrected for thedifferences in heat content (2 tons of coal equal to 1 ton of fuel oil), the"cost" of coal for steam raising would be of the order of $10 per ton comparedwith the cost of $100-$120 ton of importing fuel oil.
These numbers indicate that (a) the conventional method of costcalculation may underestimate the "true cost" of coal by ignoring the "value"of coal in the ground and (b) there is considerable economic rent availablein the system. Another important point brought out by Naganna's study isthat wages constitute a large proportion (60-75 percent) of the total cost ofproduction of coal. If it is assumed that a large percentage of this laborcost would be wages paid to unskilled labor which has very low "shadow wagerates," the "economic cost" of coal production would go down significantly.On the other hand, a premium on foreign exchange would increase the "economiccost" of imported fuel oil, thus increasing the difference between "economiccosts" of two fuels. Naganna's paper also finds that the extent of inter-minevariations in input-output coefficients is very large and examines how thesecould be explained by level of output, age of mine and type of material used.
The results show that the material input increases with the age ofthe mine and the cost of explosives remains considerably high (40-55 percentof total material costs) at each age group. The tentative conclusion is thatthe data show the prevalence of an inverted U-shaped relationship between thematerial input coefficients and the age of the mines.
VI.5 Electricity
Demand
Developed Countries -- United States: There have been a number ofstudies on demand for electricity in the US, most of which are reviewed in asurvey article by Taylor (1975). The studies are essentially econometricmodels which are used for estimating the price elasticity of demand in theresidential sector or at the aggregate level. The major documents in thisarea include Taylor (1975, 1977), Mount, Chapman and Tyrrell (1973, 1974),Smith (1980), Smith and Cicchetti (1975a,b), Harvorsen (1975, 1976a), Anderson(1972b, 1973), Houthakker, Verleger and Sheehan (1974), and Fisher and Kaysen(1962).
Taylor (1975) has surveyed and evaluated econometric models of the
short-term and long-term demand for electricity in the US residential andcommercial sectors. The models are classified regionally and by measures ofelectricity price employed. Taylor (1975, 1977) also summarizes the income
and price elasticities. Some of the special problems associated with modelingelectricity demands, such as its dependence on stock and utilization rates ofequipment, changes in utilization rates, and effects of regulatory processes,are also discussed. Table VI.1, adapted from Hoffman and Wood (1976) sum-marizes some of the results.
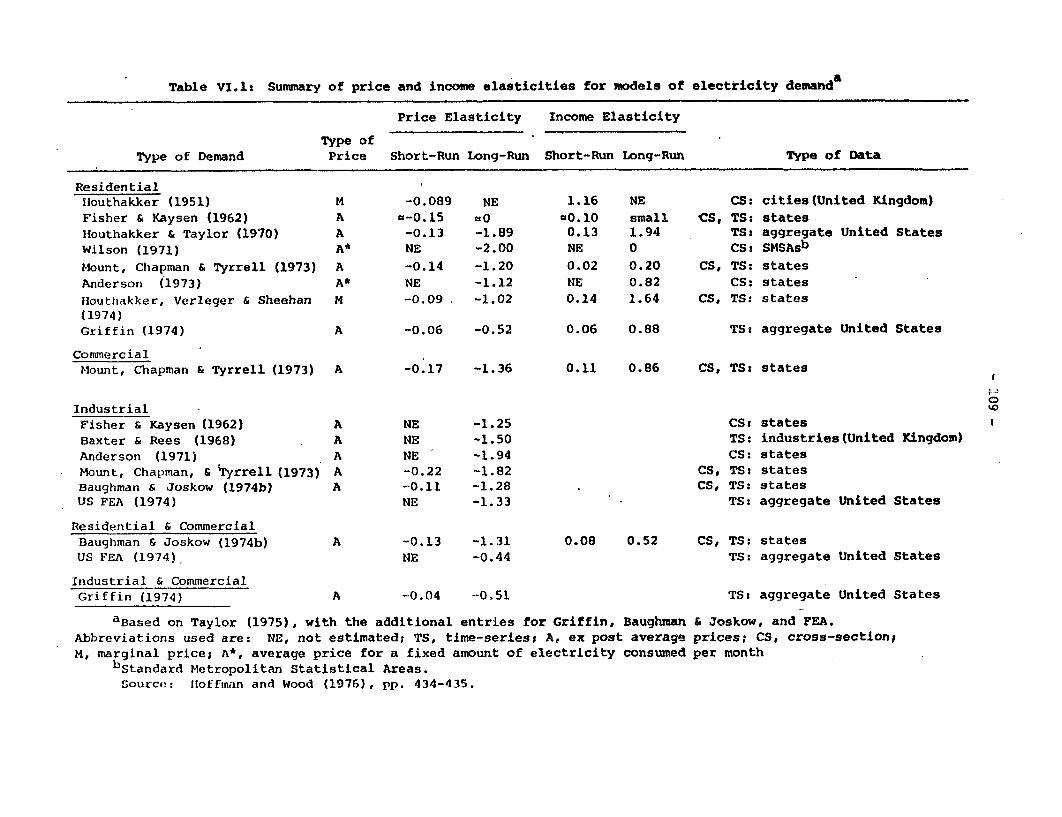
Table VI.ls Summary of price and income elasticities for models of electricity demanda
Price Elasticity Income Elasticity
Type ofType of Demand Price Short-Run Long-Run Short-Run Long-Run Type of Data
ResidentialHouthakker (1951) M -0.089 NE 1.16 NE CS: cities(United Kingdom)Fisher & Kaysen (1962) A a-0.15 =0 U0.10 small CS, TS: statesHouthakker & Taylor (1970) A -0.13 -1.89 0.13 1.94 TS: aggregate United StatesWilson (1971) A* NE -2.00 NE 0 CS: SMSAsb
Mount, Chapman & Tyrrell (1973) A -0.14 -1.20 0.02 0.20 CS, TS: statesAnderson (1973) A* NE -1.12 NE 0.82 CS: statesHouthakker, Verleger & Sheehan M -0.09 -1.02 0.14 1.64 CS, TS: states(1974)Griffin (1974) A -0.06 -0.52 0.06 0.88 TS: aggregate United States
Commercial ,Mount, Chapman & Tyrrell (1973) A -0.17 -1.36 0.11 0.86 CS, TS: states
0Industrial
1
Fisher & Kaysen (1962) A NE -1.25 CS: statesBaxter & Rees (1968) A NE -1.50 TS: industries(United Kingdom)Anderson (1971) A NE -1.94 CS: statesMount, Chapman, & Iyrrell (1973) A -0.22 -1.82 CS, TS: statesBaughman & Joskow (1974b) A -0.11 -1.28 . CS, TS: statesUS FEA (1974) NE -1.33 TS: aggregate United States
Residential & CommercialBaughman & Joskow (1974b) A -0.13 -1.31 0.08 0.52 CS, TS: statesUS FEA (1974), NE -0.44 TS: aggregate United States
Industrial & CommercialGriffin (1974) A -0.04 -0.51 TS: aggregate United States
aBased on Taylor (1975), with the additional entries for Griffin, Baughman & Joskow, and FEA.Abbreviations used are: NE, not estimated; TS, time-series; A, ex post average prices; CS, cross-section;M, marginal price; A*, average price for a fixed amount of electricity consumed per month
bStandard Metropolitan Statistical Areas.Source: Hoffman and Wood (1976), pp. 434-435.
- 110 -
Griffin (1974) has developed an econometric model of the supply anddemand for electricity. Various measures of market size, fuel prices, gener-ating capacity, and construction and operating costs are used as exogenousinputs to the model. The model then determines the demand for electricity inresidential, commercial and industrial sectors, nuclear capacity expansion,distribution of generation requirements between different fuel types, and theprice of electricity. The model is estimated by using US time-series dataand is simultaneous since the average price of electricity, a determinant ofdemand, depends on the generating mix. Simulations using alternative projec-tions of relative fuel prices are performed to study the impact on demand andgenerating mix.
Baughman and Joskow (1974c) have combined an engineering (process-type) supply model with an econometric demand model for electricity and thenlinked these two with an explicit model of the regulatory process by whichthe price of electricity is determined. The supply model is regionallydivided, with eight plant types (gas turbine and internal combustion, threethermal types -- gas, oil or coal fired -- , and four nuclear types -- LWR,HTGR, LMFBR, and plutonium recycle -- , with hydroelectric type treated asexogenous). The demand model is estimated in a fashion similar to Griffin(1974), but at the state level, and the generating mix is also determined ina similar manner. Since the price of electricity, however, is controlled bythe regulatory agencies in this model, it simulates the process by which thisprice is determined based on calculations of the rate base derived from thesupply model inputs and assumptions about the permissive rates of return, therate of depreciation, and the effective tax rate.
Developing Countries - India: Demand for electricity in India hasbeen analyzed at the aggregate level as well as by sector in a book byBanerjee (1979). Regression results relating electricity consumption andnational income have also been presented in the reports of the Fuel PolicyCommittee (1974) and Working Group on Energy Policy (1980) of the Governmentof India.
Banerjee finds that although consumption of electricity is relatedwith growth of national income over time, a comparison between states showsthat there is no close correspondence between a high level of stat incomeand a high level of electricity consumption. She finds that the R betweenstatewide per capita electricity sales and per capita domestic product in alog-linear regression for 1961 and 1971 is 0.28. The statewide industrialinvestment along with the level of urbanization have been found as satisfac-tory variables to explain differences in electricity sales between states.Since more than two-thirds of total electricity consumption is in the indus-
trial sector, data have been analyzed by major industry groups for the period1951-66. The results show that total quantity of electricity required bythe industry is not closely correlated to the level of production and other
factors such as changing technology, level of investment and relative prices
are found important explanatory variables in cotton textiles, cement, paperand pulp, chemicals and jute textiles. Besides, in the years since 1951,Indian industries have shown a secular tendency to use more electricity per
- 111 -
unit of production. This growing electricity intensity is found to be theresult of a multitude of factors including use of new technology, changes inproduct-mix and lower price of electricity. The study finds that industrialunits showed a great degree of sensitivity to changes in relative prices ofthe energy-giving inputs such as electricity, coal and labor. The relativeprice of electricity was falling in the case of most industries in this periodand industries took advantage of such changes in the short and in the longrun, by partially switching to electricity in place of coal-fired machinery ormanual operations. Considering that subsidized electricity replaced humanlabor especially in the textile industry, it is concluded that the governmentpolicies did not contribute to the objective of employment generation. Thestudy also points out that electricity requirements for a particular industrydepend on so many economic factors (relative prices, rate of utilization ofcapacity, etc.) that projections based on past requirements or technologicalfactors alone may prove misleading.
Investment
Investment planning for electric power industry has been the subjectof many studies, notable among those are de la Garza, Manne and Valencia(1973) for Mexico, Gately (1971) and Lahiri (1977) for India; Jacoby andLesser (1980) for Bangladesh and Leiftnick et al. (1969) for Pakistan. Vander Tak (1966), Munasinghe (1979c, 1980f), Jacoby (1979), Anderson (1972),and Turvey and Anderson (1977) provide a review of several of these modelsalong with case studies. The models used for electric power planning can beclassified as simulation and optimizing models with variations in levels ofregional and seasonal aggregation, linkages to other energy sectors (coalmining or petroleum refining) and the treatment of time.
Anderson (1972) reviews a large number of programming models usedin the analysis of electric utility operations and expansion plans. Inoptimization models, the demand for electricity and prices of fuels (as wellas other production costs) are fed in exogenously and investment options aresearched for selection. The output usually specifies the type of plant tobe built (nuclear, coal, oil, hydro, gas turbine) plus other details suchas location, if appropriate information is included. A detailed appraisalof these models is outside the scope of this review.
The study by Munasinghe (1979c) highlights the importance of devel-oping and applying a new criterion for power system planning that is based onoptimal reliability levels. Using a dual economic-engineering method, it isshown both theoretically and operationally that it is possible to establishan optimum plan for long-run power system expansion and a corresponding rangeof reliability levels that will produce the greatest net social benefits. Totest the methodology developed in the book, a case was designed that optimizedthe reliability of the distribution system in a small city in a developingcountry. Three computer models were used to determine (a) the demand fore-cast, (b) the alternative designs of the distribution system, and (c) thecorresponding system costs and outage costs. The costs of outages to dif-ferent consumers--residential and industrial--were analyzed in detail in termsof loss of leisure, spoilage, idle factors of production and recovery of lost
- 112 -
production during regular working hours as well as overtime. The study indi-cates large potential net savings to the society that could be realized byadopting the reliability-optimizing approach to power systems planning.
Pricing
Munasinghe and Warford (1981) have provided an excellent review ofthe theoretical literature on the economics of marginal cost pricing alongwith case studies for Indonesia, Pakistan, Philippines, Sri Lanka and Thailand.This book builds upon the earlier work reported in Munasinghe and Warford(1978) and Munasinghe (1979b, 1980c,f). Strict long-run marginal cost (LRMC)is first defined as the incremental cost of optimum adjustments in the systemexpansion plan and system operations attributable to an incremental demandincrease that is sustained to the future. The broad categories of costs forthe LRMC calculations are: capacity costs, energy costs and consumer costs.In the context of developing countries, where the perspective is that of thenational economy rather than of a private power utility company, these costshave to be calculated at shadow prices rather than at market prices. Theestimation of shadow prices is a complex task and the necessary details havebeen discussed under Section 11.5.
Once strict LRMC has been calculated at shadow prices for majorinputs, the actual tariff structure that meets economic second-best, social,financial, political and other constraints may be derived by modifying strictLRMC. This process of adjusting LRMC results in deviations in both the mag-nitude and structure of strict LRMC and may include differentiation by typeof consumer (agricultural, industrial, etc.) or by income levels of differentconsumers. "Second best" departures may be required where electric powersubstitutes and complements are subsidized (e.g., subsidies on importedgenerators, diesel fuel or kerosene) for political or environmental reasons.In addition to these "second best" economic arguments, socio-politicalarguments are often advanced in favor of "life line" tariffs, especially incases where the costs of electricity consumption are high compared to incomelevels. This would involve examining a chain of interrelated energy andother effects which are generally more complex in developing countries thanin the developed country context. 5/ On account of these effects, it issuggested that, in general, decisions to subsidize electric power should beapproached with care in developing countries on account of its implicationsfor public revenues/surpluses. Another constraint considered is the needfor a uniform national tariff for each consumer category throughout the coun-try. Since this would deviate from strict LRMC, the benefits of a uniformtariff policy must be weighed against the efficiency costs of deviating fromstrict LRMC. In addition to the above factors, practical difficulties ofmetering, billing and consumer comprehension may require adjustments intariffs.
5/ Some of these have been studied in Munasinghe and Schramm (1980),especially the case of kerosene subsidy in Sri Lanka.
- 113 -
The case studies for five countries--Indonesia, Pakistan, Philip-pines, Sri Lanka and Thailand--have been reviewed and in all the tariffstudies the LRMC of capacity greatly exceeds the existing kilowatt charges.
The Philippines study points out that the failure to adequately recognizemarginal capacity costs in the tariff structure of the major bulk suppliercompounds the distortions inherent in the tariff structures of distribution
authorities. Favorable treatment of low voltage consumers--residential users,tubewell operators, etc.--is noted in the case studies in Sri Lanka, Indonesiaand Pakistan. The desirability of the increasing block rate for domesticconsumers is generally recognized. The need to obtain more accurate informa-
tion on load factors and to shift loads from peak to off-peak periods isrecognized. Market distortions are recognized and treated in all the casestudies. The prevalence of policies in which the domestic prices of oil,natural gas and coal tend to diverge from their opportunity costs is recog-nized and it is found that the shadow-priced marginal energy costs are usuallyconsiderably in excess of financial estimates. The need for the determinationof the opportunity cost of depletable natural gas, oil and coal has been
recognized. It is observed that in many countries, a number of adjustmentsto tariff levels and structures that are consistent with the LRMC approachhave recently been made.
Three studies on pricing of electricity on India are available:Dasgupta (1970), World Bank (1979e) and Gellerson (1977). Gellerson hasused the following three methods of measuring marginal cost of supplying
electricity in four regions of India: long-run incremental cost (LRIC),present worth of incremental system cost (PWISC) and average incremental
cost (AIC). His evaluation of different methods shows that when capacity
investments are lumpy, as is the case in developing countries, the LRIC
method accurately measures marginal cost in years when capacity investmentsare made; however, it overestimates marginal cost during periods of surplus
capacity. He finds that the AIC approach measures marginal cost in a long-run time framework which is consistent with the time frame used in powerplanning. The AIC approach is considered a reasonable way to measure marginal
costs so that tariffs: (i) do not fluctuate widely, and (ii) ensure thatexisting capacity is efficiently used. Using the AIC approach, estimates ofmarginal costs (for four regions) are compared with existing tariffs andimplications for tariff revisions are outlined. He finds that tariffs foreach category of consumers--domestic, commercial, agricultural, industrial--
are considerably below marginal costs.
Dasgupta-s paper (1970) presents a theoretical approach to the
estimation of long-run marginal cost of electricity under two conditions:(a) the existence of technical progress, leading to steady decline both ininvestment costs and in running costs, and (b) the divergence between social
and private costs, e.g., in India the social cost of low-grade coal is lowerthan its private cost while for foreign exchange the reverse is true. A
vintage capital approach has been developed and empirical estimates havebeen obtained for India under different assumptions regarding rate of dis-count, premium on foreign exchange and social cost of low-grade coal. Theresults show that the assumption as regards the type of coal (zero-cost or
- 114 -
medium-cost) used does not make a substantial difference to the peak pricebecause the capital charge is the dominant component of this price. Thevalue of the peak price is relatively more sensitive to rate of discountthan to premium on foreign exchange.
VI.6 Renewable Energy Resources
A number of case studies on the economic evaluation of renewableenergy projects are available which bring out the need for proper valuationand pricing of inputs and outputs such as firewood, land for forestry, cowdung and other animal residues, crop residues (rice hulls), etc. The majorcontributions in the field have been reviewed as a part of an annotatedbibliography in a recent report by Meta Systems (1980c). Some of thesestudies have been discussed under Section 11.5; the remaining include papersby French (1979), FAO (1979), USAID (1980) and Hodam Associates (1980). Theseare discussed below in order to indicate the significance of issues involvedin economics of renewables.
The paper by French (1979) provides the most detailed benefit-cost analyses for three representative renewable energy systems: (i) a 40-hpsolar thermal irrigation pump near Balek, Senegal; (ii) a family-scale Indianbiogas plant; and (iii) a 5.5 kw solar cell irrigation pump on the borders ofLake Chad. The study presents details of financial analysis and suggests themajor adjustments required for economic analysis, e.g., shadow pricing, thecalculation of social costs and benefits, and consideration of secondaryeffects. The results show that neither the solar thermal pump nor the family-scale biogas plant appears to be profitable in either financial or economicterms under any plausible set of assumptions. The solar cell pump has posi-tive net benefit by economic measures but is unlikely to be competitive withdiesel power for another decade. There is also a good discussion of theanalytical issues which arise in pursuing benefit-cost analyses of renewable-energy devices.
However, it may be noted that there is a misunderstanding in valu-ation of benefits in two studies. In the case of the 40 hp solar thermalirrigation pump as well as the 5.5 kw solar cell irrigation pump, economicbenefits have been calculated in terms of the value of output of rice, maize,
sorghum, wheat or cotton grown by using the irrigation water supplied by thepump. The NPVs and IRRs have been calculated using these benefits adjustedfor shadow prices. This method is termed as "viewed strictly in its ownterms...without reference to competing systems." However, this method is notappropriate if the choice for the society is to use either a solar irrigationpump or a diesel irrigation pump for providing irrigation water to the crops
regardless of the additional benefits from irrigation. (The valuation ofirrigation water is a separate and a more complex matter.) The introductionof a solar system replaces an existing (or potential) diesel system and,hence, the "true" benefit of the solar system is the savings in resources(capital, foreign exchange and labor) which would otherwise have been devotedto the diesel system. Thus, the correct method of estimation of benefits
from a solar system is in terms of the costs (saved) of the competing systemand not "in its own terms." The latter, in fact, would involve attributing
- 115 -
the benefits from the use of irrigation water to solar system although thesame quantity (and quality) of irrigation water could be provided by a com-
peting diesel system.
One of the important aspects brought out by a report by Meta Systems(1980c) is that using a correct shadow price of land may be very important foreconomic evaluation of renewable energy projects, especially those concernedwith social forestry schemes or charcoal production. It is recommended that,in general, the shadow price of land should be equated to the opportunitycost of land. The opportunity cost of land may be calculated on the basis ofbenefits foregone in the alternative use of this land. The benefits foregonemay relate to the existing or potential uses of land for agricultural, forest,pasture of other industrial uses. As an approximation, one can use thebenefit foregone in terms of the value (as shadow prices) of agriculturalcommodities which could be grown on the piece of land during the lifetime ofthe project. The simplest method may be to assume that one rain-fed food-grain crop could be potentially grown on this land if not diverted to theproject in question. It is recognized that the opportunity cost of land canbe very project-specific and a lot of subjective judgement may be involved.However, it is better to indicate the range of relevant values than to usethe convenient value of zero as the opportunity cost of land as has beenthe case in some of the forestry projects discussed elsewhere.
The report on village fuelwood plantations is one of the casestudies of forestry and forest industries projects prepared by the FAO(1979) in order to demonstrate methods of preparing and appraising projectsin the forest sector. The fuelwood project discussed is a part of an inte-grated rural development program in Korea and is aimed at establishing about11,000 village fuelwood blocks covering 127,000 hectares.
The case study provides a good format for the detailed assessmentof technical considerations, project costs and benefits. Shadow prices forforeign exchange and labor as well as direct and indirect project benefitshave been considered. However, the cost of land, which is the most importantcomponent in fuelwood plantation schemes, has not been given due importance.The report notes: "It is considered that land under the project would have noalternative economic use for the period of the project. Therefore, land isvalued at zero." In addition, the valuation of fuelwood is arbitrary. It ismentioned that since fuelwood is not traded at present, the fuelwood has beenvalued in terms of the value of fuels that it would replace, namely agricul-tural residues and coal. Although the methodology used is correct, thedetails of the values of proportion of agricultural residues replacingfuelwood, the calorific contents of residue of fuelwood and the price ofagricultural residue have not been given. The price of both fuels (residuesand coal) is taken as won 12/kg without providing any basis or source ofdata.
The USAID (1980) project covers the techno-economic and financialanalysis of reforestation in the Philippines, both as an ecological necessityto present erosion, and as a source of energy. The proposed power generationplant (3Mw) is by means of a steam turbine fueled by the direct combustion
- 116 -
of harvested wood. Although a detailed economic analysis of the profitabilityof the project has been included, the entire issue of "economic cost" ofproducing fuelwood, especially the opportunity cost of land, labor and otherinputs into fuelwood plantations, has been bypassed. It is assumed that thecost of fuel to the power plant (including transportation) will be $25/greenton and the "tree farmer" will be paid at $17/ton. The basis for estimatesof fuelwood yield per hectare and labor inputs have also not been provided.
A report prepared by Hodam Associates (1980) covers the techno-economic feasibility of conversion of the rice hulls to energy in thePhilippines. Two technologies--direct combustion followed by a steam cycle,and gasification followed by a diesel cycle--have been discussed. The eco-nomic analysis presents a comparison of 15-year costs of the current system,the gasification system and a steam cycle system. The gasification systemwith cogeneration is found most economic although its technical reliabilityis in doubt. The nation-wide benefits in terms of savings of diesel fuel arementioned but not quantified. Although rice hulls are the major input, thesehave not been included on the cost side. In addition, no effort was made todo social benefit cost analysis or perform sensitivity analysis to importanttechno-economic parameters.
Conclusion
A summary evaluation of investment and pricing principles is diffi-cult because, with the exception of electricity, we have not been able to finda well-developed body of literature in this area. Integrated energy sectorstudies such as for Mexico and Bangladesh provide an important guide to howsimilar studies can be done. The operational requirements for such studies,however, are considerable. It should be possible to create a typology ofdeveloping countries energy situations, identify a few "typical" sets ofproblems that tend to coalesce together and develop a step-by-step method ofpricing recommendations in each situation.
There is another reason that evaluation of literature in this areais rather difficult; this is that the actual policies followed by governmentsdo not always follow the guidelines provided by theoretical principles. Sincewe had a priori decided to ignore the descriptive, institutional literature onLDC energy planning and policy making, it was not possible to evaluate suchdivergence of practice from theory and the range of possible explanations forit.
In the oil and gas sub-sector, much of the literature on investmentand capacity expansion (particularly in the exploration and developmentstages) is fairly technical, with data requirements beyond the range availablein many developing countries, and also very location-specific. However, boththe ENERGETICOS model for Mexican energy sector development (though somewhat
dated) and the variety of investment studies done for the Bangladesh Energy
Study suggest potentially useful areas of further research, refinement, andapplicability to other developing countries. The Bhatia (1976) study onpetroleum refining industry in India is also significant for suggestingsimilar work using process analysis models elsewhere. The critical questions
- 117 -
of taxation and the structure of relative petroleum product prices havereceived little attention in the literature from either developed or devel-oping countries.
Very little work has been done on the potential for investment incoal production in developing countries. At present few developing countrieshave significant proven reserves of coal, but this may be a function of inade-quate exploration rather than poor geology. The potential for coal use indeveloping countries has not been adequately studied, and long-term planningfor coal exploration and development, production, and pricing policies isnecessary.
By comparison, power sector investment and capacity expansionstudies on developing countries are widely available. However, the possi-bilities of substitution between electricity and other energy sources atthe end-use level needs to be studied to determine what policy leverageis possible in shifting a country's overall energy use towards or away fromelectricity. Such work would be of considerable use in integrated energysector investment planning.
A very different set of questions arise with renewable energyresources, particularly the traditional, non-commercial ones. Problems indetermining the shadow price of some of the renewables have already beendiscussed in Section 11.4. For fuelwood or charcoal, for example, estimatingthe opportunity cost of land is necessary, and such estimates depend on arange of alternative uses for land. For animal manure or crop residues,their alternative (non-fuel) uses as fodder or fertilizer give differentmeasures of opportunity costs. One would ideally need to take into accountthe shadow prices of the alternate outputs, possibly extending on to severallinkages. Considerable work is needed for a conceptual development of theseissues and preliminary empirical work.
Several problems also plague the issue of market pricing policiesfor renewables. Some renewables may have a cash market but if this marketwas weakly organized and fragmented (limited to each village, for example),there is no way a government can influence it directly. For either this kindof renewable or non-commercial ones, if their use required a complementaryequipment (such as a biogas plant or a solar battery) which had a sufficientlystrong market, then the government may be able to influence the latter's priceand hence the energy resource use indirectly. But for some non-commercialrenewables (such as dung cakes or free branches and wooden sticks) even thisis impossible. The policy options available to the government in such casesmay be to effect changes in energy resource generation and consumption patternsthemselves such as establishing forestry schemes, prohibiting woodchopping(where enforceable), even encouraging a shift from wood to kerosene by sub-sidizing kerosene stoves. Not only are such choices problematic, bu the ruralenergy system in many LDCs are embedded in complex food-fodder-fuel-fertilizer-feedstock interrelationships whose physical as well as social dimensions arepoorly understood.
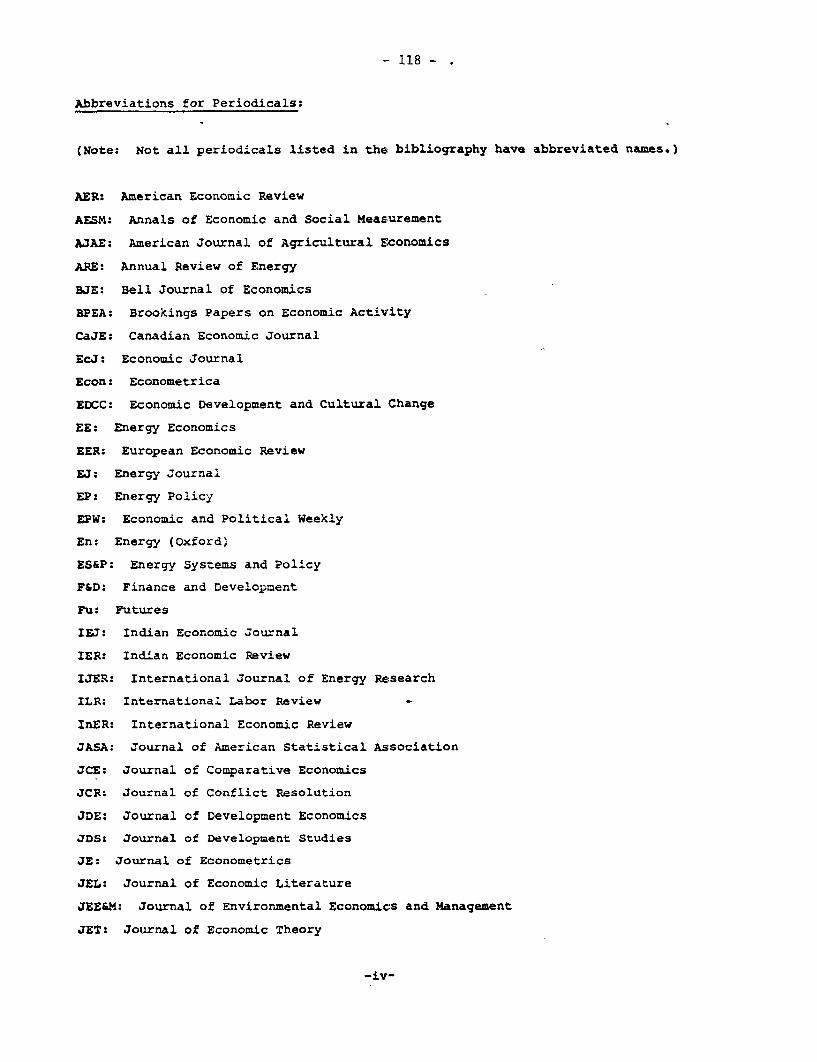
- 118 -
Abbreviations for Periodicals:
(Note: Not all periodicals listed in the bibliography have abbreviated names.)
AER: American Economic Review
AESM: Annals of Economic and Social Measurement
AJAE: American Journal of Agricultural Economics
ARE: Annual Review of Energy
BJE: Bell Journal of Economics
BPEA: Brookings Papers on Economic Activity
CaJE: Canadian Economic Journal
EcJ: Economic Journal
Econ: Econometrica
EDCC: Economic Development and Cultural Change
EE: Energy Economics
EER: European Economic Review
EJ: Energy Journal
EP: Energy Policy
EPW: Economic and Political Weekly
En: Energy (Oxford)
ES&P: Energy Systems and Policy
F&D: Finance and Development
Fu: Futures
IEJ: Indian Economic Journal
IER: Indian Economic Review
IJER: International Journal of Energy Research
ILR: International Labor Review
InER: International Economic Review
JASA: Journal of American Statistical Association
JCE: Journal of Comparative Economics
JCR: Journal of Conflict Resolution
JDE: Journal of Development Economics
JDS: Journal of Development Studies
JE: Journal of Econometrics
JEL: Journal of Economic Literature
JEE&M: Journal of Environmental Economics and Management
JET: Journal of Economic Theory
-iv-
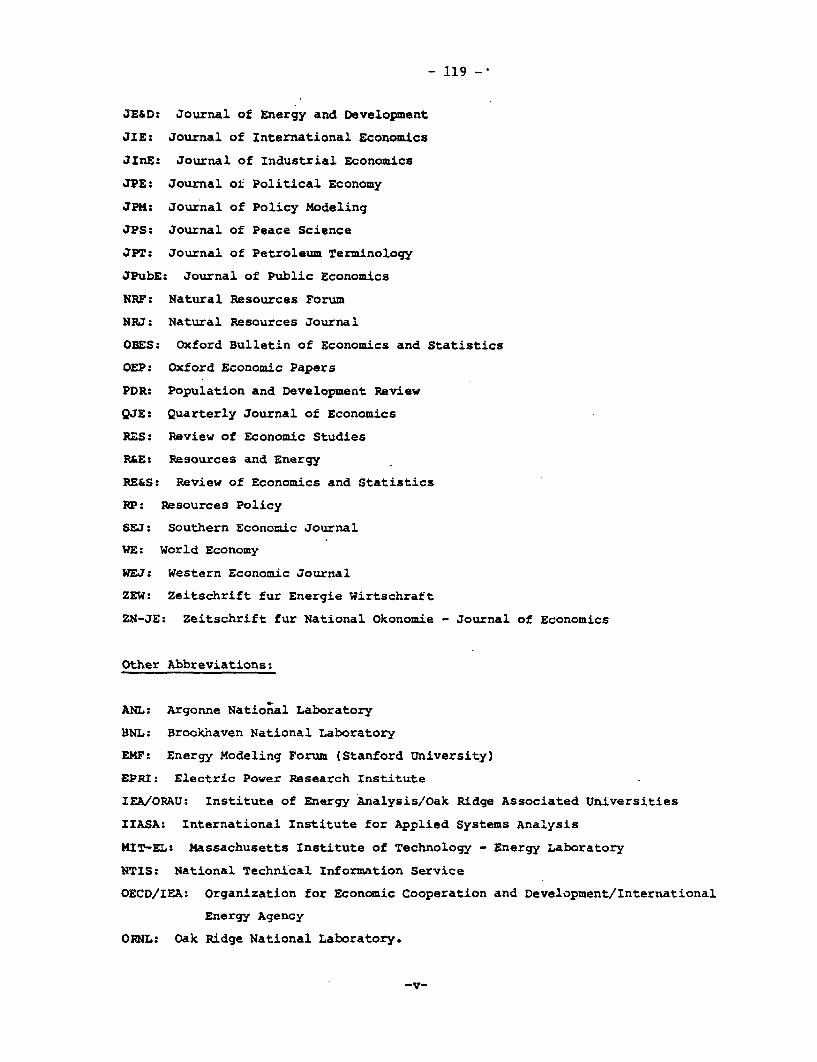
- 119
JE&D: Journal of Energy and Development
JIE: Journal of International Economics
JInE: Journal of Industrial Economics
JPE: Journal ok Political Economy
JPM: Journal of Policy Modeling
JPS: Journal of Peace Science
JPT: Journal of Petroleum Terminology
JPubE: Journal of Public Economics
NRF: Natural Resources Forum
NRJ: Natural Resources Journal
OBES: Oxford Bulletin of Economics and Statistics
OEP: Oxford Economic Papers
PDR: Population and Development Review
QJE: Quarterly Journal of Economics
RES: Review of Economic Studies
R&E: Resources and Energy
RE&S: Review of Economics and Statistics
RP: Resources Policy
SEJ: Southern Economic Journal
WE: World Economy
WEJ: Western Economic Journal
ZEW: Zeitschrift fur Energie Wirtschraft
ZN-JE: Zeitschrift fur National Okonomie - Journal of Economics
Other Abbreviations:
ANL: Argonne National Laboratory
BNL: Brookhaven National Laboratory
EMF: Energy Modeling Forum (Stanford University)
EPRI: Electric Power Research Institute
IEA/ORAU: Institute of Energy Analysis/Oak Ridge Associated Universities
IIASA: International Institute for Applied Systems Analysis
MIT-EL: Massachusetts Institute of Technology - Energy Laboratory
NTIS: National Technical Information Service
OECD/IEA: Organization for Economic Cooperation and Development/International
Energy Agency
ORNL: Oak Ridge National Laboratory.
-v-
- 120 -
Part II. Classified Bibliography
- 121 -
BIBLIOGRAPHY
for
CHAPTER II: Economic Theory of Exhaustible and Renewable Resources
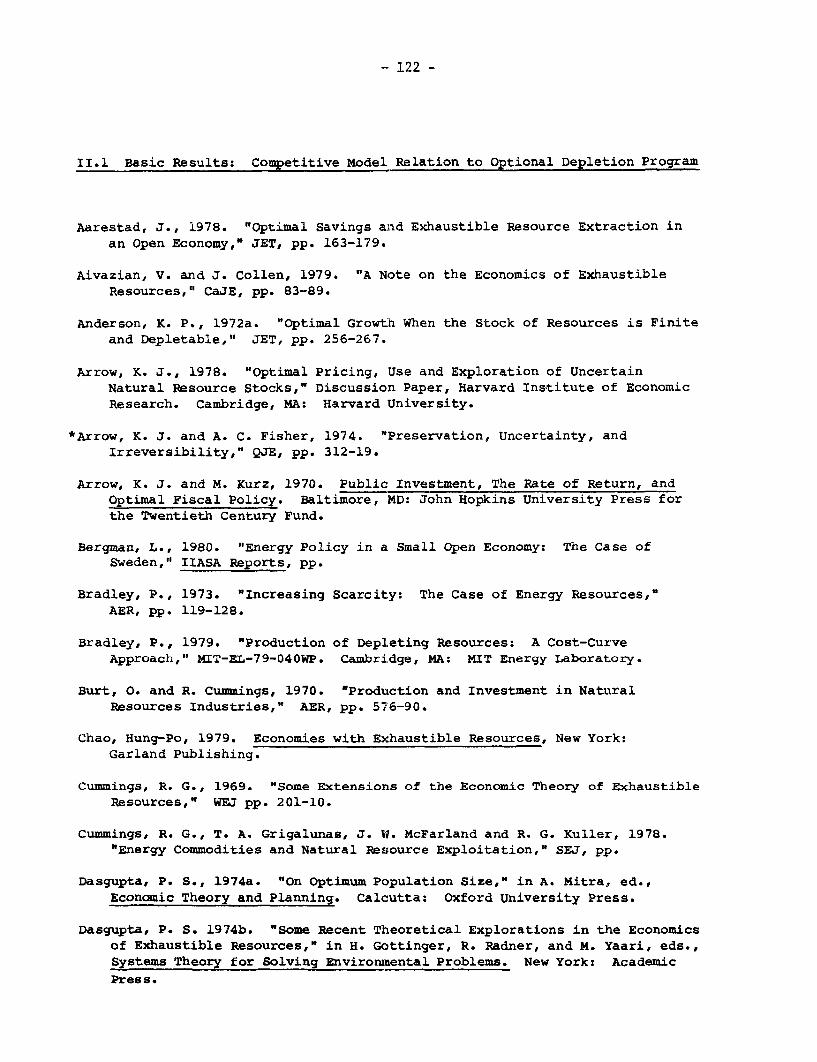
- 122 -
II.1 Basic Results: Competitive Model Relation to Optional Depletion Program
Aarestad, J., 1978. "Optimal Savings and Exhaustible Resource Extraction in
an Open Economy," JET, pp. 163-179.
Aivazian, V. and J. Collen, 1979. "A Note on the Economics of Exhaustible
Resources," CaJE, pp. 83-89.
Anderson, K. P., 1972a. "Optimal Growth When the Stock of Resources is Finite
and Depletable," JET, pp. 256-267.
Arrow, K. J., 1978. "Optimal Pricing, Use and Exploration of Uncertain
Natural Resource Stocks," Discussion Paper, Harvard Institute of Economic
Research. Cambridge, MA: Harvard University.
*Arrow, K. J. and A. C. Fisher, 1974. "Preservation, Uncertainty, and
Irreversibility," QJE, pp. 312-19.
Arrow, K. J. and M. Kurz, 1970. Public Investment, The Rate of Return, and
Optimal Fiscal Policy. Baltimore, MD: John Hopkins University Press for
the Twentieth Century Fund.
Bergman, L., 1980. "Energy Policy in a Small Open Economy: The Case of
Sweden," IIASA Reports, pp.
Bradley, P., 1973. "Increasing Scarcity: The Case of Energy Resources,"
AER, pp. 119-128.
Bradley, P., 1979. "Production of Depleting Resources: A Cost-Curve
Approach," MIT-EL-79-040WP. Cambridge, MA: MIT Energy Laboratory.
Burt, 0. and R. Cummings, 1970. "Production and Investment in Natural
Resources Industries," AER, pp. 576-90.
Chao, Hung-Po, 1979. Economies with Exhaustible Resources, New York:
Garland Publishing.
Cummings, R. G., 1969. "Some Extensions of the Economic Theory of Exhaustible
Resources," WEJ pp. 201-10.
Cummings, R. G., T. A. Grigalunas, J. W. McFarland and R. G. Kuller, 1978.
"Energy Commodities and Natural Resource Exploitation," SEJ, pp.
Dasgupta, P. S., 1974a. "On Optimum Population Size," in A. Mitra, ed.,
Economic Theory and Planning. Calcutta: Oxford University Press.
Dasgupta, P. S. 1974b. "Some Recent Theoretical Explorations in the Economics
of Exhaustible Resources," in H. Gottinger, R. Radner, and M. Yaari, eds.,
Systems Theory for Solving Environmental Problems. New York: Academic
Pres s.
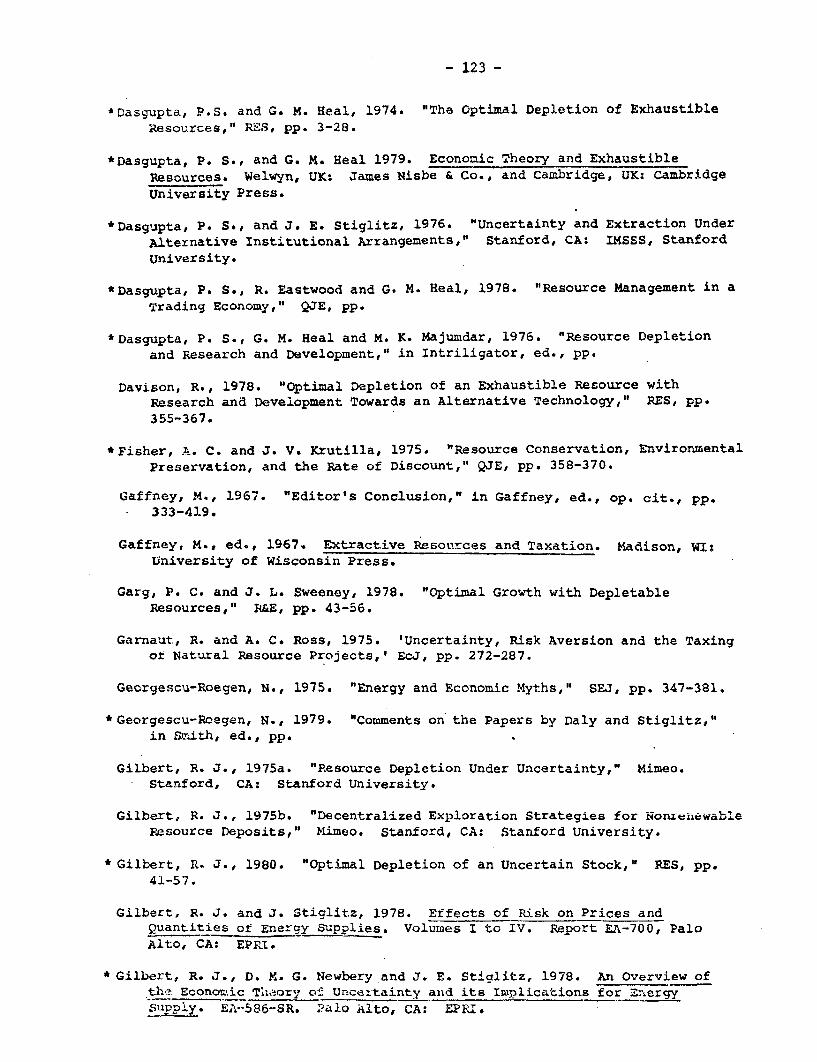
- 123 -
*Dasgupta, P.S. and G. M. Heal, 1974. "The Optimal Depletion of Exhaustible
Resources," RES, pp. 3-28.
*Dasgupta, P. S., and G. M. Heal 1979. Economic Theory and Exhaustible
Resources. Welwyn, UK: James Nisbe & Co., and Cambridge, UK: Cambridge
University Press.
*Dasgupta, P. S., and J. E. Stiglitz, 1976. "Uncertainty and Extraction Under
Alternative Institutional Arrangements," Stanford, CA: IMSSS, Stanford
University.
*Dasgupta, P. S., R. Eastwood and G. M. Heal, 1978. "Resource Management in a
Trading Economy," QJE, pp.
*Dasgupta, P. S., G. M. Heal and M. K. Majumdar, 1976. "Resource Depletion
and Research and Development," in Intriligator, ed., pp.
Davison, R., 1978. "Optimal Depletion of an Exhaustible Resource with
Research and Development Towards an Alternative Technology," RES, pp.355-367.
*Fisher, A. C. and J. V. Krutilla, 1975. "Resource Conservation, Environmental
Preservation, and the Rate of Discount," QJE, pp. 358-370.
Gaffney, M., 1967. "Editor's Conclusion," in Gaffney, ed., op. cit., pp.333-419.
Gaffney, M., ed., 1967. Extractive Resources and Taxation. Madison, WI:University of Wisconsin Press.
Garg, P. C. and J. L. Sweeney, 1978. "Optimal Growth with DepletableResources," R&E, pp. 43-56.
Garnaut, R. and A. C. Ross, 1975. 'Uncertainty, Risk Aversion and the Taxingof Natural Resource Projects,' EcJ, pp. 272-287.
Georgescu-Roegen, N., 1975. "Energy and Economic Myths," SEJ, pp. 347-381.
*Georgescu-Roegen, N., 1979. "Comments on the Papers by Daly and Stiglitz,"
in Szith, ed., pp.
Gilbert, R. J., 1975a. "Resource Depletion Under Uncertainty," Mimeo.Stanford, CA: Stanford University.
Gilbert, R. J., 1975b. "Decentralized Exploration Strategies for Nontenewable
Resource Deposits," Mimeo. Stanford, CA: Stanford University.
* Gilbert, R. J., 1980. "Optimal Depletion of an Uncertain Stock," RES, pp.41-57.
Gilbert, R. J. and J. Stiglitz, 1978. Effects of Risk on Prices andQuantities of Energy Supplies. Volumes I to IV. Report EA-700, PaloAlto, CA: EPRI.
* Gilbert, R. J., D. M. G. Newbery and J. E. Stiglitz, 1978. An Overview ofthe Economic Theory of Uncertainty and its Implications for Znergy
S-PPly. EA-586-SR. , alo Alto, CA: EPRI.
- 124 -
* Gordon, R. L., 1967. "A Reinterpretation of the Pure Theory of Exhaustion,"
JPE, pp. 274-286.
* Gray, L. C., 1914. "Rent Under the Assumption of Exhaustibility," QJE, pp.466-89. (Reprinted in Gaffney, ed., 1967, op. cit.)
Guesnerie, R. and T. deMontbrial, 1974. "Allocation under Uncertainty: A
Survey," in J. H. Dreze, ed., Allocation under Uncertainty: Equilibrium
and Optimization. London: MacMillan.
Hanson, D. A., 1977a. "The Allocation of a Natural Resource When the Cost of
a Substitute Is Uncertain," AESM, pp. 189-201.
Hanson, D. A., 1977b. "Competitive Price Behavior of an Exhaustible Resource
Where The Rate of Substitution Is Constrained," InER, pp. 135-149.
*Hanson, D. A., 1977c. "Second Best Pricing Policies for an Exhaustible
Resource," AER, pp. 351-354.
Hanson, D. A., 1979a. "Increasing Extraction Costs and Resource Prices," in
Pindyck, ed., 1979a, pp. 177-186.
Hanson, D. A., 1979b. "Increasing Extraction Costs and Resource Prices: Some
Further Results," BJE, pp. 335-342.
Hartwick, J. M., 1977. "Intergenerational Equity and the Investing of Rents
from Exhaustible Resources," AER, pp. 972-974.
Hartwick, J. M., 1978. "Substitution Among Exhaustible Resources and
Intergenerational Equity," RES, pp. 347-354.
*Heal, G. M., 1975. "The Influence of Interest Rates on Resource Prices,"Cowles Foundation Discussion Paper No. 407. New Haven, CT: YaleUniversity.
*Heal, G. M., 1976. "The Relationship Between Price and Extraction Cost for aResource with a Backstop Technology," BJE, pp. 317-378.
Heal, G. M., 1979a. "The Long-Run Movement of the Prices of Exhaustible
Resources," in E. Malinvaud, ed., Economic Growth and Resources, Vol I:
.The Major Issues, pp. 89-107. New York: St. Martin's, for International
Economic Association.
*Heal, G. m., 1979b. "Uncertainty and the Optimal Supply Policy for anExhaustible Resource," in Pindyck, ed., 1979b, pp. 119-148.
Heal, G. M. and M. Barrow, 1979. "Empirical Investigations of the Long-Term
Movement of Resource Prices," Discussion Paper Series, 79-80-40, NewYork: Department of Economics, Columbia University.
Heal, G. M. and M. Barrow, 1980. "The Relationship Between Interest Rates andMetal Price Movements," RES, pp. 161-181.
- 125 -
Henry, C., 1974a. "Investment Decisions under Uncertrainty: The
Irreversibility Effect," AER, pp. 1006-12.
Henry, C., 1974b. "Option Values in the Economics of Irreplaceable Assets,"RES, pp. 89-104.
*Herfindahl, 0. C. and A. V. Kneese, 1974. Economic Theory of NaturalResources. Columbus, OH: Charles R. Merrill.
Hoel, M., 1978a. "Resource Extraction When a Future Substitute has anUncertain Cost," RES, pp. 637-644.
Hoel, M., 1978b. "The Long-Run Rate of Profit in an Economy with NaturalResource Scarcity," Scandinavian Journal of Economics, pp. 199-208.
*Hotelling, H., 1931. "The Economics of Exhaustible Resources," JPE, pp.
137-175.
Houthakker, H. S., 1976a. "The Economics of Nonrenewable Resources," Harvard
Institute of Economic Research Discussion Paper No. 493. Cambridge, MA:
Harvard University.
Intriligator, M. D., 1971. Mathematical Optimization and Economic Theory.
Englewood Cliffs, NJ: Prentice Hall.
Intriligator, M. D., ed., 1977 Frontiers of Quantitative Economics, Vol.IIIB. Amsterdam: North Holland.
*Jacoby, H. D. and J. J. Stern, 1980. "Economic Objectives, Parameters, andAssumptions," Chapter 5 in deLucia, Jacoby, et al., op. cit.
JCemp, M. C. and N. v. Long, 1979. "International Trade with an Exhaustible
Resource: a Theorem of Rybczynski type," InER, pp.
Kemp. M. C. and N. v. Long, 1980. "On Two Folk Theorems Concerning theExtraction of Exhaustible Resources," Econ, pp.
*Kemp, M. C. and N. v. Long, eds., 1980. Exhaustible Resources, Optimalilty,and Trade. New York: North Holland.
Koopmans, T. C., 1973. "Some Observations on 'Optimal' Economic Growth and
Exhaustible Resources," in H. C. Bos, H. Linnemann and P. dewolff, eds.,Economic Structure and Development: Essays in Honor of Jan Tinbergen.Amsterdam: North Holland.
' Koopmans, T. C., 1977. "Concepts of Optimality and Their Uses," AER, pp.
261-74.
Kroch, E. A., 1978. Economic Dynamics of Energy Resource Allocation inTheory and Practice. Unpublished Ph. D. dissertation. Cambridge, MA:
Harvard University.
Lecomber, R., 1979. The Economics of Natural Resources. New York: *McMillan.
Lee, D. R. and D. Orr, 1975. "The Private Discount Rate and ResourceConservation," CaJE, pp. 351-363.
- 126 -
Levhari, D. and N. Liviatan, 1977. "Notes on Hotelling's Economics ofExhaustible Resources," CaJE, pp. 177-92.
Long, N* V., 1975. "Resource Extractions Under Uncertainty about PossibleNationalization," JET, pp. 42-53.
Louri, G. D., 1978. "The Optimal Exploitation of an Unknown Resource," RES,pp. 621-636.
Marglin, S. A., 1967. Public Investment Criteria. Cambridge, MA: MIT Press.
Marglin, S. A., 1976. Value and Price in the Labor Surplus Economy. Oxford,U.K.: Clarendon Press.
Maskin, E. and D. Newbery, 1977. "A Paradox in Tax Theory: Optimal Tariffsfor Exhaustible Resources," Mimeo. Cambridge, MA: MIT Department ofEconomics.
Microeconomic Associates, 1978. See Gilbert and Stiglitz, 1978 and Gilbert,Newbery and Stiglitz, 1978.
Mishan, E. J., 1979. "Does Perfect Competition in Mining Produce an OptimalRate of Exploitation?," in H. I. Greenfield, et al., eds., Theory forEconomic Efficiency: Essays in Honor of Abba P. Lerner. Cambridge, MA:MIT Press.
Mixon, J. W., 1979. "Economic Welfare with Exhaustible Natural Resources,"EE, pp. 245-247.
Morse, C., 1976. "Depletion, Exhaustibility, and Conservation," in W. A.Vogley, ed., Economics of Mineral Industries, 3rd edition. New York, NY:American Institute of Mining, Metallurgical and Petroleum Engineers.
*Munasinghe, M., 1980a. "An Integrated Framework for Energy Pricing inDeveloping Countries," EJ, pp. 1-30.
*Munasinghe, M. and G. Schramm 1980. "Power-Energy Pricing Case Studies,"(Draft), Mimeo. Washington, DC: The World Bank.
Nordhaus, W. D., 1973. "The Allocation of Energy Resources," BPEA, PP*
*Nordhaus, W. D., 1979. The Efficient Use of Energy Resources. New Haven,CT: Yale University Press.
Nziramasanga, M., 1977. "Production from an Exhaustible Resource UnderGovernment Control in an LDC," Center for Research on EconomicDevelopment, Discussion Paper No. 70. Ann Arbor, MI: University ofMichigan.
Pearce, D. W. and J. Rose, eds., 1975. The Economics of Natural Resources,London: McMillan.
*Peterson, F. M., 1975b. "Two Externalities in Petroleum Exploration," inBrannon, ed., 1975, pp.
- 127 -
Peterson, F. M., 1978. "A Model of Mining and Exploring for Exhaustible
Resources," JEE&M, pp. 236-51.
*Peterson, P. M. and A. C. Fisher, 1977. "The Exploitation of Renewable and
Non-renewable Natural Resources," EcJ, pp. 681-721.
*Pindyck, R. S, 1978a. "The Optimal Exploration and Production of
Non-renewable Resources," JPE, October, pp. 841-861.
Pindyck, R. S, 1979a. "Models of Resource Markets and the Explanation of
Resource Price Behavior," MIT-EL-79-062WP, Cambridge, MA: MIT Energy
Laboratory.
Pindyck, R. S., 1979c. "Uncertainty and Exhaustible Resource Markets,"MIT-EL 79-012WP, Cambridge, MA: MIT Energy Laboratory.
Radner, R., 1970. "New Ideas in Pure Theory: Problems in the Theory ofMarkets Under Uncertainty," AER, pp. 454-60.
Radner, R., 1974. "Market Equilibrium Under Uncertainty: Concepts andProblems," in M. Intriligator and D. Kendrick, eds., pp. Frontiers ofQuantitative Economics, Vol. II, pp. Amsterdam: North Holland.
Ramsey, F. P., 1928. "A Mathematical Theory of Saving," EcJ, pp. 543-559.
Roberts, K. and M. Weitzman, 1979. "Funding Criteria for Research,Development, and Exploration Projects," Report MIT-EL-79-009. Cambridge,MA: MIT Energy Laboratory
Schulze, W. D., 1974. "The Optimal Use of Non-renewable Resources: TheTheory of Extraction," JEE&M pp. 53-73.
*Siddayao, C. M., 1980. "Petroleum and Coal Pricing Policies," Mimeo.Honolulu: Prepared for the Asian Development Bank Regional Energy Surveyby the East Weat Center.
Smith, V. K., 1979. "An Econometric Analysis of the Behavior of NaturalResource Prices," Washington, DC: Resources for the Future.
Smith, V. K., ed., 1979. Scarcity and Grovith Reconsidered. Baltimore, MD:Johns Hopkins University Press for Resources for the Future.
Solow, R. M., 1974a. "The Economics of Resources or the Resources ofEconomics," AER. May, pp. 1-27.
*Solow, R. M., 1974b. "Intergenerational Equity and Exhaustible Resources,"RES Symposium, pp.
Solow, R. M., 1977. "Monopoly, Uncertainty and Exploration," in A. S.Blinder and P. Friedman, eds., Natural Resources, Uncertainty, and GeneralEquilibrium Systems: Essays in Honor of Rafael Lusky, pp. 17-31. NewYork: Academic Press.
Solow, R. M. and F. Y. Wan, 1976. "Extraction Costs in the Theory ofExhaustible Resources," BJE, pp. 359-370.
-128 -
*Stiglitz, J. E., 1974a. "Growth with Exhaustible Resources: The Competitive
Economy," RES Symposium, pp. 123-128.
Surrey, A. J. and R. W. Page, 1975. "Some Issues in the Current Debate aboutEnergy and Natural Resources," in Pearce and Rose, eds., op. cit.
Suzuki, H. and M. Ogawa, 1979. "International Trade with Exhaustible NaturalResources," ZN-JE, pp. 131-142.
Sweeney, J. L., 1977. 'Economics of Depletable Resources: Market Forces andIntertemporal Bias," RES, pp. 125-42.
*Vousden, N., 1973. "Basic Theoretical Issues of Resource Depletion," JET.pp. 126-143.
Vousden, N., 1974. "International Trade and Exhaustible Resources: ATheoretical Model," InER, pp. 146-167.
Vousden, N. J., 1977. "Resource Scarcity and the Availability of Substitues:A Theoretical Model" in Intriligator, ed., pp. 507-532.
*Weinstein, M. and R. Zeckhauser, 1974. "Use Patterns for Depletable andRecyclable Resources," RES Symposium, pp. 67-88.
*Weinstein, M. and R. Zeckhauser, 1975. "The Optimal Consumption ofDepletable Natural Resources," QJE, August, pp. 371-392.
*Weitzman, M. L., 1976. "Optimal Development of Resource Pools," JET, pp.371-392.
- 129 -
11.2. Market Structure
* Cremer, J. and M. L. Weitzman, 1976. "OPEC and the Monopoly Price of WorldOil," EER, pp. 155-164.
* Dasgupta, P. S., and G. M. Heal 1979. Economic Theory and ExhaustibleResources. Welwyn, UK: James Nisbe & Co., and Cambridge, UK: CambridgeUniversity Press.
* Dasgupta, P. S., and J. E. Stiglitz, 1976. "Uncertainty and Extraction UnderAlternative Institutional Arrangements," Stanford, CA: IMSSS, StanfordUniversity.
Davidson, P., L. H. Falk and H. Lee, 1975. "The Relations of Economic Rentsand Price Incentives to Oil and Gas Suppliers," in Brannon, ed., pp.115-73.
Duchesneau, T. D., 1975. Competition in the Energy Industry. Cambridge, MA:Ballinger Publishing Co.
* Gilbert, R. J., 1978. "Dominant Firm Pricing in a Market for ExhaustibleResource," BJE, pp. 385-395
Gilbert, R. J. and S. Goldman, 1978. "Potential Competition and the MonopolyPrice of an Exhaustible Resource," JET, pp. 319-331.
Gottwald, D. and W. Guth, 1980. "Allocation of Exhaustible Resources in Oligo-polistic Markets: A Dynamic Game Approach," EE, pp. 208-222.
* Heal, G. M., 1976. "The Relationship Between Price and Extraction Cost for aResource with a Backstop Technology," BJE, pp. 317-378.
Heal, G. M., 1979b. "Uncertainty and the Optimal Supply Policy for anExhaustible Resource," in Pindyck, ed., 1979b, pp. 119-148.
* Hnyilicza, E. and R. S. Pindyck, 1976. "Pricing Policies for a Two-PartCartel: The Case of OPEC," EER, pp. 135-154.
Hoel, M., 1978c. "Resource Extraction, Substitute Production, and Monopoly,"JET, pp. 28-37.
Jenkins, G. P. and B. Wright, 1975. "Taxation of Income of Multinational
Corporations: The Case of U.S. Petroleum Industry," RE&S, pp. 1-11.
* Kay, J. A. and J. A. Mirrlees, 1975. "The Desirability of Natural Resource
Depletion," in Pearce and Rose, eds., op. cit.
Khalatbori, F., 1976. Exhaustible Resources, Planning, and Uncertainty,
Ph.D. Thesis, London: London School of Economics and Political Science.
* Lewis, T. R., 1976. 'Monopoly Exploitation of an Exhaustible Resource,' JEE&M,
pp. 198-204.
- 130 -
Lewis, T. R., S. A. Mztthews and H. S. Burness, 1979. "Monopoly and the Rate
of Extraction of Exhaustible Resources: Note," AER, March, pp. 227-230.
Pearce, D. W. and J. Rose, eds., 1975. The Economics of Natural Resources,
London: McMillan.
* Peterson, F. M. and A. C. Fisher, 1977. "The Exploitation of Renewable and
Non-renewable Natural Resources," EcJ, pp. 681-721.
* Pindyck, R. S., 1976. "Gains to Producers from the Cartelization of Exhaust-
ible Resources," MIT-EL-76-102WP. Cambridge, MA: MIT Energy Laboratory.
Pindyck, R. S., 1977a. "Cartel Pricing and the Structure of the World Bauxite
Market," BJE, pp. 343-360.
Pindyck, R. S., ed., 1979b. Advances in the Economics of Energy andResources, Vol. II: The Production and Pricing of Energy Resources.
Greenwich, CT: JAI Press.
Roberts, B., 1980. "The Effects of Supply Contracts on the Output and Price
of an Exhaustible Resource," QJE, pp. 245-260.
Rothkopf, M. H., 1969. "A Model of Rational Competitive Bidding," Management
Science, pp. 362-73.
* Salant, S. W., 1976. "Exhaustible Resources and Industrial Structures: ANash-Cournot Approach to World Oil Market," JPE, pp. 1079-1093.
Schnalensee, R., 1976. "Resource Exploitation Theory and the Behavior of the
Oil Cartel," EER, pp. 257-279.
Soladay, J. J., 1979. "Monopoly and Crude Oil Extraction," AER, pp. 234-239.
Solow, R. M., 1977. "Monopoly, Uncertainty and Exploration," in A. S.
Blinder and P. Friedman, eds., Natural Resources, Uncertainty, and General
Equilibrium Systems: Essays in Honor of Rafael Lusky, pp. 17-31. NewYork: Academic Press.
Stiglitz, J. E., 1975. "The Efficiency of Market Prices in Long RunAllocations in the Oil Industry," in Brannon, ed., pp. 55-99.
Stiglitz, J. E., 1976. "Monopoly and the Rate of Extraction of Exhaustible
Resources," AER, pp. 655-661.
Sweeney, J. L., 1977. "Economics of Depletable Resources: Market Forces andIntertemporal Bias," RES, pp. 125-42.
Tullock, G., 1979. "Monopoly and the Rate of Extraction of Exhaustible
Resources: Note," AER, March, pp. 231-233.
Weinstein, M. and R. Zeckhauser, 1975. "The Optimal Consumption of DepletableNatural Resources," QJE, August, pp. 371-392.
- 131 -
11.3. Taxation and Leasing
Brannon, G. M., 1975. Energy: Taxes and Subsidies, Cambridge, MA: Ballinger
Press.
* Brannon, G. M., ed., 1975. Studies in Energy Tax Policy, Cambridge, MA:
Ballinger Press.
Dasgupta, P. S., and G. M. Heal 1979. Economic Theory and Exhaustible
Resources. Welwyn, UK: James Nisbe & Co., and Cambridge, UK: Cambridge
University Press.
Dasgupta, P.o S., G. M. Heal and J. E. Stiglitz, 1979. "The Taxation ofExhaustible Resources." National Bureau of Economic Research WorkingPaper No. 43G. Cambridge, MA.
Due, J. F., 1970. "The Developing Economies, Tax and Royalty Payments by thePetroleum Industry, and the United States Income Tax," NRJ, pp.
Erickson, E. W., S. W. Millsaps and R. M. Spann, 1974. "Oil Supply and TaxIncentives," BPEA, pp. 449-78.
* Gafney, M., 1967. "Editor's Conclusion," in Gaffney, ed., op. cit., pp.333-419.
* 'Gaffney, M., ed., 1967. Extractive Resources and Taxation. Madison, WI:University of Wisconsin Press.
* Gaskins, D. W. and B. Vann, 1975. "Joint Buying and the Sellers' Return: TheCase of OCS Lease Sales," Mimeo. Berkeley, CA: University of California,Berkeley.
Gillis, S. M. and C. E. McLure, Jr., 1975. "Incidence of World Taxes onNatural Resources with Special Reference to Bauxite," AER, pp. 389-396.
Gillis, S. M. and C. P. Timmer, eds. (forthcoming, 1981). Public Policy inIndonesia: Issues and Methodology. Cambridge, MA: Oelgeschlager, Gurm,and Hain.
Gillis, S. M., et al., 1978. Taxation and Mining: Non-fuel Minerals inBolivia and Other Countries. Cambridge, MA: Ballinger Press.
Hughes, H. and S. Singh, 1978. "Economic Rent: Incidence in Selected Metalsand Minerals," RP, pp. 135-145.
Johnson, W. A., R. E. Messick, S. Van Vactor and F. R. Wyant, 1975.Competition in the oil Industry, Washington, DC: The George WashingtonUniversity.
* Kalter, R. J. and W. A. Vogely, eds., 1976. Energy Supply and GovernmentPolicy. Ithaca, NY: Cornell University Press.
132 -
Kamien, M. I. and N. L. Schwartz, 1977. "A Note on Resource Usage and MarketStructure," JET, pp. 394-397.
Lee, D. R., 1979. "Price Controls on Non-Renewable Resources: AnIntertemporal Analysis," SEJ, pp. 179-88.
Leland, H. E., R. Norgaard and S. Pearson, 1974. "An Economic Analysis of
Alternative Continental Shelf Petroleum Leasing Policies," Mimeo.Berkeley, CA: University of California.
Palmer, K. F., 1980. 'Xineral Taxation Policies in Developing Countries: An
Application of Resource Rent Tax,' IMF Staff Papers, pp. 517-542.
" Peterson, F. M., 1975a. "The Long-run Dynamics of Minerals Taxation," Mimeo
College Park, MD: University of Maryland.
" Peterson, F. M., 1975b. "Two Externalities in Petroleum Exploration," inBrannon, ed., 1975, pp.
" Peterson, F. M. and A. C. Fisher, 1977. "The Exploitation of Renewable and
Non-renewable Natural Resources," EcJ, pp. 681-721.
Rothkopf, m. H., 1969. "A Model of Rational Competitive Bidding," ManagementScience, pp. 362-73.
Rowland, C., 1980. 'Taxing North Sea Oil Profits in the U.K.,' EE,
pp. 115-125.
Stiglitz, J. E., 1974b. "Tax Policy and the oil Industry," Mimeo. NewHaven, CT: Yale University.
Tyner, W. E., 1978. Energy Resources and Economic Development in India.
Leiden: Martinus Nijhotf.
Wilson, R., 1975. "Price Formation via Competitive Bidding," Ximeo, Stanford,
CA: Stanford University.
- 133 -
11.4. Renewable Resources
Bhatia, R., 1977. "Economic Appraisal of Biogas Units in India: Frameworkfor Social Benefit Cost Analysis," EPW, pp. 302-315.
Bhatia, R. and M. Niamir., 1979. "Renewable Energy Sources: TheCommunity Biogas Plant," mimeo. (draft), (Revised 1980) Cambridge, MA;Harvard University.
* Brown, G. M., 1974. "An Optimal Program for Managing common PropertyResources with Congestion Externalities," JPE, pp. 163-75.
* Clark, C. W., 1977. Mathematical Bioeconomics: The Optimal Management ofRenewable Resources. New York: Wiley Interscience.
Clark, C. W., F. H. Clarke and G. R. Munro, 1979. "The Optimal Exploitationof Renewable Resource Stocks: Problems of Irreversible Investment," Econ,pp. 25-47.
* Dasgupta, P. S., and G. M. Heal 1979. Economic Theory and Exhaustible
Resources. Welwyn, UK: James Nisbe & Co., and Cambridge, UK: CambridgeUniversity Press.
deLucia, R. J. and R. Bhatia, 1980. "Economics of Renewable Energy
Technologies in Rural Third World: A Review." Mimeo. Cambridge, MA:Meta Systems Inc.
Food and Agricultural Organization of the U.N. (FAO), 1979. Economic Analysisof Forestry Projects. Rome: FAO.
Gaffney, M., 1960. "Concepts of Financial Maturity of Timbers and other
Assets," Agricultural Economics Information Series No. 62 Raleigh, NC:
North Carolina State College.
Howe, C. W., 1976. "Economic and Social Perspectives Relevant to Forest
Policy." Boulder, CO: University of Colorado.
Howe, C. W., 1979. Natural Resource Economics. New York: John Wiley.
Munasinghe, M., 1980a. "An Integrated Framework for Energy Pricing inDeveloping Countries," EJ, pp. 1-30.
Parikh, K. S. and J. K. Parikh, 1977. Potential of Biogas Technology,
Laxenburg, Austria: IIASA.
Peterson, F. M. and A. C. Fisher, 1977. "The Exploitation of Renewable and
Non-renewable Natural Resources," EcJ, pp. 681-721.
Samuelson, P. A., 1974. "Economics of Forestry in an Evolving Society,"Presented at Symposium on The Economics of Sustained Yield Forestry,
Seattle, WA: College of Forest Resources, University of Washington.
- 134 -
Sanghi, A. K. and D. Day, 1976. 'A Cost-Benefit Analysis of Biogas Productionin Rural India: Some Policy Issues,' Himeo, St. Louis, MO: WashingtonUniversity.
* Smith, V. L., 1968. "Economics of Production from Natural Resources," AER,pp. 409-31.
Smith, V. L., 1975. "The Primitive Hunter Culture, Pleistocene Extinction,and The Rise of Agriculture," JPE, pp. 727-55.
Tyner, W. E., 1978. Energy Resources and Economic Development in India.Leiden: Martinus Nijhoff.
- 135 -
11.5. Social Benefit Cost Analysis and Energy Projects Summary and Conclusions
Adler, H. A., 1971. Economic Appraisal of Transport Projects: A Manual withCase Studies. Bloomington, IN: Indiana University Press.
* Arrow, K. J. and M. Kurz, 1970. Public Investment, The Rate of Return, andOptimal Fiscal Policy. Baltimore, MD: John Hopkins University Press forthe Twentieth Century Fund.
Bacha, E. and L. Taylor, 1971. "Foreign Exchange Shadow Prices: A CriticalReview of Current Theories," QJE, pp.
Balassa, B., 1976. "The 'Effects Method' of Project Evaluation," OBES,pp. 219-231.
Beyer, J., 1972. An Economic Framework for Project Analysis in India. Mimeo.New Delhi, India: The Ford Foundation.
Beyer, J., 1975. "Estimating the Shadow Price for Foreign Exchange: AnIllustration from India," JDS, pp. 302-315.
Bhagwati, J. N. and T. N. Srinivasan, 1980. "Domestic Resource Costs,Effective Rates of Protection, and Project Analysis in Tariff-DistortedEconomies," QJE, p. 205.
Bhagwati, J. N. and H. Y. Wan, Jr., 1979. "The 'Stationarity' of ShadowPrices and Factors in Project Evaluation, with and without Distortions,"AER, pp. 261-273.
* Phatia, R., 1977. "Economic Appraisal of Biogas Units in India: Frameworkfor Social Benefit Cost Analysis," EPW, pp. 302-315.
Bhatia R. and M. Mehta, 1977. "Tubewell Irrigation in India: An EconomicAnalysis of Technical Alternatives," EPW, pp.
* Bhatia, R. and M. Niamir., 1979. "Renewable Energy Sources: TheCommunity Biogas Plant," mimeo. (draft), (Revised 1980) Cambridge, MA;Harvard University.
Bruno, M., 1972. "Domestic Resource Costs and Effective Protection:Clarification and Synthesis," JPE, pp.
* Dasgupta, A. and S. W. Pearce, 1972. Cost Benefit Analysis: Theory andPractice. London: Maclillan.
Dasgupta, P. S. and J. E. Stiglitz, 1974. "Benefit-Cost Analysis and TradePolicies," JPE, pp. 1-33.
Dattachaudhuri, M. and A. K. Sen, 1970. "An Economic Evaluation of theDurgapur Fertilizer Project," IER, pp.
136 -
* deLucia, R. J. and R. ihatia, 1980. "Economics -f 1en:wzble Energy
Technologies in r.)al Third World: A Ieview." 4imeo. Carbridge, MA:
Meta Systems Inc.
deLucia, R. J. and H. D. Jacoby, 1980. "Sector-wide Analysis and Investment
Program Design," Chapter 10 in daLucia, Jacoby, et al., op. cit.
deLucia, R. J., H. D. Jacoby, et. al., 1980. LDC Enercy Planning: A Study
of Bangladesh, (Manuscript in review; available from Meta Systems Inc).
Eckstein, 0., 1958. Water Resources Develooment: The Economics of Project
Evaluation. Cambridge, MA: Harvard University Press.
Findlay, R. and S. Wellisz, 1976. "Project Evaluation, Shadow Prices, and
Trade Policy," JPE, pp. 543-552.
* Food and Agricultural Organization of the U.N. (FAO), 1979. Economic Analysis
of Forestry Projects. Rome: FAO,
* French, D., 1979. "The Economics of Renewable Energy Systems for Developing
Countries," mimeo. Washington, D.C.: USAID.
Harberger, A. C., 1971. "Three Basic Postulates for Applied WelfareEconomics," JEL, pp. 785-797.
* Harberger, A. C., 1973. Project Evaluation: Collected Papers, Chicago, IL:
Markham.
* Jacoby, H. D. and J. J. Stern, 1980. "Economic Objectives, Parameters, and
Assumptions," Chapter 5 in deLucia, Jacoby, et al., op. cit.
Jenkins, G. P., 1978. "Inflation and Cost Benefit Analysis," HIID Discussion
Paper No. 45. Cambridge, MA: Harvard University.
* Lal, D., 1974. Methods of Proiect Analysis: A Review, Baltimore, MD: Johns
Hopkins Univeroity Press tor the World Bank.
Lamson-Scribner, F. H., Jr., 1977. Industrial Proiect Analysis: Case
Studies. Baltimore, MD: Johns Hopkins University Press for the World
Bank.
Little, I. M. D. and J. A. Mirrlees, 1968. Manual. of Industrial Project
Analysis in Developing Countries, Vol. 2: Social Cost-H-nefit Analysis,
Paris: Development Center, Organization for Econo-mic Cooperaticn andDevelopment.
* Little, I. M. D. and J. A. Mirrlees, 1974. Project Appraisal and Planning for
Developing Countries. New York: Basic Books.
* Marglin, S. A., 1967. Public Investment Criteria. Cambridge, MA: MIT Press.
* Marglin, S. A., 1976. Value and Price in the Labor Surplus Economy. Oxford,U.K.: Clarendon Press.
- 137 -
McGauhey, S.E., 198. "Investment Critcria for Agricultural and Rural
Development Projects: The Measurenent of Their Multiple Economic and
Social Consequences," in Economic ;.nalysis of Forestry Projects:Readings. FA0 Forestry Paper 17, Supplement 2, pp. 1-62. Policy andPlanning Service, Forestry Department. Rome: FAO.
14ishan, E. J., 1976. Cost Benefit Analysis. New York: Praeger.
Xishra, S. N. and J. Beyer, 1976. Cost Benefit Analysis: A Case-Study of theBatnagiri Fisheries Project (India). Delhi: Hindustan Publishing Co.
Montreal Engineering, Snamprogetti, Meta Systems Inc. and C. Lotti and
Associates, 1976. Bangladesh Energy Study. For the Government of thePeople's Republic of Bangladesh, administered by the Asian Development
Bank under United Nations Development Programme. Cambridge, MA: Meta
Systems Inc.
" Overseas Development Administration (U.K.), 1972. A Guide to Project
Appraisal in Developing Countries. London, U.K.
" Parikh, K. S. and J. K. Parikh, 1977. Potential of Biogas Technology,Laxenburg, Austria: IIASA.
" Roemer, M. and J. J. Stern, 1975. The Appraisal of Development Projects: APractical Guide to Project Analysis with Case Studies and Solutions,Praeger, New York.
Sanghi, A. K. and M. Blase, 1976. "An Economic Analysis of Energy Requirementsof Alternative Farming Systems for a Small Farmer: Some Public PolicyIssues," Indian Journal of Agricultural Economics, pp.
" Sanghi, A. K. and D. Day, 1976. 'A Cost-Benefit Analysis of Biogas Productionin Fural India: Some Policy Issues,' Mimeo, St. Louis, MO: WashingtonUniversity.
Sen, A. K., 1968. Choice of Technicues: An Aspect of the Theory of PlannedEconomic Development, Oxford: Oxford University Press.
Ben, A. K., 1975. Enloyment, Technology and Development, Oxford, U.K.:Clarendon Press.
Siddayao, C. M., 1980. "Petroleum and Coal Pricing Policies," Mimeo.Honolulu: Prepared for the Asian Development Bank Regional Energy Surveyby the East West Center.
Sjaastad, L. A. and D. L. Wisecarver, 1977. "The Social Cost of Public
Finance," JPE, pp.
Squire, L. and H. Van der Tak, 1975. Economic Analysis of Projects,Baltimore, MD: Johns Hopkins University Press ior The World Bank.
Srinivasan, T. N. and J. N. Bhagwati, 1978. "Shadow Prices for ProjectSelection in the Presence of Distortions: Effective Rates of Protectionand Domestic Resource Costs," JPE, pp. 97-116.
United Nations Industrial Development Organization (UNIDO), 1972. Guidelinesfor Project Ev;iluatior.. New York, NY: United Nations.
- 138 -
United National Industrial Development Organization (UNIDO), 1978. Guide toPractical Project Appraisal: Social Benefit - Cost Analysis in DevelopinZCountries. Now York: United Nations.
United States Agency for International Development (USAID), 1974. Appraisalfor Development. Washington, D.C.
Warr, P., 1977. "On the Shadow Pricing of Traded Commodities," JPE, pp.865-872.
Weckstein, R. S., 1979. "Shadow Prices and Project Evaluation in LessDeveloped Countries," EDCC, pp. 474-494.
World Bank, The, 1977a (May). Economic and Social Analysis of Projects: ACase Study of the Ivory Coast. Staff Working Paper No. 253, Washington,D.C.
World Bank, The, 1979f. Application of Shadow Pricing to Country EcnnomicAnalysis with an Illustration from Pakistan. Staff Working Paper No.330. Washington, D.C.
World Bank, The, 1979g. Estimating Shadow Price for Colombia in an Input-Outout Table Framework. Staff Working Paper No. 357. Washington, D.C.
World Bank, The, 1980c. Shadow Prices for Project Appraisal in Turkey. StaffWorking Paper No. 392. Washingon, D.C.
- 139 -
BIBLIOGRAPHY
for
Chapter III. Analysis of International Energy Markets
- 140 -
iII.1. International/Regional Energy Supply and Demand
Adelman, M. A., 1973. "American Import Policy and the World Oil Market," EP,
pp. 91-99.
* Adelman, M. A. and S. Friis, 1974. "Changing Monopolies and European Oil
Supplies," EP, pp. 275-292.
Adelman, M. A. and H. D. Jacoby, 1979b. "Oil Prices, Gaps, and Economic
Growth," MIT-EL-79-008WP. Cambridge, MA: MIT Energy Laboratory.
Adelman, M. A. and G. L. Ward, 1980. "Worldwide Production Costs of Oil and
Gas," MIT-EL-79-058WP. Cambridge, MA: MIT Energy Laboratory.
Ager-Hanssen, H., 1980. "The Exploration of Norwegian Oil and Gas," EP, pp.
153-164.
Agman, T., D. Lessard and J. L. Paddock, 1979. "Financial Markets and the
Adjustment to Higher Oil Prices." in Pindyck, ed., 1979a, pp. 291-310.
Allen, E. L., J. A. Edmonds and R. E. Kuenne, 1979. A Comparative Analysis of
Global Energy Models. Washington, DC: IEA/ORAU.
Basile, P. S., 1980. "Global Energy Demand in the Very Long Term," in
Dunkerley, ed., pp. 101-112.
Basile, P. S., ed., 1977. Energy Demand Studies: Major Consuming Countries.
Cambridge, MA: MIT Press.
Beaujean, J. M., J. P. Charpentier and N. Nakicenovic, 1977. "Global and
International Energy Models: A Survey," ARE, pp. 153-170
Ben-Shahar, H., 1976. Oil: Prices and Capital. Lexington, MA: Lexington
Books.
Blitzer, C. R., A. Meeraus and A. Stoutjesdijk, 1975. "A Dynamic Model ofOPEC Trade and Production, Jvz, pp. 319-335.
Brodman, J. R. and R. E. Hamilton, 1979. A Comparison of Energy Projectionsto 1985. Paris: IEA/OECD.
Cato, D. B. and E. Reiser, 1976. "International Energy Demand Model:Twenty OECD Country Models," in W. G. Vogt and M. H. ickle, eds.,Modeling and Simulations. Pittsburgh: Instrument Society of America.
Charpentier, J. P., 1974. "A Review of Energy Models," RR-74-10. Laxenburg,Austria: IIASA.
Charpentier, J. P., 1975. "Overview on Techniques and Models used in the
Energy Field," Research Meorandum*RM-75-8. Laxenburg, Austria: IIASA.
- 141 -
Chesshire, J. M. and K. L. R. Pavitt, 1978. 'Global Liergy Profiles to
2050," in C. Freeman and M. Jahoda, eds., World Futures: The Great
Debate. London: Martin Robinson.
Danskin, H., 1979. "SARU's Energy-Demand Model," Fu, pp.
Deam, R. J., M. A. Laughton, J. G. Hale, J. R. Isaac, J. Leather, F. M.
O'Carroll and P. C. Ward, 1973. "World Energy Modelling: The Development
of Western Europe Oil Prices," EP, pp. 21-34.
* Deam, R. J., J. G. Hale, J. R. Isaac, J. Leather, F. J. O'Carroll, P. V. Slee,
P. C. Ward and P. L. Watson, 1974. "World Energy Modelling," in EnergyModelling, papers presented at NSF and Energy Research Unit Workshop,
Queen Mary College, London. London: IPC. Science and Technology Press.
Dunkerley, J., ed., 1980. International Energy Strategies: Proceedings ofthe 1979 IAEE/RFF Conference. Cambridge, MA: Oelgeschlager, Gunn & Hain.
Eckbo, P. L., 1976. The Future of World Oil. Cambridge, MA: Ballinger.
Eden, R., 1979. "Methodology for Studying World Energy Demand," in OECD/IEA,pp. 315-324.
Eden, R., et al, 1977. Report on Energy Demand 1975-2000. Cambridge, U.K:Energy Research Group, Cavendish Laboratory, University of Cambridge.
Energy Modeling Forum (EMF), 1980b. "World Oil Study Design," Working Paper
6.1. Stanford, CA: Stanford University.
Ezzati, A., 1975. "FEA World Energy Model," in International EnergyAnalysis, Proceedings of ERDA/NSF Seminar on International EnergyAnalysis. Washington, D.C.
Ezzati, A., 1976a. "Future OPEC Price and Production Strategies as Affectedby its Capacity to Absorb Oil Revenues," EER, pp. 107-38.
Ezzati, A., 1976b. "Analysis of World Equilibrium Prices, Supply, Demand,Imports, and Exports of Crude Oil and Petroleum Products," JE&D, pp.306-25.
Fischer, D., D. Gately and J. F. Kyle, 1975. "The Prospects for OPEC: ACritical Survey of Models of the World Oil Market," JDE, pp. 363-386.
Gately, D., 1979. "The Prospects for OPEC: Five Years After 1973/1974,"EER, pp. 369-379.
Gerholm, T. R., 1980. "Long Range Energy Demand: Problems and Perspectives,"Position Paper for Round-Table discussion No. 6 - Energy Demand SupplyConservation and Balance. 11th World Energy Conference, Munich.
* Grenon, M., 1977. "Global Energy Resources," ARE, pp. 67-94.
Grenon, M., ed., 1976. Report of the IIASA Conference on Energy Resources.CP-76-4. Laxenburg, Austria: IIASA.
- 142 -
Grenon, M., ed., 1979a. Future Coal Supply for the World Energy Balance.
Third IIASA Conference on Energy Resources; IIASA Proceedings Series.
Oxford: Pergamon Press.
Grenon, M., ed., 1979b. Methods and Models for Assessing Energy Resources.
Laxenburg, Austria: IIASA.
Hafele, W., 1980. "IIASA's World Regional Energy Modelling," Fu, pp. 18-
Hafele, W., ed., 1981. Energy in a Finite World. Cambridge, MA: Ballinger.
Hafele, W. and W. Sassin, 1977. "The Global Energy System," ARE, pp. 1-30.
Hamilton, R. E., 1977. -World Energy Outlook to 1985," in Nordhaus, ed., pp.287-307.
Hammoudeh, S., 1979. "The Future Oil Price Behavior of OPEC and Saudi Arabia -
A Survey of Optimization Models," EE, pp. 156-176.
Houthakker, H. S., 1976b. The Price of Oil, Washington, DC: American
Enterprise Institute for Public Policy Research.
Houthakker, H. S. and M. Kennedy, 1978. "Long Range Energy Prospects," JE&D,
pp. 1-28.
Houthakker, H. S. and M. Kennedy, n.d. "A Long-Run Model of World Energy
Demands, Supplies, and Prices," Mimeo. Cambridge, MA: Harvard
University.
Hubbert, M. K., 1973. "Survey of World Energy Resources," Canadian Mining
and Metallurgical Bulletin, pp. 37-54.
Hughes, B. B. and M. D. Mesarovic, 1978. "Analysis of the WAES Scenarios
Using the World Integrated Model," EP, pp.
Huther, F. W., 1974. "Modelling of Energy Supply and Demand," in Energy
Modelling, op. cit.
Ikuta, T., 1979. "Stable Growth and Energy Strategy: Two Approaches," in
OECD/IEA, op. cit., pp. 189-216.
International Institute for Applied Systems Analysis (IIASA), 1979.
IIASA/UNITAR International Conference on Future Supply of
Nature-Made Petroleum and Gas. Laxenburg, Austria.
Ion, D. C., 1975. Availabililty of World Energy Resources, London: Graham
Trotman.
Jacmart, M. C., M. Arditi and I. Arditi, 1979. "The World Distribution of
Commercial Energy Consumption," EP, pp. 199-207.
- 143 -
Jorgenson, D. W., ed., 1976. Econometric Studies of U.S. Energy Policy,
Amsterdam, North Holland.
Kalymon, B. A., 1975. "Economic Incentives in OPEC Oil Pricing Policy," JDE,
pp. 337-362.
* Kennedy, M., 1974. "An Economic Model of the World Oil Market," BJE, pp.
540-77.
* Kennedy, M., 1976. "A World Oil Model," Ch. 3 in Jorgenson, ed.,
pp. 95-176.
Kouris, G., 1976. "Determinants of Energy Demand in the EEC Area," EP, pp.
343-355.
Lambertini, A., 1976. 'Energy and Petroleum in Non-OPEC Developing Countries,'
IBRD Staff Working Paper 289. Washington, D.C.; The World Bank.
* Martin, W. F., ed., 1977. Energy Supply to the Year 2010; Global and National
Studies. Cambridge, MA: MIT Press.
Nordhaus, W. D., ed., 1977. "The Demand for Energy: An International
Perspective," in Nordhaus, ed., pp. 239-285.
Organization for Economic Cooperation and Development (OECD), 1977. World
Energy Outlook, Paris.
Organization for Economic Cooperation and Development/International Energy
Agency (OECD/IEA), 1979a. Workshop on Energy Supply and Demand. Paris.
Parikh, J. K. and K. S. Parikh, 1980. "Simulation of Macroeconomic Scenariosto Assess the Energy Demand for India (SIMA)," IIASA Reports, pp. 215-262.
Parker, A., 1975. 'World Energy Resources: A Survey,' EP, pp. 58-66.
Pindyck, R. S., ed., 1979a. Advances in the Economics of Energy and
Resources, Vol. I: The Structure of Energy Markets. Greenwich, CT: JAI
Press.
* Reilly, J., 1980. Financing Development and Oil Imports in the Developing
Nations, Research Memo 80-14(M). Oak Ridge, TN: IEA/ORAU.
* Reilly, J. and R. Dougher, 1980. (Draft). Non-OPEC Free World Developing
Countries: Energy Supply and Demand in 2000, Oak Ridge, TN: IEA/ORAU.
Sassin, W., 1980. "Urbanization and the Global Energy Problem," in P.Laconte, J. Gibson and A. Rapoport, ed., Factors Influencing UrbanDesign: A Systems Approach, Sijthoff and Noordhoff InternationalPublishers.
- 144 -
* Ulph, A. M., 1980. 'World Energy Models - A Survey and Critique," EE,pp. 48-59.
United Nations, 1979. World Energy Supplies. New York, NY: United Nations.
United Nations Conference in Trade and Development (UNCTAD), 1978. Energy, -Supplies for Developing Countries: Issues in the Transfer and Developmentof Technology. Geneva.
United States Central Intelligence Agency (U.S. CIA), 1977. The InternationalEnergy Situation: outlook to 1985. Washington, D.C.
United States Federal Energy Administration (FEA), 1974. Project IndependenceReport. Washington, D.C: U.S. GPO.
" Wolf, C., Jr., D. A. Relles and J. Navarro, 1980. The Demand for Oil andEnergy in Developing Countries. R-2488-DOE. Santa Monica, CA: RandCorporation.
" Workshop on Alternative Energy Strategies (WAES), 1977. Energy: GlobalProspects 1985-2000. New York: McGraw Hill.
World Bank, The, 1978. Petroleum and Gas in Non-OPEC Developing Countries:1976-1990. Staff Working Paper No. 289, Washington, D.C.
World Energy Conference, 1978a. World Energy Resources: 1985-2000. NewYork: IPC Science and Technology Press.
* World Energy Conference, 1978b. World Energy Demand. Guildford, Surrey, UK:IPC Science and Technology Press.
World Energy Conference, 1978c. Oil and Gas Resources. Guildford, Surrey,UK: IPC Science and Technology Press.
- 145 -
III.2. OPEC Supply and Price Behavior
Adelman, M. A., 1972. The World Petroleum Market. Baltimore: The Johns
Hopkins University Press for Resources for the Future.
* Adelman, M. A., 1978. "Constraints on the World Oil Monopoly Price," R&E,
pp. 3-19.
Adelman, M. A., 1980b. "Supply Strategies for the Future." Mimeo.Cambridge, MA: MIT Department of Economics.
Adelman, M. A., 1980c. "The Clumsy Cartel," EJ, pp. 43-53.
* Adelman, M. A. and H. D. Jacoby, 1979a. "Alternative Methods of Oil SupplyForecasting," in Pindyck, ed., 1979b, pp. 1-38.
Adelman, M. A. and J. L. Paddock, 1980. "An Aggregate Model of PetroleumProduction Capacity and Supply Forecasting," MIT-EL-79-005WP (Revised).
Cambridge, MA: MIT Energy Laboratory.
Al-Chalabi, F. and A. Al-Janabi, 1978. "Optimum Production and PricingPolicies," JE&D, pp. 229-258.
Al-Janabi, A., 1978. "The Determinants of Long-Term Demand for OPEC Oil,"JE&D, pp. 347-365.
* Ben-Shahar, H., 1976. Oil: Prices and Capital. Lexington, MA: Lexington
Books.
Bird, C. and M. W. Sampson, 1976. "A Game-Theoretic Model of OPEC, Oil
Consumers, and Oil Companies Emphasizing Coalition Formations," in J.
Gillespie and D. Zinnes, eds., Mathematical Models in International
Relations, pp. New York: Praeger.
Blair, J. M, 1976. The Control of Oil. New York: Pantheon Books.
* Blitzer, C. R., A.,Meeraus and A. Stoutjesdijk, 1975. "A Dynamic Model of
OPEC Trade and Production," JDE, pp. 319-335.
Bobrow, D. B. and R. T. Kurdle, 1976. "Theory, Policy and Resource
Cartels: The Case of OPEC," JCR, pp. 3-56.
* Bohi, D. and M. Russell, 1975. Limiting Oil Imports: An Economic History and
Analysis, Baltimore, MD: John Hopkins University Press for Resources for
the Future.
Calvo, G. and R. Findlay, 1978. "Optimal Acquisition of Foreign Capital
Through Investment of Oil Export Revenue," JIE, pp.
- 146 -
Charles River Associates, 1976. Commodity Supply Restrictions Study: PolicyImplications of Producer Country Supply Restriction - The World EnergyMarket. Springfield, VA: NTIS.
Choucri, N., 1979. "Analytical Specifications of The World Petroleum Market:A Review and Comparison of Twelve Models," JCR, pp. 340-372.
Choucri, N., 1980. "The International Petroleum Exchange Model: ReferenceResults and Validation," Fu, pp. 201-
Choucri, N., 1981. International Energy Futures: PetroleumPrices, Power and Payments, Cambridge, MA: MIT Press.
Choucri, N. with V. Ferraro, 1976. International Politics of EnergyInterdependence: The Case of Petroleum. Lexington, MA: Lexington Books.
* Cremer, J. and M. L. Weitzman, 1976. "OPEC and the Monopoly Price of WorldOil," EER, pp. 155-164.
Dailami, M., 1979. "Inflation, Dollar Depreciation and OPEC's PurchasingPower," JE&D, pp. -
Dailami, M., 1980. "Financial Influences on the Behavior of Oil Exporters,"in Dunkerley, ed., pp. 243-262.
Danielson, A. L., 1976. "Cartel Rivalry and the World Price of Oil," SEJ,pp. 407-15.
Danielson, A. L. and E. B. Selby, Jr., 1980. "World Oil Price Increases:Sources and Solutions," EJ, pp. 59-74.
Dunkerley, J., ed., 1980. International Energy Strategies: Proceedings ofthe 1979 IAEE/RFF Conference. Cambridge, MA: oelgeschlager, Gunn and Hain.
" Eckbo, P. L., 1976. The Future of World Oil. Cambridge, MA: Ballinger.
" Ezzati, A., 1976a. "Future OPEC Price and Production Strategies as Affectedby its Capacity to Absorb Oil Revenues," EER, pp. 107-38.
" Ezzati, A., 1976b. "Analysis of World Equilibrium Prices, Supply, Demand,Imports, and Exports of Crude Oil and Petroleum Products," JE&D, pp.306-25.
" Ezzati, A., 1978. World Energy Markets and OPEC Stability. Lexington, MA:Lexington Books.
" Fischer, D., D. Gately and J. F. Kyle, 1975. *The Prospects for OPEC: ACritical Survey of Models of the World Oil Market,* JDE, pp. 363-386.
Fixler, L. D. and R. L. Ferrar, 1975. "On Pricing Policy Options from theProducers' Point of View," EP, pp. 136-143.
Frank, H. J., 1966. Crude Oil Prices in the Middle East: A Study inOligopolistic Price Behavior. New York, NY: Praeger.
- 147 -
Gately, D., 1979. "The Prospects for OPEC: Five Years After 1973/1974,"
EER, pp. 369-379.
Gately, D., 1980. "Modeling OPEC Behavior," in Dunkerley, ed., pp. 237-242.
Gately, D. and J. F. Kyle (in association with D. Fischer), 1977."Strategies for OPEC's Pricing Decisions," EER, pp. 209-230.
Ghadar, F., 1977. Evolution of OPEC Strategy. Lexington, MA: LexingtonBooks.
Hammoudeh, S., 1979. "The Future Oil Price Behavior of OPEC and Saudi Arabia -
A Survey of Optimization Models," EE, pp. 156-176.
Hnyilicza, E. and R. S. Pindyck, 1976. "Pricing Policies for a Two-Part
Cartel: The Case of OPEC," EER, pp. 135-154.
Jacoby, N. H., 1973. Multinational Oil. New York: MacMillan.
Kalymon, B. A., 1975. "Economic Incentives in OPEC Oil Pricing Policy," JDE,pp. 337-362.
Koreisha, S., 1980. "The Limitations of Energy Policy Models," EE, pp. 96-110.
Kosobud, R. F. and H. H. Stokes, 1980a. "OPEC Short-Run Market Share
Behavior: Implications, Theories, and Facts," EE, pp. 66-80.
Kosobud, R. F. and H. H. Stokes, 1980b. "Simulation of World Oil Market
Shocks: A Markov Analysis of OPEC and Consumer Behavior," EJ (April) pp.
55-84.
Marshalla, R. A., 1977. "Intertemporal Efficiency and the World Price of Oil
- An Empirical Model," AESM, pp. 203-226.
Marshalla, R. A., 1979. An Analysis of Cartelized Market Structures for
Non-Renewable Resources. New York: Garland Publishing.
Mead, W. J., 1979. "An Economic Analysis of Crude Oil Price Behavior," JE&D,
pp*
kikesell, R. F., 1971. Foreign Investment in the Petroleum and Mineral
Industries: Case Studies of Investor-Host Country Relations. Baltimore,
MD: Johns Hopkins University Press for Resources for the Future.
Penrose, E. P., 1968. The Large International Firm in Developing Countries:
The International Petroleum Industry. London: George Allen and Unwin.
Pindyck, R. S., 1976. "Gains to Producers from the Cartelization of Exhaust-
ible Resources," MIT-EL-76-102WP. Cambridge, MA: MIT Energy Laboratory.
Pindyck, R. S., 1978b. "Gains to Producers from the Cartelization of
Exhaustible Resources," RE&S, pp.
- 148 -
Pindyck, R. S., 1979b. "Some Long Term Problems in OPEC Oil Pricing," JE&D,
pp.
Pindyck, R. S., ed., 1979b. Advances in the Economics of Energy andResources, Vol. II: The Production and Pricing of Energy Resources.Greenwich, CT: JAI Press.
Salant, S. W., 1976. "Exhaustible Resources and Industrial Structures: ANash-Cournot Approach to World Oil Market," JPE, pp. 1079-1093.
Samii, M. V., 1979. "Economic Growth and Optimal Rate of Oil Extraction,"OPEC Review, pp. 16-26.
Schmalensee, R., 1976. "Resource Exploitation Theory and the Behavior of the
Oil Cartel," EER, pp. 257-279.
* Tourk, X. A., 1977. "The OPEC Cartel: A Revival of 'Dominant Firm' Theory,"
JE&D, pp. 321-328.
Ulph, A. m., 1980. 'World Energy Models - A Survey and Critique,' EE,
pp. 48-59.
Willett, T. D., 1979. "Structure of OPEC and the outlook for International
Oil Prices," WE, pp. 51-
- 149 -
BIBLIOGRAPHY
for
qbapter IV. Aggregate Energy/Output Relationships
- 150 -
IV.1. Energy Consumption and Economic Growth
Adams, F. G. and P. Miovic, 1968. "On Relative Fuel Efficiency and the
Output Elasticity of Energy Consumption in Western Europe." JInE, pp.
41-56.
Adelman, M. A., 1980a. "Energy-Income Coefficients and Ratios: Their Use and
Abuse," EE, pp. 2-4
Allen, E. L., 1979. Energy and Economic Growth in the United States.
Cambridge, MA: MIT Press.
Allen, E. L. and J. A. Edmonds, 1979. "Exogenous (Non-price) FactorsInfluencing Energy/GNP Relationships in Leading OECD Countries,"
Washington, DC: IEA/ORAU.
Askin, A. B., ed., 1978. How Energy Affects the Economy. Lexington, MA:
Lexington Books.
Bakke, D. W., 1980. "Energy in Non-OPEC Developing Countries." Ch. 11 in
Landsberg, ed., op. cit., pp. 349-392.
Baron, D. P. and R. R. DeBondt, 1979. "Fuel Adjustment Mechanisms and
Economic Efficiency." JInE, pp. 243-
Berndt, E. R., 1976. "Reconciling Alternative Estimates of the Elasticity ofSubstitution," RE&S, pp. 59-67.
Berndt, E. R., 1978a. "Aggregate Energy, Efficiency, and ProductivityMeasurement," ARE, pp.
Berndt, E. R., 1979. "Engineering and Econometric Approaches to Industrial
Energy Conservation and Capital Formation: A Reconciliation," in
OECD/IEA, pp. 278-314.
Berndt, E. R. and D. 0. Wood, 1974. "An Economic Interpretation of theEnergy-GNP Ratio," in Macrakis, ed., pp. 21-30.
Berndt, E. R. and D. 0. Wood, 1975. "Technology, Prices, and the DerivedDemand for Energy," RESS, pp. 259-268.
Berndt, E. R. and D. 0. Wood, 1977. "Consistent Projections of Energy Demandand Aggreaate Economic Growth: A Review of Issues and EmpiricalStudies," MIT-EL 77-024WP. Cambridge, MA: MIT Energy Laboratory.
Berndt, E. R. and D. 0. Wood, 1979. "Engineering and Econometric
Interpretations of Energy-Capital Complementarity," AER, pp. 342-354.
Berry, R. S., P. Salamon and G. M. Heal, 1978. "On a Relation Between
Economic and Thermodynamic Optima," R&E, pp. 125-137.
- 151 -
* Blitzer, C. R., 1980. "Energy and Development: An Ovezview of Selected
Issues," Mimeo. Washington, DC.
* Bossanyi, E. and J. Stanislaw, 1979. 'Fuel Substitution and Price Response for
UK Industry,' EE, pp. 93-100.
* Brookes, L. G, 1972. "More on the output Elasticity of Energy Consumption,"
JInE. pp. 83-92.
Bullard, C. and R. Herendeen, 1975. "Energy Cost of Goods and Services,"
ES&P, pp. 268-278.
Bullard, C., B. Hunan, and R. Herendeen, 1975. "Energy Flow through the
United States Economy." Urbana: University of Illinois Center for
Advanced Computation.
Cato, D. B., A. D. Sandeval and F. E. Hopkins, 1980. Income and Price
Effects on Petroleum Consumotion: An International Comoarison.
Washington, D.C: Energy Information Administration/Department of Energy.
Chapman, P. F., 1974. "Energy Costs: A Review of Methods," EP, pp. 91-103.
Chapman, P. F., 1975. "The Energy Costs of Materials," EP, pp. 47-57.
Chapman, P. F., G. Leach and M. Slesser, 1974. "The Energy Costs of Fuels,"
EP, pp. 231-243.
Choe, B. J., 1978. "Energy Demand Prospects in Non-OPEC Developing Countries,"
Mimeo, Washington, D.C.* The World Bank.
* Choe, B. J., 1979. "Energy Demand Prospects in Non-OPEC Developing
Countries," in OECD/IEA, pp. 422-440.
* Choe, B. J., 1980. "Energy Demand in Developing Countries," in Dunkerley,ed. pp.
* Christensen, L. R. and W. H. Greene, 1976. "Economies of Scale in U.S.
Electric Power Generation," JPE, pp. 655-676.
Connolly, T. J., G. B. Dantzig and S. C. Parikh, 1979. "The Stanford PILOT
Energy/Economic Model," in Pindyck, ed. 1979a, pp. 77-104.
Corden, W. M., 1977. "Framework fox Analyzing the Implications of the Rise in
Oil Prices," in Rybczynski, Id., pp. 12-24.
Cornia, G. A. and E. Mayorga-Alba, 1980. "The Energy Constraint in the
1980's and the Scope for Import Substitution in Western Europe," JPM, pp.205-228.
* Darmstadter, J., J. Dunkerley, and J. Alterman, 1977. How Industrial
Societies Use Energy: A Comparative Analysis, Baltimore, KD: John
Hopkins University Press for Hesources for the Future.
Darmstadter, J., P. Teitelbaum, and J. Pollach, 1976. Energy in the World
Economy, Baltimore, MD: John Hopkins University Press for ReGources for
the Future.
- 152 -
* Desai, A. V., 1979. "Development and Energy Consumption," OBE&S, pp.
Dunkerley, J., 1980a. Trends in Energy Use in Industrial Societies: AnOverview. Washington, D.C.: RFF.
Dunkerley, J., 19 80c. "Energy/Output Relationships: Implications for EnergyConservation," in Dunkerley, ed., pp. 71-78.
Dunkerley, J., ed., 1978. International Comparisons of Energy Consumption:Proceedings of a RFF/EPRI Workshop. Baltimore, MD: Johns HopkinsUniversity Press for Resources for the Future (RFF).
Dunkerley, J., ed., 1980. International Energy Strategies: Proceedings ofthe 1979 IAEE/RFF Conference. Cambridge, MA: Oelgeschlager, Gunn and Hain.
" Dunkerley, J. and J. E. Jankowski, Jr., 1980. "The Real Price of ImportedOil," EJ, pp. 113-118.
" Dunkerley, J. and G. Knapp with S. Glatt, 1980. Factors Affecting theComposition of Energy Supplies in Developing Countries. Working Paper forARDEN Project. Washington, D.C.: Resources for the Future.
" Dunkerley, J., with J. E. Jankowski, Jr., M. Gillis, R. K. Pachauri, P.Ehrlich, et al., and R. Kahn, 1980. Assessment of Energy DemandProjections for Selected Developing Countries. Mimeo., Report preparedfor Long Range Assessment and Research Division, U.S. Dept. of StateWashington, D.C.: Resources for the Future.
" Edwards, R. and A. Parikh, 1978. "Intensities of Energy Usage: AnInternational and Intertemporal Comparison," EP, pp.
* Energy Modeling Forum (EMF), 1980a. Aggregate Elasticity of Energy Demand.Vol. 1. Report 4. Stanford, CA- Stanford University.
Ezzati, A. and F. Pinto, 1979. "An Analytic Framework to Assess the Energyoutlook in Developing Countries," in OECD/IEA, pp. 100-108.
Field, B. C. and C. Grebenstein, 1980. "Capital-Energy Substitution in U.S.Manufacturing," RE&S, pp. 207-211
Fishelson, G. and T. V. Long, II, 1978. "An International Comparison ofEnergy and Materials Use in the Iron and Steel Industry." in J. Dunkerley,ed., pp. 116-150.
Fuss, M. A., 1977. "The Demand for Energy in Canadian Manufacturing: AnExample of the Estimation of Production Structures with Many Inputs," JE,pp. 89-116.
Gillis, S. M., 1980. Energy Demand in Indonesia: Projections and Policies.Development Discussion Paper No. 92, Harvard Institute for InternationalDevelopment. Cambridge, MA: Harvard University.
Gillis, S. M., et al., 1980. Tax and Investment Policies for Hard Minerals:Public and Multinational Enterprise in Indonesia. Cambridge, MA:Ballinger Press.
Government of India, 1979. Interim Report of the Working Group on EnergyPolicy. New Delhi, India.
- 153 -
Griffin, J. M. and P. Gregory, 1976. "An Intercountry Translog Model of
Energy Substitution Responses," AER, pp.
Gunning, J. W., M. Osterritch and J. Waelbroeck, 1976. "The Price ofEnergy and Potential Growth of Developed Countries: An Attempt atQuantification," EER, pp. 35-62.
Halvorsen, R., 1976b. "Energy Substitution in U.S. Manufacturing,"Unpublished manuscript. (Published 1977, RE&S, pp. 381-388).
Halvorsen, R. and J. Ford, 1979. "Substitution Among Energy, Capital, andLabor Inputs in U.S. Manufacturing," in Pindyck, ed., pp. 51-76.
Hawkins, R. G., 1975. "A Vintage Model of the Demand for Energy andEmployment in Australian Manufacturing," Paper presented to the FifthConference of Economists, August 25-29. Brisbane, Australia. Cited inBerndt and Wood (1977).
Herendeen, R. A. and J. Tanaka, 1976. "Energy Cost of Living," EN, pp.
Hitch, C. J., ed., Modeling Energy - Economy Interactions: Five Approaches.Baltimore: Johns Hopkins University Press for Resources for the Future.
Hnyilicza, E., 1976. Optimal Economic Growth and Energy Policy, Unpublisheddoctoral dissertation, Cambridge, MA: MIT.
Hoffman, L., 1977. "Energy Demand in Developing Countries: An Outline forResearch," Mimeo. Commodities and Export Projections Division.Washington, DC: The World Bank.
Hoffman, L., 1978. "Determinants of Energy Demand in Developing Countries,"Mimeo. Washington, D.C.: The World Bank.
Hoffman, L., 1979. "Energy Demand in Developing Countries: Approaches toEstimation and Projections," in OECD/IEA, 1979, pp. 109-118.
Hogan, W. W., 1978. "Energy and Economic Growth," EMF Occasional Paper 3.1Stanford, CA: Stanford University.
Hogan, W. W., 1979a. "Capital-Energy Complementarity in AggregateEnergy-Economic Analysis." E&EPC Discussion Paper E-79-03. Cambridge,MA: Harvard University.
Hudson, E. A. and D. W. Jorgenson, 1974a. "Tax Policy and Energy Use," inCommittee on Finance, U.S. Senate, Fiscal Policy and the Energy Crisis,Washington, DC: Ninety-third Congress, First and Second Session, U.S.
GPO.
Hudson, E. A. and D.*W. Jorgenson, 1974b. "U. S. Energy Policy and Economic
Growth: 1975-2000," BJE, pp. 461-514.
Humphrey, D. B. and J. R. Moroney, 1975. "Substitution among Capital, Labor,
and Natural Resource Products in American Manufacturing," JPE, pp.
Humphrey, W. S. and J. Stanislaw, 1979. "Economic Growth and EnergyConsumption in the UK, 1700-1975,"- EP, pp. 29-42.
- 154 -
International Federation of Institutes for Advanced Study (IFIAS), 1975.
"Energy Analysis and Economics," Workshop Feport, R&E, pp. 151-204.
* Kaushik, S. K. and R. Bhatia, 1980. "Energy in Twenty Oil-Importing
Countries," (Draft), Paper presetned at Atlantic Economic Conference,
Boston, MA.
* Klein, L. R., 1974. "Supply Constraints in Demand Oriented Systems: An
Interpretation of the Oil Crisis," ZN-JE, pp. 45-56.
Koopmans, T. C., 1974. "Ways of Looking at Future Economic Growth,
Resource and Energy Use," in Macrakis, ed., pp. 3-15.
Kraft, J. and A. Kraft, 1978. "On the Relationship between Energy abd GNP,"
JE&D, pp. 401-440.
Landsberg, H. H., ed., 1980. Selected Studies on Energy: Background Papers
for "Energy: The Next Twenty Years," Cambridge, MA: Ballinger.
Leigh, J. G., J. V. Strasser and R. K. Trehan, 1980. Energy and Development:
Extended Analysis and Implications. McLean, VA: MITRE Corporation.
Macrakis, M. S., ed., 1974. Energy Demand, Conservation, and InstitutionalProblems, Cambridge, MA: MIT Press.
Magnus, J. R., 1978. "Substitution Between Energy and Non-energy Inputs in
the Netherlands, 1950-74," (forthcoming in InER), Amsterdam: Institute
of Actuarial Sciences and Econometrics.
Manne, A. S., with S. Kim and T. F. Wilson, 1980. "A Three-Region model of
Energy, International Trade and Economic Growth," Stanford, CA,
Department of Operations Research, Stanford University.
MITRE Corporation, 1980a. Energy and Development in Central America. Volume
I: Regional Assessment. MTR-80W6-01. McLean, VA: MITRE Corporation.
MITRE Corporation, 1980b. Energy and Development in Central America. Volume
II Country Assessments. MTR- 80W6-02. McLean, VA: MITRE Corporation.
Mork, K. A., 1978. "The Aggregate Demand for Primary Energy in the Short and
Long Run for the U.S., 1949-1975," 1IT-EL-78-007WP, Cambridge, MA: MITEnergy Laboratory.
Mork, K. Ae and R. E. Hall, 1980a. "Energy Prices and the U.S. Economy in1979-81," EJ, pp. 41-53.
Mork, K. A. and R. E. Hall, 1980b. "Energy Prices, Inflation and Recession,1974-1975," EJ, pp. 31-63.
Moroney, J. R., ed., 1980. Advances in the Economics of Energy and Resources,
Vol. III: Economic Aspects of New Technology. Greenwich, CT: JAI Press.
* Moroney, J. R. and A. Toevs, 1977. "Factors Costs and Factor Use: AnAnalysis of Labor, Capital, and Natural Resources Inputs,- SEJ, pp.222-239.
- 155 -
* Moroney, J. R and A. Toevs, 1979. "Input Prices, Substitution, and Product
Inflation," in Pindyck, ed., 1979a, op. cit., pp. 27-50.
* Mubayi, V. and J. Lee, 1975. "A Preliminary Analysis of Energy Supply and
Consumption in Indonesia," Upton, NY: BNL.
* Mukherjee, S. K., 1977. 'Energy Demand Forecasting: A Review,' Public
Utilities Notes No. PUN 26. Energy, Water and TelecommunicationsDepartment. Washington, D.C.: The World Bank.
Nordhaus, W. D., ed., 1977. International Studies of the Demand for Energy.New York: North-Holland.
Organization for Economic Cooperation and Development/International EnergyAgency (OECD/IEA), 1979a. Workshop on Energy Supply and Demand. Paris.
* Parikh, J. K., 1978. "Energy and Development," Energy, Water and Telecommuni-
cations Deparment, Public Utilities Notes, PUN 43. Washington, D.C.: TheWorld Bank.
Parikh, J. K. and K. S. Parikh, 1980. "Simulation of Macroeconomic Scenarios
to Assess the Energy Demand for India (SIMA)," IIASA Reports, pp. 215-262.
Parikh, K. S., 1977. "Projecting and Planning India's Fuel Requirement," Ch.
12 in Nordhaus, ed., op. cit., pp. 213-236.
* Parikh; S. C. and M. H. Rothkopf, 1980, "Long Run Elasticity of U.S. EnergyDemand," EE, pp. 31-37.
Percebois, J., 1979. "Is the Concept of Energy Intensity Meaningful?," EE,- pp. 148-155.
Pindyck, R. S., 1980b. "Energy Price Increases and MacroeconomicPolicy," EJ (October), pp. 1-20.
Pindyck, R. S., ed., 1979a. Advances in the Economics of Energy andResources, Vol. I: The Structure of Energy Markets. Greenwich, CT: JAIPress.
Pindyck, R. S. ed., 1979b. Advances in the Economics of Energy andResources, Vol. II: The Production and Pricing of Energy Resources.
Greenwich, CT: JAI Press.
Reister, D. B. and J. A. Edmonds, 1977. "A General Equilibrium Two-sectorEnergy Demand Model," in Hitch, edt, pp. 199-246.
Rosenberg, N., 1980. "Historical Relations between Energy and EconomicGrowth," in Dunkerley, ed., pp. 55-70.
Rybczynski, T. M., ed., 1976. The Economics of the Oil Crisis, New York:Holmes and Meier.
Searl, M. F., ed., 1973. Energy Modelling, Baltimore, lD: Johns HopkinsUniversity Press for Resources for The Future.
Smil, V. and T. Kuz, 1976. "European Energy Elasticities," EP, pp. 171-175.
- 156 -
* Starr, C. and S. Field, 1978. "Enerqy Use Proficiency: The Validity ofInternational Comparisons," ES&P, pp.
Starr, C. and F. Y. Wan, 1979. "Economic Growth, Employment and Energy," EP,pp. 2-22.
* Strout, A. M., 1977. "Energy and Economic Growth in Central America," ARE,pp. 219-305.
Strout, A. M., 1980. "How Credible Are Long-Run Projections of EnergyDemand?" (Draft) Mimeo. Cambridge, MA: MIT Department of Urban Studiesand Planning.
Sudarsono, B., 1979. "Energy Projections in Indonesia," in OECD/IEA, 1979,op. cit., pp. 87-91.
* Sweeney, J. L., 1.979c. "Energy and Economic Growth: A Conceptual Framework,"in B. Kursunuglu and A. Perlmutter, eds. Directions in Energy Policy: AComprehensive Approach to Energy Resource Decision-Making. Cambridge,MA: Ballinger.
Thomas, S. D., 1980. "Modelling U.K. Energy Demand to 2000," EP, pp. 17-37.
Toevs, A. L., 1980. "Input Substitution and Biased Technological Change inResource-Intensive Manufacturing Industries," in Moroney, ed., pp. 221-251.
Turvey, R. and A. R. Nobay, 1965. "On Measuring Energy Consumption," EcJ, pp.
Uri, N. D., 1979a. "Energy Substitution in the UK, 1968-64," EE, pp. 241-244.
Verleger, P., K., Jr., 1973b. "An Econometric Analysis of the Relationshipsbetween Macro Economic Activity and U.S. Energy Consumption," in Searl,ed., pp. 64-102.
Verleger, P. K., Jr., 1974. "The Relationship between Energy Demand andEconomic Activity," in Macrakis, ed., pp. 31-41.
Weyant, J. P., 1978. "Aggregate Elasticity Estimates," EIF Working Paper
4-4. Stanford, CA: Stanford University.
- 157 -
IV.2. Energy Policy Modeling
Baughman, M. L., 1972. Dynamic Energy System Modelling - InterfuelCompetition. Washington: National Science Foundation.
Berndt, E. R., 1978a. "Aggregate Energy Efficiency, and Productivity
Measurement," ARE, pp.
* Berndt, E. R. and D. 0. Wood, 1977. "Consistent Projections of Energy Demand
and Aggregate Economic Growth: A Review of Issues and Empirical
Studies," MIT-EL 77-024WP. Cambridge, MA: MIT Energy Laboratory.
* Brock, H. and D. Nesbitt, 1977. Large Scale Energy Planning Models: A
Methodological Analysis. Menlo Park, CA: SRI International.
Brooks, H. and J. J. Hollander, 1979. "United States Energy Alternatives to
2010 and Beyond: The CONAES Study," ARE, p. 1-70.
* Cherniavsky, E. A., 1974. "Brookhaven Energy System Optimization Model,"
BNL 19569. Upton, NY: BNL.
Davidson, P., L. H. Falk and H. Lee, 1974. "Oil: Its Time Allocation and
Project Independence," in BPEA, pp. 411-48.
DeSouza, G. R., 1980. Energy Models for Energy and Policy Analysis.
Lexington, MA: Lexington Books for Arthur D. Little, Inc.
Greenberger, M. and R. Richels, 1979. "Assessing Energy Policy Models:
Current State and Future Directions," ARE, pp. 467-500.
Hitch, C. J., ed., Modeling Energy - Economy Interactions: Five Approaches.
Baltimore: Johns Hopkins University Press for Resources for the Future.
Hoffman, K. C., 1973. "A Unified Framework for Energy System Planning," inSearl ed., pp. 110-143.
Hoffman, K. C., 1974. See 1973 above. Reprinted in Energy Modeling, 1974.
* Hoffman, K. C. and E. A. Cherniavsky, 1974. "Interfuel Substitution andTechnological Change," BNL 19293. Upton, NY: BNL.
* Hoffman, K. C. and D. W. Jorgenson, 1978. "Economic and Technological Models
for Evaluation of Energy Policy," BJE, pp. 444-466.
* Hoffman, K. C. and D. 0. Wood, 1976. "Energy System Modeling andForecasting," ARE, pp. 423-454.
Hoffman, K. C., P. F. Palmedo, W. Marcuse and M. D. Goldman, 1974. CoupledEnergy Systems-Economic Models, BNL 19293. Upton, NY: BNL.
Hogan, W. W., 1978. "Energy and Economic Growth," EMF Occasional Paper 3.1Stanford, CA: Stanford University.
- 158 -
Hogan, W. W., 1979a. "Capital-Energy Complementarity in Aggregate
Energy-Economic Analysis." E&EPC Discussion Paper E-79-03. Cambridge,MA: Harvard University.
* Hogan, W. W. and A. S. Manne, 1977. "Energy - Economy Interactions: The
Fable of the Elephant and the Rabbit?," in Hitch, ed., op. cit. (Also in
Pindyck, ed., 1979b, op. cit.)
* Hogan, W. W. and S. C. Parikh, 1977. "Comparison of Models of Energy and theEconomy," EMF Working Paper 1.4. Stanford, CA: Stanford University.
* Hogan, W. W. and J. P. Weyant, 1980. Combined Energy Models, Palo Alto, CA:EPRI.
Hudson, E. A. and D. W. Jorgenson, 1974a. "Tax Policy and Energy Use," inCommittee on Finance, U.S. Senate, Fiscal Policy and the Energy Crisis,Washington, DC: Ninety-third Congress, First and Second Session, U.S.GPO.
* Hudson, E. A. and D. W. Jorgenson, 1974b. "U. S. Energy Policy and EconomicGrowth: 1975-2000," BJE, pp. 461-514.
Hudson, E. A. and D. W. Jorgenson, 1976. "Tax Policy and EnergyConservation," Ch. 2 in Jorgenson, ed., pp. 7-94.
Hudson, E. A. and D. W. Jorgenson, 1977. "The Long Tern InterindustryTransactions Model: A Simulation Model for Energy and EconomicAnalysis," Washington, DC: Final Report to the Applied EconomicsDivision, Federal Preparedness Agency, General Services Administration.
Hudson, E.A. and D.W. Jorgenson, 1978a. "Energy Policy and U.S. EconomicGrowth," AER, pp. 118-123.
Hudson, E. A. and D. W. Jorgenson, 1978b. "The Economic Impact of Policiesto Reduce U.S. Energy Growth," R&E, pp. 205-222.-
Hudson, E. A. and D. W. Jorgenson, 1978c. "Energy Prices and the U. S.Economy, 1972 - 1976," NRJ, pp.
Intriligator, M. D., ed., 1977. Frontiers of Quantitative Economics, Vol.IIIB. Amsterdam: North Holland.
Jorgenson, D. W., ed., 1976. Econometric Studies of U.S. Energy Policy,Amsterdam, North Holland.
Jorgenson, D. W. and H. Houthakker, eds., 1973. Energy Resources and EconomicGrowth. Lexington, MA: Data Resources, Inc.
* Joskow, P. L., 1980. "America's Many Energy Futures - A Review of Energy
Future, Energy: The Next Twenty Years, and Energy in America's Future,"BJE, pp. 377-398.
* Just, J. and L. Lave, 1979b. "Review of Scenarios of Future U.S. Energy Use,"
ARE, pp. 501-536.
- 159 -
Klein, L. R. and W. F. Finan, 1977. "The Structure of the Wharton Annual
Energy Model," in E4F, Energy and the Economy. Stanford, CA: StanfordUniversity.
* Koreisha, S., 1980. "The Limitations of Energy Policy Models," EE, pp. 96-110.
Kroch, E. A., 1978. Economic Dynamics of Energy Resource Allocation inTheory and Practice. Unpublished Ph. D. dissertation. Cambridge, MA:Harvard University.
Kuh, E. and D. 0. Wood, 1979. Independent Assessment of Energy PolicyModels. Palo Alto, CA: EPRI.
Landsberg, H. H., ed., 1979. Energy: The Next Twenty Years, Cambridge, MA:
Ballinger.
* Landsberg, H. H., ed., 1980. Selected Studies on Energy: Background Papers
for "Energy: The Next Twenty Years," Cambridge, MA: Ballinger.
Limaye, D. R., ed., 1974. Energy Policy Alternatives; Modeling and Simulation
Approaches, Lexington, MA: Lexington Books.
Limaye, D. R. and J. R. Sharko, 1974. "US Energy Policy Evaluation: Some
Analytical Approaches," EP, pp. 3-17.
Macrakis, M. S., ed., 1974. Energy Demand, Conservation, and Institutional
Problems, Cambridge, MA: MIT Press.
Manne, A. S., 1974a. "Waiting for the Breeder," RES, pp. 47-65.
Manne, A. S., 1974b. "Electricity Investments Under Uncertainty: Waiting for
the Breeder," in Macrakis, ed., pp. 91-112.
Manne, A. S., 1976a. "ETA: A Model for Energy Technology Assessment," BJE,
pp. 379-406.
" Manne, A. S., 1976b. "ETA: A Model for Energy Technology Assessment," in
Intriligator, ed., op. cit.
" Manne, A. S., 1979. "ETA-MACRO: A Model of Energy-Economy Interactions," in
Pindyck, ed., 1979a, pp. 205-234. (Also in Hitch, ed., 1977, op. cit.)
Manne, A. S., with S. Kim and T. F. Wilson, 1980. "A Three-Region Model ofEnergy, International Trade and Economic Growth," Stanford, CA,
Department of Operations Research, Stanford University.
" Manne, A. S., R. G. Richels and J. P. Weyant, 1979. "Energy Policy Modeling:
A Survey," Operations Research, pp. 2-37.
" National Academy of Sciences, (NAS), 1978. Energy Modelin.7 for an Uncertain
Future. Modeling Resource Group (MRG), Conmittee on Nuclear and
Alternative Energy Scenarios (CONAES). Washington, DC: National Research
Council.
- 160 -
National Academy of Sciences, 1979. U.S. Energy Supply Prospects to 2010,Report of the Supply and Delivery Panel to the CONAES. Washington, DC:National Research Council.
National Academy of Sciences, 1980. Energy in Transition: 1985-2010. FinalReport of the CONAES. Washington, DC: National Research Council.
Nordhaus, W. D., 1973. "The Allocation of Energy Resources," BPEA, pp.
Nordhaus, W. D., 1979. The Efficient Use of Energy Resources. New Haven,CT: Yale University Press.
Nuclear Energy Policy Study Group (NEPSG), 1977. Nuclear Power Issues andChoices, Directed by the MITRE Corporation for Ford Foundation. SpurgeonM. Keeney, Chairman. Cambridge, MA: Ballinger.
Pindyck, R. S., ed., 1979b. Advances in the Economics of Energy andResources, Vol. II: The Production and Pricing of Energy Resources.Greenwich, CT: JAI Press.
Planco, Inc., 1979. Survey of the Research into Energy-Economy Interactions,Vol. I: Survey: Vol. II: Annotated Bibliography. Dallas, TX.
" Ridker, R. G. and W. D. Watson, 1980. To Choose a Future: Resource andEnvironmental Consequences of Alternative Growth Paths, Faltimore, MD:Johns Hopkins University Press for Resources for the Future.
" Schurr, S. H., J. Darmstadter, W. Ramsay, H. Perry and M. Russell, 1979.Energy in America's Future: The Choices Before Us, Baltimore, MD: JohnsHopkins University Press for Resources for the Future.
" Searl, M. F., ed., 1973. Energy Modelling, Baltimore, MD: Johns HopkinsUniversity Press for Resources for The Future.
" Stobaugh, R. and D. Yergin, 1979. Energy Futures: Report of the EnergyProject at the Harvard Business School, New York: Random House.
United States Federal Energy Administration (FEA), 1974. Project IndependenceReport. Washington, D.C: U.S. GPO,
Weinberg, A. M., 1979. "Limits to Energy Modeling," Oak Ridge, TN: IEA/ORAU.
- 161 -
BIBLIOGRAPHY
for
Chapter V. Demand for Energy by End-Use Sector
- 162 -
V. Demand for Energy by End-Use Sector
Berndt, E. R. and D. W. Jorgenson, 1973. "Production Structure," in D. W.Jorgenson, et. al, eds. U.S. Energy Resources and Economic Growth. FinalReport to the Ford Foundation Energy Policy Project, Washington, DC.
* Berndt, E. R. and D. 0. Wood, 1975. "Technology, Prices, and the DerivedDemand for Energy," RE&S, pp. 259-268.
* Bronheim, H., R. Nathans and P. F. Palmedo, 1975. User's Guide for RegionalReference Energy Systems. Upton, NY: BNL.
Brookhaven National Laboratory (BNL), 1976. "Study to Assess ,the Applicationof Shadow Pricing Techniques to National Energy Resource Planning," Year1 Final Report. Upton, NY.
* Brookhaven National Laboratory (BNL), 1978. An Analytical Framework for theAssessment of Energy Resource and Technology Options of DevelopingCountries. BNL 50800. Upton, NY.
Cato, D. B., A. D. Sandeval and F. E. Hopkins, 1980. Income and PriceEffects on Petroleum Consumption: An International Comparison.Washington, D.C: Energy Information Administration/Department of Energy.
Chateau, B. and C. Lapillionne, 1978. "Long-Term Energy Demand Forecasting- A New Approach," EP, pp. 140-157.
* Cirillo, R. R., 1980. "Analysis of Demand in Individual Sectors for Use inNational Energy Planning," Prepared for Commission of the EuropeanCommunities International Conference on Energy Programming. Argonnne, IL:Energy and Environmental Systems Division, ANL.
Cirillo, R. R., C. E. Klotz and R. E. Stajdohar, 1979. "The Assessment of aCountry's Energy Posture." Argonne, IL: ANL.
deLucia, R. J. and J. Houghton, 1980. "Analyses of the Fuel and FertilizerSystem." Chapter 9 in deLucia, Jacoby, et al., op. cit.
deLucia, R. J., H. D. Jacoby, et..al., 1980. LDC Energy Planning: A Studyof Bangladesh, (Manuscript in review; available from Meta Systems Inc).
* deLucia, R. J. and R. T. Tabors, 1980b. "Energy Demand Estimation," Chapter6 in deLucia, Jacoby, et al., op. cit.
Desai, A. V., 1981 (forthcoming). "The Effects of the Rise in Oil Prices inSouth Asian Countries, 1972-1978," ILR, pp.
* Dunkerley, J., with J. E. Jankowski, Jr., M. Gillis, R. K. Pachauri, P.Ehrlich, et al., and R. Kahn, 1980. Assessment of Energy DemandProjections for Selected Developing Countries. Mimeo., Report preparedfor Long Fange Assessment and Research Division, U.S. Dept. of StateWashington, D.C.; Resources for the Future.
- 163 -
Edmonds, J. A., 1978. "A Guide to Price Elasticities of Demand for Energy:
Studies and Methodologies," Oak Ridge, TN: IEA/ORAU. Available from NTIS.
Energy Modelling. 1974. Comprising the papers presented at a special
workshop organized by the U.S. National Science Foundation and the Energy
Research Unit, Queen Mary College, London. Guildford, Surrey, U.K.: IPC
Science and Technology Press.
Erickson, E. W., R. M. Spann and R. Ciliano, 1973. "Substitution and Usagein Energy Demand: An Econometric Estimation of Long-run and Short-run
Effects," in Searl, ed., pp. 192-2C8.
Griffin, J. M., 1977c. An International Analysis of Demand Elasticities
Between Fuel Types. Report to the National Science Foundation.
Washington, D.C.
" Griffin, J. M., 1979a. Energy Conservaiion in the OECD; 1980 - 2000.Cambridge, MA: Ballinger.
" Griffin, J. M., 1979b. "Results of Policy Simulations to 2000," in OECD/IEA,
1979, op. cit., pp. 382-406.
" Griffin, J. M. and P. Gregory, 1976. "An Intercountry Translog Model ofEnergy Substitution Responses," AER, pp.
Halvorsen, R., 1978. Econometric Models of U.S. Energy Demand. Lexington,MA: Lexington Books.
" Hartman, R. S., 1979. "Frontiers in Energy Demand Modeling," ARE, pp.433-466.
" Hoffman, K. C., 1973. "A Unified Framework for Energy System Planning," inSearl ed., pp. 110-143.
" Hoffman, K. C. and E. A. Cherniavsky, 1974. "Interfuel Substitution and
Technological Change," BNL 19293. Upton, NY: BNL.
Hoffman, K. C. and D. 0. Wood, 1976. "Energy System Modeling and
Forecasting," ARE, pp. 423-454.
Hogan, W. W. 1979b. "Dimensions of Energy Demand," E&EPC Discussion PaperE-79-02. Cambridge, MA: Harvard University. (Part published in
Landsberg, ed., 1980, op. cit.)
Jacoby, H. D. and M. Lesser, 1980. "Analysis of the Electric Power System,"Chapter 8 in deLucia, Jacoby, et al., op. cit.
Landsberg, H. H., ed., 1980. Selected Studies on Energy: Background Papersfor "Energy: The Next Twenty Years," Cambfridge, MA: Ballinger.
Lee, J., G. Mitchell and V. 4ubayi, 1978. 'A Preliminary Analysis of EnergySupply and Consumption in Thailand,' Mimeo. Epton, NY: BNL.
-164-
McGranahan, G., G. Mitchell, V. bubayi and R. Stern, 1979. "A Preliminary
Assessment of Energy Supply and Consumption in The Dominican Rzpublic,"Upton, NY: BIL.
Maddala, G. S., W. S. Chern and G. S. Gill, 1978. Econometric Studies inEnergy Demand and Supply. Cambridge, mA: Ballinger Press.
Montreal Engineering, Snamprogetti, Meta Systems Inc. and C. Lotti andAssociates, 1976. Banglade.Th Encray Study. For the Government of thePeople's Republic of Bangladesh, administered by the Asian DevelopmentBank under United Nations Development Programme. Cambridge, MA: MetaSystems Inc.
* Nordhaus, W. D., 1977. "The Demand for Energy: An InternationalPerspective," in Nordhaus, ed., pp. 239-285.
Nordhaus, W. D., ed., 1977. International Studies of the Demand for Energy.New York: North-Holland.
Organization for Economic Cooperation and Development/International Energy
Agency (OECD/IEA), 1979a. Workshop on Energy Supply and Demand. Paris.
* Pindyck, R. S, 1979d. The Structure of World Energy Demand, MIT Press,Cambridge, MA: MIT Press.
Reisman, A. and R. Malone, 1978. 'Less Developed Countries Energy NetworkSimulation: LDC-ESNS: A Brief Description,' Upton, NY: BNL.
Searle, M. F., ed., 1973. Energy Modelling, Baltimore, MD: Johns HopkinsUniversity Press for Resources for The Future.
Taylor, L. D., 1977. "The Demand for Energy: A Survey of Price and IncomeElasticities," Ch. 1 in Nordhaus, ed., pp. 3-44.
Zusman, P., E. Hochman, I. Luski and E. Bezalel, 1978. The Structure ofRegional Demand for Energy. Beersheva, Israel: Ben-Gurion University.
- 165 -
V.1. Industrial-Manufacturing Sector
* Anderson, K. P., 1971. "Toward Econometric Estimation of Industrial EnergyDemand: An Experimental Application to the Primary Metals Industry."R-719-NSF. Santa Monica, CA: Rand.
Anderson, R. G., 1980. "The Treatment of Intermediate Materials in theEstimation of the Demand for Energy: The Case of U.S. Manufacturing,1947-1971," EJ, pp. 75-94.
* Baxter, R. F. and R. Rees, 1968. "Analysis of the Industrial Demand forElectricity," EcJ, pp. 277-298.
Berndt, E. R. and L. R. Christensen, 1973. "The Internal Structure ofFunctional Relationships: Separability, Substitution and Aggregation,"RES, pp.
Berndt, E. R. and D. W. Jorgenson, 1973. "Production Structure," in D. W.Jorgenson, et. al, eds. U.S. Energy Resources and Economic Growth. FinalReport to the Ford Foundation Energy Policy Project, Washington, DC.
Berndt, E. R. and G. C. Watkins, 1977. "Demand for Natural Gas:Residential and Commercial Markets in Ontario and British Columbia,"CaJE, pp. 97-111.
Berndt, E. R. and D. 0. Wood, 1975. "Technology, Prices, and the DerivedDemand for Energy," RE&S, pp. 259-268.
Berndt, E. R. and D. 0. Wood, 1977. "Consistent Projections of Energy Demandand Aggregate Economic Growth: A Review of Issues and EmpiricalStudies," MIT-EL 77-024WP. Cambridge, MA: MIT Energy Laboratory.
Berndt, E. R. and D. 0. Wood, 1979. "Engineering and EconometricInterpretations of Energy-Capital Complementarity," AER, pp. 342-354.
Bossanyi, E. and J. Stanislaw, 1979. 'Fuel Substitution and Price Response forUK Industry,' EE, pp. 93-100.
* Chern, W. S., 1975. "Electricity Demand by Manufacturing Industries in TheUnited States," ORNL-NSF-EP-87. Oak Ridge, TN: ORNL.
Christensen, L. R. and W. H. Greene, 1976. "Economies of Scale in U.S.Electric Power Generation," JPE, pp. 655-676.
Christensen, L. R., D. W. Jorgenson and L. J. Lau, 1971. "Conjugate Dualityand the Transcendantal Logarithmic Function," Econ. pp. 206-207.
Christensen, L. R., D. w. Jorgenson and L. J. Lau, 1973. "TranscendentalLogarithmic Production Fronties," RE&S, pp. 23-27.
Christensen, L. R., D. W. Jorgenson, and L. J. Lau 1975. "TranscendentalLogarithmic Utiilty Functions," AER, pp. 367-383.
- 166 -
deLucia, R. J., H. D. Jacoby, et. al., 1980. LDC Energy Planning: A Studyof Bangladesh, (Manuscript in review; available from Meta Systems Inc).
deLucia, R. J. and R. T. Tabors, 1980b. "Energy Demand Estimation," Chapter6 in deLucia, Jacoby, et al., op. cit.
Desai, A. V., 1978. "India's Energy Consumption; Composition and Trends,"EP, pp. 217-230.
Desai, A. V., 1979. "Development and Energy Consumption," OBE&S, pp.
Desai, A. V., 1980a. India's Energy Economy: Pacts and their Interpretation.Bombay, India: Center for Monitoring Indian Economy.
Desai, A. V., 1980b. "Interfuel Substitution in the Indian Economy," Mimeo.Washington, D.C.: Resources for the Future.
Duncan, R. C. and H. P. Binswanger, 1976. 'Energy Sources: Substitutabilityand Biases in!Australia,' Australian Economic Papers, pp. 288-301.
Econometrica International, 1976. Development of Methods for Forecasting theNational Industrial Demand for Energy. Palo iUto, CA: EPRI.
" Fuss, M. A., 1977. "The Demand for Energy in Canadian Manufacturing: An
Example of the Etimation of Production Structures with Many Inputs," JE,
pp. 89-116.
" Fuss, M. and L. Waverman, 1975. "The Demand for Energy in Canada," Working
Paper, Institute for Policy Analysis, Toronto, Canada: University of
Toronto.
" Fuss, M., R. Hyndman and L. Waverman, 1975. "Residential, Commercial and
Industrial Demand for Energy in Canada," in Nordhaus, ed., pp. 151-179.
" Griffin, J. M., 1977b. "Interfuel Substitution Possibilities: A Translog
Application to Pooled Data," InER, pp. 755-770.
" Griffin, J. M., 1977c. An International Analysis of Demand Elasticities
Between Fuel Types. Report to the National Science Foundation.
Washington, D.C.
Griffin, J. M. and P. Gregory, 1976. "An Intercountry Translog Model of
Energy Substitution Responses," AER, pp.
Halvorsen, R., 1975. "Residential Demand for Electric Energy," RE&S, pp.12-18.
Halvorsen, R., 1976b. "Energy Substitution in U.S. Manufacturing,"Unpublished manuscript. (Published 1977, RE&S, pp. 381-388).
Halvorsen, R. and J. Ford, 1979. "Substitution Among Energy, Capital, andLabor Inputs in U.S. Manufacturing," in Pindyck, ed., pp. 51-76.
Hudson, E. A. and D. W. Jorgenson, 1974b. "U. S. Energy Policy and EconomiqGrowth: 1975-2000," BJE, pp. 461-514.
- 167 -
Jankowski, J. E., Jr., 1980. "Industrial Energy Conservation in DevelopingCountries," Working paper for ARDEN Project. Washington, DC: Resourcesfor the Future.
Kim, S., 1977. "Inter-Industry Analysis of Petroleum Use in the UnitedStates: An Input-Output Approach," JE&D, pp. 310-320.
Kouris, G. F., 1979. "Price sensitivity of Petrol Consumption and Some Policyimplications: The Case of the EEC," EP, PP.
Liew, C. X., 1974. "Measuring the Substitutability of Energy Consumption,"Unpublished manuscript.
Macrakis, M. S., ed., 1974. Energy Demand, Conservation, and InternationalProblems, Cambridge, MA: MIT Press.
Mount, T. D., L. D. Chapman and T. J. Tyrell, 1973. "Electricity Demand inThe United States: An Econometric Analysis," ORNL-NSF-EP-49. Oak Ridge,TN: ORNL.
Nordhaus, W. D., ed., 1977. "The Demand for Energy: An InternationalPerspective," in Nordhaus, ed., pp. 239-285.
Parikh, J. K. and K. Chaitanya, 1980. "Are Our Industries Energy-efficient?",EPW, pp.
Pindyck, R. S, 1979d. The Structure of World Energy Demand, MIT Press,Cambridge, MA: MIT Press.
Pindyck, R. S., ed., 1979a. Advances in the Economics of Energy andResources, Vol. I: The Structure of Energy Markets. Greenwich, CT: JAIPress.
Pindyck, R. S., ed., 1979b. Advances in the Economics of Energy andResources, Vol. II: The Production and Pricing of Energy Resources.Greenwich, CT: JAI Press.
* Schramm, G. and M. Munasinghe, 1980. "Interrelationships in Energy Planning:The Case of the Tobacco Curing Industry in Thailand," Mimeo. Washington,DC: The World Bank.
* Strout, A. M., 1979. "Industrial Growth Options and Energy Use in DevelopingCountries," (Draft) Mimeo. Cambridge, MA: MIT Department of UrbanStudies and Planning.
* Uri, N. D., 1979b. "Energy Demand and Interfuel Substitution in India," EER,pp. 181-190.
Williams, M. and P. Laumas, 1980. ,"The Relation between Energy and Non-energyInputs in a Developing Economy," mimeo, DeKalb, IL: Northern IllinoisUniversity.
Wood, D. 0., 1978. "Economic Policy and the Demand for Energy in U. S.Manufacturing," Proceedings of the American Statistical Association.
- 168 -
V.2. Household/Residential Sector
Adams, F. G. and J. M. Griffin, 1974. "Energy and Fuel SubstitutionElasticities: Results from an International Cross-Section Study," Mimeo.Philadelphia, PA: University of Pennsylvania.
Anderson, K. P., 1972b. "Residential Demand for Electricity: EconomicEstimates for California and the United States," R-905, Santa Monica, CA:
Rand.
Anderson, K. P., 1973. "Residential Energy Use: An Econometric Analysis,"
R-1;97-NSF, Santa Monica,.CA: Rand.
" Baughman, M. L. and P. L. Joskow, 1974a. "The Effects of Fuel Prices on
Residential Appliance Choice in The United States," Land Economics, pp.41-49.
" Baughman, M. L. and P. L. Joskow, 1974b. Interfuel Substitution in theConsumption of Energy in the United States. Report No. MIT-EL 74-002.Cambridge, MA: MIT Energy Laboratory.
" Baughman, M. L. and P. L. Joskow, 1974c. A Regionalized Electricity Model.MIT-EL 75-005. Cambridge, MA: MIT Energy Laboratory.
Baughman, M. L. and P. L. Joskow, 1976. "Energy Consumptionand Fuel Choice by Residential and Commercial Consumers in the UnitedStates," ES&P, pp. 305-323.
Baughman, M. L., P. L. Joskow and D. P. Kamat, 1979. Electric Powerin the United States: Models and Policy Analysis. Cambridge, MA: MITPress.
Berndt, E. R. and G. C. Watkins, 1977. "Demand for Natural Gas:Residential and Commercial Markets in Ontario and British Columbia,"CaJE, pp. 97-111.
Cecelski, E., J. Dunkerley and W. Ramsay, 1979. Household Energy and the Poorin the Third World. Washington, D.C.: Resources for the Future.
Cecelski, E. and J. Dunkerley, 1980. "Energy Use in the Rural and Urban house-
hold Sectors of Developing Countries: An Assessment," in NAS, 1980, pp.206-215.
Chern, W. S., 1976. "Energy Demand and Interfuel Substitution in the CombinedResidential and Commercial Sector," Oak Ridge, TN: ORNL.
Cody, E., 1980. "Income Elasticities of Energy Demand: Preliminary Analysisof Bombay, Nairobi and the U.S.," Mimeo. Cambridge, MA: Kennedy Schoolof Government, Harvard University.
- 169 -
Fernandez, J. C., 1980. Household Energy Use in Non-OPEC DevelopingCountries. R-2515-DOE. Santa Monica, CA: Rand.
* Fuss, M. and L. Waverman, 1975. "The Demand for Energy in Canada," Working
Paper, Institute for Policy Analysis, Toronto, Canada: University of
Toronto.
* Fuss, M., R. Hyndman and L. Waverman, 1975. "Residential, Commercial and
Industrial Demand for Energy in Canada," in Nordhaus, ed., pp. 151-179.
* Gillis, S. M., 1980. Energy Demand in Indonesia: Projections and Policies.
Development Discussion Paper No. 92, Harvard Institute for International
Development. Cambridge, MA: Harvard University.
* Griffin, J. M., 1974. "The Effects of Higher Prices on Electricity
Consumption," BJE, pp. 515-539.
Griffin, J. M., 1977c. An International Analysis of Demand ElasticitiesBetween Fuel Types. Report to the.National Science Foundation.
Washington, D.C.
* Halvorsen, R., 1975. "Residential Demand for Electric Energy," RE&S, pp.12-18.
* Halvorsen, R., 1976a. "Demand for Electric Energy in the United States."SEJ, pp. 610-625.
* Hartman, R. S., 1978. A Critic4il Review of Single-Fuel and InterfuelSubstitution in Residential Energy Demand Models, Cambridge, MA: MITEL-78-003.
Havrylyshyn, 0. and M. Munasinghe, 1980. "Interactions Among AlternativeModes of Energy Production: Empirical Case Study for Sri Lanka," Mimeo.Washington, DC: The World Bank.
* Hirst, E., W. Lin and J. Cope, 1976. "An Engineering - Economic Model of
Residential Energy Use," TM-5470. Oak Ridge, TN: IEA/ORAU.
* Houthakker, H. S., P. K. Verleger and D. P. Sheehan, 1976. "Dynamic DemandAnalysis for Gasoline and Residential Electricity," AJAE, pp. 412-418.
* Jorgenson, D. W., 1975. "Consumer Demand for Energy," in Nordhaus, ed.,pp. 309-328.
* Joskow, P. L. and M. L. Baughman, 1976. "The Future of the U.S. NuclearEnergy Industry," BJE, pp. 3-32.
Lebanon, A., 1977. "The Household Demand for Energy and Fuels in OECDCountries," EER, pp. 61-81.
* Liew, C. K., 1974. "Measuring the Substitutability of Energy Consumption,"Unpublished manuscript.
Macrakis, M. S., ed., 1974. Energy Demand, Conservation, and Institutional
Problems, Cambridge, MA: MIT Press.
- 170 -
McGranahan, G. and M. Taylor, 1977. Urban Eneray Use Patterns in DevelopingCountries: A Preliminarv Study of Mexico City. Stony Brook, NY: StateUniversity of New York.
McGranahan, G., S. Chubb and R. Nathans, 1979. Patterns of Urban HouseholdEnergy Use in Develo-ing Countries: the Case of Nairobi. Stony Brook,NY: State University of New York.
Meier, R. L., S. Berman and D. Dowell, 1978. Urbanism and Energy inDeveloping Renions, Prepared for U.S. DOE, Energy and EnvironmentDivision, LBL-7808. Berkeley, CA: Lawrence Berkeley Laboratory,University of California.
Mount, T. D., L. D. Chapman and T. J. Tyrell, 1973. "Electricity Demand inThe United States: An Econometric Analysis," ORNL-NSF-EP-49. Oak Ridge,TN: ORNL.
Mo0unt, T. D., Chapman, L. D. and T. J.-Tyrrell, 1974. "Electricity Demand inthe United States: An Econometric; Analysis," in Macrakis, ed., pp.318-329.
Nelson, J. P., 1975. "The Demand for Space Heating Energy," RE&S, pp. 508-522.
Nordhaus, W. D., 1977. "The Demand for Energy: An InternationalPerspective," in Nordhaus, ed., pp. 239-285.
Nordhaus, W. D., ed., 1977. "The Demand for Energy: An InternationalPerspective," in Nordhaus, ed., pp. 239-285.
" Pindyck, R. S, 1979d. The Structure of World Energy Demand, MIT Press,Cambridge, MA: MIT Press.
" Pindyck, R. S., 1980a. "International Comparisons of the Residential Demandof Energy," EER, pp. 1-26.
" Strout, A. M., 1978. "The Demand for Kerosene in Indonesia," (Draft) Mimeo.Cambridge, MA: bIT Department of Urban Studies and Planning.
Stucker, J. P., 1976. "The Impact of Energy Price Increases on Households:An Illustration," Santa Monica, CA: Rand.
Taylor, L. D., 1975. "The Demand for Electricity: A Survey," BJE, pp. 74-110.
Taylor, L. D., 1977. "The Demand for Energy: A Survey of Price and IncomeElasticities," Ch. I in Nordhaus, ed., pp. 3-44.
Taylor, L. D., 1979. "On Modelling the Residential Demand for Electricity byTime-of-day," JE, pp.
Wilcox, R. E., 19E0. "A New Framework for Analyzing the Fiscal Policies ofthe Energy Sector in Daveloping Countries," (Draft). Cambridge, MA:Harvard University Department of City and Regional Planning.
- 171 -
V.3. Transport Sector
" Adams, F. G. and J. M. Griffin, 1974. "Energy and Fuel SubstitutionElasticities: Results from an International Cross-Section Study," Mimeo.Philadelphia, PA: University of Pennsylvania.
* Adams, F. G., H. Graham and J. M. Griffin, 1974. "Demand Elasticities forGasoline: Another View," Discussion Paper no. 279, Department ofEconomics, University of Pennsylvania. Philadelphia: University ofPennsylvania.
" Diwan, R., 1978. "Energy Implications of Indian Economic Development," JE&D,pp. 318-
Fuss, M. and L. Waverman, 1975. "The Demand for Energy in Canada," WorkingPaper, Institute for Policy Analysis, Toronto, Canada: University ofToronto.
Heide, R. J., 1979. "Log Linear Models of Petroleum Product Demand: An Inter-national Study," MIT-EL 79-006WP. Cambridge, MA: MIT Energy Laboratory.
Hoffman, K. C. and D. 0. Wood, 1976. "Energy System Modeling andForecasting," ARE, pp. 423-454.
Houthakker, H. S., P. K. Verleger and D. P. Sheehan, 1976. "Dynamic DemandAnalysis for Gasoline and Residential Electricity," AJAE, pp. 412-418.
Jorgenson, D. W., 1975. "Consumer Demand for Energy," in Nordhaus, ed.,pp. 309-328.
Pindyck, R. S, 1979d. The Structure of World Energy Demand, MIT Press,Cambridge, MA: MIT Press.
Ramsey, J., R. Rasche and B. Allen, 1975. "An Analysis of the Private andCommercial Demand for Gasoline," RE&S, pp. 502-507.
Sweeney, J. L., 1975. Passenger Car Use of Gasoline: An Analysis of Policyoptions. Washington, D.C.: U.S. FEA.
Sweeney, J. L., 1978a. "The Demand for Gasoline in The United States: AVintage Capital Model," in OECD/IEA, pp.
Sweeney, J. L., 1978b. "Energy Policy and Automobile Use of Gasoline,"Stanford, CA: Stanford University.
Sweeney, J. L., 1979b. "Effects of Federal Policies on Gasoline Consumption,"R&E, pp. 3-26.
Sweeney, J. L., 1979d. "U.S. Gasoline Demand: An Economic Analysis of theEPA New-Car Efficiency Standards," in Pindyck, ed., 1979b, pp.
Verleger, P. x., Jr., 1973a. "A Study of the Quarterly Demand for Gasolineand Impacts of Alternative Gasoline Taxes." Report prepared for theCouncil on Environmental Quality. Lexington, MA Data Resources, Inc.

- 172 -
* Verleger, P. K. and D. D. Sheehan, 1976. 'A Study of the Demand forGasoline," in Jorgenson, ed.,-pp. 177-231.
* Wheaton, W. C., 1981. "The Long Run Structure of Transporation and Gasoline
Demand," Mimeo. Cambridge, MA: MIT Department of Economics.
- 173 -
V.4. Agricultural Sector
* Adams, J. and W. E. Tyner, 1977. "Rural Electrification in India:Biogas Versus Large-Scale Power," Asian Survey, pp.
* Bajracharya, D., 1979. "Rural Energy Utilization Patterns: SomeObservations from Pangma, Nepal," mimeo, Sussex, UK. Institute forDevelopment Studies.
* Bajracharya, D., 1980. "Fuel Wood and Food Needs vs. Deforestation:An Energy Study of a Hill Village Panchayat in Eastern Nepal" in EnergyAnalysis in Rural Regions: Studies in Indonesia, Nepal and thePhilippines. Part III. Honolulu, Hawaii: East-West Center.
* Bhatia, R., 1976a. "Energy Requirements of Different Farm Systems," IndianJournal of Agricultural Economics, pp.
* Bhatia, R., 1980a. "Energy Alternatives for Irrigation Pumping: Some Resultsfor Small Farms in North Bihar," Paper presented at International Seminaron Energy, Hyderabad, November 1979. (Revised March, 1980).
* Bhatia, R., 1980c. "The World Bank, Energy Prices, and AgriculturalDevelopment," (Draft),. Mimeo. Cambridge, MA: Harvard UniversityDepartment of City and Regional Planning.
* Bhatia R. and M. Mehta, 1977. "Tubewell Irrigation in India: An EconomicAnalysis of Technical Alternatives," EPW, pp.
Bhatia, R. and M. Niamir., 1979. "Renewable Energy Sources: TheCommunity Biogas Plant," mimeo. (draft), (Revised 1980) Cambridge, MA:Harvard University.
Bhatia, R., J. Briscoe, M. N. Jha and P. Rogers, 1980. "EnergyDemand and Supply in Rural Bihar: A Comprehensive Micro Level Study,"Draft. Cambridge, MA: Harvard University Department of City and RegionalPlanning.
Bialy, J., 1979. "Firewood Use in a Sri Lankan Village: A PreliminarySurvey." Edinburgh, Scotland: University of Edinburgh.
* Briscoe, J., 1979a. "Energy Use and Social Structure in a BangladeshVillage," PDR, pp.
Briscoe, J., 1979b. "The Political Economy of Energy Use in Rural Bangladesh,"Mimeo, Cambridge, MA: Harvard University, Division of Engineering and
. Applied Physics.
* deLucia, R. J., 1981. "Infrastructure for Rural Energy Systems." Paperprepared for Ad-Hoc Expert Group in preparation for forthcoming U.N.Conference on New and Renewable Sources of Energy.
- 174 -
deLucia, R. J., H. D. Jacoby, et. al., 1980. LDC Energy Planning: A Study
of Bangladesh, (Manuscript in review; available from Meta Systems Inc).
deLucia, R. J. and M. Lesser, 1980. "Energy from Organic Residues in
Developing Countries: Present Use, Potential, and Observations on
Feasibility," Paper presented at the World Bio-Energy Conference,Atlanta, GA.
deLucia, R. J. and R. T* Tabors, 1980a. "Traditional and Renewable EnergySources," Chapter 4 in deLucia, Jacoby, et al*, op. cit.
Desai, A. V., 1978. "India's Energy Consumption: Composition and Trends,"EP, pp. 217-230.
Food and Agricultural Organization of the U.N. (FAO), 1976. "Energyfor Agriculture in the Developing Countries," PAO Monthly Bulletin ofAgriculture Economics and Statistics, pp. 1-8.
" French, D., 1979. "The Economics of Renewable Energy Systems for Developing
Countries," mimeo. Washington, D.C.: USAID.
Friedrich, R. A., 1978. Energy Conservation For American Agriculture.
Cambridge, MA: Ballinger.
" Gavan, J. D. and R. Tyers, 1980. "Agricultural Analysis for Energy Planning,"
Chapter 3 in deLucia, Jacoby, et. al., op.cit.
Ghate, P. B., 1979. "Biogas: A Decentralized Energy System,' EPW,
PP*
Ghate, P. B., 1980. "IrrigaLion for Very Small Farmers: Appropriate
Technology or Appropriate Organization?," EPW, pp. A-161-171.
" Heichel, G. H., 1974. "Energy Needs and Food Yields," Technology Review, pp.
18-25.
" Heichel, G. H., 1976. "Agriculture Production and Energy Resources,"American Scientist, pp. 64-72.
Intriligator, M. D., ed., 1977. Frontiers of Quantitative Economics, Vol.IIIB. Amsterdam: North Holland.
Kuether, D. 0. and B. Duff, 1979. "Energy Requirements for Alternative RiceProduction Systems in the Tropics." Paper presented at the Annual Meetingof the Society of Automotive Engineers, Wisconsin.
Leach, G., 1979a. Energy and Food Production, Guildford, England: IPC Scienceand Technology Press.
Leach, G., 1979b. Report of the Energy Resources Working Group, InternationalConference on Aaricultural Production: Research and DevelopmentStrategies for the 1980's. Bonn, West Germany.
* Lockeretz, W., ed., 1977. Agriculture and Energy, New York: Academic Press.
- 175 -
* Makhijani, A. and A. Poole, 1975. Energy and Agriculture in the Third World.
Cambridge, MA: Ballinger.
Meta Systems Inc., 1978a. "Report (including Background Note) of the
Brookhaven/USAID Workshop on 1Rhral/Domestic Energy Issues," Cambridge, MA.
Mubayi, V. and T. Le, 1977. "Irrigation in Less Developed Countries," Mimeo.
Upton, NY: BNL.
* Mubayi, V., J. Lee and R. Chatterjee, 1980. 'The Potential of Biomass Con-
version in Meeting the Energy Needs of the Rural Populations of Developing
Countries - An Overview,' in J.L. Jones and S.B. Padding, eds., Thermal
Conversion of Solid Wastes and Biomass, ACS Symposium Series 130.
Washington, D.C.: American Chemical Society.
National Council of Applied Economic Research, 1978 (Feb). Survey of Rural
Energy Consumption in Northern India. New Delhi.
Parikh, J. K., 1978. "Energy and Development," Energy, Water and Telecommuni-cations Deparment, Public Utilities Notes, PUN 43. Washington, D.C.: TheWorld Bank.
Parikh, J. K. and K. S. Parikh, 1977. 'Mobilization and Impacts of Bio-gasTechnologies," En, pp. 441-455.
Parikh, K. S. and T. N. Srinivasan, 1977. "Food-Energy Choices for India,"in Intrilligator, ed., op. cit.
Patel, S. M. and R. K. Gupta, 1979. "Study on Conservation of Light DieselOil in Pumpset for Lift Irrigation in Gujarat State, India," Ahmedabad,,India: Institute of Coeperative Management.
Pimentel, D., 1977. Workshop Report on Energy Needs, Uses, and Resources inthe Food Systems of Developing Countries, Ithaca, NY: Cornell University.
Pimentel, D., N. Beyer, and V. Mubayi, 1976. "Energy in Indian Agriculture."
Upton, NY: BNL.
Pimentel, D. and M. Pimentel, 1979. Food, Energy and Society, New York,John Wiley.
Reddy, A. K. N. and D. G. Subramaniam, 1979 (Sept.). "The Design of Rural
Energy Centers," Proceedings of Indian Academy of Sciences.
Revelle, R., 1976. "Energy Use in Rural India," Science, pp. 969-975.
Revelle, R., 1978. "Requirements for Energy in the Rural Areas of Developing
Countries," in N. L. Brown, ed., Renewable Energy Resources and Rural
Applications in the Developing'World, Boulder, CO: American Association
for the Advancement of Science.
Rogers, P. and C. Hurst, 1980 (Oct.). "Engines for Development III: The Case
of Self Energized Irrigation Pump," Himeo, Center for Population
Studies. Cambridge, MA: Harvard University.
Sanghi, A. K. and M. Blase, 1976. "An Economic Analysis of Energy Requirements
of Alternative Farming Systems for a Small Farmer: Some Public Policy
Issues," Indian Journal of Agricultural Economics, pp.
- 176 -
Smil, V., 1978. "Analysis of Rural Energy Flows," in A Preliminary Assessment
of Egyptian Energy Outlook, Upton, NY: BNL.
Smith, D. V., 1977. Photovoltaic Power in Less Developed Countries,Lexington, MA: MIT Lincoln Laboratory.
* Smith, D. V., 1979. "Photovoltaics in the Third World," MIT-EL 79-045WP.Cambridge, MA: MIT Energy Laboratory.
* Smith, D. V. and S. V. Allison, 1978. "Micro-irrigation withPhotovoltaics," MIT-EL-78-006. Cambridge, MA: MIT Energy Laboratory.
* Stout, B. A., et al., 1980. Energy for World Agriculture, Rome: FAO.
* Tabors, R. T., 1979. The Economics of Water Lifting for Small Scale Irrigationin the Third World: Traditional and Photovoltaic Techniques. MIT-EL79-011. Cambridge, MA: MIT Energy Laboratory.
Tewari, S. K., 1978. 'Economics of Wind Energy Use for Irrigation in India,'Science, pp.
Trehan, R. K,,L. Newman and W. R. Park, 1980. Potential for Energy Farms inthe Dominican Republic. McLean, VA: The MITRE Corporation.
12yers, R., 1978. "Optimal Resource Allocation in Transitional Agriculture:Case Studies in Bangladesh," Ph.D. Dissertation. Cambridge, MA: HarvardUniversity.
Weatherly, P. and J. E. M. Arnold, 1980. "Environmental Assessment of theSecond USAID Rural Electrification Project." Jakarta: USAID.
- 177 -
BIBLIOGRAPHY
for
Chapter VI. Integrated Energy Sector Studies and
Demand/Investment/Pricing by Individual Fuel Types
- 178 -
VI.l. Integrated Energy Sector Studies
* Arrow, X. J. and J. P. Kalt, 1979. Petroleum Price Regulation: Should weDecontrol? AEI Studies in Energy Policy. Washington, D.C.: AmericanEnterprise Institute for Public Policy Research.
* Camm, F. A., Jr, 1978. Average Cost Price of Natural Gas: A Problem andThree Policy Options. R-2282-DOE. Santa Monica, CA: Rand.
* Camm, F. A., Jr., 1979. "Policy Alternatives to the Average Cost Pricing ofNatural Gas," R&E, pp. 27-49.
* de la Garza, F.G. and A. S. Manne, 1973. "ENERGETICOS, a Process AnalysisModel of the Energy Sector," in L. Goreux and A. S. Manne, eds.,Multi-level Planning: Case Studies in Mexico. Amsterdam: North Holland.
* de la Garza, F. G., A. S. Manne, and J. A. Valencia, 1973. "Multi-levelPlanning for Electric Power Projects," in Goreux and Manne, eds., op.cit., pp. 197-232.
* deLucia, R. J. and J. Houghton, 1980. "Analyses of the Fuel and FertilizerSystem." Chapter 9 in deLucia, Jacoby, et al., op. cit.
* deLucia, R. J. and H. D. Jacoby, 1980. "Sector-wide Analysis and InvestmentProgram Design," Chapter 10 in deLucia, Jacoby, et al., op. cit.
deLucia, R. J., H. D. Jacoby, et. al., 1980. LDC Energy Planning: A Studyof Bangladesh, (Manuscript in review; available from Meta Systems Inc).
* deLucia, R. J. and R. T. Tabors, 1980b. "Energy Demand Estimation," Chapter6 in deLucia, Jacoby, et al., op. cit.
Goreux, L. and A. S. Manne, eds., 1973. Multilevel Planning - Case Studies.
in Mexico. Amsterdam: North Holland.
* Government of India, 1974. Report of the Fuel Policy Committee. New Delhi,
India.
* Government of India, 1979. Interim Report of the Working Group on EnergyPolicy. New Delhi, India.
* Government of India, 1980a. Report of the Working Group on Energy Policy.
New Delhi.
Henderson, P. D., 1975. India: The Energy Sector, New York: OxfordUniversity Press for The World Bank.
* Jacoby, H. D., (1967 - Republished in 1979). Analysis of Investment in
Electric Power, New York: Arno Press, (Originally author's dissertationat Harvard University and Discussion Paper at Center for International
Affairs, Harvard University, 1967).
- 179 -
Jacoby, H. D. and M. Lesser, 1980. "Analysis of the Electric Power System,"Chapter 8 in deLucia, Jacoby, et al., op. cit.
MacAvoy, P. and R. S. Pindyck, 1973. "Alternative Regulatory Policies forDealing with the Natural Gas Shortage," BJE, pp. 454-98.
* MacAvoy, P. and R. S. Pindyck, 1975. The Economics of the Natural GasShortage (1960-1980). Amsterdam: North Holland.
* Manne, A. S., 1973. "On Linking ENERGETICOS to DINAMICO," in Goreux andManne, eds., op. cit., pp. 277-290.
* Montreal Engineering, Snamprogetti, Meta Systems Inc. and C. Lotti andAssociates, 1976. Bangladesh Energy Study. For the Government of thePeople's Republic of Bangladesh, administered by the Asian DevelopmentBank under United Nations Development Programme. Cambridge, MA: MetaSystems Inc.
Munasinghe, M., 1980a. "An Integrated Framework for Energy Pricing inDeveloping Countries," EJ, pp. 1-30.
Munasinghe, M., 1980d. "Integrated National Energy Planning (INEP) inDeveloping Countries," NRF, pp. 359-373.
Munasinghe, M. and G. Schramm 1980. "Power-Energy Pricing Case Studies,"(Draft), Mimeo. Washington, DC: The World Bank.
Pachauri, R. K., 1977. Energy and Economic Development in India. NewYork; Praeger.
Palmedo, P. F., R. Nathans,.E. Beardsworth and S. Hale, Jr., 1978. EnergyNeeds, Uses and Resources in Developing Countries. Upton, NY: BNL.
Pindyck, R. S, 1978c. "Higher Energy Prices and the Supply of Natural Gas,"ES&P, pp. 177-199.
Schramm, G., 1979. *The Economics of Energy Pricing," Mimeo. January.
Siddayao, C. M., 1980. "Petroleum and Coal Pricing Policies," Kimeo.Honolulu: Prepared for the Asian Development Bank Regional Energy Surveyby the East West Center.
Tyner, W. E., 1978. Energy Resources and Economic Development in India.Leiden: Martinus Nijhoff.
Webb, X. G., 1978. "Policy on Energy Picuing," EP pp. 53-
Webb, M. G., 1980. 'Energy Pricing in the UK,' EE, pp. 194-198.
World Bank, The, 1979c. Energy Options and Policy Issues in DevelopingCountries. Staff Working Paper No. 350, Washington, D.C.
World Bank, The, 1980a. Pakistan: Issue and Options in the Energy Sector.Washington, D.C.
World Bank, The, 1980b. Energy in the Developing Countries. Washington, D.C.
-180 -
VI.2. Crude Oil/Natural Gas - Pricing Policies
" Balestra, P., 1967. The Demand for Natural Gas in the United States.Amsterdam: North Holland.
" Balestra, P. and M. Nerlove, 1966. "Pooling Cross-Section and Time-SeriesData in the Estimation of a Dynamic Model: The Demand for Natural Gas."Econ, pp. 585-612. -
Barouch, E. and G. M. Kaufman, 1976. "Probability Modeling of Oil and GasDiscovery," in Roberts, ed., pp. 133-151.
" Bhatia, R., 1976. "Technological and Locational Choices in Petroleum andFertilizer Industries: A Multi-Purpose Programming Model in India," IER,
PP*
Bradley, P., 1967. The Economics of Crude Petroleum Production. Amsterdam:
North-Holland.
Brannon, G. M., ed., 1975. Studies in Energy Tax Policy, Cambridge, MA:Ballinger Press.
" Camm, F. A., Jr, 1978. Average Cost Price of Natural Gas: A Problem andThree Policy Options. R-2282-DOE. Santa Monica, CA: Rand.
" Camm, F. A., Jr., 1979. "Policy Alternatives to the Average Cost Pricing ofNatural Gas," R&E, pp. 27-49.
" Cichetti, C. J. and M. Reinbergs, 1979. "Electricity and Natural Gas RateIssues," ARE, pp. 231-258.
a Cox, J. C. and A. W. Wright, 1975b. "The Cost-Effectiveness of Federal TaxSubsidies for Petroleum Reserves: Some Empirical Results and TheirImplications," in G. Brannon, ed., pp.
a Cox, J. C. and A. W. Wright, 1976. "The Determinants of Investment inPetroleum Reserves and Their Implications for Public Policy," AER, pp.153-67.
Debanne, J. G., 1971. "A Model for Continental Oil Supply and Distribution,"JPT, pp. 1089-1100.
deLucia, R. J. and H. D. Jacoby, 1980. "Sector-wide Analysis and InvestmentProgram Design," Chapter 10 in deLucia, Jacoby, et al., op. cit.
Dunkerley, J., ed., 1980. International Energy Strategies: Proceedings of
the 1979 IAEE/RFF Conference. Cambridge, MA: Oelgeschlager, Gunn & Hain.
Eckbo, P. L., 1979. 'A Basin Development Model of Oil Supply,' in Pindyck, ed.1979b, pp. 39-58.
- 181 -
Eckbo, P. L., 1980. "Projecting the Supply of North Sea Oil - Dimensions of
Uncertainty," in Dunkerley, ed*, pp. 335-364.
* Eckbo, P. L., H. D. Jacoby, and J. L. Smith, 1978. "Oil Supply Forecasting:
A Disaggregated Process Approach," BJE, pp.
Energy Modelling. 1974. Comprising the papers presented at a specialworkshop organized by the U.S. National Science Foundation and the Energy
Research Unit, Queen Mary College, London. Guildford, Surrey, U.K.: IPCScience and Technology Press.
Epple, D. N., 1975. Petroleum Discoveries and Government Policy: An
Econometric Study of Supply. Cambridge, MA: Ballinger.
* Epple, D. N., 1978. "Studies of United States Primary Energy Supply: AReview," ES&P, pp. 245-265.
Epple, D. N. and L. P. Hansen, 1979. -"An Econometric Model of U.S. PetroleumSupply with Optimal Endogenous Depletion," Mimeo. Pittsburgh:Carnegie-Mellon University, Graduate School of Industrial Administration.
* Erickson, E. W. and R. M. Spann, 1971. "Supply Response in a RegulatedIndustry: The Case of Natural Gas," BJE, pp. 94-121.
Erickson, E. W., S. W. Millsaps and R. M. Spann, 1974. "Oil Supply and TaxIncentives," BPEA, pp. 449-78.
* Fisher, F. M., 1964. Supply and Ccts in the U.S. Petroleum Industry: Two
Econometric Studies. Baltimore, 11: Johns Hopkins University Press for
Resources for the Future.
Gillis, S. M. and C. P. Timmer, eds. (forthcoming, 1981). Public Policy inIndonesia: Issues and Methodology. Cambridge, MA: oelgeschlager, Gurm,and Hain.
a Goreux, L. and A. S. Manne, eds., 1973. Multilevel Planning - Case Studiesin Mexico. Amsterdam: North Holland.
* Government of India, 1965. Report of the Working Group on Oil Prices. New
Delhi, India.
* Government of India, 1969. Report of the Working Group on Oil Prices. New
Delhi, India.
* Government of India, 1975. Interim Report of Oil Prices Committee. New
Delhi, India.
* Government of India, 1976. Oil Price Cormittee Report. New Delhi. (Also,
Reports of the Working Group on Oil Prices. 1965, 1969.) New Delhi, India.
* G6vernment of India, 1980a. Report of the Working Group on Energy Policy.
New Delhi.
* Griffin, J. M., 1972. "The Process Analysis Alternative to Statistical Cost
Functions," AER, pp. 46-56.
- 182 -
Griffin, J. M., 1977d. "The Econometrics of Joint Production: Another
Approach," RE&S, pp. 339-397.
Helms, R. B., 1974. Natural Gas RequLation: An Evaluation of FPC Price
-Controls, vlashington, DC: '._merican Enterprise Institute.
guntington, H. G., 1978. "Federal Price Regulation and the Supply of NaturalGas in a Segmented Field Market," ,and Economics, pp. 337-47.
Jorgenson, D. W., ed., 1976. Econometric Studies of U.S. Energy Policy,Amsterdam, North Holland.
Joyce, T. J., 1978. "The Role of Natural Gas in Developing Countries,"
* Mimeo. Washington, DC: The World Bank.
Kalt, J. P. and R. S. Stillman, 1980. "The Role of Government Incentives in
Energy Production - An Historical overview," ARE, pp. 1-32.
Kemp, A. G. and D. Crichton, 1979a. "North Sea Oil Taxation in Norway," EE,
pp. 33-
Kemp, A. G. and D. Crichton, 1979b. "Effects of Changes in U.K. North Sea Oil
Taxation," EE, pp. 224-
Khazzoom, J. D., 1971. "The FPC Staff's Econometric Model of Natural GasSupply in the United States," BJE, pp. 51-93.
Kuller, R. and R. Cummings, 1974. "An Economic Model of Production andInvestment for Petroleum Reservoirs," AER, pp. 66-79.
Landsberg, H. H., ed., 1980. Selected Studies on Energy: Background Papersfor "Energy: The Next Twenty Years," Cambridge, MA: Ballinger.
MacAvoy, P. and R. S. Pindyck, 1973. "Alternative Regulatory Policies forDealing with the Natural Gas Shortage," BJE, pp. 454-98.
MacAvoy, P. and R. S. Pindyck, 1975. The Economics of the Natural GasShortage (1960-1980). Amsterdam: North Holland.
Macrakis, M. S., ed., 1974. Energy Demand, Conservation, and InstitutionalProblems, Cambridge, MA: MIT Press.
Mause, P. 1980. "Price Regulations and Energy Policy," in Landsberg, ed.,op. cit. pp. 145-166.
Mozumdar, S. Z., 1980. "Pricing of Gas in Bangladesh," Unpublishedmanuscript, cited in Siddayao, pp. 111.
Munasinghe, M. and G. Schramm 1980. "Power-Energy Pricing Case Studies,"(Draft), Mimeo. Washington, DC: The World Bank.
Neri, J. A., 1977. "An Evaluation of Two Alternative Supply Models of NaturalGas," BJE, pp. 289-302.
- 183 -
Phelps, C. E. and R. T. Smith, 1977. Petroleum Regulation: The FalseDilemma of Decontrol, Report R-1951-RC. Santa Monica, CA: Rand.
Pindyck, R. S., 1974a. "Market Structure and Regulation: The Natural GasIndustry," in Macrakis, ed., pv. 291-302.
* Pindyck, R. S., 1974b. "The Regulatory Implications of Three AlternativeEconometric Supply Models of Natural Gas," BJE, pp. 633-645.
Pindyck, R. S., 1975. "The Econometrics of U.S. Natural Gas and Oil Markets,"in Energy Modelling, op. cit., pp.
* Pindyck, R. S, 1978c. "Higher Energy Prices and the Supply of Natural Gas,"ES&P, pp. 177-199.
Pindyck, R. S., ed., 1979a. Advances in the Economics of Energy and
Resources, Vol. II: The Production and Pricing of Energy Resources.
Greenwich, CT: JAI Press.
Pindyck, R. S., ed., 1979b. Advances in the Economics of Energy andResources, Vol. II: The Production and Pricing of Energy Resources.Greenwich, CT: JAI Press.
Reid, G. L., K. Allen and D. J. Harris, 1973. The Nationalized FuelIndustries, London: Heinemann.
Renshaw, E. F., 1975. "The Pricing of U.S. Crude Oil," EP, pp. 192-200.
Renshaw, E. F., 1980. "The Decontrol of U.S. Oil Production," EP, pp. 38-49.
Rice, P. and V. K. Smith, 1977. "An Econometric Model of the PetroleumIndustry," JE, pp. 263-287.
Roberts, F. S., ed., 1976. Energy: Mathematics and Models. Proceedings of an
SIMS conference on Energy.
Searl, M. F., ed., 1973. Energy Modelling, Baltimore, MD: Johns HopkinsUniversity Press for Resources for The Future.
* Siddayao, C. M., 1978. The Off-Shore Petroleum Resources of South-east Asia:Potential Conflict Situations and Related Economic Considerations, KualaLampur: Oxford University Press.
Siddayao, C. M., 1979. Future of Oil and Gas in Large-Scale Energy Systems,Presented at the Atlantic Economic Conference, Washington, D.C.
* Siddayao, C. M., 1980. "Petroleum and Coal Pricing Policies," Mimeo.Honolulu: Prepared for the Asian Develoyment Bank Ragional Energy Surveyby the East West Center.
Smiley, R., 1980. "A Marginalist Approach to Pricing U.S. Natural Gas, EEfpp. 172-177.
Smith, J. L., 1980. "A Probablistic Model of Oil Discovery," RE&S, pp.587-594.
- 184 -
Spann, R. M. and E. W. Erikson, 1973. "Joint Costs and Separability in Oiland Gas Exploxationj" in Searl, ed., pp. 212-250.
Strout, A. M., 1978. "The Demand for Kerosene in Indonesias" (Draft) Mimeo.
Cambridge, MA: MIT Department of Urban Studies and Planning.
Squire, L. and H. Van der Tak, 1975. Economic Analysis of Projects,
Baltimore, MD: Johns Hopkins University Press for The World Bank.
Summers, L., (1981, forthcoming). 'Oil Subsidies in indonesia,' in Gillis andTimmer, ed., op. cit.
Sweeney, J. L., 1979a. "Models of U.S. Oil and Gas Supply," EMP OccasionalPaper No. 6. Stanford, CA: Stanford University.
Tyner, W. E., 1978. Energy Resources and Economic Development in India.
Leiden: Martinus Nijhoff.
Uhler, R. S., 1979. "The Rate of Petroleum Exploration and Extraction," inPindyck, ed. 1979a, pp. 93-118.
United ,States Federal Trade Commission, 1976. Staff Report on Effects ofFederal Price and Allocation Rewiations on the Petroleum Industry.Washington, D.C.: Bureau of Economics, U.S. FTC.
Verleger, P. K., Jr., 1980 (Oct.). "An Assessment of the Effects of theWindfall Prof.Lts Tax on Crude Oil Supply," EJ, pp. 41-58.
Verleger, P. K. and D. D. Sheehan, 1976. "A Study of the Demand forGasoline," in Jorgenson, ed., pp. 177-231.
Vinod, H. D., 1968. "Econometrics of Joint Production," Econ, pp. 322-336.
Vinod, H. D., 1976. "Canonical Ridge and Econometrics of Joint Production,"
JE, pp. 147-166.
Wellisz, S. H., 1963. "Regulation of Natural Gas Pipeline Companiest AnEconomic Analysis," JPE, pp. 30-43.
Weyant, J. P., 1979. "The Role of Models in the Oil and Gas Supply
Debates," EnF OP 4.1. Stanford, CA: Stanford University.
World Bank, The, 1979b. A Proaram to Accelerate Petroleum Production in theDevelopina Countries. Washington, D.C.
- 185 -
VI.3. Petroleum Products
* Adams, F. G. and J. M. Griffin, 1969. "An Econometric Model of the U.S.
Petroleum Industry," in L. R. Klein, ed., Essays in Industrial
Econometrics. Philadelphia, PA: University of Pennsylvania Press.
* Adams, F. G. and J. M. Griffin, 1972. "An Economic-Linear Programming Model
of the U.S. Petroleum Refining Industry," JASA, pp. 542-551.
Arrow, K. J. and J. P. Kalt, 1979. Petroleum Price Regulation: Should we
Decontrol? AE1 Studies in Energy Policy. Washington, D.C.: American
Enterprise Institute for Public Policy Research.
Bhatia, R., 1976. "Technological and Locational Choices in Petroleum and
Fertilizer Industries: A Multi-Purpose Programming Model in India," IER,
PP*
* deLucia, R. J. and J. Houghton, 1980. "Analyses of the Fuel and Fertilizer
System." Chapter 9 in deLucia, Jacoby, et al., op. cit.
deLucia, R. J. and H. D. Jacoby, 1980. "Sector-wide Analysis and Investment
Program Design," Chapter 10 in deLucia, Jacoby, et al., op. cit.
deLucia, R. J., H. D. Jacoby, et. al., 1980. LDC Energy Planning: A Studyof Bangladesh, (Manuscript in review; available from Meta Systems Inc).
* Dhrymes, P. J. and B. M. Mitchell, 1969. "Estimation of Joint Production
Functions," Econ, pp. 732-736.
Fainer, D. with P. Baade, 1974. "Price and Income Elasticities of EEC
Demand for Petroleum Products," Washington, D.C.: U.S. Federal Energy
Administration.
* Gillis, S. M., 1980. Energy Demand in Indonesia: Projections and Policies.
Development Discussion Paper No. 92, Harvard Institute for International
Development. Cambridge, MA: Harvard University.
Goreux, L. and A. S. Manne, eds., 1973. Multilevel Planning - Case Studies
in Mexico. Amsterdam: North Holland.
Government of India, 1969. Report of the Working Group on Oil Prices. New
Delhi, India.
* Government of India, 1974. Report of the Fuel Policy Committee. New Delhi,
India.
* Government of India, 1976. Oil Price Committee Report. New Delhi. (Also,
Reports of the Working Group on Oil Prices. 1965, 1969.) New Delhi, India.
Griffin, J. M., 1971. Capacity Measurement in Petroleum Refining: A Process
Analysis Approach to the Joint Product Case. Lexington, MA: Lexington
Books.
- 186 -
Griffin, J. M., 1977d. "The Econometrics of Joint Production: Another
Approach," RE and S, pp. 389-397.
Heide, R. J., 1979. "Log Linear Models of Petroleum Product Demand: An Inter-national Study," MIT-EL 79-006WP. Cambridge, MA: MIT Energy Laboratory.
* Houthakker, H. S., P. K. Verleger and D. P. Sheehan, 1976. "Dynamic DemandAnalysis for Gasoline and Residential Electricity," AJAE, pp. 412-418.
Manne, A. S., 1956. Scheduling of Petroleum Refinery Operations. Cambridge,MA: Harvard University Press.
* Manne, A. S., 1958. "A Linear Programming Model of U.S. Petroleum RefiningIndustry," Econ, pp.
Manne, A. S., 1973. "On Linking ENERGETICOS to DINAMICO," in Goreux andManne, eds., op. cit., pp. 277-290.
Marshak, T. A., 1963. "A Spatial Model of US Petroleum Refining," in A. S.Manne and H. M. Markowitz, eds., Studies in Process Analysis, New York:Wiley.
fMunasinghe, M. and G. Schramm 1980, "Power-Energy Pricing Case Studies,"(Draft), klizeo. Washington, DC: The World Bank.
Pagoulatos, A. and J. F. Timmons, 1979. "Estimation and Projections of Demandfor Crude Petroleum and Refined Petroleum Products," EE, pp. 72-75.
Peck, S. C. and S. Harvey, 1979. "Factors Leading to Structural Change in theU.S. Oil-Refining Industry in the Post-War Period," in Pindyck, ed.,1979a, op. cit., pp. 135-162.
Rice, P. and V. K. Smith, 1977. "An Econometric Model of the PetroleumIndustry," JE, pp. 263-287.
Saito, K., 1975. "Taxes on Petroleum Products," Finance and Development,December, pp.
Seidel, M. R., 1978. "Gas-Saving Taxes: A Comparison," R&E, pp. 93-107.
Sweeney, J. L and M. T. Flaherty, 1978. "Methodologies for Petroleum ProductPrice Forecasting: A Review," in Topics in Energy. Lexington, MA: Data
Resources, Inc.
Tait, A. A. and D. F,. Morgan, 1980. "Gasoline Taxation in Selected OECDCountries," 11MF Staff Papers, pp. 349-379.
Vinod, H. D., 1968. "Econometrics of Joint Production," EcOn, pp. 322-336.
Vinod, H. D., 1976. "Canonical Ridge and Econometrics of Joint Production,"
JE, pp. 147-166.
Wright, B. D., 1980. "The Cost of Tax-Induced Energy Conservation," BJEpp. 84-107.
- 187 -
VI.4 Coal/Lignite
* Coal India Limited, 1976. Coal Price (Approach Paper). Calcutta, India.
* Desai, A. V., 1980b. "Interfuel Substitution in the Indian Economy," Mimeo.
Washington, D.C.: Resources for the Future.
Dun1erley, J.s ed., 1980. International Energy Strategies: Proceedings of
the 1979 IAEE,/RFF Conference. Cambridge, MA: Oelgeschlager, Gunn & Hain.
Energy Modeling Forum (EMF), 1978. Coal in Transition: 1980 - 2000.
Stanford, CA: Stantord University.
Gordon, R. L., 1977. Economic Analysis of Coal Supply: An Assessment of
Existing Studies. Report EA-796, Vol. 2. Palo Alto, CA: EPRI
Gordon, R. L., 1980. "Coal Policy and Energy Economics," EJ pp.77-86.
Government of India, 1980b. Spotlight on Coal: Report of the Committee on
Economics in the Production of Coal (Baveja Committee). Calcutta, India:
K. P. Bagchi and Company.
Grenon, M., ed., 1979a. Future Coal Supply for the World Energy Balance.
Third IIASA Conference on Energy Resources; IIASA Proceedings Series.
Oxford: Pergamon Press.
Griffith, E. D., 1980. "Opportunities and Constraints in the InternationalCoal Trade," in Dunkerley, ed., pp. 419-430.
Griffith, E. D. and A. W. Clarke, 1979 (January). "World Coal Production,"Scientific American, pp.
* Hughes, W. R., 1978. "Coal Price Formation," Mimeo. Boston, MA: CharlesRiver Associates.
Jackson, M. P., 1974. The Price of Coal, London: Croom Helm Ltd.
* Jankowski, J. E., Jr., 1980. "Industrial Energy Conservation in DevelopingCountries," Working paper for ARDEN Project. Washington, DC: Resourcesfor the Future.
* Naganna, N., 1977. "Input Structures through Time; The Case of Coal MiningIndustry," Artha Vijnana, pp. 129-147.
Organization for Economic Cooperation and Development/International EnergyAgency (OECD/IEA), 1978. Steam Coal: Prospects to 2000. Paris.
- 188 -
Ormerod, R. J. and M. J. Sadnicki, 1979. "The Coal Option: A Case Study ofthe UK," in Grenon, ed., 1979a. pp. 512-523.
Pindyck, R. S, 1979d. The Structure of World Energy Demand, MIT Press,
Cambridge, MA: MIT Press.
Reddington, 1980. "The Future of Steam Coal," in Dunkerley, ed., pp. 407-418.
* Sassin, W. and W. Hafele, 1979. "The Role of Coal in the Evolution of the
Global Energy System: A Reference Case," in Grenon, ed., 1979a, pp.
631-649.
* Siddayao, C. M., 1980. "Petroleum and Coal Pricing Policies," Mimeo.
Honolulu: Prepared for the Asian Development Bank Regional Energy Survey
by the East West Center.
Sweeney, J. L., 1975. Passenger Car Use of Gasoline: An Analysis of Policy
Options. Washington, D.C.: U.S. FEA.
* Uri, N. D., 1979a. "Energy Substitution in the UK, 1968-64," EE, pp. 241-244.
* Uri, N. D.., 1979b. "Energy Demand and Interfuel Substitution in India," EER,
pp. 181-190.
* Williams, M. and P. Laumas, 1980. "The Relation between Energy and Non-energy
Inputs in a Developing Economy," mimeo, DeKalb, IL: Northern Illinois
University.
World Bank, The, 1979d. Coal Development, Potential and Prospects in the
Developing countries. Washington, D.C.
World Coal Study (1CCOL), 1980. Coal - Bridge to the Future. Cambridge, MA:Ballinger.
World Energy Conference, 1978d. Coal Resources. Guildford, Surrey, UKi IPC* Science and Technology Press.
Zimmerman, M. B., 1977. "Modelling Depletion in a Mineral Industry: The Caseof Coal," BJE, pp. 41-65.
Zimmerman, M. B., 1979. 'An Economic Interpretation of Coal ReserveEstimates,' IMT-EL 79-048WP. Cambridge, MA: MIT Energy Laboratory.
Zimmerman, M. B., 1981 (forthcoming). The US Coal Industry: The Economics
of Policy Choice. Cambridge, MA: MIT Press.
- 189 -
VI.5 Electricity
* Anderson, D., 1972. "Models for Determining Least-Cost Investments inElectricity Supply," BJE, pp. 267-299.
Anderson, D. and R. Turvey, 1980. "Supply and Demand Uncertainty and OtherIssues in Peak Load Pricing in Electricity Supply," in Dunkerley, ed., pp.433-446.
* Anderson, K. P., 1971. "Toward Econometric Estimation of Industrial Energy.Demand: An Experimental Application to the Primary Metals Industry."R-719-NSF. Santa Monica, CA: Rand.
* Anderson, K. P., 1972b. "Residential Demand for Electricity: EconomicEstimates for California and the United States," R-905, Santa Monica, CA:Rand.
* Anderson, K. P., 1973. "Residential Energy Use; An Econometric Analysis,"R-1297-NSP, Santa Monica, CA: Rand.
Atkinson, S. E. and R. Halvorsen, 1976. "Interfuel Substitution in SteamElectric Power Generation," JPE, pp.
Bajracharya, D., 1979. "Rural Energy Utilization Patterns: SomeObservations from Pangma, Nepal," mimeo, Sussex, UK. Institute forDevelopment Studies.
* Banerjee, N., 1979. Demand for Electricity. Calcutta: K.P. Bagchi & Co.
* Baughman, M. L. and P. L. Joskow, 1974b. Interfuel Substitution in theConsumption of Energy in the United States. Report No. MIT-EL 74-002.Cambridge, MA: NIT Energy Laboratory.
Baughman, M. L. and P. L. Joskow, 1974c. A Regionalized Electricity Model.MIT-EL 75-005. Cambridge, MA: MIT Energy Laboratory.
Baughman, M. L., P. L. Joskow and D. P. Kamat, 1979. Electric Powerin the United States: Models and Policy Analysis. Cambridge, MA: MITPress.
Baumol, W. and D. Bradford, 1970. "Optimal Departures from Marginal CostPricing," AER, pp. 265-283.
* Baxter, R. F. and R. Rees, 1968. "Analysis of the Industrial Demand forElectricity," EcJ, pp. 277-298.
Berndt, E. R., 1978b. "The Demand for Electricity: Comments and FurtherResults," NIT Energy Laboratory Working Paper MIT-EL-78-021WP.
- 190 -
brown, G., Jr. and R. B. Johnson, 19G9. "Public Utility Pricing and output
Under Risk," ARE, pp. 119-29.
Carlton, D. W., 1977. "Peakload Pricing with Stochastic Demand,O AER,pp. 1006-1010.
Christensen, L. R. and W. H. Greene, 1976. "Economies of Scale in U.S.Electric Power Generation," JPE, pp. 655-676.
* Cichetti, C. J. and V. K. Smith, 1975. 'Alternative Price Measures and theResidential Demand for Electricity,' Regional Science and Urban Economics,
pp.
Cichetti, C. J., W. J. Gillen and P. Smolensky, 1977. The Marginal Cost andPricing of Electricity, Cambridge, MA: Ballinger Press.
Cichetti, C. J. and M. Reinbergs, 1979. "Electricity and Natural Gas RateIssues," ARE, pp. 231-258.
Dasgupta, A. K., 1970. "Long Run Marginal Cost of Electricity," Economics ofPlanning, pp.
de la Garza, F. G., A. S. Manne, and J. A. Valencia, 1973. "Multi-levelPlanning for Electric Power Projects," in Goreux and Manne, eds., op.cit., pp. 197-232.
deLucia, R. J., H. D. Jacoby, et. al., 1980. LDC Energy Planning: A Studyof Bangladesh, (Manuscript in review; available from Meta Systems Inc).
Dunkerley, J., ed., 1980. International Energy Strategies: Proceedings ofthe 1979 IAEE/RFF Conference. Cambridge, MA: Oelgeschlager, Gunnand Hain.
Energy Modeling Forum (EMF), 1979. Electric Load Forecasting: Probing theIssues with Models. Vol. 1 Report 3. Stanford, CA: Stanford University.
Energy Modelling. 1974. Comprising the papers presented at a specialworkshop organized by the U.S. National Science Foundation and the EnergyScience and Technology Press.
Fisher, F. M. and C. Yaysen, 1962. A Study in Econometrics: The Demand forElectricity in the United States. Amsterdam: North Holland.
Gately, D., 1971. "Investment Planning for the Electric Power Industry: AMixed Integer Programming Approach," Ph.D. Dissertation. Princeton, NJ:Princeton University.
Gellerson, M. W., 1977. "Marginal Cost-based Electricity Tariffs: Theory andCase Study of India," IER, pp. 163-176.
Goreux, L. and A. S. Manne, eds., 1973. Multilevel Planning - Case Studiesin Mexico. Amsterdam: North Holland.
Government of India, 1979. Interim Report of the Working Group on EnergyPolicy. New Delhi, India.
- 191 -
Government of India, 1980a. Report of the workinq Group on Enerqy Policy.
New Delhi.
Griffin, J. M., 1974. "The Effects of Higher Prices on Electricity
ConsuLmption," BJE, pp. 515-539.
Griffin, J. M., 1977a. "Long-Run Production Modeling with Pseudo Data:
Electric Power Generation," BJE, pp. 112-127.
Griffin, J. M., 1977b. "Interfuel Substitution Possibilities: A Translog
Application to Pooled Data," InER, pp. 755-770.
Halvorsen, R., 1975. "Residential Demand for Electric Energy," RE&S, pp.
12-18.Halvorsen, R., 1976a. "Demand for Electric Energy in the United States."
SEJ, pp. 610-625.
Harberger, A. C. and N. Andreatta, 1964. "A Note on the Economic Principles ofElectricity Pricing," in P. N. Rosenstein-Rodan, ed., Pricing and FiscalPolicies. Cambridge, MA: MIT Press.
Hoffman, K. C. and D. 0. Wood, 1976. "Energy System Modeling andForecasting,"ARE, pp. 423-454.
* Houthakker, H. S., 1951. "Some Calculations of Electricity Consumption in
Great Britain," Journal of Royal Statistical Society, pp. 351-371.
Houthakker, H. S., 1980. "Residential Electricity Revisited," EJ (January),pp. 29-41.
* Houthakker, H. S. and L. D. Taylor, 1970. Consumer Demand in the UnitedStates. Cambridge, MA: Harvard University Press.
* Houthakker, H. S., P. K. Verleger and D. P. Sheehan, 1976. "Dynamic DemandAnalysis for Gasoline and Residential Electricity," AJAE, pp. 412-418.
* Jacoby, H. D., (1967 - Republished in 1979). Analysis of Investment inElectric Power, New York: Arno Press, (Originally author's dissertationat Harvard University and Discussion Paper at Center for International
Affairs, Harvard University, 1967).
* Jacoby, H. D. and M. Lesser, 1980. "Analysis of the Electric Power System,"Chapter 8 in deLucia, Jacoby, et al., op. cit.
Jenkin, F. P., 1974. "Electricity Supply Models," in Energy Modeling, op.
cit., pp. 44-56.
Joskow, P. L., 1976. "Contributions to the Theory of Marginal Cost Pricing,"
BJE, pp. 197-206.
Joskow, P. L. and F. S. Mishkin, 1977. "Electric Utility Fuel Choice Behaviorin the United States," InER, pp.
- 192 -
Kahn, E., M. Davidson, A. Makhijani, p. Caesar and C. M. Berrman, 1976.Investment Planning in the Energy Sector. Berkeley, CA: LawrenceBerkeley Laboratory.
Lahiri, S., 1977. "Investment Planning for the Electric Power Industry inNorthern India: A Spatial Programming Approach," IER, pp.
Lieftinck, P., A. R. Sadiver and T. C. Creyke, 1969. Water and PowerResources of West Pakistan. 3 Vols. Baltimore, MD: Johns HopkinsUniversity Press.
Lyman, R. A., 1978. "Price Elasticities in The Electric Power Industry,"ES&P, pp. 381-406.
Macrakis, M. S., ed., 1974. Energy Demand, Conservation, and InstitutionalProblems, Cambridge, MA: MIT Press.
Mount, T. D., L. D. Chapman and T. J. Tyrell, 1973. "Electricity Demand inThe United States: An Econometric Analysis," ORNL-NSF-EP-49. Oak Ridge,TN: ORNL.
Mount, T. D., Chapman, L. D. and T. J. Tyrrell, 1974. "Electricity Demand inthe United States: An Econometric Analysis," in Macrakis, ed., pp.318-329.
Munasinghe, M., 1979a. Optimum Economic Power Supply Reliability, StaffWorking Paper 311. Washington, DC: The World Bank.
Munasinghe, M., 1979b. Electric Power Pricing Policy. Staff Working Paper340. Washington, DC: The World Bank.
Munasinghe, M., 1979c. The Economics of Power System Reliability andPlanning. Baltimore, MD: Johns Hopkins University Press for The WorldBank.
Munasinghe, M., 1980a. "An Integrated Framework for Energy Pricing inDeveloping Countries," EJ, pp. 1-30.
Munasinghe, M., 1980b. "A New Approach to Power System Planning," IEEE,Transactions on Power Apparatus and Systems, pp. 1198-1206.
Munasinghe, M., 1980c. "Electric Power, Energy Pricing, and Investment Policyin Developing Countries," in Dunkerley, ed., pp.
Munasinghe, M., 1980e. "Planning for Electrical Power: Costs andTechnologies," Modern Government/National Development, pp. 75-84.
Munasinghe, M., 1980f. "Optimal Investment Planning and Pricing PolicyModelling in the Energy Sector: Electric Power," Paper presented at theInternational Seminar on Resource Policy Modelling, Israel, December 28-31.
Munasinghe, M. and G. Schramm 1980. "Power-Energy Pricing Case Studies,"(Draft), Mimeo. Washington, DC: The World Bank.
- 193 -
Manasinghe, M. and J. Warford, 1978. Shadow Pricing and Power Tariff Policy,
Staff Working Paper 286. Washington, DC: The World Bank.
Munasinghe, M. and J. J. Warford, 1981 (forthcoming). Electricity Pricing in
Developing countries. Baltimore, MD: Johns Hopkins University Press.
Munasinghe, M. and C. Warren, 1980. "Rural Electrification, Energy Economicsand National Policy in Developing Countries," IEE InternationalConferenco on Future Energy ConCepts, (London, Jan-eb, 1980).
Nelson, J. R., ed., 1964. Marginal Cost Pricing in Practice, EnglewoodCliffs, NJ: Prentice Hall.
Nordhaus, W. D., ed., 1977. International Studies of the Demand for Energy.New York: North-Holland.
Pachauri, R. K., 1975. The Dynamics of Electrical Energy Supply and Demand,New York: Praeger.
Panzar, J. C., 1976. "A Neo-Classical Approach to Peak Load Pricing," BJE,pp. 521-530.
Pressman, I., 1970. "A Mathematical Formulation of the Peak-Load PricingProblem," BJE, pp. 304-326.
Ramsay, W., 1979. Unpaid Costs of Electricity Generation: Health and
Environmental Impacts from Coal and Nuclear Power. Baltimore: Johns
Hopkins University Press for Resources for the Future.
Renshaw, E. F., 1979. "The Pricing of Off-Peak Power," EE, pp. 144-147.
* Smith, V. K., 1980. "Estimating the Price Elasticity of U.S. Electricity
Demand," EE, pp. 81-85.
* Smith, V. K. and C. J. Cicchetti, 1975. "Measuring the Price Elasticity of
Demand for Electricity: The U.S. Experience," in C. J. Cicchetti and W.
K. Foell, eds., Energy Systems: Forecasting, Planning and Pricing,
Madison, WI: Institute for Environmental Studies.
* Taylor, L. D., 1975. "The Demand for Electricity: A Survey," BJE, pp. 74-110.
* Taylor, L. D., 1977. "The Demand for Energy: A Survey of Price and Income
Elasticities," Ch. 1 in Nordhaus, ed., pp. 3-44.
Turvey, R., 1965. "On Investment Choices in Electricity Generation," OEP, pp.
279-286.
Turvey, R., 1968. Optimal Pricing and Investment in Electricity Supply.Cambridge, MA: MIT Press.
* Turvey, R and D. Anderson, 1977. Electricity Economics: Essays and Case
Studies. Baltimore, MD; The Johns Hopkins Press for The World Bank.
- 194 -
United States Federal Energy Administration (FEA), 1974. Project Independence
Report. Washington, D.C: U.S. GPO.
Uri, N. D., 19 79c. "Price Expectations and the Demand for Electric Energy,"ES&P, pp. 73-
Uri, N. D., 1979d. "A Mixed Time-series Econometric Approach to ForecastingPeak System Load," JE, pp.
Uri, N. D., 1980b. "Directional Causality in the Demand for Electrical Energyin the United States," ES&P, pp. 353-365.
van der Tak, H. G., 1966. The Econ6mic Choice Between Hydroelectric andThermal Power Developments. Washington, D.C.: The World Bank.
Vickrey, W., 1980. "Responsive Pricing Based on Marginal Cost as a Means ofPromoting Efficient Energy Use," in Dunkerley, ed., pp. 455-
Williamson, 0. E., 1966. "Peak Load Pricing and Optimal Capacity UnderIndivisibility Constraints," AER, pp. 810-827.
* Wilson, J. W., 1971. "Residential Demand for Electricity," Quarterly Reviewof Economics and Business, pp. 7-22.
* World Bank, The, 1979e. India: Economic Issues in the Power Sector.Washington, D.C.
- 195 -
VI.6 Renewable Energy Resources
Adams, J. and W. E. Tyner, 1977. "Rural Electrification in India:Biogas Versus Large-Scale Power," Asian Survey, pp.
Ashworth, J. M., 1979. "Renewable Energy Sources for the World's Poor: AReview of Current International Development Assistance Programs," Golden,CO: Solar Energy Research Institute.
Bajracharya, D., 1980. "Fuel Wood and Food Needs vs. Deforestation:An Energy Study of a Hill Village Panchayat in Eastern Nepal" in EnergyAnalysis in Rural Regions:' Studies in Indonesia, Nepal and thePhilippines. Part III. Honolulu, Hawaii: East-West Center.
Barnett, A., L. Pyle and S. K. Subramaniam, 1978.. Biogas Technology in theThird World: A Multidisciplinary Review. Ottawa: InternationalDevelopment Research Center.
Benemann, J. R., 1980. "Biomass Energy Economics," EJ, pp. 107-128.
Bhatia, R., 1980a. "Energy Alternatives for Irrigation Pumping: Some Resultsfor Small Farms in North Bihar," Paper presented at International Seminaron Energy, Hyderabad, November 1979. (Revised March, 1980).
Bhatia, R., 1980b. "Fuel Alcohol from Agro-Products: A Conceptual Frameworkfor a Study in India and Papua, New Guinea," Draft, Department of Cityand Regional Planning, Cambridge, MA: Harvard University.
Bhatia, R. and M. Niamir., 1979. "Renewable Energy Sources: TheCommunity Biogas Plant," mimeo. (draft), (Revised 1980) Cambridge, MA;Harvard University.
Bhavani, S., 1976. "Biogas for Fuel and Fertilizers in Rural India -- ASocial Benefit Cost Analysis," Indian Journal of Agricultural Economics,PP.
Bialy, J., 1979. "Firewood Use in a Sri Lankan Village: A PreliminarySurvey." Edinburgh, Scotland: University of Edinburgh.
Briscoe, J., 1979a. "Energy Use and Social Structure in a BangladeshVillage," PDR, pp.
Brokensha, D. and Z. Riley, 1978. "Forest, roraging, Fences and Fuel in aMarginal Area of Kenya.1 A paper prepared for USAID Africa EureauFirewood Workshop. Washington, DC, June 12-14.
- 196 -
Brown, H. and K. R. Smith, 1980. "Energy for the People of Asia and
the Pacific," ARE, pp. 173-240.
Brown, N. L., 1980. "Renewable Energy Resources for Developing Countries,"
ARE, pp. 389-413.
deLucia, R. J., 1980a. "Rural Energy Survey Requirementas Some Comments
and Perspectives." Discussion paper prepared for the Workshop on Energy
Survey Methodologies, Board on Science and Technology for International
Development of the National Academy of Sciences. Jekyll Island, GA.
deLucia, R. J., 1980b. "Fuelwood Surveys: Perspectives on Defining theScope." Prepared for Monograph Guidelines for Wood Fuel Surveys. Rome:
FAO.
deLucia, R. J., H. D. Jacoby, et. al., 1980. LDC Energy Planning: A Study
of Bangladesh, (Manuscript in review; available from Meta Systems inc).
deLucia, R. J. and M. Lesser, 1980. "Energy from Organic Residues in
Developing Countries: Present Use, Potential, and Observations onFeasibility," Paper presented at the World Bio-Energy Conference,
Atlanta, GA.
deLucia, R. J. 4nd R. T. Tabors, 1980a. "Traditional and Renewable EnergySources," Chapter 4 in deLucia, Jacoby, et al., op. cit.
DiGernes, T., 1977. "Energy Crisis Implying Desertification: The Case of
Bara, The Sudan." Geografisk Institutt. Universitet Bergen.
Fleuret, P. and A. Fleuret, 1978. "Fuelwood Use in a Peasant Community:Tanzanian Case Study," Journal of Developing Areas, pp. 315-322.
Food and Agricultural Organization of the U.N. (FAO), 1979. Economic Analysisof Forestry Projects. Rome: FAo.
French, D., 1979. "The Economics of Renewable Energy Systems for DevelopingCountries," mimeo. Washington, D.C.: USAID.
Georgia Institute of Technology, 1977. Recent Efforts to Develop Simple
Wood-Burning Stoves: A State of the Art Survey of Solar Powered
Irrigation Pumps, Solar Cookers and Woodburning Stoves for Use in
Sub-Sahara Africa, Athens, GA.
Ghate, P. B., 1979. "Biogas: A Decentralized Energy System,' EPW,
pp.
Ghate, P. B., 1980. "Irrigation for Very Small Farmers: Appropriate
Technology or Appropriate Organization?," EPW, pp. A-161-171.
Hodam Associates, 1980. Cogeneration of Process Heat and Electricity fromRice Hulls in the Philippines. Old Sacramento, CA.
Indian Council of Agricultural Research, 1976. The Economics of Cow Dung GasPlants: A Report. New Delhi, India.
- 197 -
Kuether, D. 0. and B. Duff, 1979. "Energy Requirements for Alternative Rice
Production Systems in the Tropics." Paper presented at the Annual Meeting
of the Society of Automotive Engineers, Wisconsin.
Meta Systems Inc., 1978b. Traditional Energy and Rural Development Issues and
Recommendations for Peru, Prepared for Brookhaven Vational Laboratory and
U.S. Department of Energy. Cambridge, MA.
Meta Systems Inc., 19 78c. "Traditional Fuels: Supporting Materials for the
World Development Report," Much of this material is incorporated in
Prospects for Traditional and Non-Conventional Energy Sources in
Developing Countries, World Bank Staff Working Paper No. 346. Washington,
DC: The World Bank.
* Meta Systems Inc., 1980c. State-of-the-Art Review of Economic Evaluation of
Non-conventional Energy Alternatives. Bioresources for Energy Project,
U.S. Department of Agriculture.
Mubayi, V., J. Lee and R. Chatterjee, 1980. 'The Potential of Biomass Con-version in Meeting the Energy Needs of the Rural Populations of Developing
Countries - An Overview,' in J.L. Jones and S.B. Radding, eds., Thermal
Conversion of Solid Wastes and Biomass, ACS Symposium Series 130.
Washington, D.C.: American Chemical Society.
National Council of Applied Economic Research (India), 1965. Domestic FuelConsumption in Rural India. New Delhi.
National Council of Applied Economic Research, 1978 (Feb). Survey of RuralEnergy Consumption in Northern India. New Delhi.
Nilsson, N. E., 1980. "Outline of Potential Supply of Renewable Energy from
Wood/Biomass Resources within some of the Member Countries of AsianDevelopment Bank," Mimeo, prepared for ADB Regional Energy Survey.
Manila, Philippines: Asian Development Bank.
Parikh, J. K. and K. S. Parikh, 1977. 'Mobilization and Impacts of Bio-gasTechnologies," En, pp. 441-455.
Parikh, K. S. and J. K. Parikh, 1977. Potential of Biogas Technology,
Laxenburg, Austria: IIASA.
Prasad, C. R., K. K. Prasad and A. K. N. Reddy, 1976. "Biogas Plants:Prospects, Problems and Tasks," EPW, pp.
Revelle, R., 1976. "Energy Use in Rural India," Science, pp. 969-975.
Revelle, R., 1978. "Requirements for Energy in the Rural Areas of Developing
Countries," in N. L. Brown, ed., Renewable Energy Resources and Rural
Applications in the Developing World, Boulder, CO: American Association
for the Advancement of Science.
- 198 -
Revelle, R., 1979. 'Energy Sources for Rural Development,' EN, pp. 969-987.
Rogers, P. and C. Hurst, 1980 (Oct.)0 "Engines for Development III: The Caseof Self Energized Irrigation Pump," Mimeo, Center for PopulationStudies. Cambridge, MA: Harvard University.
Sanghi, A. K. and D. Day, 1976. 'A Cost-Benefit Analysis of Biogas Productionin Rural India: Some Policy Issues,' Mimeo, St. Louis, MO: WashingtonUniversity.
United States Agency for International Development (USAID), 1980. PhilippinesReforestation/Rural Energy Project. Washington, D.C.
World Bank, The, 1979a. Prospects for Traditional and Non-Conventional EnergySources in Developing Countries. Staff Working Paper 346. Washington,D.C.
- 199 -
ANNEX: A METHODOLOGICAL NOTE ON THE SCOPE OF REVIEW ANDLITERATURE SEARCH AND SELECTION
Preparation of the bibliography and its classification by majorsubject areas discussed in this review were interwoven tasks. The conceptual
framework - listing of major areas, sub-areas, and their linkages - in Table
II.1 formed the basis for the literature search. 1/ We were principallyguided by this framework in selecting literature for inclusion in the
bibliography, and for extending searches in a particular direction.
What we have gathered here should be viewed as focusing on the
analysis of issues of energy pricing in oil-importing developing countries,subject to the conceptual framework adopted by the reviewers (as to what
interlinkages ought to exist conceptually, even if these are not recognizedor explicitly analyzed in literature). Even with this focus, it would be
difficult to describe what we have chosen to ignore, but the major omissions
can be mentioned.
We have chosen to ignore the literature on overall macrofinancial
impacts of energy price rises (balance-of-payments, domestic inflation),on nuclear energy developments and trade in nuclear technologies and on
environmental impacts of various energy technologies and alternative patterns
of energy usage. Next, we limit our focus primarily to economic analyses;those which are more technological-oriented or deal with political-insti-
tutional contexts and scenarios (as in the case of the world petroleum market)
have been excluded. Similarly, descriptive studies on energy planning and
policy which focus on the institutional contexts and planning recommendationshave been ignored. Some areas are only peripherally touched, although theseare important and bear on the subjects we discuss; one such example is theenvironmental/ecological impact of fuelwood usage in developing countries.Since our purpose was not so much to discuss whether fuelwood is a viableenergy resource option as how fuelwood can be priced, or what policy consi-derations are involved in social forestry schemes for fuelwood/charcoal,
we chose to ignore the deforestation/desertification aspect of fuelwood
usage.
Two main criteria were employed in both selection of articles/
books for inclusion in the bibliography and for review: (1) Analyticalcontent: Studies which had special analytical content relevant to the
subjects at hand were easily chosen; those which had no special advancement
or innovations were cited in footnotes along with the more important ones
reviewed in the text. We have consciously tried to avoid a bias towards formal,
quantitative modeling, partly because some of the very sophisticated modeling
1/ The question we initially asked was: given this framework, how do
we best perform a literature search, and, conversely, given our resources
and what we find in the literature, do we need to modify our thinking
so that the usefulness of literature is maximized?
- 200 -
studies may not be useful in developing countries, where the kinds of ques-tions one may wish to analyze are quite different, and because they rarelytouch on pricing policy and project evaluation questions. (2) PotentialRelevance to, or Applicability in Developing Country Contexts: we made anextensive effort to locate the accessible work done on developing countries'energy problems, with special reference to pricing and project evaluationquestions. Thus projections of energy demands, studies of interfuelsubstitution in energy usage patterns and income and price elasticitiesof energy consumption, etc. were particularly searched for. However, asmentioned before, macrofinancial aspects were ignored, and the literatureon energy data and statistics, on constructing energy balances, and pre-paring overall energy profiles was also omitted.
As much as possible, empirical studies were searched for andincluded in both bibliography and review. Most empirical literature avail-able to us was on the US, some of which was included in review; some litera-ture is also available for Canada, the UK, and the Netherlands, which wasmostly neglected because we did not find a good enough volume of materialfor comparative evaluation. We have relied on secondary sources for thispurpose.
The following steps were taken in further literature search andsolution.
1. Direct, manual library searches in books and periodicals.A large number of journals were searched through for thelast ten years or so to find articles relevant to ourdiscussion. The following journals principally coverenergy economics and policy-related research. Energy, EnergyEconomics, Energy Journal, Energy Policy, Resources and Energy,and Journal of Energy and Development. In addition, two annualpublications, Annual Review of Energy and Advances in the Economicsof Energy and Resources are also extremely useful for largerresearch articles and surveys. Both Energy Economics and EnergyPolicy provide a list of new publications and meetings/ conferenceswhich helps keep abreast of on-going research.
2. The Computerized Literature Search Service (CLSS) at MITlibraries was used to search the Energy Data Base providedby the Department of Energy, the NTIS Data Base, and the EAI(Economic Abstracts International) Data Base. The first twocover most of the energy-related research in the United States,whereas EAI covers literally hundreds of economics and businessperiodicals (and yet, not all that we did search manually).CLSS printouts mostly included what we have already coveredthrough manual library searches, though their abstractswere particularly useful in deciding if we wanted to pursuegetting an article or a report and if we wanted to includethem in our review.
- 201 -
3. Finally, several (= 80 to 100) individuals in academicas well as international organizations were contacted bytelephone or letter to inquire on their own work on relatedsubjects (or what they knew of). The responses varied, andin some cases we were able to obtain some "work-in-progress"material.
The best way of ensuring comprehensiveness of a literature searchis extending one-s search from the references in what one already has, oncea sizeable amount of materials is collected by library catalog search, shelfsearch and journal searches. When one finds these references becoming aclosed set, with each article mainly referring to other articles alreadyincluded, the search is more or less comprehensive. When we encounteredsuch a situation, we concluded that further investment in literature searchwould yield low marginal returns, and these returns would be subject to greatuncertainty. This choice was somewhat arbitrary, but the need for a specificcut-off point was obvious. That we were justified in our decision was con-firmed by the CLSS printouts (last search performed in the final week ofDecember, 1980), which failed to force out a single significant work we hadnot known of before.
Related Documents