ENERGY POLICY OF GUYANA PREPARED BY THE NATIONAL ENERGY POLICY COMMITTEE July 1994

Welcome message from author
This document is posted to help you gain knowledge. Please leave a comment to let me know what you think about it! Share it to your friends and learn new things together.
Transcript
ENERGY POLICY
OF GUYANA
PREPARED BY
THE NATIONAL ENERGY POLICY COMMITTEE July 1994


CONTENTS
Page
1. Foreword
2. Executive Summary
3. Energy Situation for the Period 1988-1992
4. Future Outlook 1994-2004
5. Implementation and Financing
Table: 3.1 – 3.6
4.1 – 4.8
Figures: 3.1 – 3.17
4.1 – 4.14
Appendix 1: List of Members of the Energy Policy Committee

PART 1
FOREWORD

ENERGY POLICY PAPER FOR GUYANA – PART 1 – FOREWORD
1. FOREWORD
This document was prepared by a select committee, comprising technicians from key agencies in the
Energy Sector in Guyana, which are responsible for energy research, petroleum exploration and
development, preparation, implementation and management of energy projects and programmes, electricity
generation, transmission and distribution and energy conservation. A list of the members of the committee
is included at Appendix 1.
In preparing this document, the existing databases at the relevant agencies were used. Information was also
obtained from major producers and consumers of energy on their plans and programmes for the next
decade.
Due to the lack of precise data in some areas, it has been necessary to make several essential assumptions.
It is important to recognize that the energy policy herein is a dynamic one and is subject to change as
additional data and information on development programmes become available.
For the purposes of presentation, this document is divided into four sections:
(i) EXECUTIVE SUMMARY – which highlights the main focus of the document.
(ii) ENERGY SITUATION FOR THE PERIOD 1988 – 1992: - which provides relevant
information/ data on the energy/ economic situation for the period 1988 – 1992. Data for 1993
were not available in time for inclusion in this document.
(iii) FUTURE OUTLOOK 1994 – 2004: - which projects the energy demand / supply scenario for
the period 1994 – 2004. It also includes the major policy options and the strategies to be
pursued.
(iv) IMPLEMENTATION / FINANCING – which describes the implementation schedule and
possible financing mechanisms.
ENERGY POLICY PAPER FOR GUYANA – PART 1 – FOREWORD
The policy committee wishes to acknowledge the cooperation of several firms / organizations which provided
vital information / data to facilitate the preparation of this document. These include:
- Linden Mining Enterprise (LINMINE)
- Berbice Mining Enterprise (BERMINE)
- Guyana Sugar Corporation (GUYSUCO)
- Guyana Electricity Corporation (GEC)
- Guyana Airways Corporation (GAC)
- Guyana Forestry Commission
- Georgetown Seafoods Ltd.
- Omai Gold Mines Ltd.
- Barama Company Ltd.
- Aroaima Mining Company Ltd.
- Ministry of Agriculture ( Planning and Fisheries Dept.,)
- Texaco, West Indies Ltd.
- Bank of Guyana
- Licence & Revenue Department

PART 2
EXECUTIVE SUMMARY

ENERGY POLICY PAPER FOR GUYANA – PART 2 – EXECUTIVE SUMMARY
2. EXECUTIVE SUMMARY
This Energy Policy Paper highlights the energy situation during the period 1988 – 1992, and the projections for
the period 1994 – 2004. It also focuses on the strategies to be implemented to achieve the stated objectives, the
implementation schedule and possible sources of financing.
Energy Situation for the Period 1988 – 1992
Between 1988 and 1992, final energy consumption increased by 3.2 % whereas per capita energy consumption
increased by approximately 3.0 %.
During this period, petroleum products, bagasse and fuelwood provided the energy supply required. An
analysis of the sectoral use of energy supply indicates that electricity generation, industry / mining,
transportation, and the residential sectors represented the major users.
ENERGY BY SOURCE
SOURCE 1988 1992
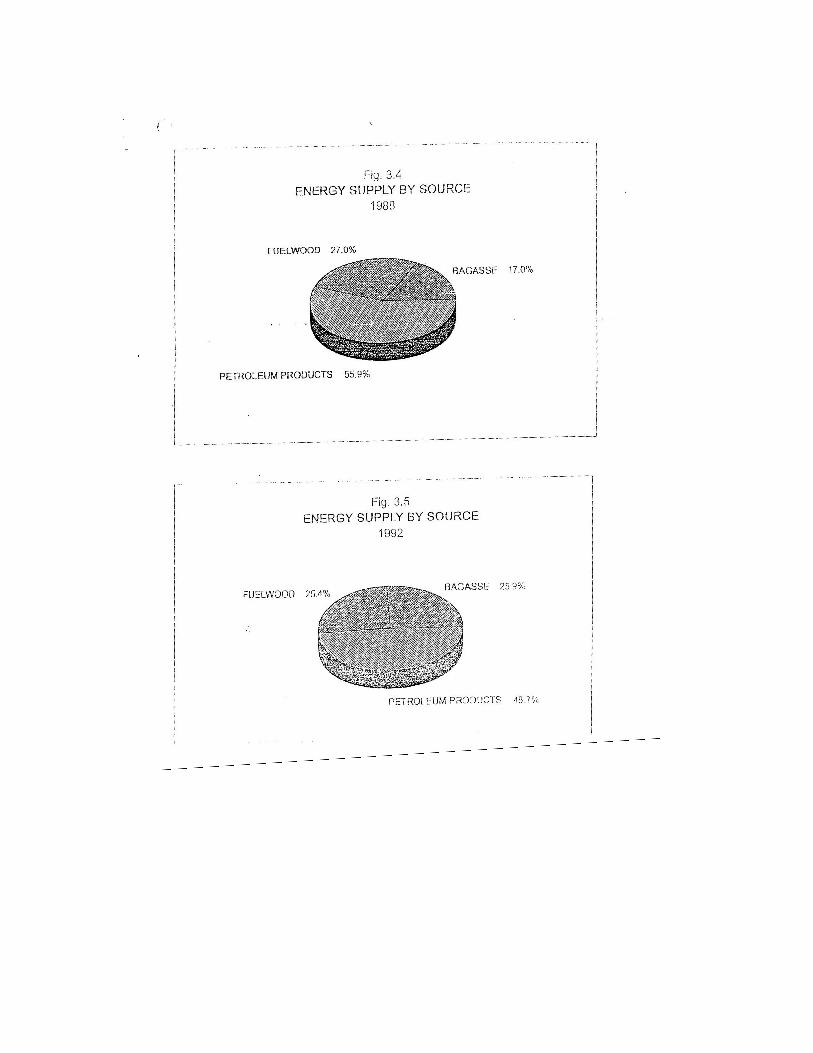
Petroleum Products 55.9% 48.7%
Bagasse 19.0% 25.9%
Fuelwood 27.0% 25.4%

ENERGY POLICY PAPER FOR GUYANA – PART 2 – EXECUTIVE SUMMARY
SECTORAL USE OF ENERGY
SECTOR 1988 1992
Electricity 21.3% 24.5%
Industry / Mining 32.1% 34.8%
Transportation 11.4% 9.67%
Residential 28.3% 25.7%
Agri / Fishing 6.3% 4.8%
Commercial / Public 0.4% 0.4%
Charcoal 0.2% 0.2%
The importation of petroleum products in 1988 was 3,364,000 barrels, representing a CIF value of US$63.53
Million while in 1992 the corresponding figures were 2,691,000 barrels and US$61.47 Million. A breakdown
of average consumption for 1988 – 1992 shows that electricity generation (30%), industry / mining (33%),
transportation (20%) and agriculture / fishing (11%) were the major sectoral users. Fuel Oil / Bunker ‘C’
(45%), diesel/ gasoil (30%) and premium gasoline (14.5%) were the major types of petroleum products.
The indigenous energy resources which contributed significantly to the energy supply were begasse (for co-
generation in the sugar industry) and fuelwood (for the residential sector). Other resources (hydropower,
woodwaste, rice-husk, wind, solar) while available, did not contribute significantly to the energy supply.
ENERGY POLICY PAPER FOR GUYANA – PART 2 – EXECUTIVE SUMMARY
Future Outlook 1994 – 2004
The objectives of the National Energy Policy are:
- to provide stable, reliable and economic supply of energy
- to reduce dependency on imported fuels
- to promote where possible the increased utilization of domestic resources
- to ensure energy is used in an environmentally sound and sustainable manner.
Based on the demand forecast, the following are projected:
(i) Final energy consumption is expected to grow as the economy grows. Between 1992 and 1998,
total final consumption of energy is projected to increase by 7.3% while in 2004 an increase of
2.1% over 1998 is projected.
(ii) Between 1992 and 1998, consumption of electricity is expected to increase annually by 6%.
Thereafter, the growth rate is expected to be in the vicinity of 2.5% per annum.
(iii) Final consumption of petroleum products is expected to grow annually at an average rate of just
below 2% between 1992 and 1998. Thereafter, the average annual increase is projected below 1%
up to 2004.
Strategies for Satisfying Energy Demand
To satisfy the energy demand forecast for 1998 and 2004 and the objectives outlined, the strategies to be
adopted would include the promotion of and where feasible, the increased utilization of indigenous energy
resources (bagasse, woodwaste, rice-husk, hydropower), more efficient utilization of energy, continued oil
exploration activities and the establishment of energy farms to provide fuelwood.
ENERGY POLICY PAPER FOR GUYANA – PART 2 – EXECUTIVE SUMMARY
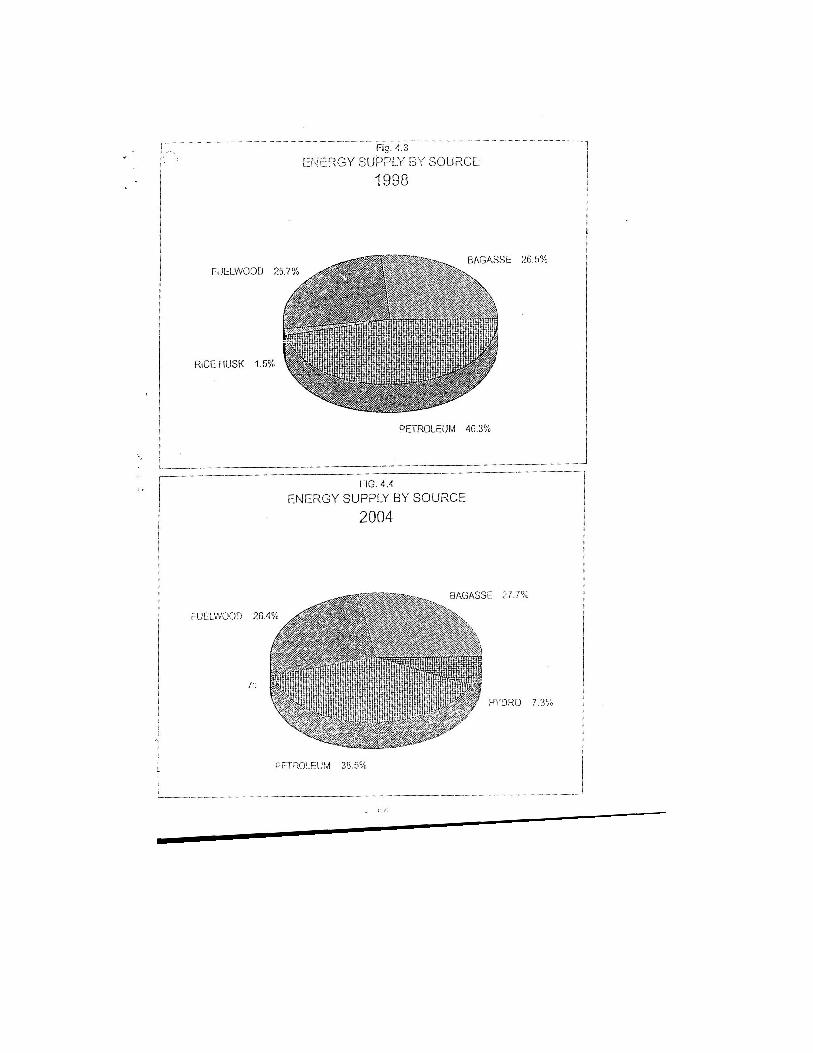
As a result of the strategies to be pursued, energy supply for 1998 will be provided by indigenous resources,
53.7% and imported petroleum products, 46.3%. By 2004, these figures are projected at 61.5% and 38.5%,
respectively. Despite an overall increase in energy demand of 9.4% between 1992 and 2004, the use of
imported petroleum products is projected to decline by 26% during this period. This decline does not take into
account the effect of energy conservation measures to be pursued. It is essentially due to increased utilization
of indigenous resources and thus less dependence on petroleum products for electricity generation. More
specifically, power generation will increase from 50 MW in 1992 to 128 MW in 2004, with a corresponding
reduction of the fuel bill in this sector from US$17.9 Million in 1992 to US$0.7 Million in 2004, representing a
reduction of 95% of the Dollar value of the fuel bill in this sector.
Implementation Schedule / Financing
The various activities and time-frame envisaged for the achievement of the objectives of the National Energy
Policy are included in the implementation schedule. The formation of the Energy Agency is absolutely
necessary for the successful implementation of the Policy. The projected time-frame for the activities could
vary depending on the efficiency with which related activities are carried out.

PART 3
ENERGY SITUATION FOR THE PERIOD
1988 – 1992
3.1 ECONOMIC GROWTH AND FINAL ENERGY CONSUMPTION
3.2 ENERGY SUPPLY BY SOURCE OF ENERGY
3.3 ENERGY SUPPLY AND SECTORAL USE
3.4 DOMESTIC ENERGY RESOURCES
3.5 ENERGY IMPORTS
ENERGY POLICY PAPER FOR GUYANA – PART 3 – ENERGY SITUATION 1988 – 1992
3. ENERGY SITUATION FOR THE PERIOD 1988 – 1992
3.1 ECONOMIC GROWTH AND FINAL ENERGY CONSUMPTION
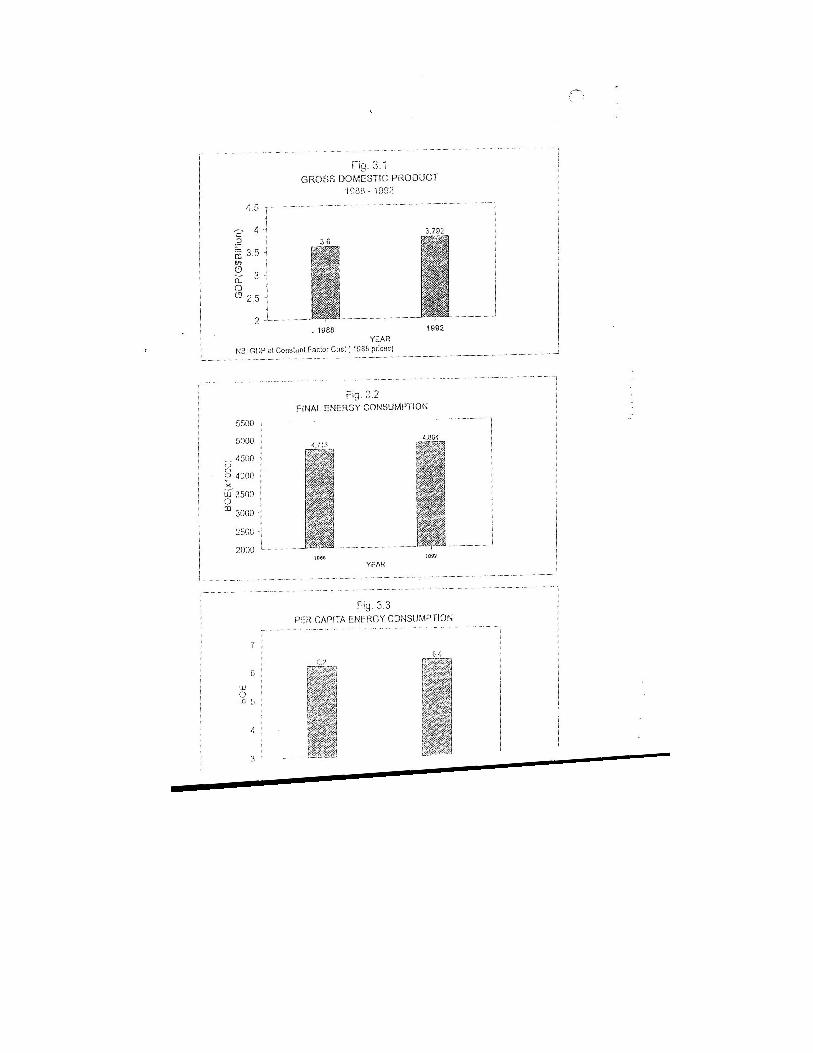
During the period 1988 to 1992, Gross Domestic Product (GDP) at constant factor cost (1988 prices) and total
final energy consumption revealed an increasing trend. GDP increased from G$3.6 Billion in 1988 to G$3.792
Billion in 1992, reflecting an increase of 5.3%. This is illustrated in Fig. 3.1. In 1988, the total final energy
consumption was 4,713,000 barrels of oil equivalent (BOE) and in 1992, it was 4,864,000 BOE as shown in fig.
3.2. This represented an increase of 3.2%
In addition, Fig. 3.3 indicates that per capita energy consumption increased during the period 1988 to 1992 from
6.2 BOE to 6.4 BOE, an increase of 3.2%.
3.2 ENERGY SUPPLY BY SOURCE OF ENERGY
The supply of petroleum products decreased from 3,252,000 BOE to 2,996,000 BOE for the period 1988 to
1992 (see Table 3.1), a decline of 7.9%. This decline could be explained by the dramatic reduction in the
production of bauxite and the concomitant reduction in energy consumption in that industry, as well as a decline
in consumption of motor gasoline due to the increased availability of mini buses and resultant reduced
dependence on hire cars. In addition, relatively higher retail prices of gasoline due to decontrol and the
devaluation of the Guyana dollar have led to more rational use of petroleum products.
Bagasse supply, which is directly related to sugar cane production, increased from 980,000 BOE in 1988 to
1,596,000 BOE in 1992.
ENERGY POLICY PAPER FOR GUYANA – PART 3 – ENERGY SITUATION 1988 – 1992
Fuelwood supply, in absolute terms, is estimated to have increased by merely 1.2% between 1988 and 1992.
However, during this period, as a percentage of total energy supply, fuelwood decreased by approximately
2%.
The percentage distribution of energy supply by source is illustrated in Table 3.1, and Figs. 3.4 and 3.5 for
the years 1988 and 1992, respectively. In 1988, fuelwood and bagasse taken together represented 44% of
total energy supply, compared with 51.3% in 1992. In fact, fuelwood and bagasse supply taken together
increased by 25% in absolute terms during this period. Petroleum supply reduced by 7.9%.
3.3 ENERGY SUPPLY AND SECTORAL USE
Tables 3.2 and 3.3 and Figs. 3.6, 3.7, 3.8, and 3.9 provide data on the Sectoral Use of Energy supply for the
years 1988 and 1992. From these tables and figures, it should be noted that Industry / Mining, electricity
generation, residential and the transportation sectors accounted for 93.4% of the utilization of energy supply in
1988 and 94.6% in 1992. Each of the sectors mentioned is analysed below:
(a) Industry / Mining Sector
In 1988, Industry / Mining accounted for 32.1% of total use of energy as compared with 34.8% in 1992.
Petroleum products represented 57.1% and bagasse 39.8% of energy utilized in this sector in 1988. For 1992,
the corresponding figures were 41.1% and 55.9%
These figures indicate that, in the Industry / Mining Sector from 1988 to 1992, there was a relative increase in
the utilization of bagasse and decreased utilization of petroleum products. As mentioned before, this was due to
drastic reduction in bauxite production and a concomitant decline in the utilization of petroleum products in this
Sector.
ENERGY POLICY PAPER FOR GUYANA – PART 3 – ENERGY SITUATION 1988 – 1992
(b) Electricity Sector
In 1988, the electricity Sector accounted for 21.2% of total use of energy as compared with 24.5% in 1992.
Petroleum products represented 80% and bagasse 20% of resources used to generate electricity in 1988. By
1992, these figures changed to 70.8% and 26.5%, respectively.
In the Electricity Sector, petroleum products have been the major source of energy (70% - 80%). During this
period there was approximately 10% decrease in the utilization of petroleum products and increased bagasse
utilization of 64%. It must be noted that increased utilization of bagasse was mainly due to inefficient
utilization of this energy source.
(c) Residential Sector
In 1988, the Residential Sector accounted for 28.3% of total use of energy as compared with 25.7% in 1992.
Fuelwood represented 90.9% and petroleum products 9.1% of energy utilized in this sector in 1988. By 1992,
these figures changed to 91.2% and 8.8%, respectively.
(d) Transportation / Agriculture and Fishing Sectors
In 1988, the Transportation / Agriculture and Fishing Sectors accounted for 17.4% of total use of energy as
compared with 14.4% in 1992. Petroleum products represented the only energy source used in these two
sectors.
ENERGY POLICY PAPER FOR GUYANA – PART 3 – ENERGY SITUATION 1988 – 1992
3.4 DOMESTIC ENERGY RESOURCES
The only fossil fuel occurring in Guyana is Petroleum. However, these resources have not yet been
quantified and there is no commercial exploitation at this time.
Economic potential for hydropower is estimated to be in the region of 7000MW. This resource is not being
exploited currently but clearly, the solution to the country’s long term power needs lies in hydro-energy.
Forests cover approximately 75% or 16 million hectares of the country’s land area. However, active
encouragement of increased fuelwood consumption would have to be tempered by environmental concerns.
In-situ woodwaste from the Timber Industry remains a viable potential source of energy. At the current
time, two lumber enterprises generate a total of 3 MW of power from woodwaste for their industrial uses.
Bagasse is currently utilized, albeit inefficiently, for the co-generation of steam and electricity in the sugar
industry. An analysis of the true potential of this energy source has been carried out and efforts are being
made to maximize the benefits.
Rice Husk is also a viable potential source of energy and is currently used by two rice millers for steam and
electricity generation (approximately 1 MW). This resource needs to be developed further.
Currently, solar and wind play a very minimal role in Guyana’s energy spectrum, but their potential
contribution cannot be disregarded in the long term.
Biogas digesters provide methane gas for cooking and refrigeration. In the residential sector, the impact is
more social and environmental rather than economic. The cost of construction of these digesters must be

ENERGY POLICY PAPER FOR GUYANA – PART 3 – ENERGY SITUATION 1988 – 1992
reduced considerably for any major economic impact in the residential sector. For large commercial and
agricultural enterprise, this technology can be cost-effective.
3.5 ENERGY IMPORTS
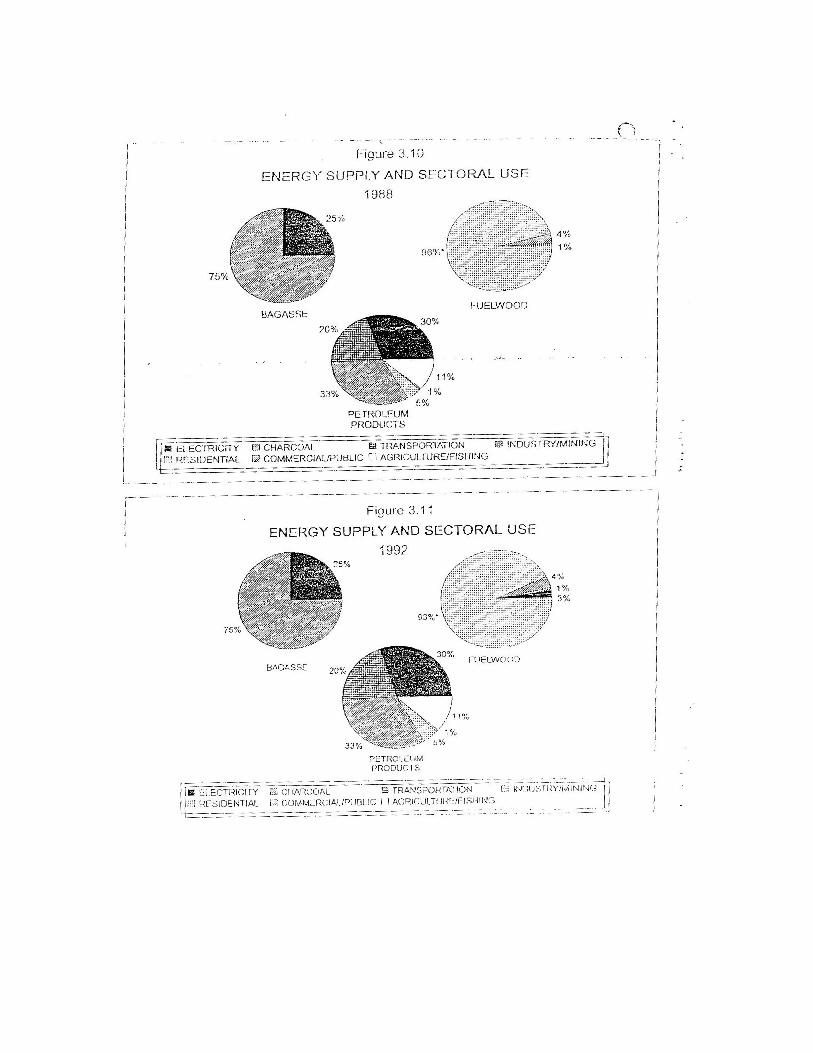
Fig. 3.10 and fig. 3.11 provide information on the utilization of the major energy sources in the various
sectors during the period under review, 1988 and 1992. In the case of petroleum products, approximately
94% of all the imported fuels is being used by the electricity (30%), transportation (20%), industry / mining
(33%) and agri / fishing (11%) sectors.
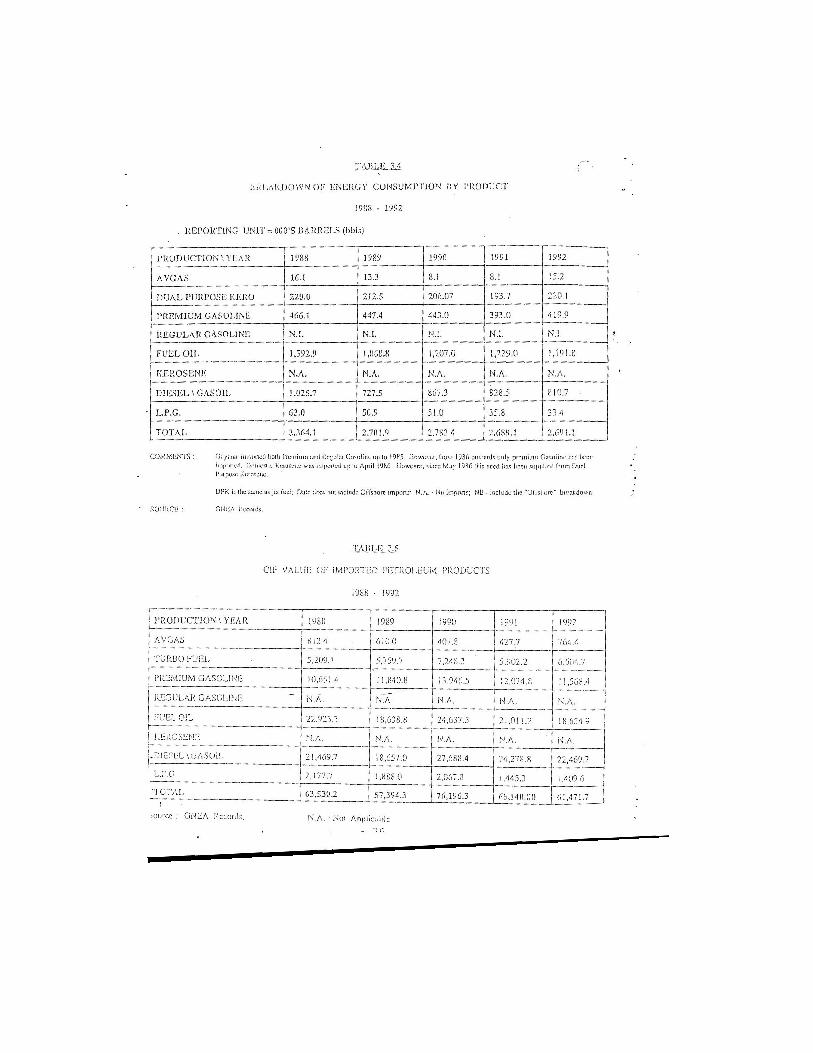
Petroleum products totaling 3,364,100 bbls, were imported in 1988 compared with a figure of 2,691,000
bbls for 1992, an overall decrease of 20%. Table 3.4 and fig. 3.12 provide detailed data indicating that fuel
oil (44% - 46%) diesel / gasoil (30%) and premium gasoline (13% - 15%) represented 91% and 90% of the
total petroleum imports for 1988 and 1992, respectively.
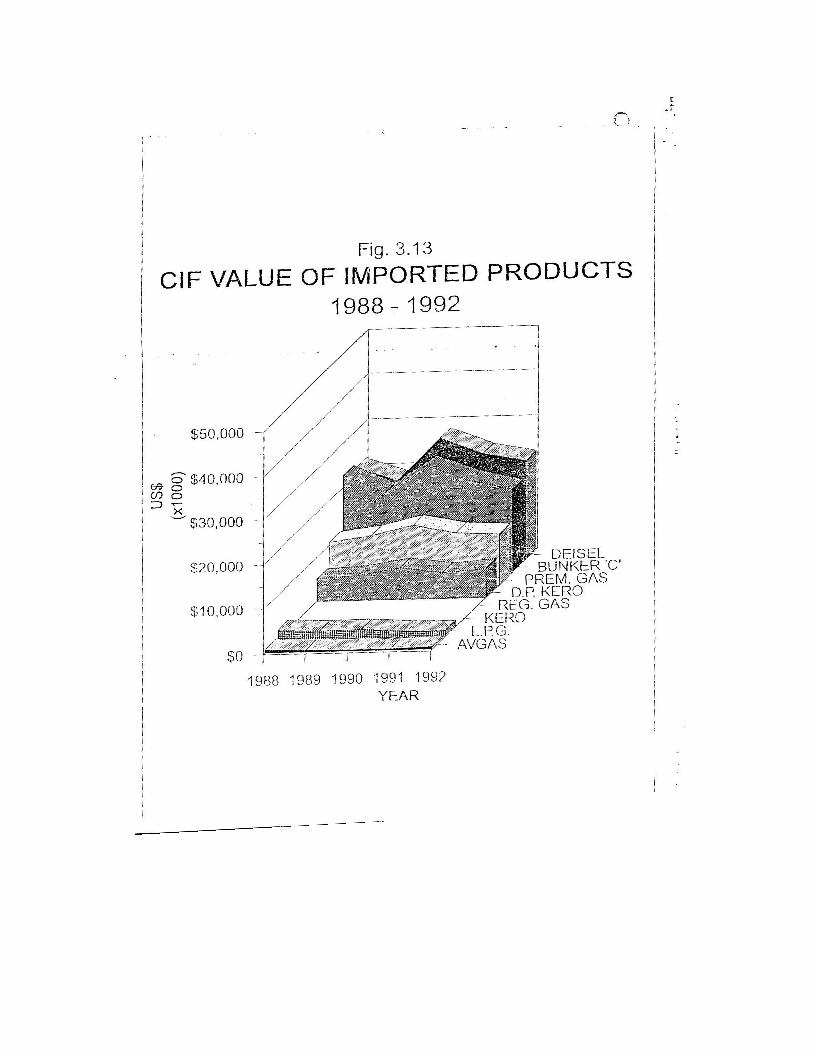
In value terms, US$63,530,200 was expended on petroleum products in 1988 and US$61,471,700 in 1992,
and overall decrease of 3.2%. Table 3.5 and Fig. 3.13 provide detailed data indicating that the CIF value of
fuel oil (30% - 36%), diesel / gasoil (34% - 36%) and premium gasoline (16% - 18%) represented 86% and
84% of the total CIF value of the imported fuel products in the years 1988 and 1992, respectively.
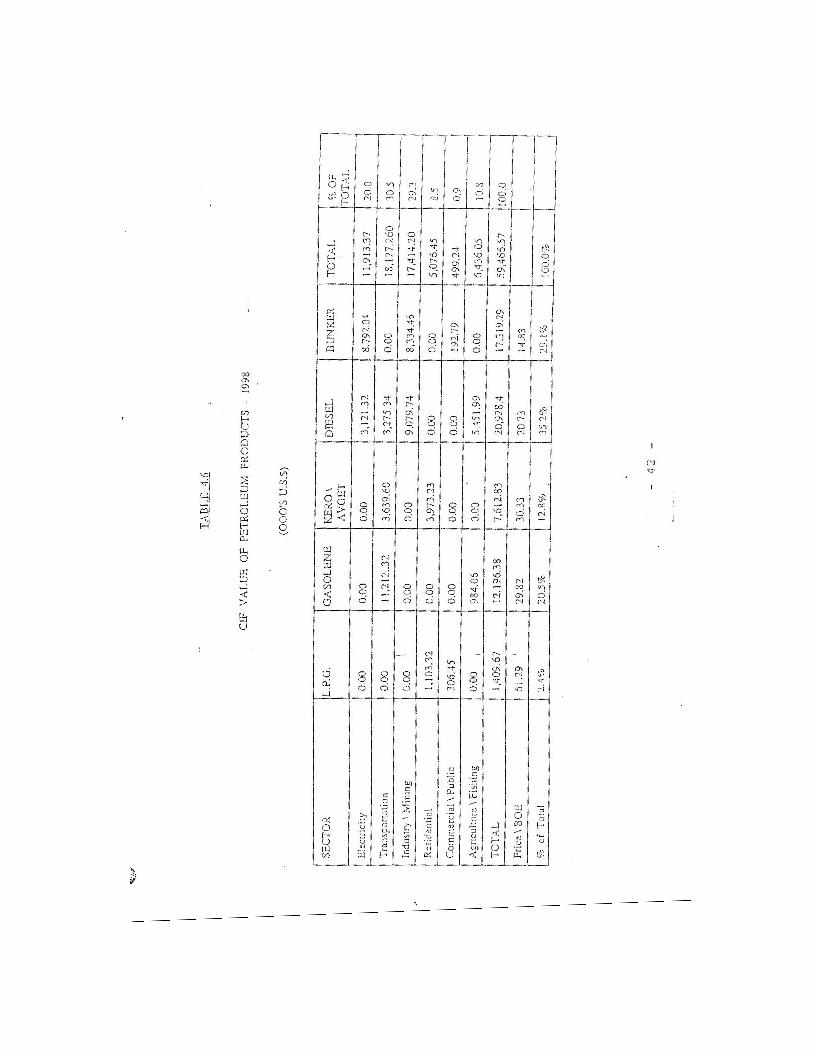
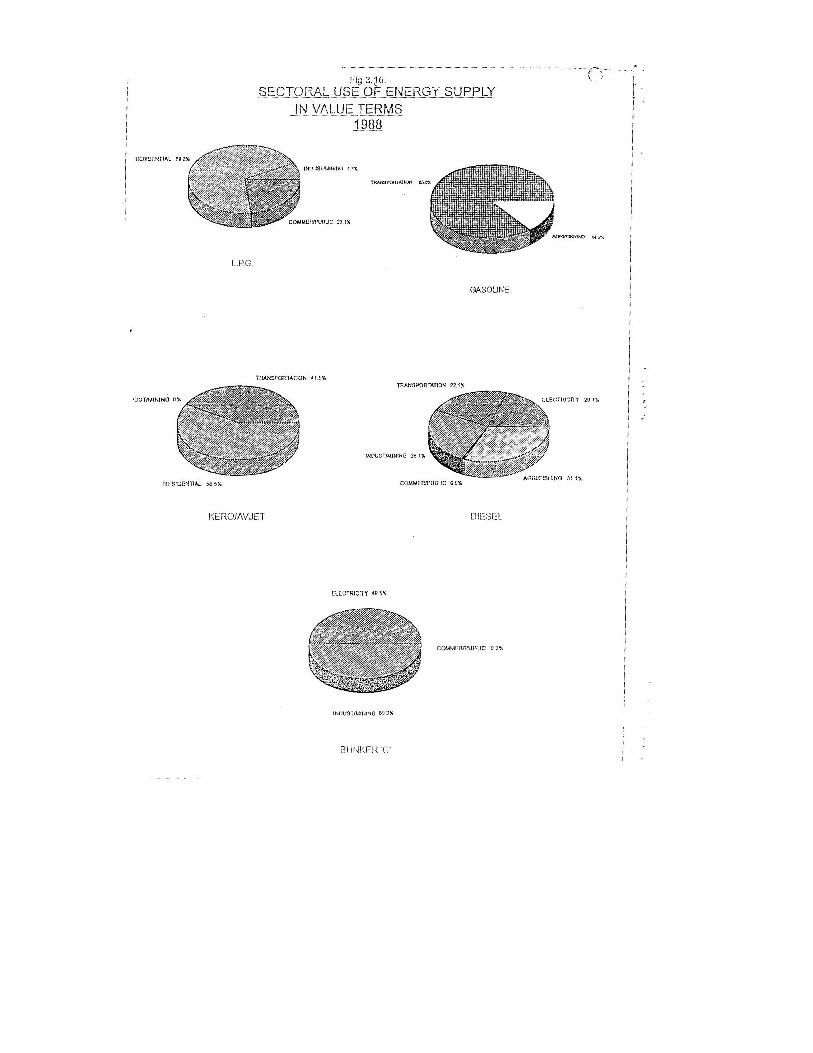
Table 3.6 provides financial data indicating that in the value terms, electricity (24.7% - 29.2%), industry /
mining (27.1% - 24.5%), transportation (29.1% - 21.2%) and agriculture / fishing (13.0% - 10.5%) sectors,
represented 86% and 85% of the total fuel bill in 1988 and 1992, respectively.
Therefore, any strategy to reduce the dependency on imported fuels, must be directed at evaluating,
optimizing and reducing the utilization of these products in the four sectors.
ENERGY POLICY PAPER FOR GUYANA – PART 3 – ENERGY SITUATION 1988 – 1992
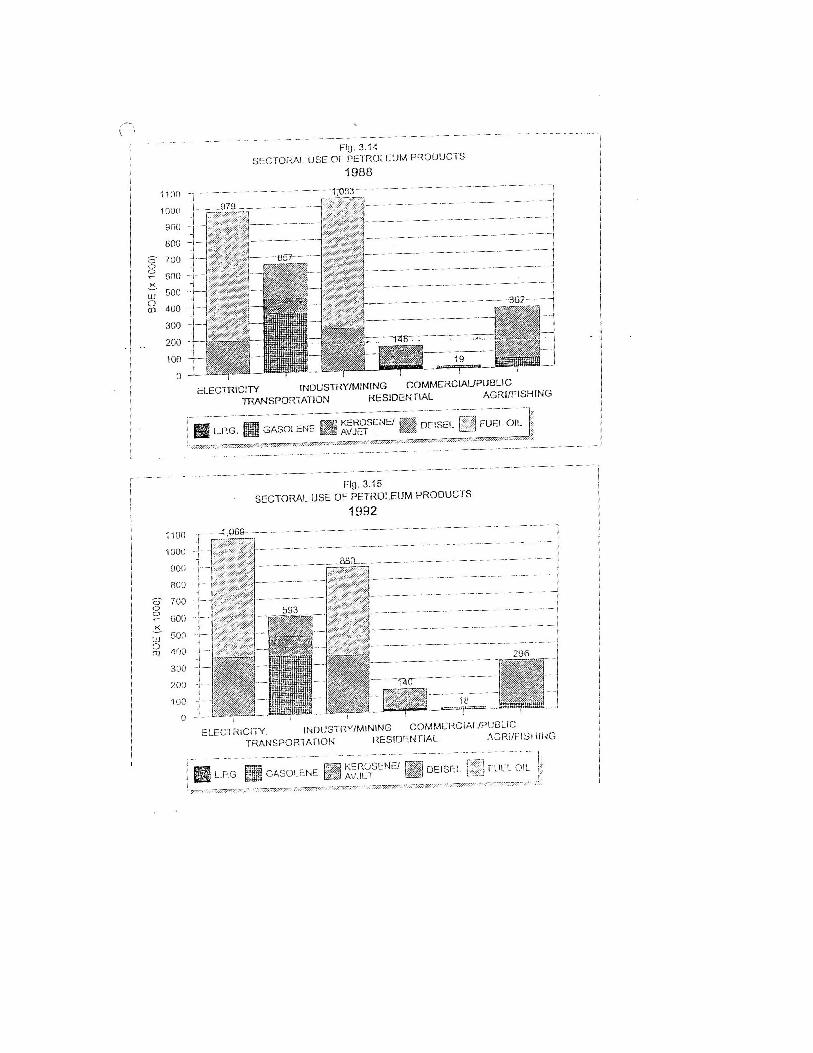
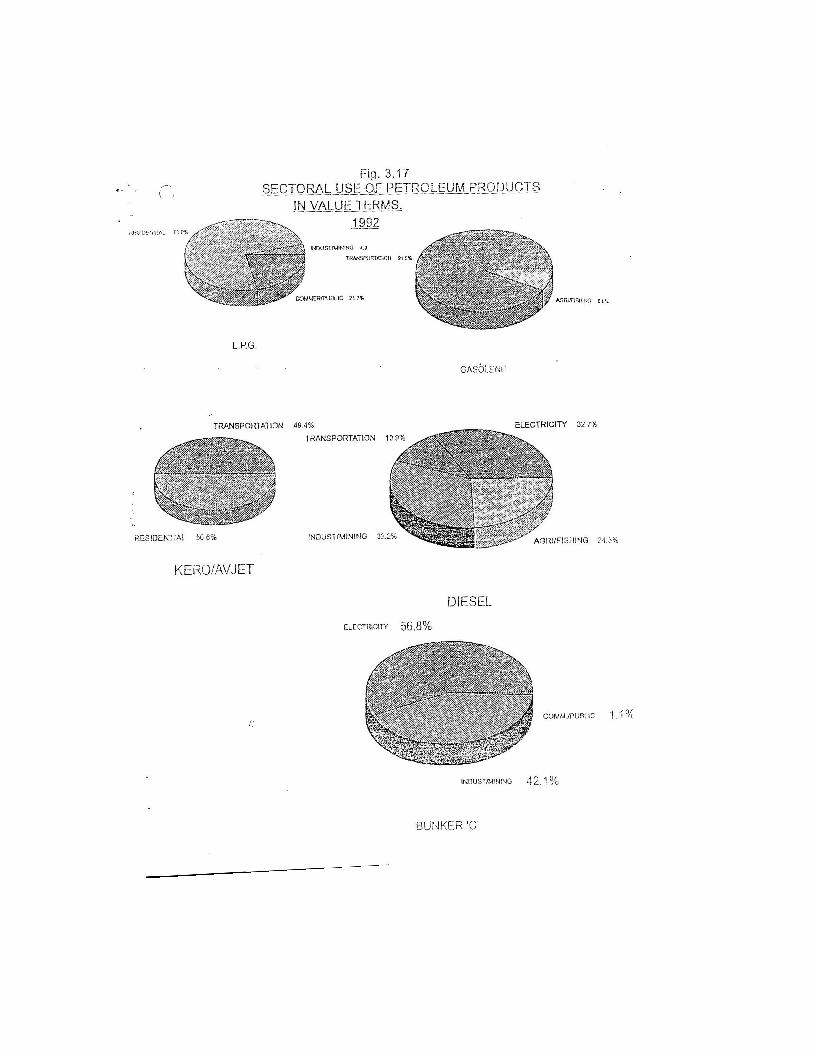
Figs. 3.14 and 3.15 show the sectoral use of petroleum products for 1988 and 1992. Figs 3.16 and 3.17
indicate in value terms the use of fuel products in various sectors. Fuel oil provided the energy supply for
mainly the electricity sector (49.5% - 56.8%) and industry / mining sector (50.3% - 42.1%) gasoline for the
transportation (85.8% - 91.5%) agri / fishing (14.2% - 8.5%) and diesel for the transportation (22.1% -
10.9%) agri / fishing (31.1% - 24.3%) industry / mining (26.1% - 32.2%) and electricity (20.1% - 32.7%)
sectors.

PART 4
FUTURE OUTLOOK
1994 – 2004
4.1 ENERGY DEMAND FORECAST
4.2 MAJOR POLICY OPTIONS
4.3 ENERGY RESOURCE AND SUPPLY PROSPECTS
4.4 STRATEGIES FOR SATISFYING ENERGY DEMAND
4.5 ENERGY SUPPLY AND SECTORAL USE
4.6 IMPACT OF STRATEGIES ON IMPORTED PETROLEUM PRODUCTS
ENERGY POLICY PAPER FOR GUYANA – PART 4 – FUTURE OUTLOOK 1994 – 2004
4. FUTURE OUTLOOK 1998 – 2004
4.1 ENERGY DEMAND FORECAST
(A) FORECAST ASSUMPTIONS
The demand forecasts used in this document were based on the following:
(1) Information provided by Management in the various sectors in future plans.
(2) Implicit growth rates for variables for which data was available e.g.
population estimates and best judgement where data was not available
e.g. economic growth.
(3) 1992 was used as the base year.
1. Electricity
(i) Estimates based on GEC’s projected customers’ demands
(ii) Estimate of consumption of Bunker “C: for electricity generation by LINMINE
in 1996 was taken from Jacob’s Report on the Bauxite Industry. Efficiency of
conversion implicit in 1992 figures was applied. It was assumed that this will
hold constant for 1998 and 2004.
(iii) Electricity produced by GUYSUCO in 1992 held constant for 1998 and 2004.
(iv) Electricity produced by BERMINE assumed to increase from 5500 BOE in 1992
to 6200 BOE in 1998 to cater for projected increased production. 6200 BOE
held constant for 2004.

ENERGY POLICY PAPER FOR GUYANA – PART 4 – FUTURE OUTLOOK 1994 – 2004
(v) Electricity demand by others placed at 31,000 BOE in 1998 and assumed to grow
5% by 2004.
2. Transportation
(i) Consumption of gasoline, which is used mainly for passenger transportation,
assumed to increase at the rate of population growth.
(ii) Projections for consumption of aviation kerosene (jet fuel), provided by GAC.
(iii) Consumption of diesel, which is used mainly for freight transportation, assumed to
increase at a rate of 5% per annum up to 1998 and 3% per annum thereafter. This is
intended to approximate to the rate of growth of the economy.
3. Industry and Mining
(i) Consumption of Bunker “C” by LINMINE and Aroaima assumed to remain
constant.
(ii) Consumption of Bunker “C” by BERMINE increased based on projected increase
in production.
(iii) Consumption of diesel by LINMINE and Aroaima assumed to remain constant.
(iv) Consumption of diesel by BERMINE increased based on projected increase in
production.
(v) Consumption of diesel for “other” industry and mining assumed to grow at 5% per
annum up to 1998.

ENERGY POLICY PAPER FOR GUYANA – PART 4 – FUTURE OUTLOOK 1994 – 2004
(vi) Consumption of petroleum products for 1998 held constant for 2004.
(vii) Consumption of Bagasse and Fuelwood held constant at 1992 figures.
4. Residential
(i) Consumption of fuelwood held constant.
(ii) Consumption of petroleum products assumed to grow at the rate of population
growth.
5. Commercial and Public
(i) Utilization of petroleum products held constant at 1992 figures.
6. Agriculture and Fishing
(i) Consumption by shrimping trawlers assumed to be constant.
(ii) Consumption for sugar and rice cultivation also assumed constant.

ENERGY POLICY PAPER FOR GUYANA – PART 4 – FUTURE OUTLOOK 1994 – 2004
(B) SUMMARY OF THE DEMAND FORECAST
Based on projections made the following may be highlighted:
(1) Final consumption of energy is expected to grow as the economy grows. Between 1992
and 1998, total final consumption of energy is projected to increase from 4864 thousand
BOE to 5165 thousand BOE, or by 7.3%. In 2004, total final energy consumption is
expected to be 5369 thousand BOE, an increase of 2.1% over 1998.
(2) Between 1992 and 1998, consumption of electricity is expected to grow at an annual rate of
6%. Thereafter, the growth rate is expected to be 2.5% per annum.
(3) Final consumption of petroleum products is expected to grow at an average rate of just
below 2% per annum between 1992 and 1998. The average annual growth rate of final
consumption of petroleum products between 1998 and 2004 is expected to be less than 1%.
4.2 MAJOR POLICY OPTIONS
Analysis of the figures in the current situation and future outlook indicates that Guyana
continues to rely heavily on imported fossil fuels. A broad objective of the energy policy
therefore will be to seek to reduce dependency on imported petroleum. To this end, a two-
prong approach is envisaged based on energy conservation (or increased efficiency of use) and
energy substitution (replacement of imported fuels by indigenous sources).
ENERGY POLICY PAPER FOR GUYANA – PART 4 – FUTURE OUTLOOK 1994 – 2004
The major policy options to achieve the objectives are:
1. Rationalisation of the Energy Sector.
2. Development of indigenous new and renewable sources of energy.
3. Exploration and development of indigenous oil and gas resources.
4. To promote energy conservation through the efficient and rational utilization of energy while
pursuing sustainable economic development.
5. To ensure stable supply of energy at the lowest possible cost.
6. Provide fiscal incentives and encourage joint-venture programmes to achieve (1) to (5) above.
4.3 ENERGY RESOURCES AND SUPPLY PROSPECTS
(A) Energy Resources
The implementation of the Guyana Energy Policy will require, inter alia, further and rational
development and/or utilization of the following sources of energy:
(1) Indigenous
New and Renewable Sources of Energy (NRSE)

ENERGY POLICY PAPER FOR GUYANA – PART 4 – FUTURE OUTLOOK 1994 – 2004
(i) Hydropower
DESCRIPTION RANGE OF POWER (Kw) HEAD IN METRES
LOW MED. HIGH
MICRO UP TO 50 15 15 – 20 H > 50
MINI 50 TO 500 20 20 – 100 H > 100
SMALL 500 TO 5000 25 25 – 130 H > 130
LARGE > 5000 25 25 – 130 H > 130
(ii) Biomass which include
- Bagasse
- Rice Husk
- Woodwaste
- Wood
- Plant and animal residue
(iii) Fossil-Based indigenous resources
(iv) Others which include
- Solar
- Wind
- Industrial and non-industrial by-products
- Tidal
(2) Imported
Fossil based fuels and lubricants
ENERGY POLICY PAPER FOR GUYANA – PART 4 – FUTURE OUTLOOK 1994 – 2004
(B) SUPPLY PROSPECTS
Specific and conclusive data relating to most of the various indigenous energy sources are readily
available. The extent to which these resources can therefore make an impact at the macro level must be
quantified. It is necessary to formulate an appropriate plan to pursue the development of these
resources by evaluating the resource potential, the necessary technology and financing required to
implement these programmes.
Following are details pertaining to the supply propects:
(1) Petroleum-based Fuels
The petroleum-based fuels which are imported and utilized in Guyana are motor Gasoline, dual
purpose Kerosene, Diesel/Gasoil, Fuel Oil/Bunker “C”, aviation Gasolene and Liquefied
Petroleum Gas (LPG). Since diesel and fuel oil will continue to account for a substantial
amount of the national fuel bill and provide the best opportunity for substitution, every effort
should be made in order to reduce the nation’s dependence on these fuels in order to achieve
significant savings. There should be simultaneously, continued exploration for indigenous
resources and implementation on conservation measures.
(2) Hydropower (large, small, mini and micro)
Hydropower programme is intended to solve the long term energy problems of Guyana through
national development of water-resources and to generate electricity by the construction of
hydropower stations (micro, mini, small or large) for the supply of power for the following
uses:

ENERGY POLICY PAPER FOR GUYANA – PART 4 – FUTURE OUTLOOK 1994 – 2004
(i) industrial
(ii) commercial
(iii) domestic
(iv) recreational
(v) others
In the development of a river basin, the following factors will be considered:
- hydropower
- navigation
- irrigation
- sedimentation control
- flood control
- recreation
- municipal and industrial water supply (i.e., water quality control)
- fisheries
- others

ENERGY POLICY PAPER FOR GUYANA – PART 4 – FUTURE OUTLOOK 1994 – 2004
(3) BIOMASS
(i) Bagasse
Studies have shown that there is sufficient bagasse at the Albion and LBI Sugar Estates
to generate 20MW and 10MW of electricity, respectively. The development of this
source of energy should be undertaken, through the installation of generating plants at
Albion and LBI to supply electricity to the national grid.
(ii) Woodwaste
Woodwaste is currently used by two private companies to generate approximately
1.5MW of power for their operations. Immediate steps should be taken to encourage
utilization of woodwaste in concentrated sawmilling area (e.g., Crabwood Creek) and
for large operations like Demerara Timbers Limited (DTL), Barama for power
generation. This power could be used in industrial applications with the excess to be
supplied to the national grid. The isolated sawmills can establish systems for self-
utilization and any excess can be utilized by the surrounding communities.
(iii) Fuelwood
The statistics show tht fuelwood is used widely for domestic purposes. However, the
supply of fuelwood is not organized nationally. Producing heat energy, from the
energy source, generates significant savings through substitution for electricity,
kerosene and LPG. Serious and immediate efforts, therefore, should be made towards
the development of an organized fuelwood industry to satisfy the national demand of
this energy source, in an environmentally friendly manner, with particular attention to
the rural communities.
ENERGY POLICY PAPER FOR GUYANA – PART 4 – FUTURE OUTLOOK 1994 – 2004
(iv) Rice-Husk
Two companies are currently utilizing rice husk for power-generation and for
processing. The available potential has been evaluated, and efforts should be made to
establish central generating plans in areas where there is a high concentration of mills.
In both cases, industrial and domestic uses are envisaged.
(v) Biogas (from animal waste, vegetable matter, distillery waste)
There are about eighty-five (85) biogas digesters which were built since 1985 in the
country, with volumes varying in sizes from 8, 12, 16 to 20 cu. metres. Biogas
technology has been identified as part of the solution to the energy problem in Guyana.
However, more education, cheaper design costs and proper surveys need to be
conducted to ensure that the technology is widely utilized among farmers for cooking,
lighting and refrigeration.
(4) Wind Energy
The absence of sufficient information and data on the wind regime has restricted
utilization of wind energy along Guyana’s coastland as well as in the hinterland areas.
Efforts should, therefore, be undertaken to determine the wind regime with a view to
assessing the power potential of wind mills. The establishment of wind farms should
be evaluated in terms of cost effectiveness.

ENERGY POLICY PAPER FOR GUYANA – PART 4 – FUTURE OUTLOOK 1994 – 2004
(5) Solar Energy
Adequate information on solar radiation in Guyana has been collected. However, the high cost
of photovoltaic (PV) systems has limited the size of units being used. At the moment, there are
twenty-one (21) PV systems operational in Guyana, ranging from 0.5 Kw to 10 Kw output
units. The systems are being used by Health-Centres in remote areas for lighting and
refrigeration. The utilization of these systems in remote areas must be encouraged where the
need exists, providing they constitute a cost effective option. The use of fixed convection and
natural convection solar systems should also be encouraged for the processing of agro-based
commodities and in the fishing industry.
4.4. STRATEGIES FOR SATISFYING ENERGY DEMAND
To satisfy the projected energy demand up to 2004, the following major strategies would be
adopted:
(1) more efficient utilization of bagasse with a view to supplying power to the national grid
(2) increased utilization of woodwaste and rice-husk for electricity generation
(3) development of major hydropower facilities
(4) more efficient utilisation of petroleum based products and energy generally through conservation measures
(5) provision of fiscal incentives and appropriate legislation to support energy development programmes
(6) establishing energy farms to provide fuelwood source for household uses
(7) continuation of oil exploration activities

ENERGY POLICY PAPER FOR GUYANA – PART 4 – FUTURE OUTLOOK 1994 – 2004
(8) development of small, mini/micro hydropower, solar and wind technologies for remote and isolated communities.
4.5 ENERGY SUPPLY AND SECTORAL USE
It is projected that final energy consumption in 1998 will be 5,165,000 BOE and in 2004,
5,369,000 BOE and the final consumption of petroleum products to be 3,100,000 bbls in 1998 and
3,500,000 in 2004. These are illustrated in Figs. 4.1 and 4.2. Based on the strategies outlined
above, Tables 4.1 and 4.2 indicate that the total supply of energy by source in 1998 and 2004 will
be 6,226,000 BOE and 5,755,000 BOE, respectively. It is projected that Guyana will be less
dependent on imported petroleum products in 2004 than in 1992. A decrease of approximately
26% is projected. Increased exploitation of domestic energy resources, namely bagasse, and
hydropower, for generation of electricity for the national grid, would contribute heavily to this
reduced dependency. Table 4.3 and fig. 4.3 and 4.4 have indicated energy supply will be provided
for in 1998 by indigenous resources (53.7%) and imported petroleum products (46.3%). In 2004,
the energy supply will be provided by indigenous resources (61.5%) and petroleum products
(38.5%).
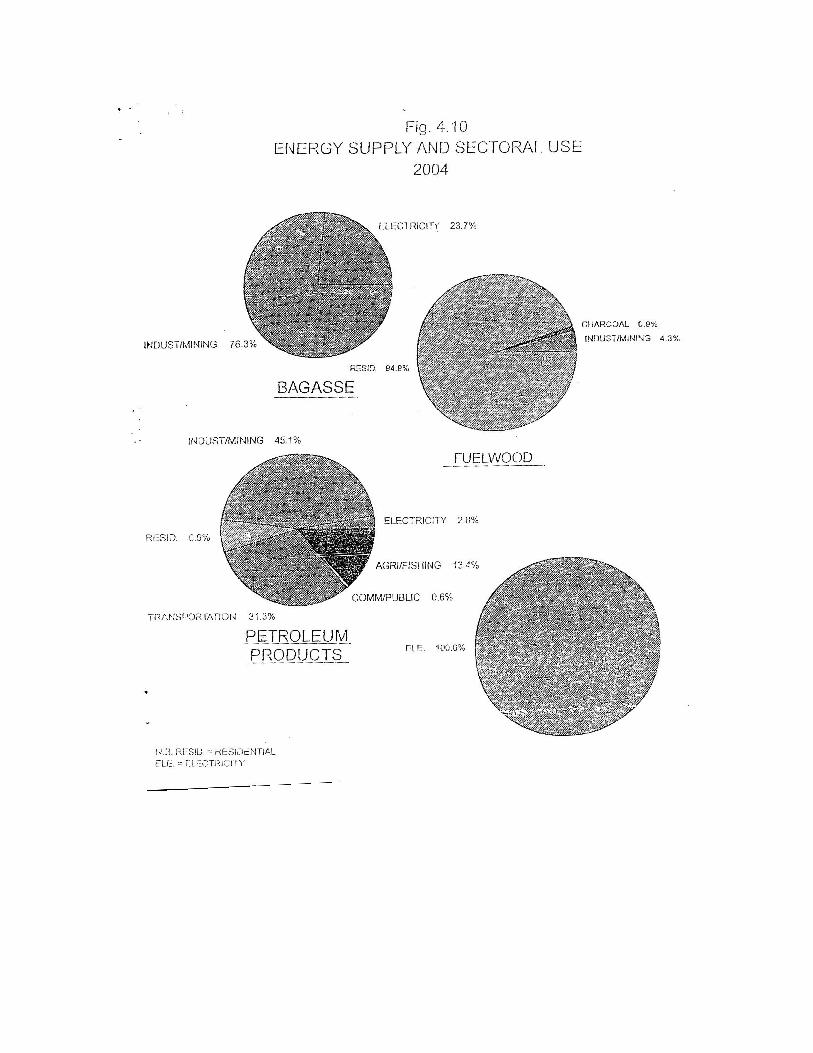
In terms of energy supply and sectoral use, Figures 4.5, 4.6, 4.7, 4.8, 4.9 and 4.10 illustrate the
trend predicted for 1998 and 2004. More specifically, the following can be observed.
(1) Industry / Mining Sector
During the period 1998 – 2004, the Industry and Mining Sector will utilize 35.1% to
40.0% of total energy supply. In 1998, petroleum products would represent 45.7% and

ENERGY POLICY PAPER FOR GUYANA – PART 4 – FUTURE OUTLOOK 1994 – 2004
bagasse 51.5% of energy supply in this sector. In 2004, contribution from these two
resources will change to 43.8% and 53.4%, respectively. This sector is projected to
remain the largest consumer of energy. The trend of an increase in the contribution by
bagasse and decrease in the use of petroleum products will continue, eventually
stabilizing in 2004.
(2) Electricity Sector
It is projected that the electricity Sector would utilize 23.7% of energy supply in 1998
and 14.9% in 2004.
In 1998, petroleum products would represent 55.0% and indigenous resources 45.0% of
energy supply in this sector. In 2004, it is projected that these figures would change to
7.0% and 93.0%, respectively. In this sector, dependence on petroleum products will
decrease by 48% during the period 1998 – 2004. More efficient utilization of bagasse
will increase the contribution from this energy source. Hydro-energy (49%) will be the
major source of electricity generation by this time.
(3) Residential Sector
It is projected that the Residential Sector would utilize 25.5% of energy supply in 1998
and 27.7% in 2004. Fuelwood would provide 90.8% and petroleum products 9.2% of
the energy supply in 1998 and 90.5% in 2004, respectively.
Fuelwood is expected to remain the important energy source in this sector.

ENERGY POLICY PAPER FOR GUYANA – PART 4 – FUTURE OUTLOOK 1994 – 2004
(4) Transportation, Agriculture and Fishing Sectors
The Transportation, Agriculture and Fishing Sectors are projected to use 15.3% of
energy supply in 1998 and 17.2% in 2004. As in previous years, petroleum products
are projected to be the only source of energy supply in these sectors.
(5) Charcoal Production
This will remain relatively constant during the period 1992 – 1998 and 2004 and will
have a marginal impact (0.1% - 0.2%) on sectoral use of energy supply.
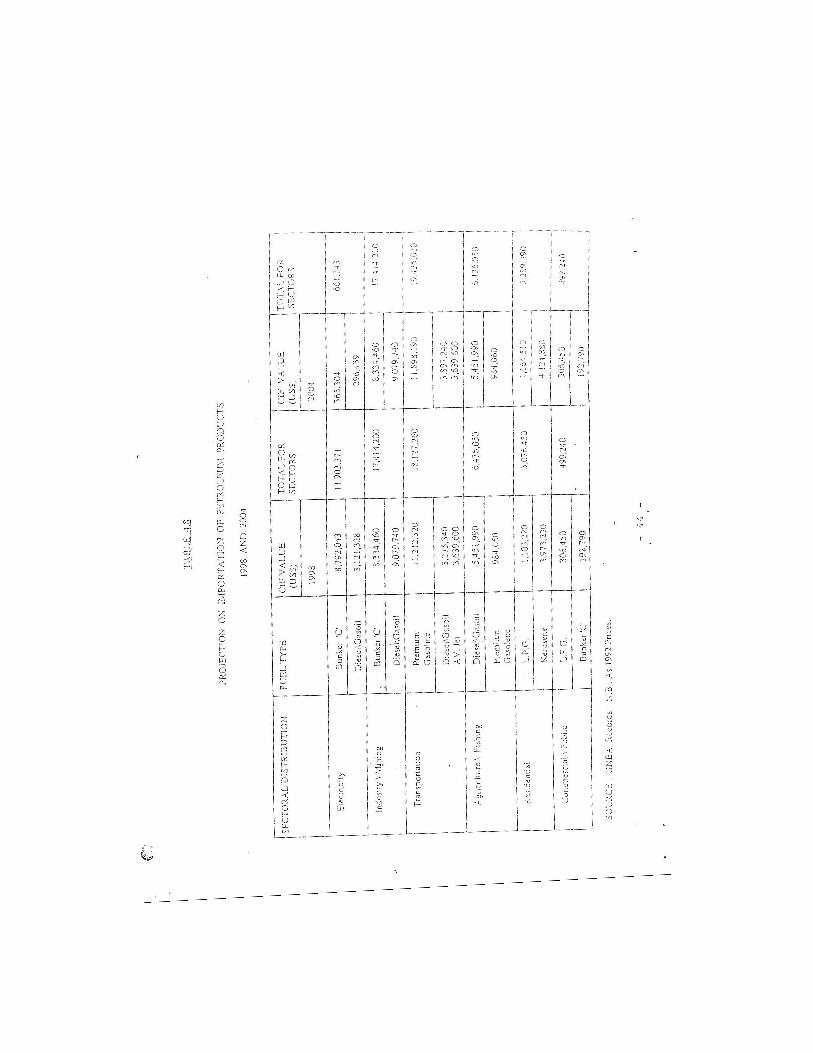
4.6 IMPACT OF STRATEGIES ON IMPORTED PETROLEUM PRODUCTS
Overall, the strategy applied will result in the increased utilization of indigenous resources with the
consequential decrease in energy supply from petroleum products form 48.7% in 1992 to 38.5% in 2004,
despite an overall increase in final consumption of energy of 9.3% over the same period. This decrease in
energy from petroleum products does not include new energy conservation opportunities to be taken. Tables
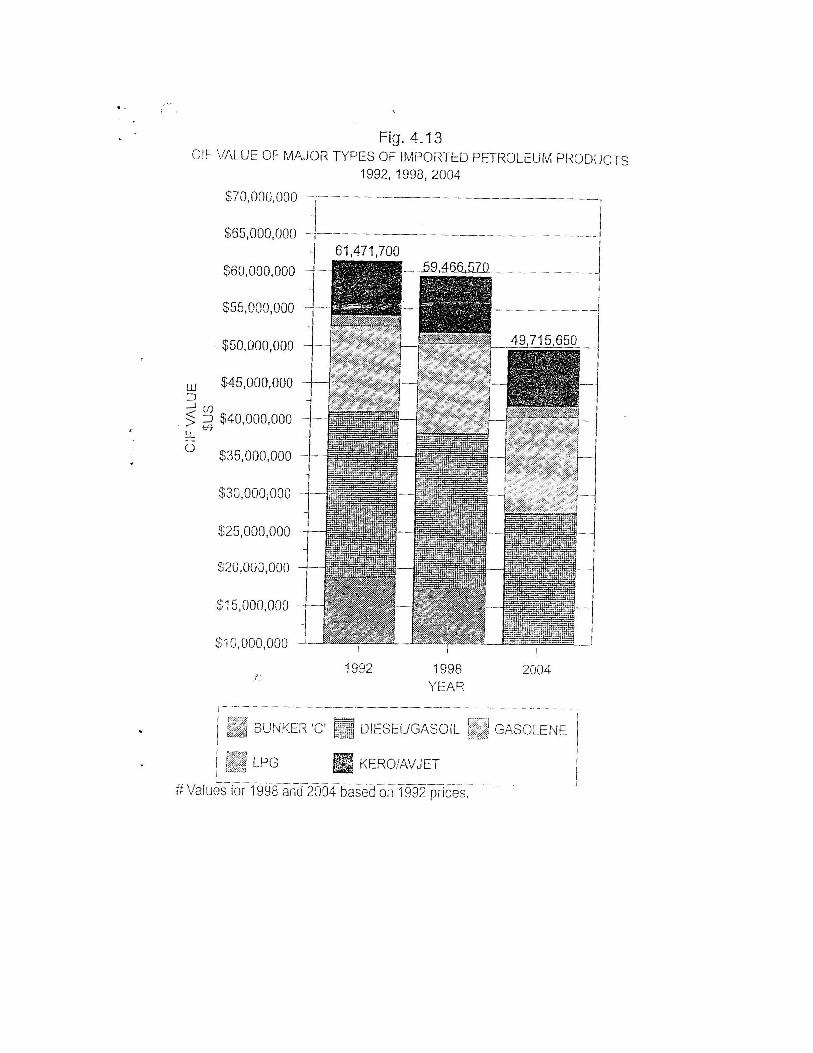
4.4, 4.5, 4.6, 4.7, 4.8 and Figures 4.11, 4.12 and 4.13 show the sectoral use of petroleum products in 1998 and
2004 and the corresponding expenditure associated with the importation of these products. In total, fig. 4.13
indicates expenditure in 1992 to be US$61,471,700 decreasing to a value of US$49,715,650 in 2004. This
projected decrease in the utilization of petroleum products would be due largely to increase and more efficient
utilization of local resources for electricity generation.

ENERGY POLICY PAPER FOR GUYANA – PART 4 – FUTURE OUTLOOK 1994 – 2004
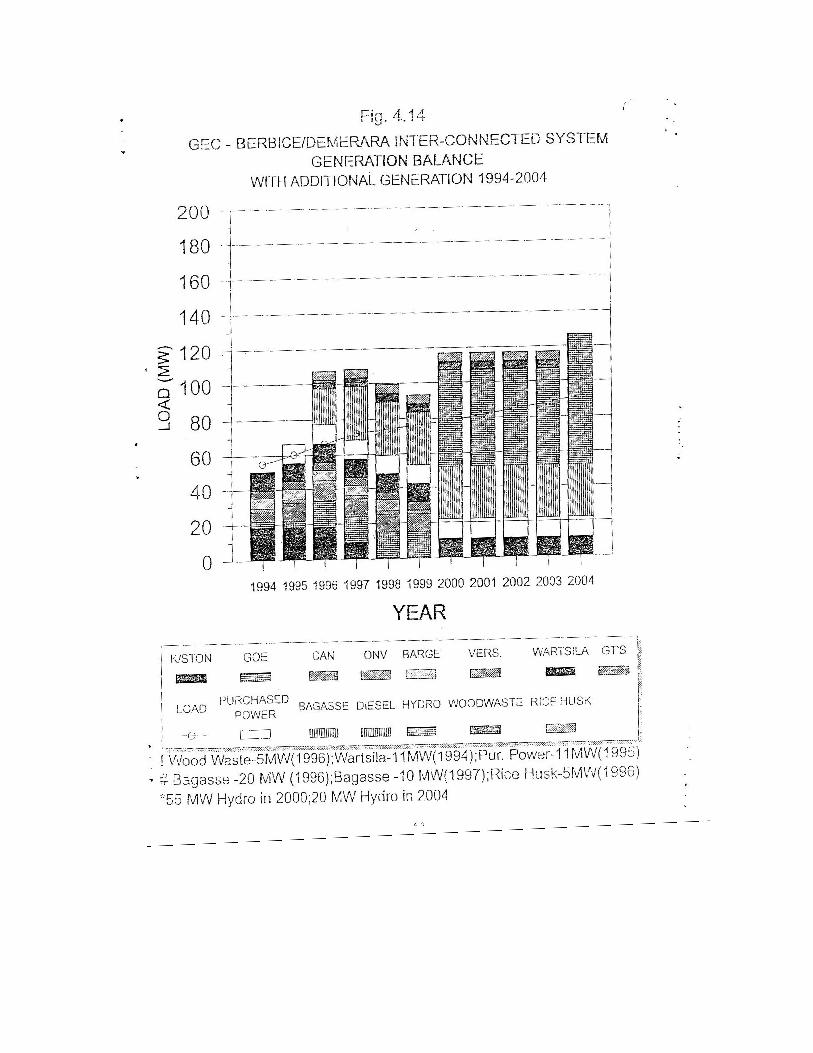
Electricity Sector
The Guyana Electricity Corporation (GEC) generation balance for the Berbice / Demerara interconnected
system is shown in Fig. 4.14. Based on this generation plan, in 1992, 36% of the energy supply from petroleum
product was used to generate electricity, while 27% will be used in 1998 and 2.8% in 2004. In power output
terms, in 1992 all power generation (50 MW) came from petroleum products while in 2004, only 15% (22 MW
out of 128 MW) will be generated by petroleum products. Based on 1992 prices, the fuel bill for electricity
generation will decrease for US$17,943,447 in 1992 to US$11,903,371 in 1998 reaching a figure of
US$661,743, in 2004 while at the same time increasing the generating capacity from 50 MW to 128 MW.
Although the savings will represent 36% of the total fuel bill, the availability of large quantities of reliable
power at low generating cost would have a major impact on the industrial development of the country.
Other Sectors:
Industry / Mining, Transportation, Agri / Fishing:
The utilization of petroleum products for the other sectors will remain basically the same. The utilization of
currently known indigenous resources cannot replace fossil fuel in these sectors. Over the next ten years, to
reduce the dependency on such fuels for these sectors the following MUST be pursued.
- continued oil exploration activities
- promotion of efficient utilization of these products at the sectoral level through energy
conservation, fiscal incentives and enactment of appropriate legislation.
PART 5
IMPLEMENTATION AND FINANCING
5.1 IMPLEMENTATION SCHEDULE
5.2 PROJECT FINANCING
ENERGY POLICY PAPER FOR GUYANA – PART 5 – IMPLEMENTATION AND FINANCING
5. IMPLEMENTATION AND FINANCING
This section focuses on a projected implementation schedule and possible sources of financing.
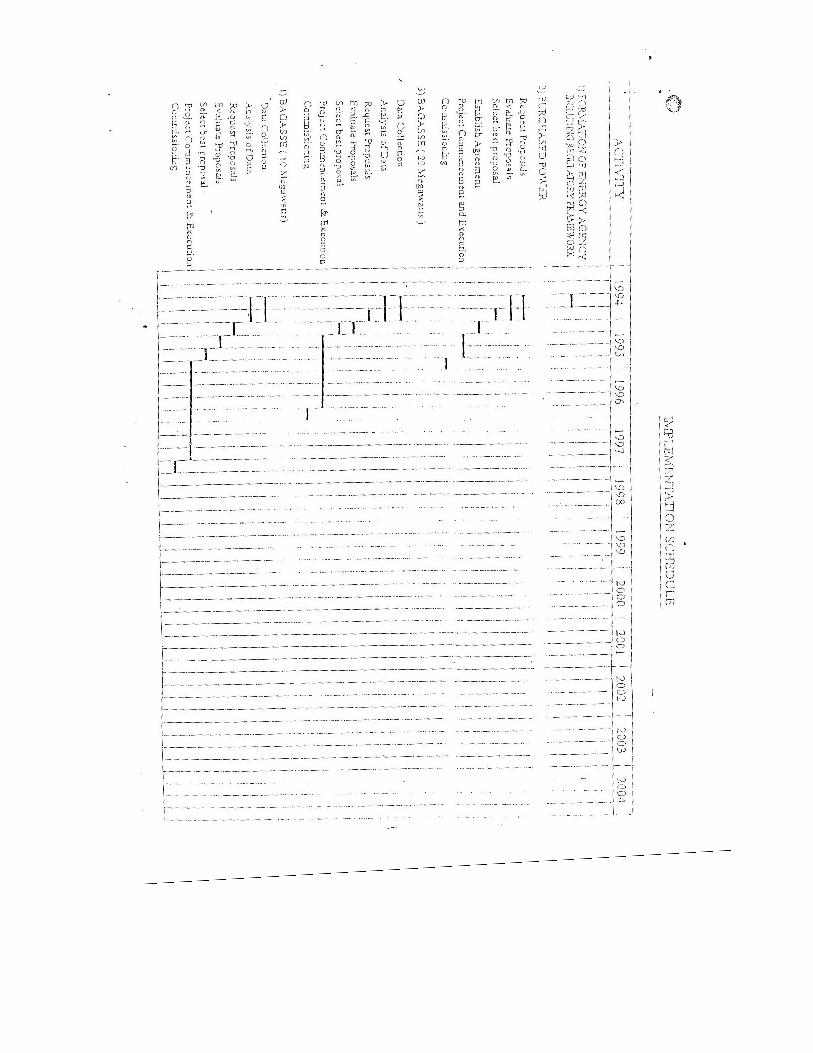
5.1 IMPLEMENATION SCHEDULE
The various activities and the time-frame envisaged for the achievement of the objectives of the
national energy policy are included in the implementation schedule which is presented below. It is self
explanatory and covers the period 1994 to 2004.
It is important to point out that by the end of the third quarter of 1994, an appropriate energy agency
should be established and the required regulatory framework for the energy sector should be
formulated. This is absolutely necessary for the successful implementation of the national energy
policy.
In respect of the implementation of the various projects, the main activities would include:
- Data Collection
- Analysis of Data
- Requesting Proposals
- Evaluation of Proposals
- Selecting the Best Proposals
- Project Commencement and Execution
- Commissioning

ENERGY POLICY PAPER FOR GUYANA – PART 5 – IMPLEMENTATION AND FINANCING
The projected time-frame for the activities in the implementation schedule could vary, depending on the
response to the request for proposals and the efficiency with which the other activities could be carried out.
5.2 PROJECT FINANCING
Financing the projects identified for implementation is an extremely crucial aspect of our energy policy.
It is expected that the energy agency to be established would collaborate with the other relevant local
agencies / organizations in promoting investments and securing financing for the projects. Financing of
these projects could be pursued through various international institutions / countries which include:
- Caribbean Development Bank (CDB)
- World Bank
- Inter-American Development Bank (IDB)
- Organisation of American States (OAS)
- Canadian International Development Agency (CIDA)
- O L A D E
- Overseas Development Administration (ODA) of the United Kingdom
- European Economic Community (EEC)
- Japan International Development Organisation Ltd. (JAIDO)
- Government of Japan Grant Aid Programme
- Lines of Credit from countries like Venezuela, Brazil, Germany, Italy
- Direct Investment by American, Canadian, British, Venezuelan, Brazilian, Italian, Germany, Australian, Companies / Investors on a Finance, Build, Own, Operate and Transfer (FBOOT basis)
- Guyanese Companies / Investors in Joint Venture schemes, again on a FBOOT basis.
ENERGY POLICY PAPER FOR GUYANA – PART 5 – IMPLEMENTATION AND FINANCING
The types of financing that could be made available are listed below:
- Direct short-term / long-term loans at approximately IDB interest rates
- Technical assistance schemes / programmes
- Grants and schemes / programmes
- Grants
- Short-term / long-term credits (Lines of Credit)
- 100% direct investment by Foreign Companies
- Partial direct investment by Guyanese Companies in Joint-Venture Schemes.


TABLES: 3.1 – 3.6
4.1 – 4.8


FIGURES: 3.1 - 3.17
4.1 - 4.14


APPENDIX 1
APPENDIX 1
LIST OF MEMBERS OF ENERGY POLICY COMMITTEE
ROSHANDEEN HABIBULLAH (Chairman) - Director Institute of Applied Science and Technology DOORGA PERSAUD (Secretary) - Head (Ag.) Natural Resources Planning Unit Guyana Natural Resources Agency JOSEPH O’LALL - Executive Chairman Guyana Natural Resources Agency BRIAN SUCRE - Commissioner Guyana Geology and Mines Commission MARK BENDER - Chief Executive Officer Guyana National Energy Authority MAURICE VEECOCK - Director Hydropower Unit Guyana National Resources Agency RAYMOND DUNDEE - Specialist Engineer Hydropower Unit Guyana Natural Resources Agency RABINDRANAUTH SINGH - Divisional Manager Corporate Planning and Projects Guyana Electricity Corporation NEERMAL REKHA - Economist 111 Guyana National Energy Authority
Related Documents