____________ * Corresponding author. Fax: + 46-13-28 17 88 E-mail address: [email protected] (P. Thollander). Linköping University Postprint Energy policies for increased industrial energy efficiency - Evaluation of a local energy programme for manufacturing SMEs Patrik Thollander, Maria Danestig and Patrik Rohdin N.B.: When citing this work, cite the original article. Original publication: Patrik Thollander, Maria Danestig and Patrik Rohdin, Energy policies for increased industrial energy efficiency - Evaluation of a local energy programme for manufacturing SMEs, 2007, Energy Policy, (35), 11, 5774-5783. http://dx.doi.org/10.1016/j.enpol.2007.06.013 . Copyright: Elsevier B.V., http://www.elsevier.com/ Postprint available free at: Linköping University E-Press: http://urn.kb.se/resolve?urn=urn:nbn:se:liu:diva-12512

Welcome message from author
This document is posted to help you gain knowledge. Please leave a comment to let me know what you think about it! Share it to your friends and learn new things together.
Transcript

____________ * Corresponding author. Fax: + 46-13-28 17 88 E-mail address: [email protected] (P. Thollander).
Linköping University Postprint
Energy policies for increased industrial energy efficiency - Evaluation of a local
energy programme for manufacturing SMEs
Patrik Thollander, Maria Danestig and Patrik Rohdin
N.B.: When citing this work, cite the original article. Original publication: Patrik Thollander, Maria Danestig and Patrik Rohdin, Energy policies for increased industrial energy efficiency - Evaluation of a local energy programme for manufacturing SMEs, 2007, Energy Policy, (35), 11, 5774-5783. http://dx.doi.org/10.1016/j.enpol.2007.06.013. Copyright: Elsevier B.V., http://www.elsevier.com/ Postprint available free at: Linköping University E-Press: http://urn.kb.se/resolve?urn=urn:nbn:se:liu:diva-12512

Energy policies for increased industrial energy efficiency - Evaluation of a local energy programme for manufacturing SMEs
Patrik Thollander a,*, Maria Danestig a, Patrik Rohdin a
a Department of Management and Engineering, Division of Energy Systems,
Linköping University,
SE-581 83 Linköping, Sweden
_________________________________________________________________________
Abstract
The most extensive action targeting the adoption of energy efficiency measures in the
small and medium-sized manufacturing industry in Sweden over the past 15 years was
project Highland. This paper presents an evaluation of the first part of this local industrial
energy programme, which shows an adoption rate of more than 40 percent when both
measures that have already been implemented and measures that are planned to be are
included. A comparison between this programme and another major ongoing programme
for the Swedish energy-intensive industry indicates that the approach used in project
Highland aimed at small and medium-sized industries is an effective way to increase
energy efficiency in the Swedish industry. The major barriers to energy efficiency among
the firms were related to the low priority of the energy efficiency issue.
Keywords: Energy efficiency; Energy audits; Industrial energy programs
___________________________________________________________________
1. Introduction
Global warming resulting from the use of fossil fuels is putting pressure on policy-
makers to formulate and adopt energy policies aimed at different sectors of the economy.
Industrial energy efficiency plays a central role as manufacturing industry accounts for
about 75% of the world’s yearly coal consumption, 44% of the world’s natural gas
2 of 28

consumption, and 20% of global oil consumption. In addition, these manufacturing
companies also use 42% of all electricity generated (IEA, 2004). In Sweden, the
aggregated industrial energy use is about 155 TWh, where the non-energy-intensive
industry accounts for about 30% of the aggregated industrial energy use (SEA, 2004a). The
European Energy End-use Efficiency and Energy Services Directive, which came into
force in 2006, proposes a reduction in energy use of 9% in each member state, to be
achieved by the ninth year of application of the directive (EC, 2006). The directive
addresses a number of activities and services, such as the availability of energy auditing for
small and medium-sized industrial customers. It also highlights the availability of energy
efficiency funds to all market actors and promotes energy audits and financial incentives
for the adoption of energy efficiency measures and energy services (EC, 2006). The
directive stresses the need to discuss possible end-use energy policy initiatives directed at
small and medium-sized industrial manufacturers (SMEs1) in a national context. For
decades, electricity prices in Sweden have been low, due to a substantial proportion
generated by nuclear and hydropower. The deregulation of the Swedish electricity market
in 1996 initially caused prices to fall, but since 2000 prices have begun to increase again.
The historically low electricity prices have led to a larger share of electricity use within
Sweden’s industries compared with their European competitors (Dag, 2000, Nord-Agren,
2002, Thollander et. al., 2005, Trygg, 2006). An electricity price survey in 2002, covering
major parts of the European Union’s member states, revealed that the electricity prices paid
by Swedish enterprises were among the lowest in the Union (EEPO, 2003). The electricity
price increases over the past few years have created a challenge for Swedish enterprises to
find ways to decrease electricity use and for trade associations and authorities to formulate
and adopt end-use energy policy instruments for industry. Different barriers to energy
efficiency, however, may obstruct the implementation of cost-efficient energy efficiency
measures. One such barrier, and which has been shown to be significant, is imperfect
3 of 28

information (SPRU, 2000). Other market failure barriers include asymmetric information, a
special form of imperfect information where split incentives, adverse selection and
principal-agent relationships may be categorized. A true market failure may justify public
policy intervention. However, the mere existence of such may not justify such intervention,
as market failures are pervasive (SPRU, 2000). It is also important that the benefits arising
from an intervention exceeds the cost of implementation. One aim with the new End-Use
Directive is to remove existing market barriers and imperfections that impede the efficient
end use of energy (EC, 2006). The Swedish Ministry of Enterprise, Energy and
Communications (2001) argues that energy policies should be general and not targeted
towards one single technology, and categorize energy policy instruments into economic
policy instruments, like taxes, duties, subsidies, financial incentives etc, administrative
policy instruments like rules and regulations, acts etc, and informative policy instruments
like information campaigns/programs.
Public policies towards industry in turn may take a number of different forms such as
price-based and fiscal instruments, regulations, voluntary approaches like Long-Term
Agreements (LTA) and energy audit programs where a combination of policy instruments
are often more effective. Government funded industrial energy programmes are one such
way to increase energy efficiency in industry and overcome, among other such barriers, the
problem of imperfect information (Hirst and Brown, 1990). Public information programs
may also include educational workshops and training programs for professionals,
advertising, and product labelling (Anderson and Newell, 2004). While general information
campaigns result in increased awareness of the importance of energy efficiency; such
campaigns, however, seems to result in only a small increase in the adoption of energy
efficiency measures (Stern and Aronsson, 1984). Local energy programmes, on the other
hand, are argued to be successful policy instruments for increased adoption of energy
efficiency measures, especially when company-specific information is provided by
4 of 28

intermediaries such as local authorities, consultants or trade organizations, which are
considered credible and trustworthy by the firms (Stern and Aronsson, 1984).
The aim of this paper is to evaluate the first part of project Highland2, the most
extensive Swedish energy programme directed at small and medium-sized industry. The
research questions covered in this paper are:
Which energy efficiency measures were implemented?
What were the barriers and driving forces inhibiting the implementation of
energy efficiency measures according to the respondents at the firms?
How effective is project Highland in relation to the outcome of other mainly
Swedish energy programs towards the manufacturing industry?
The first and second research questions were examined by means of a questionnaire,
and interviews. The questionnaire was sent out by mail from Linköping University in
spring 2006 to firms that had participated in the programme before September 2005, and
was collected by the local authority energy consultant. The respondents were working in
companies which had participated in the local energy program and the main criterion for
selecting respondents was that they had been the contact person for the previously made
energy audit at their company. The reason for excluding companies which had gotten
audits after September 1st 2005 was that these companies were not considered of having
had enough time to act on the information from the energy audit. A total of 64 respondents
received the questionnaire that resulted in 47 replies. The questionnaire contained a list of
the proposed energy efficiency measures and a number of barriers to and driving forces for
energy efficiency that the respondents were asked to rank. The questionnaire has
previously been used in Rohdin et al. (2007) and Rohdin and Thollander (2006).
5 of 28

In order to answer the third research question, two international energy audit
programs, the Australian EEAP and the American IAC are briefly presented as well as a
review of Swedish industrial energy efficiency action. Where possible, the costs for the
Swedish programs are presented. The aim has been to include both the public cost,
including the administrative cost for the Swedish programmes and the firm’s investment
costs. Start-up costs have been included in project Highland but not in PFE as this
information have not been publicly available. It should be noted that such cost may be
quite extensive in the initial part of a program wherefore it is recommended that programs
should run over a longer period of time according to audit II (Väisänen et. al, 2003).
Furthermore, a comparison between project Highland and PFE is not unambiguous as PFE
deals with both strategic issues and energy audits, and project Highland include only
energy audits. Another aspect of this comparison is that PFE focuses on electricity.
Evaluation of public policies is an intricate matter involving a large number of
plausible causalities (Vedung, 1998). In Larsen and Jensen (1999) it is stated that
evaluations of energy audit programs face a risk of being overly optimistic or, due to free-
rider effects, even give a false positive result as the efficiency investments are wrongly
attributed to a given audit when in reality they would have been implemented anyway. One
such causality is the electricity prices increases that have taken place in Sweden. In the
current evaluation, the causality of project Highland was therefore examined by means of
asking the six firms with the highest adoption rates and the five companies with the lowest
adoption rates if they would have undertaken the measures despite of the energy audit.
Both these categorises expressed great appreciation to the audits and those firms with the
highest adoption rates said that they would not have undertaken the measures without the
information provided from the energy audits. Inspired by Vedung (1998), some of the local
authority energy consultants involved in the project were also interviewed in order to
increase the study’s internal validity. None thought that the savings would have occurred
6 of 28

without the energy audits. Even though there is a degree of uncertainty involved, this gives
strong reasons to believe that the presented outcome of project Highland, within a limited
time period, actually refers to the input from the evaluated energy program. Another issue
to be commented is the reasons why not all companies (64) have answered the
questionnaire. This may be either because they for various reasons have been less
responsive to adopting the proposed measures or not been satisfied with the energy audit.
These are not uncommon problems when performing case study research of this type, see
e.g Worrell (2003).
When approaching the end-use energy efficiency issue using a systems approach,
savings in e.g. electricity yields savings high above the end-use figures taking the losses in
the generation of electricity in power plants into account. In the case of Sweden this is an
intricate matter having half of the generation of electricity located in hydro power and half
in nuclear power. Yet another such issue is that conversion to district heating enables more
generation of electricity, where CHP is used, as the heat load increases. This in turn may
lead to a reduced generation of electricity, in those plants with the highest cost (lowest
efficiency). These intricate issues and others involving system boundaries and its
definitions, has made restrictions necessary. This paper has been restricted to solely deal
with end-use energy efficiency issues at the actual firms. The following text refers, if not
else stated, to the 47 first firms within the program that have taken part of the evaluation.
2. Industrial energy programmes
Small and medium-sized enterprises (SMEs) often face difficulties in obtaining
strategic information on new and already existing technologies and often lack the capital
and technical expertise to invest in energy efficiency improvements (Shipley and Elliot,
2001). Larger enterprises often have their own skilled personnel and the necessary
resources to work strategically with energy efficiency issues, while the smaller firm’s
technical staff must deal with a broad range of issues and may not have the time or the
7 of 28

resources to focus on energy use (Shipley and Elliot, 2001). So far, the non-energy-
intensive sector and SMEs have often received little attention when it comes to energy end-
use policies (Ramirez et al., 2005), and Sweden is no exception3. In fact, Swedish energy
policy activities focusing on industrial end-use energy efficiency have, in relation to many
other countries, been relatively few. In Denmark, for example, the energy-saving policy is
well developed and quite strong compared with the policy in many other countries (Bach,
2001). Rising electricity prices (price increases per se, according to Bertoldi et al. (2005),
are an inadequate approach to inducing energy efficiency) and the new directive addresses
the need for governmental energy policy activity within the industrial sector of the
economy. Below follow a few examples of actions directed towards the industry, in
particular small and medium-sized and non-energy-intensive manufacturers are outlined.
Perhaps one of the largest energy programmes aimed at industry is the American
Information Assessment Center’s (IAC) program. Since 1976, more than 10,000
manufacturing firms have participated in the programme that offers energy audits to small
and medium-sized manufacturers. An evaluation of the programme showed that more than
half of the recommended measures were adopted and that the main reason for non-adoption
was that the measures were economically undesirable. Another large-scale energy
efficiency programme, that offered energy audits at a 50% discount between 1991 and
1997, was the Australian EEAP (Commonwealth Government’s Enterprise Energy Audit
Programme), covering some 1,200 firms with an average number of 297 employees. The
adoption rate for the proposed measures was 82% among the approximately six
recommendations proposed measures per firm (Harris et al., 2000). The evaluations of IAC
and EEAP both showed that the higher the average cost of the energy efficiency
investment, the less likely it was that a recommendation would actually be implemented
(Harris et al., 2000, Anderson and Newell, 2004).
8 of 28

After the project Uppdrag 2000, a national demand-side management programme
managed by Vattenfall4, between 1986 and 1991, different Swedish energy efficiency
programmes directed to industries are running or have been concluded, see Table 1.
Table 1: Swedish industrial energy efficiency programs.
Energy program, year
Type of program
Industries Quantitative evaluation
Qualitative evaluation
Sub-sidiaries
Calculated energy efficiency potential
EKO-Energi, 1994-2001
Voluntary agreements,
72 large energy-intensive
N.a. Increased priority to energy and environment
Public sponsored audit
N.a.
PFE, 2005- Long term agreements
117 energy intensive
Electricity saving
N.a. Tax discount
N.a.
SEA-seminars, 2006
Seminars, information
N.a. N.a. Increased awareness, low implementation
N.a. N.a.
Project Highland, 2003-2008
Energy audits 340 small and medium-sized
Energy (including electricity) saving
Barriers and driving forces, interviews
Public sponsored audit
Electricity savings , total energy savings
Sparkraft, 2000-2003
Energy audits Mainly service sector
N.a. N.a. Public sponsored audit
N.a.
Oskarshamn, 2000-2001
Energy audits 9 largest industries in Oskars-hamn
N.a. Barriers and driving forces (Rohdin and Thollander, 2006)
Public sponsored audit
Electricity saving 48%, total energy saving 40%
Elost, Energy audits 7 N.a. N.a. Public sponsored audit
Electricity saving 58%
Energieffektiva VästraGötaland, -2005
Energy audits 9 N.a. N.a. Public sponsored audit
Total energy saving 16%
Sustainable municipalities, 2004-2006
Energy audits 40 N.a. N.a. Public sponsored audit
Electricity saving 20-60%, total energy saving 30-38%
A qualitative evaluation of the EKO-Energi program, directed towards the energy
intensive industry, revealed that in particular the audits had given increased priority to
energy efficiency and environmental issues (Uggla and Avasoo, 2001). Despite intense
efforts, it was unfortunately not possible to evaluate the programme quantitatively (Lindén
9 of 28

and Carlsson-Kanyama, 2002, Widerström, 2007). The firms in another energy intensive
industrial programme, PFE, are offered a tax discount of 0.54 EUR/MWh5 on the newly
introduced tax on electricity for the Swedish manufacturing industry if the company fulfils
the requirements. Within the first two years, the companies in PFE must undertake an
energy audit, which should result in a number of energy efficiency measures that can be
implemented over the remainder of the period, and the implemented measures should result
in savings at least equivalent to the tax discount. The programme also includes the
mandatory implementation of an energy management system, the introduction of
standardized routines for purchasing and planning energy efficient technologies, energy
systems and plants (SEA, 2007). Among the about 1 200 firms which are eligible for
participation only 117 have joined the program (Ottosson and Peterson, 2007). Among
these 117 firms, 98 firms have been accepted (Ottosson and Peterson, 2007). The
electricity saving that the firms now have presented after the first two years and which
must be implemented in order to remain in the programme as well as public costs and
investment costs for the firms are presented in Table 3.
A nationwide action directed at small and medium-sized manufacturers from the
Swedish Energy Agency (SEA) in 2006 was a series of seminars given in 10 locations by
six regional energy agencies (SEA, 2006a). An evaluation of the seminars, based on 40
telephone interviews with participants from industry, revealed that they viewed the
seminars as valuable as it increased the awareness of the energy efficiency issue, but that
only a small number of the measures were implemented as a direct result of the seminars
(SEA, 2006a). According to the participants, the motivation existed but the firms did not
know how to become energy efficient; nor did they have the knowledge, skill, or
experience to work systematically with the issue.
SEA also supports the local authority energy consultancy6 in each municipality
financially, and also, to some extent, the regional energy agencies by supporting specific
10 of 28

Table 3: Key figures for project Highland and PFE. The costs refer, if not else stated to the participating firms within PFE and the 47 firms within project Highland. Costs for establishing an energy management system etc. in PFE are not included in the investment cost.
Project Highland1,2
PFE3,4
[I] Number of firms 47 98
[II] Electricity use (GWh/year) 100 31 200
[III] Energy use (GWh/year) 182 106 6005
[IV] Electricity savings (GWh/year) 4/106 -/7656,7
[V] Total energy savings, including electricity (GWh/year)
7/166 -/8086
[VI] Total electricity saving (%) 4/106 -/2.56,7
[VII] Total energy savings (%) 3.8/8.86 -/0.86
[VIII] Number of measures 142/2816 -/8726
[IX] Subsidy (EUR) 52 000 (audit costs)
65 900 000 (tax discount) 8
[X] Administration (EUR) 29 600 4 300 0009
[XI] Investment costs at the firm (EUR) 933 00010 140 311 022
projects. The local authority energy consultancy was previously aimed at citizens and
offered independent energy advice. Recently, however, this service was also opened to the
industrial sector. Unfortunately, with one or few exceptions the local authority energy
consultants are presently not able to support industry as they lack the technical skills and
the necessary experience to do so. The new guidelines from SEA opened up the possibility
to run project Highland, which is presented and evaluated later in this paper.
1 Results in this table are based on the evaluated 47 firms. 2 Measures included Space heating: 22%/27% Ventilation: 24%/23% Water: 3%/4% Lighting: 14%/19% Compressed air: 17%/17% Production processes: 13%/15% Educational: 5%/11%. 3 SEA (2007) and (Ottosson and Peterson, 2007). 4 Measures included Lighting: 1%; Fans: 6%; Indirect electricity savings: 2%; Compressors: 10%; Chiller plants: 2%; Space heating and ventilation systems: 3%; Motors: 4%; Production processes; 48%; Pumps: 17%; Other electricity savings: 7%. 5 Of which electricity accounts for 31,2 TWh, fossil fuels for 16,7 TWh and renewable fuels for 58,7 TWh. TWh/16,7 TWh/58,7 TWh. 6 Implemented/planned. 7 Planned electricity measures in PFE which is mandatory for implementation in order to remain within the program. 8 When assuming that all savings are achieved right away, based on 6 % discount rate (71 600 000 EUR at 3% and 60 800 000 EUR at 9%). 9 This figure is a rough estimation by Åberg (2006) as the program is still running. 10 Based on SEA, 2000.
11 of 28

Other Swedish actions in the past include Sparkraft, which offered about 10 energy
audits per municipality to different actors in south-eastern Sweden, carried out by three
regional energy agencies between 2000 and 2003. The project was mainly aimed at the
service sector, i.e. schools and other public buildings, but some industries were also
covered (Sparkraft, 2007). Another project covered the nine largest industries within the
municipality of Oskarshamn and was carried out between 2000 and 2001 by ESS (The
Energy Agency for Southeast Sweden) and Linköping University (Trygg, 2005). Yet
another project, named ELOST, involved energy audits and focused on reducing the use of
electricity as an adjustment to an assumed electricity price increase, and many measures
therefore include conversion from electricity to other energy carriers. The aggregated
energy saving potential is thus much lower (Franzén, 2005). A project in southwest
Sweden, named Energieffektiva Västra Götaland, concluded in May 2005, included nine
energy audits for the manufacturing industry (Environmental Health Collaboration, 2005).
In another project funded by SEA, called Sustainable Municipalities, energy audits aimed
at the commercial sector in each of the five participating municipalities were conducted by
Linköping University between 2004 and 2006 (SEA, 2004b-c, SEA, 2005, SEA, 2006b).
The degree of adoption within these programmes has not yet been evaluated. Two regional
energy agencies are currently offering a total of 25 industrial energy audits respectively in
two regions in Sweden where the results from the audits will later be spread through
seminars and a booklet. Also, the West Sweden Chamber of Commerce and Industry
(WSCCI) currently offers a total of 30 industrial tools to manufacturing industries that have
energy costs over 2 MSEK. The project’s name is Energy Focus (WSCCI, 2007). In
addition, ESS is currently working with a small number of industrial energy audits (3-4) in
six municipalities in southeast Sweden (ESS, 2007).
12 of 28

3. Project Highland
The most extensive action targeting the adoption of energy efficiency measures in
small and medium-sized manufacturing industries over the past 15 years have been project
Highland, funded partly by the European Union’s programme Objective 2 South Sweden.
Energy use by industry in the Highland region is about 1.1 TWh annually and the program
covered about half of this industrial energy use.
The local energy programme included 340 energy audits in six municipalities, of
which 139 audits were made at manufacturing industries. A total of 359 manufacturing
industries with 3 or more employees are located in this region (SCB, 2007). The structure
of the beginning of an audit is presented in Fig. 1. and began when the local authority
energy consultant in each municipality offered public-sponsored energy audits to the
enterprises within the municipality.
Energy Agency 1 LAEC contacts the firm
of South East 2 LAEC contacts the auditor att ESS
Sweden (ESS) 3 ESS auditor contacts the firm
3 2
Local Authority1 Energy Consultant
The firm (LAEC)
Fig. 1. The beginning of an energy audit in project Highland.
The audits were carried out by ESS, which unlike the other Swedish regional energy
agencies work on a broad basis towards industrial actors, and is also by far the largest
Swedish regional energy agency. The energy audits included individual energy audit
13 of 28

reports where specific energy efficiency measures for each company were presented.
However, due to the limited amount of time assigned each audit, and due to the fact that
SEA did not allow complete audits due to a risk of competitive disadvantages for firms not
included in the programme, fewer than half of the recommended measures were quantified
(ESS, 2007). ESS was the executive part but in some cases the local authority energy
consultant supported ESS during field visits. The audits were restricted to two days: a one-
day field visit and a day to compile the energy audit report. The measures investigated in
the project were mainly related to the generic (support) processes and may be divided into
measures related to the building, water, space heat and cooling, ventilation, lighting,
compressed air, load management, education, and decision-making support in the planning
process. If the used audit methodology is compared to other international audits
categorizations such as the ASHRAE categorization, project Highland delivered audits
similar to a Level I – Walk-Through Analysis (ASHRAE, 2004).
3.1. Evaluation of project Highland
The overall picture from the in-depth interviews with the contact persons at the firms
were that the energy audit report was considered clear and presented specific proposals for
the plant. The measures were spread among the generic and production processes and easy
to understand. Despite that the above picture was supported by the interviewed
respondents, it should be held in mind that only a few firms were asked (11), and that 6 of
these firms had been successful in adopting the proposed measures. In some cases the
measures were considered to have too long pay-offs to be of interest and in some cases the
measures were considered to be too general. One positive aspect mentioned was that the
program was considered to save a lot of time for the company staff and that it was easier to
receive budget funding when having a report to rely on. Through the energy audit, the
building or environmental manager received economic figures (saved Euros per year) for
the investments, something which was considered positive. The respondents also pointed
14 of 28

out the importance that measures are quantified in the energy audit reports. The energy
auditors were considered trustworthy, credible and good listeners. It was considered
positive that someone outside the firm came in with new ideas, as some of the respondents
felt a difficulty in generating ideas themselves. Furthermore, some of the respondents had
been in contact with the energy auditor after the energy audit to return a question.
One respondent experienced that the local authority energy consultant was eager to
help them out but the majority of the respondents have not had any contact with the local
authority energy consultant more than the initially held contact where the energy consultant
contacted staff at the firm offering the energy audit to be done at their site. In one
municipality the local authority energy consultant contacted companies when they asked
for building permits, something that has been much appreciated. The company staff then
was given practical ideas regarding their energy system and what may be considered
important when a new construction was set up.
The energy saving potential for the whole programme (139 manufacturers) and the
evaluated 47 companies are presented in Table 2, and the degree of adoption for the latter
is presented in Fig. 2 and Fig. 3 In addition, the energy audits from the evaluated firms
resulted in measures for energy conversions to district heating as well as site-located
biofuel boilers, of about 22 GWh and 3 GWh respectively. The number of employees at the
evaluated companies ranged from just a few to about 450, the average being 72 employees.
The total number of proposed measures was 643 of which 142 measures have been
implemented and a further 139 are planned. The actual energy savings, of the quantified
measures, are presented in Table 3. Only about 50% of the measures that have been
implemented, or are planned to be, were quantified. The figures in Table 3 are thus a
conservative estimate of the actual adoption rate. Regarding the degree of adoption, Table
3 presents the degree of adoption for different categorises of energy efficiency measures
and the savings as well as the public costs and investment costs for the firms. Table 3 also
15 of 28
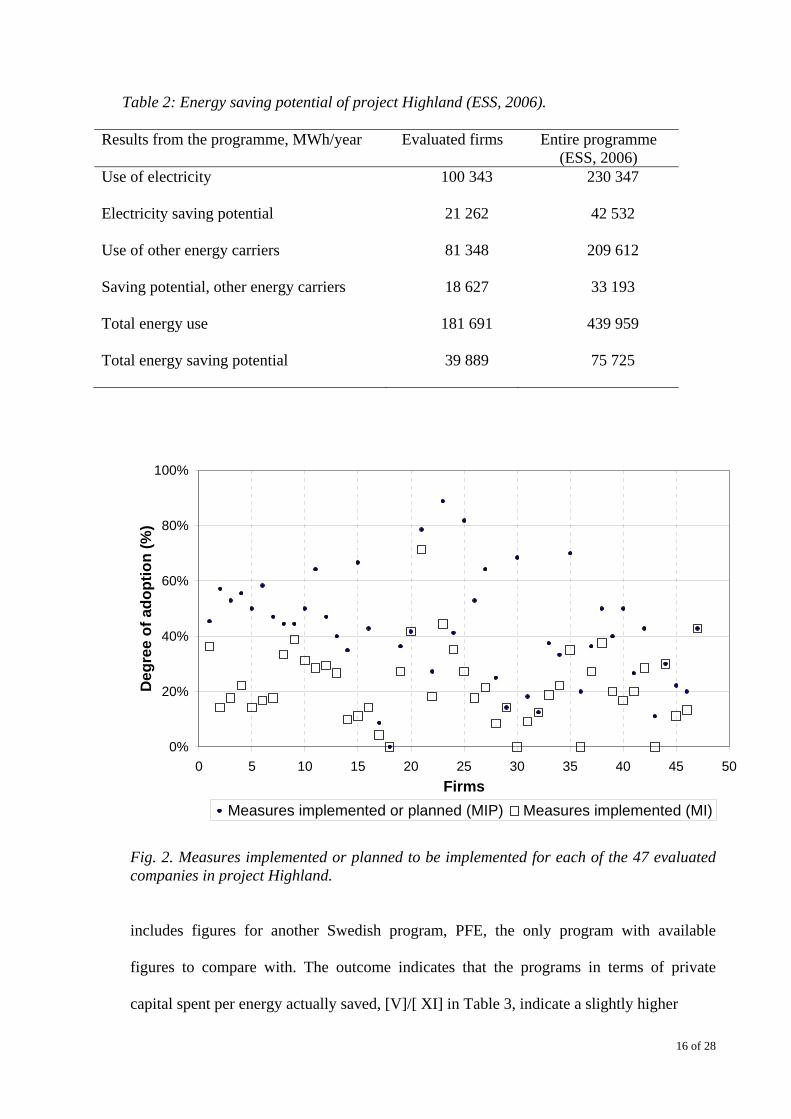
Table 2: Energy saving potential of project Highland (ESS, 2006).
Results from the programme, MWh/year Evaluated firms Entire programme (ESS, 2006)
Use of electricity 100 343 230 347
Electricity saving potential 21 262 42 532
Use of other energy carriers 81 348 209 612
Saving potential, other energy carriers 18 627 33 193
Total energy use 181 691 439 959
Total energy saving potential 39 889 75 725
0%
20%
40%
60%
80%
100%
0 5 10 15 20 25 30 35 40 45 50Firms
Deg
ree
of a
dopt
ion
(%)
Measures implemented or planned (MIP) Measures implemented (MI)
Fig. 2. Measures implemented or planned to be implemented for each of the 47 evaluated companies in project Highland.
includes figures for another Swedish program, PFE, the only program with available
figures to compare with. The outcome indicates that the programs in terms of private
capital spent per energy actually saved, [V]/[ XI] in Table 3, indicate a slightly higher
16 of 28
0 20 40 60 80 100 120 140 160 180
Other
Hot tap water
Production processes
Compressed air
Ventilation
Lighting
Educational
Space heating
Number of measuresImplemented Planned Not considered
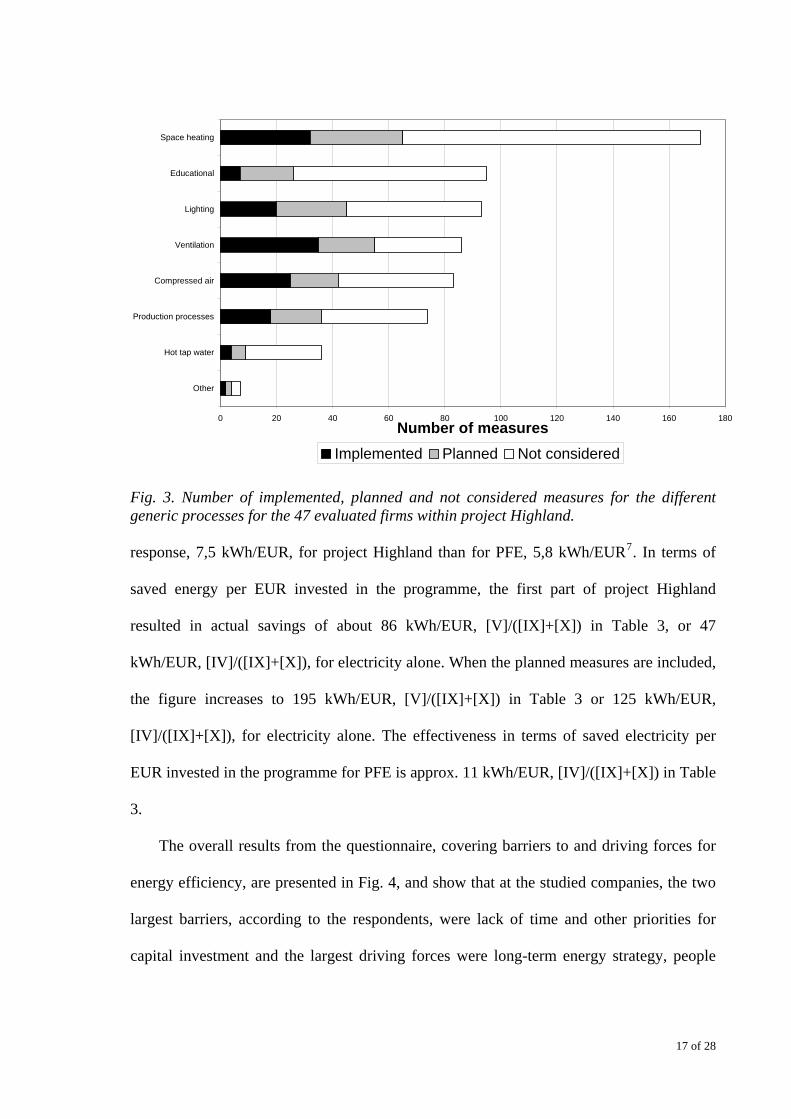
Fig. 3. Number of implemented, planned and not considered measures for the different generic processes for the 47 evaluated firms within project Highland. response, 7,5 kWh/EUR, for project Highland than for PFE, 5,8 kWh/EUR7. In terms of
saved energy per EUR invested in the programme, the first part of project Highland
resulted in actual savings of about 86 kWh/EUR, [V]/([IX]+[X]) in Table 3, or 47
kWh/EUR, [IV]/([IX]+[X]), for electricity alone. When the planned measures are included,
the figure increases to 195 kWh/EUR, [V]/([IX]+[X]) in Table 3 or 125 kWh/EUR,
[IV]/([IX]+[X]), for electricity alone. The effectiveness in terms of saved electricity per
EUR invested in the programme for PFE is approx. 11 kWh/EUR, [IV]/([IX]+[X]) in Table
3.
The overall results from the questionnaire, covering barriers to and driving forces for
energy efficiency, are presented in Fig. 4, and show that at the studied companies, the two
largest barriers, according to the respondents, were lack of time and other priorities for
capital investment and the largest driving forces were long-term energy strategy, people
17 of 28

with real ambitions, an environmental company profile, and/or an EMS (Environmental
Management System).
0,30 0,35 0,40 0,45 0,50 0,55 0,60 0,65 0,70
International competitionEnvironmental company profile and/or EMS
People with real ambitionLong term strategy
Conflicts of interest within the companyUncertainty regarding the companies future
Technology is inappropriate at this sitePossible poor performance of equipment
Cost of identifying opportunities, analyzing cost effectiveness and tendering Poor information quality regarding energy efficiency opportunities
Long decision chainsEnergy objectives not integrated into operating, maintenance or pruchasing procedures
Slim organizationTechnical risks such as risk of production disruptions
Lack of staff awarenessLow priority given to energy management
Lack of technical skillsDifficulties in obtaining information about the energy consumption of purchased equipment
Lack of sub-meteringLack of budget funding
Cost of production disruption/hassle/inconvenienceAccess to capital
Other priorities for capital investmentsLack of time or other priorities
Barriers
Drivers
Fig. 4. Ranked results of barriers to and driving forces for energy efficiency at the 47 evaluated manufacturing firms in project Highland.
Discussion
Regarding which energy efficiency measures that were implemented, it is seen from
Fig. 3 that the four most commonly given measures were related to the generic processes,
space heating, ventilation, lighting and compressed air. In terms of implemented and
planned measures, these four categorises were also the most commonly implemented and
planned measures. Comparing these figures with figures for PFE reveals that nearly half of
the planned measures for PFE were production related measures and furthermore much
larger, both in terms of energy saved and in terms of investment costs. There are two
plausible reasons for this. First, the generic processes represents a much larger degree of
the aggregated energy use for SMEs in relation to the more energy intensive firms and
secondly, the energy auditors in project Highland have in general not had specific
experience in the production related processes. Future programs towards SMEs should
18 of 28

thus, firstly, be aimed towards the generic processes. In terms of payback periods, project
Highland seems to have slightly higher figures than PFE even though the magnitude of the
investments is much larger for PFE.
As regards barriers and driving forces inhibiting the implementation of energy
efficiency measures, small and medium-sized manufacturers (SMEs) often face difficulties
in obtaining strategic information on new and already existing equipment (Shipley and
Elliot, 2001). The largest barriers spotted in this study were related to the non-priority of
energy efficiency investments and lack of access to capital, i.e. non-information related
barriers, thus indicating that these barriers are weakened through the energy audits. The
existence of a long-term energy strategy and people with real ambition were the most high-
ranked drivers. Even though in-house activities like management systems could be a way
of overcoming the largest barriers, as also stated by the respondents, it could be questioned
whether this driver alone is enough to lower the energy use at SMEs. In fact, many of the
implemented measures would then have been implemented already. Providing SMEs with
low cost energy audits like in the evaluated local energy programme using the local
authority energy consultants thus seems to be a successful policy action towards small and
medium-sized manufacturers in terms of actual energy saved. However, even though the
companies have received energy audits that reduce the magnitude of the perceived
information related barriers, there are still problems related to these barriers, such as
difficulties in obtaining information, lack of technical skills and staff awareness, and poor
information quality as regards energy efficiency opportunities. This indicates a need for
even more detailed and specific information, which could increase the adoption even
further.
It should be noted that while information programs like project Highland is aimed
towards reducing information related barriers such as imperfect information, other policy
instruments such as LTAs which involves mandatory routines to be adopted, including e.g.
19 of 28

energy management systems within the organisation, may enable other barriers than solely
information related such to be reduced. Consequently, LTAs like PFE could be argued to
be a sound approach towards energy intensive larger firms while information programs like
the evaluated project Highland may be a better choice for small and medium sized
manufacturers.
The adoption rate of over 40% indicates that the information provided in project
Highland has in general been accepted by the respondents. It is of interest to compare these
figures with results from other programmes, especially Swedish ones. However, the cost
and outcome of the different Swedish programmes have not often been presented
explicitly, even though this was often initially the ambition. The only programme in which
adoption figures have been presented is the PFE programme. Even though many of the
measures in PFE have not yet been adopted, the presented measures are mandatory for
companies wishing to remain in the programme. A comparison of the two programs
indicates that project Highland seems to be more effective in reducing the use of electricity.
The comparison, however, is as mentioned in a previous section not unambiguous as PFE
deals with both strategic issues and energy audits, and project Highland only included
energy audits and that the outcome of PFE might also result in the reduction of non-
information related barriers and result in savings in other energy carriers, even though this
is not presented in the figures. However, the comparison of the two programmes addresses
the possibility to expand PFE by including other energy carriers in the programme,
something that most likely would increase the effectiveness of PFE.
Yet another factor worth noting is that the number of participating firms is much larger
within project Highland than in PFE. For project Highland, 139 of 359 firms in the region
received energy audits, representing roughly about 40 percent of the population while PFE
show figures of about 10 percent (Ottosson and Peterson, 2007). This address the need to
20 of 28

develop a portfolio of energy policies rather than solely using one approach if one wants to
reach as many firms as possible as also stated by, e.g. Christoffersen et al. (2006).
Apart from Sweden, other industrial energy programmes such as the Australian EEAP
and the programme run by the IAC in America show adoption rates of approx. 80% and
50% respectively, while project Highland achieves about 40%, if the planned measures are
included. In EEAP the companies received a 50% subsidy of the cost of the audit, while the
audits were offered at no cost in both project Highland and IAC. The only partly financed
subsidy may explain the EEAP’s higher adoption rate. The design of EEAP would
substantially have increased the adoption rates as only companies that showed active
interest in receiving energy audits participated in the programme. Another reason for the
high figures in the EEAP was that these measures were all quantified and included
investment assessments for each measure; on average, about six recommendations with
investment assessments were presented. Companies participating in project Highland were
on average offered about 13 measures, of which fewer than half were quantified in terms of
saved energy and no measures included investment assessments. The IAC, like EEAP,
offered fewer measures, on average about 7 individual measures that included investment
assessments, resulting in higher adoption rates compared with project Highland. The
inclusion of investment assessments thus seems to increase the adoption rate, and
highlights the question of including such assessments in future programmes. Furthermore,
future programmes should also include quantified energy saving figures to a higher degree
than was the case in project Highland.
Conclusion
The evaluation of project Highland indicates that by using intermediaries like local
authority energy consultants and regional energy agencies, the concept of local energy
programmes seems to be an effective energy policy option in terms of public money spent
21 of 28

in relation to energy saved. However, further work in order to improve the energy auditing
procedure is suggested as an area for future research.
The largest barriers found in the studied SMEs were the low priority of energy issues,
and to reduce this barrier there is a need for a strong public policy targeting these types of
companies. When comparing the local energy program, project Highland, to the Long
Term Agreements program, PFE, the outcome in terms of private money spent in relation
to energy saved is approximately the same. However, when comparing public money spent
in relation to energy saved project Highland appears more effective. Considering the threat
of increased global warming both these types of programs are argued to be necessary.
Acknowledgements
The work has been carried out under the auspices of the Energy System Programme,
which is financed by the Swedish Foundation for Strategic Research and the Swedish
Energy Agency. We kindly thank the respondents at the studied industries for giving freely
of their time to answer our questions. We would also like to thank Björn Johansson and
Carl-Johan Bondesson for valuable contributions in the early stage of this project. Also, we
wish to thank Olle Faxälv for valuable help with the collection of data in the latter part of
this project. Finally, we would like to show our appreciation to the two anonymous referees
whose useful comments have improved the quality of this paper considerably. The usual
disclaimer holds.
References
Anderson, S.T., Newell, R.G., 2004. Information programs for technology adoption: the case of energy-
efficiency audits. Resource and Energy Economics 26 (1), 27-50.
ASHRAE, 2004. Commercial Building Energy Auditing. American Society of Heating, Refrigeration and
Air-conditioning Engineers, Inc (ASHRAE), Atlanta.
22 of 28

Bach, P., 2001. An energy-efficiency policy - Problems, barriers and possibilities. In: Proceedings of the
2001 ECEEE summer study “Further than ever from Kyoto? Rethinking energy efficiency can get us
there”, vol. 1. European Council for an Energy-Efficient Economy, 82-90.
Bertoldi, P., Rezessy, S., Bürer, M.J., 2005. Will emission trading promote end-use energy efficiency and
renewable energy projects? In: Proceedings of the 2005 ACEEE summer study on energy efficiency in
industry “Cutting High Costs of Energy”, vol. 4. American Council for an Energy-Efficient Economy, 1-
12.
Christoffersen, L.B., Larsen, A., Togeby, M. Empirical analysis of energy management in Danish industry.
Journal of Cleaner Production 14 (2006), 516-526.
Dag, S., 2000. Volvo faces a deregulated European electricity-market. Linkoping studies in Science and
Technology, Dissertation No. 663, Linköping University, Sweden.
EEPO (European Electricity Prices Observatory), 2003. Year 2002 Results. Brussels. COM (European
Commission), 2006.
EC, 2006. Directive 2006/32/EC of the European Parliament and of the Council of 5 April 2006 on energy
end-use efficiency and energy services and repealing Council Directive 93/76/EEC, Brussels.
Environmental Health Collaboration, 2005. The homepage of the Environmental Health Collaboration.
Download at: www.miljosamverkan.se.
ESS (Energy agency of South East Sweden), 2006. Results from the project Hogland. Energy Agency of
South East Sweden, 2006.
ESS (Energy agency of South East Sweden), 2007. Personal communication with staff at ESS, January, 2007.
Franzén, T. ENSAM Energisystemanalysmetod för industriella energisystem (ENSAM Energy systems
analysis method for industrial energy systems). Linkoping studies in Science and Technology,
Dissertation No. 1092, Linköping University, Linköping. [in Swedish]
23 of 28

Harris, J., Anderson, J., Shafron, W., 2000. Investment in energy efficiency: a survey of Australian firms.
Energy Policy 28 (12), 867-876.
Hirst, E., Brown, M., 1990. Closing the efficiency gap: barriers to the efficient use of energy. Resources,
Conservation and Recycling 3 (4), 267–281.
IEA (International Energy Agency), 2004. Key world energy statistics. IEA, Paris. Download at:
http://www.iea.org/dbtw-wpd/Textbase/nppdf/free/2004/keyworld2004.pdf
Johansson, B., Modig, G., Nilsson, L.J., 2007. Policy instruments and industrial responses – experiences from
Sweden. In: Proceedings of the 2007 ECEEE summer study “Saving energy – just do it”, Panel 7.
European Council for an Energy-Efficient Economy, 1413-1421.
Larsen, A., Jensen, M. Evaluations of energy audits and the regulator. Energy Policy 27 (9), 557–564.
Lindén, A.L., Carlsson-Kanyama, A. Voluntary agreements—a measure for energy-efficiency in industry?
Lessons from a Swedish programme. Energy policy 30 (10), 897-905.
Nord-Agren, L., 2002. The electricity usage pattern for cooker manufacturing in three European Countries: a
benchmarking study of Electrolux Factories. Linkoping studies in Science and Technology, Thesis No.
987, Linköping University, Linköping.
Ottosson and Peterson, 2007. First results from the Swedish LTA programme for energy efficiency in
industry. In: Proceedings of the 2007 ECEEE summer study “Saving energy – just do it”, Panel 7.
European Council for an Energy-Efficient Economy, 1517-1525.
Ramirez, C.A., Patel, M., Blok, K., 2005. The non-energy intensive manufacturing sector. An energy analysis
relating to the Netherlands. Energy 30 (5), 749–767.
Rohdin, P., Thollander, P., 2006. Barriers to and Driving Forces for Energy Efficiency in the Non-energy
Intensive Manufacturing Industry in Sweden. Energy 31 (12), 1836-1844.
24 of 28

Rohdin, P., Thollander, P., Solding, P. 2007. Barriers to and drivers for energy efficiency in the Swedish
foundry industry. Energy Policy 35 (1), 672-677.
SCB, 2007. Personal communication with staff at SCB. SCB (Statistics Sweden), Örebro.
SEA (Skane Energy Agency), 2000. Lönsamma sätt att spara energi – en lathund (Profitable energy savings).
Skane Energy Agency, Malmö. [in Swedish]
SEA, 2002. Redovisning av Energimyndighetens insatser för energieffektivisering åren 1998-2001 (The work
of the Swedish Energy Agency between the years 1998-2001. Swedish Energy Agency, Eskilstuna. [in
Swedish]
SEA (Swedish Energy Agency), 2004a. Energy in Sweden 2004. Swedish Energy Agency Publication
Department, Eskilstuna.
SEA (Swedish Energy Agency), 2004b. Energianalys Örnsköldsvik (Energy audits, Örnsköldsvik). Swedish
Energy Agency, Eskilstuna. [in Swedish]
SEA (Swedish Energy Agency), 2004c. Energianalys Ulricehamn (Energy audits, Ulricehamn). Swedish
Energy Agency, Eskilstuna. [in Swedish]
SEA (Swedish Energy Agency), 2005. Energianalys Borås (Energy audits, Borås). Swedish Energy Agency,
Eskilstuna. [in Swedish]
SEA (Swedish Energy Agency), 2006a. Utvärdering av seminarieserie industri 2005-2006. Swedish Energy
Agency, Eskilstuna. [in Swedish]
SEA (Swedish Energy Agency), 2006b. Energianalys Vingåker (Energy audits, Vingåker). Swedish Energy
Agency, Eskilstuna. [in Swedish]
SEA (Swedish Energy Agency), 2007. Two years with PFE. Swedish Energy Agency, Eskilstuna.
25 of 28

Shipley, A.M., Elliot, R.E., 2001 Energy Efficiency Programs for Small and Medium Sized industry. In:
Proceedings of the 2001 ACEEE summer study on energy efficiency in industry, vol. 1. American
Council for an Energy-Efficient Economy, 183-196.
Sparkraft, 2007. The homepage of Sparkraft. Download at: www.sparkraft.se
SPRU (Science and Technology Policy Research), 2000. Reducing Barriers to Energy Efficiency in Public
and Private Organizations, Brighton.
Stern, P.C., Aronsson, E. (Eds.), 1984. Energy Use: The Human Dimension, New York.
The Swedish Ministry of Enterprise, Energy and Communications, 2001.Effektivare energianvändning, Ds
2001:60. Stockholm. [in Swedish]
Thollander, P., Karlsson, M., Söderström, M., Creutz, D. 2005. Reducing industrial energy costs through
energy efficiency measures in a liberalized European electricity market - case study of a Swedish iron
foundry. Applied Energy 81 (2), 115-126.
Trygg, L., Karlsson B., 2005. Industrial DSM in a deregulated European electricity market - a case study of
11 plants in Sweden. Energy Policy 33 (11), 1445-1459.
Trygg, L., 2006. Swedish industrial and energy supply measures in a European Perspective. Linkoping
studies in Science and Technology, Dissertation No. 1049, Linköping University, Linköping.
Uggla, U., Avasoo, D., 2001. EKO-Energi - Successful voluntary agreements on energy efficiency and
environmental control in Swedish industry. In: Proceedings of the 2001 ECEEE summer study “Further
than ever from Kyoto? Rethinking energy efficiency can get us there”, vol. 1, European Council for an
Energy-Efficient Economy, 252-260.
Widerström G., 2007. Personal communication with staff at the Swedish Energy Agency. January, 2007.
26 of 28

Väisänen H. (co-ordinator), 2003. Guidebook for Energy Audit Programme Developers. Download at:
http://www.energyagency.at
Worrell, E., Laitner, J., Ruth, M., Finman, H. Productivity benefits of industrial energy efficiency measures.
Energy 28 (12), 1081–1098.
WSCCI (West Sweden Chamber of Commerce and Industry), 2007. The homepage of the West Sweden
Chamber of Commerce and Industry. Download at: http://www.west.cci.se
Åberg, M., 2006. Personal communication. SEA (Swedish Energy Agency), Eskilstuna.
Vedung, E., 1998. Utvärdering i politik och förvaltning. (Evaluation in Policy and Administration).
Studentlitteratur, Lund. [in Swedish]
27 of 28

28 of 28
1 This paper refers to the definition of SMEs derived from Shipley and Elliot (2001). Small firms are those which
have fewer than 250 employees while medium-sized firms comprise 250-500 employees.
2 The first part means the first participating firms in project Highland, i.e. the 64 manufacturing firms out of about
140 were 47 responded on the questionnaire.
3 For a summary of current industrial energy policies in Sweden, please see Johansson et al. (2007). 4 Vattenfall is Europe’s fourth largest producer of electricity and the largest producer of heat and is owned by the
Swedish state.
5 Or 5 SEK/MWh. 1 EUR is equivalent to 9.2745 SEK (February 21st, 2006).
6 The primary task of a local authority energy consultancy is to provide consumers with independent advice on
energy matters involving areas such as energy, technology and consumer guidance (SEA; 2007).
7 It should be noted that the comparison refers to the implemented measures in project Highland.
Related Documents