Energy Plus Approach: India Case Study Country report 2015 July 2015 Final Version

Welcome message from author
This document is posted to help you gain knowledge. Please leave a comment to let me know what you think about it! Share it to your friends and learn new things together.
Transcript

Energy Plus Approach: India Case Study
Country report 2015
July 2015 Final Version

Global Network on Energy for Sustainable Development (GNESD) UNEP DTU Partnership UN City Marmorvej 51 2100 Copenhagen Ø Denmark Tel: +45 4533 5250 http://www.gnesd.org/
Acknowledgement: This report was prepared for the Global Network on Energy for Sustainable Development by the Energy and Resources Institute (TERI), New Delhi, India Authors: Debajit Palit, Arvind Garimella, Martand Shardul and Saswata Chaudbury The front cover photo has been found through Flickr and is courtesy of DFID - The UK Department for International Development
Suggested Citation: GNESD 2015. Country report (India). Analysis of the electrification programme in India using the ‘energy plus’ framework and the key lessons. Report prepared for the Global Network on Energy for Sustainable Development by the Energy and Resources Institute (TERI).

Prepared for Global Network on Energy for Sustainable Development
(GNESD)
by Debajit Palit, Arvind Garimella, Martand Shardul and Saswata Chaudbury
Final Report July 2015
Analysis of the electrification programme in India using the ‘energy plus’ framework and the key lessons
© The Energy and Resources Institute 2015
Suggested format for citation
T E R I. 2015 Analysis of the electrification programme in India using the ‘energy plus’ framework and the key lessons New Delhi: The Energy and Resources Institute. 81pp.
For more information Project Monitoring Cell T E R I Tel. 2468 2100 or 2468 2111 Darbari Seth Block E-mail [email protected] IHC Complex, Lodhi Road Fax 2468 2144 or 2468 2145 New Delhi – 110 003 Web www.teriin.org India India +91 • Delhi (0)11

Analysis of the electrification programme in India using the ‘energy plus’ framework and the key lessons
List of Abbreviations
AGECC : Advisory Group on Energy and Climate Change
AP : Andhra Pradesh
APMACS : Andhra Pradesh Mutually Aided Cooperative Society Act
AP NE : Andhra Pradesh Non-Energy
AP NNE : Andhra Pradesh No Non-Energy
AP1 NE : Andhra Pradesh1 Non-Energy
AP1 NNE : Andhra Pradesh1 No Non-Energy
CBO : Community Based Organization
CEA : Central Electricity Authority
DDG : Decentralized Distributed Generation
DDUGJY : Deendayal Upadhyaya Gram Jyoti Yojana
DISCOMs : Distribution Companies
Entp. : Enterprise
GMS : Godavari Maha Samakhya
HH : Household
JNNSM : Jawaharlal Nehru National Solar Mission
MCP : Micro Credit Plan
MDG : Millennium Development Goals
MNREGA : Mahatma Gandhi National Rural Employment Guarantee Act
MoP : Ministry of Power
MP : Madhya Pradesh
MPCE : Monthly Per Capita Expenditure
MP NE : Madhya Pradesh Non-Energy
MP NNE : Madhya Pradesh No Non-Energy
MNRE : Ministry of New and Renewable Energy

MoSPI : Ministry of Statistics and Programme Implementation
NABARD : National Bank for Agriculture and Rural Development
NCAER : National Council for Applied Economic Research
NEP : National Electrification Policy
NRLM : National Rural Livelihood Mission
NSSO : National Sample Survey Organization
O&M : Operation and Maintenance
PV : Photovoltaic
RGGVY : Rajiv Gandhi Grameen Vidyutikaran Yojana
REDS : Rural Economic and Demographic Survey
REP : Rural Electrification Policy
REST : Rural Electricity Supply Technology
RVEP : Remote Village Electrification Programme
SC : Scheduled Caste
ST : Scheduled Tribe
SEFA : Sustainable Energy For All
SERP : Society for Elimination of Rural Poverty
SHG : Self Help Group
SHS : Solar Home Systems
VESP : Village Energy Security Programme
VO : Village Organization

Analysis of the electrification programme in India using the ‘energy plus’ framework and the key lessons
Executive Summary India is a predominantly rural country, with approximately 73 per cent of the total
population living in villages. There is a consensus that ‘expanded access to affordable,
reliable, and socially acceptable energy services’ is a prerequisite for achieving the
Millennium Development Goals (MDGs), as well as the overall socio-economic development
of any rural area. Thus, in order to contribute to India’s overall development, the village
economy must have access to modern energy and cleaner fuel sources. Over the years, a
number of federal government programmes and state-level initiatives attempted to enhance
energy access either as part of overall rural development or specifically targeting rural
electrification. Specifically, the Rajiv Gandhi Grameen Vidyutikaran Yojana (RGGVY) was
launched in 2005 under the aegis of the ‘Bharat Nirman’ (Build India) initiative, a time-
bound national development plan focused on rural areas. The objective of the programme
was not just to provide lighting to rural households, but also to attempt to create
opportunities for the productive use and other co-benefits of electricity in rural areas. In
addition, the Ministry of New and Renewable Energy (MNRE) has also been enhancing
electricity access through decentralized renewable energy technologies wherever grid
extension is not techno-economically feasible. As well as domestic lighting, the MNRE’s
programme also endeavoured to provide energy services for community facilities, pumping
for drinking water supply or irrigation, and income-generating and other economic activities
in the village. However, the progress of these programmes has largely been documented
from the perspectives of physical connections, village coverage and financial and
institutional delivery mechanisms; there has been a relatively lesser focus on the outcomes
from the perspective of household electricity demand or the contribution of households to
the local rural economy.
This study attempts to analyse the rural electrification programme in India and its
achievement, with a special focus on the co-benefits and productive use of electricity in line
with the ‘Energy Plus’ approach. The study also attempts to identify the key factors for the
success and limitation of rural electrification policies and programmes and their
implementation in enhancing electricity access and creating economic and income
generating opportunities for the rural poor to enhance local incomes and alleviate poverty.
Specifically, the objectives of the study are:

• To evaluate rural electrification programs using the ‘energy plus’ framework (Box 1)
to understand and examine how Indian electricity access programs have addressed
these issues;
• To assess the overall impact of rural electrification on local economies such as their
contribution to sustainable livelihoods, income-generation, newly-developed micro-
industries, living standards and poverty reduction, and to identify the key factors
that have contributed to their success and/or failures;
• To analyse the relevant issues and suggest recommendations for strengthening the
rural electrification program for sustainable electrification in the context of the
‘energy plus’ approach for enhancing electricity access. This will contribute to the
SEFA goal of universal energy access by 2030.
Study Findings The results of the primary survey reveal that income increases with electricity access, which
also corroborates the existing literature. In fact, income is shown to increase even for un-
electrified households and enterprises. Based on the cases of livelihood clusters from the
states of Andhra Pradesh and Madhya Pradesh in India, the study finds that strong
institutions foster the channelling of resources, including electricity for productive use. The
study concludes that institutions aid in incorporating both energy and non-energy inputs
(such as access to social infrastructure, skills training, capacity-building, and market value
chain creation) to catalyse productive activities leading to sustainable electricity access for
all. Specifically, the key findings from the study are as follows:
• The study found that the average income of an electrified household is higher than
the average income of an un-electrified household in both grid and off-grid areas.
Further, electrification results in increases in income (including in real terms) for
both electrified and un-electrified households in both grid and off-grid areas.
• Electrified households in grid-connected areas reap more benefits over time (changes
in income are higher) compared to un-electrified households. Thus, grid supply
probably generates better livelihoods for electrified households compared to
households connected to off-grid systems.
• Income changes are higher for electrified households with businesses as their
primary source of earnings compared to electrified households with other sources of
Analysis of the electrification programme in India using the ‘energy plus’ framework and the key lessons
earning. Thus, usage of electricity in productive or income-generating activities helps
households acquire better income-generating opportunities.
• Institutions are the fundamental non-energy inputs that can ensure sustained non-
energy inputs to households and enterprises.
• Institutionally channelled non-energy inputs to households or enterprises can trigger
productive usage of electricity and create income augmentation.
• Households with access to electricity and receiving non-energy inputs have higher
income and consumption than households with relatively lower non-energy inputs.
• Electrical appliances are seen as potential livelihood-generating assets by households
receiving relatively higher non-energy inputs.
• Access to channelled sustained non-energy inputs develops the potential for risk-
taking in households in the form of entrepreneurship.
• Institutions, affordable and timely finance, continuous impetus on training, market
linkage and supply of quality raw materials are regarded as essential non-energy
inputs by enterprises.
Policy Recommendations The following are the key recommendations based on the study:
• Challenges to poverty eradication and livelihood generation can be eliminated by
packaging the rural electrification programme with a sustained impetus of non-
energy inputs channelled through local institutions.
• Policies that focus on rural electrification and the productive use of electricity should
concentrate on developing last-mile community-based organizations such as SHGs
and energy committees, which are fundamental to linking the village economy and
rural electrification.
• Access to affordable start-up finance, continuous skills building, market linkages,
good quality raw materials channelled through community-based organizations in
partnership with public and private players will trigger entrepreneurship and
provide a platform for graduating towards the productive use of electricity.
• States that have recently implemented rural electrification programmes or are
approaching saturation of rural electrification should emphasize entrepreneurship
and the productive use of electricity through institutionally channelled non-energy
inputs.

• States with good coverage of rural electrification should initiate policies to develop
institutions which can channel non-energy inputs and drive village economies
through the productive use of electricity.

Analysis of the electrification programme in India using the ‘energy plus’ framework and the key lessons
Table of Contents 1. INTRODUCTION ................................................................................................................... 1
1.1 Background ....................................................................................................................... 1 1.2 Objectives .......................................................................................................................... 3 1.3 The research questions .................................................................................................... 4
2. APPROACH AND METHODOLOGY ................................................................................ 7
2.1 Literature review .............................................................................................................. 7 2.2 Stakeholder consultation................................................................................................. 7 2.3 Detail assessment in states .............................................................................................. 7
2.3.1 Stage 1 Survey .................................................................................................... 8 2.3.2 Stage 2 Survey .................................................................................................... 9
2.4 Dissemination Workshop ............................................................................................. 11 3. STATUS OF RURAL ELECTRIFICATION IN INDIA ................................................. 13
3.1 Background ..................................................................................................................... 13 3.2 Rural Electrification Programmes and Policies in India ........................................... 16 3.3 Current Status ................................................................................................................. 17
3.3.1 Accessibility ..................................................................................................... 19 3.3.2 Availability ....................................................................................................... 21 3.3.3 Reliability .......................................................................................................... 21 3.3.4 Affordability ..................................................................................................... 22 3.3.5 Adequacy .......................................................................................................... 23
3.4 Decentralized village-level electrification projects .................................................... 25 3.5 Impact of rural electrification in India ........................................................................ 26 3.6 Challenges in enhancing access ................................................................................... 29
4. DEFINING ELECTRICITY ACCESS AND STAKEHOLDER ANALYSIS ................ 33
4.1 Definition of village electrification .............................................................................. 33 4.2 Stakeholder analysis ...................................................................................................... 34
5. UNDERSTANDING THE ROLE OF ELECTRICITY AND NON-ENERGY INPUTS39
5.1 Stage 1 Survey: impact of village electrification on livelihoods .............................. 39 5.2 Stage 2 Survey: role of non-energy inputs .................................................................. 46
5.2.1 Identification of villages in each cluster ....................................................... 47 5.2.2 Income, consumption and electricity access in households ...................... 49 5.2.3 Income, non-energy inputs, and electricity access in enterprises ............ 55 5.2.4 Regression analysis ......................................................................................... 58

6. DISCUSSION ....................................................................................................................... 61
6.1 Institution as an enabler ................................................................................................ 61 6.2 Income, expenditure, and ownership of appliances by electrified households .... 65
6.2.1 Monthly average income and MPCE ............................................................ 65 6.2.2 Ownership of electrical/electronic appliances by households ................. 65
6.3 Electricity as a driver for the augmentation of incomes and/or opportunities for income generation .................................................................................................... 66
6.4 Electrified enterprise income and changes in income .............................................. 67 6.4.1 Average monthly income of enterprises and changes in monthly
income of enterprise ....................................................................................... 67 6.4.2 Usage of electricity beyond basic use (lighting and mobile
phone charging)............................................................................................... 68 7. CONCLUSIONS AND RECOMMENDATIONS ............................................................. 70 REFERENCES .............................................................................................................................. 75 ANNEX 1. SELECTED INDICATORS ......................................................................... 81 ANNEX 2. PROFILE OF THE SURVEY RESPONDENTS ................................................... 83 ANNEX 3. RURAL ELECTRICITY PROGRAMMES IN INDIA ............................. 85 ANNEX 4. COMPOSITE INDEXES BASED ON 18 SELECTED INDICATORS .. 89 ANNEX 5. VARIABLES USED IN REGRESSION ANALYSIS ............................... 91
Analysis of the electrification programme in India using the ‘energy plus’ framework and the key lessons
List of Tables Table 1 Sample details ................................................................................................................... 9
Table 2 Sample details of Andhra Pradesh cluster .................................................................. 11
Table 3 Classification of states based on percentage of households dependent on electricity for lighting ..................................................................................................... 20
Table 4 Expenditure on electricity ............................................................................................. 22
Table 5 State-wise per capita electricity consumption (kWh) from 2009–10 to 2011–12.......................................................................................................... 23
Table 6 Details of sample in stage 2 survey .............................................................................. 46
Table 7 Results of regression analysis ....................................................................................... 59

Analysis of the electrification programme in India using the ‘energy plus’ framework and the key lessons
List of Figures Figure 1 Transition to ‘energy plus’ approach ........................................................................... 3
Figure 2 Progress of electrification............................................................................................. 14
Figure 3 Fuel consumption pattern by income class in India ................................................ 15
Figure 4 Electrification improves with per capita income ...................................................... 15
Figure 5 Electricity access in India ............................................................................................. 19
Figure 6 Consumption of electricity (utilities) during 2011–12 ............................................. 25
Figure 7 Progress in village electrification ................................................................................ 34
Figure 8 Change in income for electrified (E) and un-electrified (UE) households ............ 40
Figure 9 Changes in income for un-electrified (UE) and electrified (E) households through different sources ....................................................................... 42
Figure 10 Change in average revenue of electrified (E) and un-electrified (UE) enterprises ...................................................................................................................... 44
Figure 11 Actual change in average revenue for un-electrified (UE) and electrified (E) through different sources .................................................................... 45
Figure 12 Non-energy inputs (Source: Mission Document: NRLM 2010) ............................. 49
Figure 13 Average monthly income of electrified households ................................................ 50
Figure 14 Average monthly per capita expenditure (MPCE) in INR...................................... 50
Figure 15 Electricity as opportunity to augment to income opportunities (per cent of HHs) ........................................................................................................... 51
Figure 16 Ownership of electrical/electronic appliances by HHs (percent of HHs) ............ 52
Figure 17 Ownership of electrical/electronic appliances by HHs reporting electricity supply as reliable .......................................................................................................... 53
Figure 18 Households reporting willingness to purchase new electrical appliances ........... 54
Figure 19 Average monthly income for electrified enterprises ............................................... 56
Figure 20 Electrified enterprises reporting change in monthly income ................................. 56
Figure 21 Top five non-energy inputs reported by enterprise respondents .......................... 57
Figure 22 Usage of electricity by enterprises .............................................................................. 58


Analysis of the electrification programme in India using the ‘energy plus’ framework and the key lessons
1. Introduction
1.1 Background India is a predominantly rural country, with approximately 73 per cent of the total
population living in villages. Of the total of 179 million rural households in India, the socio-
economic census for 2011 indicates that 38 per cent are landless and agricultural wage
earners and that only 10 per cent belong to the salaried class. The same census also reports
that only a little more than 25 per cent of households own irrigated lands. The monthly
income of the highest earning household member is less than 5,000 for almost 75 per cent of
rural households, indicating the high incidence of poverty in most rural areas of India. The
socio-economic census of 2011 also indicates that, in terms of assets, around 70 per cent
households own a mobile phone but less than 20 per cent of rural households own a car or a
two-wheeler. Seasonal or permanent migration for jobs to improve one’s quality of life is a
common feature across many rural tracts of the country. There is a consensus that ‘expanded
access to affordable, reliable, and socially acceptable energy services’ is a prerequisite for
achieving the Millennium Development Goals (MDGs), as well as for the overall socio-
economic development of any rural area. Thus, in order to contribute to India’s overall
development, the village economy must have access to modern energy and cleaner fuel
sources.
Over the years, a number of federal government programmes and state-level initiatives have
attempted to enhance energy access, whether as a part of overall rural development or
specifically targeting rural electrification. However, the multiplicity of programmes has
made the funding for each of them inadequate, and also programme implementation was
not properly coordinated or managed by the rural electrification implementation agencies.
Further, while both rural development and rural electrification have been a priority for the
government over the years, there has been limited coordination between the various
government departments such as electricity, agriculture, irrigation, rural development, etc.,
thereby restricting the synergy of various schemes in obtaining the maximum impact.
Statistics indicate that in 2001, 77 per cent of all inhabited villages and only around 43 per
cent of households were connected to the electricity grid. However, during the last decade
rural electrification has become a political priority in India, with the central government
creating the necessary enabling environment through the Rural Electricity Supply
1

Analysis of the electrification programme in India using the ‘energy plus’ framework and the key lessons
Technology (REST) Mission in 2001, the Electricity Act in 2003, the National Electrification
Policy (NEP) in 2005 and the Rural Electrification Policy (REP) in 2006. The Rajiv Gandhi
Grameen Vidyutikaran Yojana (RGGVY) was launched in 2005 under the aegis of the ‘Bharat
Nirman’ (Build India) initiative, a time-bound national development plan focused on rural
areas. Recently, in late 2014, the RGGVY was expanded to launch the Deendayal Upadhyaya
Gram Jyoti Yojana (DDUGJY), with the aims of facilitating agricultural and non-agricultural
supply to rural consumers, augmenting distribution infrastructure in rural areas, and
completing household electrification in rural areas. The objective of these programmes was
not just to provide lighting to rural households, but also to attempt to create opportunities
for the productive use and other co-benefits of electricity in rural areas.
Apart from the Ministry of Power, the Ministry of New and Renewable Energy (MNRE) has
also been enhancing electricity access through decentralized renewable energy technologies,
such as solar home systems (SHS), solar photovoltaic (SPV) power plants, small hydropower
plants and biomass gasification under the Remote Village Electrification Programme
(RVEP), wherever grid extension is not techno-economically feasible. In addition to domestic
use, RVEP also endeavoured to provide energy services for community facilities, pumping
for drinking water supply or irrigation, and income-generating and other economic activities
in the village.
However, the progress of these programmes has largely been documented from the
perspectives of physical connections, village coverage and around financial and institutional
delivery mechanisms; there has been a relatively lesser focus on the outcomes from the
perspective of household electricity demand or the contribution of households to the local
rural economy.
Against this background, this study attempts to analyse the rural electrification programme
in India and its achievement, with a special focus on the co-benefits and productive use of
electricity in line with the ‘Energy Plus’ approach. The study also attempts to identify the
key factors for the success and limitation of rural electrification policies and programmes
and their implementation in enhancing electricity access and in creating income-generating
and other economic opportunities for the rural poor to enhance local incomes and alleviate
poverty.
2

Analysis of the electrification programme in India using the ‘energy plus’ framework and the key lessons
1.2 Objectives Specifically, the objectives of the study are:
• To evaluate the rural electrification programmes using the ‘energy plus’ framework
(Box 1) to understand and examine how Indian electricity access programmes have
addressed these issues.
• To assess the overall impact of rural electrification on local economies, e.g. their
contribution to sustainable livelihoods, income-generation, newly-developed micro-
industries, living standards and poverty reduction, as well as identify the key factors
that have contributed to their success and/or failures.
• To analyse the relevant issues and suggest recommendations for strengthening the
rural electrification programme for sustainable electrification in the context of the
‘energy plus’ approach for enhancing electricity access. This will contribute to the
Sustainable Energy For All (SEFA) goal of universal energy access by 2030.
Box 1. The Energy Plus approach of the UNDP Based on a review of seventeen energy access programmes and projects in the Asia-Pacific region,
the United Nations Development Programme (UNDP) published a report entitled ‘Towards an
energy plus approach for the poor: a review of good practices and lessons learned from Asia and
the Pacific’ (UNDP 2011). This report found that most energy access programmes and projects have
traditionally employed a minimalist approach and focused largely on basic domestic energy access.
Furthermore, as such projects focus mainly on energy inputs only, they are often not effective
enough to enable the poor to escape the poverty trap. The recommended energy plus framework
(Figure 1) incorporates a combination of energy inputs and other complementary inputs such as
infrastructure, access to markets, access to capital, availability of information and skills training,
and social services such as medical facilities and schools. The report (UNDP 2011) suggests an
integrated approach that combines energy service delivery with measures that generate income or
improve livelihood.
3

Analysis of the electrification programme in India using the ‘energy plus’ framework and the key lessons
Figure 1. Transition to ‘energy plus’ approach.
1.3 The research questions The study attempted to focus on some of the key issues indicated below:
• What is the current status of rural electrification in India, and how effective has been
the trend in enhancing access since the last decade?
• What is the definition/understanding of electricity access in the country among
policy-makers, and what is the efficacy of the definition in enhancing access?
• Which economic and income-generating opportunities have resulted from enhanced
electricity access in rural areas, whether through grid electricity access or off-grid
programmes, which have helped alleviate the poverty and/or are enabling the poor
to pay for energy services?
• Has there been any change in livelihood practices or changes in consumption,
expenditure, and savings because of rural electrification?
• What capacity development strategies have been adopted by energy access projects
for enhancing electrification and achieving synergistic effects?
• What are the enabling or inhibiting factors that may have come as opportunities or
barriers to implementing the ‘energy plus’ approach for rural electrification?
4

Analysis of the electrification programme in India using the ‘energy plus’ framework and the key lessons
• What are the main challenges and issues (e.g., technical, financial, institutional,
political, etc.) for improving the electricity access following the ‘energy plus’
approach?
• Whether the current rural electrification model(s) are an appropriate solution to
ensuring enhanced electricity access and sustainability?
5


Analysis of the electrification programme in India using the ‘energy plus’ framework and the key lessons
2. Approach and Methodology In light of the research objectives mentioned in the previous section, this study has
employed an evaluative research design consisting of the following broad steps.
2.1 Literature review As a first step, an intensive literature review was undertaken to build understanding of the
‘energy plus’ approach and already documented knowledge on the subject. International
peer-reviewed journals, papers and articles were consulted, along with the publications and
project reports of internationally reputed institutions, universities and government bodies.
In addition, Google Scholar was also used for web research on the topic.
2.2 Stakeholder consultation Stakeholder consultation was carried out with the aim of collecting views on the current
electricity access scenario in India, along with the importance of productive applications in
providing electricity access. The stakeholders consulted for the study included actors from
the government, donor agencies, academic and research institutes and the private sector.
The stakeholders willingly participated in these discussions and shared their views on the
current electricity scenario and the inclusion of productive applications. Examples are
quoted from their experiences, highlighting the factors that were significant in facilitating or
hampering the use of electricity for productive purposes. They also shared their views on
appropriate technologies and business and institutional models, and made suggestions for
enhancing the links between these models and productive activities.
2.3 Detail assessment in states While the availability of electricity at an affordable price is a pre-condition for enhancing
access, its use for basic lighting purposes alone may not assist in improving livelihoods.
Thus, the use of electricity for productive purposes as a necessary requirement for
improvements to livelihoods is an important issue for discussion. Moreover, whether only
providing energy input is sufficient or whether some other complementary factors are
needed to utilize and/or augment the impact of energy use for livelihoods also requires a
thorough discussion. Thus, to address these issues, this study conducted primary surveys in
two stages. In stage 1, the study focused on measuring the impact of electrification on
7

Analysis of the electrification programme in India using the ‘energy plus’ framework and the key lessons
livelihood improvement through the monthly incomes of households and/or the revenues
of enterprises. In stage 2, the study attempted to identify different non-energy inputs that
can help to improve livelihoods over and above energy usage and measure their impact. The
following sections briefly discuss the methodology adopted for both stage 1 and stage 2.
2.3.1 Stage 1 Survey The relationship between electrification and livelihood improvement is well established in
the literature. To verify the links, the study conducted a primary survey in selected villages.
The sample for the survey was selected through purposive random sampling in three
consecutive stages, viz., selection of state, selection of cluster, and selection of sample
(households and enterprises) for the survey.
Selection of state To identify the states for stage 1 survey, the study considered the growth in rural household
electrification between the last two censuses (2001–11). Based on this indicator, the top three
states where the growth in rural household electrification was highest were selected for
stage 1.1
Selection of cluster Electrified and un-electrified clusters were chosen from the selected states based on
discussions with stakeholders. However, an electrified sample was collected from
households with different sources of electrification (namely grid, mini-grid, and stand-alone
systems). This was done to help the study measure the impact of electrification, as well as
help it identify the sources that provide relatively better energy for livelihood applications.
Based on discussions with stakeholders, all clusters in these states were identified. However,
preference was given to a particular cluster if it had both electrified and un-electrified
households. Further, the selection was also made on the basis of the availability of all the
three modes of electrification mentioned above. If a cluster with above characteristics was
not available in any state, the cluster with the best performing mode (e.g., mini-grid or
stand-alone system) was considered.
1 The same indicator was also considered along with other indicators in the state selection methodology for stage 2.
8

Analysis of the electrification programme in India using the ‘energy plus’ framework and the key lessons
Sample selection The sample comprises household and enterprises (Table 1). Actual samples were collected
on random basis. The random sample was chosen using the random number table and list of
households and enterprises (available at respective block offices). If the respondent was not
available or reluctant to provide feedback, a proper replacement was made.
Table 1. Sample details.
Sample Household
(HH) Sample Enterprise
(Entp.)
Mode of electrification
Electrified
(E) Un-electrified
(UE) Electrified
(E) Un-electrified
(UE)
Grid 75 32 6 6
Mini-grid 71 31 5 5
Stand-alone system 38 37 5 6
To identify the impact of electrification on livelihoods, the stage 1 survey collected the pre-
and post- (most recent) electrification average monthly incomes for households and
revenues for enterprises. The perceptions of the respondents about the impact of
electrification in respect of changes in health service and children’s education, among others,
were also collected. Moreover, to overcome the influence of inflation (increases in price
levels over time) on incomes and revenues, the real (deflated) incomes and revenues were
calculated for all respondents.
2.3.2 Stage 2 Survey After the stage 1 survey, the stage 2 survey was conducted to identify the impact of non-
energy inputs on productive activity. However, because of shortages of both resources and
time, only one source of electrification was chosen for the study. Based on our stage 1
primary survey, the source which provides relatively better opportunities for livelihoods
was chosen for the stage 2 survey. In this stage also, the sample selection was done in three
consecutive stages, viz., selection of state, selection of cluster, and selection of sample.
Selection of state
Two kinds of states were required for this study, one a ‘good performer’, the other a ‘not so
good performer’. A ‘good performer’ was considered to be a state where electrification has
helped the community use it for productive purposes and not just for lighting. In other
9

Analysis of the electrification programme in India using the ‘energy plus’ framework and the key lessons
words, in such a state, electrification should improve standards of living through the use of
electricity in a productive activity. On the other hand, a ‘not so good performer’ is a state in
which utilization of electricity for productive use has resulted in limited improvements to
livelihoods or new electricity connections not being used for any productive income
generation.
To select the ‘good’ and ‘not so good’ performing states, a composite index method was
used. There may be different dimensions of livelihood improvement due to the productive
use of electricity, for example, it may increase employment, incomes or business
opportunities. Similarly, other complementary factors are also important if similar
improvements in the standard of living are to be achieved. Thus, to calculate the composite
index, a total of 18 selected indicators were considered (Annex 1) for all major states of India
(i.e., except the north-eastern states, which are smaller) and the Union Territories.
Different composite indices were calculated by giving different weights to different
indicators (in accordance with their perceived importance). Among the eighteen indicators
considered, eight were given more importance (10 per cent weightage), compared to the
remaining ten variables (2 per cent weightage for each) because of their closer links with
electricity access and livelihood improvements through non-energy inputs. These eight
indicators are:
1. Growth of village electrification (2004–05 to 2012–13)
2. Percentage of rural HHs using electricity for lighting (as major source)
3. Growth of rural HHs using electricity (2001–2011)
4. Percentage of enterprises receiving assistance
5. Share of rural enterprises in rural households
6. Percentage of enterprises working more than 12 hours
7. Percentage peak demand met (peak demand met as percentage of peak demand)
(2013–14)
8. Pump-set per thousand hector net sown area (2012–13).
As the weight of different indicators changes, states may change their ranking among
themselves, but in all cases, the top and bottom three good and relatively poor performer
states remain the same. Based on logistical convenience and resource availability, in
administering the survey questionnaires, one state each from the three states were selected
10

Analysis of the electrification programme in India using the ‘energy plus’ framework and the key lessons
as representatives of ‘good’ and ‘not so good’ performing states to identify the impact of
non-energy inputs in improving livelihoods through productive use.
Selection of cluster Once the states had been selected, all small and home-based livelihood clusters were listed
from respective state government websites. Based on logistical and other factors (such as the
availability of district-level data, of partner institutions to facilitate the study in the region,
etc.), one livelihood cluster from a relatively poor performing state and two livelihood
clusters from a better performing state were chosen. However, among the two clusters
selected from the better performing state, one cluster has a livelihood profile similar to the
cluster selected from the poor performing state. All three clusters are similar in the sense
that they represent small or micro- and home-based enterprising livelihood clusters.
However, two clusters were chosen from the best performing state to overcome any state-
specific and profession-specific bias. Further, in each of the clusters, both better off and
relatively poor villages (in terms of access to non-energy inputs) were selected.
Selection of sample After the clusters had been selected, stratification was done based on the availability of non-
energy inputs. Then from each stratum, sample households and enterprises were chosen
randomly, using the random number table and the list of households and enterprises
(available at the respective block offices). If the respondent was not available or reluctant, a
proper replacement was made. The sample details are listed in Table 2 below. Annex 2
provides insights into the profile of the survey respondents.
Table 2. Sample details of the Andhra Pradesh cluster.
Cluster Type Household Enterprise
Better performing state_cluster1 20 60
Better performing state_cluster2 20 60
Poor performing state_cluster 36 58
2.4 Dissemination Workshop The dissemination of the study results will be done through a one-day national-level
workshop to be held in New Delhi, prospectively in October 2015.
.
11


Analysis of the electrification programme in India using the ‘energy plus’ framework and the key lessons
3. Status of Rural Electrification in India This chapter describes the current status of rural electrification in India and how effective
progress has been in enhancing access to electricity in rural areas in the last decade.
3.1 Background The Indian government has made conscious efforts to make substantial improvements to its
electricity infrastructure, especially in terms of availability and accessibility, since the
country’s planned economic development began in 1951. However, progress in modern
energy provision in rural India has been somewhat sporadic, with only a marginal success in
terms of both policies and programmes (Modi 2005; Bhattacharyya 2006). Though 95.6 per
cent of the total of 597,464 villages have access to electricity (Figure 2) (CEA, 2014), the
household electrification rate is only about 67 per cent (Census of India, 2011). There are
only nine states which have achieved more than 90 per cent household electrification, and
the larger states such as Assam, Bihar, Madhya Pradesh, Rajasthan, Uttar Pradesh and West
Bengal are lagging behind in terms of their rural electrification efforts. Also, the states of
Uttar Pradesh (20 million households), Bihar (15 million), and West Bengal (9 million)
account for more than 50 per cent of the non-electrified households. Further, the share of
electrified villages between regions and states can be explained by structural factors
(Chaurey et al. 2004, Kemmler 2007). For example, the challenge of rural access to electricity
in some states is aggravated by factors such as poor institutional arrangements, ineffective
implementation, the overemphasis on serving urban customers, the poor paying capacity of
users, etc. Even where there is access to electricity, the quality of supply remains poor due to
the non-availability of power during the evening hours, when people need it the most (Palit
and Chaurey 2011).
Historically, the level of electrification has been measured as a percentage of electrified
villages (with grid extension to any point within the revenue boundary of a village,
irrespective of whether any household is being connected or not), not as a percentage of
electrified households, thereby reflecting the low household electrification levels in many
states (Palit et al. 2014). In fact, some researchers argue that the main driver of rural
electrification was the electrification component of the Green Revolution in agriculture
(Bhattacharyya 2006, Krishnaswamy 2010). During the early five-year planning period in the
1950s to 1980s, pumpset energization was given more importance so that irrigation facilities
13

Analysis of the electrification programme in India using the ‘energy plus’ framework and the key lessons
could be created in the rural areas to support the Green Revolution and make the country
self-sufficient in food grains. Thus, targets were set for pumpset energization, but no explicit
targets for connecting households to electricity. Wherever a target for household connection
was set, as with the Government of India’s Kutir Jyoti scheme, it was restricted to providing
a single lighting connection (Balachandra 2012).
Figure 2. Progress of electrification. Furthermore, the growth in village electrification has largely been measured in terms of the
expansion of the central grid infrastructure (Rehman et al. 2012), the mere creation of
infrastructure at the village level having been the larger focus area for rural electrification
programmes (Balachandra 2013). A reliable, affordable and adequate electricity supply is
still a serious challenge. Also, there is an divide in energy access based on the geography
and income of the community, that is, households belonging to higher income groups
and/or urban areas consume more electricity than households in rural areas and/or with
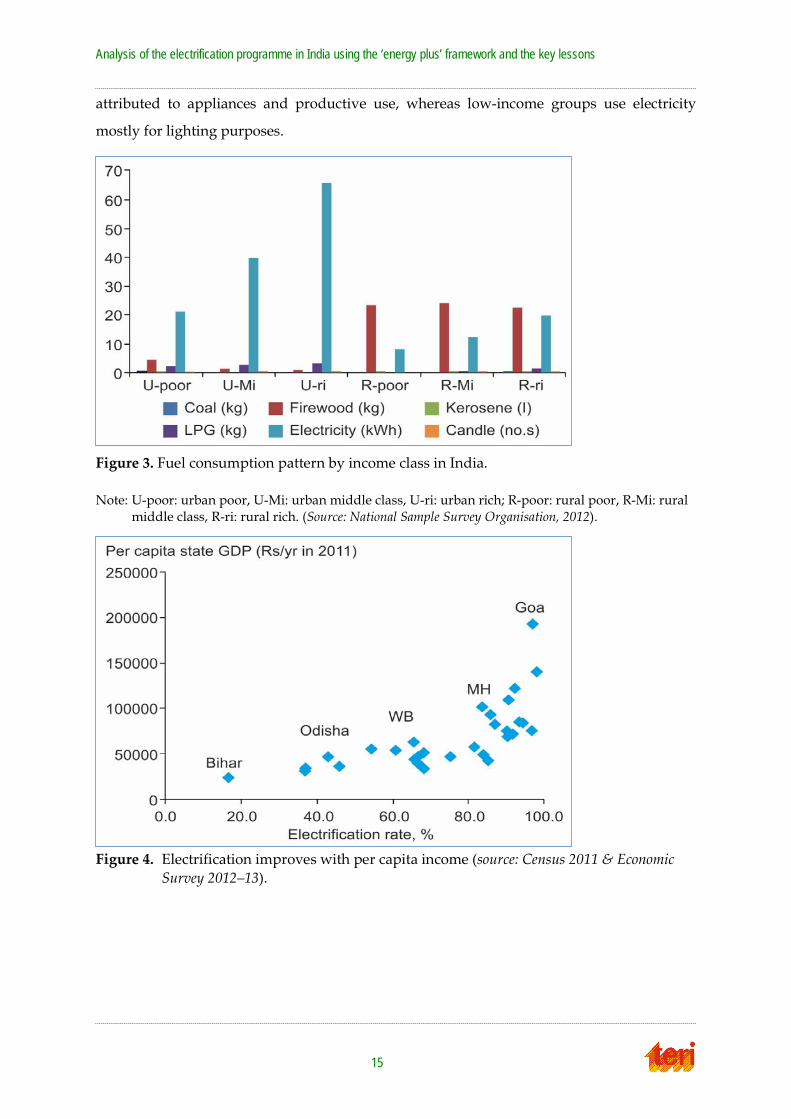
low incomes (Figure 3) (Pachauri 2007, Ramji et al. 2012). Figure 4 clearly indicates that there
is a link between a state’s economic development and its electrification rate, with states
having low per capita incomes being poor performers as compared to those with high per
capita incomes. The higher electricity consumption among high-income group can be
14
0 3061 7294 21754
45148 73739
156729
232770 249799
370332
470838
487170 498836 512153
482864
556633
593732
0
100000
200000
300000
400000
500000
600000
700000
1947
1950
1956
1961
1966
1969
1974
1979
1980
1985
1990
1992
1997
2002
2007
2012
2013
Num
ber o
f vill
ages
Plan / Year
Planwise Growth of Number of Villages Electrified in the Country
Analysis of the electrification programme in India using the ‘energy plus’ framework and the key lessons
attributed to appliances and productive use, whereas low-income groups use electricity
mostly for lighting purposes.
Figure 3. Fuel consumption pattern by income class in India. Note: U-poor: urban poor, U-Mi: urban middle class, U-ri: urban rich; R-poor: rural poor, R-Mi: rural
middle class, R-ri: rural rich. (Source: National Sample Survey Organisation, 2012).
Figure 4. Electrification improves with per capita income (source: Census 2011 & Economic Survey 2012–13).
15
Analysis of the electrification programme in India using the ‘energy plus’ framework and the key lessons
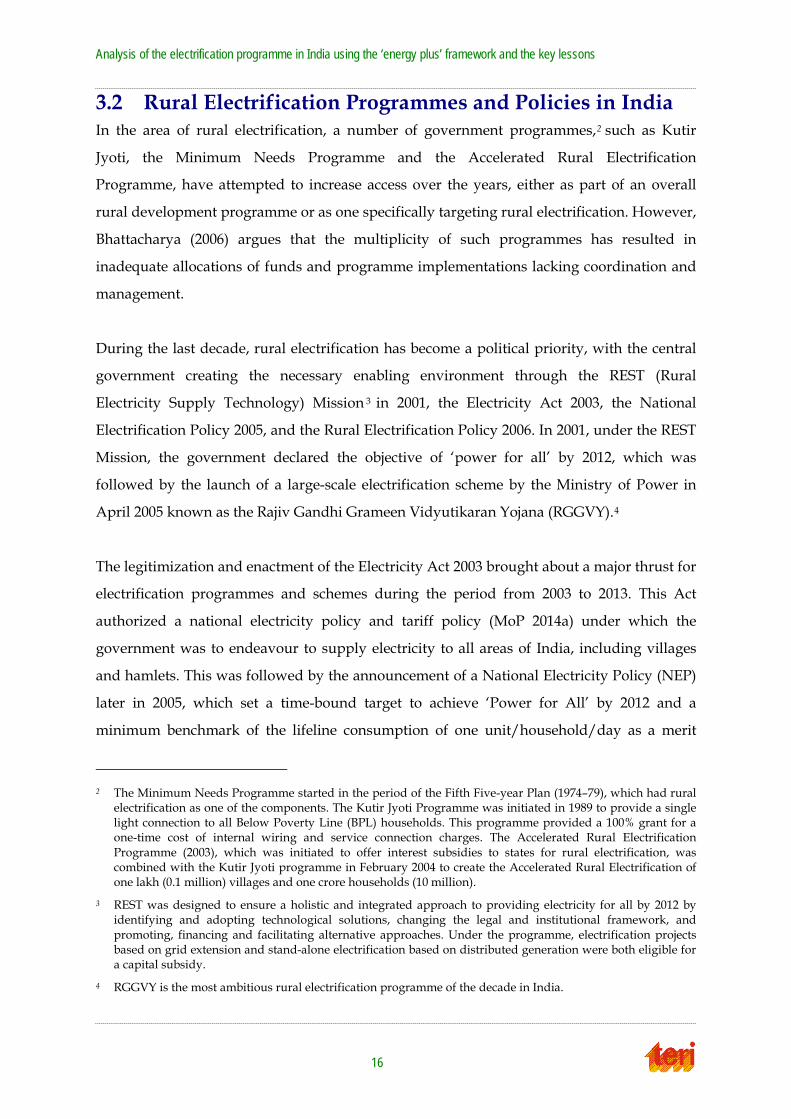
3.2 Rural Electrification Programmes and Policies in India In the area of rural electrification, a number of government programmes,2 such as Kutir
Jyoti, the Minimum Needs Programme and the Accelerated Rural Electrification
Programme, have attempted to increase access over the years, either as part of an overall
rural development programme or as one specifically targeting rural electrification. However,
Bhattacharya (2006) argues that the multiplicity of such programmes has resulted in
inadequate allocations of funds and programme implementations lacking coordination and
management.
During the last decade, rural electrification has become a political priority, with the central
government creating the necessary enabling environment through the REST (Rural
Electricity Supply Technology) Mission 3 in 2001, the Electricity Act 2003, the National
Electrification Policy 2005, and the Rural Electrification Policy 2006. In 2001, under the REST
Mission, the government declared the objective of ‘power for all’ by 2012, which was
followed by the launch of a large-scale electrification scheme by the Ministry of Power in
April 2005 known as the Rajiv Gandhi Grameen Vidyutikaran Yojana (RGGVY).4
The legitimization and enactment of the Electricity Act 2003 brought about a major thrust for
electrification programmes and schemes during the period from 2003 to 2013. This Act
authorized a national electricity policy and tariff policy (MoP 2014a) under which the
government was to endeavour to supply electricity to all areas of India, including villages
and hamlets. This was followed by the announcement of a National Electricity Policy (NEP)
later in 2005, which set a time-bound target to achieve ‘Power for All’ by 2012 and a
minimum benchmark of the lifeline consumption of one unit/household/day as a merit
2 The Minimum Needs Programme started in the period of the Fifth Five-year Plan (1974–79), which had rural electrification as one of the components. The Kutir Jyoti Programme was initiated in 1989 to provide a single light connection to all Below Poverty Line (BPL) households. This programme provided a 100% grant for a one-time cost of internal wiring and service connection charges. The Accelerated Rural Electrification Programme (2003), which was initiated to offer interest subsidies to states for rural electrification, was combined with the Kutir Jyoti programme in February 2004 to create the Accelerated Rural Electrification of one lakh (0.1 million) villages and one crore households (10 million).
3 REST was designed to ensure a holistic and integrated approach to providing electricity for all by 2012 by identifying and adopting technological solutions, changing the legal and institutional framework, and promoting, financing and facilitating alternative approaches. Under the programme, electrification projects based on grid extension and stand-alone electrification based on distributed generation were both eligible for a capital subsidy.
4 RGGVY is the most ambitious rural electrification programme of the decade in India.
16

Analysis of the electrification programme in India using the ‘energy plus’ framework and the key lessons
good (MoP 2014b). In 2006, the Rural Electrification Policy was passed soon after, in
compliance with Sections 4 and 5 of the Electricity Act, 2003 (MoP 2014c). This policy gave a
mandate to respective state governments to prepare and notify a Rural Electrification Plan.
However, owing to a range of factors, including the non-completion of work to set up the
electricity transmission and distribution infrastructure within the prescribed timeframe
under the national rural electrification programme, poor planning and execution, the poor
paying capacities of rural households, inadequate attention to connecting rural households
above the poverty line, the scattered distribution of households and the inadequate
electricity supply, these targets have not yet been achieved. A great deal is evident from the
fact that, during the initial stage of RGGVY in 10th Five-Year Plan, RGGVY implementation
was only intended for villages with a population of over 300. In addition, the installation of
distribution transformers of an inadequate capacity restricted households from securing an
electricity connection.
Prior to RGGVY, most programmes have failed to attain the goal of electricity access,
whereas under RGGVY 23.67 million households, including 21.27 million Below Poverty
Line (BPL) households, have been electrified 5 (Balachandra 2013). According to the
secondary data analysis, there was an almost 15 per cent growth in village electrification
between the end of the 10th and 11th Five-Year Plans (Figure 2) and a 6.7 per cent growth
between the end of the 11th Five-Year Plan and the end of the 1st year of the 12th Five-Year
Plan (CEA 2013). This growth in village electrification can be attributed to the political will
evident from the policies passed into law. In addition to the central schemes, there are other
individual programmes under the state governments, such as the Jyoti Gram Yojana in
Gujarat and the Atal Jyoti Yojana in Madhya Pradesh. The details of Indian rural electricity
programmes and schemes are given in Annex 3.
3.3 Current Status Out of the total number of electrified villages, there were still 77 million households without
electricity in 2011 (Figure 5) (Census of India, 2011). The primary mode of village
electrification during the four decades after India’s independence was the centralized grid.
Decentralized renewable energy-based projects were primarily meant for technology
demonstrations in rural areas. However, currently, wide use is being made of renewable
5As of 31st October, 2013.
17
Analysis of the electrification programme in India using the ‘energy plus’ framework and the key lessons
energy technologies such as solar photovoltaic (PV), biomass gasifier and pico/micro hydro-
based electricity supply for villages and hamlets in cases where a central grid-based
electricity supply is either technically or financially unviable or the grid electricity supply is
inadequate. This was triggered by the Electricity Act enacted in 2003, Section 3 of which
mandated the development and passing of a National Electricity Plan for the development
of power based on the optimum utilization of resources, including renewable energy
sources. Also, Section 86 (1) (e) mandated the Regulatory Commission to specify renewable
purchase obligations. In addition, Section 4 of the said Act provided for stand-alone systems,
including those based on renewable energy for rural areas. Further, the eighth provision
under Section 14 of the Electricity Act 2003 provided a framework for the generation and
distribution of electricity in rural areas and specified that no one intending to generate and
distribute electricity in rural areas shall require any licence to do so.
Hence, the RGGVY rural electrification programme also has provisions for decentralized
generation and electricity distribution using both conventional and non-conventional energy
sources (RGGVY 2014b). The environment for private-sector participation in India in both
grid-connected and off-grid renewable-based systems has been further enabled by the
Jawaharlal Nehru National Solar Mission (JNNSM) and financial instruments like feed-in
tariffs and renewable purchase obligations. The challenges for rural access to electricity in
India (as discussed in the previous section) have often been linked to the power supply in
terms of its accessibility, reliability, availability, affordability (including upfront costs for
connection fees and appliance costs) and adequacy (Patil 2010). To explain the current status
of rural electrification in India further, the position of electricity in terms of accessibility,
availability, reliability, affordability and adequacy, along with rural electricity consumption,
is discussed in the following sections.
18

Analysis of the electrification programme in India using the ‘energy plus’ framework and the key lessons
Figure 5. Electricity access in India (source: Census of India, 2011).
3.3.1 Accessibility There is inequality of electricity access both between rural and urban households and
between states. Among all the states and union territories in India, Bihar reports the lowest
percentage of households depending on electricity for lighting. Among the smaller states of
the Indian north-east, Assam has the lowest percentage of households depending on
electricity for lighting (Census of India, 2011). The lower percentage of households
dependent on electricity for lighting can be attributed to several factors, including higher
population densities, the poor paying capacities of households, difficulties of terrain,
governance issues, and the gap between supply and demand, coupled with an unreliable
grid electricity service, resulting in a limited willingness by households to secure a
legitimate electricity connection, etc. The situation is also attributable to low6 state gross
development product, higher transmission and distribution losses, and poor electricity
generation capacity in these states, among other things. The summary of the status of each of
the states and union territories in terms of the percentage of households depending on
electricity for lighting is given in Table 3.
6 In comparison to states that have a higher percentage of households using electricity for lighting.
19

Analysis of the electrification programme in India using the ‘energy plus’ framework and the key lessons
Table 3. Classification of states based on percentage of households dependent on electricity for lighting.
A 30 and below Bihar
B 30.01–50.00 Assam, Jharkhand, Odisha, Uttar Pradesh
C 50.01–70.00 Rajasthan, Arunachal Pradesh, Manipur, Tripura, Meghalaya, West Bengal, Madhya Pradesh
D 70.01–90.00 Jammu & Kashmir, Uttarakhand, Nagaland, Mizoram, Chhattisgarh, Andaman & Nicobar Islands, Maharashtra
E 90.01 and above Himachal Pradesh, Punjab, Chandigarh, Haryana, Sikkim, Gujarat, Daman & Diu, Dadra & Nagar Haveli, Andhra Pradesh, Tamil Nadu, Puducherry, Karnataka, Goa, Lakshadweep, Kerala, NCT of Delhi
Source: TERI Energy Data Directory & Yearbook (TEDDY), 2013/14. A comparison of the total percentage of villages electrified and total number of rural
households dependent on electricity for lighting reveals that, while over 95 per cent of the
villages have already been electrified,7 45 per cent of the rural households still do not have
electricity for lighting (CEA 2014). Furthermore, while the average growth rate of rural
households during the decade from 2001 to 2010 was 21.4 per cent, the average growth rate
of rural electrification stood at 27.1 per cent (Figure 3). Assuming a similar average growth
rate for rural households and village electrification in 2020, it is estimated that close to 61
million households will still not have electricity for lighting. Incidentally, the IEA (2013)
estimates that even in the New Policies Scenario for 2030, over 100 million people in India
will still not have access to electricity.
In the above context, Pachauri et al. (2004), while discussing energy poverty with a focus on
electricity, found that, although whether a household chooses to use a number of different
pieces of electrical equipment or not is a matter of choice, what is important is that the
household has an opportunity to make a choice. For this to be possible, physical access to the
grid infrastructure and connectivity are preliminary requirements. Furthermore, the
consumer must also have access to markets where electrical equipment can be purchased, as
well as the purchasing power to buy the equipment and obtain electricity at a competitive
price.
7As of 31st December, 2013
20
Analysis of the electrification programme in India using the ‘energy plus’ framework and the key lessons
3.3.2 Availability The availability of electricity supply is a critical challenge in rural India. The national rural
electrification programme, i.e., the RGGVY, is mandated to supply at least eight hours of
electricity on daily basis to rural consumers, while the policies of the government specify 24
hours of supply in both rural and urban areas. However, rural consumers in several states
receive less than eight hours of grid supply daily (Planning Commission 2013). While the
non-availability of actual supply or the non-availability of the necessary infrastructure for
supply and connectivity restricts access to electricity, delays in maintaining existing and
faulty infrastructure is an equally critical challenge. For example, in Bihar, 17 per cent of the
distribution transformers installed under RGGVY8 were reported to be defective, including
burnt transformers (MoP 2013). In 2013–14, at the national level, the actual power supply
position recorded an overall deficit of 4.5 per cent in terms of peak demand vis-à-vis peak
supply (CEA 2014b). In the case of remote villages, though a number of off-grid energy
solutions are operational across many states, a recent study (GNESD 2014), reports that the
majority of the mini-grid based companies operating in rural areas provide electricity for
only five to ten hours during the evenings. As the peak demand is for lighting, the electricity
supply is restricted to five to ten hours of daily supply to meet this basic need only, owing to
the limited funding available to set up mini-grid plants under the government’s schemes.
3.3.3 Reliability While the level of village electrification has grown to around 95.6 per cent, since the RGGVY
was initiated there are still structural deficiencies in implementing and sustaining the rural
electrification sector, with an impact on the growth in the household electrification level and
the supply of electricity to rural areas. While an adequate and quality supply of power and
also a quality service are important to sustaining the rural electricity distribution network,
field assessment of the programme indicates that concurrent, parallel measures have not
been taken to improve the quality of the rural electricity supply and service9 (TERI 2010). In
8 As of 31st March, 2013. 9 According to the Rural Energy Policy, state governments should prepare and notify a Rural Electrification
Plan in six months to achieve the goal of providing access to all households falling under the Plan for the establishment of a transmission and distribution system and the provision of an adequate power supply. It was observed that while seventeen states have so far notified their Plans, they have not taken the required steps to fulfil the commitments they made under the Plans. Further, for purposes of availing capital subsidies under the RGGVY scheme, the states have to ensure a minimum of six to eight hours of power supply in RGGVY network. While the states have committed themselves to this arrangement, in reality they are not procuring enough power to supply the rural areas either because they do not generate enough revenue and any supply in rural areas is deemed to be a loss-making proposition, or because the state’s planned generation capacity has not materialized, resulting in a chronic shortage of supply.
21

Analysis of the electrification programme in India using the ‘energy plus’ framework and the key lessons
states like Tamil Nadu, Haryana and Andhra Pradesh, over 90 per cent of villages are now
electrified. However, the deficit in electricity supply even in these states is high. While the
demand in rural areas does not contribute significantly to the peak deficit, if such a deficit
occurs, it is the rural areas that are often affected the most (E&Y 2007).
3.3.4 Affordability The affordability of electricity has been an issue of debate in recent years. The rising price of
fossil fuels such as coal, which is the primary energy source for electricity generation in
India, is reflected in consumers’ electricity bill, including those of rural consumers. The off-
grid communities that draw their energy from local decentralized electricity suppliers like
the diesel generator operator or the renewable based micro- or mini-grid operator largely
pay a service-fee which is almost seventeen times that of the grid electricity of equivalent
units.10 Table 4 below highlights the monthly expenditure classes for electricity consumers in
rural India.
Table 4. Expenditure on electricity.
MPCE classes Electricity in kWh
0–599 34.59
599–722 39.65
722–826 44.45
826–923 46.66
923–1036 53.78
1036–1167 55.11
1167-1336 59.11
1336-1583 64.44
1583-2054 73.87
above 2054 95.35 Source: TERI Energy Data Directory & Yearbook (TEDDY), 2013/14.
10 In accordance with the North Bihar Power Distribution Company Limited’s order for a performance review for the 2013/14 financial year and the determination of aggregate revenue requirement and tariffs for retail sales of electricity for the 2014/15 financial year, Kutir Jyoti (metered rural) household consumers of grid electricity pay INR 1.60 per unit of electricity consumption. Conversely, the household consumers of a decentralized renewable energy-based electricity generation and distribution company in Bihar pay almost INR 150 for close to 5.4 units of electricity consumed in 30 days, which comes to over INR 27 per unit of electricity consumption per household consumer (NBPDCL 2014; Sevea 2013).
22

Analysis of the electrification programme in India using the ‘energy plus’ framework and the key lessons
3.3.5 Adequacy Though 67 per cent of rural households are reported to have had access to electricity in
2009–10, their per capita consumption of electricity is only around 8 kWh per month, which
is just one-third of the reported consumption of 24 kWh in urban areas (Planning
Commission 2013). This is largely because of the poor quality of electricity supplies and
reflects significant unmet demand. Table 5 below highlights state-wise per capita electricity
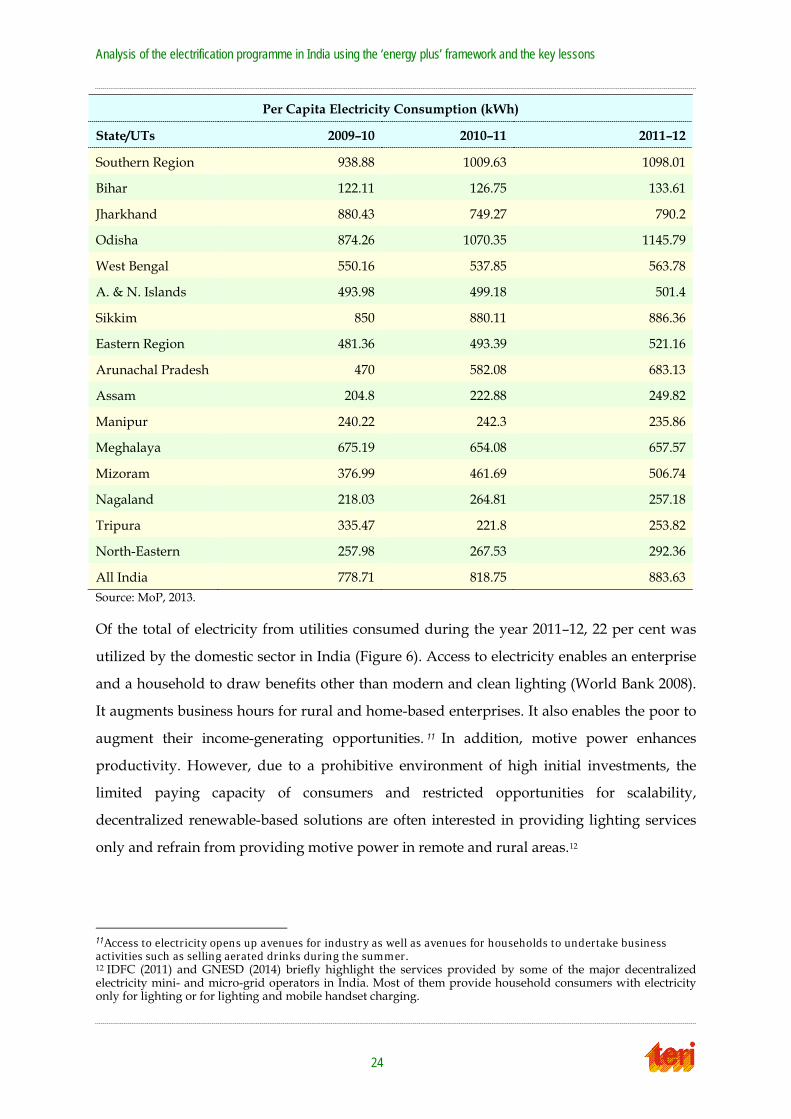
consumption (kWh) from 2009–10 to 2011–12.
Table 5. State-wise per capita electricity consumption (kWh) from 2009–10 to 2011–12.
Per Capita Electricity Consumption (kWh)
State/UTs 2009–10 2010–11 2011–12
Chandigarh 1340 1282.86 1217.37
Delhi 1651.26 1530.43 1586.73
Haryana 1222.21 1485.07 1628.31
Himachal Pradesh 1379.99 1250.93 1289.39
Jammu & Kashmir 952.02 988.3 1015.19
Punjab 1526.66 1735.51 1799.01
Rajasthan 736.2 843.75 927.36
Uttar Pradesh 348.37 411.94 449.89
Uttarakhand 1112.29 1143.61 1232.17
Northern Region 695.11 776.37 833.19
Chhattisgarh 1546.94 1117.53 1319.56
Gujarat 1615.24 1508.14 1663.23
Madhya Pradesh 602.07 674.48 671.54
Maharashtra 1028.22 1095.99 1204.38
Daman & Diu 7118.23 7810.22 7785.22
D. & N. Haveli 11863.64 13366.5 13766.56
Goa 2263.63 2060.65 2025.46
Western Region 1116.92 1104.44 1201.15
Andhra Pradesh 966.99 1065.46 1156.52
Karnataka 903.24 925.02 1081.35
Kerala 525.25 550.8 593.77
Tamil Nadu 1131.58 1232.51 1276.57
Puducherry 1743.37 1850.47 2124.71
Lakshadweep 418.14 531.63 550.25
23
Analysis of the electrification programme in India using the ‘energy plus’ framework and the key lessons
Per Capita Electricity Consumption (kWh)
State/UTs 2009–10 2010–11 2011–12
Southern Region 938.88 1009.63 1098.01
Bihar 122.11 126.75 133.61
Jharkhand 880.43 749.27 790.2
Odisha 874.26 1070.35 1145.79
West Bengal 550.16 537.85 563.78
A. & N. Islands 493.98 499.18 501.4
Sikkim 850 880.11 886.36
Eastern Region 481.36 493.39 521.16
Arunachal Pradesh 470 582.08 683.13
Assam 204.8 222.88 249.82
Manipur 240.22 242.3 235.86
Meghalaya 675.19 654.08 657.57
Mizoram 376.99 461.69 506.74
Nagaland 218.03 264.81 257.18
Tripura 335.47 221.8 253.82
North-Eastern 257.98 267.53 292.36
All India 778.71 818.75 883.63 Source: MoP, 2013.
Of the total of electricity from utilities consumed during the year 2011–12, 22 per cent was
utilized by the domestic sector in India (Figure 6). Access to electricity enables an enterprise
and a household to draw benefits other than modern and clean lighting (World Bank 2008).
It augments business hours for rural and home-based enterprises. It also enables the poor to
augment their income-generating opportunities. 11 In addition, motive power enhances
productivity. However, due to a prohibitive environment of high initial investments, the
limited paying capacity of consumers and restricted opportunities for scalability,
decentralized renewable-based solutions are often interested in providing lighting services
only and refrain from providing motive power in remote and rural areas.12
11Access to electricity opens up avenues for industry as well as avenues for households to undertake business activities such as selling aerated drinks during the summer. 12 IDFC (2011) and GNESD (2014) briefly highlight the services provided by some of the major decentralized electricity mini- and micro-grid operators in India. Most of them provide household consumers with electricity only for lighting or for lighting and mobile handset charging.
24

Analysis of the electrification programme in India using the ‘energy plus’ framework and the key lessons
Figure 6. Consumption of electricity (utilities) during 2011–12 (source: MoSPI, 2013).
In summary, the priority in government programmes has been the installation and
commissioning of a basic electricity distribution infrastructure for rural electrification. While
this has accelerated physical access to the electricity service delivery infrastructure,
reliability, adequacy, availability and affordability continue to be challenges that have to be
dealt with. While significant progress has been reported in terms of the percentage of
electrified villages across all states, actual household electrification and the supply of
electricity remain far behind the targets announced by the government. In addition, the per
capita consumption of electricity in rural areas has not significantly improved over the
years, and there is also inequality among different states in respect of per capita electricity
consumption. In rural areas, in order to foster the sustainable use of electricity, the challenge
of affordability also has to be addressed. It is equally important to raise the awareness of the
inhabitants and to mobilize their support for the effective functioning of the state electricity
distribution companies.
3.4 Decentralized village-level electrification projects In India, coal constitutes the major energy source for electricity generation. However, in
recent years, fluctuation in the prices of fossil fuels and shortages in the supply of fuels such
as coal have become serious concerns for the growing electricity demand in the country.
There is also an immense global focus towards increasing the share of renewables in the
energy mix, in India as elsewhere (AGECC 2010). The JNNSM alone has set a target of an
additional 20 GW of grid-connected solar power by 2022. The Government of India has set a
target of 15 per cent of power generation from renewables by the same date (MNRE 2013).
25

Analysis of the electrification programme in India using the ‘energy plus’ framework and the key lessons
At present, renewables constitute close to 12 per cent of installed electricity-generating
capacity 13 (MoSPI 2013). While grid-connected renewables-based electricity generation
includes large-scale projects, decentralized rural electricity generation from renewables
involves small-scale projects. A majority of the decentralized projects for village-level
electricity generation in rural areas are financed primarily by the impact investors,
international grant-awarding agencies, and bilateral and multilateral agencies. The
challenges, including the scalability and sustainability of the business model, are serious
issues (MNRE 2013). In this context, Palit and Bandyopadhyay (2015) stress that the cost of
electricity supply using off-grid renewable energy-based solutions in rural areas is a
function of the technology used, the energy resources utilized, the capacity of the system,
the pattern of demand, the infrastructure created and service quality. Furthermore, due to
the higher operational and maintenance cost, the costs of generation for decentralized off-
grid systems is often higher than the paying capacities of their customers. This restricts
revenue generation through tariffs and hence the sustainability of power plant system. In
addition, competition from the central grid is always a threat to the long-term sustainability
of small-scale, village-level, decentralized renewable energy electricity generation projects in
rural areas14 operated by the private sector, village-level entrepreneurs and/or community-
based institutions. The lack of policy regulation in this direction limits private-sector
participation in village-level decentralized rural electricity generation and distribution using
renewables.
3.5 Impact of rural electrification in India
Rural electrification in developing economies, including India, has been a subject of study
for decades. The literature available in international peer-reviewed journals and reports
provides an insight into the different approaches that have been undertaken to analyse the
impacts of rural electrification. This section of the report draws insights from the literature
reflecting on India’s rural electrification programme, especially what economic and income-
generating opportunities may have resulted from enhanced electricity access in rural areas.
13 Electricity (utilities) as of 31.3.2012 (source: MoSPI 2013). 14 Decentralized energy service companies mostly operate in off-grid regions or in locations where the grid
electricity supply is not reliable. However, most such companies offer only basic lighting services to consumers. Hence, with the extension of centralized grid network into the operating areas of decentralized energy service companies and with improvements in the reliability of electricity supply, both existing and prospective consumers are likely to shift to grid service, the former due to growing energy demand, the latter due to a desire for grid service. Hence, the privately owned decentralized energy service companies refrain from investing in expanding their electricity generating capacity, which may make their services obsolete in course of time.
26

Analysis of the electrification programme in India using the ‘energy plus’ framework and the key lessons
Panda (2007) discussed the governance of rural electricity systems in India and stated that
the rural electrification programmes have largely pursued a supply-led strategy. Further,
Rehman et al. (2012) point out the demand–supply gap for electricity in rural India. Pachauri
et al. (2004), while discussing energy poverty in rural Indian households, state that the lack
of electricity and of the efficient use of equipment is reflections of poverty. Khandker et al.
(2010), also writing on the issue of poverty, raise the question of whether the provision of
energy services leads to economic development, or economic development leads to an
increase in the demand for energy. The paper evaluates the relationship between energy and
poverty in India. In this context, Panda (2007) adds that both the direct and indirect
integration of the utility’s service delivery system, with income-generating opportunities for
consumers, can foster access. Modi et al. (2005) describe modern energy service as a
facilitator for the attainment of the UN’s Millennium Development Goals. However, Cook
(2011) suggests that, while the increased focus on rural electrification has emphasized its
connection with productive use and poverty alleviation, progress in rural areas in terms of
electrification has been limited.
On similar lines, Khandker et al. (2012) suggest that the impacts of electrification on incomes
are proportionate, while Bhattacharyya (2005) recommends expanding the productive use of
electricity for the economic and financial viability of rural electrification projects in India.
The author finds that traditionally in rural households, electricity is only used for lighting
and hence, it does not emerge as a primary energy requirement at the household level. Rud
(2007) finds that in India, the need for electricity to operate electrical pumpsets has
generated a demand for electricity in certain states and for the subsequent expansion of the
grid network. Cabraal et al. (2005) add that productive use for energy must take account of
health, education and gender alongside augmentation of incomes. They further add that the
programme for the productive use of electricity has been relatively successful in the area of
irrigation.
Using data set from the India Rural Economic and Demographic Survey (REDS) for different
periods (1981–82 and 1998–99) conducted by the National Council for Applied Economic
Research (NCAER), Walle et al. (2013) have carried out an evaluation of the long-term effects
of household electrification on consumption, labour supply and schooling in rural India. The
study provides information about the positive impact of electrification on schooling for boys
27

Analysis of the electrification programme in India using the ‘energy plus’ framework and the key lessons
and the significant gains for consumption and earnings. It also highlights that un-electrified
households also benefit from village electrification. The study suggests that village
electrification through grid connectivity adds one percentage point to the annual
consumption growth rate for households that do not have their own electricity. Also, it
reports that households compete among themselves to maintain their status and hence
purchase electrical equipment or acquire assets. An evaluation study for RGGVY points to
the use of electricity by rural inhabitants for productive purposes (TERI 2013a, TERI 2013b).
These reports highlight income-generating activities such as bamboo mat and khadi weaving
by community members using grid electricity. In addition, it also highlights use of grid
electricity for lighting. Similarly, a study by Chaurey et al. (2012) shows that decentralized
electricity service businesses through the renting of solar lanterns and mini-grid, micro-grid
or diesel-based generation has developed business opportunities for community members.
In addition, provision for franchisees under RGGVY has also developed business models for
income generation. In another study, Chaurey and Mohanty (2007) provide insights from the
Sundarbans in West Bengal highlighting that the provision of reliable electricity to remote
communities has had a significant impact on the socio-economic development of the region,
particularly for women. The availability of electricity has enabled women to undertake
certain household chores at their convenience. For example, water pumping and water
storage using motive power saves time and prevents drudgery. In addition, economic
activities such as weaving and sewing can also be undertaken using machines powered by
electricity. Similarly, a study of Sagardweep Island in West Bengal documented both the
direct and indirect benefits of solar power systems (Chakrabarti et al. 2014). A further study
of the Sundarbans region of West Bengal also identified significant impacts of electrification
using solar energy on local economies (Imai and Palit 2014). Analyses of Census of India
2011 and National Sample Survey data (Balachandra 2011) have provided insights into the
dynamics of electricity access, revealing that deprivation is highest for households in the
poorest income strata. Similarly, survey data collected by the Government of India
highlights the complexities and inadequacies of using a normative consumption-based
approach and also stresses the ineffectiveness of benchmark-based approaches (Srivastava et
al. 2012). Using cross-sectional data from the Indian Human and Development Survey, the
income differences between urban and rural non-farm enterprises have been evaluated in
terms of the different number of hours of electricity supply (Rao 2013). The study finds a
strong relationship between incomes and access to electricity and better supply. Similarly,
the instrumental variable approach has been used to determine the impact of electrification
28

Analysis of the electrification programme in India using the ‘energy plus’ framework and the key lessons
using the India Human and Development Survey’s 2005 data (Khandker et al. 2012). Their
analysis reveals that electrification has a positive effect on time allocation for fuel collection,
incomes, expenditures and the incidence of poverty. It also establishes that electrification can
address poverty in both the short and long terms. The paper adds that the relatively wealthy
households in rural settings benefit more from rural electrification.
The literature referred to in this report establishes that access to electricity in the village and
the household has a positive impact for rural inhabitants. Further, access to electricity
enhances the income-generating opportunities for households and enterprises. Hence, the
integration of electricity access with income-generating opportunities has been widely
recommended. However, rural electrification in India has largely pursued a supply-led
approach, as is also evident from the current definition of village electrification. A majority
of past studies and the secondary literature referred to in this report seems to have looked at
the impacts of rural electrification using secondary data, nor does it consider the
relationships between rural electrification, non-energy inputs and the village economy.
Therefore, the present study attempts to evaluate the recent rural electrification programme
in India by using the energy plus framework of the United Nations (UNDP, 2011) and by
focusing on the relationship between rural electrification, the flow of non-energy inputs and
the graduation of non-farm, home-based micro-enterprises from basic needs to the
productive use of electricity.
3.6 Challenges in enhancing access
There are many challenges—technical, financial, regulatory and institutional—hindering
electricity access in India. Despite having moderate to high village electrification rates,
household connections in rural India continue to be low. Furthermore, a large population
continues to use biomass fuels to meet their cooking energy needs. Some of the specific
challenges inhibiting the provision of ‘sustainable’ electricity access in rural areas are
discussed below (Palit et al. 2014).
a) Subsidy trap. India’s electrification programme is deeply anchored in a subsidy
culture. The expansion of grid infrastructure to rural areas has always been supported
with grants of capital. The capital subsidy level reached its peak under the RGGVY,
with 90 per cent support available for grid extension, as well as off-grid options. The
subsidy syndrome is even more visible in the case of electricity tariffs for grid-based
29

Analysis of the electrification programme in India using the ‘energy plus’ framework and the key lessons
supply, with agricultural consumers and BPL consumers in many states paying only a
minimum charge for electricity. The problem is further compounded by the practice of
unmetered supply,15 especially in the larger states of Uttar Pradesh and Bihar, which
makes billing and revenue collection difficult. The issue is so politically fraught that
tariff rationalization has become a major challenge for the electricity regulators. As a
consequence, most utilities have become practically financially unviable as entities.
While a case for supporting the poor and supporting infrastructure creation can be
made, such a system essentially has to be selective and targeted to ensure
sustainability.
b) Poor linkage with rural development agendas. The Indian approach has remained a
top-down approach, with the federal government designing the programme, and
implementation and operation being done by state agencies or others in pursuit of the
programme’s targets. However, the agenda has always failed to consider the issue of
electrification in a comprehensive manner. Instead, the impetus always seems to be on
taking the distribution network to the villages without appreciating the fact that
energy is a derived demand that requires appropriate appliances to create the
demand. Consumers cannot procure such equipment unless they have sufficient
buying power, and the process did not focus on facilitating rural development in a
way that could enhance their incomes and buying power. The village economy was
always seen in isolation from the rural electrification programmes. This lack of
emphasis in packaging rural electrification with the village economy restricted the
graduation of rural households from the basic use of electricity to its productive use.
This linkage or synergy between rural electrification and the village economy is
quintessential in making the leap to the productive use of electricity, which can in turn
result in enhanced household cash flows.
c) Lack of local resource integration. Although India has been pursuing various policies
on renewable energies and enhancing access, the attempts to harness local resources
for local-level supply have not been very effective. Large programmes have often
relied on conventional technologies and fuels, whereas funding and political support
15There are several reasons for unmetered supply, such as the meter being faulty after installation, or the household securing an electricity connection before the metering of supply was introduced by the electricity distribution company. Also, in some regions it is due to poor governance and community resistance to metered connection.
30

Analysis of the electrification programme in India using the ‘energy plus’ framework and the key lessons
for programmes based on local resources has been limited. This has created failed
projects and sent the wrong signals, although the potential remains high.
d) Policy barriers. In spite of the policy push over the years, it is sometimes argued that
the full potential of electricity access in remote rural areas cannot be realized under
existing conditions. For example, while the level of village electrification in India is
high, the actual number of connected households is comparatively low. In fact, the
current definition of village electrification in India requires the electrification of only
10 per cent of households for a village to be considered electrified. The key issues are
‘how to improve the household level connection’, and also ‘how to ensure sustained
electricity supply to rural areas in line with demand’. Furthermore, current policy
frameworks and interconnection standards do not fully allow excess generation from a
local mini-grid system to be fed into the conventional grid at a lower voltage level.
Also, under the current policy and regulatory regime, decisions on tariffs for an
independent mini-grid fall outside the regulatory regime. Off-grid systems are entirely
free of licensing obligations and regulatory oversight, leaving retail tariffs to be
determined solely by market forces. At the same time, the remoteness of these projects
increases their capital and O&M costs and hence the costs of generation and supply.
The poor payment capacity of rural consumers is an additional challenge. As a result,
projects sometimes lapse after few months of operation, as was observed in the case of
VESP (Palit et al. 2011). In this context, Palit and Bandyopadhyay (2015) recommend
providing cross-subsidies for mini-grid consumers, as is currently available for
consumers who draw electricity from the central grid. In terms of the legal framework,
the benefits of cross-subsidization are limited to grid-supplied consumers and cannot
be extended to consumers of off-grid systems. This benefit could have helped the
financial viability of mini-grid systems in remote areas, where user payments are
currently insufficient to achieve this.
31


Analysis of the electrification programme in India using the ‘energy plus’ framework and the key lessons
4. Defining Electricity Access and Stakeholder Analysis
4.1 Definition of village electrification The SE4All Global Tracking Framework defines electricity access as the availability of an
electricity connection at home or the use of electricity as the primary source for lighting. In
India also, one of the major impediments to achieving universal access to electricity has been
the definition of village electrification, which has evolved over the years. Before October
1997, a village was classified as electrified if electricity was being used within its revenue
area for any purpose whatsoever. After October, 1997 the definition was changed to a village
being deemed as electrified if the electricity is used in the inhabited locality, that is, within
the revenue boundary of the village, for any purpose whatsoever. According to the new
definition that came into effect in 2004–05, a village is declared electrified if:
1) Basic infrastructure such as a ‘distribution transformer’ and ‘distribution lines’ has
been provided in the inhabited locality, as well as in the Dalit Basti hamlet, where
this exists.
2) Electricity is provided to public places like schools, the panchayat office, health
centres, dispensaries, community centres, etc.
3) The number of households that have been electrified should be at least 10 per cent of
the total number of households in the village.
Because of this change of definition in 2004, many villages that were previously considered
electrified were classified in the un-electrified category, with an almost 10 per cent drop in
2004–2005 in the village electrification rate (Figure 7). In spite of the Government of India
adopting a more comprehensive definition of village electrification since 2004, it is still not
comprehensive enough, as it does not capture issues such as the quantity, quality or
adequacy of service.
33

Analysis of the electrification programme in India using the ‘energy plus’ framework and the key lessons
Figure 7. Progress in village electrification (source: CEA, 2013).
In the above context, Maithani and Gupta (2015) have recently proposed a new and more
comprehensive definition of village electrification, viewing it from a supply and demand
perspective, rather than just focusing on supply-side provision alone. They propose that:
a. More than 50 per cent of all households and public places in a village have an actual
electricity connection;
b. Electricity is supplied for a minimum of twelve hours, including a minimum of three
hours during peak evening hours (i.e., 5:30–10:30 pm);
c. The distribution transformer size is related to the potential load of more than 75 per
cent of the population based on the stated objective of providing 1 kWh per
household per day; and
d. Billing and collection should involve more than 80 per cent of the connected
households.
4.2 Stakeholder analysis This section summarizes stakeholders’ views regarding electricity access, with a focus on
rural areas and issues regarding the inclusion of productive applications in electricity access.
Stakeholders were of the view that providing electricity is seen more as a way to develop
infrastructure than as a public service entity. In fact, donor agencies mentioned that
government tends to side-line the service aspect of electricity and focuses on policies and
programmes that aim to develop infrastructure. In support of this statement, they quoted
the RGGVY programme and the Decentralized Distributed Generation (DDG) scheme of the
Ministry of Power, which concentrates only on infrastructural development.
34

Analysis of the electrification programme in India using the ‘energy plus’ framework and the key lessons
Stakeholders also stated that there are discrepancies when it comes to the planning of urban
and rural electricity infrastructure, as well as their quantity and quality. While in rural areas
end-users are provided with a defined amount of energy, consumers in urban areas can use
electricity at demand. This is due to the fact that, in planning the energy needs of urban
areas, electricity access is considered to be an infrastructural investment for the future,
whereas in rural areas it is still seen as a lifeline provisioning and subsidy scheme.
Stakeholders also talked about the reservations of government agencies in accepting new
technologies that could help reduce production costs, such as an unwillingness to accept
lithium ion batteries as a viable alternative to lead acid batteries or to adopt sufficiently large
transformers capable of taking up a productive application load to facilitate rural livelihood
opportunities along with electricity access.
One of the important points raised during the stakeholder discussions was a lack of
coordination and integration across different ministries, agencies and government
programmes. For example, integrating the government scheme of the National Rural
Livelihood Mission (NRLM) with other energy access programmes could provide better
market linkages and micro-finance facilities to communities, which in current scenario have
only failed to transfer the benefits to end-users. Also, to make the maximum use of
electricity, different players should be brought on to a single platform through a mechanism.
Electricity access in rural areas is also greatly affected by the cost factor and prices compared
to grid electricity, which often discourage people to take up electricity through off-grid
interventions. However, the reliability of the energy supply from the latter pushes the
consumer to take up the connection, and, with the support of suitably designed incentive
schemes, such off-grid interventions become the preferred option.
Further, stakeholders’ views indicated that, although many electricity access programmes
and schemes are being implemented by both government and the private sector, there is no
particular policy which could facilitate the use of energy. Despite the fact that being able to
use electricity for productive purposes will not only provide income-earning opportunities
to the rural population, but will also support the whole idea of national development, still
there is hardly any best case study demonstrating significant take-up of productive use
through rural electricity access programmes. The main factor hindering this development is
35
Analysis of the electrification programme in India using the ‘energy plus’ framework and the key lessons
the simple lack of any rural electricity access delivery model being designed to provide just
the basic lighting and mobile charging facility.
Stakeholders have quoted some examples where few government programmes, whether in
past or presently operating, have tried to link productivity with electricity but have not been
successful for various reasons. One such example, where the initial goal was to have
productive activities as one of the major design parameters in the electricity delivery model,
was RGGVY,16 but when the programme was implemented, it focused more on providing
electricity for lighting only. Remote Village Electrification was one such programme where
one can find mention of ‘productive use’, but it became defunct in 2013.
Also, it has been well pointed out that end-users cannot use electricity for productive
purposes unless there is an uninterrupted supply with minimal voltage fluctuations. Hence,
government policies should bear in mind the quality of energy supply, which aids in it being
taken up for productive purposes. To this, stakeholders also added the role of the
distribution companies (DISCOMs) in supplying uninterrupted electricity through the grid
in rural areas, assuming they had better functionality and profitability and a self-directing
approach. This would only result in faster processes for acquiring connections, streamlining
revenue collection and quicker responses to complaints, thereby serving consumers in a
more efficient manner and improving the DISCOMs’ image.
Stakeholders made a few recommendations to promote the productive use of rural
electricity access models, such as the alignment of different government departments and
ministries to ensure the optimal use of electricity for productive purposes, better availability
of finance for end-users to help them establish small-scale enterprises, encouraging village
cluster formation to promote large-scale productive activities for better economies of scale,
and finally, linking electricity access to an existing economic activity in the rural market. All
these initiatives may significantly result in the uptake of electricity for productive purposes,
simultaneously also reducing the expenditure on external training.
16 In 2005, the Government of India started the Rajiv Gandhi Grameen Vidyutikaran Yojana (RGGVY) to electrify all un-electrified villages and habitations and to provide access to electricity to all rural households in un-electrified and electrified villages in the entire country in a timely manner.
36
Analysis of the electrification programme in India using the ‘energy plus’ framework and the key lessons
The findings that have emerged from the consultations with stakeholders primarily
highlight the importance of convergence between electricity service provisioning and the
development of livelihood activities. Most stakeholders felt that there is a need for greater
regulatory certainty and the demarcation of areas for expanding electricity access through
the main grid and mini-grids respectively. Government should include mini-grids in the
regulatory framework to improve the clarity of project developers. Further, the focus should
be on aligning different government departments and ministries to ensure the optimal use of
electricity for productive purposes. Providing finance facilities for end-users to help
establish small-scale enterprises may also be given an enhanced focus. In addition, the
government may encourage the formation of village clusters to carry out productive
activities on a larger scale to provide better economies of scale. Lastly, linking electricity to
productive activities in places which have a stable supply of electricity and established
livelihood activity should be prioritized.
37


Analysis of the electrification programme in India using the ‘energy plus’ framework and the key lessons
5. Understanding the Role of Electricity and Non-Energy Inputs
This chapter presents a socio-economic analysis bringing out the difference between the two
categories of clusters selected for the study from different states. The first section discusses
the findings of the stage 1 survey of clusters selected from three different states, each with
different models for rural electrification. The second section discusses the stage 2 survey of
clusters selected from two different states, both connected to the central grid, but further
categorized into those with non-energy inputs and those without.
5.1 Stage 1 Survey: impact of village electrification on livelihoods
In accordance with the methodology mentioned in section 2.3.1, the sample was selected in
three steps. In the first step, three states were selected with the highest growth in rural
household electrification in 2001–11, namely, Bihar, Odisha and West Bengal.17 After these
states had been selected, electrified (varied across different sources of electrification) and un-
electrified clusters were chosen from them. In West Bengal, the district of South 24 Parganas
was identified where both electrified (through grid, mini-grid and stand-alone systems) and
un-electrified clusters were available. Based on stakeholder discussions, in the case of Bihar,
electrified (through mini-grids) and un-electrified clusters were identified in West
Champaran District, where electrification had been effected through mini-grids. On the
other hand, in Odisha, electrified (through stand-alone systems) and un-electrified clusters
were chosen in the district of Mayurbhanj, where the mode of electrification is stand-alone
systems. Finally, 184 electrified households and 16 electrified enterprises were chosen from
grid, mini-grid, and stand-alone system-connected areas. To compare them, 100 un-
electrified households and 17 un-electrified enterprises were also chosen from the same
clusters.
From the stage 1 survey, it was found that the average monthly income of an electrified
household ( 5,717) is significantly higher than the average income of an un-electrified
17 All three states have growth rates of rural household electrification of more than 80 per cent (Bihar 103%, Odisha 83%, and West Bengal 98%), while all other states have less than 50 per cent. However, all three states have poor levels of livelihood activity using electricity. Thus, in the stage 2 survey, a new methodology for selecting states was adopted.
39

Analysis of the electrification programme in India using the ‘energy plus’ framework and the key lessons
household ( 3,728). It was also found that post-electrification income has increased18 for both
electrified and un-electrified households. However, the increase in income is higher for an
electrified household (the rate of change of income is 53 per cent compared to 48 per cent for
un-electrified households). Even after deflation, this finding remains the same (Figure 8).
While increases in income are observed for both electrified and un-electrified households, it
is evident that there are factors beyond electricity access that lead to this difference in
increases in income between electrified and un-electrified households. Hence, the stage 2
survey identifies and attempts to establish the role of any non-energy inputs (or inputs over
and above electricity) affecting income augmentation.
Figure 8. Change in income for electrified (E) and un-electrified (UE) households.
To identify the mode of electricity service delivery which provides relatively greater
opportunities for increasing incomes, we disaggregated the households in accordance with
their source of electrification. Our survey reveals that, in the case of grid and off-grid supply
(the latter including both mini-grids and stand-alone systems), the average income of an
electrified household ( 5,608 for grid and 5,791 for off-grid) is higher than that of an un-
electrified household in the case of both grid ( 3,875) and off-grid ( 3,659) areas. The
incomes of households using all three modes of electricity supply have increased over time,
even in real terms. But, on comparing the change in household incomes before and after
electrification, it was found that in grid-connected areas, electrified households reap
relatively more benefits (rate of change of income is 45 per cent) compared to un-electrified
households (rate of change of income is 27 per cent) in grid-connected areas. However, in
18 Compared to pre-electrification.
40
Analysis of the electrification programme in India using the ‘energy plus’ framework and the key lessons
the surveyed areas with access to mini-grids and/or stand-alone solar interventions, it was
found that un-electrified households reap an almost equal benefit (rate of change of income
is 62 per cent) compared to electrified households (rate of change of income 59 per cent) in
such areas. The increase in incomes in both electrified and un-electrified households in
surveyed areas (for both grid and off-grid clusters) thus indicates that, apart from electricity,
other non-energy inputs may also have influenced improvements to livelihoods. A probable
reason for the greater change in incomes for grid-connected households compared to
households with mini-grids or stand-alone systems could be explained by the following. The
fact that grid supply is available for longer time periods and that price are regulated (as
compared to off-grid supply, which is available only for specific hours and has a relatively
high or market-determined price) helps electrified households use it for more than just basic
needs such as lighting and mobile phone charging, thus reaping more benefits.
If we disaggregate the off-grid supply in electrified households through mini-grid and
stand-alone systems,19 the study reveals that the average income of an electrified household (
6,796 for mini-grids and 3,939 for stand-alone systems) is higher than that of an un-
electrified household ( 5,419 and 2,184) in both the areas with mini-grids and those with
stand-alone systems. All of them enjoyed increases in incomes after electrification
(compared to before electrification) even in real terms. Similarly, in both areas with mini-
grids and those with stand-alone systems, un-electrified households (rate of change of
income is 62 per cent with mini-grids and 61 per cent with stand-alone systems) receive
almost equal benefits compared to electrified households (rate of change of income is 58 per
cent with mini-grids and 61 per cent with stand-alone systems) even in real terms (Figure 9).
Theoretically, mini-grid supply is better than stand-alone systems, as the latter provides
electricity for relatively less time and cannot be used for purposes other than for lighting.
However, our sample failed to find and evidence of this. This may be because in both cases
(mini-grids and stand-alone systems), the electricity supply in the surveyed areas is only
provided for lighting and mobile-phone charging, i.e., the end use is for basic purposes in
both areas, because of which both fail to generate relatively greater incomes for electrified
households compared to un-electrified households. Thus, our sample helps us to conclude
19 To control state-specific effects on income, the study collected samples from two different states (for both categories, i.e., the mini-grid sample was collected from Bihar and West Bengal, while the stand-alone system sample was collected from Odisha and West Bengal). But, to remove sample bias on incomes and identify the impact of electrification from two different sources, comparisons of changes in income are required.
41
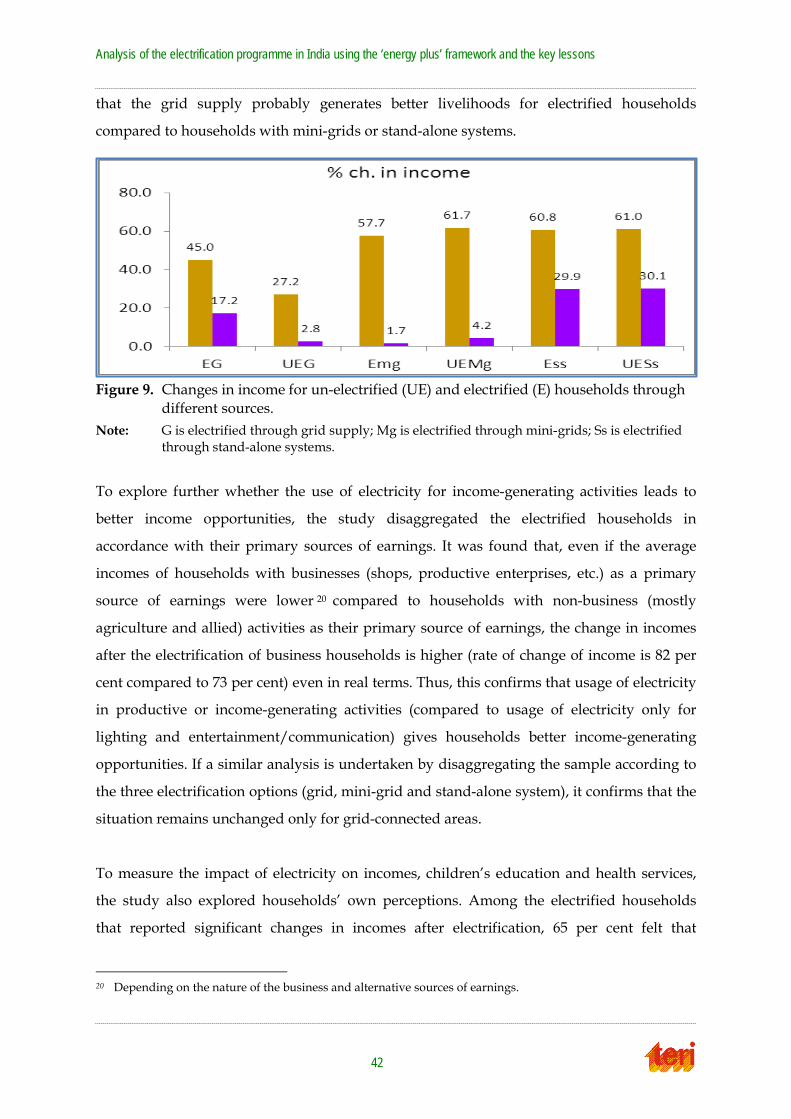
Analysis of the electrification programme in India using the ‘energy plus’ framework and the key lessons
that the grid supply probably generates better livelihoods for electrified households
compared to households with mini-grids or stand-alone systems.
Figure 9. Changes in income for un-electrified (UE) and electrified (E) households through different sources.
Note: G is electrified through grid supply; Mg is electrified through mini-grids; Ss is electrified through stand-alone systems.
To explore further whether the use of electricity for income-generating activities leads to
better income opportunities, the study disaggregated the electrified households in
accordance with their primary sources of earnings. It was found that, even if the average
incomes of households with businesses (shops, productive enterprises, etc.) as a primary
source of earnings were lower 20 compared to households with non-business (mostly
agriculture and allied) activities as their primary source of earnings, the change in incomes
after the electrification of business households is higher (rate of change of income is 82 per
cent compared to 73 per cent) even in real terms. Thus, this confirms that usage of electricity
in productive or income-generating activities (compared to usage of electricity only for
lighting and entertainment/communication) gives households better income-generating
opportunities. If a similar analysis is undertaken by disaggregating the sample according to
the three electrification options (grid, mini-grid and stand-alone system), it confirms that the
situation remains unchanged only for grid-connected areas.
To measure the impact of electricity on incomes, children’s education and health services,
the study also explored households’ own perceptions. Among the electrified households
that reported significant changes in incomes after electrification, 65 per cent felt that
20 Depending on the nature of the business and alternative sources of earnings.
42
Analysis of the electrification programme in India using the ‘energy plus’ framework and the key lessons
electricity (village electrification) is partly responsible (only another 8 per cent believed that
electricity is largely responsible). The remaining 27 per cent felt that non-energy factors
(such as skills development, job opportunities, etc.) may be responsible for such changes in
incomes. On the other hand, about 36 per cent of the households that reported changes in
the education of their children after electrification considered that electricity was largely
responsible for the change (another 34 per cent believed that electricity was partly
responsible). Finally, about 44 per cent of households who perceived a change in health
services after electrification reported that electricity had a large impact on this change
(another 38 per cent report that electricity has a partial impact).
To explore the impact of electrification on entrepreneurial activity, the study found that the
average monthly revenue of an electrified enterprise ( 14,165) is significantly higher than
that of an un-electrified enterprise ( 5,950). While revenues have increased over time (before
and after electrification) for both categories, in real terms average revenue has declined for
both categories.21 However, the change in revenue (20 per cent) is higher for un-electrified
enterprises as compared to electrified enterprises (13 per cent). In real terms, the decline is
greater for electrified (17 per cent) compared to un-electrified (11 per cent) enterprises
(Figure 10). Ideally, electrified enterprises should enjoy relatively greater increases in
revenues compared to un-electrified enterprises. This discrepancy in the surveyed clusters
may be due to the nature of their businesses.22 Since the sample was collected from both grid
and mini-/off-grid connected areas, the study disaggregated the analysis at the boundary
between the grid and mini-/off-grid area. In the grid area, the average revenue of an
electrified enterprise ( 24,429) is almost double that of an un-electrified enterprise ( 12,200),
even in real terms, but none reports a significant increase in revenue after electrification.
Ideally, electrified enterprises in the grid area are expected to reap the benefits of
electrification through significant increases in revenue after electrification. However, this
21 Revenue has increased in monetary terms but declined in real terms, implying that inflation was higher than the change in revenue.
22 It was found in the survey that a majority of the electrified sample are retail shops, while the un-electrified sample mostly consisted of a barber, mechanic, tailor, saal leaf-plate maker, etc. Now, in spite of being electrified, retail shops do not have much application of electricity beyond lighting. But using electricity only for lighting does not provide much benefit unless it is used for productive purpose. On the other hand, enterprises like the barber, mechanic and tailor are mainly skilled jobs. The absence of electricity may not have much impact on their businesses and may not affect their revenues significantly. Over time, through skills improvements, their changes in revenue may be higher despite the limited application of electricity (like retail shops). Thus, the un-electrified sample in such cases may show greater changes to revenue compared to the electrified sample in this study.
43

Analysis of the electrification programme in India using the ‘energy plus’ framework and the key lessons
study did not find any such evidence in the surveyed area, which may be due to the fact that
the cluster was electrified only couple of years ago. Further, during this period, a significant
number of similar enterprises were also started in the neighbourhood area. Thus, because of
increasing competition, on average monthly revenue did not change significantly for the
surveyed enterprises. In the case of off-grid areas also, average revenue is higher for
electrified enterprises ( 6,980) than for un-electrified enterprise ( 3,109), both enjoying
increases in revenue even in real terms. However, changes in revenue are significantly
higher in the case of un-electrified enterprises (83 per cent) than electrified enterprises (63
per cent). Ideally, electrified enterprises are expected to receive greater benefits from
electrification through higher changes in revenue after electrification compared to un-
electrified enterprises in the same area. However, this study failed to find any such evidence
in the surveyed area. The reason may be explained as set out in footnote 22.23
Figure 10. Change in average revenue of electrified (E) and un-electrified (UE) enterprises.
If we disaggregate the off-grid connections in mini-grids and stand-alone systems, the
average revenue of an electrified enterprise ( 10,400 and 3,560) is higher even in real terms
than that of an un-electrified enterprise ( 4,500 and 2,314) in both mini-grid and stand-
alone system-connected areas. Further, as in the household analysis (see footnote 19), to
control state-specific effects on revenue, the study has collected samples from two different
states (for both categories, i.e., a mini-grid sample was collected from Bihar and West
Bengal, while a stand-alone system sample was collected from Odisha and West Bengal). To
23 See footnote 22.
44

Analysis of the electrification programme in India using the ‘energy plus’ framework and the key lessons
remove sample bias on revenues and to identify the impact of electrification from two
different sources, a comparison of changes in revenue is required. However, increases in
revenue after electrification compared to before electrification are higher for un-electrified
enterprises (rate of change of revenue is 100 per cent compared to 50 per cent for electrified
enterprises) in mini-grid areas,24 while electrified enterprises (rate of change of revenue is
116 per cent compared to 68 per cent for un-electrified enterprises) enjoyed higher increases
in revenue in stand-alone system-connected areas. In real terms the situation remains
unchanged, but electrified enterprises in mini-grid areas actually faced a decline in revenue
in real terms (Figure 11). Ideally, electrified enterprises in mini-grid areas are expected to
have increases in revenue in both monetary and real terms but this study did not find
evidence of this. In monetary terms, there were increases in revenue after electrification
(though it was less than that of an un-electrified enterprise, as explained in footnote 22) for
electrified enterprises in mini-grid areas. But, as monetary increases become less (though not
very significantly) after deflation, the change in revenue becomes negative, in other words, a
decline in revenue is observed. Thus, the enterprise survey did not show any definitive
conclusion on the impact of electrification, which might be due to nature of the businesses
(as explained in footnote 17) and the limited sample size.
Figure 11 Actual change in average revenue for un-electrified (UE) and electrified (E) through different sources.
Note: G is electrified through grid supply; mg is electrified through mini-grid; ss is electrified through stand-alone system; ng is off-grid (including both mini-grid and stand-alone system).
This issue may be overcome by increasing the sample size, where more enterprises with
different types of business can be included, possibly leading to different conclusions.
24 See footnote 22.
45

Analysis of the electrification programme in India using the ‘energy plus’ framework and the key lessons
However, the objective of stage 1 survey was to select the cluster with the mode of
electrification which provides relatively better changes in income for stage 2 surveys. Since
the household sample provided answers, the study did not attempt to overcome this
problem given the limited time and resources available. Thus, based on the household
survey, we selected grid-connected areas showing the existence of livelihood activities for
our stage 2 survey. Moreover, since the grid covers almost 95 per cent of India’s inhabited
villages, it was felt that it would be easier to select livelihood clusters to analyse the impact
of non-energy inputs on livelihoods (through productive activity) in the stage 2 survey.
However, all three states selected for the stage 1 survey were found to have poor livelihood
activities using electricity, so a new methodology for state selection was adopted for stage 2
surveys.
5.2 Stage 2 survey: role of non-energy inputs In stage 2, sites were selected which have been electrified through the central grid. Again in
this stage, samples were chosen in three steps, as mentioned in section 2.3.2. Based on a
composite index, the values for each state were computed, and the states were categorized
as best performing (top three in composite index value) or worst performing (bottom three
in composite index value). Then one state from the top three states was picked and one from
the bottom three, based on logistical feasibility. The values of the composite index for each
state are given in Annex 4. Andhra Pradesh and Madhya Pradesh were chosen as the best
and poorest performing states respectively for the stage 2 survey. After the states had been
selected, weaving livelihood clusters were chosen from both states. In addition, a fishing
livelihood cluster was chosen from Andhra Pradesh. Then each cluster was divided into two
groups based on the availability of electricity with non-energy inputs. Finally, households
and enterprises were chosen randomly from these groups. The following table (Table 6)
briefly describes the sample. The information available from the survey is discussed in the
following sections.
Table 6. Details of sample in stage 2 survey.
S. No. State Cluster type Location Code for this study
1. Madhya Pradesh
Weaving Pranpur, Chanderi Cluster in MP with electricity and non-energy inputs (MP NE)
2. Madhya Pradesh
Weaving Ramnagar, Chanderi Cluster in MP with electricity but without non-energy inputs (MP NNE)
3. Andhra Fishing + Pochampally, Households in AP with electricity and
46

Analysis of the electrification programme in India using the ‘energy plus’ framework and the key lessons
Pradesh Weaving Bhairavapalem, Ramanapalem, Pedalavalasa
non-energy inputs (AP NE)
4. Andhra Pradesh
Fishing + Weaving
Raghavapuram, Kurrela, Uppalanka
Households in AP with electricity but without non-energy inputs (AP NNE)
5. Andhra Pradesh
Weaving Pochampally (main) Weaving cluster in AP with electricity and non-energy inputs (AP1 NE)
6. Andhra Pradesh
Weaving Raghavapuram, Kurrela (near Pochampally).
Weaving cluster in AP with electricity but without non-energy inputs (AP1 NNE)
5.2.1 Identification of villages in each cluster
The energy plus approach mentions the drawbacks of a minimalist approach and
emphasizes the efforts that will augment incomes by complementing energy services, such
as access to information, market linkages, business development services and access to
capital. The approach also describes certain good practices, but it does not list the package of
non-energy inputs that should be combined with the energy inputs to trigger productive
uses of energy by households.
In this report, as mentioned in the previous section, in each livelihood cluster two categories
of households and enterprises were selected based on the access to non-energy inputs
received. The definition of non-energy inputs25 has been extended from the National Rural
Livelihood Mission26 (NRLM), the Government of India document that had redefined its
focus to include the multi-dimensional nature of poverty and to initiate necessary action to
alleviate the situation. The Society for the Elimination of Rural Poverty (SERP) under the
NRLM has been a pioneer among community-based organizations in extending human
development and livelihood services, and it was also the resource cell in the development of
NRLM.27
25 In accordance with UNDP 2011, non-energy inputs may include among others access to credit, access to raw materials, market linkages, infrastructure such as roads and communications, availability of information and skills training, and social services.
26 The National Rural Livelihood Mission (NRLM) is a poverty alleviation project being implemented by the Ministry of Rural Development, Government of India. This scheme is focused on promoting the self-employment and organization of rural poor. The basic idea behind this programme is to organize the poor into SHG (Self Help Groups) and make them capable of self-employment.
27 IKP Annual Report 2013–14 http://www.serp.ap.gov.in/SHGOLD/files/documents/IKP_Progress_Report_Annual1314.pdf; last accessed 15 June 2015.
47

Analysis of the electrification programme in India using the ‘energy plus’ framework and the key lessons
The livelihood services of NRLM, mentioned below, in combination with institutional
inputs, human and social capital, and entitlements (Figure 12), are derived from the services
offered by various SERP departments28 to SHG29 households and have been defined as the
non-energy inputs for the Andhra Pradesh part of the study. Further, in addition to the non-
energy inputs mentioned above, SERP has also offered livelihood-specific and
geographically specific services, as in the two clusters in Andhra Pradesh. This is being done
in partnership with a Federation of SHGs (Godavari Maha Samakhya, GMS) in the case of a
cluster in Thallarevu, Kakinada, also involving a non-governmental organization (the
Chetana Society) and a private organization (Chenetha Colour Weaves), in the weaving
cluster at Pochampally, Nalgonda.
Village-level federations of SHGs known as Village Organizations (VO) are graded from ‘A’
to ‘F’, with ‘A’ being the highest grade). These grades are the performance of the SHGs
under the VO in terms of loan repayments, savings, regular SHG meetings and internal
lending. The grade of VO determines the quality and quantity of the benefits transferred.
Thus, in this study, AP NNE stands for a cluster in Andhra Pradesh with electricity and
without non-energy inputs, which translates into a household or an enterprise that is not a
member of SHG or falls into a VO grade {C,D,E,F}, or is not a member of the federation of
GMS or falls outside the support of the NGO Chetana Society and Chenetha Colour Weaves.
Further, AP NE stands for clusters in Andhra Pradesh with electricity and receiving non-
energy inputs, or enterprises and households that are members of SHG, have a SHG grade
{A, B}, are members of GMS or have benefited through the project of Chetana Society and
Chenetha Colour Weaves.
Unlike Andhra Pradesh, to identify villages for the study in Madhya Pradesh, focus-group
discussions were undertaken in the villages of Pranpur and Ramnagar. The discussion
revealed that both villages are located within a radius of 4 km from the block headquarters
at Chanderi. Both villages have access to informal financial institutions. However, Pranpur
has relatively better access to public transport and the telecom network. In addition, it is
28 http://www.serp.ap.gov.in/SHGAP/#; last accessed 15 June 2015. 29 SHG refers to Self Help Group.
48
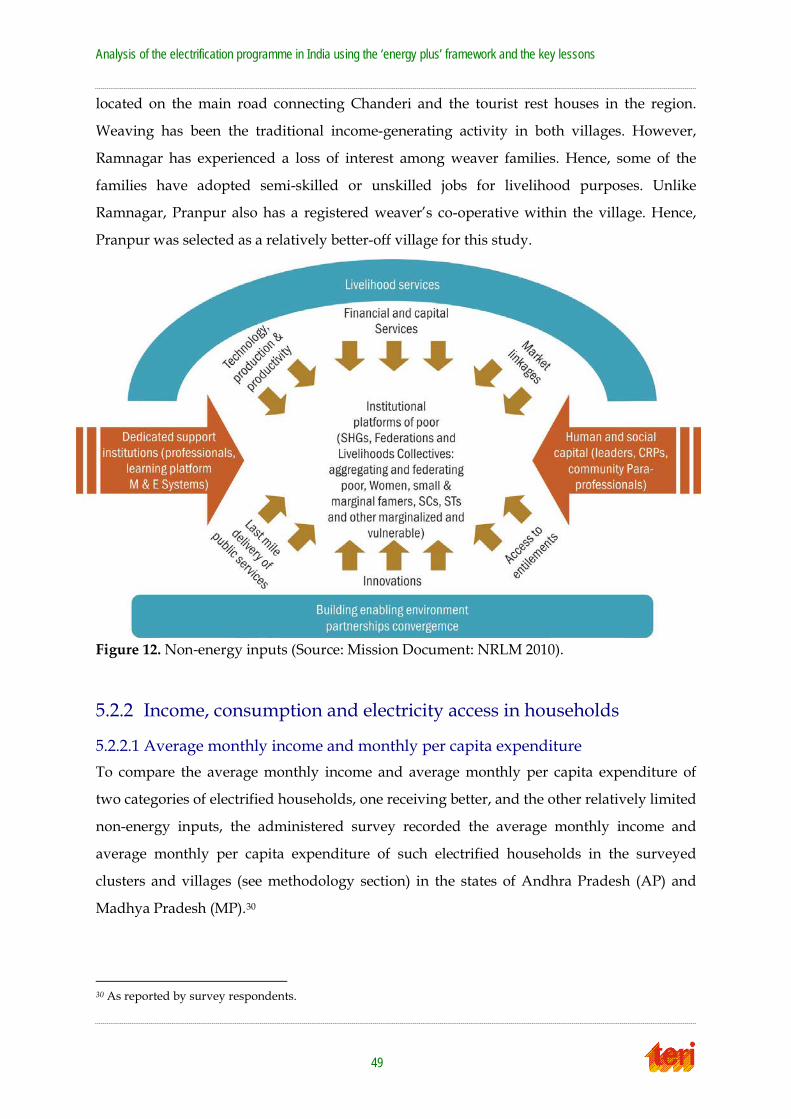
Analysis of the electrification programme in India using the ‘energy plus’ framework and the key lessons
located on the main road connecting Chanderi and the tourist rest houses in the region.
Weaving has been the traditional income-generating activity in both villages. However,
Ramnagar has experienced a loss of interest among weaver families. Hence, some of the
families have adopted semi-skilled or unskilled jobs for livelihood purposes. Unlike
Ramnagar, Pranpur also has a registered weaver’s co-operative within the village. Hence,
Pranpur was selected as a relatively better-off village for this study.
Figure 12. Non-energy inputs (Source: Mission Document: NRLM 2010).
5.2.2 Income, consumption and electricity access in households
5.2.2.1 Average monthly income and monthly per capita expenditure To compare the average monthly income and average monthly per capita expenditure of
two categories of electrified households, one receiving better, and the other relatively limited
non-energy inputs, the administered survey recorded the average monthly income and
average monthly per capita expenditure of such electrified households in the surveyed
clusters and villages (see methodology section) in the states of Andhra Pradesh (AP) and
Madhya Pradesh (MP).30
30 As reported by survey respondents.
49

Analysis of the electrification programme in India using the ‘energy plus’ framework and the key lessons
The average monthly income of electrified households in Andhra Pradesh was found to be
significantly higher than those in Madhya Pradesh (Figure 13). Further, while the average
monthly income for AP NE was registered as 9,788, it was found to be 6,081 in AP NNE.
Unlike Andhra Pradesh, in Madhya Pradesh the average monthly income for MP NE and
MP NNE were found to be 4,595 and 3,120 respectively (lower than in Andhra Pradesh).
Further, the difference in the average monthly income between AP NE and AP NNE is
higher than that for the difference between MP NE and MP NNE. This is confirmed by lower
average monthly per-capita expenditure 31 (Figure 14) in MP relative to household
respondents in Andhra Pradesh. Further, MPCE (monthly per capita expenditure) is highest
in AP NE and lowest in MP NNE. This finding is a clear indication of the important role of
non-energy inputs over and above electricity access for livelihood augmentation.
Figure 13. Average monthly income of electrified households.
Figure 14. Average monthly per capita expenditure (MPCE) in INR.
31 Monthly per capita expenditure (MPCE) is defined first at the household level (household monthly consumer expenditure ÷ household size).
50
0
2000
4000
6000
8000
10000
12000
AP MP
Average monthly household income (in INR)
NE NNE
I n c ome
1412
797 1040
601
AP MP
Average Monthly Per Capita Expenditure for household (in INR)
NE NNE

Analysis of the electrification programme in India using the ‘energy plus’ framework and the key lessons
5.2.2.2 Electricity as an opportunity to augment incomes and income opportunities The administered questionnaire also drew information from respondents to understand
their perception of the role of electricity as an opportunity for augmenting income through
entrepreneurship. From the AP NE and MP NE clusters, an increase in income 32 was
reported by 54 per cent and 95 per cent of the households respectively after the injection of
non-energy inputs. At the same time, the percentage of households identifying electricity as
the primary factor contributing to increases in income in Madhya Pradesh is significantly
lower than that in Andhra Pradesh (Figure 15). Further, the willingness of HHs to undertake
entrepreneurship (intervention that uses electricity) in future was higher among
respondents in AP NE (69 per cent) than in AP NNE, and the same was lowest among HH
respondents in MP NE. Hence, in this study, it is evident that, despite electricity access,
there is difference in the findings for the clusters selected for this study. The encouraging
finding from Andhra Pradesh, beyond households’ access to electricity, pinpoints the role of
non-energy inputs as a catalyst.
Figure 15. Electricity as opportunity to augment to income opportunities (per cent of HHs).
5.2.2.3 Ownership of electrical and electronic appliances by electrified households
Beyond MPCE, the study also looked into the ownership of electrical and electronic
appliances among the survey respondents. Appliance ownership is an indicator of a
household’s access to the electricity supply network. In addition, it also reflects the
reliability of the electricity supply. However, this study did not aim to identify an exhaustive
list of factors that have catalysed the adoption of respective appliances by survey
respondents.
32 Increase in income relative to period when there was no access to effective non-energy inputs of any kind and/or no intensification of electrification within the village.
54
15
95
60 65
43 29
7
69
43 33
47
AP NE AP NNE MP NE MP NNE
Electricity as opportunity to augment income opportunities (per cent of HHs)
Per cent of HHs reportingincrease in income
Per cent fo HHs reportingelectricity essential forincremental incomePer cent of HHs willing toundertake entrepreneurship(electricity based initiative)
51
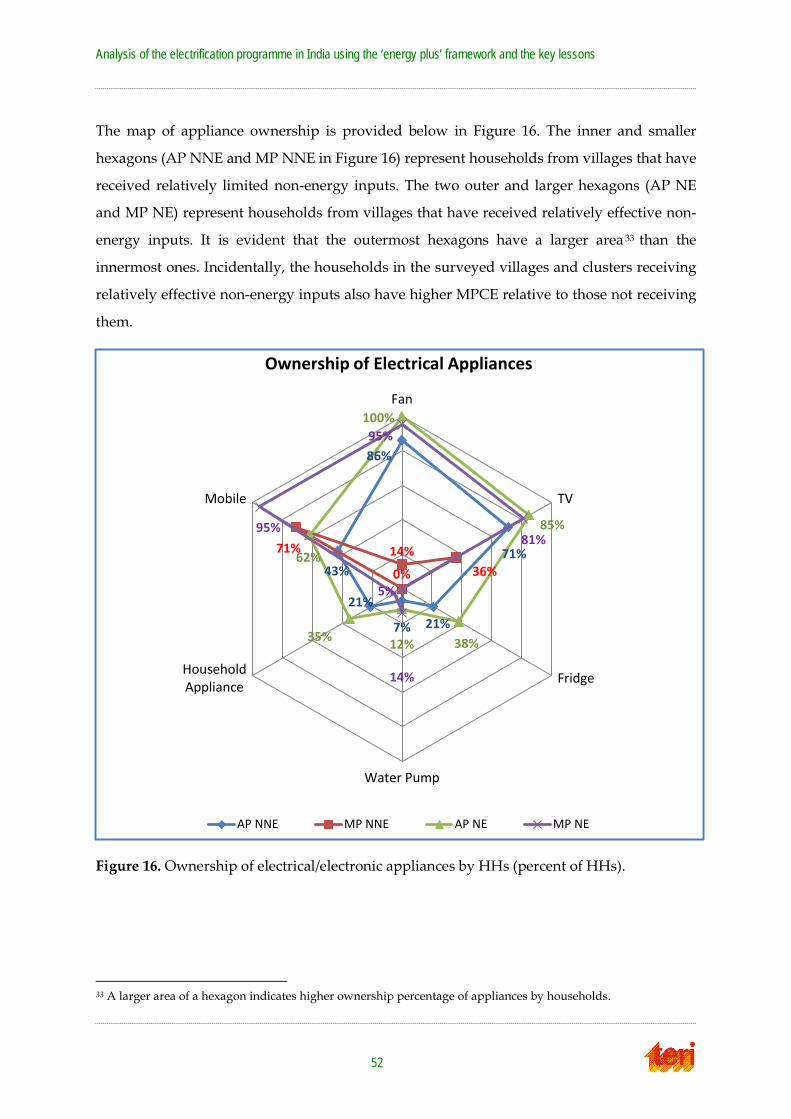
Analysis of the electrification programme in India using the ‘energy plus’ framework and the key lessons
The map of appliance ownership is provided below in Figure 16. The inner and smaller
hexagons (AP NNE and MP NNE in Figure 16) represent households from villages that have
received relatively limited non-energy inputs. The two outer and larger hexagons (AP NE
and MP NE) represent households from villages that have received relatively effective non-
energy inputs. It is evident that the outermost hexagons have a larger area 33 than the
innermost ones. Incidentally, the households in the surveyed villages and clusters receiving
relatively effective non-energy inputs also have higher MPCE relative to those not receiving
them.
Figure 16. Ownership of electrical/electronic appliances by HHs (percent of HHs).
33 A larger area of a hexagon indicates higher ownership percentage of appliances by households.
86%
71%
21% 7%
21%
43% 14%
36% 0%
71%
100%
85%
38% 12% 35%
62%
95%
81%
14%
5%
95%
Fan
TV
Fridge
Water Pump
HouseholdAppliance
Mobile
Ownership of Electrical Appliances
AP NNE MP NNE AP NE MP NE
52
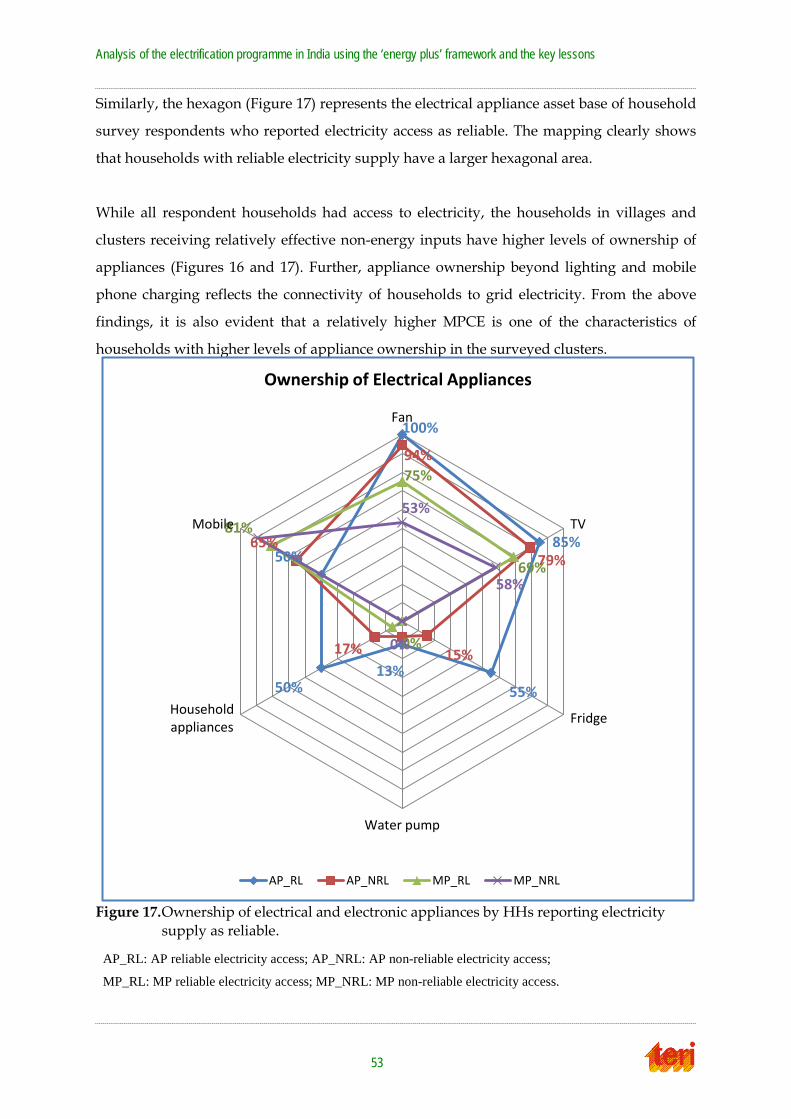
Analysis of the electrification programme in India using the ‘energy plus’ framework and the key lessons
Similarly, the hexagon (Figure 17) represents the electrical appliance asset base of household
survey respondents who reported electricity access as reliable. The mapping clearly shows
that households with reliable electricity supply have a larger hexagonal area.
While all respondent households had access to electricity, the households in villages and
clusters receiving relatively effective non-energy inputs have higher levels of ownership of
appliances (Figures 16 and 17). Further, appliance ownership beyond lighting and mobile
phone charging reflects the connectivity of households to grid electricity. From the above
findings, it is also evident that a relatively higher MPCE is one of the characteristics of
households with higher levels of appliance ownership in the surveyed clusters.
Figure 17. Ownership of electrical and electronic appliances by HHs reporting electricity supply as reliable.
AP_RL: AP reliable electricity access; AP_NRL: AP non-reliable electricity access;
MP_RL: MP reliable electricity access; MP_NRL: MP non-reliable electricity access.
53
100%
85%
55% 13%
50%
50%
94%
79%
15% 17%
65%
75%
69%
0%
81% 53%
58%
0%
Fan
TV
Fridge
Water pump
Householdappliances
Mobile
Ownership of Electrical Appliances
AP_RL AP_NRL MP_RL MP_NRL

Analysis of the electrification programme in India using the ‘energy plus’ framework and the key lessons
5.2.2.4 Willingness to purchase electrical appliances by electrified households While the administered survey attempted to compare the willingness of respondent
households to undertake entrepreneurship (Figure 15), it was important to learn about their
motivation to purchase appliances that would foster entrepreneurship in the future. In
Andhra Pradesh, a majority of the household respondents who had relatively effective
access to non-energy inputs expressed a willingness to purchase new electrical appliances in
the future. Unlike Andhra Pradesh, in Madhya Pradesh, household respondents who had
relatively limited access to effective non-energy inputs expressed a willingness to purchase
new electrical appliances in the future (Figure 18). This is largely attributable to lower MPCE
and the higher aspirations of the respondents in MP who have relatively limited access to
effective non-energy inputs. In addition, the respondents in the village with relatively
limited access to effective non-energy inputs are also exposed to modern and efficient
electrical appliances, as village residents undertake seasonal jobs in the cities.
Incidentally, villages in both Andhra Pradesh and Madhya Pradesh where respondent
households reported a greater willingness to purchase new electrical appliances that would
catalyse entrepreneurship in the future also reported higher percentages of respondents
willing to undertake entrepreneurship. However, the contrast between Andhra Pradesh and
Madhya Pradesh reflects the fact that it is not merely electrification that is a driver of the
willingness of households to purchase electrical appliances that foster productivity and/or
income generation, but also non-energy inputs such as exposure to inputs, sustained access
to timely and affordable credit, and the benefits of mechanization and techniques of
mechanization.
Figure 18. Households reporting willingness to purchase new electrical appliances.
54
54%
0%
14%
79%
AP MP
Willingness to Purchase Electrical Appliances (per cent of HHs)
No Non Energy
Non Energy
Analysis of the electrification programme in India using the ‘energy plus’ framework and the key lessons
5.2.3 Income, non-energy inputs, and electricity access in enterprises34
5.2.3.1 Income and changes to income for electrified enterprises The administered survey was also aimed at determining the average monthly income of
enterprises in clusters receiving relatively effective non-energy inputs and those receiving
limited non-energy inputs. Average monthly incomes for electrified enterprises in both
Madhya Pradesh and Andhra Pradesh were found to be higher for villages and enterprises
that received relatively effective non-energy inputs (Figure 19). However, in both Madhya
Pradesh and Andhra Pradesh, for the electrified enterprises that received relatively effective
non-energy inputs, the average monthly income in Andhra Pradesh was found to be higher.
At the same time, for the electrified enterprises that received relatively poor or limited non-
energy inputs, average monthly incomes for Andhra Pradesh and Madhya Pradesh were not
significantly different. Similarly, the percentages of electrified enterprises reporting
increases in monthly incomes in both Andhra Pradesh and Madhya Pradesh are higher for
those who have access to relatively effective non-energy inputs.
At the same time, among the enterprises that have received relatively poor or limited non-
energy inputs, the percentage of enterprises reporting decreases in monthly incomes is
higher than those reporting increases. Hence, the findings (Figures 19 and 20) reveal that, in
the study area, access to effective non-energy input influences average monthly enterprise
income. The study also looked at the non-energy inputs received by the surveyed villages
and enterprises in both Andhra Pradesh and Madhya Pradesh. These inputs are discussed in
the next section.
34 For the purposes of this study, we have only included enterprises within the habitation and enterprise, and this study refers to non-farm and home based entities only.
55

Analysis of the electrification programme in India using the ‘energy plus’ framework and the key lessons
Figure 19. Average monthly income for electrified enterprises.
Figure 20. Electrified enterprises reporting change in monthly income.
5.2.3.2 Electricity and non-energy inputs reported by electrified enterprises The administered survey recorded the non-energy inputs received by the enterprise
respondents in AP1 NE, AP1 NNE, MP NE, and MP NNE. The polygons below (Figure 21)
illustrate the mapping of the top five non-energy inputs reported by the majority of
enterprise respondents. The differentiating non-energy input reported by AP1 NE is
‘institutions’. The inputs reported by AP1 NNE respondents are independent of any
institutional or project support and are mainly personal ties and rapport in the market. Some
other inputs were also reported by the AP1 NNE households, such as training by a
cooperative or society. However, this was a one-off training, unlike the continuous up-
grading training received by AP1 NE households on how to meet market expectations for
better designs, colours and tools. Similarly, respondents in MP NE report effective access to
institutions which the MP NNE respondents did not report. It is notable that the average
monthly income of AP1 NE is higher than that of AP1 NNE. In the same way, the average
56
5313
3235 3130
4374
AP1 NE AP1 NNE MP1 NE MP1 NNE
Monthly average income for electrified enterprises (in INR)
47
6
55 41
53
94
45 59
AP1 NE AP1 NNE MP NE MP NNE
Percent of electrified enterpises reporting change in monthly income
Increase Decrease
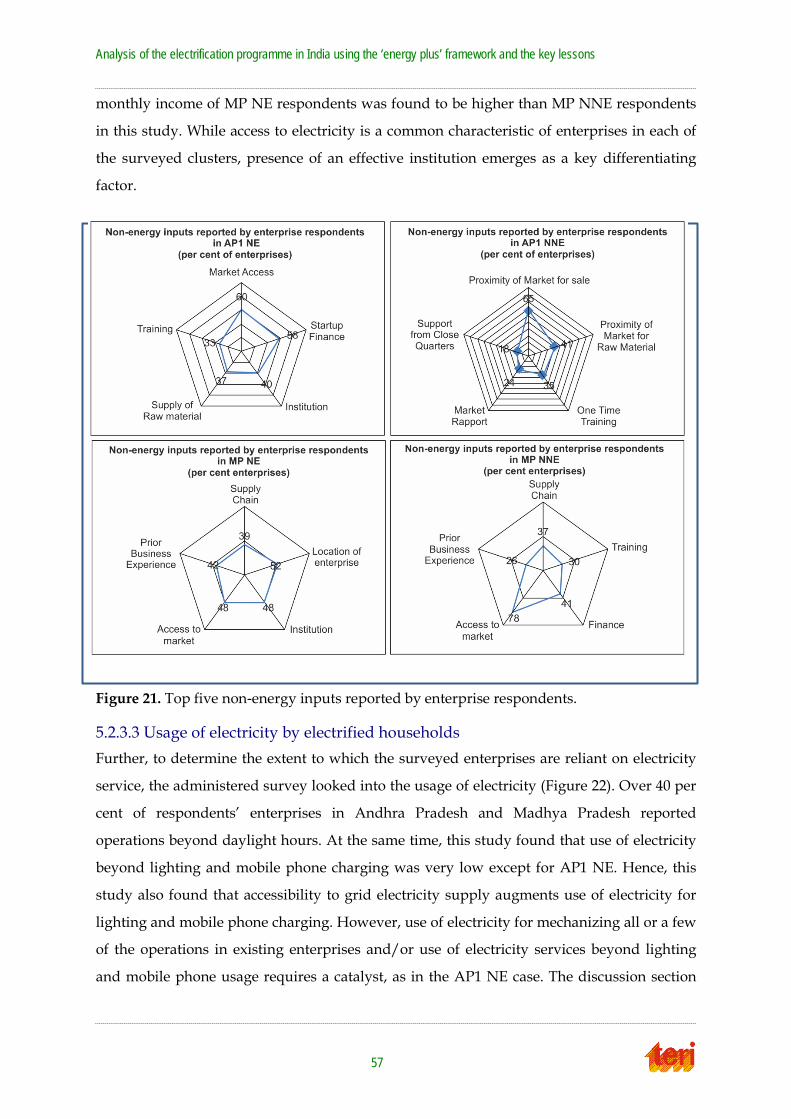
Analysis of the electrification programme in India using the ‘energy plus’ framework and the key lessons
monthly income of MP NE respondents was found to be higher than MP NNE respondents
in this study. While access to electricity is a common characteristic of enterprises in each of
the surveyed clusters, presence of an effective institution emerges as a key differentiating
factor.
Figure 21. Top five non-energy inputs reported by enterprise respondents.
5.2.3.3 Usage of electricity by electrified households Further, to determine the extent to which the surveyed enterprises are reliant on electricity
service, the administered survey looked into the usage of electricity (Figure 22). Over 40 per
cent of respondents’ enterprises in Andhra Pradesh and Madhya Pradesh reported
operations beyond daylight hours. At the same time, this study found that use of electricity
beyond lighting and mobile phone charging was very low except for AP1 NE. Hence, this
study also found that accessibility to grid electricity supply augments use of electricity for
lighting and mobile phone charging. However, use of electricity for mechanizing all or a few
of the operations in existing enterprises and/or use of electricity services beyond lighting
and mobile phone usage requires a catalyst, as in the AP1 NE case. The discussion section
57

Analysis of the electrification programme in India using the ‘energy plus’ framework and the key lessons
will explain further the role of a catalyst based on findings from the surveyed enterprises in
the study areas.
Figure 22. Usage of electricity by enterprise.
5.2.4 Regression analysis To strengthen our primary survey analysis and stakeholder discussion, we conducted a set
of regression analyses using an enterprise sample. This sample was collected in both states
(Andhra Pradesh and Madhya Pradesh) and both clusters (Weaving and Fishering in
Andhra Pradesh and Weaving in Madhya Pradesh). To address our objective of identifying
the factors responsible for improvements to livelihoods in terms of increases in revenue,
each entrepreneur was asked to respond whether they felt a particular factor to be important
or not. Thus, to quantify the bivariate qualitative response, we generated a binary response
variable with values of 1 (if yes) and 0 (if No). Because of the particular nature of the
response variable, we analysed the response using a ‘log it’ model and calculated the odd-
ratio, which represents the probability of choosing a particular decision over another. The
next paragraph will briefly describe the results for overall data and state-wise and cluster-
wise data. Annex 5 will briefly describe the explanatory variables.
Running the regression on combined data (both states and both clusters), we found that all
the variables except use of electricity (other than for lighting and mobile charging) and
training have significant positive impacts on livelihoods (revenue of enterprises). Moreover,
we found that there is significant cluster-wise variation and state-wise variation. Among all
these factors, availability in peak hours is the only factor which has a significant impact in
both clusters taken separately and in Andhra Pradesh. Institution and market access have
significant impacts on the weaving cluster in Andhra Pradesh. On the other hand,
58
63
41
84 89
63
0
16 7
AP1 NE AP1 NNE MP NE MP NNE
Usage of electricity by enterprises (Per cent of enterprises)
Post daylight operations Use electricity beyond lighting and mobile phone charging

Analysis of the electrification programme in India using the ‘energy plus’ framework and the key lessons
infrastructure has a significant impact on the weaving cluster when Andhra Pradesh and
Madhya Pradesh are combined. Relationship (branding) has a significant impact in Andhra
Pradesh and on the weaving cluster of Andhra Pradesh. In Madhya Pradesh, we did not
find any factor among the above which had a significant impact.
Table 7. Results from regression analysis.
All cl 1 cl 2 st 1 st 2 st 1 cl 1
Electricity 632 -249.2 0 -992.3 35.51 -1733.7
(768.80) (564.30) (.) (1256.60) (565.50) (1166.80)
Availability 2411.4*** 1809.6*** 6735.8** 3027.7** 1159.9 2456.7*
(670.80) (512.70) (2360.30) (947.10) (631.50) (929.20)
Reliability 1859.2*** 472.2 597.6 1123.8 723.9 174.6
(494.30) (476.90) (1365.40) (695.70) (519.30) (926.30)
Finance 2007.4*** 229.3 -1330.6 1256.5 819.6 1514.5
(555.60) (475.20) (2366.10) (860.80) (1275.30) (946.70)
Training 194.5 213.2 0 1146.4 840.6 1057.2
(684.50) (530.00) (.) (864.20) (1956.00) (831.50)
Institution 1967.6*** 792.6 734.8 1518.9 -220.6 2324.7*
(552.10) (489.20) (1607.30) (824.80) (1439.30) (1020.90)
Infrastructure 1704.8** 1124.2* -478.3 1079.4 866.2 1794.6
(602.50) (542.60) (1267.70) (722.70) (702.30) (962.00)
Power backup 2112.7** -682.9 0 654.4 -1111.1 -1494.6
(655.00) (598.60) (.) (910.80) (1876.10) (1167.80)
Experience 2275.8*** -186.2 386.8 1171 743.1 904.9
(512.10) (617.40) (1409.40) (836.60) (1368.60) (1243.10)
Market access 1220.6* 798.9 470.1 479.7 -1392.4 1771.3*
(542.50) (513.60) (1966.00) (748.50) (1199.00) (800.30)
Relationship 2056.3** 504.7 1260.7 2293.4** -1514.8 3349.6**
(632.80) (612.70) (1683.60) (871.40) (903.20) (1083.30)
Family support
1743.1* 175.2 -1042 2.09 -689.7 802.8
(706.70) (731.10) (2352.60) (1053.20) (1567.90) (1315.60)
Governance 2610.8*** -324.9 296.6 693.6 1261.5 -104.5
(650.70) (595.50) (2335.90) (937.60) (1121.20) (982.60)
Supply chain 1879.0** 826.7 2927.1 1376.4 1153.9 1933.7
59

Analysis of the electrification programme in India using the ‘energy plus’ framework and the key lessons
All cl 1 cl 2 st 1 st 2 st 1 cl 1
(597.00) (474.00) (3366.20) (915.90) (575.90) (1005.10)
d_cl -6160.8*** 1894.1 0 -8419.9*** 2602.9** -1149.6
(705.70) (985.00) (.) (893.40) (920.30) (1820.20)
d_st 3606.9*** -72.95 8862.4* 7279.5*** 0 0
(611.80) (617.10) (4335.90) (1816.90) (.) (.)
N 178 118 60 120 58 60
df_m 16 16 12 16 15 15
r2 0.906 0.84 0.966 0.945 0.888 0.864
Note: standard errors in parentheses. * p <0.05 that is significant at 5% level of significance ** p <0.01 that is significant at 1% level of significance *** p <0.001 that is significant at 0.1% level of significance
60

Analysis of the electrification programme in India using the ‘energy plus’ framework and the key lessons
6. Discussion
This chapter discusses the underlying factors that are attributable to the findings presented
in Chapter 5 of this report. The chapter begins with a brief insight into institutional 35
arrangements in Andhra Pradesh and Madhya Pradesh. Further, it also discusses the
reported value addition (as perceived by survey respondents) of the institutions in the
clusters that were selected for this study.
6.1 Institution as an enabler Among community-based organizations, SERP under the NRLM has been the pioneer in
extending human development and livelihood services, and it has also been the resource cell
in the development of NRLM.36 Thus, SERP is the guiding framework for all State Rural
Livelihood Missions (SRLM) under the umbrella of the NRLM. The formation of SERP in
2001 was an initiative taken up by the Andhra Pradesh state government as a sensitive
support structure to facilitate poverty alleviation, its emphasis being on social mobilization
and improving the livelihoods of the rural poor in erstwhile Andhra Pradesh, efforts that
were sustained by successive state governments. The SRLM of Madhya Pradesh, known as
the Madhya Pradesh Rajya Ajeevika Forum (MPRAF), was established in 2012. Thus, SERP
had been actively involved in the rural poverty elevation mission eleven years ahead of
MPRAF, and, with the active support of successive Andhra Pradesh state governments, it
has graduated from its main mandate being to ensure financial inclusion to offering
livelihood services, a safety net (pensions, insurance), and human development services.
Further, all the activities of SERP have been delivered to poor rural households through the
network of Self-Help Groups (SHGs) and the federation of such groups. These SHGs are
initiated, nurtured and developed by the SERP and form the basic unit of the rural
development model in Andhra Pradesh, which was adopted by the NRLM and the
respective SRLM. Therefore, the MPRAF is still in the initial phase of operations and has yet
to reach the scale of SERP in Andhra Pradesh in terms of SHG members and the extent and
35 ‘Institution’ in this study refers to Self Help Groups, Chit Fund Groups, Cooperatives, Non-Governmental Organizations, Community Based Organizations, and government or private facilities that amalgamate the market value chain and productive mechanisms to catalyse income generation by households and rural home-based enterprises.
36 IKP Annual Report 2013–14: http://www.serp.ap.gov.in/SHGOLD/files/documents/IKP_Progress_Report_Annual1314.pdf; last accessed on 15 June 2015.
61
Analysis of the electrification programme in India using the ‘energy plus’ framework and the key lessons
variety of services offered. Box 2 gives a snapshot of SHGs and the financial services that are
delivered to rural households.
The National Rural Livelihoods Mission (NRLM) of the Government of India recognizes
institutions like Self-Help Groups (SHGs), producers’ cooperatives and companies as entities
that facilitate the enabling environment at the last mile for livelihood augmentation.
Incidentally, in this study, which is based on inputs from survey respondents, we found the
presence of effective institutions as key non-energy input fixing the villages selected for this
study in Andhra Pradesh as performing better relative to villages in Madhya Pradesh.
The study has identified five non-energy inputs that have figured in the majority of the AP1
NE entrepreneurs’ responses as the three non-energy inputs significant to the development
of their enterprise: institutions, start-up finance, market access, supply of raw materials, and
training. These inputs have been exploited by the AP1 NE enterprises through the SHG
network of SERP. Moreover, the term ‘institutions’ refers to SHGs, federations of SHGs, and
private and non-profit organizations involved in the project through SERP. As mentioned
earlier, SERP’s model of rural development is based on the SHG model, the very first step
involved being to develop the SHGs.
Box 2
Strong presence of Self-Help Groups in Andhra Pradesh relative to Madhya Pradesh
The state of Andhra Pradesh (AP) has the largest network of self-help groups (SHGs) with 1.2
million SHGs and 12 million members (following the bifurcation of AP into two states, AP and
Telangana which has 4.2 million SHG members). Unlike AP, Madhya Pradesh (MP) has only 0.29
million SHGs. Similarly, there is a clear disparity in the SHG bank linkages in these states, with AP
bank loan disbursements to SHGs of 74.53 billion and MP bank loan disbursements to SHGs of
1.37 billion. Furthermore, the skewed nature in inputs received via institutions in the states is
highlighted by the SHG-based bank savings, with AP SHGs savings of 22.14 billion and MP SHGs
savings of 0.78 billion (NABARD, 2013).
The disparity in institutional strength and the density of the inputs through the medium of SHGs
is further accentuated if the rural population of the states is taken into account (both states having
approximately same rural populations) while reading into the number of SHGs, savings and loans
disbursed, emphasizing the fact that MP is in a very nascent stage. This is indicative of the
effectiveness of the SHG networks in AP.
62

Analysis of the electrification programme in India using the ‘energy plus’ framework and the key lessons
The strong SHG network in the AP1 NE cluster created access to timely and affordable
finance and human development services for the weaver households. The weavers have
leveraged the three forms of loan available to SHG members, such as bank linkages, the
Community Investment Fund, and 0 per cent interest loans, all of which created savings for
the weaver households. The partnership between SERP and the non-profit Chetana Society
helped identify gaps such as market access, access to quality raw materials, and designs and
skill in the AP1 NE cluster. Given the presence of the SHG network, the non-profit
organization was able to mobilize, building a mutually aided cooperative and floating a
handloom weaver-owned enterprise, ‘Chenetha Colour Weaves’. Raw materials and market
access were provided by Chenetha Colour Weaves, and training was provided by the
Chetana Society. The skills building training introduced the community to technology that
makes productive use of electricity in the form of a warping machine for activities beyond
lighting, such as the use of motor-driven machines to improve productivity to save time,
and access to affordable finance, coupled with access to actionable information through
skills building led these enterprises towards the productive use of electricity. The machine
saves 2–3 man-days of work for the enterprise, which is worth 274–411 (taking the
MGNREGA rate as 13737), as well as improving the quality of the product. Further, the
public-private partnership with the involvement of institutions such as SERP, the Chetana
Society and the SHG federation helped in creating a private enterprise owned and run by
handloom weavers. This institutionally facilitated private enterprise created access to the
market and access to good-quality raw materials. Training, access to good-quality raw
materials, market access and the branding of weaver products have resulted in a 20 per cent
increase in the market price for the dress material in comparison to the local market at
Pochampally.
In the fishermen cluster study area in Andhra Pradesh, the enterprises have received the
services offered to all SHGs by SERP, as well as additional inputs from the Godavari Maha
Samakhya (a confederation of fisherwomen SHGs) such as finance, transport vehicles to
market, smoking bins, tarpaulin sheets, collective salt procurement, renewable energy
technologies and inputs on hygiene (Godavari Maha Samakhya, popularly known as GMS,
is a premier confederation working for poverty eradication among coastal fishermen
families in the district of East Godavari, Andhra Pradesh. This confederation is registered
37 Mahatma Gandhi National Rural Employment Guarantee Act <http://nrega.nic.in/nerega_statewise.pdf>
63
Analysis of the electrification programme in India using the ‘energy plus’ framework and the key lessons
under the APMACS Act of 1995 and affiliated to Zilla Samakhya, which operates under
SERP.) Again the role of institutions in channelling non-energy inputs can be seen in this
cluster.
In the study areas in Madhya Pradesh, the survey respondents did not report any institution
working intensively on a holistic pattern, as was the case with the study areas in Andhra
Pradesh. In the Pranpur cluster of Madhya Pradesh, there is an electricity supply, as well as
market linkage inputs from private sector-led institutions such as Fab India and Sutra.38
However, these institutions have focused only on providing sustained sources of business at
the last mile, without any long-term value inputs throughout the product’s life-cycle.
Further, the weaver co-operative society in the study area has lost membership after
handholding support was withdrawn. The non-energy inputs channelled through
institutions at various levels are absent in this cluster. Furthermore, in Madhya Pradesh the
presence of institutions in the form of the private sector does not extend to providing access
to affordable and timely finance, good-quality raw material supply or capacity-building, all
hallmarks of the Andhra Pradesh livelihood cluster, thus hindering the growth of the
livelihood sector in a sustained manner.
On the other hand, the study areas in Andhra Pradesh have the required energy as well as
non-energy inputs, as community-based organizations, government institutions and the
private sector are active and are driving sustained access to different non-energy inputs.
Hence, access to effective and sustained institution-led inputs distinguishes the households
and enterprises the study areas of Andhra Pradesh from those in Madhya Pradesh.
Furthermore, the quality of inputs in terms of the consistency in exploiting the non-energy
inputs is easy, providing timely access and customization in non-energy inputs to meet the basic
and livelihood needs of poor rural households. The existence of an established network of SHGs
and their respective federations has ensured consistency in the process and in providing
continuous access to non-energy inputs; furthermore, SERP has designed livelihood services to
meet the needs of poor rural households. In the context of the two clusters in Andhra Pradesh,
livelihood services were defined as meeting cluster needs, such as support to fisheries and
handlooms in East Godavari and Nalgonda Districts respectively. Thus, the network of
community-based organizations ensured good-quality non-energy inputs for poor rural
households in Andhra Pradesh.
38 Fab India and Sutra are among big garment retailing brands in India.
64
Analysis of the electrification programme in India using the ‘energy plus’ framework and the key lessons
6.2 Income, expenditure, and ownership of appliances by electrified households
6.2.1 Monthly average income and MPCE In this study, we found that the households in villages with access to relatively effective
non-energy inputs have higher average monthly incomes. Household respondents in AP NE
have significantly higher incomes than in AP NNE, MP NE, or MP NNE. Electrification in
AP NE has created positive externalities for respondent households in terms of job
opportunities in industry and fishing boards and at the larger cities in proximity.
Given that all the households fall under the category of having daily wage labourers as
members, the sizeable differences in their incomes and consumption levels emphasizes the
point that the mere presence or absence of a non-energy input is no indication of better
standard of living for a rural household: it is the quality39 of the input that carries weight, in
addition to the strength of the institutions. This difference is confirmed by the findings for
income and expenditure in Andhra Pradesh and Madhya Pradesh. The numbers given in the
background section highlight the differences in institutions in Andhra Pradesh and Madhya
Pradesh and the quantum of financial inclusion input received.
6.2.2 Ownership of electrical/electronic appliances by households In section 5.2.2.3, the hexagonal plot shows that, despite all the households being electrified,
the ownership of appliances is skewed towards households receiving non-energy inputs, an
indication of the consumption of a household as an offshoot of non-energy inputs coupled
with electrification. Furthermore, mere accessibility does not ensure or improve a
household’s ability to purchase these appliances: it is the access to quality non-energy inputs
that increases this ability. An affordable and easily accessible stream of finance, coupled
with a safety net and livelihood services that enhance household incomes may have
contributed to the ownership of larger number of electrical appliances in households
receiving non-energy inputs in Andhra Pradesh.
39 The quality of non-energy inputs is based on: (a) consistency in the process to exploit inputs by rural poor households, (b) easy and continuous or timely access of inputs to poor rural households, and (c) inputs customized to meet the basic and livelihood needs of poor rural households.
65
Analysis of the electrification programme in India using the ‘energy plus’ framework and the key lessons
At the same time, the study clearly establishes that not only non-energy inputs but also the
reliability of electricity supply is essential for households before they opt to purchase
electrical appliances. The study re-emphasizes the concept of the ‘energy plus approach’,
that is, that a reliable energy supply coupled with a cocktail of good-quality non-energy
inputs is necessary for households to show growth in terms of income, consumption and
asset accumulation.
6.3 Electricity as driver for the augmentation of incomes and/or opportunities for income generation
The study clearly indicates that electricity is regarded as essential for incremental income
generation, and also that households receiving additional non-energy inputs have shown
increases in income. Furthermore, a household's ability to look towards entrepreneurial
activities is higher when it receives non-energy inputs channelled through institutions, as is
the case with households in AP NE, while this potential ability to take on risks is absent
from households in AP NNE. This greater willingness to start enterprises based on
electricity as a primary input is also reflected in their willingness to purchase electrical
appliances. Therefore, non-energy inputs can give the households ability to see electrical
appliances as assets for income generation, as described below (Box 3). Households in
Madhya Pradesh that do not receive non-energy inputs have the least possession of electrical
appliances, their willingness to purchase which is more of an aspiration and a recreational
thought than a step towards thinking of electricity as an income-generating activity.
Similarly, AP NNE households that receive relatively lower non-energy could not relate
electricity to increases in incomes.
66
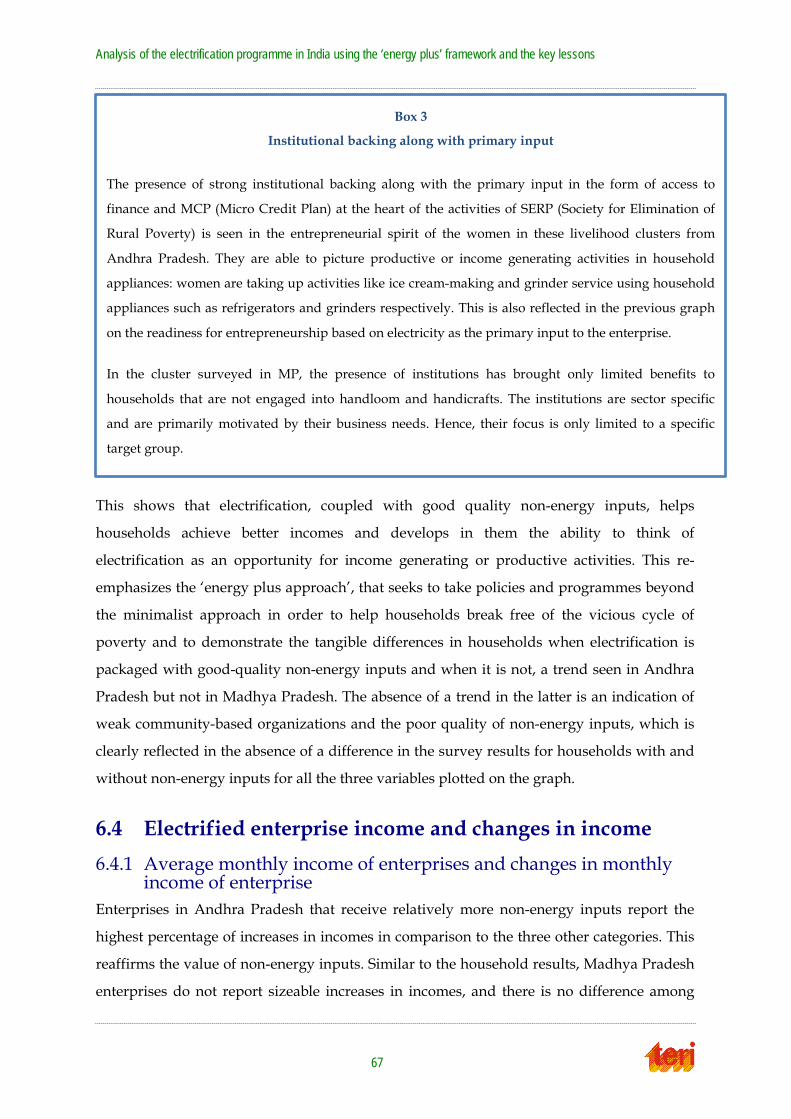
Analysis of the electrification programme in India using the ‘energy plus’ framework and the key lessons
This shows that electrification, coupled with good quality non-energy inputs, helps
households achieve better incomes and develops in them the ability to think of
electrification as an opportunity for income generating or productive activities. This re-
emphasizes the ‘energy plus approach’, that seeks to take policies and programmes beyond
the minimalist approach in order to help households break free of the vicious cycle of
poverty and to demonstrate the tangible differences in households when electrification is
packaged with good-quality non-energy inputs and when it is not, a trend seen in Andhra
Pradesh but not in Madhya Pradesh. The absence of a trend in the latter is an indication of
weak community-based organizations and the poor quality of non-energy inputs, which is
clearly reflected in the absence of a difference in the survey results for households with and
without non-energy inputs for all the three variables plotted on the graph.
6.4 Electrified enterprise income and changes in income 6.4.1 Average monthly income of enterprises and changes in monthly
income of enterprise Enterprises in Andhra Pradesh that receive relatively more non-energy inputs report the
highest percentage of increases in incomes in comparison to the three other categories. This
reaffirms the value of non-energy inputs. Similar to the household results, Madhya Pradesh
enterprises do not report sizeable increases in incomes, and there is no difference among
Box 3
Institutional backing along with primary input
The presence of strong institutional backing along with the primary input in the form of access to
finance and MCP (Micro Credit Plan) at the heart of the activities of SERP (Society for Elimination of
Rural Poverty) is seen in the entrepreneurial spirit of the women in these livelihood clusters from
Andhra Pradesh. They are able to picture productive or income generating activities in household
appliances: women are taking up activities like ice cream-making and grinder service using household
appliances such as refrigerators and grinders respectively. This is also reflected in the previous graph
on the readiness for entrepreneurship based on electricity as the primary input to the enterprise.
In the cluster surveyed in MP, the presence of institutions has brought only limited benefits to
households that are not engaged into handloom and handicrafts. The institutions are sector specific
and are primarily motivated by their business needs. Hence, their focus is only limited to a specific
target group.
67

Analysis of the electrification programme in India using the ‘energy plus’ framework and the key lessons
enterprises receiving or not receiving non-energy inputs, a reflection of the lack of
institutions that can channel such inputs.
6.4.2 Usage of electricity beyond basic use (lighting and mobile phone charging)
As seen from the income graphs (Figures 19 and 20), these enterprises can be brought into
two income brackets in each state. Taking income as an indication of the stage, scale and
profitability of the enterprise, this stage–to-input mapping can be derived from the
pentagons shown in Figure 21. The inputs identified by the enterprises from AP1 NNE are
the inputs valued in the nascent stage of an enterprise without external support or non-
energy inputs. The inputs reported by AP1 NE weavers are the inputs needed by an
enterprise in order to increase its income and profitability through better quality product,
market tie-up and access to affordable finance that reduces the cost of capital and improves
efficiency. At this stage these enterprises are able to utilize electricity as a means to achieve
additional income. Motor-driven machines have been used to improve efficiency in an
activity so as to save time, improve product quality and save time for more output. The time
saved is around 2–3 days per weaver from AP1 NE. Using the warping machine can
translate into an indirect benefit in terms of potential earnings of 274–411 (through
MNREGA40 payment). Furthermore, cell phones are being used as a medium for storing
new designs in the form of photographs and as a means of information exchange. These
clusters in Andhra Pradesh have had access to electricity for the last thirty to forty years,
which is sizeable in comparison to the start of activities by SERP in 2000. The evolution of
enterprises towards the productive usage of electricity happened because a package of non-
energy inputs was received through the SHG network. In the case of MP enterprises,
electrification has been provided in recent years, but a consistent flow of non-energy inputs
through community-based organizations (such as SHGs) is still lacking.
A higher percentage of AP1 NE enterprises in comparison to AP1 NNE ones reported
extended working hours (beyond daylight hours) and use of electricity for activities beyond
lighting, such as use of motor-driven machines to improve quality, save time and efficiency.
The fact that these enterprises are using electricity beyond lighting is also supported by the
reported higher impact of unscheduled power cuts on productive activities. The enterprises
40 Mahatma Gandhi National Rural Employment Guarantee Act http://nrega.nic.in/nerega_statewise.pdf; last accessed on 15 June 2015.
68
Analysis of the electrification programme in India using the ‘energy plus’ framework and the key lessons
Box 4
Access to energy and income augmentation
The anecdotal evidence from Andhra Pradesh suggests that, despite there having been access to
electricity in the survey villages for thirty to forty, this had not been translated into income
augmentation or the development of enterprises from the economically weaker sections. The advent of
SERP in 2003 put in place a network of community-based organizations that channelled other non-
energy inputs. For the entrepreneur, this reduced the cost of capital, injected livelihood-specific
trainings, implemented the concept of micro-credit plans for SHG, created access to safety nets to
households through insurance and pension access, covered health expenditure and provided
educational scholarships, as well as built synergetic partnerships that brought market access, market
acceptability of microenterprise products, improved quality of produce, and reduced seasonality of
demand. This package of non-energy inputs with the community-based organizations as the backbone
accelerated the evolution of the enterprises in Andhra Pradesh and triggered the idea of the
productive use of electricity to enhance productivity and income.
This role of community-based organizations in triggering the productive use of energy has also been
reported in the Kudumbashree project in Kerala that leveraged on the Community Development
Societies, Area Development Societies and Neighbourhood Groups of women to trigger the
enterprises that make productive use of electricity such as processing units, production units,
electronics, and IT units.
in Madhya Pradesh, both MP NE and MP NNE, do not report a high impact of unscheduled
power cuts on their enterprise activities but do report using electricity beyond lighting. This
is due to their use of mobile phones for information access, which is the only activity that is
supported by electricity other than lighting, as there is no productive use of electricity for
income augmentation. This shows the superior stage of the AP1 NE cluster that is utilizing
electricity beyond lighting and mobile phone usage and is showing higher incomes (Box 4).
While these enterprises have had access to electricity for thirty to forty years in the Andhra
Pradesh weaving cluster, it was the injection of non-energy inputs in the form of
institutional support, access to finance, market tie-up, capacity-building and training from
2003 that triggered the growth in their incomes, scale and capacity. Therefore, supplying
electricity did not trigger this change: rather, it was the non-energy input that allowed
enterprises to realize the potential of electricity to increase productivity and income.
69

Analysis of the electrification programme in India using the ‘energy plus’ framework and the key lessons
7. Conclusions and Recommendations While over 95 per cent of Indian villages have already been electrified, this study has
attempted to understand the present state of electrification in terms of availability,
accessibility and reliability. Further, results from the primary survey reveal that income
increases with electricity access, which corroborates the existing literature. Incidentally,
income increases even for un-electrified households and enterprises. Hence, this study has
also looked into inputs other than electricity access that have led to an increase in livelihood
opportunities.
Access to the grid augments the usage of electricity for basic lighting and charging mobile
phones, but inputs other than electricity access are also required to encourage productive
Key Findings
• The study found that the average income of an electrified household is higher than the average income of an un-electrified household for both grid and off-grid areas. Further, electrification results in increases in income (also in real terms) for both electrified and un-electrified households for both grid and off-grid areas.
• Electrified households in grid-connected areas reap more benefits over time (change of income is higher) compared to un-electrified households. Thus, grid supply probably generates better livelihoods for electrified households compared to households connected to off-grid systems.
• Income change is higher for electrified households with business as their primary source of earnings compared to electrified households with other sources of earnings. Thus, usage of electricity in productive/income-generating activity gives households better income-generating opportunities.
• Institutions are the fundamental non-energy inputs that can ensure sustained non-energy inputs to households and enterprises.
• Institutionally channelled non-energy inputs to households or enterprises can trigger productive uses of electricity and increase incomes.
• Households with access to electricity and receiving non-energy inputs have higher incomes and consumption than households with relatively lower non-energy inputs.
• Electrical appliances are seen as potential livelihood-generating assets by households receiving relatively higher non-energy inputs.
• Access to channelled sustained non-energy inputs develops the tendency to take risks in households in the form of entrepreneurship.
• Institutions, affordable and timely finance, continuous impetus on training, market linkage and supply of quality raw materials have been regarded as the significant non-energy inputs essential by enterprises.
70

Analysis of the electrification programme in India using the ‘energy plus’ framework and the key lessons
uses of electricity for income generation. Based on the cases of livelihood clusters from the
states of Andhra Pradesh and Madhya Pradesh, the study finds that sustainable institutions
foster the channelling of resources, including electricity for productive use.
The study reveals that the application of energy plus approach is essential in providing a
catalyst for income generation and that it is not the mere presence of non-energy inputs that
determines sustainable access to electricity and its productive use. Furthermore, the study
reveals that it is the presence of strong community-based institutions that facilitate access to
effective non-energy inputs and that the functionally effective institutions have a strong role
to play in achieving the goal of sustainable electricity access for all. Thus, the study
concludes that institutions aid in incorporating both energy and non-energy inputs (such as
access to social infrastructure, skills training, capacity-building and market value chain
creation) to catalyse productive activities leading to sustainable electricity access for all.
While electrification in India has been a priority for decades, it is only in the last decade that
there has been the necessary momentum for the creation of the necessary supply
infrastructure at the village level, primarily through RGGVY. Despite limited access in rural
areas, access to electricity infrastructure through various sources has triggered the use of
electricity for basic and productive purposes. While both energy and non-energy inputs are
essential, non-energy inputs are demand-based. Further, effective last-mile institutions are
essential to channel them and to scale up their impacts.
The following are the key recommendations based on the study:
Recommendation 1. Availability of reliable and quality access to electricity during peak
hours is essential.
While it is acknowledged that round the clock availability of electricity is essential, our
findings from the study areas in the livelihood clusters of Andhra Pradesh and Madhya
Pradesh emphasize that the availability of electricity during peak hours has a much wider
impact. However, it is important that the community has access to the infrastructure and
resources that enable the productive use of electricity.
Recommendation 2. Leverage on network of institutions for optimal delivery and utilization
of non-energy inputs.
Based on the review of secondary literature, stakeholder consultation and primary surveys
in the study areas, it has become clear that where both electricity access and institutions to
71

Analysis of the electrification programme in India using the ‘energy plus’ framework and the key lessons
channel non-energy inputs co-exist, the impacts are relatively greater. In India, energy
committees exist involving community representatives constituted at the last mile.
Incidentally, there are provisions for engaging these institutions in the planning and
implementation of development programmes. Relevant training and capacity-building will
make a majority of these institutions functional and translate them into solutions that
accelerate the productive uses of resources.
Recommendation 3. Development goals and electricity access should be packaged to
complement each other.
Access to electricity requires necessary transmission and distribution infrastructure.
However, the aspirations of community members are not limited to mere access to electricity
infrastructure. This implies that the use of electricity and electrical or electronic appliances
are mere indicators and not the real ends in themselves. Hence, government and civil-
society development programmes must be designed to empower community members to
meet their aspirations through electricity access facilitating the process. This design should
incorporate rural electrification programmes with a simultaneous impact on the non-energy
inputs to enable households to graduate from basic lighting and mobile phone usage
towards income augmentation through the productive usage of electricity. The development
of institutions is the primary input that creates access to effective non-energy inputs.
Recommendation 4. The study findings from the AP1 NE handloom cluster show that non-
energy inputs, such as access to finance, training and capacity-building, access to good-
quality raw materials, market access and institutions were the non-energy inputs regarded
as a priority by the household handloom enterprises. Furthermore, only a few enterprises
have mentioned enabling government policy as one of their top three non-energy inputs. But
this list of five priority non-energy inputs, provided by these entrepreneurs, was possible
only by enabling government policy and by implementation in Andhra Pradesh. As the
study findings relate to handloom-based livelihoods, future studies should come up with a
package of non-energy inputs that can be generalized for all forms of rural livelihoods.
Recommendation 5. From the surveys of the two states of Andhra Pradesh and Madhya
Pradesh, it is evident that government action in the form of enabling policy plays a
significant role in creating community-based organizations. The findings from the study in
Andhra Pradesh shows that enabling government policy in the creation of community-based
organizations can be considered to be the initial input, institutions or community-based
organizations such as SHG network and the federation of SHGs the secondary input, and
72
Analysis of the electrification programme in India using the ‘energy plus’ framework and the key lessons
access to finance the tertiary non-energy input. The order of the non-energy inputs is based
on the order of non-energy input injection in Andhra Pradesh; this involved the creation of
SERP/Indira Kranti Patham41 and the establishment of the SHG network, access to finance
(SHG–bank linkage, community investment fund) and access to finance, followed by
livelihood-specific inputs such as training, market access and access to good-quality raw
materials. Therefore, this study shows that the quality of non-energy inputs is important,
and it also lists a package of non-energy inputs specific to handloom livelihoods, as well as
emphasizing the significance of non-energy input injection. Future studies should invest in
establishing a generalized order of non-energy input injection that should cover all major
forms of rural livelihood. Further, future research should also investigate the contribution of
safety net-related inputs such as pensions, insurance, educational scholarships and inputs in
health and sanitation in ushering enterprises towards productive uses of electricity.
41 The activities of DWCRA (Development of Women and Children in Rural Areas) and Velugu were integrated under a programme called Indira Kranti Patham (IKP). The basic objective of this integration is to implement various programmes for strengthening of self-help groups with similar implementation strategy. The new scheme Indira Kranti Patham had been designed by clubbing Women Empowerment with Poverty Alleviation. The IKP is a state-wide poverty reduction project to enable the rural poor to improve their livelihoods and quality of life through their own organizations. It aims to cover all the rural poor households in the state with a special focus on the 30 lakh poorest of the poor households. It is implemented by Society for Elimination of Rural Poverty (SERP), Department of Rural Development, Govt of AP. SERP is an autonomous society registered under the Societies Act, and implements the project through District Rural Development Agencies (DRDAs) at the District level. The Chief Minister of Andhra Pradesh is the Chairperson of the Society. The IKP builds on more than a decade long, state wide rural women’s self-help movement. The focus is on deepening the process, providing an institutional structure and developing a framework for sustaining it for comprehensive poverty eradication. It is the single largest poverty reduction project in South Asia.
73

Analysis of the electrification programme in India using the ‘energy plus’ framework and the key lessons
Policy Recommendations
• Challenges in poverty eradication and in livelihood generation can be eliminated by
packaging the rural electrification programme with sustained impetus of non-energy
inputs channelled through local institutions.
• Policies that focus on rural electrification and productive uses of electricity should
focus on developing last mile community-based organizations such as SHGs and
energy committees, which are fundamental to linking the village economy to rural
electrification.
• Access to affordable start-up finance, continuous skills building, market linkages,
good-quality raw materials channelled through community-based organizations in
partnership with public and private players will trigger entrepreneurship and
provide a platform for graduating towards productive uses of electricity.
• States with recent rural electrification programme implementation or in the process
of saturation of rural electrification should emphasize entrepreneurship and
productive uses of electricity through institutionally channelled non-energy inputs.
• States with good coverage of rural electrification should initiate policies to develop
institutions which can channelize non-energy inputs and drive village economy
through productive use of electricity.
74

Analysis of the electrification programme in India using the ‘energy plus’ framework and the key lessons
References AGECC. (2010). Energy for a sustainable future: summary report and recommendations. The Secretary-General’s Advisory Group on Energy and Climate Change‚ New York.
Balachandra, P. (2010). The Status of Rural Energy Access in India: A Synthesis. Discussion Paper 2010-09. Energy Technology Innovation Policy Research Group. Belfer Center for Science and International Affairs, Harvard Kennedy School.
Balachandra, P. (2011). Dynamics of rural energy access in India: an assessment. Energy, 36: 5556– 5567.
Balachandra, P. (2012). Universal and sustainable access to modern energy services in rural India: An overview of policy-programmatic interventions and implications for sustainable development. Journal of the Indian Institute of Science, 92: 1.
Balachandra, P. (2013). Rural off-grid electrification in India: Promising policies but ineffective implementation. Available at <http://cdf.ifmr.ac.in/wp-content/uploads/2013/10/Rural-Off-Grid-Electrification-in-India-Promising-Policies-but-Ineffective-Implementation.pdf.>; last accessed on December 16, 2014.
Bamberger, M., Uawithya, P., Shekhar, S. & Gupta, B. (2013). Evaluating the economic and equity impacts of a decentralized rural electrification program in India. South Asian Journal of Evaluation in Practice, 1(1): 25–43.
Bhattacharyya, S.C. (2006). Energy access problem of the poor in India: Is rural electrification a remedy? Energy Policy, 34(18).
Cabraal, R.A., Barnes, D.F. & Agarwal, S.G. (2005). Productive uses of energy for rural development. Annual Review of Environment and Resources, 30: 117–144.
CEA. (2013). Growth of Electricity Sector in India from 1947 to 2013. Central Electricity Authority, Ministry of Power. Government of India. <http://www.cea.nic.in/reports/planning/dmlf/growth.pdf>; last accessed on December 16, 2014
CEA. (2014a). Progress report of village electrification as on 31-08-2014 as per 2011. Available at <http://cea.nic.in/reports/monthly/dpd_div_rep/village_electrification.pdf.>; last accessed on December 16, 2014.
CEA. (2014b). Load generation balance report 2014–15. Ministry of Power. Government of India.
Census of India. (2001). Office of the Registrar General & Census Commissioner, India. New Delhi: Government of India. Available at <http://censusindia.gov.in/>; last accessed on December 20, 2014.
Census of India. (2011). Office of the Registrar General & Census Commissioner, India. New Delhi: Government of India. Available at <http://censusindia.gov.in/>; last accessed on December 20, 2014
75

Analysis of the electrification programme in India using the ‘energy plus’ framework and the key lessons
Chakrabarti, S., Chakrabarti, S., Majumder, A. & Mukherjee, R. (2014). A study on the impact of the use of electricity on socio-economic activities and environmental awareness of the inhabitants of Sagar Dweep, an island in West Bengal, India. Available at <http://www.isical.ac.in/~eru/erudp/2003-10.pdf.>; last accessed on December 16, 2014.
Chaurey A. & Mohanty P., (2007). Distributed generation and rural electrification in the Sundarbans. In Renewable Energy in the Sundarbans. Gon Choudhuri S.P., editor. New Delhi: The Energy and Resources Institute.
Chaurey, A., Krithika, P.R., Palit, D., Rakesh, S. & Sovacool, B.K. (2012). New partnerships and business models for facilitating energy access. Energy Policy, 47, Supplement 1.
Chaurey, A., Ranganathan, M. & Mohanty, P. (2004). Electricity access for geographically disadvantaged rural communities: Technology and policy insights. Energy Policy, 32(15): 1693–1705.
Cook, P. (2011). Infrastructure, rural electrification and development. Energy for Sustainable Development, 15(3): 304–313.
Cust, J., Singh, A. & Neuhoff, K. (2007). Rural electrification in India: Economic and institutional aspects of renewables. EPRG 0730 and CWPE 0763. Available at <http://www.eprg.group.cam.ac.uk/wp-content/up-loads/2008/11/eprg0730.pdf>
Ernst & Young. (2007). Models of Rural Electrification: Report to Forum of Indian Regulators. Available at <http://www.forumofregulators.gov.in/Data/Reports/Final_Foir_Report_5th_March07_Models_of_RE_E&Y%5B1%5D.pdf>; last accessed on December 20, 2014.
GNESD. (2014). Renewable energy-based rural electrification: The Mini-Grid Experience from India. New Delhi: Prepared by the Energy and Resources Institute (TERI) for the Global Network on Energy for Sustainable Development (GNESD).
IDFC. (2011). Biomass-based decentralized distributed generation for universal energy access, IDFC Quarterly No 11. Available at <http://www.idfc.com/pdf/publications/policy_group_quarterly_no_11_march_2011_biomass.pdf.>; last accessed on January 13, 2015.
IEA (International Energy Agency). (2013). World Energy Outlook, Paris. Available at <http://www.worldenergyoutlook.org/>; last accessed on December 20, 2014.
IEA (International Energy Agency). (2014). World Energy Outlook, Paris. Available at <http://www.worldenergyoutlook.org/>; last accessed on December 20, 2014.
IFAD. (2015). Investing in rural people in India. International Fund for Agriculture Development. Available at <http://www.ifad.org/operations/projects/regions/pi/factsheets/in.pdf.>; last accessed on June 15, 2015.
Imai, K. & Palit, D. (2014). Impacts of electrification with renewable energies on local economies: The case of India's rural areas. The International Journal of Environmental Sustainability, 9(1): 1–18.
76
Analysis of the electrification programme in India using the ‘energy plus’ framework and the key lessons
Jaisinghani N. (2011). Islands of light: the experience of micro-grid power solutions. Solar Quarterly, 3(3):10–8.
Kemmler, A. (2007). Factors influencing household access to electricity in India. Energy for Sustainable Development, XI(4): 13–20.
Khandker, S.R., Barnes, D.F. & Samad, H.A. (2010). Energy poverty in rural and urban India: Are the energy poor also income poor? Policy Research Working Paper Series 5463. The World Bank.
Khandker, S.R., Samad, H.A., Ali, R. & Barnes, D.F. (2012).Who benefits most from rural electrification? Evidence in India. Annual Meeting, August 12–14, 2012, Seattle, Washington 125090, Agricultural and Applied Economics Association.
Krishnaswamy, S. (2010). Shifting of goal posts: Rural electrification in India: A progress report. Vasudha Foundation, New Delhi.
Kumar, A., Mohanty, P., Palit, D. & Chaurey, A. (2009). Approach for standardization of off-grid electrification projects. Renewable Energy Rev, 13: 1946–56.
Maithani, P. C. & Gupta, D. (2015). Achieving universal energy access in India: Challenges and the way forward. Sage Publication India Pvt Ltd., New Delhi.
Ministry of New and Renewable Energy. (2012). Empowering rural India the RE way: inspiring success stories. Available at <http://mnre.gov.in/file-manager/UserFiles/compendium.pdf>; last accessed on March 20, 2015.
Ministry of New and Renewable Energy. (2014). Jawaharlal Nehru National Solar Mission. Available at <http://www.mnre.gov.in/file-manager/UserFiles/mission_document_JNNSM.pdf.>; last accessed on December 16, 2014.
Ministry of Power. (2013). Demand of Electricity. Lok Sabha Starred Question no. 505 to be answered on 02.05.2013. Available at < http://powermin.gov.in/loksabhatable/pdf/Lok_02052013_Eng.pdf.>; last accessed on December 16, 2014.
Modi, V. (2005). Improving Electricity Services in Rural India. Available at <http://www.me. columbia.edu/fac-bios/modi/resources/Rural Energy_India.pdf>; last accessed on December 16, 2014.
Modi, V., Mc Dade, S., Lallement, D. & Saghir, J. (2006). Energy and the Millennium Development Goals. New York: Energy Sector Management Assistance Programme, United Nations Development Programme, UN Millennium Project, and World Bank.
MoP. (2014a). Electricity Act, 2003. Available at <http://powermin.nic.in/acts_notification/electricity_act2003/preliminary.htm.>; last accessed on December 16, 2014 .
MoP. (2014b). National Electricity Policy. Available at <http://www.powermin.nic.in/whats_new/national_electricity_policy.htm.>; last accessed on December 16, 2014.
77

Analysis of the electrification programme in India using the ‘energy plus’ framework and the key lessons
MoP. (2014c). Rural Electrification Policy. Available at <http://powermin.nic.in/whats_new/pdf/RE%20Policy.pdf.>; last accessed on December 16, 2014.
MoSPI, 2013. Energy Statistics. Ministry of Statistics and Programme Implementation, Government of India. Available at <http://mospi.nic.in/mospi_new/upload/Energy_Statistics_2013.pdf>; last accessed on July 1, 2015.
NABARD. (2013). Status of microfinance in India: 2012–13. Available at <https://www.nabard.org/Publication/Status_of_Microfinance_in_India_2012-13.pdf>; last accessed on December 16, 2014.
North Bihar Power Distribution Company Limited. (2014). Available at <http://app.nbpdcl.in/Portal/TariffRegulation/10-Jun-2014-15-18NBPDCL%20Tariff%20Order%20FY%202014-15l.pdf.>; last accessed on December 17, 2014.
NSSO. (2012). Operational Characteristics of Unincorporated Non-agricultural Enterprises (Excluding Construction) in India, Report No. 546 (67/2.34/1), NSS 67th Round, National Sample Survey Office (NSSO), Ministry of Statistics and Programme Implementation, Government of India.
Pachauri, S. & Spreng, D. (2004). Energy use and energy access in relation to poverty. Economic and Political Weekly, XXXIX(3): 17–23.
Pachauri, S. (2007). Global development and energy inequality options. Available at <http:// www.iiasa.ac.at/Admin/INF/OPT/Winter07/opt-07wint.pdfS>; last accessed on November 20, 2014.
Pachauri, S., Mueller, A., Kemmler, A. & Spreng, D. (2004). On measuring energy poverty in Indian Households. World Development, 32(12): 2083–2104.
Palit, D. & Bandyopadhyay, K. R. (2015). Regulating off-grid electricity delivery: Exploring the grey areas. Economic and Political Weekly, L(10): 46–52.
Palit, D. & Chaurey, A. (2011). Off-grid rural electrification experiences from South Asia: Status and best practices. Energy for Sustainable Development, 15: 266–27.
Palit, D., Bhattacharyya, S.C. & Chaurey, A. (2014). Indian Approaches to Energy Access. In Energy Poverty: Global Challenges and Local Solutions (edited by Antoine Halff, Benjamin K Sovacool and Jon Rozhon). UK: Oxford University Press.
Palit, D., Malhotra, R. & Kumar, A. (2011). Sustainable model for financial viability of decentralized biomass gasifier based power projects. Energy Policy, 39: 4893–4901.
Panda, H. (2007). Governance of rural electricity systems in India: An overview of Indian scenario. In Governance of Rural Electricity Systems in India (ed. Haribandhu Panda). New Delhi: Academic Foundation; pp. 23–52.
Planning Commission of India. (2013). Economic Sectors.Twelfth Five Year Plan (2012–2017), Volume II. Government of India. Available at
78

Analysis of the electrification programme in India using the ‘energy plus’ framework and the key lessons
<http://planningcommission.gov.in/plans/planrel/12thplan/pdf/12fyp_vol2.pdf>; last accessed on July 2, 2015.
Rao, N.D. (2013). Does (better) electricity supply increase household enterprise income in India? Energy Policy, 57: 532–541.
Rehman, I.H., Kar, A., Banerjee, M., Kumar, P., Shardul, M., Mohanty, J. & Hossain, I. (2012). Understanding the political economy and key drivers of energy access in addressing national energy access priorities and policies. Energy Policy, 47, Supplement 1.
RGGVY. (2014a). Rajiv Gandhi Grameen Vidyutikaran Yojana. (2014). Report C - Physical & Financial Progress of RGGVY, Projects Under Implementation (Plan-wise). Available at <rggvy.gov.in/rggvy/rggvyportal/plgsheetplan1_excel.jsp.>; last accessed on December 16, 2014.
RGGVY. (2014b). Rajiv Gandhi Grameen Vidyutikaran Yojana. (2014). Available at <http://rggvy.gov.in/rggvy/rggvyportal/rggvy_glance.html.>; last accessed on December 16, 2014.
Rud, J.P. (2012). Electricity provision and industrial development: Evidence from India. Journal of Development Economics, 97(2): 352–367.
Sevea. (2013). Husk Power Systems—power to empower. Available at <http://www.sevea-asso.org/wa_files/Case_20study_20HPS_20Vcomprime_CC_81.pdf.>; last accessed on January 14, 2015.
Shardul, M., Vijayalakshmi, B. & Dholakia, D. (2013). Decentralized energy production: A potential avenue for rural telecentres. Global Humanitarian Technology Conference: South Asia Satellite (GHTC-SAS), 2013 IEEE, August, 181,186.
Srivastava, L., Goswami, A., Diljun, G.M. & Chaudhury, S. (2012). Energy access: Revelations from energy consumption patterns in rural India. Energy Policy, 47,Supplement 1: 11–20.
TERI. (2013a). RGGVY Evaluation - Tripura. The Energy and Resources Institute, New Delhi. Available at <http://rggvy.gov.in/rggvy/rggvyportal/evaluation/TERI_Tripura.pdf.>; last accessed on December 16, 2014.
TERI. (2013b). RGGVY Evaluation–West Bengal. The Energy and Resources Institute, New Delhi. Available at <http://rggvy.gov.in/rggvy/rggvyportal/evaluation/TERI_WB.pdf.>; last accessed on December 16, 2014.
TERI. (2014). TERI Energy & Environment Data Directory and Yearbook (TEDDY) 2013/14. New Delhi: TERI.
UNDP. (2011). Towards an ‘energy plus’ approach for the poor—a review of good practices and lessons learned from Asia and the Pacific. UNDP Environment and Energy. Available at <http://web.undp.org/asia/pdf/EnergyPlus.pdf.>; last accessed on December 16, 2014.
USAID India and MNRE. (2013). Partnership to Advance Clean Energy - Deployment (PACE - D) and Ministry of New and Renewable Energy (MNRE).Financing Renewable Energy in India: A review of
79

Analysis of the electrification programme in India using the ‘energy plus’ framework and the key lessons
current status and recommendations for innovative mechanisms. Available at <http://www.pace-d.com/wp-content/uploads/2013/10/RE-Finance-Report.pdf.>; last accessed on December 5, 2014.
Van de Walle, D., Ravallion, M., Mendiratta, V. & Koolwal, G. (2013). Long-term impacts of household electrification in rural India. Policy Research Working Paper Series 6527.The World Bank. Available at <http://www-wds.worldbank.org/servlet/WDSContentServer/WDSP/IB/2013/06/28/000158349_20130628143734/Rendered/PDF/WPS6527.pdf.>; last accessed on December 20, 2014.
World Bank. (2008). The Welfare Impact of Rural Electrification: A Reassessment of the Costs and Benefits. Independent Evaluation Group, The World Bank, Available at <http://siteresources.worldbank.org/EXTRURELECT/Resources/full_doc.pdf>; last accessed on December 20, 2014.
80
Analysis of the electrification programme in India using the ‘energy plus’ framework and the key lessons
Annex 1. Selected Indicators The selected indicators are the following:
1. Growth of village electrification (2004–05 to 2012–13): as village electrification status
of all states is almost 100 per cent, we have taken growth in the last ten years to
measure the performance of the states.
2. Percentage of rural HHs using electricity for lighting (as major source).
3. Growth of rural HHs using electricity (2001–2011): this measures the performance of
electrification of a state over a period in terms of accessibility.
4. Human Development Index: the better the HDI, the more performance can be
expected to be better.
5. Share of priority sector lending for small enterprises in total PSL (2010): indicator of
financial input, the more the PSL, the better the performance.
6. Gross enrolment ratio in Classes I–VIII (6–13 years): indicator of educational input,
expected to have a direct and positive relationship to performance.
7. Percentage of PHCs with electricity supply (As on March 2011): indicator of health
service input, expected to have a direct relationship to performance.
8. Consumer metering (2006/07): indicator of utility efficiency, might have positive
relationship with performance.
9. Percentage change in MPCE between 2005–06 and 2010–11: indicator of economic
status (change of), expected to improve with availability of electricity and expected
to demand better livelihood standard (e.g., in terms of access to electricity).
10. Percentage change in per capita consumption of electricity in 2007–08 to 2010–11:
measures change in average per capita consumption.
11. Percentage of enterprises 42 receiving some kind of assistance (includes financial
loans, subsidies, machinery/equipment, training, marketing, raw materials and
others): receiving more assistance could help to start or run an enterprise.
42 Unincorporated Non-agricultural Enterprises (Excluding Construction) in Rural area
81
Analysis of the electrification programme in India using the ‘energy plus’ framework and the key lessons
12. Share of rural enterprises in rural HH: represents the proportion of rural enterprises
in rural HHs, indicates level of entrepreneurial activity for improving standards of
living.
13. Share of employment engaged in rural enterprises in the rural population: indicates
employment (self + paid) for improvements in standards of living.
14. Percentage of enterprises working more than twelve hours: enterprises working
more than twelve hours definitely require some kind of lighting arrangement (other
than sunlight); can be a proxy for electricity requirements for entrepreneurial
activity.
15. Percentage of enterprises whose businesses have expanded in the last three years
(2008–10): indicates prosperity/profitability of productive activity; may be due to
access to electricity or business expansion, may demand access to electricity.
16. Percentage of enterprises perceiving that power is not a challenge for their business:
can be a proxy for access to electricity for an enterprise.
17. Percentage peak demand met (peak demand met as a percentage of peak demand)
(2013–14): can be a proxy for power cuts, thus, the higher is the value the better the
state’s performance.
18. Pump-set per thousand hectares net sown area (2012–13): proxy for agricultural
electrification; the greater the value the better the state’s performance.
Data source: central and state government documents, Reserve Bank of India data base,
Indiastat.com, and Indian National Sample Survey reports.
82

Analysis of the electrification programme in India using the ‘energy plus’ framework and the key lessons
Annex 2. Profile of Survey Respondents Age group
The sample only consists of adult respondents (18 and above). All of the household and
enterprise respondents in the survey were in the age group of 20 to 70 years of age. In
Madhya Pradesh, a majority (36.11 per cent) of household respondents were in the age
group of 40 to 50 years, and a wide percentage(38.71 per cent) of enterprise respondents
were in the age group of 30 to 40 years. In Andhra Pradesh, the equivalent percentage (23
per cent) of respondents belonged to two age groups (30–40 and 49–60 years) and a slightly
higher percentage (29 per cent) of respondents were in the age group of 40 to 50 years.
Educational level
The education levels of the survey respondents were identified in terms of the usual
milestones for educational qualifications in rural India like primary education, high school,
diploma, intermediate, etc. A majority of both household and enterprise survey respondents
were found to be have attained primary education and above in MP. The percentage of
illiterates (46 per cent) among respondents was also high in AP.
Current primary and secondary sources of income
Among household respondents in MP, 63.9 per cent reported daily wage labour and 19.4 per
cent reported service (contractual/permanent service in government or private sector) as
their primary livelihood activity. The remaining household respondents mentioned selling
wood as their key source of livelihood. At the same time, among enterprise survey
respondents, a majority (51.7 per cent) reported traditional activities (primarily handicraft,
weaving, and pottery) as their primary livelihood activities. Further, 12.1 per cent of
respondents reported agriculture and agri-related activities (including selling milk, raising
goats, vegetable and fruit selling, and making bidis) as primary sources of income. 15.5 per
cent of the enterprise respondents gave their professions as skilled jobs (including carpenter,
electrician, painter, barber, and tailor). Over 20 per cent of the enterprise respondents
reported services (including garments and grocery shops) as their primary source of income.
In the two livelihood clusters in AP, the majority of respondents’ primary sources of income
were in weaving and dry fish and prawn trading (37.5 per cent each). Further, a considerable
percentage (18.1 per cent) of respondents worked as daily wage labourers on fishing boats,
83

Analysis of the electrification programme in India using the ‘energy plus’ framework and the key lessons
in agricultural fields and factories; the respondents falling under this category pursued a
combination of daily wage labour opportunities in the vicinity of their households based on
the availability of work such as working on fishing boats and in agricultural fields, prawn
and crab factories and zip factories. The remaining 6.9 per cent of respondents pursued
agriculture and allied activities, salaried employment and skill-based labour (carpentry,
cooking, masonry, car driving, etc.).
84
Analysis of the electrification programme in India using the ‘energy plus’ framework and the key lessons
Annex 3. Rural Electricity Programmes in India In the rural electrification sector, over the years a number of government programmes43
(such as Kutir Jyoti, the Minimum Needs Programme, the Accelerated Rural Electrification
Programme, etc.) have attempted to enhance access either as part of overall rural
development or by specifically targeting rural electrification. Though a number of
programmes have attempted to enhance access to electricity either as part of overall rural
development or specifically targeting rural electrification, the multiplicity of the
programmes has meant that the funding for each programme proved inadequate and that
programme implementation was not properly coordinated or managed. Due to the financial
burden that such programmes impose, utilities often showed less interest in promoting these
schemes actively, and even the targets set by the utilities were not met. Further, the high
cross subsidy for rural electricity supply also made the utilities lukewarm towards
supplying electricity to rural areas. However, during the last decade, rural electrification has
become a political priority, driven by the realization of its neglect over the years, with the
central government creating the necessary enabling environment through the REST (Rural
Electricity Supply Technology) Mission44 in 2001; the Electricity Act, 2003; the National
Electrification Policy, 2005; and the Rural Electrification Policy, 2006. In 2001, the
government declared the objective of providing ‘power for all’ by 2012 under the REST
Mission, and backed this up with the launch of a large-scale electrification effort, the Rajiv
Gandhi Grameen Vidyutikaran Yojana (RGGVY) scheme, in April 2005, led by the Ministry
of Power. The following sections provide details of the various rural electrification
programmes prevalent in India.
43The Minimum Needs Programme started in the Fifth Five-Year Plan (1974–79), which had rural electrification as one of the components. The Kutir Jyoti Programme was initiated in 1989 to provide a single light connection to all Below Poverty Line (BPL) households. This programme provided a 100 per cent grant for the one-time costs of internal wiring and service connection charges. The Accelerated Rural Electrification Programme (2003), which was initiated to offer interest subsidies to states for rural electrification purposes, was combined with the Kutir Jyoti programme in February 2004 to create the Accelerated Rural Electrification of one lakh villages and one crore households. 44 The REST Mission was launched for the electrification of one lakh villages and one crore households. REST was designed to ensure a holistic and integrated approach to providing electricity for all by 2012 by identifying and adopting technological solutions, changing the legal and institutional framework, and promoting, financing and facilitating alternative approaches. Under the programme, electrification projects based on grid extensions and stand-alone electrification based on distributed generation both became eligible for capital subsidies.
85

Analysis of the electrification programme in India using the ‘energy plus’ framework and the key lessons
Rajiv Gandhi Grameen Vidyutikaran Yojana
The RGGVY was launched by merging all other existing schemes of rural electrification,
with the goal of electrifying all un-electrified villages and hamlets, providing access to
electricity to all households within five years, and providing 23.4 million free connections to
households below the national poverty line. The scheme attempted to address some of the
common ailments of rural electrification in the country, such as poor distribution networks,
lack of maintenance, low load densities with high transmission losses, increasing costs of
delivery and poor quality of power supply. Instead of only village electrification, the
emphasis of RGGVY has been on facilitating rural development, employment generation
and poverty alleviation by providing access to electricity to all rural households, including
below poverty line households, and also catering to the requirements of agriculture, small
and micro-enterprise cold chains, health care IT and education. The RGGVY programme is
covered in more detail in Section 4.
Remote Village Electrification Programme
While the Ministry of Power is the nodal ministry for extensions of the electricity grid, the
Ministry of New and Renewable Energy (MNRE) has also been enhancing electricity access
through decentralized renewable energy technologies, such as solar home systems, solar
photovoltaic power plants, small hydropower plants and biomass gasification. This is being
done under the Remote Village Electrification Programme (RVEP), wherever grid extension
is not feasible. The RVEP was initiated in 2001 for the provision of basic lighting facilities in
un-electrified census villages, regardless of whether or not these villages were likely to
receive grid connectivity. The scheme was subsequently modified to cover only those un-
electrified census villages that are not likely to receive grid connectivity. By focusing on
remote census villages and remote hamlets in electrified census villages, the RVEP aimed to
bring the benefits of electricity to people living in the most backward and deprived regions
of the country. In addition to domestic use, the scheme also has the option of providing
energy services for community facilities and pumping for drinking water supply or
irrigation, as well as for economic and income-generating activities in the village.
As of December 2011, the RVE programme has reportedly covered 12,369 villages and
hamlets (MNRE 2012). However, Palit (2013) observes that the vast majority, more than 90
per cent of the villages taken up for electrification under RVE were provided with solar
home systems or solar power plants. Central financial assistance of up to 90 per cent of the
86
Analysis of the electrification programme in India using the ‘energy plus’ framework and the key lessons
cost of the project is provided as grant, with specific benchmarks as applicable in respect of
the technologies adopted for electrification. The remaining 10 per cent cost of projects can be
financed through sources such as the Prime Minister’s Gramodaya Yojana, the Rural
Infrastructure Development Fund, the Ministry of Tribal Affairs, the MP Local Area
Development Fund, the MLA Local Area Development Fund and the corporate sector. The
implementing agencies were given the option of raising funds from these and other sources,
such as the Rural Electrification Corporation, the Power Finance Corporation, etc., but also
including users, so as to meet their share of the costs of the project.
Village Energy Security Programme
Another programme, the Village Energy Security Programme (VESP), was conceptualized
by MNRE as a step forward to the RVE programme, and it attempted to address total energy
needs for electricity, cooking and motive power in remote villages through the use of locally
available biomass. The programme was initiated in 2004 with the following objectives:
• To meet village energy requirements through biomass material and biomass-based
conversion technologies or other renewable technologies, where necessary;
• To go beyond electrification by addressing total energy requirements such as energy
required for household cooking and irrigation;
• These projects will involve the installation of energy production systems: biomass
gasifiers, biogas plants, plantation activities and improved biomass cooking stoves.
Undoubtedly, the programme was ambitious in setting itself a mandate of meeting a rural
community’s total demand for energy services. Appropriately for such a pioneering and
unprecedented programme, the initial phase of VESP was intended to test the concept and
capacity of various institutions to deliver energy to remote and inaccessible communities.
However, this test phase met with very limited success, and most of the test projects could
not be sustained. The programme was discontinued, and no new test projects have been
sanctioned since 2010 (Palit 2011).
Jawaharlal Nehru National Solar Mission
MNRE is also implementing the Jawaharlal Nehru National Solar Mission (JNNSM), one of
the eight National Missions comprising India’s National Action Plan on Climate Change.
When the JNNSM was launched, all solar energy programmes promoted by MNRE were
integrated under the Mission. It has the twin objectives of contributing to India’s long-term
87

Analysis of the electrification programme in India using the ‘energy plus’ framework and the key lessons
energy security and to its environmentally sustainable growth. The Mission also aims to
incentivize the installation of 22,000 MW of on- and off-grid solar power, using both solar
PV and Concentrating Solar Power technologies by 2022, along with a large number of other
solar applications such as solar lighting, heating and water pumps. The first phase (up to
2013) focuses on promoting off-grid systems to serve populations without access to
commercial energy, as well as on adding capacity to grid-based systems, augmenting the
supply with ‘clean’ energy.
88

Analysis of the electrification programme in India using the ‘energy plus’ framework and the key lessons
Annex 4. Composite indexes based on 18 selected indicators The composite indexes based on 18 selected indicators are as follows:
CI# SC
CI$ SC
Kerala 0.69 1.00 Kerala 0.55 1.00
Andhra Pradesh 0.64 0.96 Tamil Nadu 0.37 0.83
Tamil Nadu 0.49 0.85 Andhra Pradesh 0.35 0.81
Uttarakhand 0.35 0.73 Uttarakhand 0.35 0.80
Haryana 0.31 0.70 Himachal Pradesh 0.33 0.78
Himachal Pradesh
0.28 0.69 Haryana 0.25 0.71
West Bengal 0.12 0.56 Odisha 0.20 0.65
Jharkhand 0.10 0.54 West Bengal 0.19 0.65
Odisha 0.08 0.53 Jharkhand 0.15 0.61
Punjab 0.03 0.49 Gujarat -0.09 0.37
Gujarat 0.02 0.48 Rajasthan -0.12 0.34
Karnataka -0.04 0.44 Karnataka -0.13 0.33
Rajasthan -0.07 0.41 Maharashtra -0.13 0.32
Maharashtra -0.13 0.37 Punjab -0.14 0.32
J & K -0.30 0.23 J & K -0.25 0.21
Chandigarh -0.31 0.23 Chandigarh -0.25 0.21
Uttar Pradesh -0.38 0.17 Uttar Pradesh -0.30 0.16
Madhya Pradesh -0.56 0.03 Madhya Pradesh -0.37 0.09
Assam -0.59 0.01 Bihar -0.42 0.04
Bihar -0.60 0.00 Assam -0.46 0.00
#10 per cent weightage to variable 1/2/3/11/12/14/17/18 and 2 per cent weightage to
remaining 10 variables.
$ Equal weightage to all variables.
89

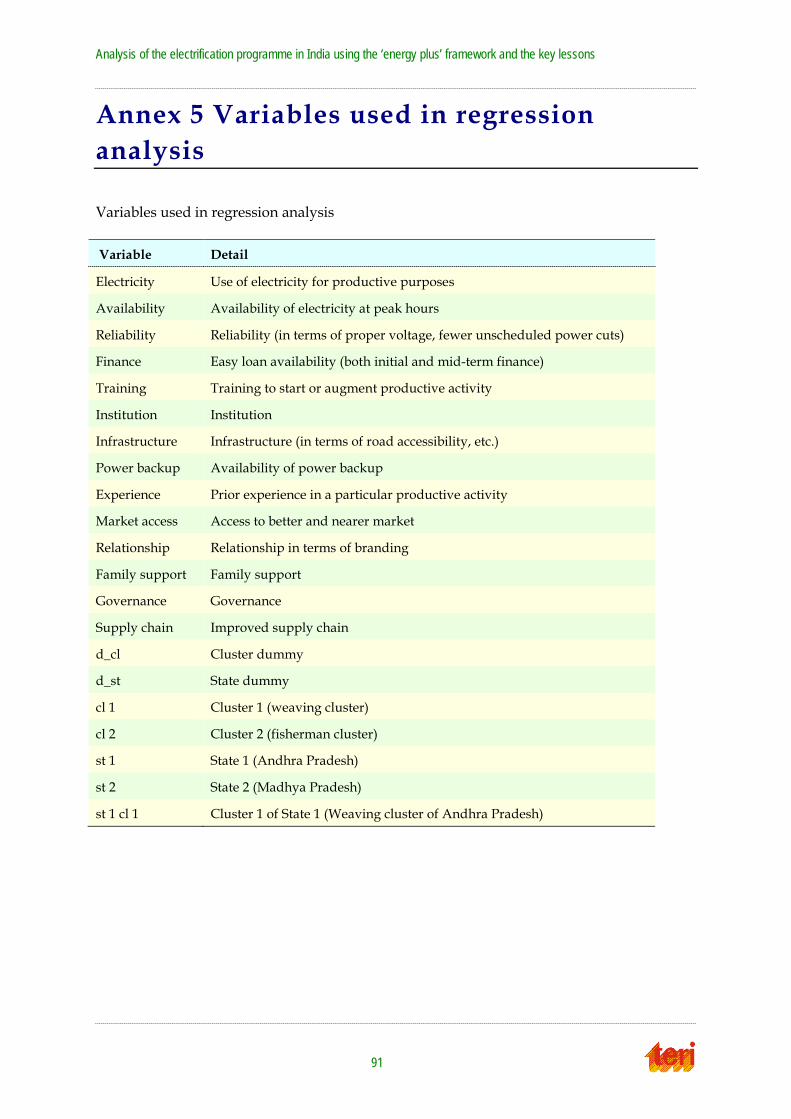
Analysis of the electrification programme in India using the ‘energy plus’ framework and the key lessons
Annex 5 Variables used in regression analysis Variables used in regression analysis Variable Detail
Electricity Use of electricity for productive purposes
Availability Availability of electricity at peak hours
Reliability Reliability (in terms of proper voltage, fewer unscheduled power cuts)
Finance Easy loan availability (both initial and mid-term finance)
Training Training to start or augment productive activity
Institution Institution
Infrastructure Infrastructure (in terms of road accessibility, etc.)
Power backup Availability of power backup
Experience Prior experience in a particular productive activity
Market access Access to better and nearer market
Relationship Relationship in terms of branding
Family support Family support
Governance Governance
Supply chain Improved supply chain
d_cl Cluster dummy
d_st State dummy
cl 1 Cluster 1 (weaving cluster)
cl 2 Cluster 2 (fisherman cluster)
st 1 State 1 (Andhra Pradesh)
st 2 State 2 (Madhya Pradesh)
st 1 cl 1 Cluster 1 of State 1 (Weaving cluster of Andhra Pradesh)
91

Analysis of the electrification programme in India using the ‘energy plus’ framework and the key lessons
Related Documents