Abstract—Supermarkets are the most electricity-intensive type of commercial buildings. The unsuitable indoor environment of a supermarket provided by abnormal HVAC operations incurs waste energy consumption in refrigeration systems. This current study briefly describes significantly solid backgrounds and proposes easy- to-use analysis terminology for investigating the impact of HVAC operations on refrigeration power consumption using the field-test data obtained from building automation system (BAS). With solid backgrounds and prior knowledge, expected energy interactions between HVAC and refrigeration systems are proposed through Pearson’s correlation analysis (R value) by considering correlations between equipment power consumption and dominantly independent variables (driving force conditions).The R value can be conveniently utilized to evaluate how strong relations between equipment operations and driving force parameters are. The calculated R values obtained from field data are compared to expected ranges of R values computed by energy interaction methodology. The comparisons can separate the operational conditions of equipment into faulty and normal conditions. This analysis can simply investigate the condition of equipment operations or building sensors because equipment could be abnormal conditions due to routine operations or faulty commissioning processes in field tests. With systematically solid and easy-to-use backgrounds of interactions provided in the present article, the procedures can be utilized as a tool to evaluate the proper commissioning and routine operations of HVAC and refrigeration systems to detect simple faults (e.g. sensors and driving force environment of refrigeration systems and equipment set-point) and optimize power consumption in supermarket buildings. Moreover, the analysis will be used to further study the FDD research for supermarkets in future. Keywords—Energy interaction, HVAC, R-value, Supermarket buildings. I. INTRODUCTION UPERMARKETS are the largest energy consumption in commercial buildings according to [1], refrigeration equipment being the most important systems consumed 7% of total energy for the commercial sector. For electricity use in supermarket areas [2], 50% of energy consumption was consumed by refrigeration systems, whereas 20% of the total was belonged to HVAC (heating, ventilation and air- conditioning) operations. The load calculations of HVAC systems are based on occupants, indoor and outdoor design D. Woradechjumroen is a Ph.D. candidate with the Charles W. Durham School of Architectural Engineering and Construction, University of Nebraska-Lincoln, Omaha, NE 68182 USA (phone: 402-613-0343; e-mail: dworadechjumroe@ unomaha.edu). H. Li and Y. Yu are associate professors with the Charles W. Durham School of Architectural Engineering and Construction, University of Nebraska-Lincoln, Omaha, NE 68182 USA (e-mail: [email protected], [email protected]). conditions and the load of supermarket environment. The driving force conditions of refrigeration systems are designed at 95°F (35°C) for an outdoor condition and 75°F (24°C) and 55% RH for an indoor condition. Not only is outdoor air temperature (OAT) driving force influencing on the power consumption of refrigeration systems, but the indoor conditions, that are provided by HVAC systems such as zone air temperature (ZAT) and indoor air relative humidity (IARH), also affect the power consumption; refrigeration systems cannot be operated optimally without a well- conditioned space. The suitable indoor condition of refrigeration systems can happen when the size and suitable operations of HVAC systems are proper. The indoor conditions of the refrigeration systems provided by HVAC systems are called “energy interaction”. The interactions between improper indoor conditions and refrigeration systems lead to excessive power consumption in supermarkets. For instance, HVAC systems provide inappropriate indoor condition in a supermarket (e.g., 60% RH and 78°F) and then the refrigeration equipment (e.g., refrigeration compressors) can consume more energy because latent load is increased due to more IARH. Conversely, whenever IARH could be controlled between 55% and 35% RH at 75°F for a zone temperature, the power consumption of refrigeration systems can be reduced [3]. The interaction in terms of energy consumption in a supermarket environment have been significantly concerned more than two decades; previous researchers (e.g., [4]-[6]) studied the energy performance of this interaction for refrigerated display cases using computer simulations, laboratory tests, and field assessments. The results of power reduction percentages were concluded in the database review presented by [3]; however, no previous study analyzed the energy performance of these intereffects in supermarkets by systematically considering the conditions of HVAC&R (HVAC and refrigeration) systems including: improper, acceptable and normal operations in field tests. The proposed method can be further used to investigate faults of energy interactions in field tests because fault-free data of commercial supermarkets are cost effective collected for analysis and faults are typical existed in field tests due to improper design, commissioning and preventive maintenance. Additionally, the findings will be further utilized as a tool to study the optimization of refrigeration power consumption and to simply detect faulty indoor conditions of supermarket environment provide by HVAC for fault detect and diagnosis (FDD) in supermarkets. Energy Interaction among HVAC and Supermarket Environment D. Woradechjumroen, H. Li, Y. Yu S World Academy of Science, Engineering and Technology International Journal of Civil, Environmental, Structural, Construction and Architectural Engineering Vol:8, No:12, 2014 1230 International Scholarly and Scientific Research & Innovation 8(12) 2014 scholar.waset.org/1999.3/9999881 International Science Index, Civil and Environmental Engineering Vol:8, No:12, 2014 waset.org/Publication/9999881

Welcome message from author
This document is posted to help you gain knowledge. Please leave a comment to let me know what you think about it! Share it to your friends and learn new things together.
Transcript

Abstract—Supermarkets are the most electricity-intensive type of
commercial buildings. The unsuitable indoor environment of a supermarket provided by abnormal HVAC operations incurs waste energy consumption in refrigeration systems. This current study briefly describes significantly solid backgrounds and proposes easy-to-use analysis terminology for investigating the impact of HVAC operations on refrigeration power consumption using the field-test data obtained from building automation system (BAS). With solid backgrounds and prior knowledge, expected energy interactions between HVAC and refrigeration systems are proposed through Pearson’s correlation analysis (R value) by considering correlations between equipment power consumption and dominantly independent variables (driving force conditions).The R value can be conveniently utilized to evaluate how strong relations between equipment operations and driving force parameters are. The calculated R values obtained from field data are compared to expected ranges of R values computed by energy interaction methodology. The comparisons can separate the operational conditions of equipment into faulty and normal conditions. This analysis can simply investigate the condition of equipment operations or building sensors because equipment could be abnormal conditions due to routine operations or faulty commissioning processes in field tests. With systematically solid and easy-to-use backgrounds of interactions provided in the present article, the procedures can be utilized as a tool to evaluate the proper commissioning and routine operations of HVAC and refrigeration systems to detect simple faults (e.g. sensors and driving force environment of refrigeration systems and equipment set-point) and optimize power consumption in supermarket buildings. Moreover, the analysis will be used to further study the FDD research for supermarkets in future. Keywords—Energy interaction, HVAC, R-value, Supermarket
buildings.
I. INTRODUCTION UPERMARKETS are the largest energy consumption in commercial buildings according to [1], refrigeration
equipment being the most important systems consumed 7% of total energy for the commercial sector. For electricity use in supermarket areas [2], 50% of energy consumption was consumed by refrigeration systems, whereas 20% of the total was belonged to HVAC (heating, ventilation and air-conditioning) operations. The load calculations of HVAC systems are based on occupants, indoor and outdoor design
D. Woradechjumroen is a Ph.D. candidate with the Charles W. Durham
School of Architectural Engineering and Construction, University of Nebraska-Lincoln, Omaha, NE 68182 USA (phone: 402-613-0343; e-mail: dworadechjumroe@ unomaha.edu).
H. Li and Y. Yu are associate professors with the Charles W. Durham School of Architectural Engineering and Construction, University of Nebraska-Lincoln, Omaha, NE 68182 USA (e-mail: [email protected], [email protected]).
conditions and the load of supermarket environment. The driving force conditions of refrigeration systems are designed at 95°F (35°C) for an outdoor condition and 75°F (24°C) and 55% RH for an indoor condition. Not only is outdoor air temperature (OAT) driving force influencing on the power consumption of refrigeration systems, but the indoor conditions, that are provided by HVAC systems such as zone air temperature (ZAT) and indoor air relative humidity (IARH), also affect the power consumption; refrigeration systems cannot be operated optimally without a well-conditioned space. The suitable indoor condition of refrigeration systems can happen when the size and suitable operations of HVAC systems are proper. The indoor conditions of the refrigeration systems provided by HVAC systems are called “energy interaction”.
The interactions between improper indoor conditions and refrigeration systems lead to excessive power consumption in supermarkets. For instance, HVAC systems provide inappropriate indoor condition in a supermarket (e.g., 60% RH and 78°F) and then the refrigeration equipment (e.g., refrigeration compressors) can consume more energy because latent load is increased due to more IARH. Conversely, whenever IARH could be controlled between 55% and 35% RH at 75°F for a zone temperature, the power consumption of refrigeration systems can be reduced [3].
The interaction in terms of energy consumption in a supermarket environment have been significantly concerned more than two decades; previous researchers (e.g., [4]-[6]) studied the energy performance of this interaction for refrigerated display cases using computer simulations, laboratory tests, and field assessments. The results of power reduction percentages were concluded in the database review presented by [3]; however, no previous study analyzed the energy performance of these intereffects in supermarkets by systematically considering the conditions of HVAC&R (HVAC and refrigeration) systems including: improper, acceptable and normal operations in field tests. The proposed method can be further used to investigate faults of energy interactions in field tests because fault-free data of commercial supermarkets are cost effective collected for analysis and faults are typical existed in field tests due to improper design, commissioning and preventive maintenance. Additionally, the findings will be further utilized as a tool to study the optimization of refrigeration power consumption and to simply detect faulty indoor conditions of supermarket environment provide by HVAC for fault detect and diagnosis (FDD) in supermarkets.
Energy Interaction among HVAC and Supermarket Environment
D. Woradechjumroen, H. Li, Y. Yu
S
World Academy of Science, Engineering and TechnologyInternational Journal of Civil, Environmental, Structural, Construction and Architectural Engineering Vol:8, No:12, 2014
1230International Scholarly and Scientific Research & Innovation 8(12) 2014 scholar.waset.org/1999.3/9999881
Inte
rnat
iona
l Sci
ence
Ind
ex, C
ivil
and
Env
iron
men
tal E
ngin
eeri
ng V
ol:8
, No:
12, 2
014
was
et.o
rg/P
ublic
atio
n/99
9988
1

II. BACKGROUNDS
A. Supermarket Building Load Design In the process of constituting load calculation for
supermarket buildings, an indoor condition is designed at 68ºF for a heating space and at 74ºF for a cooling space at around 50%-55% RH, whereas an outdoor temperature should be specified according to an annual design temperature of each location before sizing the capacities of HVAC equipment. The capacities of HAVC systems shall be adequate to supply cool on the hottest condition and heat on the coldest period; these conditions will be the appropriate indoor space of refrigeration systems. The outdoor conditions are recommended in ASHARE Handbook- Fundamentals for each location. For U.S. commercial supermarkets, RTUs are intensively used to supply cooling or heating for comfort zones; however, in practice, RTUs are inherently oversized by HVAC designers leading to improper indoor humidity in supermarket environment. To solve over latent load, dehumidification unit (DHU) is a typical machine to improve indoor humidity due to the inherent oversizing effect of RTU operations in supermarkets. Sizing this equipment is based on internal latent load from occupants, electrical machines and air infiltration including refrigerated display cases in the conditioned space of a refrigeration area. This internal latent load will be removed in terms of moisture quantity by desiccant wheel in the dehumidifier module of a DHU.
Likewise the design of HVAC systems, outdoor air temperature is specified to be a driving force to select the capacity of a refrigeration system for an outdoor condition. This variable cannot be controlled by HVAC equipment. Conversely, the indoor condition of refrigeration systems can be manipulated; the set point of temperature and indoor air relative humidity (IARH) are controlled by the function of HVAC controllers. These two variables performing as other driving forces influence refrigeration systems. In the process of load calculation, refrigeration equipment is similarly calculated to HAVC systems, but defrost heat and product load are extra included in total load to conserve the quality of food in refrigerated display cases, walk in unit and/or self-contained units. Typically, HAVC designers assume the design conditions of refrigeration equipment are at a 95ºF (35ºC) outdoor condition and at indoor conditions of 75ºF (24ºC) with 55% RH according to refrigerated case manufacturers.
The indoor conditions provided by HVAC operations for refrigeration systems are interactions. When HVAC systems are not properly operated and out of the indoor design condition, the refrigeration compressor can consume more energy than the design condition and / or cannot maintain the design temperature for retaining product quality. For instance, an indoor temperature at 75°F (24°C) with 75% RH for refrigerated cases, this relative humidity is out of the range from 35 to 50%, so higher latent load of indoor air results in higher energy consumption for refrigeration compressors. With this relation, interactions among HVAC and supermarket environment can be used to evaluate HVAC&R equipment in
supermarkets.
B. HVAC and Refrigeration Systems Commercial supermarkets consist of HVAC units and
refrigeration equipment; HVAC units provide heat and cool air by RTUs, which are practically oversized [7], [8] resulting in degraded efficiency in absorbing latent load [9]. Even through zone air temperature is controlled at a set point temperature, IARH cannot be maintained at 50-55% RH because the temperature controller is typically independent to the humidity controller. This situation is particular to supermarkets rather than other generally commercial buildings. As a result, the installation of an advanced RTU with a humidity control technology or dehumidification units is required to retain RH at appropriately set-point level. The interaction of the supermarket environments provided by those HAVC units with the refrigeration equipment is indoor temperature and humidity. Meanwhile another significant driving condition is outdoor air temperature influencing RTU, DHU and refrigeration on a condenser module.
Fig. 1 Multiplexed refrigeration and HVAC systems in commercial
supermarkets Commercial refrigeration systems can be classified into two
categories. First system is practically designed as multiplexed direct expansion equipment including: 1) the condenser on a rooftop; 2) the multiple compressors with a liquid-line receiver located in a machine room; 3) evaporators installed in display cases at a sale area and 4) refrigerant piping system is utilized for supplying a refrigerant volume from the liquid manifold and receiver, which collect liquid refrigerant after it exits from the rooftop condenser. These four components can be depicted in Fig. 1. Another type typically located in small to medium-scaled supermarkets is a self-contained unit which combines all the refrigeration system components in one packaged system such as reach-in refrigerators, coolers and freezers. Among them, around 55% of annual primary energy usages in commercial supermarkets were consumed by the first type and the rest were accounted by self-contained units [10]. Unlike an evaporator coil of an air-conditioning unit or a RTU, the evaporators are installed in display cases instead of conditioned zones, where evaporator coils must be designed at
World Academy of Science, Engineering and TechnologyInternational Journal of Civil, Environmental, Structural, Construction and Architectural Engineering Vol:8, No:12, 2014
1231International Scholarly and Scientific Research & Innovation 8(12) 2014 scholar.waset.org/1999.3/9999881
Inte
rnat
iona
l Sci
ence
Ind
ex, C
ivil
and
Env
iron
men
tal E
ngin
eeri
ng V
ol:8
, No:
12, 2
014
was
et.o
rg/P
ublic
atio
n/99
9988
1

the different ranges of temperature operations depending upon the range of temperature operations. Two additional devices are also used: anti-sweat heaters (ASH) and defrost. An ASH is used to prevent condensation from occurring on door-gasket surfaces and glass and installed on low temperature display and beverage cases. This device controller can maintain surface temperature above the dew-point temperature and automatically operates via on-off cycles based on RH set points. Defrost is used for display cases to melt the frost that can occur in a coil surface, lessening the negative impact this frost has on the efficiency of heat transfer at the evaporator coil.
Fig. 2 Schematic of supermarket dehumidification
Specifically, for the low temperature of glass door freezers, condensation is a major problem. In order to avoid condensation during times when IARH is particularly high, ASH is used on the glass door. The operation of ASH is operated by the set point of IARH. The energy consumption of ASH is significantly reduced by decreasing the IARH in a store. If the IARH can be controlled at 35%, the energy consumption of anti-sweat heaters could be reduced. Also, when the temperature of an evaporator coil is lower than the dew point of air in the low and medium temperature of display cases, this different temperature causes moisture in air to frost on the evaporator coil. This frost is accumulated as insulator on the coil, and significantly decreases the efficiency of heat transfer from the coil to air in the case. Thus, defrost is required for providing heat for a refrigerated space to remove accumulated frost. The defrost operation can be controlled in a variety of ways such as measuring the temperature or pressure drop across the evaporator, measuring frost accumulation and sensing humidity depending on a type. However, the power consumption of defrost cannot be monitored in this study because the refrigeration system of supermarkets are installed the bypass valve to utilize the heat recovery to remove accumulated frost. Therefore, the power consumption of total refrigeration compressors and anti-sweat heaters is only used to analyze the interaction in this report.
For HVAC systems in supermarkets, RTUs are used to provide both cool and heat to a conditioned space. A number of RTUs are different depending on the size of each location. Also, a DHU is only installed in the area around display cases to maintain the IARH at indoor design conditions at around
50-55% RH. This equipment is packaged unit composed of a desiccant wheel to absorb moisture from air in the zone and to release the moisture to exhaust air by condenser fans, whereas multiple compressors are used to perform at part load conditions as well as the part load operations of RTUs as shown in Fig. 2. A RTU controller is based on the set point of indoor temperature, whereas a DHU is functioned based on the set point of IARH. Whenever IARH is less than the set point, a DHU is not activated. Conversely, if IARH rises above the set point, the DHU will be turned on in order to control the IARH in the conditioned space. For indoor air, both the sensible and latent energy of air are the variables influencing the power consumption of refrigeration systems; however, latent energy is more difficult to remove because phase change always happens with the moisture in air. Also, the latent load on the refrigeration comes directly from the IARH. It is important to assure the air in refrigerated spaces that is properly dehumidified to obtain the optimal efficiency of refrigeration system. Thus, if IARH are optimized in the suitable range, 35-50%, the proper energy consumption will be resulted in supermarkets.
III. METHODOLOGY
The supermarket refrigeration systems are automatically operated by two driving conditions. Firstly, the indoor conditions (zone temperature and IARH) are provided by HAVC systems. Outdoor air temperature is the outdoor condition, which is also used as the driving condition for packaged HVAC units. The indoor conditions are significantly considered for the optimal efficiency of refrigeration systems in supermarket since refrigeration equipment must be operated on HVAC indoor environment. If faults occur in the HVAC units, they will result in the deviated operations from the indoor design conditions (e.g., 50-55% RH and 68–74 ºF) leading to abnormal or faulty indoor driving conditions for the refrigeration systems. As a result, the output of refrigeration equipment will deviate from the expected value of normal driving conditions. The typical interactions between considered parameters and equipment power consumption are explained as follows:
A. Rooftop Unit versus OAT, IARH and ZAT The interaction between a RTU and IARH is weak because
the set points of temperature and indoor relative humidity are independent; the RTU is controlled by a set point of temperature, whereas IARH is manipulated by a DHU in supermarkets. There are at least two possible situations in which RTUs could interact with the refrigeration systems in terms of IARH effect. For first situation, failure in operations would cause that RTUs provide unsuitable air to refrigeration systems such as stuck dampers, cooling stage failure and dirty coil in RTU condenser; this situation incurs higher IARH in supermarket environment which affects the increase of refrigeration compressor energy consumption. Secondly, the problem is from the inherent over-sizing issue of a RTU. As a result, the latent capacity is not properly absorbed leading to high IARH. Fig. 3 illustrates the latent absorbing degradation
World Academy of Science, Engineering and TechnologyInternational Journal of Civil, Environmental, Structural, Construction and Architectural Engineering Vol:8, No:12, 2014
1232International Scholarly and Scientific Research & Innovation 8(12) 2014 scholar.waset.org/1999.3/9999881
Inte
rnat
iona
l Sci
ence
Ind
ex, C
ivil
and
Env
iron
men
tal E
ngin
eeri
ng V
ol:8
, No:
12, 2
014
was
et.o
rg/P
ublic
atio
n/99
9988
1
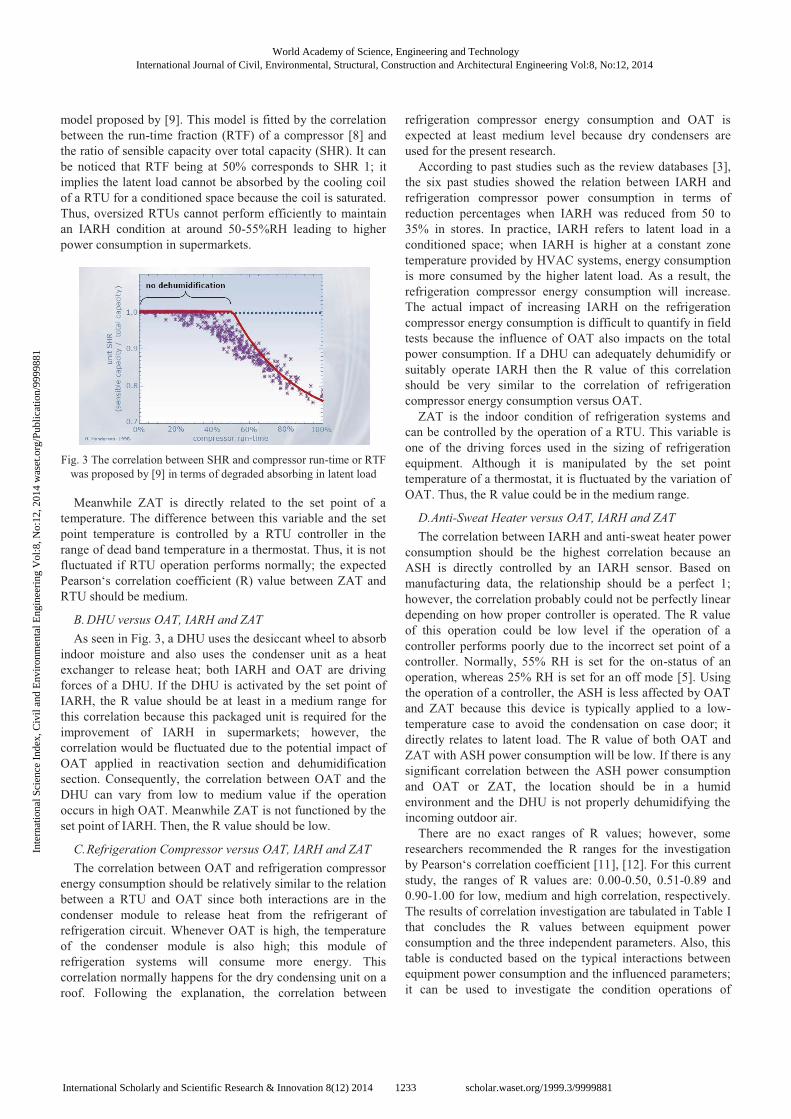
model proposed by [9]. This model is fitted by the correlation between the run-time fraction (RTF) of a compressor [8] and the ratio of sensible capacity over total capacity (SHR). It can be noticed that RTF being at 50% corresponds to SHR 1; it implies the latent load cannot be absorbed by the cooling coil of a RTU for a conditioned space because the coil is saturated. Thus, oversized RTUs cannot perform efficiently to maintain an IARH condition at around 50-55%RH leading to higher power consumption in supermarkets.
Fig. 3 The correlation between SHR and compressor run-time or RTF
was proposed by [9] in terms of degraded absorbing in latent load Meanwhile ZAT is directly related to the set point of a
temperature. The difference between this variable and the set point temperature is controlled by a RTU controller in the range of dead band temperature in a thermostat. Thus, it is not fluctuated if RTU operation performs normally; the expected Pearson‘s correlation coefficient (R) value between ZAT and RTU should be medium.
B. DHU versus OAT, IARH and ZAT As seen in Fig. 3, a DHU uses the desiccant wheel to absorb
indoor moisture and also uses the condenser unit as a heat exchanger to release heat; both IARH and OAT are driving forces of a DHU. If the DHU is activated by the set point of IARH, the R value should be at least in a medium range for this correlation because this packaged unit is required for the improvement of IARH in supermarkets; however, the correlation would be fluctuated due to the potential impact of OAT applied in reactivation section and dehumidification section. Consequently, the correlation between OAT and the DHU can vary from low to medium value if the operation occurs in high OAT. Meanwhile ZAT is not functioned by the set point of IARH. Then, the R value should be low.
C. Refrigeration Compressor versus OAT, IARH and ZAT The correlation between OAT and refrigeration compressor
energy consumption should be relatively similar to the relation between a RTU and OAT since both interactions are in the condenser module to release heat from the refrigerant of refrigeration circuit. Whenever OAT is high, the temperature of the condenser module is also high; this module of refrigeration systems will consume more energy. This correlation normally happens for the dry condensing unit on a roof. Following the explanation, the correlation between
refrigeration compressor energy consumption and OAT is expected at least medium level because dry condensers are used for the present research.
According to past studies such as the review databases [3], the six past studies showed the relation between IARH and refrigeration compressor power consumption in terms of reduction percentages when IARH was reduced from 50 to 35% in stores. In practice, IARH refers to latent load in a conditioned space; when IARH is higher at a constant zone temperature provided by HVAC systems, energy consumption is more consumed by the higher latent load. As a result, the refrigeration compressor energy consumption will increase. The actual impact of increasing IARH on the refrigeration compressor energy consumption is difficult to quantify in field tests because the influence of OAT also impacts on the total power consumption. If a DHU can adequately dehumidify or suitably operate IARH then the R value of this correlation should be very similar to the correlation of refrigeration compressor energy consumption versus OAT.
ZAT is the indoor condition of refrigeration systems and can be controlled by the operation of a RTU. This variable is one of the driving forces used in the sizing of refrigeration equipment. Although it is manipulated by the set point temperature of a thermostat, it is fluctuated by the variation of OAT. Thus, the R value could be in the medium range.
D. Anti-Sweat Heater versus OAT, IARH and ZAT The correlation between IARH and anti-sweat heater power
consumption should be the highest correlation because an ASH is directly controlled by an IARH sensor. Based on manufacturing data, the relationship should be a perfect 1; however, the correlation probably could not be perfectly linear depending on how proper controller is operated. The R value of this operation could be low level if the operation of a controller performs poorly due to the incorrect set point of a controller. Normally, 55% RH is set for the on-status of an operation, whereas 25% RH is set for an off mode [5]. Using the operation of a controller, the ASH is less affected by OAT and ZAT because this device is typically applied to a low-temperature case to avoid the condensation on case door; it directly relates to latent load. The R value of both OAT and ZAT with ASH power consumption will be low. If there is any significant correlation between the ASH power consumption and OAT or ZAT, the location should be in a humid environment and the DHU is not properly dehumidifying the incoming outdoor air.
There are no exact ranges of R values; however, some researchers recommended the R ranges for the investigation by Pearson‘s correlation coefficient [11], [12]. For this current study, the ranges of R values are: 0.00-0.50, 0.51-0.89 and 0.90-1.00 for low, medium and high correlation, respectively. The results of correlation investigation are tabulated in Table I that concludes the R values between equipment power consumption and the three independent parameters. Also, this table is conducted based on the typical interactions between equipment power consumption and the influenced parameters; it can be used to investigate the condition operations of
World Academy of Science, Engineering and TechnologyInternational Journal of Civil, Environmental, Structural, Construction and Architectural Engineering Vol:8, No:12, 2014
1233International Scholarly and Scientific Research & Innovation 8(12) 2014 scholar.waset.org/1999.3/9999881
Inte
rnat
iona
l Sci
ence
Ind
ex, C
ivil
and
Env
iron
men
tal E
ngin
eeri
ng V
ol:8
, No:
12, 2
014
was
et.o
rg/P
ublic
atio
n/99
9988
1
equipment in supermarkets because OAT, IARH and ZAT are the driving conditions of refrigeration systems.
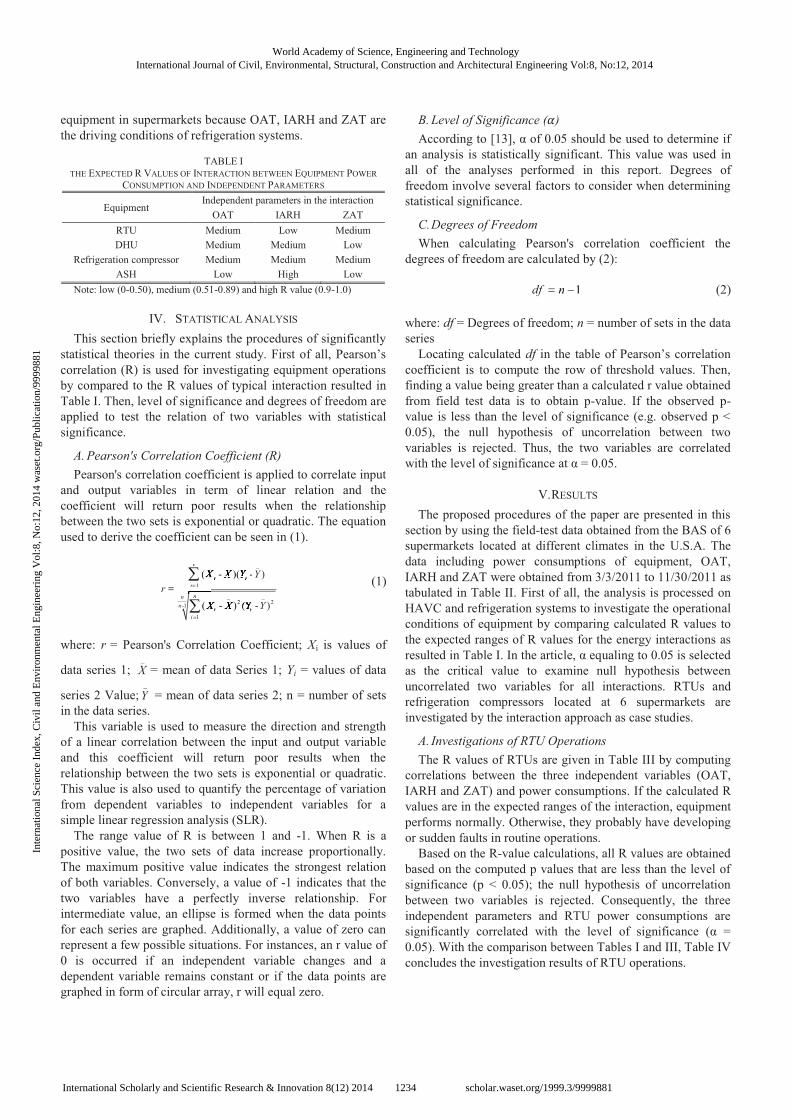
TABLE I
THE EXPECTED R VALUES OF INTERACTION BETWEEN EQUIPMENT POWER CONSUMPTION AND INDEPENDENT PARAMETERS
Equipment Independent parameters in the interaction
OAT IARH ZAT RTU Medium Low Medium DHU Medium Medium Low
Refrigeration compressor Medium Medium Medium ASH Low High Low
Note: low (0-0.50), medium (0.51-0.89) and high R value (0.9-1.0)
IV. STATISTICAL ANALYSIS This section briefly explains the procedures of significantly
statistical theories in the current study. First of all, Pearson’s correlation (R) is used for investigating equipment operations by compared to the R values of typical interaction resulted in Table I. Then, level of significance and degrees of freedom are applied to test the relation of two variables with statistical significance.
A. Pearson's Correlation Coefficient (R) Pearson's correlation coefficient is applied to correlate input
and output variables in term of linear relation and the coefficient will return poor results when the relationship between the two sets is exponential or quadratic. The equation used to derive the coefficient can be seen in (1).
_ _
1
_ _2 2-1
1
( - )( - )
( - ) ( - )
n
i ii
nnn
i ii
X X Y Yr
X X Y Y1
i 1
_
( - )( -n
i i)()- )( -- )()())
_2( - ) (2
n
i i) () (- ) (- ) (2) () () (
(1)
where: r = Pearson's Correlation Coefficient; Xi is values of
data series 1; _
X = mean of data Series 1; Yi = values of data
series 2 Value;_
Y = mean of data series 2; n = number of sets in the data series.
This variable is used to measure the direction and strength of a linear correlation between the input and output variable and this coefficient will return poor results when the relationship between the two sets is exponential or quadratic. This value is also used to quantify the percentage of variation from dependent variables to independent variables for a simple linear regression analysis (SLR).
The range value of R is between 1 and -1. When R is a positive value, the two sets of data increase proportionally. The maximum positive value indicates the strongest relation of both variables. Conversely, a value of -1 indicates that the two variables have a perfectly inverse relationship. For intermediate value, an ellipse is formed when the data points for each series are graphed. Additionally, a value of zero can represent a few possible situations. For instances, an r value of 0 is occurred if an independent variable changes and a dependent variable remains constant or if the data points are graphed in form of circular array, r will equal zero.
B. Level of Significance ( ) According to [13], α of 0.05 should be used to determine if
an analysis is statistically significant. This value was used in all of the analyses performed in this report. Degrees of freedom involve several factors to consider when determining statistical significance.
C. Degrees of Freedom When calculating Pearson's correlation coefficient the
degrees of freedom are calculated by (2):
1df n 1n (2)
where: df = Degrees of freedom; n = number of sets in the data series
Locating calculated df in the table of Pearson’s correlation coefficient is to compute the row of threshold values. Then, finding a value being greater than a calculated r value obtained from field test data is to obtain p-value. If the observed p-value is less than the level of significance (e.g. observed p < 0.05), the null hypothesis of uncorrelation between two variables is rejected. Thus, the two variables are correlated with the level of significance at α = 0.05.
V. RESULTS The proposed procedures of the paper are presented in this
section by using the field-test data obtained from the BAS of 6 supermarkets located at different climates in the U.S.A. The data including power consumptions of equipment, OAT, IARH and ZAT were obtained from 3/3/2011 to 11/30/2011 as tabulated in Table II. First of all, the analysis is processed on HAVC and refrigeration systems to investigate the operational conditions of equipment by comparing calculated R values to the expected ranges of R values for the energy interactions as resulted in Table I. In the article, α equaling to 0.05 is selected as the critical value to examine null hypothesis between uncorrelated two variables for all interactions. RTUs and refrigeration compressors located at 6 supermarkets are investigated by the interaction approach as case studies.
A. Investigations of RTU Operations The R values of RTUs are given in Table III by computing
correlations between the three independent variables (OAT, IARH and ZAT) and power consumptions. If the calculated R values are in the expected ranges of the interaction, equipment performs normally. Otherwise, they probably have developing or sudden faults in routine operations.
Based on the R-value calculations, all R values are obtained based on the computed p values that are less than the level of significance (p < 0.05); the null hypothesis of uncorrelation between two variables is rejected. Consequently, the three independent parameters and RTU power consumptions are significantly correlated with the level of significance (α = 0.05). With the comparison between Tables I and III, Table IV concludes the investigation results of RTU operations.
World Academy of Science, Engineering and TechnologyInternational Journal of Civil, Environmental, Structural, Construction and Architectural Engineering Vol:8, No:12, 2014
1234International Scholarly and Scientific Research & Innovation 8(12) 2014 scholar.waset.org/1999.3/9999881
Inte
rnat
iona
l Sci
ence
Ind
ex, C
ivil
and
Env
iron
men
tal E
ngin
eeri
ng V
ol:8
, No:
12, 2
014
was
et.o
rg/P
ublic
atio
n/99
9988
1

TABLE II INFORMATION OF MEASURED DATA OBTAINED FROM BAS
Supermarket DOE Climate Classification
IARH Range (%)
OAT Range(ºF)
ZAT Range(ºF)
A 6A 20 - 63 50 - 90 61-72 B 7A 25 - 70 42 - 99 67-75 C 3A 45 - 54 69 - 105 69-74 D 5A 27 - 50 51 - 88 72-75 E 2A 68 - 76 44 - 93 18-60 F 3B 23 - 62 42 - 87 66-75
TABLE III
THE R VALUES BETWEEN THE 3 INDEPENDENT VARIABLES AND THE POWER CONSUMPTION OF RTUS
Supermarkets OAT IARH ZAT A 0.74 0.44 0.69 B 0.43 0.18 0.22 C 0.90 -0.51 0.87 D 0.72 0.40 0.45 E 0.70 0.37 0.29 F 0.58 0.26 0.18
TABLE IV
THE INVESTIGATION OF RTU OPERATIONS BY COMPARING TABLES III TO I Supermarkets OAT IARH ZAT
A Normal Normal Normal B Fault Normal Fault C Normal Fault Normal D Normal Normal Fault E Normal Normal Fault F Normal Normal Fault
B. Fault Analysis (RTU vs. OAT and ZAT) Based on the results in Table IV, there is no doubt of the R
values between IARH and RTU that are low because all RTU controllers are functioned based on temperature set-points, not associated with a IARH set-point. Meanwhile, a medium level of R values is expected between RTU and OAT or ZAT.
For OAT and RTU, RTU power consumption normally increases in the condenser module as OAT increases, but the fluctuation could occur due to faulty sensors (e.g. OAT sensor) or condenser fouling resulting in lower efficiency. All R values between OAT and RTU are normal in all supermarkets except supermarket B being low. With the happen, the fault could cause by the OAT sensor, condenser module or compressor. Fortunately, when the same OAT data are used with refrigeration compressor in supermarket B, the correlation result between refrigeration compressor and OAT is normal. Then, OAT sensor can be concluded that it works normally. Therefore, the fault could happen in a condenser or compressor. Fig. 4 shows the normal trend of RTU operations consisting of baseline power and increased power range, whereas Fig. 5 depicts skew data comparing to the normal trend as shown in Fig. 4. The area of the skew data could be caused by faults in condensers and/or compressors or even damper stuck faults. To isolate simultaneous faults, other measuring data are more required in the field test.
Fig. 4 The plot between OAT and RTU in supermarket A
Fig. 5 The plot between OAT and RTU in supermarket B
Fig. 6 The plot between ZAT and RTU in supermarket C
For supermarket B and D, ZAT directly relates to the
function of a set-point temperature. To maintain the ZAT when OAT increases at the set point temperature, power consumption of a RTU should increase; however, faulty
20 30 40 50 60 70 80 9020
40
60
80
100
120
140
160
180
200
220
Outdoor air temperature (OAT, oF)
RT
U p
ower
con
sum
ptio
n (k
Wh)
Supermarket A
R value at 0.74shows normal operations of a RTU
baseline power of fan power
increased power duetothe compressor
40 50 60 70 80 90 1000
20
40
60
80
100
120
Outdoor air temperaturo (OAT, oF)
RT
U p
ower
con
sum
ptio
n (k
Wh)
Supermarket B
R value at 0.43shows faulty operations
increased power consumption
skew data
baseline power
69.5 70 70.5 71 71.5 72 72.5 73 73.50
50
100
150
200
250
Zone air temperature (ZAT, oF)
RT
U p
ower
con
sum
ptio
n (k
Wh)
Supermarket C
R value at 0.87shows a normal operation
increased power consumption
World Academy of Science, Engineering and TechnologyInternational Journal of Civil, Environmental, Structural, Construction and Architectural Engineering Vol:8, No:12, 2014
1235International Scholarly and Scientific Research & Innovation 8(12) 2014 scholar.waset.org/1999.3/9999881
Inte
rnat
iona
l Sci
ence
Ind
ex, C
ivil
and
Env
iron
men
tal E
ngin
eeri
ng V
ol:8
, No:
12, 2
014
was
et.o
rg/P
ublic
atio
n/99
9988
1

temperature could occur in these two supermarkets because the same ZAT data are also used to examine the relations between refrigeration compressor and ZAT showing faulty operations. The effect of faulty sensors can be illustrated in Fig. 7. In Fig. 6, the strong correlation (R = 0.87) between ZAT and RTU in supermarket C can be used as a baseline model to notice the fault effect that happens in supermarket B or D. The wrong measured ZAT data result in skew data out of the linear line leading to the lower R value (R = 0.45) in Fig. 7.
Fig. 7 The plot between ZAT and RTU in supermarket D
Fig. 8 The plot between ZAT and RTU in supermarket F
With the same method to examine ZAT sensors in
supermarket E and F, ZAT sensors are normal. Therefore, low R is caused by other faults. In Fig. 8, there are the three areas of RTU power consumption composing of the baseline power, RTU power of OAT between 60 and 70°F and RTU power of OAT being higher than 70°F. The last area causes low R because the simple linear regression model (R =0.18) is fitted between the first two areas. If the compressors and condensers of RTUs are assumed for acceptable conditions, the second and third area in Fig. 8 can be reduced or optimized by utilizing free cooling or optimizing a set-point of the supply temperature. The set-point of the supply temperature should be
optimally synchronized with the free cooling mode of RTUs to decrease excessive power consumption.
C. Investigations of Refrigeration Compressors Similar to RTU investigations, all correlations between the
three independent variables and refrigeration compressor power consumption reject the null hypothesis by using the level of significance at 0.05. All R values with strong significance associated with the parameters and compressors are tabulated in Table V.
Addressing R value results, Table VI concludes the operational conditions of refrigeration compressors in 6 supermarkets.
TABLE V
THE R VALUES BETWEEN THE 3 INDEPENDENT VARIABLES AND THE POWER CONSUMPTION OF REFRIGERATION COMPRESSORS
Supermarkets OAT IARH ZAT A 0.86 0.75 0.67 B 0.85 0.46 0.37 C 0.88 -0.44 0.78 D 0.71 0.48 0.35 E 0.93 0.67 0.56 F 0.83 0.61 0.68
TABLE VI
THE INVESTIGATIONS OF REFRIGERATION COMPRESSOR OPERATIONS BY COMPARING TABLES V TO I
Supermarkets OAT IARH ZAT A Normal Normal Normal B Normal Fault Fault C Normal Fault Normal D Normal Fault Fault E Normal Normal Normal F Normal Normal Normal
D. Fault Analysis (Refrigeration Compressor Operations vs. IARH and ZAT)
For fault analysis in supermarket B and D, the power consumption of refrigeration compressor increase as IARH increases. Although the relation between IAH and refrigeration power consumption are linear, skew data are probably occurred by the variation of OAT resulting in the R value being slightly lower than the medium range. Fig. 9 demonstrates an example of the aforementioned situation. The skew data are happened due to OAT variations. Most data are between 45 and 55% RH. In this IARH range, the power consumptions are varied between 20 and 30 kWh.
Meanwhile, supermarket C has the negative correlation due to faulty IARH sensor that is similar to the negative relation between RTU and IARH; faulty measurements could occur since IARH is between 45 and 54 %RH. The wrong IARH data lead to negative slope of the relation. This RH sensor could cause faulty interaction between IARH and a DHU. Similar to the results between ZAT and RTU in supermarket B and D, faulty sensors cause low R values.
72.5 73 73.5 74 74.5 7510
20
30
40
50
60
70
80
90
100
Zone air temperature (ZAT, oF)
RT
U p
ower
con
sum
pti
on (
kW
h)
Supermarket D
R value at 0.45shows fault operations
Skew data
Skew data
66 67 68 69 70 71 72 73 74 750
10
20
30
40
50
60
70
RT
U c
ompr
esso
r (k
Wh)
Zone air temperature (ZAT, oF)
Supermarket F
R value at 0.18shows faulty operations linear relation
RTU operations at OAT > 60oF
RTU operations at OAT > 70oF
simple linear regression (R = 0.18)
baseline power
World Academy of Science, Engineering and TechnologyInternational Journal of Civil, Environmental, Structural, Construction and Architectural Engineering Vol:8, No:12, 2014
1236International Scholarly and Scientific Research & Innovation 8(12) 2014 scholar.waset.org/1999.3/9999881
Inte
rnat
iona
l Sci
ence
Ind
ex, C
ivil
and
Env
iron
men
tal E
ngin
eeri
ng V
ol:8
, No:
12, 2
014
was
et.o
rg/P
ublic
atio
n/99
9988
1

Fig. 9 The plot between IARH and refrigeration compressor in
supermarket B
VI. CONCLUSION The study proposes the data analysis for supermarket field
tests obtained from BACnet protocol. The methodology is developed for investigating equipment operations through power consumption and measured variables without using fault-free data since laboratory data of a supermarket are cost-effective. Meanwhile, in a field test, common faults are gradually developing in routine operations due to improper commissioning, installations and preventive maintenances. Consequently, fault-free cannot be directly obtained from supermarket buildings. To overcome the barrier, Pearson’s correlation coefficient of typical interactions among HVAC and supermarket environment are evaluated based on theoretically normal operations of each equipment through the three measurements including OAT, IARH and ZAT. By using recommended R values in abnormal, acceptable and normal ranges, the three measurements are used as independent variables, whereas equipment power consumptions are dependent parameters. The examined R values of field test data with the level of significance at 0.05 are compared to the expected R values of each normal interaction. After the comparisons, simple faulty interactions can be identified when the investigated R values are out of the lower bound of the expected ranges. The operational condition of each machine will result in the overall performance of equipment in terms of increased power consumption.
Although energy interaction method cannot diagnose simultaneous faults, the proposed method can be used an easy-to-use tool to systematically examine equipment operations in commercial supermarkets. In addition, it can be applied to analyze the overall performance of model prediction by multiple linear regression analysis; the existing error of power consumption prediction on equipment could be occurred by existing developing or abrupt faults in routine operations.
REFERENCES [1] U.S. DOE, Office of Energy Efficiency and Renewable Energy
Buildings Energy. 2010.
[2] N. Rivers, Management of Energy Usage in Supermarket Refrigeration Systems, The Institute of Refrigeration. Session 2004-2005.
[3] D. Kosar, O. Dumitrescu, "Humidity Effects on Supermarket Refrigerated Case Energy Performance: A Database Review". ASHRAE Transactions. Vol. 111 (1), 2005.
[4] R.H. Howell and P. Adams, Effects of Indoor Space Conditions on Refrigerated Display Case Performance, Final Report for ASHRAE Project No. 596RP, 1991.
[5] H. Henderson and M. Khattar, "Measured impacts of Humidity level on defrost performance and refrigerating system energy use", ASHRAE Transactions, vol. 109(1), 1999.
[6] R. Farmarzi, R. Sweetser and R. Henninger, Investigation of relative humidity impacts on the performance and energy use of refrigerated display cases, Final Report GRI- 00/0084. 2000.
[7] D.R. Felts and P. Bailey, The State of Affairs - Packaged Cooling Equipment in California, 2000.
[8] D. Woradechjumroen, Y. Yu, H. Li, H. Yang H and D. Yu, "Analysis of HVAC system oversizing in commercial buildings through field measurements", Energy and Buildings, 69, pp. 131-143, 2014.
[9] H. Henderson. The Impact of Part Load Air Conditioner Operation on Dehumidification Performance: Validating a Latent Capacity Degradation Model, Presented at IAQ & Energy. New Orleans, LA, Oct. 1998.
[10] Navigant Consulting, Inc. Energy Savings Potential and R&D Opportunities for Commercial Refrigeration. Energy Efficiency and Renewable Energy. Building Technologies Program. U.S. Department of Energy. September 23, 2009.
[11] R. Taylor. "Interpretation of the correlation coefficient: A basic review," Journal of Diagnostic Medical Sonography. vol. 6 (1), pp. 35-39, Jan. 1990.
[12] A.G. Asuero, A. Sayago and A.G. Gonzalez. "The correlation coefficient: An overview," Critical Reviews in Analytical Chemistry, vol. 36, pp. 41–59, 2006.
[13] I.P. Levin, Statistical Tests for Relationships: Correlation and Regression, In Relating Statistics and Experimental Design, 1999, pp. 33-34.
Denchai Woradechjumroen is a Ph.D. candidate at Durham School of Architectural Engineering and Construction, University of Nebraska-Lincoln, Omaha USA. He obtained his B. Eng. and M. Eng. in Mechanical Engineering in 2005 and 2009, respectively, from Chulalongkorn University, Thailand. His research interests are low-cost, Plug-n-Play, Non-invasive Automated Monitoring, Control, Diagnostics, Optimization and Soft-repair of Building Energy Systems.
25 30 35 40 45 50 55 60 65 7010
15
20
25
30
35
40
Indoor air relative humidity (IARH, %)
Ref
rige
rati
on c
ompr
esso
r po
wer
con
sum
ptio
n (k
Wh)
Supermarket B
R value at 0.46shows acceptable operations simple linear regession
simple linear regression model
skew data between 45 and 55 %RH
due to OAT variation
World Academy of Science, Engineering and TechnologyInternational Journal of Civil, Environmental, Structural, Construction and Architectural Engineering Vol:8, No:12, 2014
1237International Scholarly and Scientific Research & Innovation 8(12) 2014 scholar.waset.org/1999.3/9999881
Inte
rnat
iona
l Sci
ence
Ind
ex, C
ivil
and
Env
iron
men
tal E
ngin
eeri
ng V
ol:8
, No:
12, 2
014
was
et.o
rg/P
ublic
atio
n/99
9988
1
Related Documents