Energy Information Administration NPC Demand Task Group June 8, 2010 John Maples U.S. Energy Information Administration Transportation Modeling

Energy Information Administration NPC Demand Task Group June 8, 2010 John Maples U.S. Energy Information Administration Transportation Modeling.
Dec 28, 2015
Welcome message from author
This document is posted to help you gain knowledge. Please leave a comment to let me know what you think about it! Share it to your friends and learn new things together.
Transcript
Energy Information Administration
NPC Demand Task GroupJune 8, 2010
John MaplesU.S. Energy Information Administration
Transportation Modeling

John Maples, NPC FTF Demand Task Group Meeting, June 8, 2010 2
Overview
• Transportation models• VISION• NEMS• Questions

John Maples, NPC FTF Demand Task Group Meeting, June 8, 2010 3
What service will the model perform?
• Analyze and develop input assumptions
• Develop and assess scenario analysis
• Project the impact of input assumptions
John Maples, NPC FTF Demand Task Group Meeting, June 8, 2010 4
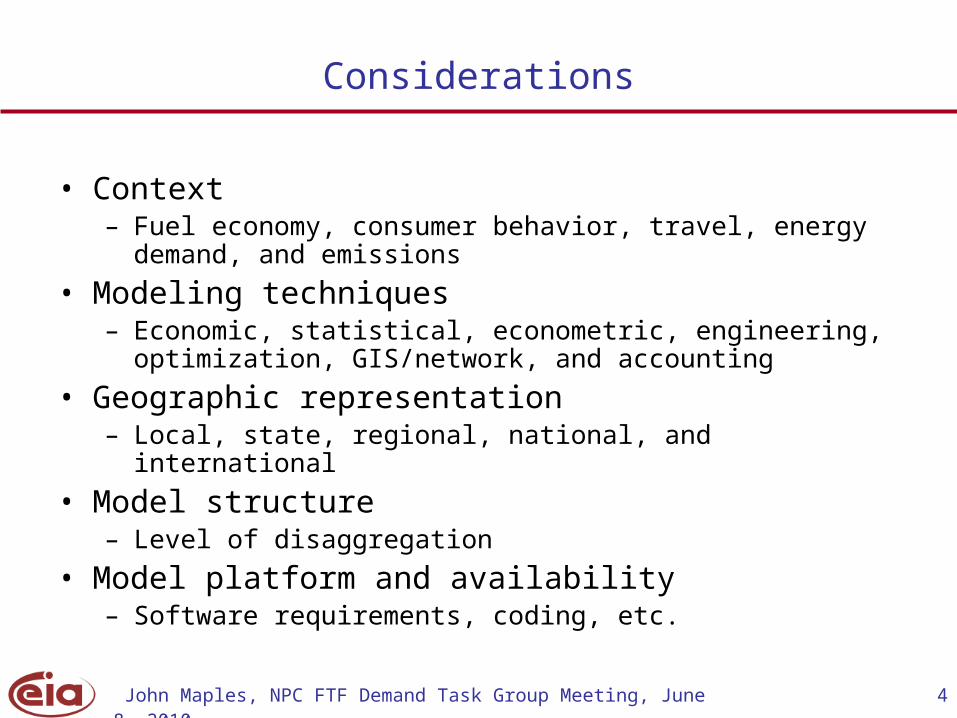
Considerations
• Context – Fuel economy, consumer behavior, travel, energy demand, and
emissions
• Modeling techniques– Economic, statistical, econometric, engineering, optimization,
GIS/network, and accounting
• Geographic representation– Local, state, regional, national, and international
• Model structure– Level of disaggregation
• Model platform and availability– Software requirements, coding, etc.

John Maples, NPC FTF Demand Task Group Meeting, June 8, 2010 5
Technology evaluation models
• Full System Simulation (FSS)– Engineering model– Subsystem/component analysis– Light, medium, and heavy vehicles– PSAT/AUTONOMIE, GT-Power, AMESIM
• Partial Discrete Approximation (PDA)– Mathematical simulation/engineering model– Subsystem/component analysis– Light, medium, and heavy vehicles– NEMS, EPA, and NHTSA

John Maples, NPC FTF Demand Task Group Meeting, June 8, 2010 6
Consumer Choice Models
• NEMS– Discrete choice nested multinomial logit (NMNL)
• Vehicle Type– Nests represent vehicles with similar attributes– Attributes (price, cost of driving, driving range, fuel availability, luggage space,
acceleration, maintenance cost, battery replacement cost, etc)• Fuel Economy Regulatory Analysis Model (FERAM)
– NMNL– Non-linear optimization– Nameplate representation
• Market Adoption of Advanced Automotive Technologies (MA3T)– 1,458 market segments– Regional specification (Census division, urban, suburban, rural)– Consumer groups (early adopter, early majority, late majority)– Distribution by daily VMT– Housing types and access to home refueling/recharging– Access to work recharging
John Maples, NPC FTF Demand Task Group Meeting, June 8, 2010 7
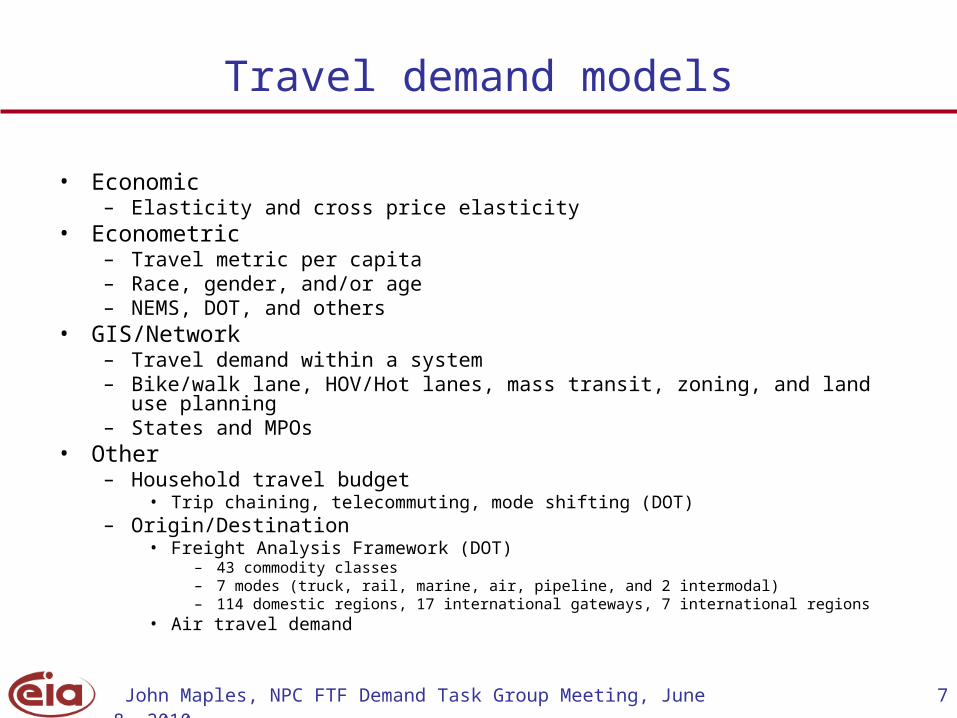
Travel demand models
• Economic– Elasticity and cross price elasticity
• Econometric– Travel metric per capita– Race, gender, and/or age– NEMS, DOT, and others
• GIS/Network– Travel demand within a system– Bike/walk lane, HOV/Hot lanes, mass transit, zoning, and land use planning– States and MPOs
• Other– Household travel budget
• Trip chaining, telecommuting, mode shifting (DOT)– Origin/Destination
• Freight Analysis Framework (DOT)– 43 commodity classes– 7 modes (truck, rail, marine, air, pipeline, and 2 intermodal)– 114 domestic regions, 17 international gateways, 7 international regions
• Air travel demand
John Maples, NPC FTF Demand Task Group Meeting, June 8, 2010 8
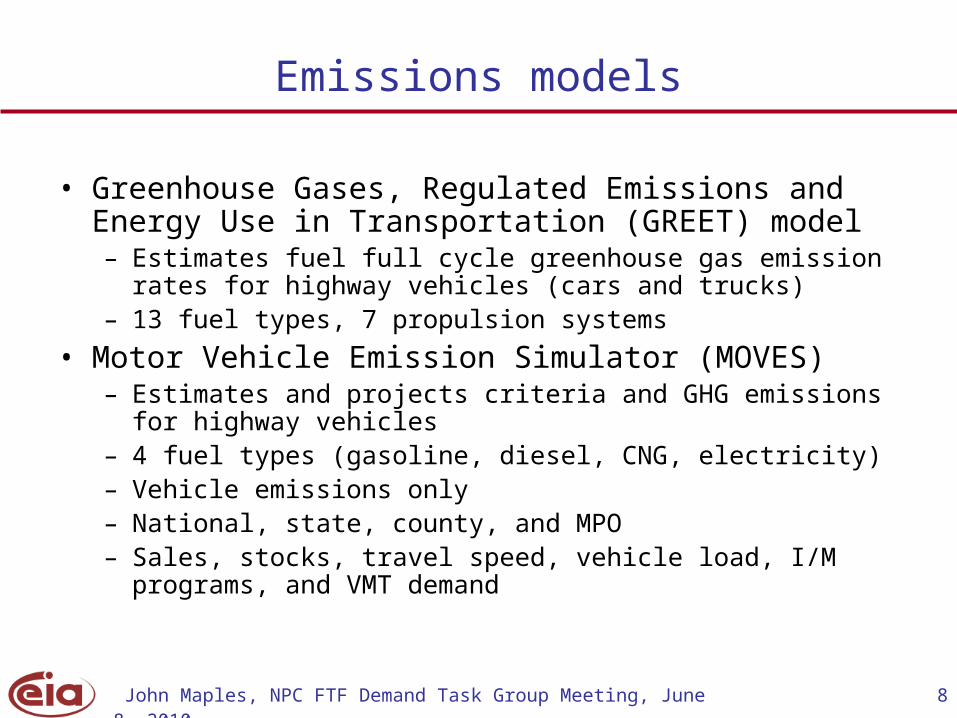
Emissions models
• Greenhouse Gases, Regulated Emissions and Energy Use in Transportation (GREET) model– Estimates fuel full cycle greenhouse gas emission rates for
highway vehicles (cars and trucks)– 13 fuel types, 7 propulsion systems
• Motor Vehicle Emission Simulator (MOVES)– Estimates and projects criteria and GHG emissions for highway
vehicles– 4 fuel types (gasoline, diesel, CNG, electricity)– Vehicle emissions only– National, state, county, and MPO– Sales, stocks, travel speed, vehicle load, I/M programs, and
VMT demand

John Maples, NPC FTF Demand Task Group Meeting, June 8, 2010 9
Energy systems models
• Projected impact– Captures agent behavior
• Travel demand, consumer behavior, supplier behavior, infrastructure constraints
– Complex and resource intensive– NEMS and MARKAL
• Scenario analysis– Accounting framework that captures impacts of
assumptions– Little (or no) internal feedback for agent behavior– Transparent and easily run– VISION and Mobility Model

John Maples, NPC FTF Demand Task Group Meeting, June 8, 2010 10
VISION Model
• Developed for DOE Office of Energy Efficiency and Renewable Energy and maintained by Argonne National Laboratory
• Model runs to 2100 and is calibrated to the latest AEO reference case (currently AEO2009)
• Assumption driven accounting model that measures energy and GHG emissions impacts of scenarios relative to a base case projection
• GHG coefficients represent full fuel cycle emissions and were developed using the GREET model
• Designed to provide quick turn around analyses of assumptions regarding increased fuel economy, advanced technology penetration, travel demand, and alternative fuel use for highway vehicles

John Maples, NPC FTF Demand Task Group Meeting, June 8, 2010 11
VISION light-duty vehicle parameters
• 11 vehicle technology types for cars and light trucks– Conventional gasoline, diesel, FFV, CNG, HEV (3), PHEV (2), BEV, and
FCV• Fuel options
– HEV: gasoline, diesel, E85 or hydrogen– PHEV: diesel and gasoline or E85 or hydrogen– FCV: gasoline, diesel, natural gas, E100, hydrogen, or methanol
• Market penetration of new vehicle sales by technology type• New vehicle fuel economy ratio relative to the base gasoline vehicle• New vehicle price ratio relative to the base gasoline vehicle• Light truck sales as a percent of total new LDV sales• Fuel use parameters
– FFV: percent of fuel demand met by E85– PHEV: all electric driving range – model calculates percent of annual
travel met in EV mode of operation
John Maples, NPC FTF Demand Task Group Meeting, June 8, 2010 12
VISION light-duty vehicle parameters (2)
• Travel demand– Exponential function (base or user defined)– User defined– Combination of exponential function and user
defined– AEO based growth rate

John Maples, NPC FTF Demand Task Group Meeting, June 8, 2010 13
VISION heavy-duty vehicle parameters
• Technology types– Class 3-6: gasoline, diesel, HEV diesel– Class 7&8 single unit: gasoline, diesel, diesel HEV– Class 7&8 combination: diesel
• New vehicle fuel economy relative to the base case
• Alternative fuel use: share F-T diesel, share bio-diesel
• Growth rate in vehicle miles traveled
John Maples, NPC FTF Demand Task Group Meeting, June 8, 2010 14
VISION fuel parameters
• Fuel prices– Gasoline, diesel, natural gas, E85, hydrogen, F-T diesel, bio-
diesel, methanol, electricity • Fuel blending
– Share of ethanol in gasoline – Share of F-T diesel– Share of Bio-diesel
• Other fuel parameters – Ethanol feedstock (corn, corn stover, switchgrass, woody
biomass, and forest residue)– Hydrogen production
• At station: natural gas, electrolysis• Central: natural gas, electrolysis, coal (with sequestration), high
temperature electrolysis, biomass, solar, and thermo-chemical– Utility Mix (coal, natural gas, petroleum, nuclear, renewables)

John Maples, NPC FTF Demand Task Group Meeting, June 8, 2010 15
VISION output
• Energy use by vehicle type by fuel type
• Percent reduction in oil use
• Full fuel cycle carbon and GHG (CO2 equivalent) emissions
• Vehicle and fuel expenditures
• All metrics provided with a comparison to the base case

John Maples, NPC FTF Demand Task Group Meeting, June 8, 2010 16
National Energy Modeling System (NEMS)
Integrating
Module
Oil and Gas
Supply
Module
Natural GasTransmission and
DistributionModule
Coal
Market
Module
Renewable
Fuels
Module
Electricity
Market
Module
Residential
Demand
Module
Commercial
Demand
Module
Transportation
Demand
Module
Industrial
Demand
Module
Petroleum
Market
Module
Macroeconomic
Activity
Module
International
Energy
Module
Supply Components Conversion Components Demand Components
John Maples, NPC FTF Demand Task Group Meeting, June 8, 2010 17
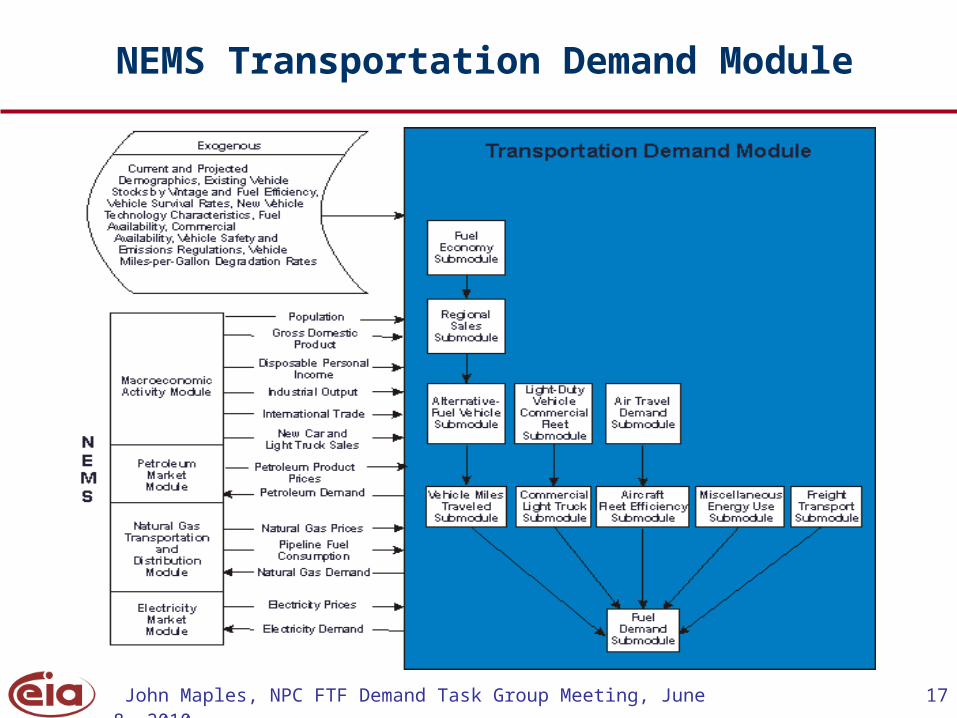
NEMS Transportation Demand Module
John Maples, NPC FTF Demand Task Group Meeting, June 8, 2010 18
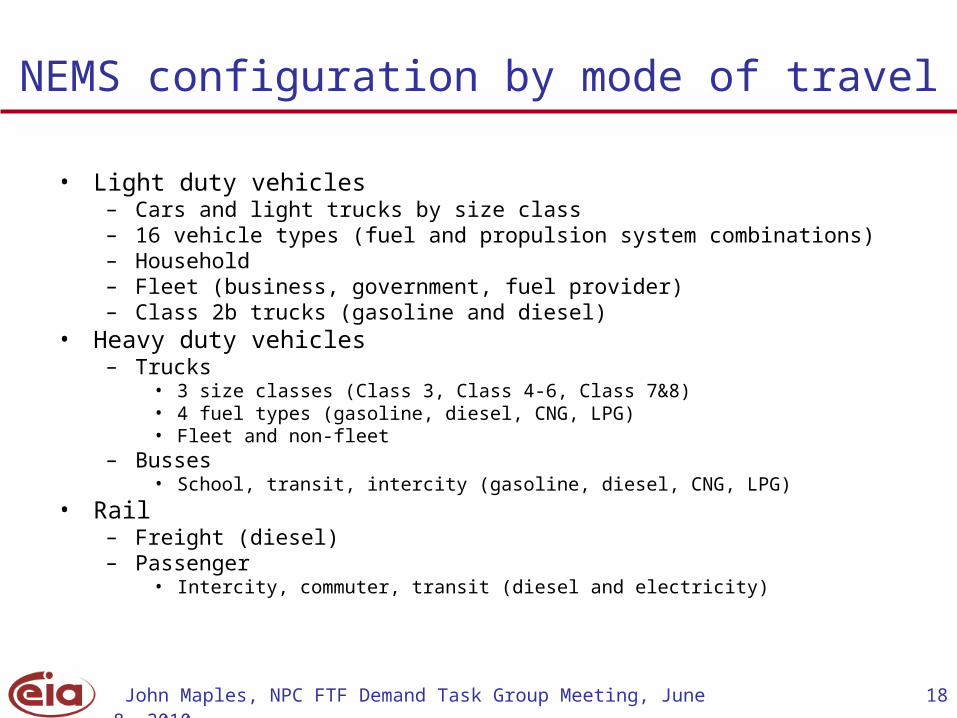
NEMS configuration by mode of travel
• Light duty vehicles– Cars and light trucks by size class– 16 vehicle types (fuel and propulsion system combinations)– Household– Fleet (business, government, fuel provider)– Class 2b trucks (gasoline and diesel)
• Heavy duty vehicles– Trucks
• 3 size classes (Class 3, Class 4-6, Class 7&8)• 4 fuel types (gasoline, diesel, CNG, LPG)• Fleet and non-fleet
– Busses• School, transit, intercity (gasoline, diesel, CNG, LPG)
• Rail– Freight (diesel)– Passenger
• Intercity, commuter, transit (diesel and electricity)

John Maples, NPC FTF Demand Task Group Meeting, June 8, 2010 19
NEMS configuration by mode of travel (con’t)
• Aircraft– 3 size classes (regional, narrow body, and wide body)– Passenger and freight– Domestic, US origin/destination international, general
aviation, non-US – Jet fuel, gasoline
• Marine– Freight
• Domestic and International (diesel and residual)– Recreational (gasoline and diesel)
• Pipeline• Military (jet fuel, diesel, residual)

John Maples, NPC FTF Demand Task Group Meeting, June 8, 2010 20
NEMS LDV travel demand
• Household vehicles– Econometric forecast based on cost of driving,
disposable income, population growth
• Fleet vehicles– Travel static per vehicle by fleet and vehicle type
• Commercial light trucks– Travel forecast based on personal travel and output
growth from 5 industrial sectors (agriculture, mining, construction, utility, and manufacturing)

John Maples, NPC FTF Demand Task Group Meeting, June 8, 2010 21
NEMS freight travel demand
• Truck, rail, and marine travel demand based on industrial output from 10 aggregate sectors: chemicals, primary metals, processed food, paper products, petroleum products, stone/concrete, metal durables, other manufacturing, agriculture, and mining Truck VMT based on industrial output from 12 sectors
• Truck travel also captures growth in government and utility sectors• Rail travel also includes coal production• Truck travel measured in VMT, while rail and marine are measured
in ton-miles• For all freight modes, freight allocation coefficients (FACs) used to
capture relationship between travel demand and industrial output• Mode choice is not explicitly model
– Mode shifts occur as industrial output changes over time
John Maples, NPC FTF Demand Task Group Meeting, June 8, 2010 22
NEMS air travel demand
• Passenger travel modeled by aircraft size class and based on population growth, disposable income, and ticket price (yield)
• Domestic ton-mile travel based on value of merchandise imports and exports
• Maximum potential travel limited by infrastructure growth
John Maples, NPC FTF Demand Task Group Meeting, June 8, 2010 23
NEMS light duty vehicle technology adoption
• Models manufacturer and consumer behavior– 9 manufacturer groups and 12 market segments
• Manufacturers build 16 vehicle types based on cost effectiveness of 63 subsystem technologies– 8 fuel types and 6 propulsion systems– 3 year payback at 15 percent– Technology attributes include cost, fuel economy improvement,
horsepower adjustment, and weight adjustment• Captures engineering relationships and constraints
– Technology based: co-related, synergistic, supercedes, mandated– Minimum and maximum horsepower
• Technology learning captured for advanced technologies (including batteries)– Probability of R&D success– Increased production (economies of scale)– Design cycle (cumulative production)

John Maples, NPC FTF Demand Task Group Meeting, June 8, 2010 24
Policy impacts on fuel economy
Model designed to capture effects of fuel economy policy
• Iterates around technology adoption and consumer preference to solve CAFE compliance– Modifies vehicle attributes once all technology options have
been exhausted• Captures impact of fuel economy credits provided for
alternative fuel vehicles• Captures impact of CAFE credits banked for over
compliance or spent for under compliance• Policies implemented to incentivize sales of advanced
technology or alternative fuel vehicles have marginal impacts on projected fuel economy
John Maples, NPC FTF Demand Task Group Meeting, June 8, 2010 25
NEMS heavy duty vehicle technology adoption
• Economic decision to adopt fuel economy technology based on initial cost versus expected fuel savings– Distribution of 4 payback periods (1 to 4 years) that varies by technology– Discount rate of 10 percent– Rate of adoption based on logistic curve derived from historic data
• Technology adoption calculated for 24 market segments– Fleet type, fuel type, and size class
• 37 technologies by size class– Technologies represent fuel economy improvement and emission
control• Captures engineering relationships and constraints
– Technology based: co-related, synergistic, supercedes, mandated– Emission control technologies are mandated but compete on cost
• Does not currently model fuel economy standards
John Maples, NPC FTF Demand Task Group Meeting, June 8, 2010 26
Stock models
• Light duty vehicles represented by 20 year vintage model
• Heavy duty vehicles represented by a 37 year vintage model– Bus stocks not modeled
• Aircraft represented by a 45 year vintage model– Algorithm also parks and transfers aircraft to other
markets• Older aircraft transferred to cargo movement or passenger
travel in developing countries
• Rail and marine equipment stocks not modeled

John Maples, NPC FTF Demand Task Group Meeting, June 8, 2010 27
Hydrogen modeling in NEMS
• Analyzes interactions of hydrogen market with other energy markets– Focus on the economic, not engineering, aspects of
hydrogen production, delivery, and consumption• Hydrogen represent in 3 market segments within
the 9 Census Divisions– Large city, small city, and rural
• In the Hydrogen Market Module (HMM) supply options compete on delivered cost in each market– Multiple production and deliver pathways
• Central, city-gate, and forecourt

John Maples, NPC FTF Demand Task Group Meeting, June 8, 2010 28
John Maples
202-586-1757
VISION:
http://www.transportation.anl.gov/modeling_simulation/VISION/
NEMS:
http://www.eia.doe.gov/oiaf/aeo/overview/
Thank you
U.S. Energy Information Administration
www.eia.gov
Related Documents