June 2013 Industry Analysis & Competitive Strategy Industry Analysis

Welcome message from author
This document is posted to help you gain knowledge. Please leave a comment to let me know what you think about it! Share it to your friends and learn new things together.
Transcript

June 2013
Industry Analysis &
Competitive Strategy
Industry Analysis

IMPACT Consulting Project
Industry Analysis & Competitive Strategy
2
IMPACT Consulting Project
June 2013
Industry Analysis &
Competitive Strategy
Report
Taposh Dutta Roy & Team

IMPACT Consulting Project
Industry Analysis & Competitive Strategy
3
Preface
Resource consumption and conservation is a hot topic within California. Over the past 30 years, California has taken a proactive approach in energy conversation efforts and continues to be a catalyst for change throughout the world. These opportunities have brought businesses such as Resource Solutions Group, based in Half Moon Bay, to help drive this transformation. The challenge the team was posed with was what direction Resource Solutions Group (RSG) should take in order to achieve internal growth objectives over the next 3-5 years. We would like to thank the team at Resource Solutions Group for their time and involvement throughout this project. Thank you to James Lui and Alison ten Cate for providing support and guidance within the RSG environment as the project sponsors. We are grateful for the input of numerous RSG associates including Laura Kimes, LeAndra MacDonald, and Paul Kyllo. The team appreciates the guidance of our academic advisor Marc Lowe who drove us to perform at the top-level standards that the UC Davis GSM depicts. This report contributes to RSG’s mission to change the way people use energy through awareness, action and sustainability. We would like to emphasize that this work is independent and has been prepared for RSG’s sole discretion.
Taposh Dutta Roy & Team

IMPACT Consulting Project
Industry Analysis & Competitive Strategy
4
Table of Contents
Executive Summary .............................................................................................................................. 6
Competition Analysis .................................................................................................................................... 7
Industry Analysis ........................................................................................................................................... 7
Schools .................................................................................................................................................... 10
Strategic Suggestions .................................................................................................................................. 10
Industry Background ................................................................................................................................... 10
Budget Considerations ................................................................................................................................ 11
Clean Energy Jobs Act (Proposition 39) ...................................................................................................... 11
Industry Competition .................................................................................................................................. 11
Direct Install Hurdles ................................................................................................................................... 12
Analytical Approach .................................................................................................................................... 12
Assumptions ................................................................................................................................................ 12
Highest proposition 39 funds per high school district based number of schools .................................... 13
Highest proposition 39 allocation per high school based on enrollment ................................................ 13
Summary of Recommendations .................................................................................................................. 14
Wineries ................................................................................................................................................. 16
Strategic Suggestions .................................................................................................................................. 16
Continue WIES Rebate Program.............................................................................................................. 16
Market Water Efficiency ......................................................................................................................... 17
Incorporate “Conservation” into Marketing Strategy ............................................................................. 18
Emphasize Refrigeration and Pumping ................................................................................................... 19
Target Most Profitable Wine Regions ..................................................................................................... 19
Summary of Recommendations .................................................................................................................. 20
Dairies ..................................................................................................................................................... 21
Strategic Suggestions .................................................................................................................................. 22
The Dairy Industry ....................................................................................................................................... 22
Dairy Product Manufacturing ..................................................................................................................... 24
U.S. Dairy Exportation ................................................................................................................................. 24
California Agriculture Energy Efficiency ...................................................................................................... 26
California Dairy Farms ................................................................................................................................. 26
Tulare County .......................................................................................................................................... 27
Merced County ........................................................................................................................................ 27
Kern County ............................................................................................................................................. 27
Dairy Product Manufacturing ..................................................................................................................... 27
Summary of Recommendations .................................................................................................................. 28
Competitive Strategy .......................................................................................................................... 29

IMPACT Consulting Project
Industry Analysis & Competitive Strategy
5
Summary ..................................................................................................................................................... 30
Key Players .................................................................................................................................................. 30
Approach for Competitive Strategy ............................................................................................................ 30
Analysis ....................................................................................................................................................... 31
IOU Specific Information ......................................................................................................................... 31
CLEAResult Subsidiary & Direct to customer companies ........................................................................ 31
Investor Owned Utilities ............................................................................................................................. 32
Pacific Gas & Electric (PG&E) .................................................................................................................. 32
Southern California Edison (SCE) ............................................................................................................. 33
Southern California Gas (SCG) ................................................................................................................. 35
San Diego Gas and Electric (SDGE) .......................................................................................................... 36
IOU Industry Analysis .................................................................................................................................. 37
Commercial Sector .................................................................................................................................. 38
Industrial Sector ...................................................................................................................................... 40
Agriculture Sector.................................................................................................................................... 41
Energy Performance Analysis .................................................................................................................. 42
IOU Markets ................................................................................................................................................ 43
Overall Analysis ....................................................................................................................................... 44
Direct to customers (D2C) Companies ........................................................................................................ 47
Appendix (Dairy Exhibits) ............................................................................................................... 54

IMPACT Consulting Project
Industry Analysis & Competitive Strategy
6
Executive Summary
The reality of the situation is that there are a finite amount of resources on this planet. Over the recent past, the usage of these resources have exponentially increased due to population growth and the evolution of technology within the human race. Right now is a critical time in our history as a human race in whether we will be able to gain a handle on our resource usage and right the path to allow future generations to press on. Locally here in California, leading initiatives are focused on answering these questions of how to incorporate and use fewer resources while operating within the capitalist structure. This in turn presents business opportunities for companies such as Resource Solutions Group (RSG). RSG, a California based company and subsidiary of CLEAResult, focuses on integrating awareness, action and sustainability into how people use energy and allowing for strategic goals to be achieved while protecting the environment. RSG operates in a highly competitive and challenging market that is at the cross roads of government, energy, and private industry. Not only is RSG challenged with competing within this market; there are also internal goals to grow the business for the future amongst the CLEAResult family. This report seeks to understand the competition within the current environment that RSG operates within, identify specific divisions and provide suggested strategic business approaches that would guide RSG towards achieving their internal goals. Two key areas provide the focus of this paper.
IMPACT Consulting Project
Industry Analysis & Competitive Strategy
7
Competition Analysis
Competition within California encompasses the four Investor Owned Utilities (IOU’s - PG&E, SCE, SCG, SDG&E) along with numerous “third party” (3P) and direct install companies (DI). All compete for customers who are investing in resource projects funded from either in-house funding or state rebate and grant programs. Research was performed to identify current competitor performance, strategic competitive advantages, possible new markets to enter, and possible partnership opportunities. An analysis of Direct to Customer (D2C) companies with insights in to the new and up-coming trends was analyzed. A review of all third party subsidiaries of CLEAResult and a chart detailing the core areas of the subsidiaries is provided.
Industry Analysis
Commercial, residential, industrial, and agricultural comprise the four major industries that are served within the CA resource programs. Within these four industries, two were identified as target markets. The schools sector within commercial and dairies and wineries within agricultural posed the best opportunities allow RSG to achieve internal targets. This report dives into the approach that RSG should take with the upcoming Prop 39 flux of funding from the school sector and what type of business approach is preferred. Within the agricultural branch, dairies and wineries were two areas of focus. The dairy sector within CA is a $7 billion dollar industry where RSG currently operates with limited competition; however, this is due to low opportunities to incorporate resource conversation efforts. Within the CA dairy sector, the report outlines potential avenues for RSG to continue to capture business and drive growth. Wineries provide a potential nexus for energy and water projects to be implemented; however, financial hurdles prevent competition and implementation from occurring. Environmentally minded consumers are driving these changes and given the right approach there are possibilities for RSG to continue to capitalize on within this market.

IMPACT Consulting Project
Industry Analysis & Competitive Strategy
8
Recommendation
The report goes into details of the final recommendations in each section. High-level final recommendations provided to RSG are:
1. Focus in Schools and transition to Direct to Customers (D2C) servicing.
2. Complement IOU programs with D2C in Wineries. 3. Complement Dairy Farming with Food
Processing/Manufacturing

IMPACT Consulting Project
Industry Analysis & Competitive Strategy
9
“2010-2012 Cycle had a budget of
$54 Million for schools”
“Clean Energy Jobs Act Proposition 39 additionally promises new funding for
schools”
“~500 Million expected funding per year in schools”

IMPACT Consulting Project
Industry Analysis & Competitive Strategy
10
Schools
RSG’s experience in the school industry and the potential growth makes for an appealing
strategic focus. Nearly 20% of California school districts are currently served by RSG, which leaves a
potential market of over 800 school districts. California is the nation’s most active state in pushing
schools to be more energy efficient. The California Public Utility Commission (CPUC) mandated that by
2012 all public schools have energy audits complete, by 2020 all new buildings have “net zero” energy
use, and by 2030 50% of existing buildings have “net zero” energy use1. The projected budget and
potential revenue stream from the school industry were the key factors in determining where RSG
should allocate resources to maximize growth over a three to five year period.
Strategic Suggestions The following strategic suggestions are based on research of the school industry and analysis of the data
collected:
1. Continue to maintain a presence in the school industry.
2. Transition to a direct-to-customer (D2C) model.
3. Acquire direct install capability.
4. Target schools based on key qualitative identifiers.
The services most relevant to this industry are: marketing, master energy planning, audits/evaluations,
and direct install of HVAC and lighting measures. This recommendation comes from positive data in the
following decision factors:
New Legislature
Industry Experience
Increasing 2013-2014 Budget
Energy Efficiency in kwh/$ spent
Industry Background There are over ten thousand schools in California and nearly 70%
are over 25 years old. The average public school building is forty-
two years old2. These buildings use about 10 kWh of electricity and
1 “Energy Efficiency Strategic Plan.” Web. 17 April 13. http://www.cpuc.ca.gov/PUC/energy/Energy+Efficiency/eesp> 2 “About California Senate Bill 39.” Web. 01 May 13. http://sb39advancecalifornia.org/about/sb39>
Exhibit 1:

IMPACT Consulting Project
Industry Analysis & Competitive Strategy
11
-
1.00
2.00
3.00Exhibit 3 - 2010-12 PG&E and SCE Rate (kw saved / $ spent)
50 cubic feet of natural gas per square foot annually, or roughly $1.25/square foot annually.
Exhibit 1 shows the average K-12 electricity usage. The majority of costs are associated with lighting and
cooling. While about 2.2% of the $68 billion dollar annual budget is spent on energy expenditures this
small percentage adds up to a large number in the bigger school districts.
Budget Considerations The commercial industry 2010-2012 IOU budget accounts for $272 million dollars. Schools account for
approximately 20% of this, or just under $54 million dollars. This is an appealing segment as the data
forecasts suggest a growth of 22% to $66 million in 2013-2014.3
Clean Energy Jobs Act (Proposition 39) By closing an out of state corporate tax loop hole, the Clean Energy Jobs Act (prop. 39) will bring $2.5
billion dollars to state schools over the next 5 years4. The exact details of allocation are undecided at the
date of this report, but it’s likely to get allocated to schools based on Governor Brown’s student
population rate rather than the senate’s needy schools first approach. This infusion of cash is yet
another reason why the school industry is critical
to RSG’s growth over the next three to five years.
Industry Competition With the increased funding comes the increased
threat of competition. Many current firms in the
market are positioned well to take advantage of
the new money coming into the industry. The
three main competitors are identified in exhibit 2.
The largest of these
competitors, Matrix Energy
Services, has programs in the
three largest IOUs and a total
2010-2012 budget of $30
million dollars across seven
programs. Compare that to
Trane, essentially a large
HVAC company that has 4
programs across PG&E and
SCE with a total budget of just
over $10 million. LIIF, or low-
3 “School Energy Facts.” Touchstone Energy Cooperatives Web. 05 May 13. <http://www.schoolenergysaving.com/schoolEnergyFacts.php> 4 “What is Prop 39.” Clean Energy Jobs Act. Web. 15 May 13. <http://www.cleanenergyjobsact.com/the-facts>
Exhibit 2 – School Industry Competition

IMPACT Consulting Project
Industry Analysis & Competitive Strategy
12
income investment fund, mainly targets
California preschools with their CPEEP
program.
Comparing the PG&E and Southern California
Edison kWh saved to dollar spent, we begin to
uncover some of the efficiencies these end-
to-end firms are able to realize. Exhibit 3
shows the Matrix and LIIF at approximately
2.3 kWh saved per dollar spent while RSG is
less than 1.55. Because other firms have the
direct installation in-house, without the need
to sub-contract, their kWh per dollar spent is
higher. The average effectiveness rate across the commercial industry is 2 kWh per dollar spent. One
observation to note is that this data includes natural gas expenditures without including the benefit but
the trend is still present. Exhibit 4 suggests that firms with the direct install capability are able to more
effectively utilize the money allocated to the program.
Direct Install Hurdles Using the budget as evidence we can see there is a high cost to participate in direct installations. RSG
will also have to deal with unions and prevailing wages. Along with this, often times the work cannot be
sub-contracted. In some scenarios, additional plans are required (haz-waste, safety, environmental).
While there is a high cost associated with going after the low hanging fruit, the opportunity to get in the
door and expand the services offered outweighs the initial financial investment.
Analytical Approach Using information obtained through the California Department of Education6 combined with US tax and
census data7; the team was able to compile lists of ideal schools for RSG to target. The data can be
filtered by enrollment, location, district, age, income, school type, and many more. From this we began
to develop an analytical framework for which schools, based on Proposition 39 allocation, would be
ideal candidates for energy efficiency measures. This allows RSG to choose the most appealing schools
to spend their resources on.
Assumptions Because the exact allocation method and vehicle for proposition 39 funds is still to be determined we
used conservative estimates based on the time of this report. Under Governor Brown’s approach, we
5 “Energy Efficiency Groupware Application.” California Public Utility Comission. Web. 1 June 13. <http://eega.cpuc.ca.gov/Documents.aspx> 6 “Public Schools Database.” California Department of Education. Web. 1 June 13. <http://www.cde.ca.gov/ds/si/ds/pubschls.asp> 7 “2011 Report - Individual Master File, Statistics of Income.”IRS.gov. 1 June 13.
Exhibit 4 – Comparison of Services Provided

IMPACT Consulting Project
Industry Analysis & Competitive Strategy
13
estimated $350 million dollars per year would be allocated to the 6.2 million students across California
public schools. This resulted in an estimate of $56 per student.
Highest proposition 39 funds per high school district based number of schools
High schools are a prime target for proposition 39 funds because they are larger facilities, usually with
many extracurricular buildings (pools, gymnasiums, etc.). This affords more energy savings
opportunities. Along with this, there are fewer per district, thus more allocated money. We can see from
the data below that Los Angeles Unified (the largest in the state) is receiving the majority of funds,
followed by Kern Union and San Diego.
Highest proposition 39 allocation per high school based on enrollment
Below we can see that both high population and low number of schools within a district are equally
important identifiers for proposition 39 funds. Arcadia Unified has one high school in the district with an
enrollment of over 3500 students.
District
Average of Zip
Code Average
Income
Sum of
Enrollment
Total Possible
Prop 39 Dollars
($/#Students)
Funding
allocated per
school (district
specific)
High Schools in
District
Los Angeles Unified 28,343$ 187,857 35,348,599$ 155,037.72$ 228
Kern Union High 26,269$ 37,070 6,975,373$ 279,014.91$ 25
San Diego Unified 42,311$ 36,040 6,781,560$ 178,462.11$ 38
Sweetwater Union High 24,738$ 28,832 5,425,248$ 319,132.24$ 17
Long Beach Unified 27,050$ 26,152 4,920,959$ 447,359.90$ 11
East Side Union High 29,888$ 25,918 4,876,928$ 232,234.65$ 21
Chaffey Joint Union High 27,374$ 24,962 4,697,039$ 427,003.58$ 11
Antelope Valley Union High 25,840$ 24,769 4,660,723$ 310,714.87$ 15
Anaheim Union High 26,357$ 22,078 4,154,364$ 319,566.47$ 13
Fresno Unified 25,528$ 21,079 3,966,385$ 198,319.23$ 20
District
Average of Zip
Code Average
Income
Sum of
Enrollment
Total Possible
Prop 39 Dollars
($/#Students)
Funding
allocated per
school (district
specific)
High Schools in
District
Arcadia Unified 38,567$ 3,514 661,221$ 661,220.92$ 1
Walnut Valley Unified 35,419$ 5,917 1,113,388$ 556,693.82$ 2
Downey Unified 29,020$ 8,426 1,585,500$ 528,500.04$ 3
Manhattan Beach Unified 114,090$ 2,456 462,140$ 462,139.61$ 1
Temecula Valley Unified 34,038$ 9,739 1,832,564$ 458,141.04$ 4
Long Beach Unified 27,050$ 26,152 4,920,959$ 447,359.90$ 11
Chaffey Joint Union High 27,374$ 24,962 4,697,039$ 427,003.58$ 11
La Canada Unified 109,907$ 2,146 403,808$ 403,807.65$ 1
Fremont Union High 57,097$ 10,629 2,000,033$ 400,006.67$ 5
Temple City Unified 27,426$ 2,039 383,674$ 383,673.72$ 1
Exhibit 5 – Proposition 39 Funds
allocated by number of schools
Exhibit 6 – Proposition 39 Funds
allocated by enrollment

IMPACT Consulting Project
Industry Analysis & Competitive Strategy
14
One additional consideration to take into account is where RSG has resources to perform the work. The
approach could be to target local schools and begin to grow organically.
Summary of Recommendations Many of the desired services for this industry are already within RSG’s core competencies and when
looking at the competitors the gap is clear. In order for RSG to best position itself to take advantage of
the increased funding in the school industry, the budget, competition, and kWh per dollar spent data
suggests a transition to direct-to-customer and direct install capabilities over the next two years. This
should be a focused effort based on the data provided above. Schools will continue to be a large
revenue stream and source of growth for RSG and with the recommendations provided RSG will
enhance their ability to serve this market.

IMPACT Consulting Project
Industry Analysis & Competitive Strategy
15
“Budget was increased +200% during 2010-12 IOU cycle”
“Only company currently active in the Wineries Market
“Should Market Water-Efficiency Programs to get a foot
in the door”

IMPACT Consulting Project
Industry Analysis & Competitive Strategy
16
Wineries
RSG’s experience in the wine industry, as well as the industry’s financial strength, point to continued
economic opportunities for RSG in this customer segment. The majority of wineries report they are in a
strong financial position, especially wineries producing more than 50,000 cases annually. Trends show
an increasing demand for wine produced in California. In addition, the vast majority of wineries lack a
comprehensive, quantitative understanding of their water and energy use.
Strategic Suggestions Continue WIES Rebate Program
Market Water Efficiency
Incorporate “Conservation” into Marketing Strategy
Emphasize Refrigeration and Pumping
Target Most Profitable Wine Regions
Continue WIES Rebate Program
RSG currently has no competitors in the wine industry among IOU rebate programs in California. The
fact RSG has completely cornered the market since 2006 indicates a positive track record among IOUs
and RSG should continue marketing the WIES program.
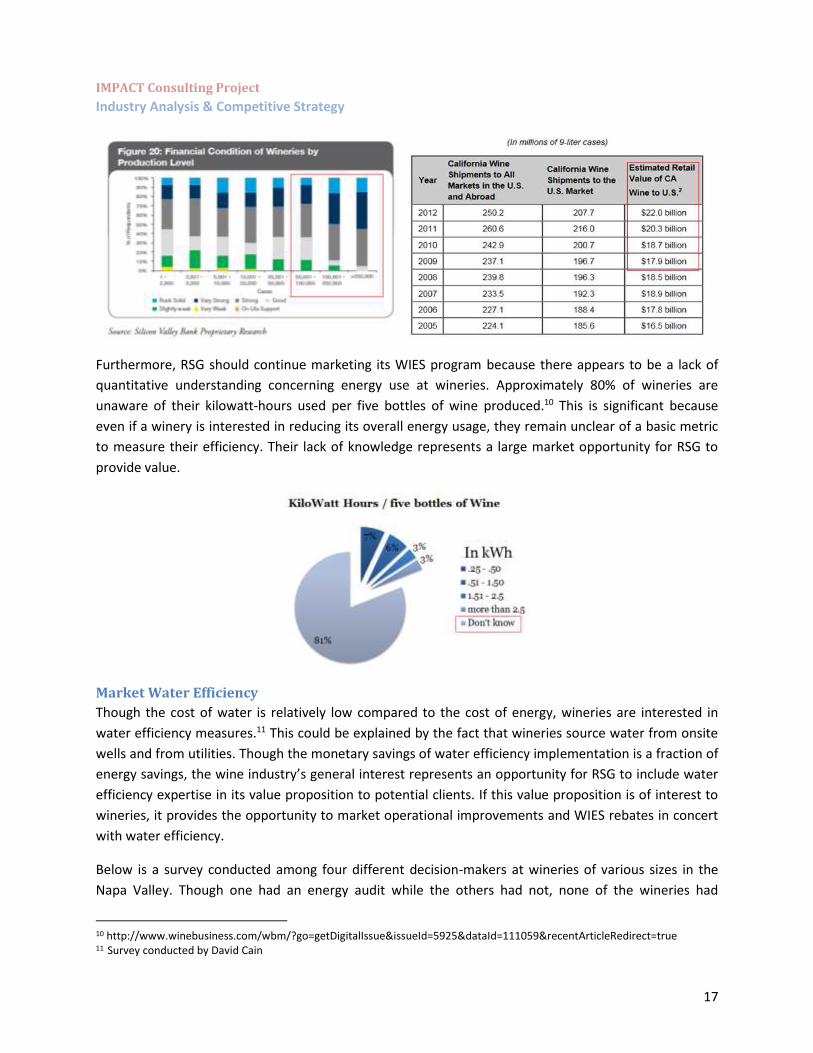
Similarly, the growth and financial strength of the wine industry signal the economic wherewithal
wineries currently possess to begin equipment upgrades in the immediate and short-term. More than
60% of wineries producing between 50,000 and 100,000 cases annually report having either a “Strong,”
“Very Strong,” or “Rock Solid” financial position. Approximately 90% of wineries producing between
100,000 and 250,000 cases and 95% of wineries producing above 250,000 cases report their financial
condition is “Strong, “Very Strong,” or “Rock Solid.”8 Trends also indicate California wine sales have and
continue to achieve growth. From 2009 to 2012, the estimated retail value of California wine increased
4.5%, 8.6%, and 8.4% respectively. It is interesting to note that even though California shipped 10 million
less cases in 2012 compared to the previous year, retail value still increased $1.7 billion.9
8 http://www.svb.com/wine-report/ 9 http://www.wineinstitute.org/resources/statistics/article697
IMPACT Consulting Project
Industry Analysis & Competitive Strategy
17
Furthermore, RSG should continue marketing its WIES program because there appears to be a lack of
quantitative understanding concerning energy use at wineries. Approximately 80% of wineries are
unaware of their kilowatt-hours used per five bottles of wine produced.10 This is significant because
even if a winery is interested in reducing its overall energy usage, they remain unclear of a basic metric
to measure their efficiency. Their lack of knowledge represents a large market opportunity for RSG to
provide value.
Market Water Efficiency
Though the cost of water is relatively low compared to the cost of energy, wineries are interested in
water efficiency measures.11 This could be explained by the fact that wineries source water from onsite
wells and from utilities. Though the monetary savings of water efficiency implementation is a fraction of
energy savings, the wine industry’s general interest represents an opportunity for RSG to include water
efficiency expertise in its value proposition to potential clients. If this value proposition is of interest to
wineries, it provides the opportunity to market operational improvements and WIES rebates in concert
with water efficiency.
Below is a survey conducted among four different decision-makers at wineries of various sizes in the
Napa Valley. Though one had an energy audit while the others had not, none of the wineries had
10 http://www.winebusiness.com/wbm/?go=getDigitalIssue&issueId=5925&dataId=111059&recentArticleRedirect=true 11 Survey conducted by David Cain

IMPACT Consulting Project
Industry Analysis & Competitive Strategy
18
undergone a water audit and all of them are interested in having one. Such evidence suggests RSG could
win clients by marketing water efficiency as part of an overall efficiency package.
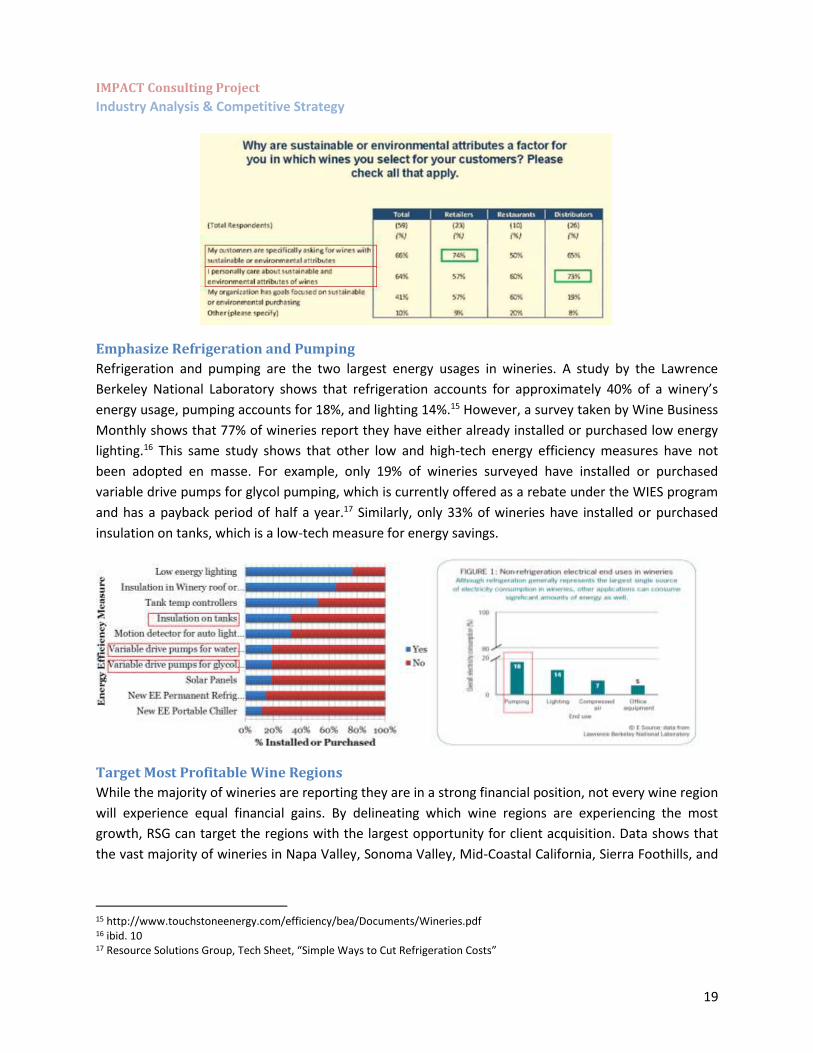
Incorporate “Conservation” into Marketing Strategy
Evidence suggests that empasizing “conservation” and “environmental-friendliness” in RSG’s marketing
plan will generate a greater level of interest among wineries. A survey conducted by Wine Business
Monthly reports that among wineries monitoring energy and water usage, not only is “conservation” a
greater motivator than “compliance,” but 75% of these wineries include “conservation” as a factor to
monitor usage.12 Similarly, there is a push by individual customers, retailers, distributors, and
restaurants for more environmentally-friendly produced wine. Environmetal attributes are taken into
account by retailers 86% of the time.13 This is evidenced by the fact that 74% of retailers report their
customers are asking for wines with sustainable or environmental attributes.14 RSG should communicate
the message that wineries will not only save money by implementing energy and water efficiency
measures, but there will be greater demand for their wine if such measures are implemented.
12 ibid. 10 13 ibid. 14 ibid.
IMPACT Consulting Project
Industry Analysis & Competitive Strategy
19
Emphasize Refrigeration and Pumping
Refrigeration and pumping are the two largest energy usages in wineries. A study by the Lawrence
Berkeley National Laboratory shows that refrigeration accounts for approximately 40% of a winery’s
energy usage, pumping accounts for 18%, and lighting 14%.15 However, a survey taken by Wine Business
Monthly shows that 77% of wineries report they have either already installed or purchased low energy
lighting.16 This same study shows that other low and high-tech energy efficiency measures have not
been adopted en masse. For example, only 19% of wineries surveyed have installed or purchased
variable drive pumps for glycol pumping, which is currently offered as a rebate under the WIES program
and has a payback period of half a year.17 Similarly, only 33% of wineries have installed or purchased
insulation on tanks, which is a low-tech measure for energy savings.
Target Most Profitable Wine Regions
While the majority of wineries are reporting they are in a strong financial position, not every wine region
will experience equal financial gains. By delineating which wine regions are experiencing the most
growth, RSG can target the regions with the largest opportunity for client acquisition. Data shows that
the vast majority of wineries in Napa Valley, Sonoma Valley, Mid-Coastal California, Sierra Foothills, and
15 http://www.touchstoneenergy.com/efficiency/bea/Documents/Wineries.pdf 16 ibid. 10 17 Resource Solutions Group, Tech Sheet, “Simple Ways to Cut Refrigeration Costs”

IMPACT Consulting Project
Industry Analysis & Competitive Strategy
20
Lake County are either increasing prices or holding prices.18 The assumption is these regions are
increasing prices due to a higher demand for their wine and, in turn, will aquire a higher degree of
capital that could be used to implement energy and water efficiency measures. In contrast, regions such
as Anderson Valley, Sacramento Valley, and Lodi should be deemphasized in customer acquisition. By
focusing on the more profitable regions, RSG can cut down on costs such as engineer site visits and
focus attention on regions with a higher potential for growth.
Summary of Recommendations As the only player in the wineries segment, RSG is well positioned to continue realizing profits from the
WIES program. In addition, RSG can strengthen its economic performance in this segment by offering a
direct-to-customer acquistion model. To do so, it is suggested RSG takes the following steps:
Market Water Efficiency
Incorporate “Conservation” into Marketing Strategy
Emphasize Refrigeration and Pumping
Target Most Profitable Wine Regions
18 ibid. 8

IMPACT Consulting Project
Industry Analysis & Competitive Strategy
21
“Has one of the 2 dairy programs run by the IOU
(2010-12)”
“We compared the budgets of Dairy Farming vs. (dairy) Food
Processing ”
“Food Process programs have 3x higher budget than Dairy
Framing programs”
IMPACT Consulting Project
Industry Analysis & Competitive Strategy
22
Dairies
Strategic Suggestions The following recommendations are based on our research of the California Dairy Industry:
1) Exportation of milk products will drive market growth. 2) The IOU Agricultural sector has allocated significant funding for PG&E. 3) There is an energy efficiency need within the Dairy Farming segment. However, direct to
customer service is not a viable option. 4) There is a greater energy efficiency potential benefit within the Dairy Product Processing and
Manufacturing segment. Dairy manufacturing fits within the IOU Agricultural sector and is a logical evolution of RSG’s current business in Dairy Farming.
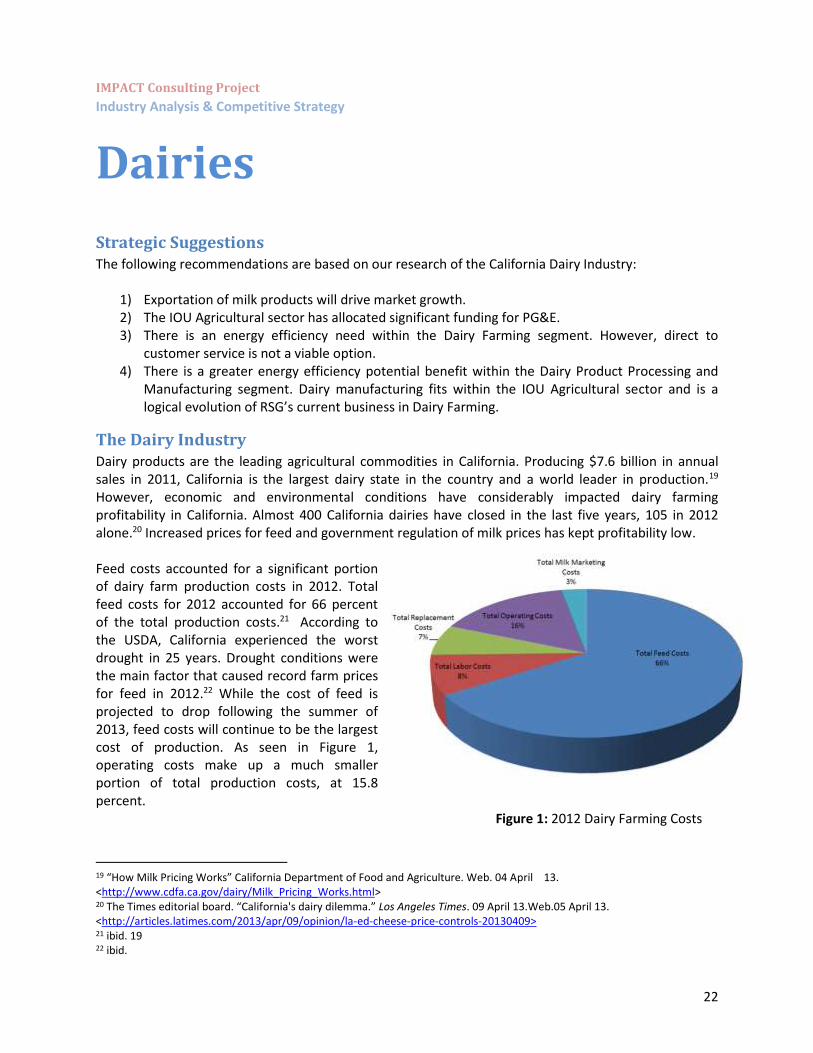
The Dairy Industry Dairy products are the leading agricultural commodities in California. Producing $7.6 billion in annual sales in 2011, California is the largest dairy state in the country and a world leader in production.19 However, economic and environmental conditions have considerably impacted dairy farming profitability in California. Almost 400 California dairies have closed in the last five years, 105 in 2012 alone.20 Increased prices for feed and government regulation of milk prices has kept profitability low. Feed costs accounted for a significant portion of dairy farm production costs in 2012. Total feed costs for 2012 accounted for 66 percent of the total production costs.21 According to the USDA, California experienced the worst drought in 25 years. Drought conditions were the main factor that caused record farm prices for feed in 2012.22 While the cost of feed is projected to drop following the summer of 2013, feed costs will continue to be the largest cost of production. As seen in Figure 1, operating costs make up a much smaller portion of total production costs, at 15.8 percent.
Figure 1: 2012 Dairy Farming Costs
19 “How Milk Pricing Works” California Department of Food and Agriculture. Web. 04 April 13. <http://www.cdfa.ca.gov/dairy/Milk_Pricing_Works.html> 20 The Times editorial board. “California's dairy dilemma.” Los Angeles Times. 09 April 13.Web.05 April 13. <http://articles.latimes.com/2013/apr/09/opinion/la-ed-cheese-price-controls-20130409> 21 ibid. 19 22 ibid.
IMPACT Consulting Project
Industry Analysis & Competitive Strategy
23
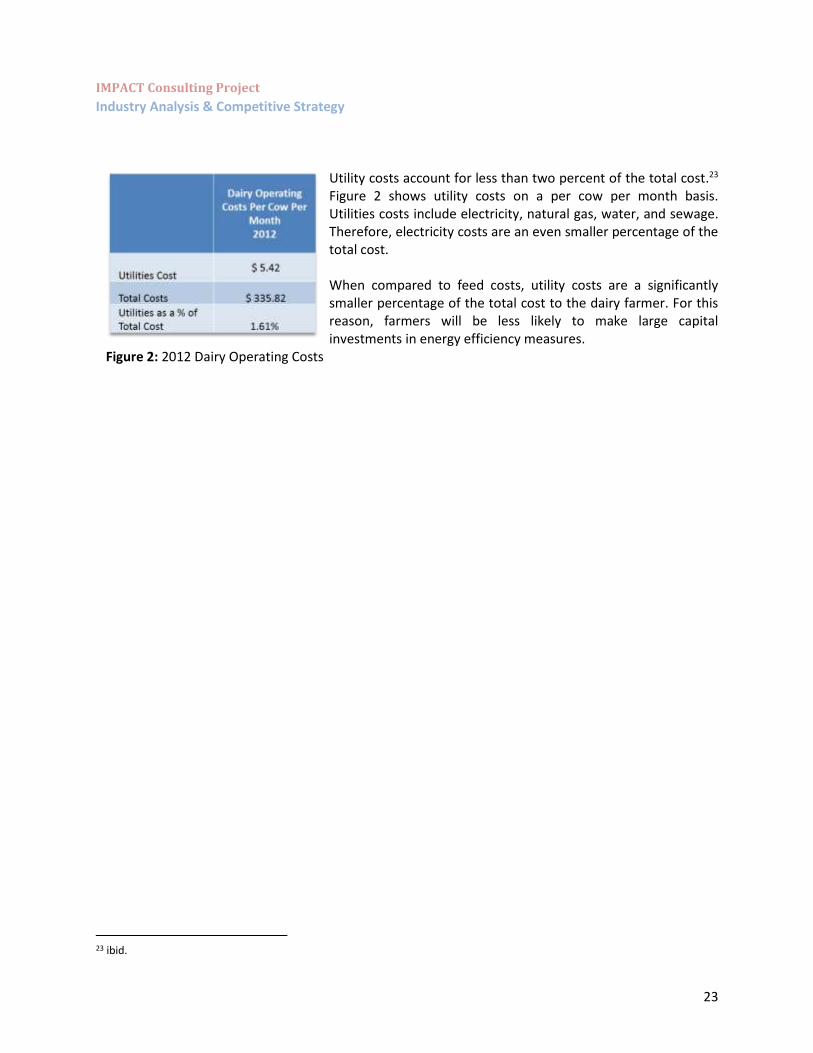
Utility costs account for less than two percent of the total cost.23
Figure 2 shows utility costs on a per cow per month basis. Utilities costs include electricity, natural gas, water, and sewage. Therefore, electricity costs are an even smaller percentage of the total cost. When compared to feed costs, utility costs are a significantly smaller percentage of the total cost to the dairy farmer. For this reason, farmers will be less likely to make large capital investments in energy efficiency measures.
Figure 2: 2012 Dairy Operating Costs
23 ibid.
IMPACT Consulting Project
Industry Analysis & Competitive Strategy
24
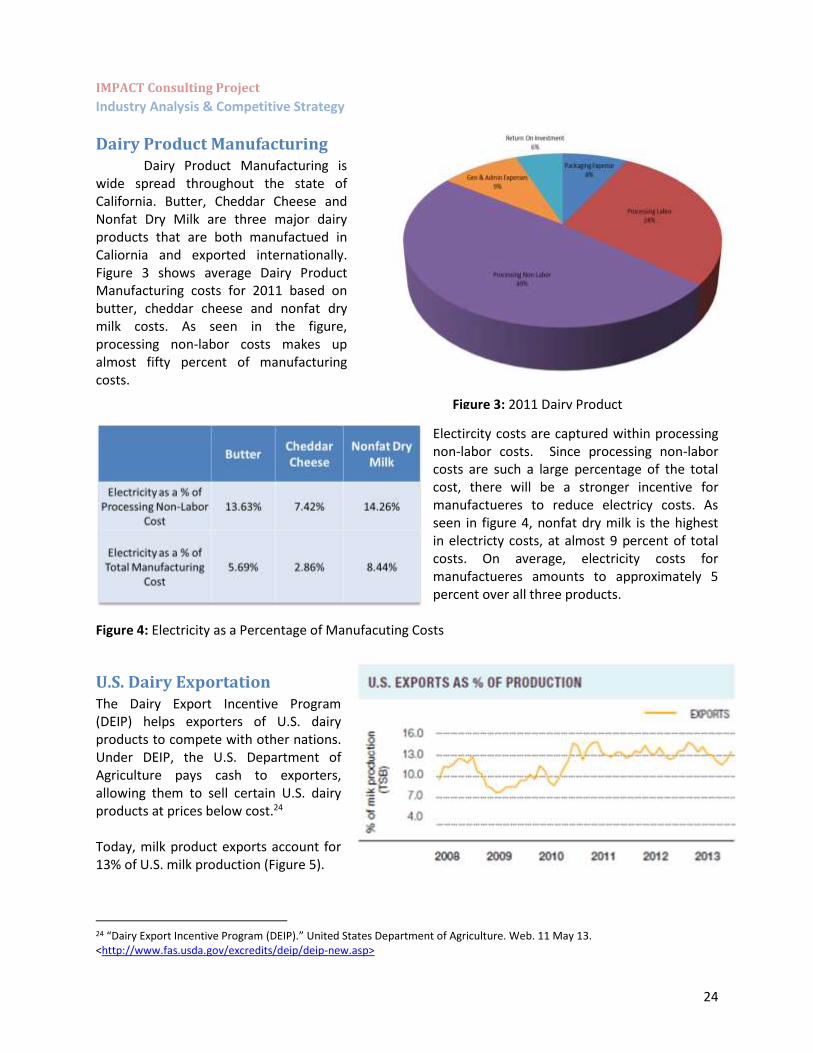
Dairy Product Manufacturing Dairy Product Manufacturing is wide spread throughout the state of California. Butter, Cheddar Cheese and Nonfat Dry Milk are three major dairy products that are both manufactued in Caliornia and exported internationally. Figure 3 shows average Dairy Product Manufacturing costs for 2011 based on butter, cheddar cheese and nonfat dry milk costs. As seen in the figure, processing non-labor costs makes up almost fifty percent of manufacturing costs.
Electircity costs are captured within processing non-labor costs. Since processing non-labor costs are such a large percentage of the total cost, there will be a stronger incentive for manufactueres to reduce electricy costs. As seen in figure 4, nonfat dry milk is the highest in electricty costs, at almost 9 percent of total costs. On average, electricity costs for manufactueres amounts to approximately 5 percent over all three products.
Figure 4: Electricity as a Percentage of Manufacuting Costs
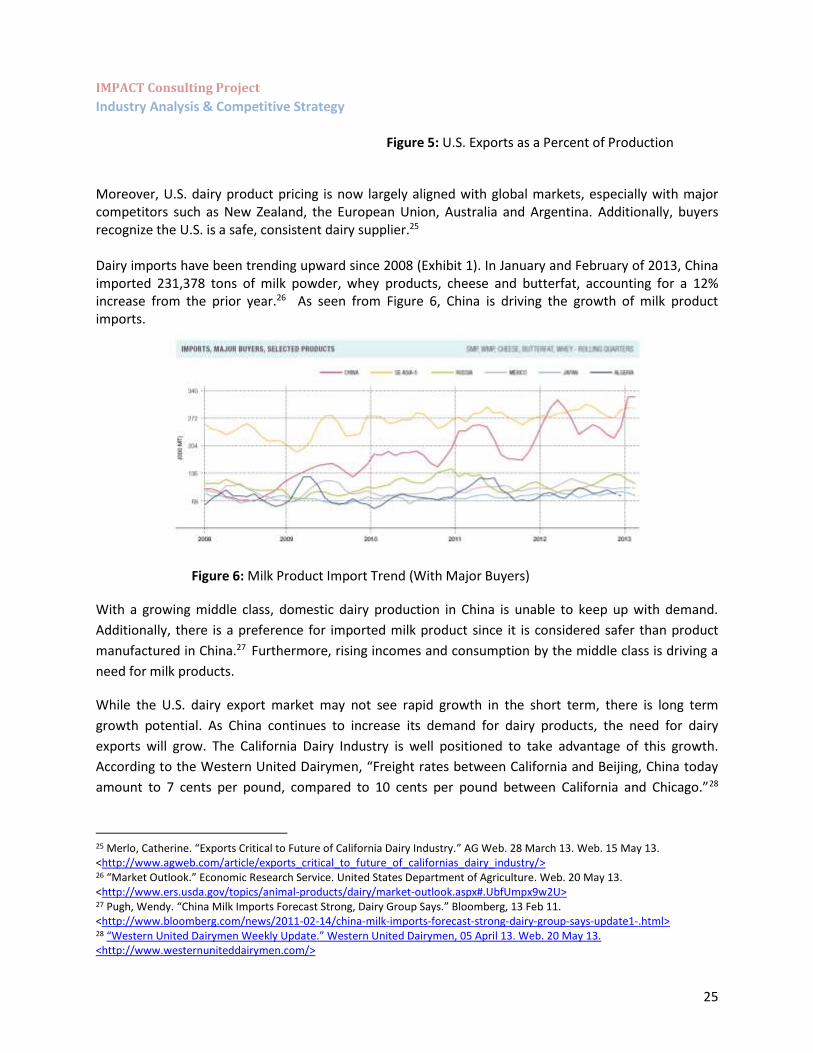
U.S. Dairy Exportation The Dairy Export Incentive Program (DEIP) helps exporters of U.S. dairy products to compete with other nations. Under DEIP, the U.S. Department of Agriculture pays cash to exporters, allowing them to sell certain U.S. dairy products at prices below cost.24 Today, milk product exports account for 13% of U.S. milk production (Figure 5).
24 “Dairy Export Incentive Program (DEIP).” United States Department of Agriculture. Web. 11 May 13. <http://www.fas.usda.gov/excredits/deip/deip-new.asp>
Figure 3: 2011 Dairy Product
Manufacturing Costs
IMPACT Consulting Project
Industry Analysis & Competitive Strategy
25
Figure 5: U.S. Exports as a Percent of Production
Moreover, U.S. dairy product pricing is now largely aligned with global markets, especially with major competitors such as New Zealand, the European Union, Australia and Argentina. Additionally, buyers recognize the U.S. is a safe, consistent dairy supplier.25 Dairy imports have been trending upward since 2008 (Exhibit 1). In January and February of 2013, China imported 231,378 tons of milk powder, whey products, cheese and butterfat, accounting for a 12% increase from the prior year.26 As seen from Figure 6, China is driving the growth of milk product imports.
Figure 6: Milk Product Import Trend (With Major Buyers)
With a growing middle class, domestic dairy production in China is unable to keep up with demand.
Additionally, there is a preference for imported milk product since it is considered safer than product
manufactured in China.27 Furthermore, rising incomes and consumption by the middle class is driving a
need for milk products.
While the U.S. dairy export market may not see rapid growth in the short term, there is long term
growth potential. As China continues to increase its demand for dairy products, the need for dairy
exports will grow. The California Dairy Industry is well positioned to take advantage of this growth.
According to the Western United Dairymen, “Freight rates between California and Beijing, China today
amount to 7 cents per pound, compared to 10 cents per pound between California and Chicago.”28
25 Merlo, Catherine. “Exports Critical to Future of California Dairy Industry.” AG Web. 28 March 13. Web. 15 May 13. <http://www.agweb.com/article/exports_critical_to_future_of_californias_dairy_industry/> 26 “Market Outlook.” Economic Research Service. United States Department of Agriculture. Web. 20 May 13. <http://www.ers.usda.gov/topics/animal-products/dairy/market-outlook.aspx#.UbfUmpx9w2U> 27 Pugh, Wendy. “China Milk Imports Forecast Strong, Dairy Group Says.” Bloomberg, 13 Feb 11. <http://www.bloomberg.com/news/2011-02-14/china-milk-imports-forecast-strong-dairy-group-says-update1-.html> 28 “Western United Dairymen Weekly Update.” Western United Dairymen, 05 April 13. Web. 20 May 13. <http://www.westernuniteddairymen.com/>

IMPACT Consulting Project
Industry Analysis & Competitive Strategy
26
Thus, California’s strength as a dairy producer and its geographic location will prove to be a strategic
advantage for California.
California Agriculture Energy Efficiency
According to the California Long Term Energy Efficiency Strategic Plan, “energy efficiency will support
the long-term economic and environmental success of California agriculture.”29 The agricultural sector
accounts for about 7 percent of California’s total energy consumption.30 The agricultural sector includes
subsectors such as Dairies and Wineries. California not only recognizes the need to reduce energy levels
within the agricultural sector, but has listed specific goals for achieving energy efficiency. By 2020,
California plans to reduce energy levels by 15% from energy levels in 2008.31 The strategy charted to
reach the goals as indicated by the plan include improved industrial refrigeration practices and
technologies and onsite source-water reduction.32 California has committed to supporting this initiative
through the IOU program. As seen in Exhibit 2, $20,445,038 has been allocated to third party IOU
programs statewide. Nearly the entirety of the funding, $20,333,052 has been allocated to the Northern
California utility PG&E.33 Based on funding alone, the Northern California agricultural sector is a
favorable market to compete in.
California Dairy Farms
Dairy farms are spread throughout the state of California. However, according to the California
Department of Food and Agriculture, Northern California has a significantly higher number of large
farms when compared to Southern California. Large farms are defined as farms with an average of 1,000
cows or more per farm. Exhibits 3 and 4 contain data showing number of farms and farm size by county.
Northern California has close to 2,000 large farms, while Southern California has only 114 large farms.34
While the average number of cows per farm is higher, there are far fewer farms in Southern California.
From a market penetration standpoint, a larger number of farms in a centralized area will be beneficial
to expanding business. Since the Dairy Industry is a tight knit, integrated community, word of mouth will
prove to be essential to RSG’s success.
29 “California Long Term Energy Efficiency Strategic Plan.” California Public Utilities Committee. Sept 08. Web. 15 May 13. < http://www.cpuc.ca.gov/NR/rdonlyres/D4321448-208C-48F9-9F62-1BBB14A8D717/0/EEStrategicPlan.pdf> 30 ibid. 31 ibid. 32 ibid. 33 “Fact Sheet.” California Public Utilities Committee, March 13. Web. 25 May 13. <http://www.cpuc.ca.gov/NR/rdonlyres/31E3D9FD-5D1B-4274-95A9-36E1734167B8/0/201314AgriculturalProgramFactSheet.pdf> 34 “Statistics and Trends Annual Tables and Data 2012.” Bi Annual and Annual Summaries. California Department of Food and Agriculture. Web. 25 May 13. <http://www.cdfa.ca.gov/dairy/dairystats_annual.html>

IMPACT Consulting Project
Industry Analysis & Competitive Strategy
27
From the data by county, the following counties have been identified as the top three target counties
for RSG:
1. Tulare County
2. Merced County
3. Kern County
Tulare County
Approximately 235 miles from RSG’s campus in Half Moon Bay, Tulare County is located in the southern
part of the Central Valley. Tulare has the largest number of farms with highest average number of cows
per farm. Lastly, Tulare is the number one county in the state and in the nation in annual milk
production, totaling more than $1.6 billion.
Merced County
Merced County is also situated in the Central Valley. Merced contains the second largest number of
farms with second highest average number of cows per farm. Additionally, Merced is the highest
producer of manufactured milk product in the state. Exhibit 5 shows that Merced County produces 61%
of the state’s manufactured milk product. RSG may consider expanding its business from strictly dairy
farming into the Dairy Product Manufacturing segment. Merced would be the ideal location for this
transition. Merced County contains cheese processors such as Hilmar Cheese Co., Joseph Farms and
Peluso Cheese. Additionally, one of California Dairies Inc. six major plants is located in Merced. California
Dairies Inc. is the number one dairy processing cooperative in the state and produces 43% of California’s
milk. A relationship with California Dairies Inc. could potentially prove to be a substantial client for RSG.
Kern County
While Kern country has fewer farms then compared to Tulare and Merced, Kern has a significantly higher number of cows per farm. At an average of 3,184 cows per farm, Kern has the largest farms in the state.35 For this reason, Kern is the third market that should be targeted by RSG.
Dairy Product Manufacturing A study conducted by the Lawrence Berkeley National Laboratory titled “Energy Efficiency Improvement and Cost Saving Opportunities for the Dairy Processing Industry” concludes that there is a significant need for energy efficiency management within the Dairy Product Manufacturing segment. The study found that many U.S. dairy processing companies have already begun to improve their energy efficiency.36 Additionally, many of the measures have relatively short payback periods and therefore the measures are attractive economic investments for manufacturers.37
35 ibid. 36 Brush, Adrian. “Energy Efficiency Improvement and Cost Saving Opportunities for the Dairy Processing Industry.” Energy Star. Oct 11. Web. 20 May 13. <http://www.energystar.gov/ia/business/industry/downloads/Dairy_Guide_Final.pdf> 37 ibid.

IMPACT Consulting Project
Industry Analysis & Competitive Strategy
28
Furthermore, dairy manufacturing would fit into the current agricultural sector. RSG already has a substantial hold in the sector with the DIRA and the WIES program. Finally, RSG would have a competitive advantage in this market. Figure 7 shows energy efficiency companies who currently work with food processors in the Agricultural IOU sector. As seen in figure 7, BASE Energy is the only company with any involvement with the dairy industry.38 Since the dairy industry is such a cohesive community, RSG would have a competitive advantage when entering into dairy manufacturing. Since the dairy farmers are the suppliers for the manufactures, moving to manufacturing is a logical evolution of RSG’s current business.
Figure 7: Energy Efficiency Companies in the Agricultural IOU sector (Food Processing Specific)
Summary of Recommendations
In conclusion, RSG should continue the DIRA program but should not attempt to go direct to the
customer in the dairy-farming segment. Due to the industry’s low profitability and high feed prices, dairy
farmers will be unlikely to make large capital investments in energy efficiency. Nevertheless, there is an
energy efficiency need within dairy farming. Dairy Product Manufacturing has a greater energy
efficiency potential benefit when compared to dairy farming. It is a logical evolution of the market and
fits with the Agricultural IOU sector.
38 “Third Part programs: Fact Sheet.” Pacific Gas and Electric. Web. 05 May 13. <http://www.pge.com/includes/docs/pdfs/mybusiness/energysavingsrebates/partnersandtradepros/eeis/search/third_party_programs_fs.pdf?

IMPACT Consulting Project
Industry Analysis & Competitive Strategy
29
“ Commercial sector to be the largest market segment in IOU budget & number of programs”
“Majority of Direct to Customer companies have
software capability”
“We created a decision matrix and compared the current
sectors -Schools, Wineries & Dairies with Others”

IMPACT Consulting Project
Industry Analysis & Competitive Strategy
30
Competitive Strategy Summary
Energy Efficiency service industry is still in its early days across US. California has been
promoting energy efficiency since the early 1970s. There is a huge market potential and growth
opportunity in this industry. The market is very active with firms are buying other firms and low barrier
for new entrants. New firms are entering the market and competing for a market share. In such a
growing market, understanding the competitors and competitive landscape is crucial. This report
focuses on the competitive landscape as of early 2013 and is developed specifically for competitors and
potential partners of RSG.
Key Players
California Public Utilities Commission
The CPUC regulates privately owned electric, natural gas, telecommunications, water, railroad,
rail transit, and passenger transportation companies. The CPUC serves the public interest by protecting
consumers and ensuring the provision of safe, reliable utility service and infrastructure at reasonable
rates, with a commitment to environmental enhancement and a healthy California economy. We
regulate utility services, stimulate innovation, and promote competitive markets, where possible.
Investor Owned Utility (IOU)39
Investor Owned Utilities (IOU) are larger utility companies administering energy efficiency
programs with oversight by the California Public Utilities Commission (CPUC). CPUC establishes key
policies and guidelines, sets program goals, and approves spending levels for each IOU.
Consumers
Consumers are residents or small businesses getting benefited by the program.
Approach for Competitive Strategy In order to better understand the areas where RSG is competing and to determine the potential
partners we segmented into three areas.
1. Investor Owned Utility (IOU): This segment is the most important one. RSG competed mainly in this segment and has been successful.
2. Direct to Customer (D2C) segment was very important, as this is the area which has more profit and growth potential.
39 http://en.wikipedia.org/wiki/Investor-owned_utility

IMPACT Consulting Project
Industry Analysis & Competitive Strategy
31
3. Subsidiaries of CLEAResult: Early Dec 2011, RSG became a subsidiary of CLEAResult; a Texas based Energy Optimization Company. Understanding the subsidiaries of CLEAResult were crucial to understand the skill sets RSG can look within CLEAResult. These skills can be used as case studies for RSG’s response to potential RFPs and help them diversify in future.
Analysis Our analysis has been strategic and data driven. We analyzed information from multiple web sources,
interviewed subject matter experts and ran surveys.
IOU Specific Information
California Public Utilities Commission’s (CPUC) Energy Efficiency Groupware Application[40] which
provides a list of programs and funding information. However they do not provide the name of the third
party that is actually executing the program. We looked at the individual IOU’s website and determined
the name of the third party and the project they were working on. Then we mapped the name of the
program & third party information to the data obtained from the CPUC’s website.
CLEAResult Subsidiary & Direct to customer companies
We used the websites of the companies, Hoovers (www.hoovers.com) and even cold called some
companies to get information about them.
40 http://eega.cpuc.ca.gov/Default.aspx
IMPACT Consulting Project
Industry Analysis & Competitive Strategy
32
Investor Owned Utilities IOU programs are either rebate driven or savings driven for the end consumers. The amount of
profit the California Public Utilities Commission allows IOU to make is separated from the amount of
utilities they sell through a process called decoupling.41
IOUs are required by law to distribute a certain percentage of their funding amongst the smaller
contracting companies know as “third parties” (3P). Third parties own the management and delivery of
these projects and in return for monetary compensation, depending on how successful the project was.
In California there are four IOUs:
1. Pacific Gas & Electric (PG&E) 2. Southern California Edison (SCE) 3. Southern California Gas (SCG) 4. San Diego Gas and Electric (SDGE)
Pacific Gas & Electric (PG&E)
PG&E is based in northern California region and is one of the biggest IOU. Every cycle PG&E puts
out proposals for projects, where the 3P’s respond and compete for. PG&E awards multi-year projects
to winners of the proposals. We analyzed the 2010-12 IOU cycle for PG&E and analyzed competitors. A
detailed list of competitors in PG&E is provided in the accompanied excel document.
We analyzed number of wins, original budget, final budget, expenditure and balance remaining for each
of the competitors in this IOU. The top competitors based on this analysis were compared and trend in
their funding was analyzed. The table below shows the analysis for the top companies in this IOU.
41 http://www.pge.com/myhome/myaccount/rateinfo/howwemakemoney/

IMPACT Consulting Project
Industry Analysis & Competitive Strategy
33
The chart below shows how each of the top companies were allocated budget by PG&E in comparison to
RSG. Red color indicates companies having budgets greater than those of RSG, while blue indicates
companies with budget lower than that of RSG.
Southern California Edison (SCE)42
SCE is based in southern California region and is the second biggest IOU. Similar to PG&E IOU they also
42 https://www.sce.com/
IMPACT Consulting Project
Industry Analysis & Competitive Strategy
34
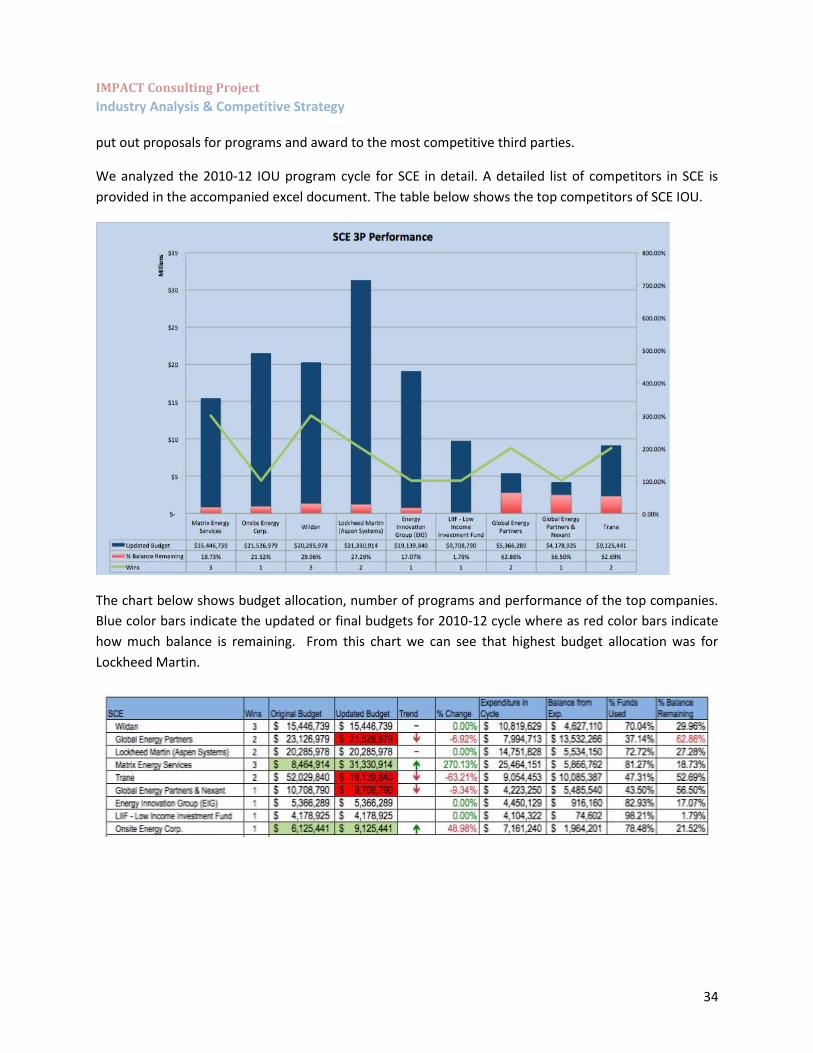
put out proposals for programs and award to the most competitive third parties.
We analyzed the 2010-12 IOU program cycle for SCE in detail. A detailed list of competitors in SCE is
provided in the accompanied excel document. The table below shows the top competitors of SCE IOU.
The chart below shows budget allocation, number of programs and performance of the top companies.
Blue color bars indicate the updated or final budgets for 2010-12 cycle where as red color bars indicate
how much balance is remaining. From this chart we can see that highest budget allocation was for
Lockheed Martin.
IMPACT Consulting Project
Industry Analysis & Competitive Strategy
35
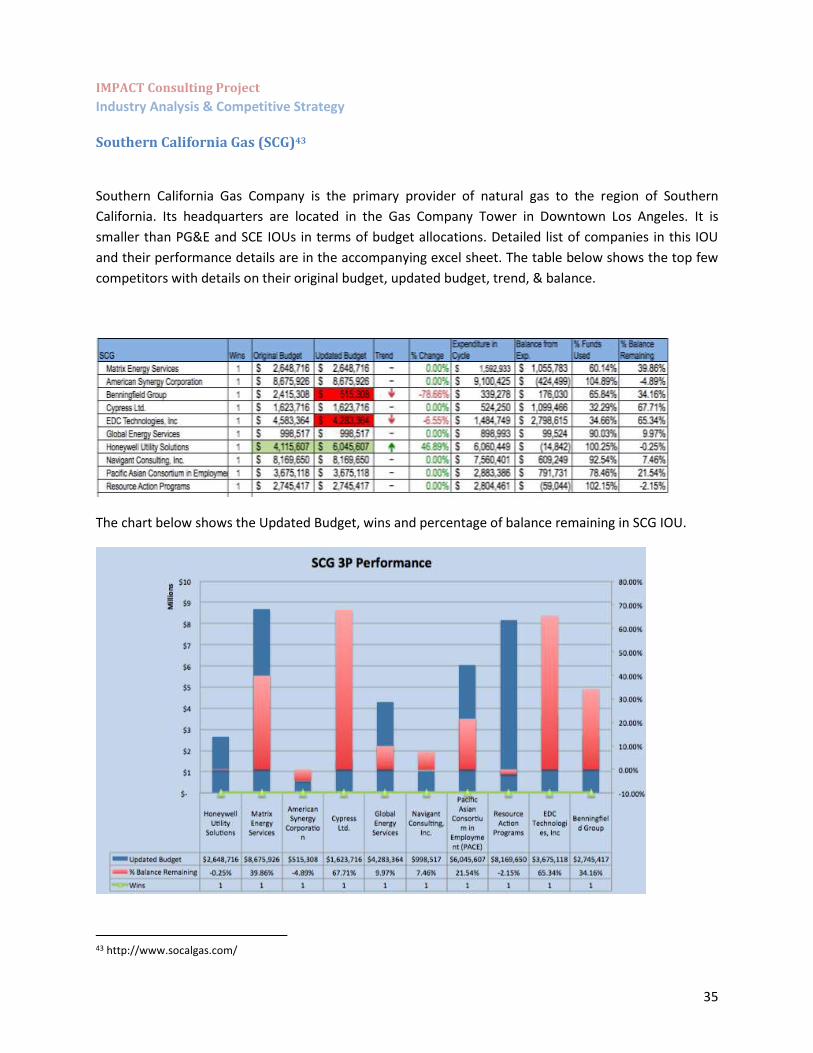
Southern California Gas (SCG)43
Southern California Gas Company is the primary provider of natural gas to the region of Southern
California. Its headquarters are located in the Gas Company Tower in Downtown Los Angeles. It is
smaller than PG&E and SCE IOUs in terms of budget allocations. Detailed list of companies in this IOU
and their performance details are in the accompanying excel sheet. The table below shows the top few
competitors with details on their original budget, updated budget, trend, & balance.
The chart below shows the Updated Budget, wins and percentage of balance remaining in SCG IOU.
43 http://www.socalgas.com/
IMPACT Consulting Project
Industry Analysis & Competitive Strategy
36
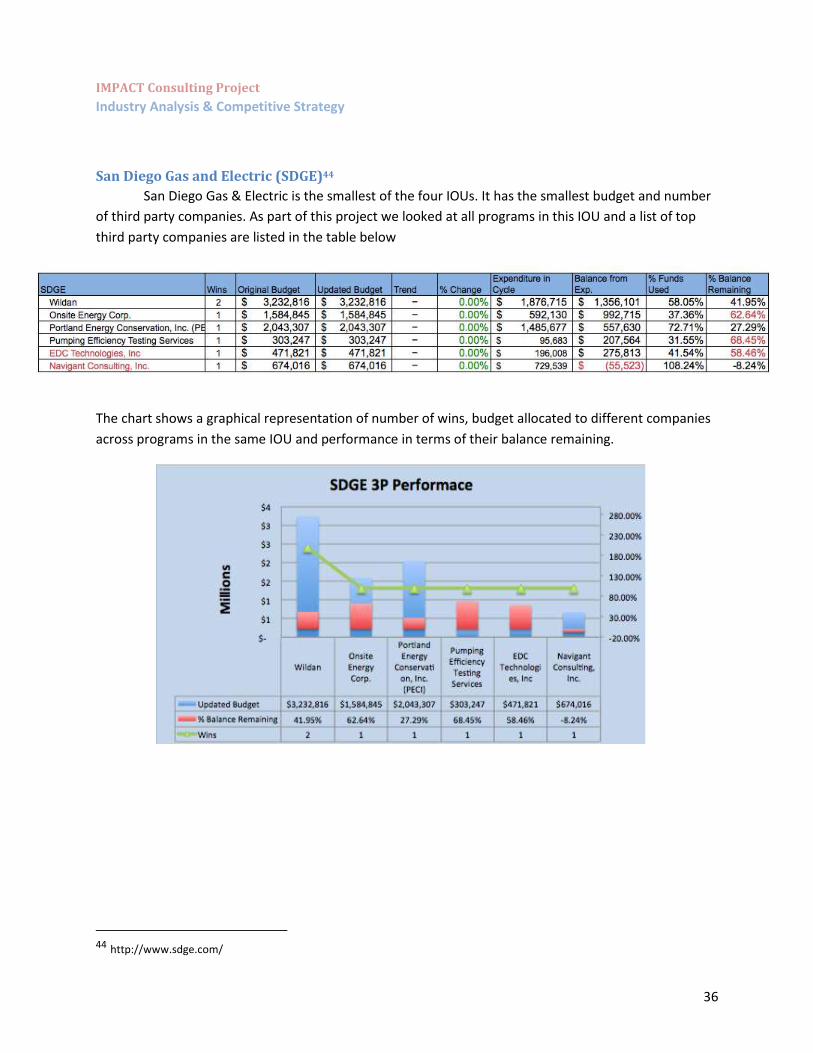
San Diego Gas and Electric (SDGE)44
San Diego Gas & Electric is the smallest of the four IOUs. It has the smallest budget and number
of third party companies. As part of this project we looked at all programs in this IOU and a list of top
third party companies are listed in the table below
The chart shows a graphical representation of number of wins, budget allocated to different companies
across programs in the same IOU and performance in terms of their balance remaining.
44 http://www.sdge.com/

IMPACT Consulting Project
Industry Analysis & Competitive Strategy
37
IOU Industry Analysis
Based on the number of program wins, updated allocated budget and balance remaining we were able
to get an overall picture how the industry look like. We were able to point out which industry sector is
more lucrative and where there is more potential for growth in the next cycles.
Based on our analysis, commercial sector is the most lucrative sector in terms of the budget allocation
and number of programs. Industrial sector is the second most lucrative sector.
Updated Budget Balance Programs
COMMERCIAL $272,774,514.24 $53,598,565.58 44
INDUSTRIAL $170,737,647.18 $41,053,643.44 21
RESIDENTIAL $71,394,119.20 $12,974,384.80 17
Cross-Cutting $31,057,475.24 $8,798,544.05 14
AGRICULTURAL $27,967,371.00 $3,539,496.00 7
WET $3,663,029.00 $168,942.00 2
IMPACT Consulting Project
Industry Analysis & Competitive Strategy
38
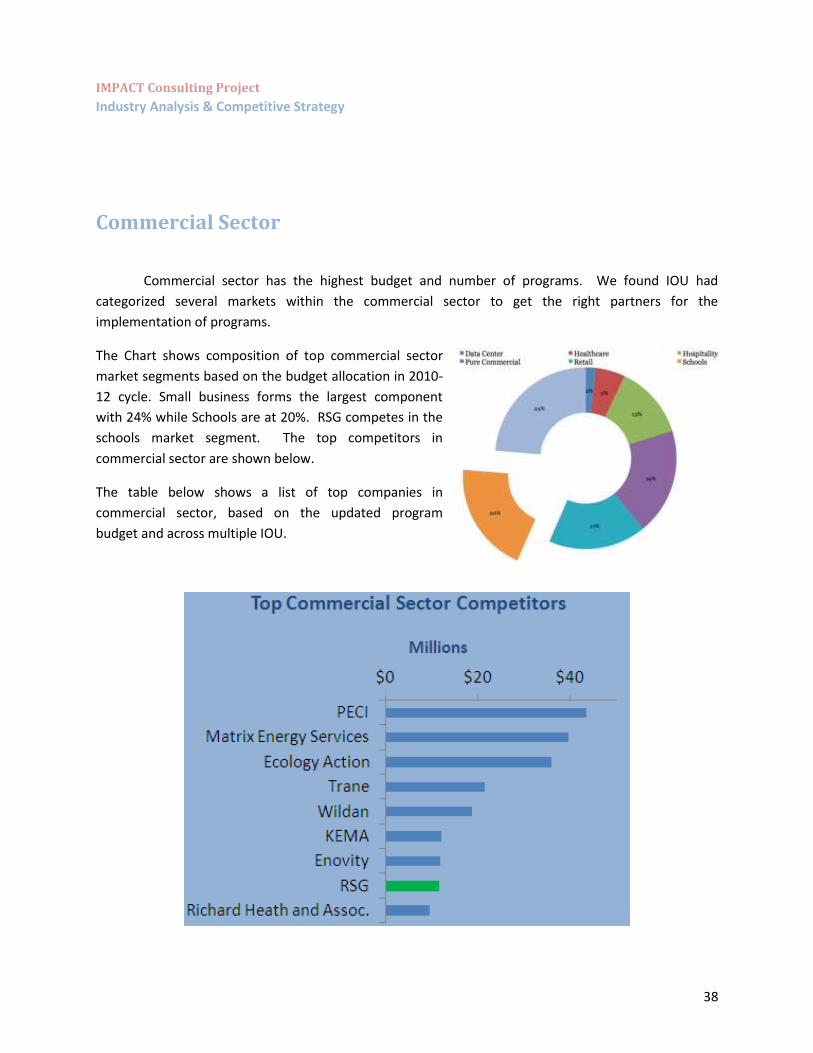
Commercial Sector
Commercial sector has the highest budget and number of programs. We found IOU had
categorized several markets within the commercial sector to get the right partners for the
implementation of programs.
The Chart shows composition of top commercial sector
market segments based on the budget allocation in 2010-
12 cycle. Small business forms the largest component
with 24% while Schools are at 20%. RSG competes in the
schools market segment. The top competitors in
commercial sector are shown below.
The table below shows a list of top companies in
commercial sector, based on the updated program
budget and across multiple IOU.
IMPACT Consulting Project
Industry Analysis & Competitive Strategy
39
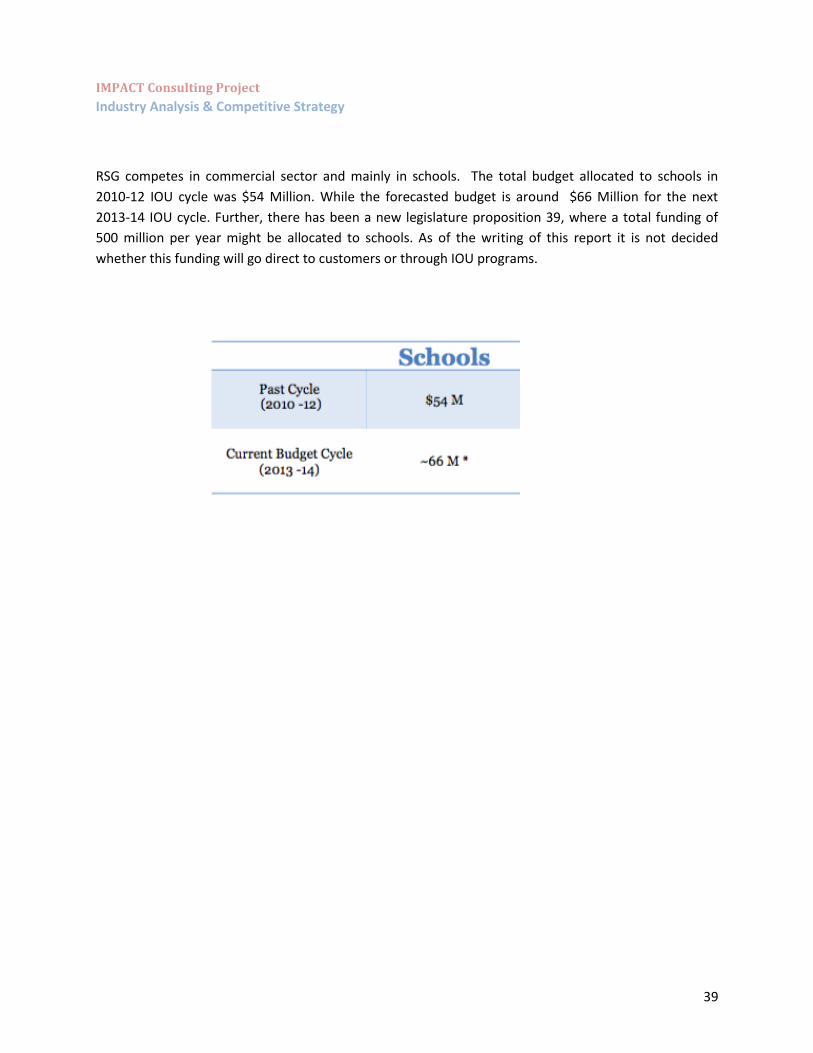
RSG competes in commercial sector and mainly in schools. The total budget allocated to schools in
2010-12 IOU cycle was $54 Million. While the forecasted budget is around $66 Million for the next
2013-14 IOU cycle. Further, there has been a new legislature proposition 39, where a total funding of
500 million per year might be allocated to schools. As of the writing of this report it is not decided
whether this funding will go direct to customers or through IOU programs.
IMPACT Consulting Project
Industry Analysis & Competitive Strategy
40
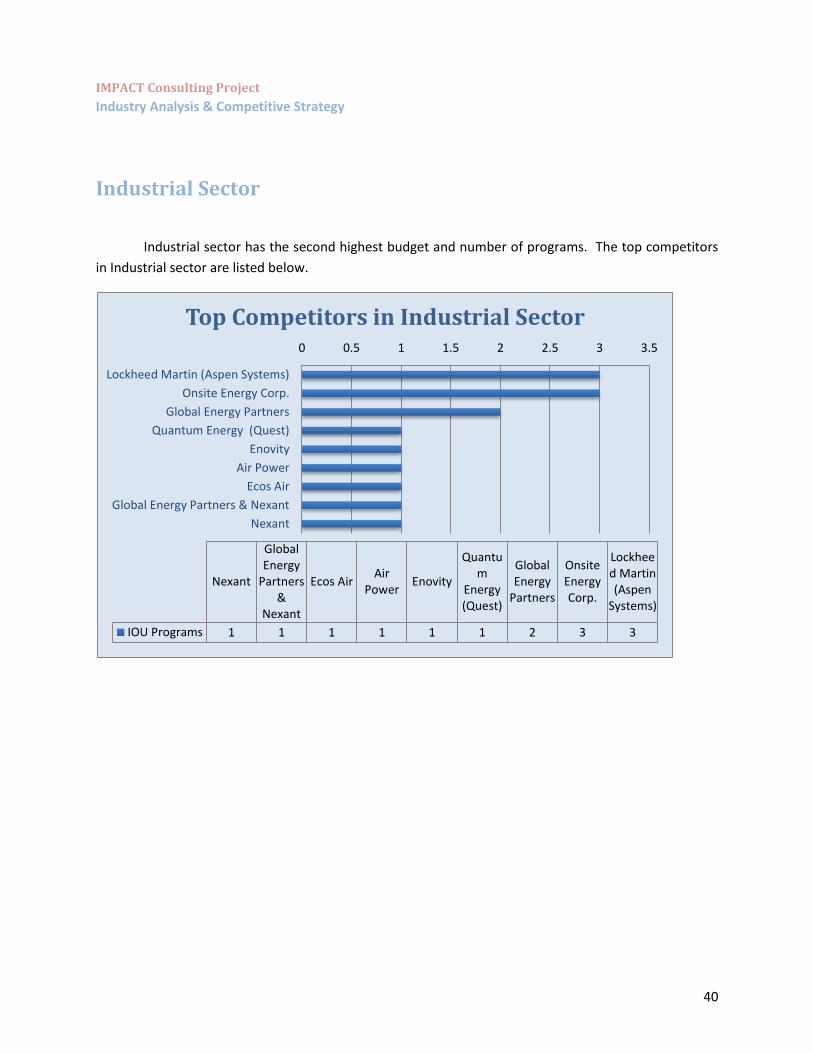
Industrial Sector
Industrial sector has the second highest budget and number of programs. The top competitors
in Industrial sector are listed below.
0 0.5 1 1.5 2 2.5 3 3.5
Lockheed Martin (Aspen Systems)
Onsite Energy Corp.
Global Energy Partners
Quantum Energy (Quest)
Enovity
Air Power
Ecos Air
Global Energy Partners & Nexant
Nexant
Lockheed Martin(Aspen
Systems)
OnsiteEnergyCorp.
GlobalEnergy
Partners
Quantum
Energy(Quest)
EnovityAir
PowerEcos Air
GlobalEnergy
Partners&
Nexant
Nexant
IOU Programs 332111111
Top Competitors in Industrial Sector
IMPACT Consulting Project
Industry Analysis & Competitive Strategy
41
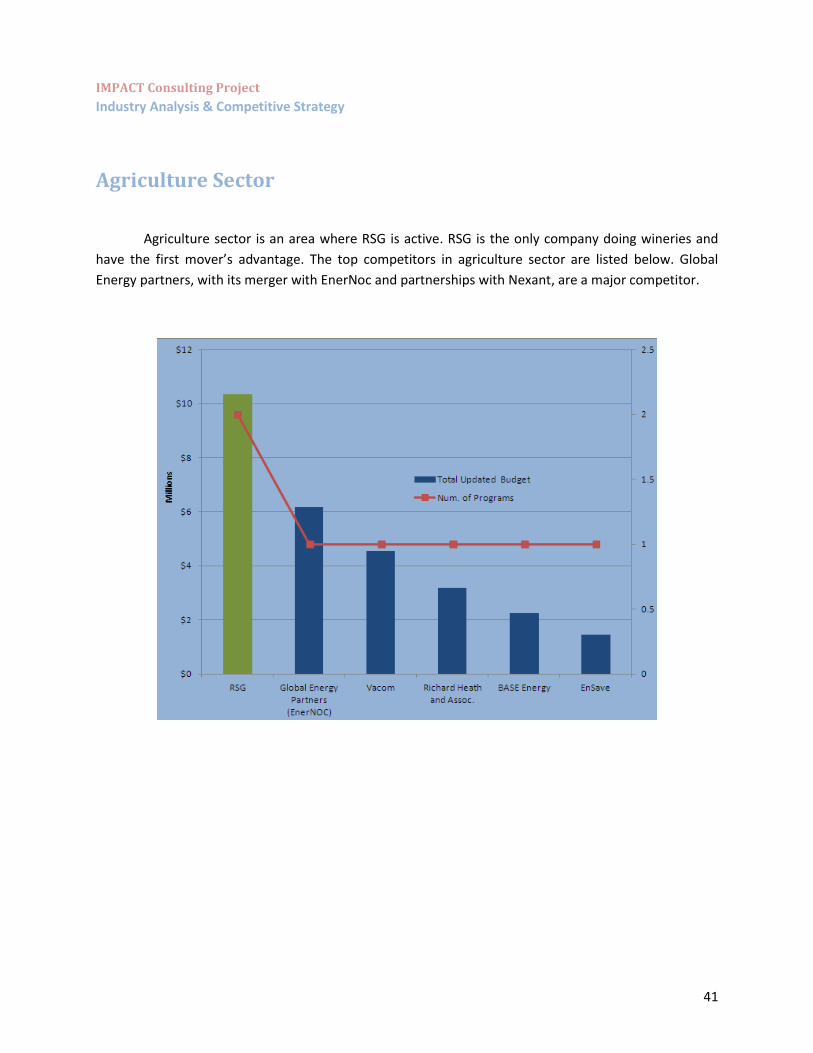
Agriculture Sector
Agriculture sector is an area where RSG is active. RSG is the only company doing wineries and
have the first mover’s advantage. The top competitors in agriculture sector are listed below. Global
Energy partners, with its merger with EnerNoc and partnerships with Nexant, are a major competitor.

IMPACT Consulting Project
Industry Analysis & Competitive Strategy
42
Energy Performance Analysis

IMPACT Consulting Project
Industry Analysis & Competitive Strategy
43
IOU Markets
Based on the 2010-12 IOU cycle and the
number of programs in each market, we see
the maximum number of programs are in
Industrial, which includes manufacturing,
bottling plants etc.
Below is a list of companies and their presence in various markets.
IMPACT Consulting Project
Industry Analysis & Competitive Strategy
44
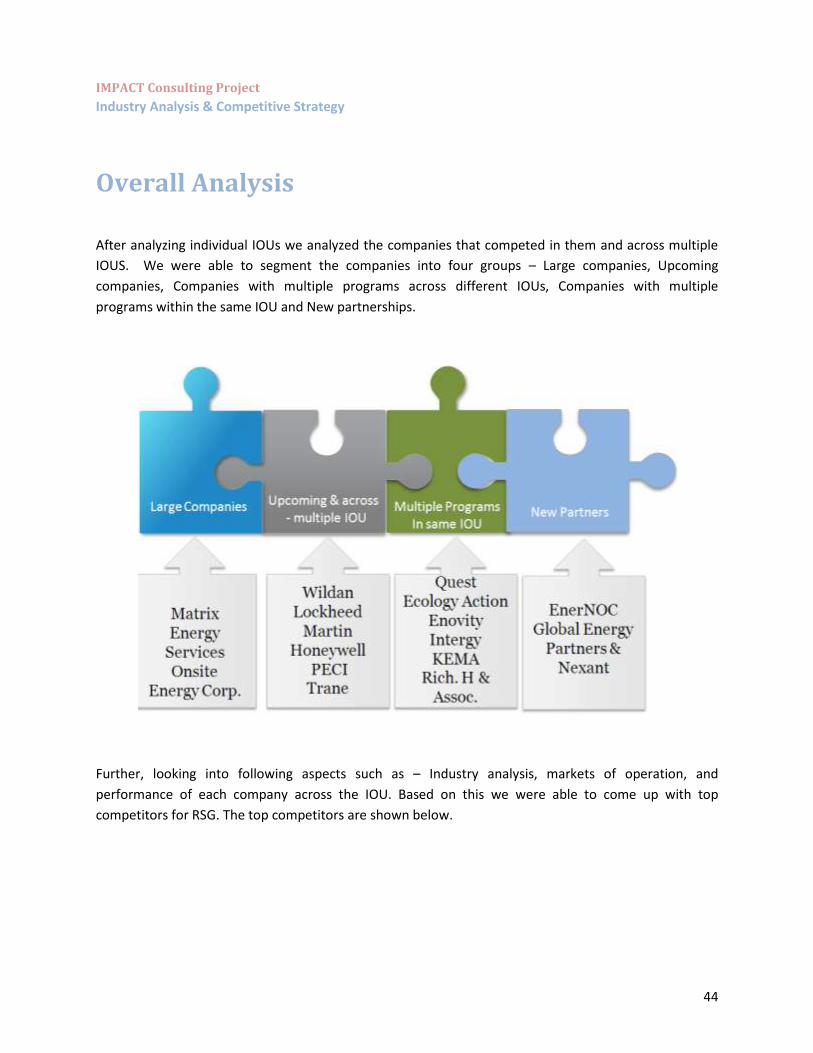
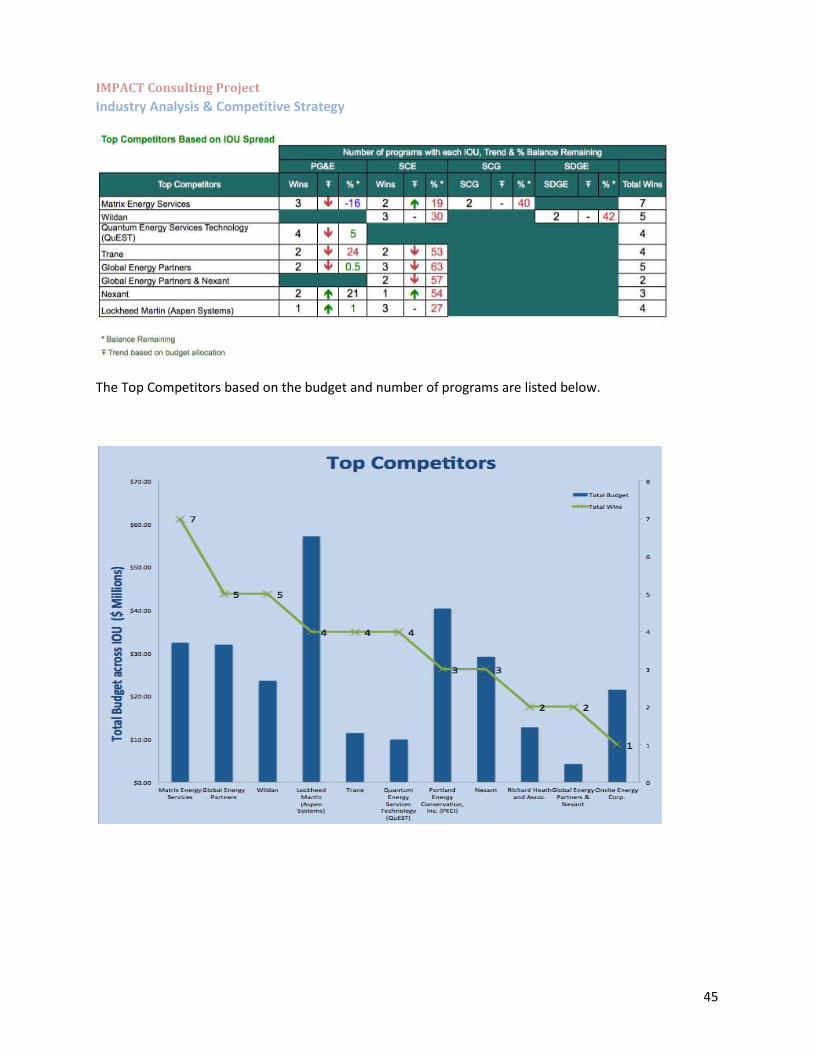
Overall Analysis
After analyzing individual IOUs we analyzed the companies that competed in them and across multiple
IOUS. We were able to segment the companies into four groups – Large companies, Upcoming
companies, Companies with multiple programs across different IOUs, Companies with multiple
programs within the same IOU and New partnerships.
Further, looking into following aspects such as – Industry analysis, markets of operation, and
performance of each company across the IOU. Based on this we were able to come up with top
competitors for RSG. The top competitors are shown below.
IMPACT Consulting Project
Industry Analysis & Competitive Strategy
45
The Top Competitors based on the budget and number of programs are listed below.
IMPACT Consulting Project
Industry Analysis & Competitive Strategy
46
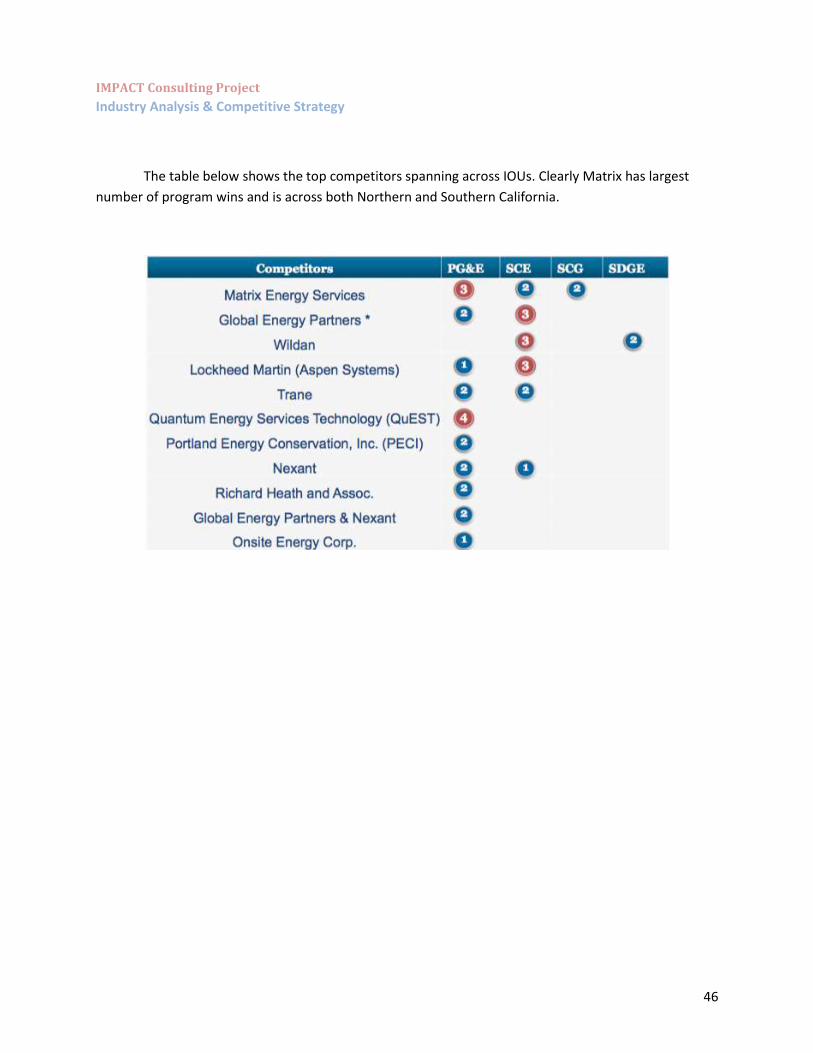
The table below shows the top competitors spanning across IOUs. Clearly Matrix has largest
number of program wins and is across both Northern and Southern California.

IMPACT Consulting Project
Industry Analysis & Competitive Strategy
47
Direct to customers (D2C) Companies
We classified Energy Efficiency service companies directly servicing the customers without any incentive
or rebate programs as Direct to Customer companies. We analyzed around 50 direct to customer
companies and found several trends. Entire list of direct to customer companies is in the accompanying
excel sheet.
Emerging Trend: Water-Energy Nexus market is up-coming.
A key emerging trend was growth in water conservation and water-energy nexus. Linucs,
Alternative Energy Systems, Arup North America, & Itron are all exploring this sector. California Energy
Commission http://www.energy.ca.gov/research/iaw/water.html is seriously looking into this area and
there can be potential programs.
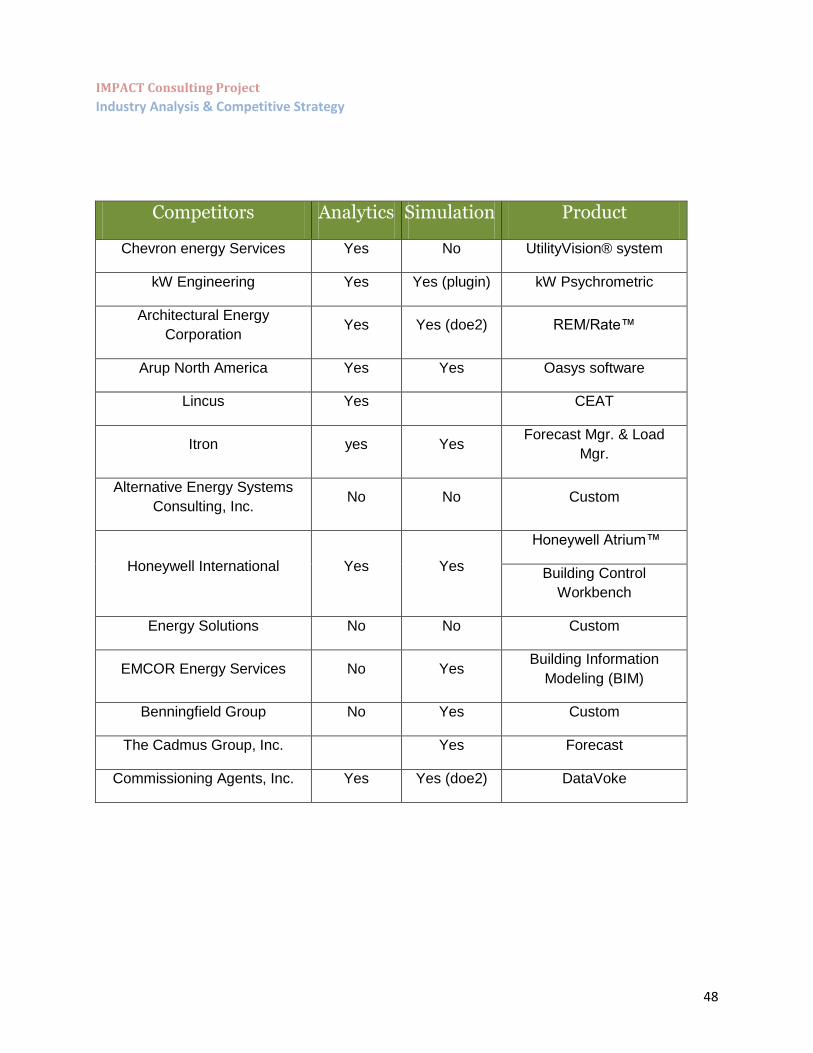
Trend #1: Majority of Direct to Customers (D2C) Companies
have Software Capability.
Below is a list of companies and their product names. Also companies have developed
simulation capabilities using DOE2 and TREAT.
IMPACT Consulting Project
Industry Analysis & Competitive Strategy
48
Competitors Analytics Simulation Product
Chevron energy Services Yes No UtilityVision® system
kW Engineering Yes Yes (plugin) kW Psychrometric
Architectural Energy
Corporation Yes Yes (doe2) REM/Rate™
Arup North America Yes Yes Oasys software
Lincus Yes CEAT
Itron yes Yes Forecast Mgr. & Load
Mgr.
Alternative Energy Systems
Consulting, Inc. No No Custom
Honeywell International Yes Yes
Honeywell Atrium™
Building Control
Workbench
Energy Solutions No No Custom
EMCOR Energy Services No Yes Building Information
Modeling (BIM)
Benningfield Group No Yes Custom
The Cadmus Group, Inc. Yes Forecast
Commissioning Agents, Inc. Yes Yes (doe2) DataVoke

IMPACT Consulting Project
Industry Analysis & Competitive Strategy
49
Trend #2 : Demand Response & Renewable Energy are Areas
getting more popular.
Below is a list of companies showing major trend in demand response and in Renewable energy.

IMPACT Consulting Project
Industry Analysis & Competitive Strategy
50
Subsidiary Companies The chart below shows a list of subsidiary companies and their core competencies. Companies
should leverage their expertise and experience when they respond to an RFP.
IMPACT Consulting Project
Industry Analysis & Competitive Strategy
51
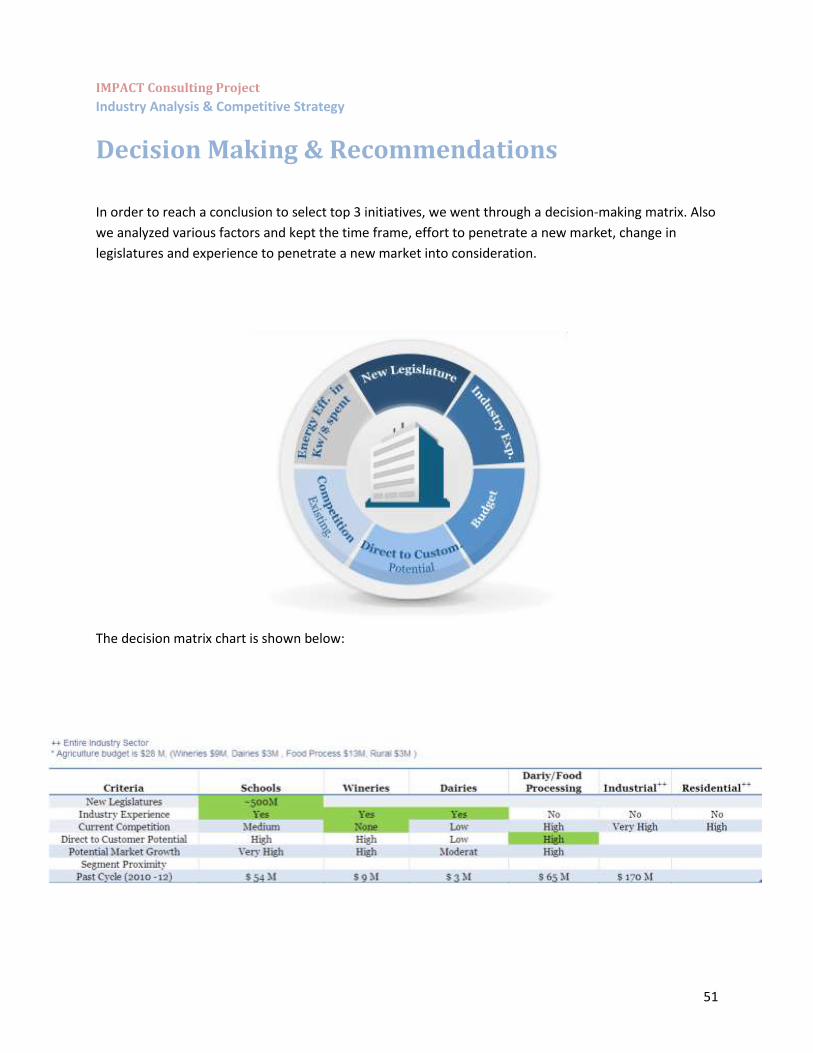
Decision Making & Recommendations
In order to reach a conclusion to select top 3 initiatives, we went through a decision-making matrix. Also
we analyzed various factors and kept the time frame, effort to penetrate a new market, change in
legislatures and experience to penetrate a new market into consideration.
The decision matrix chart is shown below:
IMPACT Consulting Project
Industry Analysis & Competitive Strategy
52
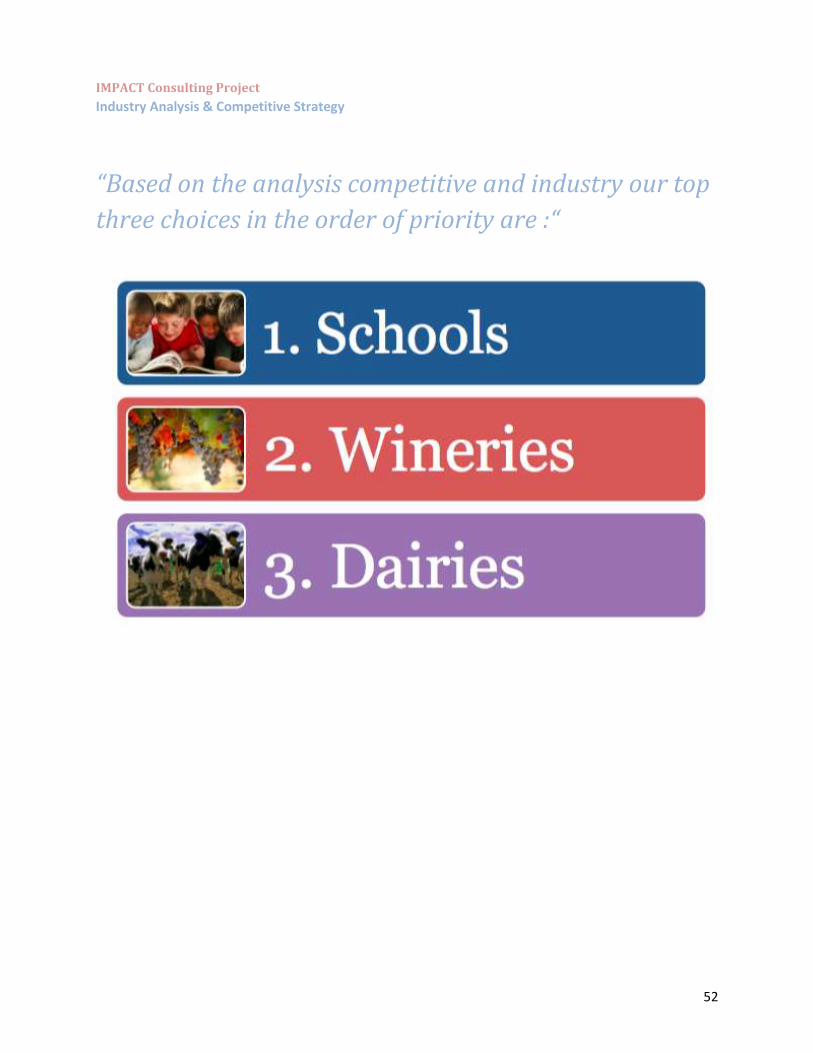
“Based on the analysis competitive and industry our top
three choices in the order of priority are :“
IMPACT Consulting Project
Industry Analysis & Competitive Strategy
53
Appendix

IMPACT Consulting Project
Industry Analysis & Competitive Strategy
54
Appendix (Dairy Exhibits)
Exhibit 1: Milk Product Import Trend
Exhibit 2: Agricultural IOU Sector Funding 2013-2014

IMPACT Consulting Project
Industry Analysis & Competitive Strategy
55
Exhibit 3: Northern California Large Dairy Farms by County
Exhibit 4: Southern California Large Dairy Farms by County
Exhibit 5: Dairy Product Manufacturing by County
Related Documents


