sensors Article Energy-Efficient Ultrasonic Water Level Detection System with Dual-Target Monitoring Sanggoo Kang, Dafnik Saril Kumar David, Muil Yang, Yin Chao Yu and Suyun Ham * Citation: Kang, S.; David, D.S.K.; Yang, M.; Yu, Y.C.; Ham, S. Energy-Efficient Ultrasonic Water Level Detection System with Dual-Target Monitoring. Sensors 2021, 21, 2241. https://doi.org/10.3390/ s21062241 Academic Editor: Miguel Ardid Ramírez Received: 9 January 2021 Accepted: 19 March 2021 Published: 23 March 2021 Publisher’s Note: MDPI stays neutral with regard to jurisdictional claims in published maps and institutional affil- iations. Copyright: © 2021 by the authors. Licensee MDPI, Basel, Switzerland. This article is an open access article distributed under the terms and conditions of the Creative Commons Attribution (CC BY) license (https:// creativecommons.org/licenses/by/ 4.0/). Department of Civil Engineering, The University of Texas at Arlington, Arlington, TX 76019, USA; [email protected] (S.K.); [email protected] (D.S.K.D.); [email protected] (M.Y.); [email protected] (Y.C.Y.) * Correspondence: [email protected]; Tel.: +1-817-272-5217 Abstract: This study presents a developed ultrasonic water level detection (UWLD) system with an energy-efficient design and dual-target monitoring. The water level monitoring system with a non-contact sensor is one of the suitable methods since it is not directly exposed to water. In addition, a web-based monitoring system using a cloud computing platform is a well-known technique to provide real-time water level monitoring. However, the long-term stable operation of remotely communicating units is an issue for real-time water level monitoring. Therefore, this paper proposes a UWLD unit using a low-power consumption design for renewable energy harvesting (e.g., solar) by controlling the unit with dual microcontrollers (MCUs) to improve the energy efficiency of the system. In addition, dual targeting to the pavement and streamside is uniquely designed to monitor both the urban inundation and stream overflow. The real-time water level monitoring data obtained from the proposed UWLD system is analyzed with water level changing rate (WLCR) and water level index. The quantified WLCR and water level index with various sampling rates present a different sensitivity to heavy rain. Keywords: ultrasonic water level detection; dual microcontroller; dual targeting; cloud-based computing platform; water level changing rate; renewable energy 1. Introduction Floods are one of the most frequent natural disasters, not only causing costly damage to infrastructure and property but also causing injuries and fatalities. Due to the severity of these effects, water level monitoring and flood warning are extremely important. Heavy rainfall can lead to overflow of streams and urban inundation. In some cases, flash floods that cannot be drained in time cause urban inundation without stream overflow. Thus, the monitoring of both urban inundation and stream overflow is significant to prevent losses. The water level change is one of the most common and straightforward indicators considering different channel/stream conditions such as geometrical impact, drain condition, and groundwater recharging condition. For flood monitoring, on-site water level measurement facilities are used, such as rainfall observation stations, water level observation stations, and meteorological centers. Although these on-site stations can measure the water level change and issue flood warnings instantly, it is costly to build, maintain, and operate such facilities and they pose a spatial limitation problem [1]. As the demand for accurate flood monitoring has increased, a cost-effective water level detection and real-time monitoring system has been studied in meteorology and engineering. To monitor water level, four types of water level sensors are commonly used: bubble gauges [2], float gauges [3], pressure sensors [4], and non-contact distance sensors [1,4–6]. Methods using the bubble gauge, float gauge, and pressure sensor are applied for a longer time than the method utilizing the non-contact distance sensor, such as ultrasound sensor [7] and radar [8]. Those devices are hard to maintain when the proper installation points are limited with additional efforts to measure the level on the site and Sensors 2021, 21, 2241. https://doi.org/10.3390/s21062241 https://www.mdpi.com/journal/sensors

Welcome message from author
This document is posted to help you gain knowledge. Please leave a comment to let me know what you think about it! Share it to your friends and learn new things together.
Transcript
sensors
Article
Energy-Efficient Ultrasonic Water Level Detection System withDual-Target Monitoring
Sanggoo Kang, Dafnik Saril Kumar David, Muil Yang, Yin Chao Yu and Suyun Ham *
�����������������
Citation: Kang, S.; David, D.S.K.;
Yang, M.; Yu, Y.C.; Ham, S.
Energy-Efficient Ultrasonic Water
Level Detection System with
Dual-Target Monitoring. Sensors 2021,
21, 2241. https://doi.org/10.3390/
s21062241
Academic Editor: Miguel
Ardid Ramírez
Received: 9 January 2021
Accepted: 19 March 2021
Published: 23 March 2021
Publisher’s Note: MDPI stays neutral
with regard to jurisdictional claims in
published maps and institutional affil-
iations.
Copyright: © 2021 by the authors.
Licensee MDPI, Basel, Switzerland.
This article is an open access article
distributed under the terms and
conditions of the Creative Commons
Attribution (CC BY) license (https://
creativecommons.org/licenses/by/
4.0/).
Department of Civil Engineering, The University of Texas at Arlington, Arlington, TX 76019, USA;[email protected] (S.K.); [email protected] (D.S.K.D.);[email protected] (M.Y.); [email protected] (Y.C.Y.)* Correspondence: [email protected]; Tel.: +1-817-272-5217
Abstract: This study presents a developed ultrasonic water level detection (UWLD) system withan energy-efficient design and dual-target monitoring. The water level monitoring system with anon-contact sensor is one of the suitable methods since it is not directly exposed to water. In addition,a web-based monitoring system using a cloud computing platform is a well-known technique toprovide real-time water level monitoring. However, the long-term stable operation of remotelycommunicating units is an issue for real-time water level monitoring. Therefore, this paper proposesa UWLD unit using a low-power consumption design for renewable energy harvesting (e.g., solar)by controlling the unit with dual microcontrollers (MCUs) to improve the energy efficiency of thesystem. In addition, dual targeting to the pavement and streamside is uniquely designed to monitorboth the urban inundation and stream overflow. The real-time water level monitoring data obtainedfrom the proposed UWLD system is analyzed with water level changing rate (WLCR) and water levelindex. The quantified WLCR and water level index with various sampling rates present a differentsensitivity to heavy rain.
Keywords: ultrasonic water level detection; dual microcontroller; dual targeting; cloud-basedcomputing platform; water level changing rate; renewable energy
1. Introduction
Floods are one of the most frequent natural disasters, not only causing costly damageto infrastructure and property but also causing injuries and fatalities. Due to the severityof these effects, water level monitoring and flood warning are extremely important. Heavyrainfall can lead to overflow of streams and urban inundation. In some cases, flashfloods that cannot be drained in time cause urban inundation without stream overflow.Thus, the monitoring of both urban inundation and stream overflow is significant toprevent losses. The water level change is one of the most common and straightforwardindicators considering different channel/stream conditions such as geometrical impact,drain condition, and groundwater recharging condition. For flood monitoring, on-sitewater level measurement facilities are used, such as rainfall observation stations, waterlevel observation stations, and meteorological centers. Although these on-site stations canmeasure the water level change and issue flood warnings instantly, it is costly to build,maintain, and operate such facilities and they pose a spatial limitation problem [1].
As the demand for accurate flood monitoring has increased, a cost-effective waterlevel detection and real-time monitoring system has been studied in meteorology andengineering. To monitor water level, four types of water level sensors are commonlyused: bubble gauges [2], float gauges [3], pressure sensors [4], and non-contact distancesensors [1,4–6]. Methods using the bubble gauge, float gauge, and pressure sensor areapplied for a longer time than the method utilizing the non-contact distance sensor, suchas ultrasound sensor [7] and radar [8]. Those devices are hard to maintain when the properinstallation points are limited with additional efforts to measure the level on the site and
Sensors 2021, 21, 2241. https://doi.org/10.3390/s21062241 https://www.mdpi.com/journal/sensors
Sensors 2021, 21, 2241 2 of 18
frequent maintenance [1]. The non-contact ultrasonic sensor has been developed anddeployed in many areas for those challenges [9,10]. Water level detection with non-contactsensors has been studied due to its convenience by not being directly exposed to water,which can cause constant degradation [9]. The reliability of water level measurements iscritical for monitoring-based flood warnings under the changing external environmentcondition without false alarm. The airborne wave speed change by the temperature andmoving average fitting are also considered to obtain a reliable water level with a non-contactultrasonic sensor [7].
Real-time monitoring systems have been studied with the development of the inter-connection in the network of devices. The development leads to networking capabilitiesbetween sensors and software or computing platforms, which allow users to access datain a short time [11–14]. The components of the typical monitoring system consist of amodule controller, a wireless network module, a data server, and a user interface platform.The general data flow between the components is (1) the microcontroller (MCU) controlssensors, and the sensors detect the water level [4,9–11]; (2) the collected water level data istransmitted via the networking system, such as a wireless sensor network (WSN) [15] ora cellular network [4,9,12]; (3) the transferred data is stored to the data server, such as aweb server [9,12–14] or a personal computer-based server [15]; and (4) the stored data isprocessed and presented by the computing platform, such as a web-GIS platform [11,16],customized software [15], or cloud computing platform [17].
Power management and power consumption minimization of the unit with renew-able energy harvesting are also important in order to ensure a long-term stable operation.Single MCU application for the unit operating remotely at certain intervals provides asleep mode for power saving in the MCU [4,5,9,14,18,19]; however, there is a possibility ofunexpected current consumption in the single MCU system during the sleep mode fromconnected peripherals (e.g., sensor and other modules). Although there are efforts to utilizea self-powered water level sensor to harvest energy from liquid-solid contact [20–22], itis inapplicable to non-contact sensors. Advanced power management technique in pro-gramming level is studied using power management application programming interfaces(APIs) [23]. Although the advanced power management system of API method [23] andintegrated circuits using Maximum Power Point Tracker chip [24] method are consider-able to manage the system power, these approaches are possibly limited to specific dataprocessing or control design.
This paper presents works conducted to overcome key technical barriers for operatinga remotely controlled water level detection unit in terms of low-cost and power-efficientultrasonic water level detection (UWLD). Furthermore, we apply a dual-targeting system,which is the first study to monitor the water level on both pavement and streamside forthe urban inundation and stream overflow monitoring. For this purpose, we developand introduce a low-cost UWLD unit using a single-MCU system and cloud computingplatform. The proposed UWLD unit is evaluated in terms of power consumption andimproved energy efficiency by adopting a dual-MCU system: the dual-MCU systemdeploys a secondary low power consumption MCU to further reduce battery consumption(see Section 2.3 for more detail). Finally, we obtain 5-month water level monitoring datafrom the developed UWLD system. The obtained data is analyzed with water levelchanging rate (WLCR) and water level index (WLI) to discuss the time-sensitive waterlevel detection for the flood warning system. The findings reveal the potential for waterlevel monitor presenting water level changes in higher sampling rate on both pavementand streamside and demonstrates the energy efficiency of the developed unit.
2. Methodology
Three versions of the low-cost system will be introduced and compared: proposedbasic UWLD system (UWLD-1) with single MCU and single target; dual-target UWLD(UWLD-2) of the unit to detect the water level change on both pavement and streamside;and dual-target UWLD with highly energy-efficient design by using dual MCUs (UWLD-3).
Sensors 2021, 21, 2241 3 of 18
2.1. UWLD-1: Development of Basic Low-Cost UWLD System2.1.1. Proposed Basic UWLD System
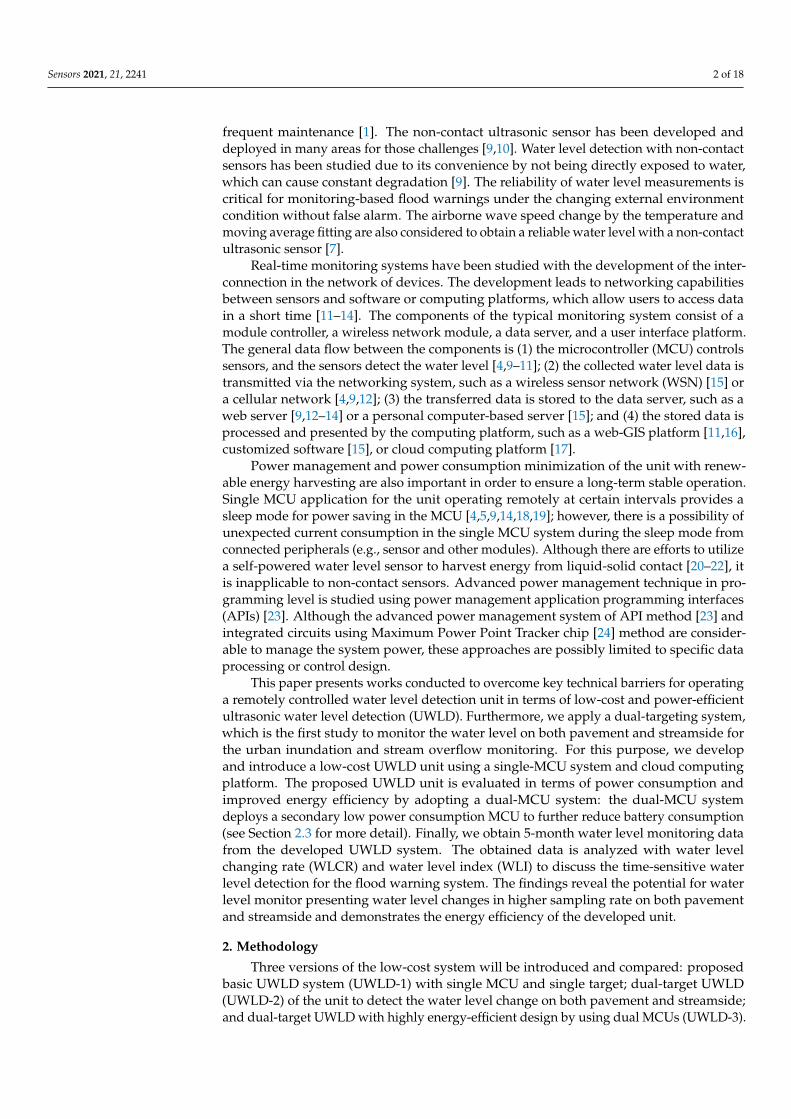
The low-cost UWLD system is developed with measuring sensors, MCU, cellularmodule, and a battery with a charging system. The material cost of the developed UWLDunit is relatively low (less than $250) compared to other commercial stations, and it allowsmore units at different locations to be installed to obtain the more localized and higherresolution of monitoring data. The main part of the UWLD system consists of low-costunits, including a data acquisition system and a real-time cloud computing platform.The system representation of the UWLD is shown in Figure 1. Two kinds of sensors, anultrasonic sensor (MB7386 HRXL, MaxBotix, Brainerd, MN, USA) and a temperature sensor(DS18B20, Adafruit, New York, NY, USA), are deployed to collect data from the site. Theultrasonic sensor is deployed to calculate the air gap distance between the sensor andthe water surface by two-way travel time (TWT) distance measurement. The sensor hasa central frequency of 42 kHz with a 6 Hz maximum sampling rate providing transistor-transistor logic (TTL) serial interface. The TTL serial output includes pulse width datarepresenting the distance between the sensor and water surface. The hard target ultrasonicsensor is selected to reduce the acoustic sensitivity since the higher acoustic sensitivitysensor possibly captures more outside noise sources as a signal. The temperature sensor isdeployed to increase the accuracy of the distance from the ultrasonic sensor by correctingit with the temperature effect on the speed of sound. The low-cost MCU (ATmega644PA-PU, Microchip, Chandler, AZ, USA) is deployed to control these two sensors. For thenetworking system, the cellular module is deployed to transfer the data collected by theUWLD unit to the cloud computing platform server for real-time data plotting. The solarpanel, battery charger, and battery are installed to supply stable power to the UWLD unit.The battery charger has a load-sharing function that allows the solar panel to charge thebattery and to supply power to the system simultaneously. The load-sharing charger iseffectively operated during the daytime when the solar panel generates more electricitythan the unit demands for operating the UWLD system.
Sensors 2021, 21, x FOR PEER REVIEW 3 of 19
(UWLD-2) of the unit to detect the water level change on both pavement and streamside;
and dual-target UWLD with highly energy-efficient design by using dual MCUs (UWLD-
3).
2.1. UWLD-1: Development of Basic Low-Cost UWLD System
2.1.1. Proposed Basic UWLD System
The low-cost UWLD system is developed with measuring sensors, MCU, cellular
module, and a battery with a charging system. The material cost of the developed UWLD
unit is relatively low (less than $250) compared to other commercial stations, and it allows
more units at different locations to be installed to obtain the more localized and higher
resolution of monitoring data. The main part of the UWLD system consists of low-cost
units, including a data acquisition system and a real-time cloud computing platform. The
system representation of the UWLD is shown in Figure 1. Two kinds of sensors, an ultra-
sonic sensor (MB7386 HRXL, MaxBotix, Brainerd, MN, USA) and a temperature sensor
(DS18B20, Adafruit, New York, NY, USA), are deployed to collect data from the site. The
ultrasonic sensor is deployed to calculate the air gap distance between the sensor and the
water surface by two-way travel time (TWT) distance measurement. The sensor has a cen-
tral frequency of 42 kHz with a 6 Hz maximum sampling rate providing transistor-tran-
sistor logic (TTL) serial interface. The TTL serial output includes pulse width data repre-
senting the distance between the sensor and water surface. The hard target ultrasonic sen-
sor is selected to reduce the acoustic sensitivity since the higher acoustic sensitivity sensor
possibly captures more outside noise sources as a signal. The temperature sensor is de-
ployed to increase the accuracy of the distance from the ultrasonic sensor by correcting it
with the temperature effect on the speed of sound. The low-cost MCU (ATmega644PA-
PU, Microchip, Chandler, AZ, USA) is deployed to control these two sensors. For the net-
working system, the cellular module is deployed to transfer the data collected by the
UWLD unit to the cloud computing platform server for real-time data plotting. The solar
panel, battery charger, and battery are installed to supply stable power to the UWLD unit.
The battery charger has a load-sharing function that allows the solar panel to charge the
battery and to supply power to the system simultaneously. The load-sharing charger is
effectively operated during the daytime when the solar panel generates more electricity
than the unit demands for operating the UWLD system.
Figure 1. System representation of the basic UWLD system: real-time user interface platform plot-
ting real-time temperature and water level (left) and UWLD-1 unit representation (right). It im-
plies the data from the remote UWLD unit can be monitored in real-time on the website.
Figure 1. System representation of the basic UWLD system: real-time user interface platform plottingreal-time temperature and water level (left) and UWLD-1 unit representation (right). It implies thedata from the remote UWLD unit can be monitored in real-time on the website.
The proposed UWLD system undergoes a cycle of a process consisting of two modes:operating mode and power-saving mode. In the operating mode, the system collects waterlevel data and sends them to the webserver. After the data collection, the UWLD systemproceeds to the power-saving mode to reduce battery consumption. Sleep mode usingcomputer operating properly (COP) timer in the MCU is initially deployed for the power-
Sensors 2021, 21, 2241 4 of 18
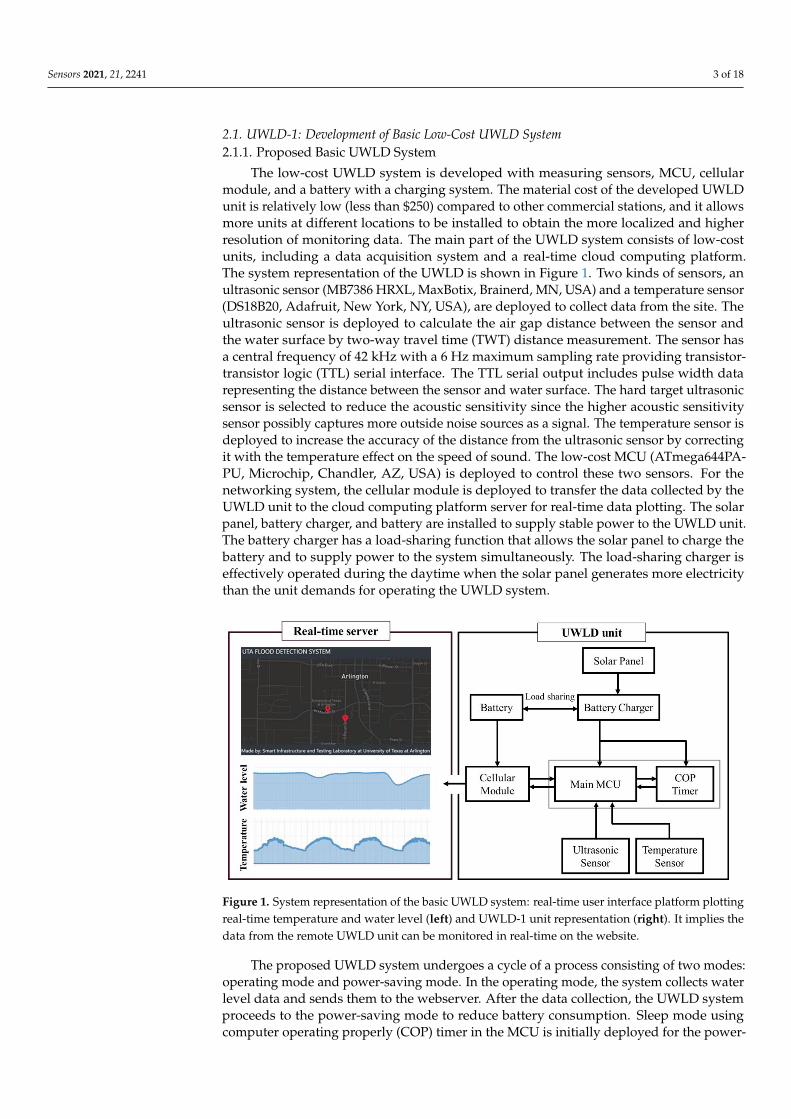
saving. This COP timer, called a watchdog timer, controls the mode of MCU by restoringthe system with a certain sleep time after the operating mode. The detail of the UWLD-1system is described in Figure 2 flowchart. The flowchart shows two decisions to preventthe system fault. Decision 1 is to check the communication between the cellular moduleand the MCU by inspecting the Global System for Mobile Communications (GSM) moduleconnectivity. Decision 2 is to check the system operation by confining the completion timeof one cycle of data collecting and transferring within 1 min. The single cycle is typicallycompleted within 30 s; thus, a system fault occurs if it takes longer than a minute. With thefalse condition in the decision, the COP timer reboots the system to conduct the additionalmonitoring cycle.
Sensors 2021, 21, x FOR PEER REVIEW 4 of 19
The proposed UWLD system undergoes a cycle of a process consisting of two modes:
operating mode and power-saving mode. In the operating mode, the system collects water
level data and sends them to the webserver. After the data collection, the UWLD system
proceeds to the power-saving mode to reduce battery consumption. Sleep mode using
computer operating properly (COP) timer in the MCU is initially deployed for the power-
saving. This COP timer, called a watchdog timer, controls the mode of MCU by restoring
the system with a certain sleep time after the operating mode. The detail of the UWLD-1
system is described in Figure 2 flowchart. The flowchart shows two decisions to prevent
the system fault. Decision 1 is to check the communication between the cellular module
and the MCU by inspecting the Global System for Mobile Communications (GSM) mod-
ule connectivity. Decision 2 is to check the system operation by confining the completion
time of one cycle of data collecting and transferring within 1 min. The single cycle is typ-
ically completed within 30 s; thus, a system fault occurs if it takes longer than a minute.
With the false condition in the decision, the COP timer reboots the system to conduct the
additional monitoring cycle.
An error occurs
Figure 2. Flowchart of basic low-cost UWLD system with a single MCU and an ultrasonic sensor.
Sensors 2021, 21, 2241 5 of 18
2.1.2. Water Level Detection
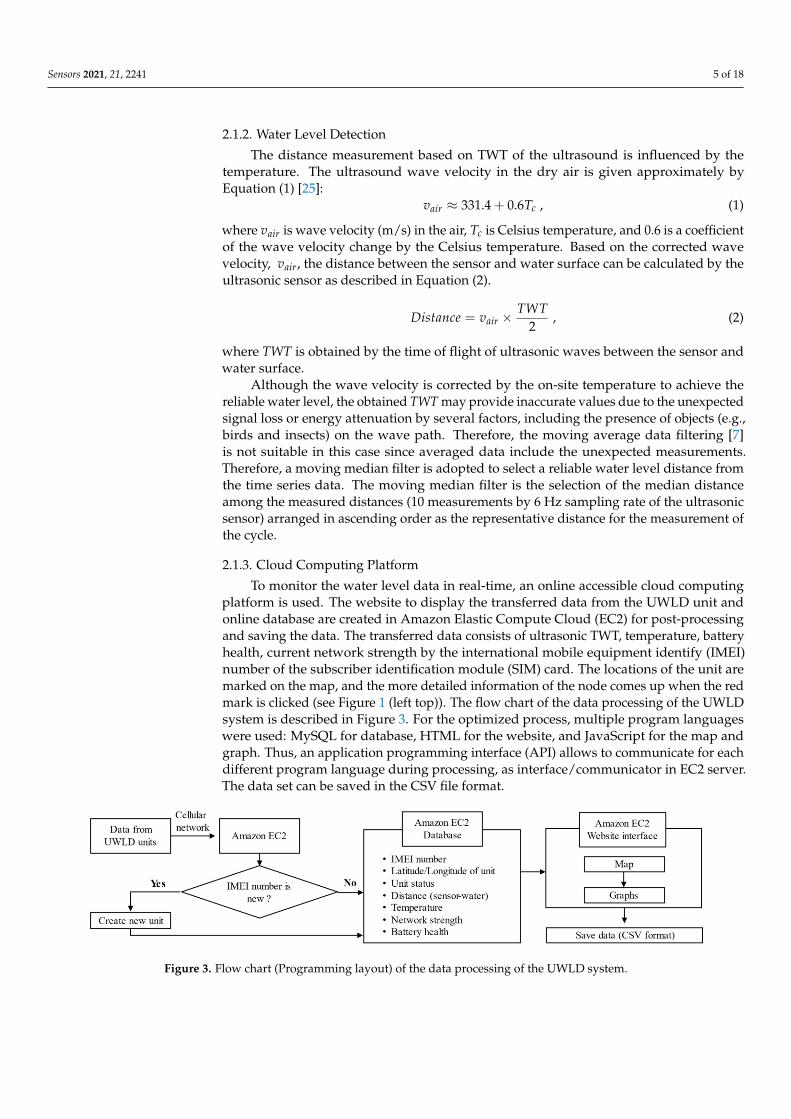
The distance measurement based on TWT of the ultrasound is influenced by thetemperature. The ultrasound wave velocity in the dry air is given approximately byEquation (1) [25]:
vair ≈ 331.4 + 0.6Tc , (1)
where vair is wave velocity (m/s) in the air, Tc is Celsius temperature, and 0.6 is a coefficientof the wave velocity change by the Celsius temperature. Based on the corrected wavevelocity, vair, the distance between the sensor and water surface can be calculated by theultrasonic sensor as described in Equation (2).
Distance = vair ×TWT
2, (2)
where TWT is obtained by the time of flight of ultrasonic waves between the sensor andwater surface.
Although the wave velocity is corrected by the on-site temperature to achieve thereliable water level, the obtained TWT may provide inaccurate values due to the unexpectedsignal loss or energy attenuation by several factors, including the presence of objects (e.g.,birds and insects) on the wave path. Therefore, the moving average data filtering [7]is not suitable in this case since averaged data include the unexpected measurements.Therefore, a moving median filter is adopted to select a reliable water level distance fromthe time series data. The moving median filter is the selection of the median distanceamong the measured distances (10 measurements by 6 Hz sampling rate of the ultrasonicsensor) arranged in ascending order as the representative distance for the measurement ofthe cycle.
2.1.3. Cloud Computing Platform
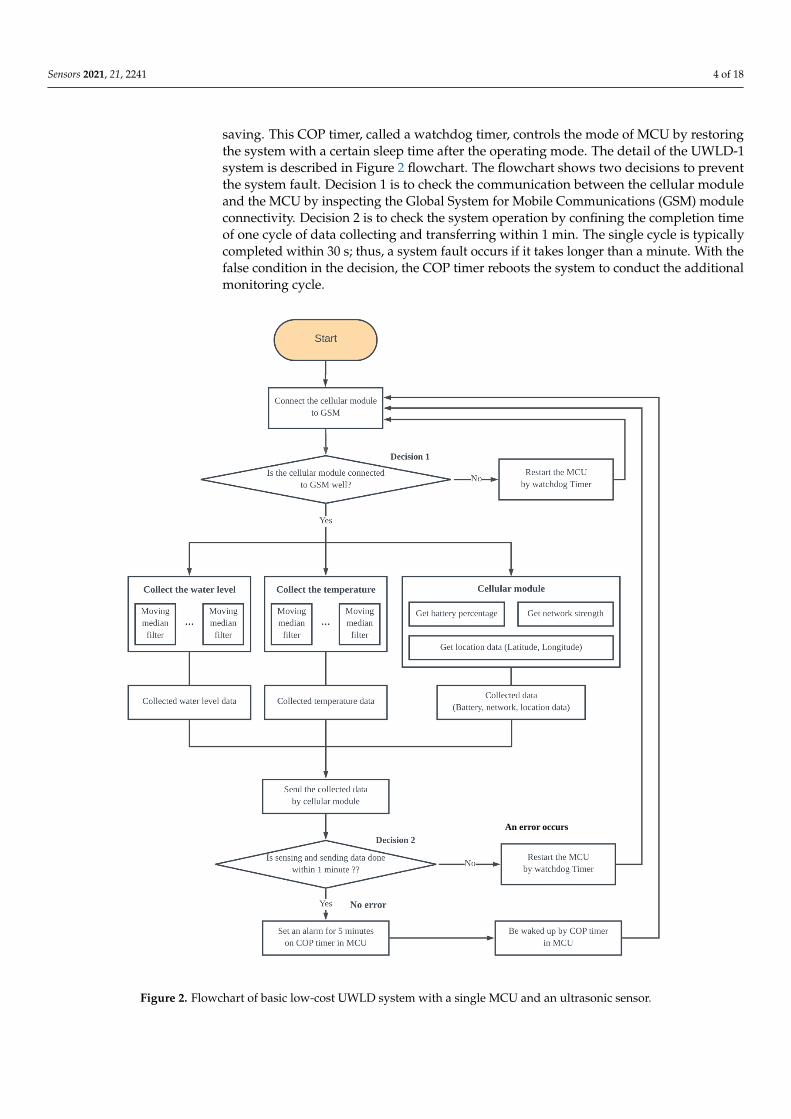
To monitor the water level data in real-time, an online accessible cloud computingplatform is used. The website to display the transferred data from the UWLD unit andonline database are created in Amazon Elastic Compute Cloud (EC2) for post-processingand saving the data. The transferred data consists of ultrasonic TWT, temperature, batteryhealth, current network strength by the international mobile equipment identify (IMEI)number of the subscriber identification module (SIM) card. The locations of the unit aremarked on the map, and the more detailed information of the node comes up when the redmark is clicked (see Figure 1 (left top)). The flow chart of the data processing of the UWLDsystem is described in Figure 3. For the optimized process, multiple program languageswere used: MySQL for database, HTML for the website, and JavaScript for the map andgraph. Thus, an application programming interface (API) allows to communicate for eachdifferent program language during processing, as interface/communicator in EC2 server.The data set can be saved in the CSV file format.
Sensors 2021, 21, x FOR PEER REVIEW 5 of 19
Figure 2. Flowchart of basic low-cost UWLD system with a single MCU and an ultrasonic sensor.
2.1.2. Water Level Detection
The distance measurement based on TWT of the ultrasound is influenced by the tem-
perature. The ultrasound wave velocity in the dry air is given approximately by Equation
(1) [25]:
𝑣𝑎𝑖𝑟 ≈ 331.4 + 0.6𝑇𝑐 , (1)
where 𝑣𝑎𝑖𝑟 is wave velocity (m/s) in the air, 𝑇𝑐 is Celsius temperature, and 0.6 is a coeffi-
cient of the wave velocity change by the Celsius temperature. Based on the corrected wave
velocity, 𝑣𝑎𝑖𝑟, the distance between the sensor and water surface can be calculated by the
ultrasonic sensor as described in Equation (2).
𝐷𝑖𝑠𝑡𝑎𝑛𝑐𝑒 = 𝑣𝑎𝑖𝑟 ×𝑇𝑊𝑇
2 , (2)
where TWT is obtained by the time of flight of ultrasonic waves between the sensor and
water surface.
Although the wave velocity is corrected by the on-site temperature to achieve the
reliable water level, the obtained TWT may provide inaccurate values due to the unex-
pected signal loss or energy attenuation by several factors, including the presence of ob-
jects (e.g., birds and insects) on the wave path. Therefore, the moving average data filter-
ing [7] is not suitable in this case since averaged data include the unexpected measure-
ments. Therefore, a moving median filter is adopted to select a reliable water level distance
from the time series data. The moving median filter is the selection of the median distance
among the measured distances (10 measurements by 6 Hz sampling rate of the ultrasonic
sensor) arranged in ascending order as the representative distance for the measurement
of the cycle.
2.1.3. Cloud Computing Platform
To monitor the water level data in real-time, an online accessible cloud computing
platform is used. The website to display the transferred data from the UWLD unit and
online database are created in Amazon Elastic Compute Cloud (EC2) for post-processing
and saving the data. The transferred data consists of ultrasonic TWT, temperature, battery
health, current network strength by the international mobile equipment identify (IMEI)
number of the subscriber identification module (SIM) card. The locations of the unit are
marked on the map, and the more detailed information of the node comes up when the
red mark is clicked (see Figure 1 (left top)). The flow chart of the data processing of the
UWLD system is described in Figure 3. For the optimized process, multiple program lan-
guages were used: MySQL for database, HTML for the website, and JavaScript for the
map and graph. Thus, an application programming interface (API) allows to communi-
cate for each different program language during processing, as interface/communicator
in EC2 server. The data set can be saved in the CSV file format.
Figure 3. Flow chart (Programming layout) of the data processing of the UWLD system. Figure 3. Flow chart (Programming layout) of the data processing of the UWLD system.
Sensors 2021, 21, 2241 6 of 18
2.2. UWLD-2: Dual Target Sensing of UWLD
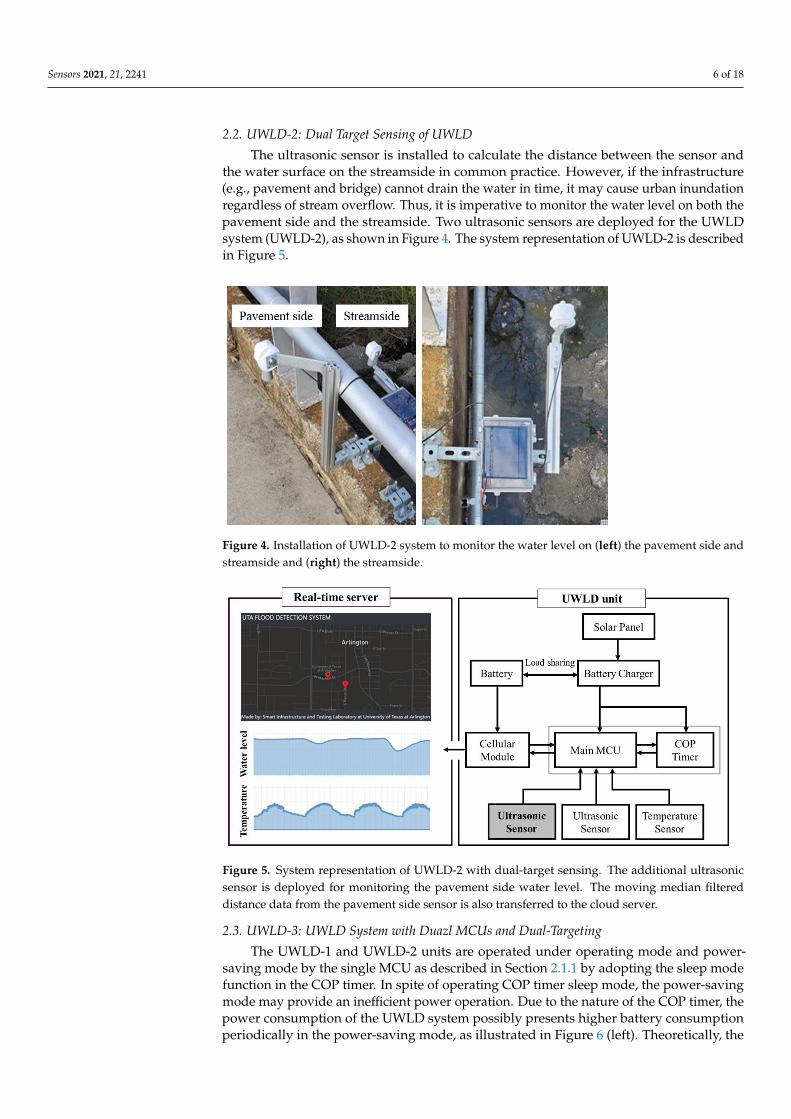
The ultrasonic sensor is installed to calculate the distance between the sensor andthe water surface on the streamside in common practice. However, if the infrastructure(e.g., pavement and bridge) cannot drain the water in time, it may cause urban inundationregardless of stream overflow. Thus, it is imperative to monitor the water level on both thepavement side and the streamside. Two ultrasonic sensors are deployed for the UWLDsystem (UWLD-2), as shown in Figure 4. The system representation of UWLD-2 is describedin Figure 5.
Sensors 2021, 21, x FOR PEER REVIEW 6 of 19
2.2. UWLD-2: Dual Target Sensing of UWLD
The ultrasonic sensor is installed to calculate the distance between the sensor and the
water surface on the streamside in common practice. However, if the infrastructure (e.g.,
pavement and bridge) cannot drain the water in time, it may cause urban inundation re-
gardless of stream overflow. Thus, it is imperative to monitor the water level on both the
pavement side and the streamside. Two ultrasonic sensors are deployed for the UWLD
system (UWLD-2), as shown in Figure 4. The system representation of UWLD-2 is de-
scribed in Figure 5.
Figure 4. Installation of UWLD-2 system to monitor the water level on (left) the pavement side
and streamside and (right) the streamside.
Figure 5. System representation of UWLD-2 with dual-target sensing. The additional ultrasonic
sensor is deployed for monitoring the pavement side water level. . The moving median filtered
distance data from the pavement side sensor is also transferred to the cloud server.
2.3. UWLD-3: UWLD System with Duazl MCUs and Dual-Targeting
The UWLD-1 and UWLD-2 units are operated under operating mode and power-
saving mode by the single MCU as described in Section 2.1.1 by adopting the sleep mode
function in the COP timer. In spite of operating COP timer sleep mode, the power-saving
mode may provide an inefficient power operation. Due to the nature of the COP timer,
the power consumption of the UWLD system possibly presents higher battery consump-
tion periodically in the power-saving mode, as illustrated in Figure 6 (left). Theoretically,
the low-power stage in the power-saving mode by COP timer presents still significant
Figure 4. Installation of UWLD-2 system to monitor the water level on (left) the pavement side andstreamside and (right) the streamside.
Sensors 2021, 21, x FOR PEER REVIEW 6 of 19
2.2. UWLD-2: Dual Target Sensing of UWLD
The ultrasonic sensor is installed to calculate the distance between the sensor and the
water surface on the streamside in common practice. However, if the infrastructure (e.g.,
pavement and bridge) cannot drain the water in time, it may cause urban inundation re-
gardless of stream overflow. Thus, it is imperative to monitor the water level on both the
pavement side and the streamside. Two ultrasonic sensors are deployed for the UWLD
system (UWLD-2), as shown in Figure 4. The system representation of UWLD-2 is de-
scribed in Figure 5.
Figure 4. Installation of UWLD-2 system to monitor the water level on (left) the pavement side
and streamside and (right) the streamside.
Figure 5. System representation of UWLD-2 with dual-target sensing. The additional ultrasonic
sensor is deployed for monitoring the pavement side water level. . The moving median filtered
distance data from the pavement side sensor is also transferred to the cloud server.
2.3. UWLD-3: UWLD System with Duazl MCUs and Dual-Targeting
The UWLD-1 and UWLD-2 units are operated under operating mode and power-
saving mode by the single MCU as described in Section 2.1.1 by adopting the sleep mode
function in the COP timer. In spite of operating COP timer sleep mode, the power-saving
mode may provide an inefficient power operation. Due to the nature of the COP timer,
the power consumption of the UWLD system possibly presents higher battery consump-
tion periodically in the power-saving mode, as illustrated in Figure 6 (left). Theoretically,
the low-power stage in the power-saving mode by COP timer presents still significant
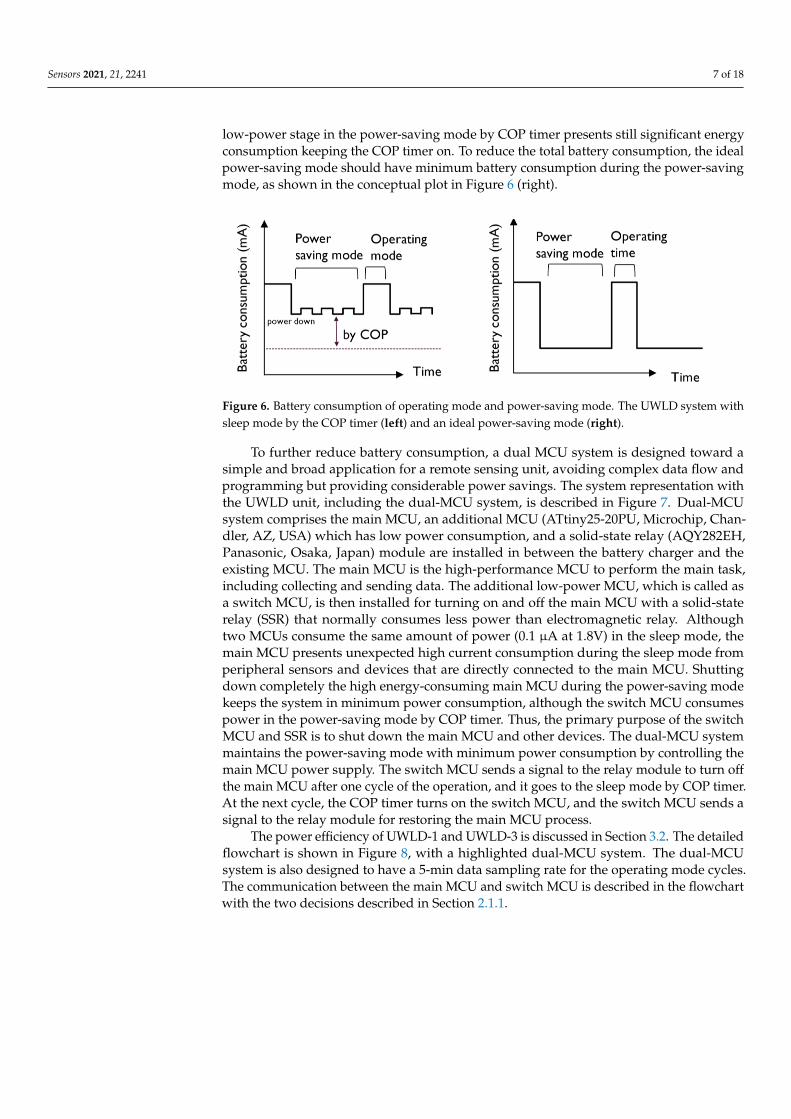
Figure 5. System representation of UWLD-2 with dual-target sensing. The additional ultrasonicsensor is deployed for monitoring the pavement side water level. The moving median filtereddistance data from the pavement side sensor is also transferred to the cloud server.
2.3. UWLD-3: UWLD System with Duazl MCUs and Dual-Targeting
The UWLD-1 and UWLD-2 units are operated under operating mode and power-saving mode by the single MCU as described in Section 2.1.1 by adopting the sleep modefunction in the COP timer. In spite of operating COP timer sleep mode, the power-savingmode may provide an inefficient power operation. Due to the nature of the COP timer, thepower consumption of the UWLD system possibly presents higher battery consumptionperiodically in the power-saving mode, as illustrated in Figure 6 (left). Theoretically, the
Sensors 2021, 21, 2241 7 of 18
low-power stage in the power-saving mode by COP timer presents still significant energyconsumption keeping the COP timer on. To reduce the total battery consumption, the idealpower-saving mode should have minimum battery consumption during the power-savingmode, as shown in the conceptual plot in Figure 6 (right).
Sensors 2021, 21, x FOR PEER REVIEW 7 of 19
energy consumption keeping the COP timer on. To reduce the total battery consumption,
the ideal power-saving mode should have minimum battery consumption during the
power-saving mode, as shown in the conceptual plot in Figure 6 (right).
Figure 6. Battery consumption of operating mode and power-saving mode. The UWLD system
with sleep mode by the COP timer (left) and an ideal power-saving mode (right).
To further reduce battery consumption, a dual MCU system is designed toward a
simple and broad application for a remote sensing unit, avoiding complex data flow and
programming but providing considerable power savings. The system representation with
the UWLD unit, including the dual-MCU system, is described in Figure 7. Dual-MCU sys-
tem comprises the main MCU, an additional MCU (ATtiny25-20PU, Microchip, Chandler,
AZ, USA) which has low power consumption, and a solid-state relay (AQY282EH, Pana-
sonic, Osaka, Japan) module are installed in between the battery charger and the existing
MCU. The main MCU is the high-performance MCU to perform the main task, including
collecting and sending data. The additional low-power MCU, which is called as a switch
MCU, is then installed for turning on and off the main MCU with a solid-state relay (SSR)
that normally consumes less power than electromagnetic relay. Although two MCUs con-
sume the same amount of power (0.1 µA at 1.8V) in the sleep mode, the main MCU pre-
sents unexpected high current consumption during the sleep mode from peripheral sen-
sors and devices that are directly connected to the main MCU. Shutting down completely
the high energy-consuming main MCU during the power-saving mode keeps the system
in minimum power consumption, although the switch MCU consumes power in the
power-saving mode by COP timer. Thus, the primary purpose of the switch MCU and
SSR is to shut down the main MCU and other devices. The dual-MCU system maintains
the power-saving mode with minimum power consumption by controlling the main MCU
power supply. The switch MCU sends a signal to the relay module to turn off the main
MCU after one cycle of the operation, and it goes to the sleep mode by COP timer. At the
next cycle, the COP timer turns on the switch MCU, and the switch MCU sends a signal
to the relay module for restoring the main MCU process.
The power efficiency of UWLD-1 and UWLD-3 is discussed in Section 3.2. The de-
tailed flowchart is shown in Figure 8, with a highlighted dual-MCU system. The dual-
MCU system is also designed to have a 5-min data sampling rate for the operating mode
cycles. The communication between the main MCU and switch MCU is described in the
flowchart with the two decisions described in Section 2.1.1.
Figure 6. Battery consumption of operating mode and power-saving mode. The UWLD system withsleep mode by the COP timer (left) and an ideal power-saving mode (right).
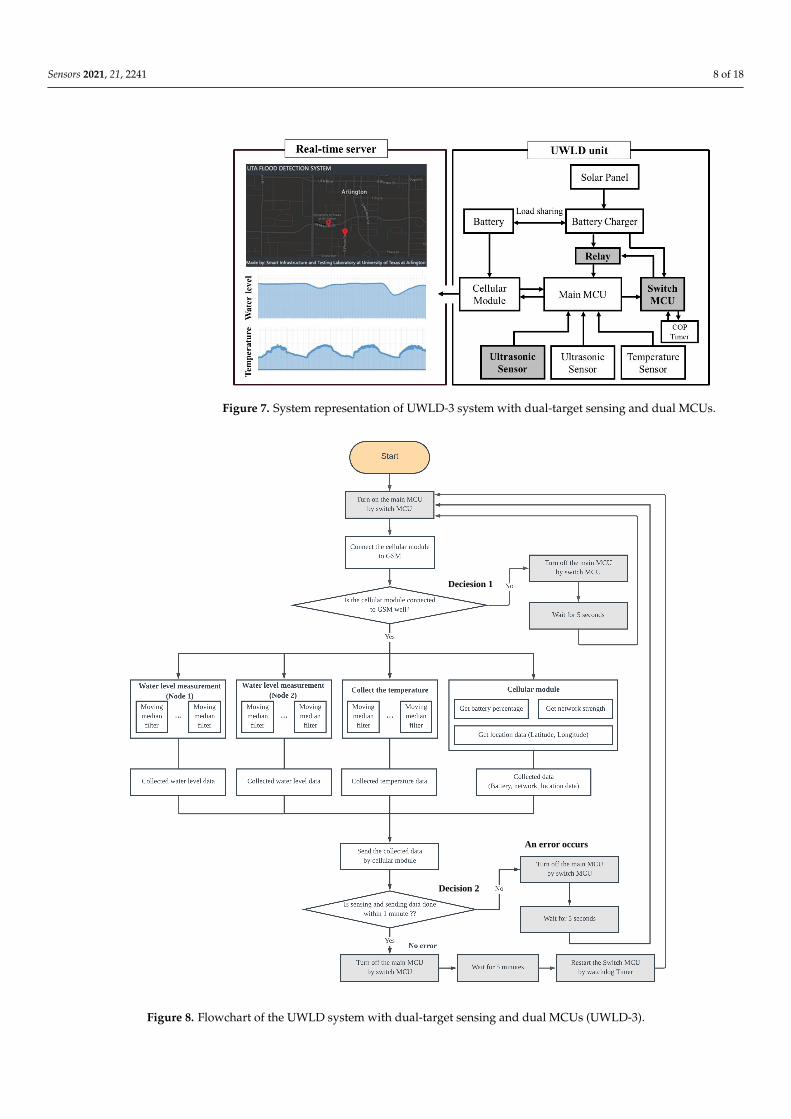
To further reduce battery consumption, a dual MCU system is designed toward asimple and broad application for a remote sensing unit, avoiding complex data flow andprogramming but providing considerable power savings. The system representation withthe UWLD unit, including the dual-MCU system, is described in Figure 7. Dual-MCUsystem comprises the main MCU, an additional MCU (ATtiny25-20PU, Microchip, Chan-dler, AZ, USA) which has low power consumption, and a solid-state relay (AQY282EH,Panasonic, Osaka, Japan) module are installed in between the battery charger and theexisting MCU. The main MCU is the high-performance MCU to perform the main task,including collecting and sending data. The additional low-power MCU, which is called asa switch MCU, is then installed for turning on and off the main MCU with a solid-staterelay (SSR) that normally consumes less power than electromagnetic relay. Althoughtwo MCUs consume the same amount of power (0.1 µA at 1.8V) in the sleep mode, themain MCU presents unexpected high current consumption during the sleep mode fromperipheral sensors and devices that are directly connected to the main MCU. Shuttingdown completely the high energy-consuming main MCU during the power-saving modekeeps the system in minimum power consumption, although the switch MCU consumespower in the power-saving mode by COP timer. Thus, the primary purpose of the switchMCU and SSR is to shut down the main MCU and other devices. The dual-MCU systemmaintains the power-saving mode with minimum power consumption by controlling themain MCU power supply. The switch MCU sends a signal to the relay module to turn offthe main MCU after one cycle of the operation, and it goes to the sleep mode by COP timer.At the next cycle, the COP timer turns on the switch MCU, and the switch MCU sends asignal to the relay module for restoring the main MCU process.
The power efficiency of UWLD-1 and UWLD-3 is discussed in Section 3.2. The detailedflowchart is shown in Figure 8, with a highlighted dual-MCU system. The dual-MCUsystem is also designed to have a 5-min data sampling rate for the operating mode cycles.The communication between the main MCU and switch MCU is described in the flowchartwith the two decisions described in Section 2.1.1.
Sensors 2021, 21, 2241 8 of 18
Sensors 2021, 21, x FOR PEER REVIEW 8 of 19
Figure 7. System representation of UWLD-3 system with dual-target sensing and dual MCUs.
Decision 2
Deciesion 1
An error occurs
Figure 7. System representation of UWLD-3 system with dual-target sensing and dual MCUs.
Sensors 2021, 21, x FOR PEER REVIEW 8 of 19
Figure 7. System representation of UWLD-3 system with dual-target sensing and dual MCUs.
Decision 2
Deciesion 1
An error occurs
Figure 8. Flowchart of the UWLD system with dual-target sensing and dual MCUs (UWLD-3).
Sensors 2021, 21, 2241 9 of 18
3. Results and Discussion3.1. Unit Installation and Calibration
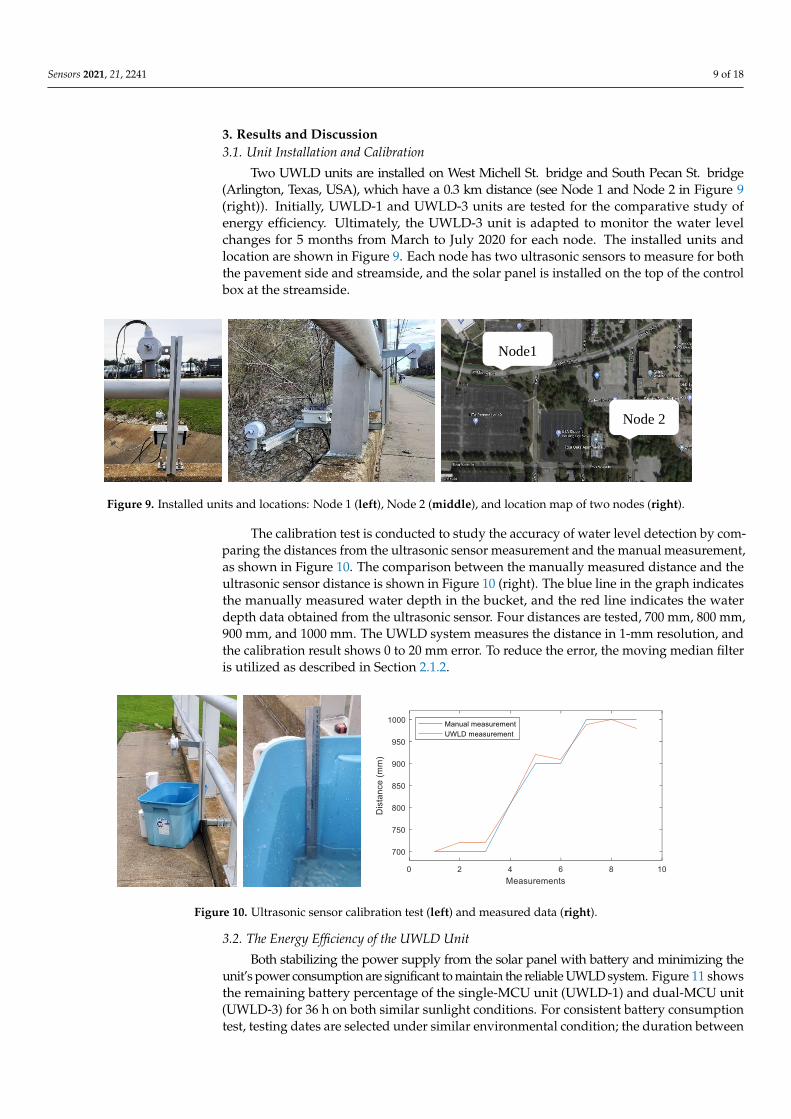
Two UWLD units are installed on West Michell St. bridge and South Pecan St. bridge(Arlington, Texas, USA), which have a 0.3 km distance (see Node 1 and Node 2 in Figure 9(right)). Initially, UWLD-1 and UWLD-3 units are tested for the comparative study ofenergy efficiency. Ultimately, the UWLD-3 unit is adapted to monitor the water levelchanges for 5 months from March to July 2020 for each node. The installed units andlocation are shown in Figure 9. Each node has two ultrasonic sensors to measure for boththe pavement side and streamside, and the solar panel is installed on the top of the controlbox at the streamside.
Sensors 2021, 21, x FOR PEER REVIEW 9 of 19
Figure 8. Flowchart of the UWLD system with dual-target sensing and dual MCUs (UWLD-3).
3. Results and Discussion
3.1. Unit Installation and Calibration
Two UWLD units are installed on West Michell St. bridge and South Pecan St. bridge
(Arlington, Texas, USA), which have a 0.3 km distance (see Node 1 and Node 2 in Figure
9 (right)). Initially, UWLD-1 and UWLD-3 units are tested for the comparative study of
energy efficiency. Ultimately, the UWLD-3 unit is adapted to monitor the water level
changes for 5 months from March to July 2020 for each node. The installed units and lo-
cation are shown in Figure 9. Each node has two ultrasonic sensors to measure for both
the pavement side and streamside, and the solar panel is installed on the top of the control
box at the streamside.
Figure 9. Installed units and locations: Node 1 (left), Node 2 (middle), and location map of two nodes (right).
The calibration test is conducted to study the accuracy of water level detection by
comparing the distances from the ultrasonic sensor measurement and the manual meas-
urement, as shown in Figure 10. The comparison between the manually measured dis-
tance and the ultrasonic sensor distance is shown in Figure 10 (right). The blue line in the
graph indicates the manually measured water depth in the bucket, and the red line indi-
cates the water depth data obtained from the ultrasonic sensor. Four distances are tested,
700 mm, 800 mm, 900 mm, and 1000 mm. The UWLD system measures the distance in 1-
mm resolution, and the calibration result shows 0 to 20 mm error. To reduce the error, the
moving median filter is utilized as described in Section 2.1.2.
Figure 10. Ultrasonic sensor calibration test (left) and measured data (right).
3.2. The Energy Efficiency of the UWLD Unit
Both stabilizing the power supply from the solar panel with battery and minimizing
the unit’s power consumption are significant to maintain the reliable UWLD system. Fig-
ure 11 shows the remaining battery percentage of the single-MCU unit (UWLD-1) and
Node1
Node 2
Figure 9. Installed units and locations: Node 1 (left), Node 2 (middle), and location map of two nodes (right).
The calibration test is conducted to study the accuracy of water level detection by com-paring the distances from the ultrasonic sensor measurement and the manual measurement,as shown in Figure 10. The comparison between the manually measured distance and theultrasonic sensor distance is shown in Figure 10 (right). The blue line in the graph indicatesthe manually measured water depth in the bucket, and the red line indicates the waterdepth data obtained from the ultrasonic sensor. Four distances are tested, 700 mm, 800 mm,900 mm, and 1000 mm. The UWLD system measures the distance in 1-mm resolution, andthe calibration result shows 0 to 20 mm error. To reduce the error, the moving median filteris utilized as described in Section 2.1.2.
Sensors 2021, 21, x FOR PEER REVIEW 9 of 19
Figure 8. Flowchart of the UWLD system with dual-target sensing and dual MCUs (UWLD-3).
3. Results and Discussion
3.1. Unit Installation and Calibration
Two UWLD units are installed on West Michell St. bridge and South Pecan St. bridge
(Arlington, Texas, USA), which have a 0.3 km distance (see Node 1 and Node 2 in Figure
9 (right)). Initially, UWLD-1 and UWLD-3 units are tested for the comparative study of
energy efficiency. Ultimately, the UWLD-3 unit is adapted to monitor the water level
changes for 5 months from March to July 2020 for each node. The installed units and lo-
cation are shown in Figure 9. Each node has two ultrasonic sensors to measure for both
the pavement side and streamside, and the solar panel is installed on the top of the control
box at the streamside.
Figure 9. Installed units and locations: Node 1 (left), Node 2 (middle), and location map of two nodes (right).
The calibration test is conducted to study the accuracy of water level detection by
comparing the distances from the ultrasonic sensor measurement and the manual meas-
urement, as shown in Figure 10. The comparison between the manually measured dis-
tance and the ultrasonic sensor distance is shown in Figure 10 (right). The blue line in the
graph indicates the manually measured water depth in the bucket, and the red line indi-
cates the water depth data obtained from the ultrasonic sensor. Four distances are tested,
700 mm, 800 mm, 900 mm, and 1000 mm. The UWLD system measures the distance in 1-
mm resolution, and the calibration result shows 0 to 20 mm error. To reduce the error, the
moving median filter is utilized as described in Section 2.1.2.
Figure 10. Ultrasonic sensor calibration test (left) and measured data (right).
3.2. The Energy Efficiency of the UWLD Unit
Both stabilizing the power supply from the solar panel with battery and minimizing
the unit’s power consumption are significant to maintain the reliable UWLD system. Fig-
ure 11 shows the remaining battery percentage of the single-MCU unit (UWLD-1) and
Node1
Node 2
Figure 10. Ultrasonic sensor calibration test (left) and measured data (right).
3.2. The Energy Efficiency of the UWLD Unit
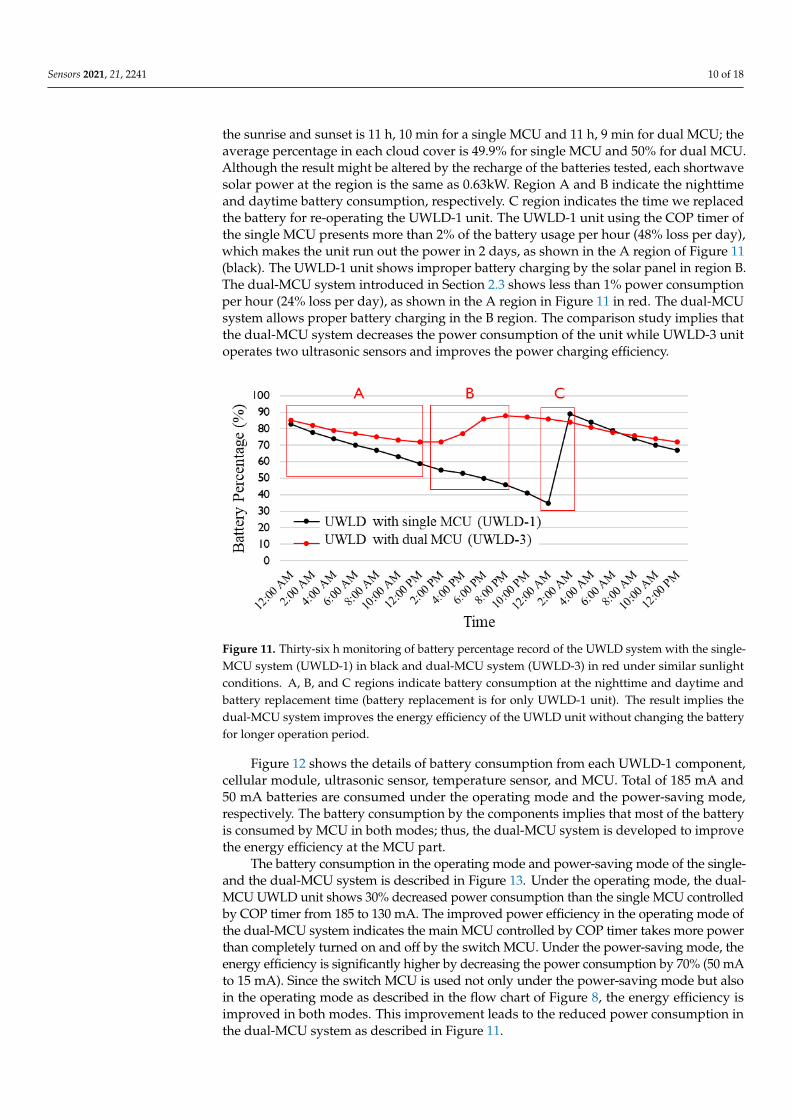
Both stabilizing the power supply from the solar panel with battery and minimizing theunit’s power consumption are significant to maintain the reliable UWLD system. Figure 11 showsthe remaining battery percentage of the single-MCU unit (UWLD-1) and dual-MCU unit(UWLD-3) for 36 h on both similar sunlight conditions. For consistent battery consumptiontest, testing dates are selected under similar environmental condition; the duration between
Sensors 2021, 21, 2241 10 of 18
the sunrise and sunset is 11 h, 10 min for a single MCU and 11 h, 9 min for dual MCU; theaverage percentage in each cloud cover is 49.9% for single MCU and 50% for dual MCU.Although the result might be altered by the recharge of the batteries tested, each shortwavesolar power at the region is the same as 0.63kW. Region A and B indicate the nighttimeand daytime battery consumption, respectively. C region indicates the time we replacedthe battery for re-operating the UWLD-1 unit. The UWLD-1 unit using the COP timer ofthe single MCU presents more than 2% of the battery usage per hour (48% loss per day),which makes the unit run out the power in 2 days, as shown in the A region of Figure 11(black). The UWLD-1 unit shows improper battery charging by the solar panel in region B.The dual-MCU system introduced in Section 2.3 shows less than 1% power consumptionper hour (24% loss per day), as shown in the A region in Figure 11 in red. The dual-MCUsystem allows proper battery charging in the B region. The comparison study implies thatthe dual-MCU system decreases the power consumption of the unit while UWLD-3 unitoperates two ultrasonic sensors and improves the power charging efficiency.
Sensors 2021, 21, x FOR PEER REVIEW 10 of 19
dual-MCU unit (UWLD-3) for 36 h on both similar sunlight conditions. For consistent bat-
tery consumption test, testing dates are selected under similar environmental condition;
the duration between the sunrise and sunset is 11 h, 10 min for a single MCU and 11 h, 9
min for dual MCU; the average percentage in each cloud cover is 49.9% for single MCU
and 50% for dual MCU. Although the result might be altered by the recharge of the bat-
teries tested, each shortwave solar power at the region is the same as 0.63kW. Region A
and B indicate the nighttime and daytime battery consumption, respectively. C region
indicates the time we replaced the battery for re-operating the UWLD-1 unit. The UWLD-
1 unit using the COP timer of the single MCU presents more than 2% of the battery usage
per hour (48% loss per day), which makes the unit run out the power in 2 days, as shown
in the A region of Figure 11 (black). The UWLD-1 unit shows improper battery charging
by the solar panel in region B. The dual-MCU system introduced in Section 2.3 shows less
than 1% power consumption per hour (24% loss per day), as shown in the A region in
Figure 11 in red. The dual-MCU system allows proper battery charging in the B region.
The comparison study implies that the dual-MCU system decreases the power consump-
tion of the unit while UWLD-3 unit operates two ultrasonic sensors and improves the
power charging efficiency.
Figure 11. Thirty-six h monitoring of battery percentage record of the UWLD system with the sin-
gle-MCU system (UWLD-1) in black and dual-MCU system (UWLD-3) in red under similar sun-
light conditions. A, B, and C regions indicate battery consumption at the nighttime and daytime
and battery replacement time (battery replacement is for only UWLD-1 unit). The result implies
the dual-MCU system improves the energy efficiency of the UWLD unit without changing the
battery for longer operation period.
Figure 12 shows the details of battery consumption from each UWLD-1 component,
cellular module, ultrasonic sensor, temperature sensor, and MCU. Total of 185 mA and 50
mA batteries are consumed under the operating mode and the power-saving mode, re-
spectively. The battery consumption by the components implies that most of the battery
is consumed by MCU in both modes; thus, the dual-MCU system is developed to improve
the energy efficiency at the MCU part.
Figure 11. Thirty-six h monitoring of battery percentage record of the UWLD system with the single-MCU system (UWLD-1) in black and dual-MCU system (UWLD-3) in red under similar sunlightconditions. A, B, and C regions indicate battery consumption at the nighttime and daytime andbattery replacement time (battery replacement is for only UWLD-1 unit). The result implies thedual-MCU system improves the energy efficiency of the UWLD unit without changing the batteryfor longer operation period.
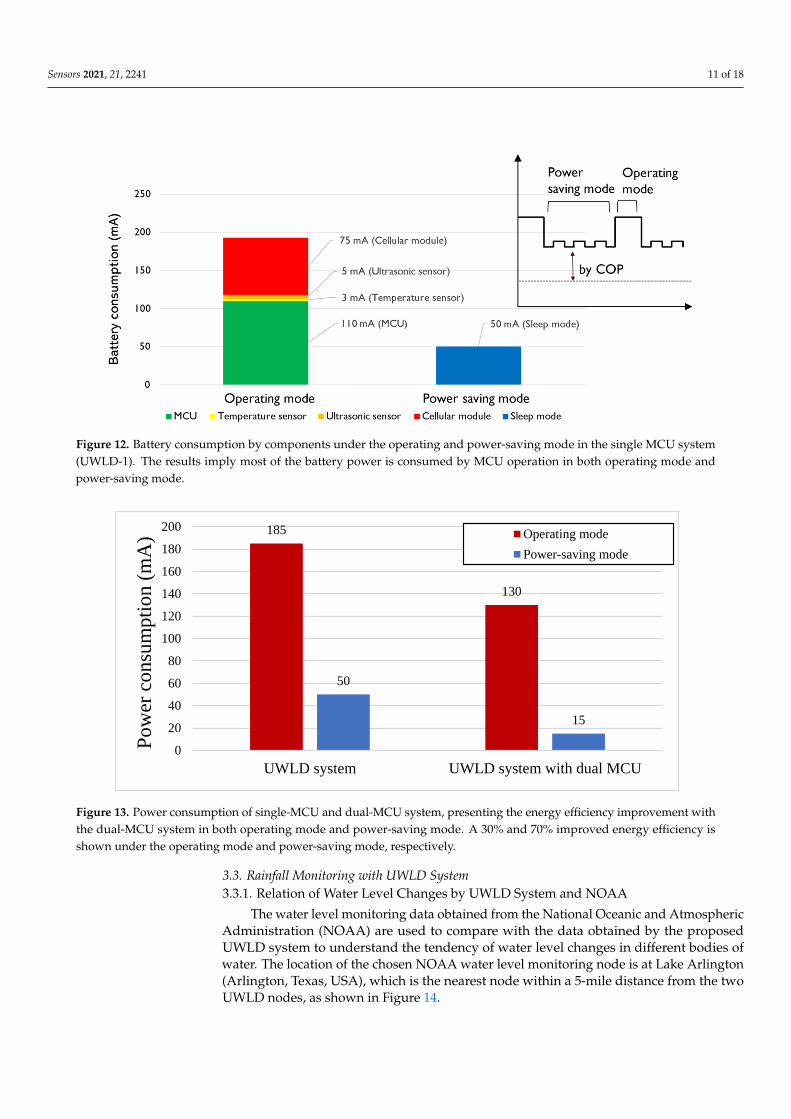
Figure 12 shows the details of battery consumption from each UWLD-1 component,cellular module, ultrasonic sensor, temperature sensor, and MCU. Total of 185 mA and50 mA batteries are consumed under the operating mode and the power-saving mode,respectively. The battery consumption by the components implies that most of the batteryis consumed by MCU in both modes; thus, the dual-MCU system is developed to improvethe energy efficiency at the MCU part.
The battery consumption in the operating mode and power-saving mode of the single-and the dual-MCU system is described in Figure 13. Under the operating mode, the dual-MCU UWLD unit shows 30% decreased power consumption than the single MCU controlledby COP timer from 185 to 130 mA. The improved power efficiency in the operating mode ofthe dual-MCU system indicates the main MCU controlled by COP timer takes more powerthan completely turned on and off by the switch MCU. Under the power-saving mode, theenergy efficiency is significantly higher by decreasing the power consumption by 70% (50 mAto 15 mA). Since the switch MCU is used not only under the power-saving mode but alsoin the operating mode as described in the flow chart of Figure 8, the energy efficiency isimproved in both modes. This improvement leads to the reduced power consumption inthe dual-MCU system as described in Figure 11.
Sensors 2021, 21, 2241 11 of 18
Sensors 2021, 21, x FOR PEER REVIEW 11 of 19
Figure 12. Battery consumption by components under the operating and power-saving mode in the single MCU system
(UWLD-1). The results imply most of the battery power is consumed by MCU operation in both operating mode and
power-saving mode.
The battery consumption in the operating mode and power-saving mode of the sin-
gle- and the dual-MCU system is described in Figure 13. Under the operating mode, the
dual-MCU UWLD unit shows 30% decreased power consumption than the single MCU
controlled by COP timer from 185 to 130 mA. The improved power efficiency in the oper-
ating mode of the dual-MCU system indicates the main MCU controlled by COP timer
takes more power than completely turned on and off by the switch MCU. Under the
power-saving mode, the energy efficiency is significantly higher by decreasing the power
consumption by 70% (50 mA to 15 mA). Since the switch MCU is used not only under the
power-saving mode but also in the operating mode as described in the flow chart of Figure
8, the energy efficiency is improved in both modes. This improvement leads to the re-
duced power consumption in the dual-MCU system as described in Figure 11.
Figure 13. Power consumption of single-MCU and dual-MCU system, presenting the energy effi-
ciency improvement with the dual-MCU system in both operating mode and power-saving mode.
A 30% and 70% improved energy efficiency is shown under the operating mode and power-saving
mode, respectively.
185
130
50
15
0
20
40
60
80
100
120
140
160
180
200
UWLD system UWLD system with dual MCU
Po
wer
co
nsu
mp
tio
n (
mA
) Operating mode
Power-saving mode
Figure 12. Battery consumption by components under the operating and power-saving mode in the single MCU system(UWLD-1). The results imply most of the battery power is consumed by MCU operation in both operating mode andpower-saving mode.
Sensors 2021, 21, x FOR PEER REVIEW 11 of 19
Figure 12. Battery consumption by components under the operating and power-saving mode in the single MCU system
(UWLD-1). The results imply most of the battery power is consumed by MCU operation in both operating mode and
power-saving mode.
The battery consumption in the operating mode and power-saving mode of the sin-
gle- and the dual-MCU system is described in Figure 13. Under the operating mode, the
dual-MCU UWLD unit shows 30% decreased power consumption than the single MCU
controlled by COP timer from 185 to 130 mA. The improved power efficiency in the oper-
ating mode of the dual-MCU system indicates the main MCU controlled by COP timer
takes more power than completely turned on and off by the switch MCU. Under the
power-saving mode, the energy efficiency is significantly higher by decreasing the power
consumption by 70% (50 mA to 15 mA). Since the switch MCU is used not only under the
power-saving mode but also in the operating mode as described in the flow chart of Figure
8, the energy efficiency is improved in both modes. This improvement leads to the re-
duced power consumption in the dual-MCU system as described in Figure 11.
Figure 13. Power consumption of single-MCU and dual-MCU system, presenting the energy effi-
ciency improvement with the dual-MCU system in both operating mode and power-saving mode.
A 30% and 70% improved energy efficiency is shown under the operating mode and power-saving
mode, respectively.
185
130
50
15
0
20
40
60
80
100
120
140
160
180
200
UWLD system UWLD system with dual MCU
Po
wer
co
nsu
mpti
on
(m
A) Operating mode
Power-saving mode
Figure 13. Power consumption of single-MCU and dual-MCU system, presenting the energy efficiency improvement withthe dual-MCU system in both operating mode and power-saving mode. A 30% and 70% improved energy efficiency isshown under the operating mode and power-saving mode, respectively.
3.3. Rainfall Monitoring with UWLD System3.3.1. Relation of Water Level Changes by UWLD System and NOAA
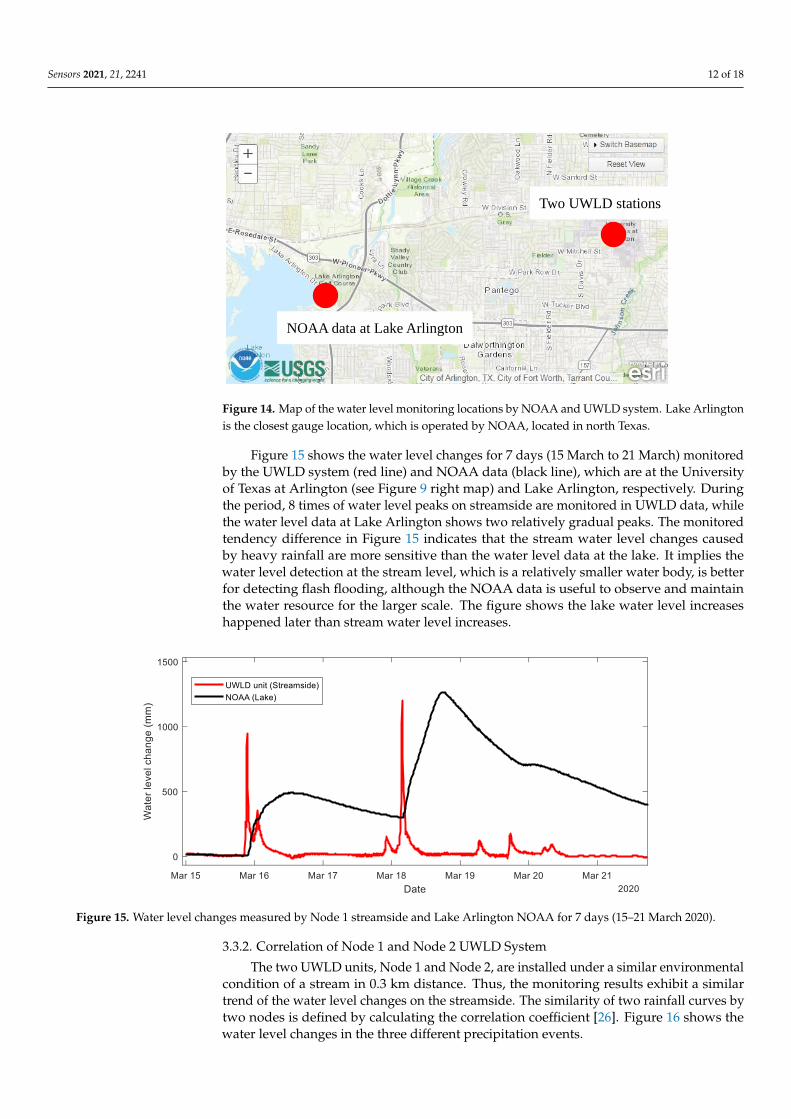
The water level monitoring data obtained from the National Oceanic and AtmosphericAdministration (NOAA) are used to compare with the data obtained by the proposedUWLD system to understand the tendency of water level changes in different bodies ofwater. The location of the chosen NOAA water level monitoring node is at Lake Arlington(Arlington, Texas, USA), which is the nearest node within a 5-mile distance from the twoUWLD nodes, as shown in Figure 14.
Sensors 2021, 21, 2241 12 of 18
Sensors 2021, 21, x FOR PEER REVIEW 12 of 19
3.3. Rainfall Monitoring with UWLD System
3.3.1. Relation of Water Level Changes by UWLD System and NOAA
The water level monitoring data obtained from the National Oceanic and Atmos-
pheric Administration (NOAA) are used to compare with the data obtained by the pro-
posed UWLD system to understand the tendency of water level changes in different bod-
ies of water. The location of the chosen NOAA water level monitoring node is at Lake
Arlington (Arlington, Texas, USA), which is the nearest node within a 5-mile distance
from the two UWLD nodes, as shown in Figure 14.
Figure 14. Map of the water level monitoring locations by NOAA and UWLD system. Lake Ar-
lington is the closest gauge location, which is operated by NOAA, located in north Texas.
Figure 15 shows the water level changes for 7 days (15 March to 21 March) monitored
by the UWLD system (red line) and NOAA data (black line), which are at the University
of Texas at Arlington (see Figure 9 right map) and Lake Arlington, respectively. During
the period, 8 times of water level peaks on streamside are monitored in UWLD data, while
the water level data at Lake Arlington shows two relatively gradual peaks. The monitored
tendency difference in Figure 15 indicates that the stream water level changes caused by
heavy rainfall are more sensitive than the water level data at the lake. It implies the water
level detection at the stream level, which is a relatively smaller water body, is better for
detecting flash flooding, although the NOAA data is useful to observe and maintain the
water resource for the larger scale. The figure shows the lake water level increases hap-
pened later than stream water level increases.
NOAA data at Lake Arlington
Two UWLD stations
Figure 14. Map of the water level monitoring locations by NOAA and UWLD system. Lake Arlingtonis the closest gauge location, which is operated by NOAA, located in north Texas.
Figure 15 shows the water level changes for 7 days (15 March to 21 March) monitoredby the UWLD system (red line) and NOAA data (black line), which are at the Universityof Texas at Arlington (see Figure 9 right map) and Lake Arlington, respectively. Duringthe period, 8 times of water level peaks on streamside are monitored in UWLD data, whilethe water level data at Lake Arlington shows two relatively gradual peaks. The monitoredtendency difference in Figure 15 indicates that the stream water level changes causedby heavy rainfall are more sensitive than the water level data at the lake. It implies thewater level detection at the stream level, which is a relatively smaller water body, is betterfor detecting flash flooding, although the NOAA data is useful to observe and maintainthe water resource for the larger scale. The figure shows the lake water level increaseshappened later than stream water level increases.
Sensors 2021, 21, x FOR PEER REVIEW 12 of 19
3.3. Rainfall Monitoring with UWLD System
3.3.1. Relation of Water Level Changes by UWLD System and NOAA
The water level monitoring data obtained from the National Oceanic and Atmos-
pheric Administration (NOAA) are used to compare with the data obtained by the pro-
posed UWLD system to understand the tendency of water level changes in different bod-
ies of water. The location of the chosen NOAA water level monitoring node is at Lake
Arlington (Arlington, Texas, USA), which is the nearest node within a 5-mile distance
from the two UWLD nodes, as shown in Figure 14.
Figure 14. Map of the water level monitoring locations by NOAA and UWLD system. Lake Ar-
lington is the closest gauge location, which is operated by NOAA, located in north Texas.
Figure 15 shows the water level changes for 7 days (15 March to 21 March) monitored
by the UWLD system (red line) and NOAA data (black line), which are at the University
of Texas at Arlington (see Figure 9 right map) and Lake Arlington, respectively. During
the period, 8 times of water level peaks on streamside are monitored in UWLD data, while
the water level data at Lake Arlington shows two relatively gradual peaks. The monitored
tendency difference in Figure 15 indicates that the stream water level changes caused by
heavy rainfall are more sensitive than the water level data at the lake. It implies the water
level detection at the stream level, which is a relatively smaller water body, is better for
detecting flash flooding, although the NOAA data is useful to observe and maintain the
water resource for the larger scale. The figure shows the lake water level increases hap-
pened later than stream water level increases.
NOAA data at Lake Arlington
Two UWLD stations
Figure 15. Water level changes measured by Node 1 streamside and Lake Arlington NOAA for 7 days (15–21 March 2020).
3.3.2. Correlation of Node 1 and Node 2 UWLD System
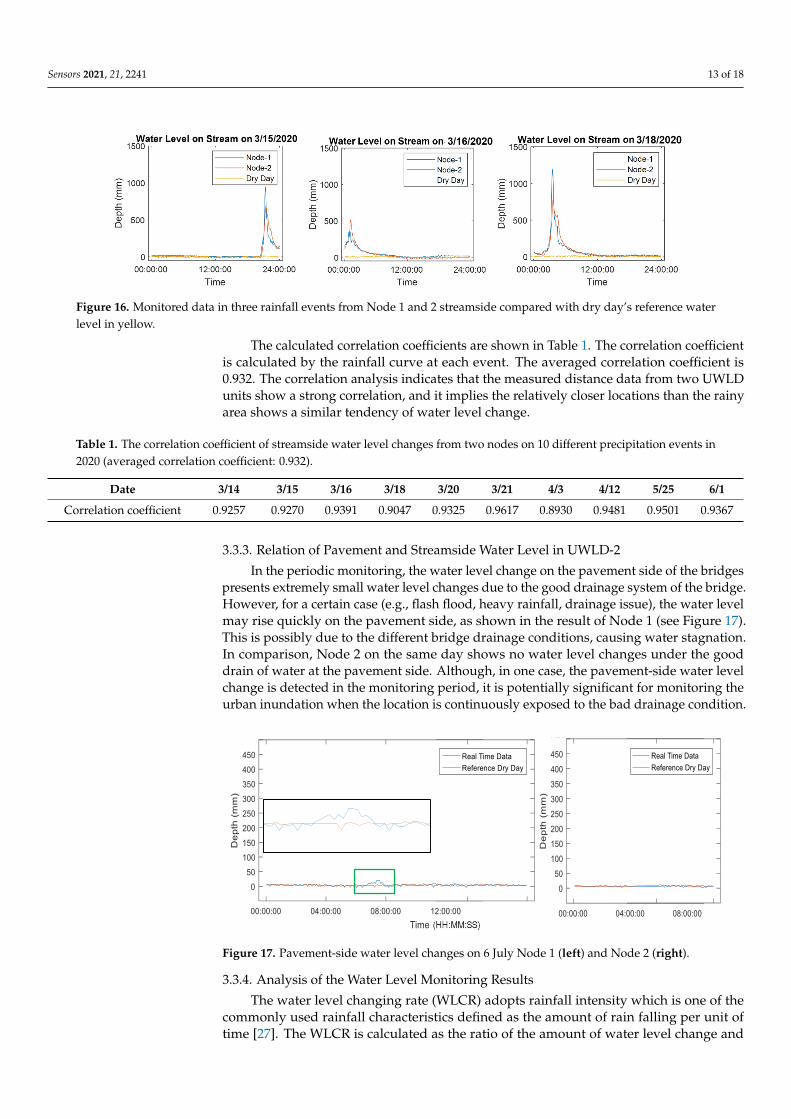
The two UWLD units, Node 1 and Node 2, are installed under a similar environmentalcondition of a stream in 0.3 km distance. Thus, the monitoring results exhibit a similartrend of the water level changes on the streamside. The similarity of two rainfall curves bytwo nodes is defined by calculating the correlation coefficient [26]. Figure 16 shows thewater level changes in the three different precipitation events.
Sensors 2021, 21, 2241 13 of 18
Sensors 2021, 21, x FOR PEER REVIEW 13 of 19
Figure 15. Water level changes measured by Node 1 streamside and Lake Arlington NOAA for 7 days (15–21 March 2020).
3.3.2. Correlation of Node 1 and Node 2 UWLD System
The two UWLD units, Node 1 and Node 2, are installed under a similar environmen-
tal condition of a stream in 0.3 km distance. Thus, the monitoring results exhibit a similar
trend of the water level changes on the streamside. The similarity of two rainfall curves
by two nodes is defined by calculating the correlation coefficient [26]. Figure 16 shows the
water level changes in the three different precipitation events.
Figure 16. Monitored data in three rainfall events from Node 1 and 2 streamside compared with dry day’s reference water
level in yellow.
The calculated correlation coefficients are shown in Table 1. The correlation coeffi-
cient is calculated by the rainfall curve at each event. The averaged correlation coefficient
is 0.932. The correlation analysis indicates that the measured distance data from two
UWLD units show a strong correlation, and it implies the relatively closer locations than
the rainy area shows a similar tendency of water level change.
Table 1. The correlation coefficient of streamside water level changes from two nodes on 10 different precipitation events
in 2020 (averaged correlation coefficient: 0.932).
Date 3/14 3/15 3/16 3/18 3/20 3/21 4/3 4/12 5/25 6/1
Correlation coefficient 0.9257 0.9270 0.9391 0.9047 0.9325 0.9617 0.8930 0.9481 0.9501 0.936
7
3.3.3. Relation of Pavement and Streamside Water Level in UWLD-2
In the periodic monitoring, the water level change on the pavement side of the
bridges presents extremely small water level changes due to the good drainage system of
the bridge. However, for a certain case (e.g., flash flood, heavy rainfall, drainage issue),
the water level may rise quickly on the pavement side, as shown in the result of Node 1
(see Figure 17). This is possibly due to the different bridge drainage conditions, causing
water stagnation. In comparison, Node 2 on the same day shows no water level changes
under the good drain of water at the pavement side. Although, in one case, the pavement-
side water level change is detected in the monitoring period, it is potentially significant
for monitoring the urban inundation when the location is continuously exposed to the bad
drainage condition.
Figure 16. Monitored data in three rainfall events from Node 1 and 2 streamside compared with dry day’s reference waterlevel in yellow.
The calculated correlation coefficients are shown in Table 1. The correlation coefficientis calculated by the rainfall curve at each event. The averaged correlation coefficient is0.932. The correlation analysis indicates that the measured distance data from two UWLDunits show a strong correlation, and it implies the relatively closer locations than the rainyarea shows a similar tendency of water level change.
Table 1. The correlation coefficient of streamside water level changes from two nodes on 10 different precipitation events in2020 (averaged correlation coefficient: 0.932).
Date 3/14 3/15 3/16 3/18 3/20 3/21 4/3 4/12 5/25 6/1
Correlation coefficient 0.9257 0.9270 0.9391 0.9047 0.9325 0.9617 0.8930 0.9481 0.9501 0.9367
3.3.3. Relation of Pavement and Streamside Water Level in UWLD-2
In the periodic monitoring, the water level change on the pavement side of the bridgespresents extremely small water level changes due to the good drainage system of the bridge.However, for a certain case (e.g., flash flood, heavy rainfall, drainage issue), the water levelmay rise quickly on the pavement side, as shown in the result of Node 1 (see Figure 17).This is possibly due to the different bridge drainage conditions, causing water stagnation.In comparison, Node 2 on the same day shows no water level changes under the gooddrain of water at the pavement side. Although, in one case, the pavement-side water levelchange is detected in the monitoring period, it is potentially significant for monitoring theurban inundation when the location is continuously exposed to the bad drainage condition.
Sensors 2021, 21, x FOR PEER REVIEW 14 of 19
Figure 17. Pavement-side water level changes on 6 July Node 1 (left) and Node 2 (right).
3.3.4. Analysis of the Water Level Monitoring Results
The water level changing rate (WLCR) adopts rainfall intensity which is one of the
commonly used rainfall characteristics defined as the amount of rain falling per unit of
time [27]. The WLCR is calculated as the ratio of the amount of water level change and
unit time. In general, the higher sampling rate allows more sensitive detection of water
level changes in flash flooding cases than the lower sampling rate. The developed UWLD
system adopts the 5-min sampling rate for the water level monitor considering the energy
efficiency and unit maintenance since the more frequent operation consumes more power
(see operation mode in Section 3.2). The analysis of the water level monitoring results in
different sampling rates is performed. The comparison between the WLCR based on the
5-min and 1-h data sampling rate is described in Figure 18. The water level record covers
5 days, 14 March to 18 March, and four rainfall events (E1–E4) are highlighted. The E1 and
E3 rainfall events show a relatively moderate water level change than the E2 and E4. The
5-min WLCR curve shows more sensitive behavior at the dramatical rainfall than 1-h
based WLCR curve.
Figure 17. Pavement-side water level changes on 6 July Node 1 (left) and Node 2 (right).
3.3.4. Analysis of the Water Level Monitoring Results
The water level changing rate (WLCR) adopts rainfall intensity which is one of thecommonly used rainfall characteristics defined as the amount of rain falling per unit oftime [27]. The WLCR is calculated as the ratio of the amount of water level change and
Sensors 2021, 21, 2241 14 of 18
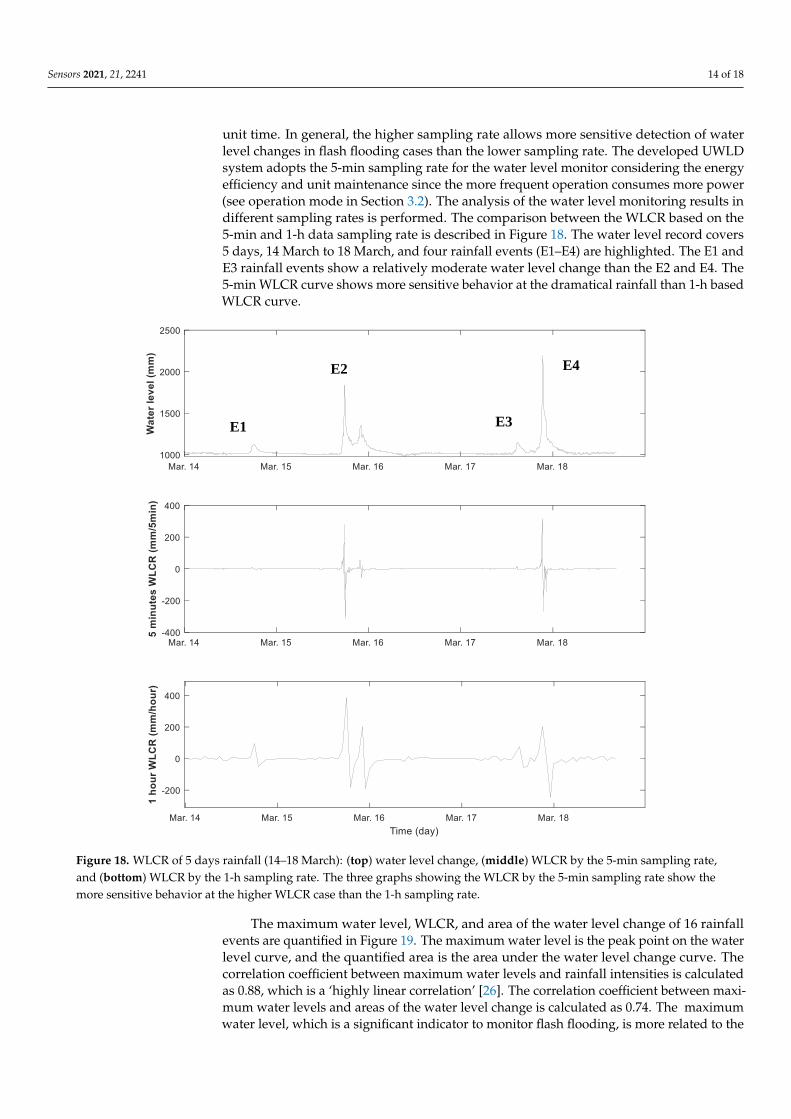
unit time. In general, the higher sampling rate allows more sensitive detection of waterlevel changes in flash flooding cases than the lower sampling rate. The developed UWLDsystem adopts the 5-min sampling rate for the water level monitor considering the energyefficiency and unit maintenance since the more frequent operation consumes more power(see operation mode in Section 3.2). The analysis of the water level monitoring results indifferent sampling rates is performed. The comparison between the WLCR based on the5-min and 1-h data sampling rate is described in Figure 18. The water level record covers5 days, 14 March to 18 March, and four rainfall events (E1–E4) are highlighted. The E1 andE3 rainfall events show a relatively moderate water level change than the E2 and E4. The5-min WLCR curve shows more sensitive behavior at the dramatical rainfall than 1-h basedWLCR curve.
Sensors 2021, 21, x FOR PEER REVIEW 15 of 19
Figure 18. WLCR of 5 days rainfall (14–18 March): (top) water level change, (middle) WLCR by the 5-min sampling rate,
and (bottom) WLCR by the 1-h sampling rate. The three graphs showing the WLCR by the 5-min sampling rate show the
more sensitive behavior at the higher WLCR case than the 1-h sampling rate.
The maximum water level, WLCR, and area of the water level change of 16 rainfall
events are quantified in Figure 19. The maximum water level is the peak point on the
water level curve, and the quantified area is the area under the water level change curve.
The correlation coefficient between maximum water levels and rainfall intensities is cal-
culated as 0.88, which is a ‘highly linear correlation’ [26]. The correlation coefficient be-
tween maximum water levels and areas of the water level change is calculated as 0.74. The
maximum water level, which is a significant indicator to monitor flash flooding, is more
related to the WLCR than the area affected by the rainfall duration. The highly correlated
WLCR and maximum water level relation indicates that the heavy rain in a short period
of time causes the greater water level rise than the large amount of water in a long period
of time rainfall.
E1
E2
E3
E4
Figure 18. WLCR of 5 days rainfall (14–18 March): (top) water level change, (middle) WLCR by the 5-min sampling rate,and (bottom) WLCR by the 1-h sampling rate. The three graphs showing the WLCR by the 5-min sampling rate show themore sensitive behavior at the higher WLCR case than the 1-h sampling rate.
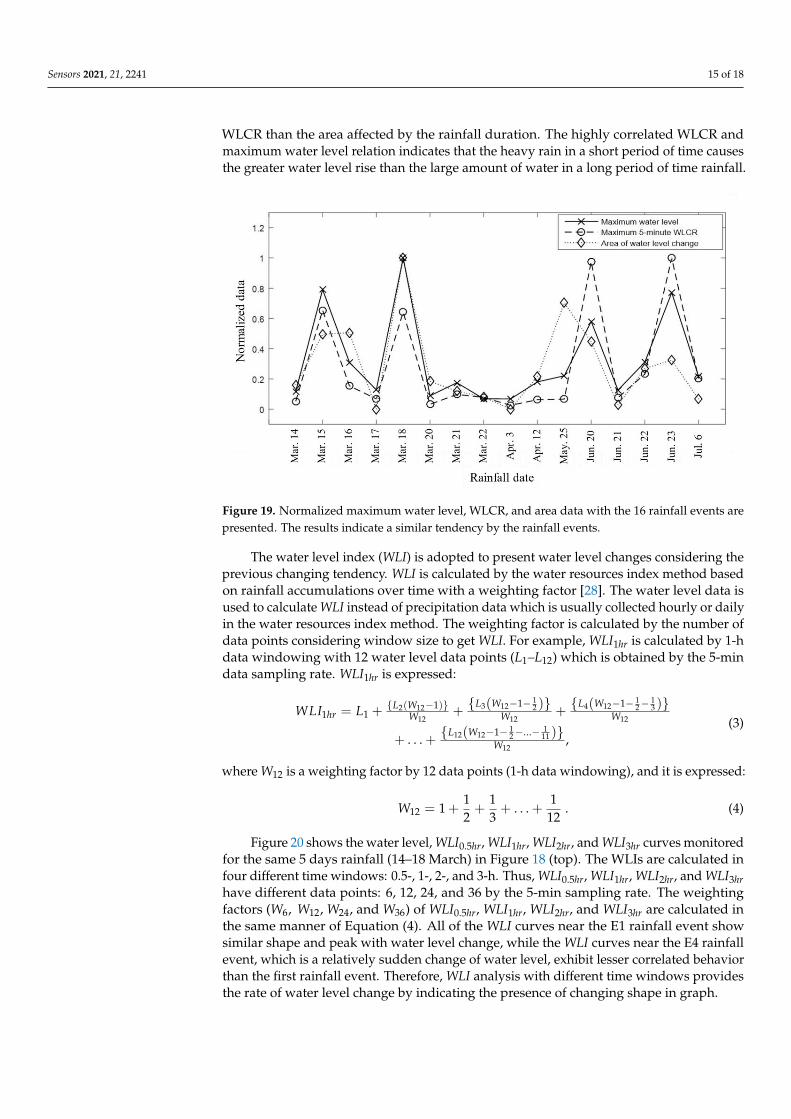
The maximum water level, WLCR, and area of the water level change of 16 rainfallevents are quantified in Figure 19. The maximum water level is the peak point on the waterlevel curve, and the quantified area is the area under the water level change curve. Thecorrelation coefficient between maximum water levels and rainfall intensities is calculatedas 0.88, which is a ‘highly linear correlation’ [26]. The correlation coefficient between maxi-mum water levels and areas of the water level change is calculated as 0.74. The maximumwater level, which is a significant indicator to monitor flash flooding, is more related to the
Sensors 2021, 21, 2241 15 of 18
WLCR than the area affected by the rainfall duration. The highly correlated WLCR andmaximum water level relation indicates that the heavy rain in a short period of time causesthe greater water level rise than the large amount of water in a long period of time rainfall.
Sensors 2021, 21, x FOR PEER REVIEW 16 of 19
Figure 19. Normalized maximum water level, WLCR, and area data with the 16 rainfall events are
presented. The results indicate a similar tendency by the rainfall events.
The water level index (WLI) is adopted to present water level changes considering
the previous changing tendency. WLI is calculated by the water resources index method
based on rainfall accumulations over time with a weighting factor [28]. The water level
data is used to calculate WLI instead of precipitation data which is usually collected hourly
or daily in the water resources index method. The weighting factor is calculated by the
number of data points considering window size to get WLI. For example, WLI1hr is calcu-
lated by 1-h data windowing with 12 water level data points (L1–L12) which is obtained by
the 5-min data sampling rate. WLI1hr is expressed:
𝑊𝐿𝐼1ℎ𝑟 = 𝐿1 +{𝐿2(𝑊12 − 1)}
𝑊12+
{𝐿3 (𝑊12 − 1 −12
)}
𝑊12+
{𝐿4 (𝑊12 − 1 −12
−13
)}
𝑊12
+ ⋯ +{𝐿12 (𝑊12 − 1 −
12
− ⋯ −1
11)}
𝑊12,
(3)
where 𝑊12 is a weighting factor by 12 data points (1-h data windowing), and it is ex-
pressed:
𝑊12 = 1 +1
2+
1
3+ ⋯ +
1
12 . (4)
Figure 20 shows the water level, WLI0.5hr, WLI1hr, WLI2hr, and WLI3hr curves monitored
for the same 5 days rainfall (14–18 March) in Figure 18 (top). The WLIs are calculated in
four different time windows: 0.5-, 1-, 2-, and 3-h. Thus, WLI0.5hr, WLI1hr, WLI2hr, and WLI3hr
have different data points: 6, 12, 24, and 36 by the 5-min sampling rate. The weighting
factors (𝑊6, 𝑊12, 𝑊24, and 𝑊36) of WLI0.5hr, WLI1hr, WLI2hr, and WLI3hr are calculated in the
same manner of Equation (4). All of the WLI curves near the E1 rainfall event show similar
shape and peak with water level change, while the WLI curves near the E4 rainfall event,
which is a relatively sudden change of water level, exhibit lesser correlated behavior than
the first rainfall event. Therefore, WLI analysis with different time windows provides the
rate of water level change by indicating the presence of changing shape in graph.
Figure 19. Normalized maximum water level, WLCR, and area data with the 16 rainfall events arepresented. The results indicate a similar tendency by the rainfall events.
The water level index (WLI) is adopted to present water level changes considering theprevious changing tendency. WLI is calculated by the water resources index method basedon rainfall accumulations over time with a weighting factor [28]. The water level data isused to calculate WLI instead of precipitation data which is usually collected hourly or dailyin the water resources index method. The weighting factor is calculated by the number ofdata points considering window size to get WLI. For example, WLI1hr is calculated by 1-hdata windowing with 12 water level data points (L1–L12) which is obtained by the 5-mindata sampling rate. WLI1hr is expressed:
WLI1hr = L1 +{L2(W12−1)}
W12+{L3(W12−1− 1
2 )}W12
+{L4(W12−1− 1
2−13 )}
W12
+ . . . + {L12(W12−1− 12−...− 1
11 )}W12
,(3)
where W12 is a weighting factor by 12 data points (1-h data windowing), and it is expressed:
W12 = 1 +12+
13+ . . . +
112
. (4)
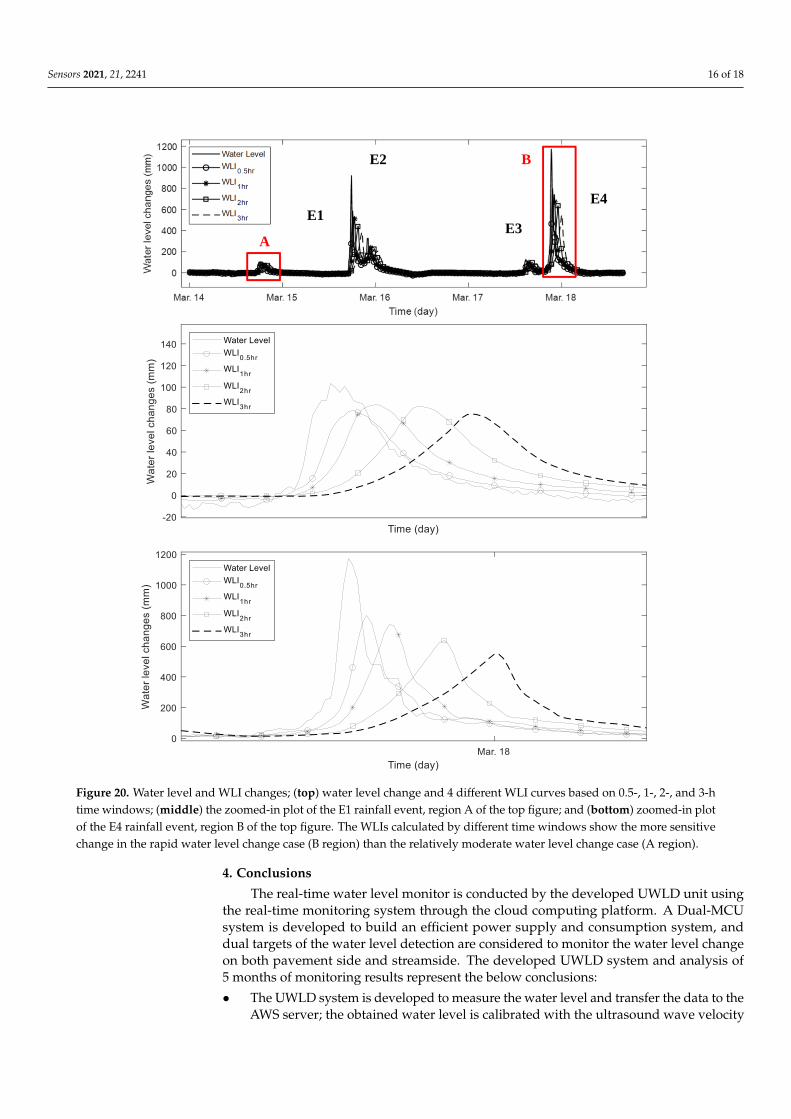
Figure 20 shows the water level, WLI0.5hr, WLI1hr, WLI2hr, and WLI3hr curves monitoredfor the same 5 days rainfall (14–18 March) in Figure 18 (top). The WLIs are calculated infour different time windows: 0.5-, 1-, 2-, and 3-h. Thus, WLI0.5hr, WLI1hr, WLI2hr, and WLI3hrhave different data points: 6, 12, 24, and 36 by the 5-min sampling rate. The weightingfactors (W6, W12, W24, and W36) of WLI0.5hr, WLI1hr, WLI2hr, and WLI3hr are calculated inthe same manner of Equation (4). All of the WLI curves near the E1 rainfall event showsimilar shape and peak with water level change, while the WLI curves near the E4 rainfallevent, which is a relatively sudden change of water level, exhibit lesser correlated behaviorthan the first rainfall event. Therefore, WLI analysis with different time windows providesthe rate of water level change by indicating the presence of changing shape in graph.
Sensors 2021, 21, 2241 16 of 18Sensors 2021, 21, x FOR PEER REVIEW 17 of 19
Figure 20. Water level and WLI changes; (top) water level change and 4 different WLI curves based on 0.5-, 1-, 2-, and 3-h
time windows; (middle) the zoomed-in plot of the E1 rainfall event, region A of the top figure; and (bottom) zoomed-in
plot of the E4 rainfall event, region B of the top figure. The WLIs calculated by different time windows show the more
sensitive change in the rapid water level change case (B region) than the relatively moderate water level change case (A
region).
4. Conclusions
The real-time water level monitor is conducted by the developed UWLD unit using
the real-time monitoring system through the cloud computing platform. A Dual-MCU
system is developed to build an efficient power supply and consumption system, and dual
targets of the water level detection are considered to monitor the water level change on
both pavement side and streamside. The developed UWLD system and analysis of 5
months of monitoring results represent the below conclusions:
The UWLD system is developed to measure the water level and transfer the data to
A
E2
E3
E4
E1
B
Figure 20. Water level and WLI changes; (top) water level change and 4 different WLI curves based on 0.5-, 1-, 2-, and 3-htime windows; (middle) the zoomed-in plot of the E1 rainfall event, region A of the top figure; and (bottom) zoomed-in plotof the E4 rainfall event, region B of the top figure. The WLIs calculated by different time windows show the more sensitivechange in the rapid water level change case (B region) than the relatively moderate water level change case (A region).
4. Conclusions
The real-time water level monitor is conducted by the developed UWLD unit usingthe real-time monitoring system through the cloud computing platform. A Dual-MCUsystem is developed to build an efficient power supply and consumption system, anddual targets of the water level detection are considered to monitor the water level changeon both pavement side and streamside. The developed UWLD system and analysis of5 months of monitoring results represent the below conclusions:
• The UWLD system is developed to measure the water level and transfer the data to theAWS server; the obtained water level is calibrated with the ultrasound wave velocity
Sensors 2021, 21, 2241 17 of 18
change by the temperature. In addition, the accuracy of the distance measurement isverified with manually measured distance.
• The battery power efficiency is improved for the stable operation of the UWLD systemdeploying the dual-MCU unit, which is composed of the additional MCU (switchMCU) and SSR for controlling the main MCU. The dual-MCU system reduces thepower consumption by 30% from 185 mA to 130 mA under the operating mode and70% from 50 mA to 15 mA under the power-saving mode. It is significant for savingpower while the solar panel charges the battery which is affected by the external envi-ronment (e.g., rainfall and cloudy day). The improved power efficiency leads to thestable operation without changing the battery under the sufficient sunlight condition.
• From the UWLD system, a total of 16 events of water level change were detected inthe monitoring period. When the streamside water level increases from our UWLDsystem, the lake water level data either increases later or does not show water levelchange. This result implies the water level change at a local small creek or stream isa more sensitive flood level indicator than at the large water bodies (e.g., lake or sealevel) due to its low sensitivity of flash flooding. Thus, it is significant to perceive theintensity of the rainfall from multiple locations of small bodies of water.
• The water level change on the pavement side is not always detected as streamsidewater level change due to the good drainage system. Although the pavement-sidewater level changes are more affected by infrastructure conditions (e.g., the drainagesystem) than the direct WLCR, it can be more significant to warn of the possibility ofurban flooding, especially close to the area of the UWLD node. Therefore, the waterlevel monitoring of dual targets, pavement side and streamside, can give more reliableand sensitive information to perceive and forecast the urban flash flooding.
• WLCR and WLI can indicate the severity of water level change. Both indicators showthe more sensitive behavior at the higher WLCR case than lower absolute WLCR caseat a certain level of the sampling rate. It implies the real-time analysis with WLCR,and WLI can realize the flash flooding monitoring.
• Study of unit maintenance and system protection under different environments will beconsidered in future research, including different water flow conditions and differentprotection strategies of the sensors from the environmental conditions.
Author Contributions: All authors have contributed to the preparation of this manuscript. S.H.designed the idea strategy; S.K., D.S.K.D. and M.Y. carried out data collection and analyzed thecollected data. M.Y designed and operated the ULWD system. Y.C.Y. assisted in analyzing data.S.H acquired the funding, supervised the study, reviewed and improved the manuscript draft. Allauthors have read and agreed to the published version of the manuscript.
Funding: This research was funded by the U.S. Department of Transportation, Tran-SET, GrantNumber 19SAUTA03 and 20STUTA26.
Institutional Review Board Statement: Not applicable.
Informed Consent Statement: Not applicable.
Data Availability Statement: The data presented in this study are available on request from thecorresponding author.
Conflicts of Interest: The authors declare no conflict of interest.
References1. Lo, S.W.; Wu, J.H.; Lin, F.P.; Hsu, C.H. Cyber surveillance for flood disasters. Sensors 2015, 15, 2369–2387. [CrossRef]2. Woodworth, P.L.; Smith, D.E. A one year comparison of radar and bubbler tide gauges at Liverpool. Int. Hydrogr. Rev. 2003, 4, 42–49.3. Euliss, N.H.; Mushet, D.M. Water-level fluctuation in wetlands as a function of landscape condition in the prairie pothole region.
Wetlands 1996, 16, 587–593. [CrossRef]4. Zheng, G.; Zong, H. High accuracy surface perceiving water level gauge with self calibration. In Proceedings of the 2009
International Conference on Mechatronics and Automation, Changchun, China, 9–12 August 2009; pp. 3680–3686.
Sensors 2021, 21, 2241 18 of 18
5. Bartos, M.; Wong, B.; Kerkez, B. Open storm: A complete framework for sensing and control of urban watersheds. Environ. Sci.Water Res. Technol. 2018, 4, 346–358. [CrossRef]
6. Kerkez, B.; Gruden, C.; Lewis, M.; Montestruque, L.; Quigley, M.; Wong, B.; Bedig, A.; Kertesz, R.; Braun, T.; Cadwalader, O.; et al.Smarter stormwater systems. Environ. Sci. Technol. 2016, 50, 7267–7273. [CrossRef] [PubMed]
7. Mousa, M.; Zhang, X.; Claudel, C. Flash Flood Detection in Urban Cities Using Ultrasonic and Infrared Sensors. IEEE Sens. J.2016, 16, 7204–7216. [CrossRef]
8. Prabhudesai, R.G.; Joseph, A.; Agarwadekar, Y.; Mehra, P.; Kumar, K.V.; Luis, R. Integrated Coastal Observation Network (ICON)for real-time monitoring of sea-level, sea-state, and surface-meteorological data. In Proceedings of the OCEANS 2010 MTS/IEEESEATTLE, Seattle, WA, USA, 20–23 September 2010; pp. 1–9.
9. Moreno, C.; Aquino, R.; Ibarreche, J.; Pérez, I.; Castellanos, E.; Álvarez, E.; Rentería, R.; Anguiano, L.; Edwards, A.; Lepper, P.; et al.Rivercore: IoT device for river water level monitoring over cellular communications. Sensors 2019, 19, 127. [CrossRef]
10. Ham, S.; Popovics, J.S. Application of micro-electro-mechanical sensors contactless NDT of concrete structures. Sensors 2015, 15, 9078–9096.[CrossRef]
11. Alfredo Mahar, A.M.F.; Racoma, B.A.; Aracan, K.A.; Alconis-Ayco, J.; Saddi, I.L. Disseminating near-real-time hazards informationand flood maps in the Philippines through Web-GIS. J. Environ. Sci. 2017, 59, 13–23.
12. Martinez, K.; Hart, J.K.; Ong, R. Environmental sensor networks. Computer 2004, 37, 50–56. [CrossRef]13. Hart, J.K.; Martinez, K. Environmental Sensor Networks: A revolution in the earth system science? Earth-Sci. Rev. 2006, 78, 177–191.
[CrossRef]14. Siddula, S.S.; Babu, P.; Jain, P.C. Water Level Monitoring and Management of Dams using IoT. In Proceedings of the 2018 3rd
International Conference On Internet of Things: Smart Innovation and Usages (IoT-SIU), Bhimtal, India, 23–24 February 2018.15. Khetre, A.C.; Hate, S.G. Automatic monitoring & reporting of water quality by using WSN technology and different routing
methods. Int. J. Adv. Res. Comput. Eng. Technol. 2013, 2, 3255–3260.16. Frolov, A.V.; Asmus, V.V.; Borshch, S.V.; Vil’fand, R.M.; Zhabina, I.I.; Zatyagalova, V.V.; Krovotyntsev, V.A.; Kudryavtseva, O.I.;
Leont’eva, E.A.; Simonov, Y.A.; et al. GIS-Amur system of flood monitoring, forecasting, and early warning. Russ. Meteorol.Hydrol. 2016, 41, 157–169. [CrossRef]
17. Rompas, P.S.; Wardana, A.A. Robust flood monitoring platform using message queueing telemetry transport protocol. In Pro-ceedings of the 2017 International Conference on Information Technology Systems and Innovation (ICITSI), Bandung, Indonesia,23–24 October 2017; pp. 234–238.
18. Phuong, N.M.; Schappacher, M.; Sikora, A.; Ahmad, Z.; Muhammad, A. Real-time Water Level Monitoring Using Low-PowerWireless Sensor Network. In Proceedings of the Embedded World Conference 2015, Nuremberg, Germany, 24–25 February 2015.
19. Basha, E.A.; Ravela, S.; Rus, D. Model-based monitoring for early warning flood detection. In Proceedings of the 6th ACMConference on Embedded Network Sensor Systems, Raleigh, NC, USA, 5–7 November 2008; pp. 295–308.
20. Zhang, Y.; Zhang, Y.; She, W.; Yang, L.; Liu, G.; Yang, Y. Rheological and harden properties of the high-thixotropy 3D printingconcrete. Constr. Build. Mater. 2019, 201, 278–285. [CrossRef]
21. Wang, P.; Zhang, S.; Zhang, L.; Wang, L.; Xue, H.; Wang, Z.L. Non-contact and liquid–liquid interfacing triboelectric nanogeneratorfor self-powered water/liquid level sensing. Nano Energy 2020, 72, 104703. [CrossRef]
22. Mariello, M.; Fachechi, L.; Guido, F.; De Vittorio, M. Multifunctional sub-100 µm thickness flexible piezo/triboelectric hybridwater energy harvester based on biocompatible AlN and soft parylene C-PDMS-EcoflexTM. Nano Energy 2021, 83, 105811.[CrossRef]
23. Frhlich, A.A. A comprehensive approach to power management in embedded systems. Int. J. Distrib. Sens. Netw. 2011, 2011, 807091.[CrossRef]
24. Fröhlich, A.A.; Bezerra, E.A.; Slongo, L.K. Experimental analysis of solar energy harvesting circuits efficiency for low powerapplications. Comput. Electr. Eng. 2015, 45, 143–154. [CrossRef]
25. Bies, D.A.; Hansen, C.H. Engineering Noise Control—Theory and Practice, 4th ed.; CRC Press: New York, NY, USA, 2009.26. Kang, S.; Wu, Y.C.; Ham, S. Singular integral solutions of analytical surface wave model with internal crack. Appl. Sci. 2020, 10, 3129.
[CrossRef]27. Choo, Y.M.; Jo, D.J.; Yun, G.S.; Lee, E.H. A study on the improvement of flood forecasting techniques in urban areas by considering
rainfall intensity and duration. Water 2019, 11, 1883. [CrossRef]28. Deo, R.C.; Byun, H.R.; Kim, G.B.; Adamowski, J.F. A real-time hourly water index for flood risk monitoring: Pilot studies in
Brisbane, Australia, and Dobong Observatory, South Korea. Env.iron. Monit. Assess. 2018, 190, 1–27. [CrossRef] [PubMed]
Related Documents