sustainability Article Energy Efficiency Measures in Bakeries toward Competitiveness and Sustainability—Case Studies in Quito, Ecuador Marco Briceño-León 1,2,* , Dennys Pazmiño-Quishpe 1 and Jean-Michel Clairand 1,* and Guillermo Escrivá-Escrivá 2 Citation: Briceño-León, M.; Pazmiño-Quishpe, D.; Clairand, J.-M.; Escrivá-Escrivá, G. Energy Efficiency Measures in Bakeries toward Competitiveness and Sustainability —Case Studies in Quito, Ecuadorr. Sustainability 2021, 13, 5209. https:// doi.org/10.3390/su13095209 Academic Editor: Tomonobu Senjyu and Ingliang Wong Received: 13 April 2021 Accepted: 28 April 2021 Published: 7 May 2021 Publisher’s Note: MDPI stays neutral with regard to jurisdictional claims in published maps and institutional affil- iations. Copyright: © 2021 by the authors. Licensee MDPI, Basel, Switzerland. This article is an open access article distributed under the terms and conditions of the Creative Commons Attribution (CC BY) license (https:// creativecommons.org/licenses/by/ 4.0/). 1 Facultad de Ingeniería y Ciencias Aplicadas, Universidad de las Américas—Ecuador, Quito 170122, Ecuador; [email protected] 2 Institute for Energy Engineering, Universitat Politècnica de València, 46022 València, Spain; [email protected] * Correspondence: [email protected] (M.B.-L.); [email protected] (J.-M.C.); Tel.:+593-9-8180-9631 (M.-B.L.) +593-9-9586-0613 (J.-M.C.) Abstract: This paper evaluates the energy efficiency in the bakery industry toward competitiveness and sustainability through energy audits that were carried out on six bakeries located in Quito, Ecuador. Firstly, an initial meeting was held. After this, an energy survey was carried out in all areas of the bakeries. The information of the energy consumption of the facilities was collected. This was based on electricity bills, power data, equipment usage time, habits, and monthly consumption. With the energy balances, the critical points were identified, resulting in the baking process and the production activity, as those with the highest energy consumption within each establishment. Subsequently, with the indicator of electrical energy consumed per unit produced, the energy consumption by production processes and the bakery’s total energy consumption were determined. Several improvement proposals were generated for the bakery industry based on the results. Finally, it is concluded that the consumption of electrical energy in the bakery industry in Quito is efficient when compared to other bakeries, since they use less energy per unit of mass processed to produce products. Keywords: eco-efficiency; emission reduction; energy efficiency; energy management; energy saving strategies; power analysis 1. Introduction The depletion of fossil fuels and environmental concerns have to be addressed in the short future. Many energy policies have been imposed in various energy-consuming activities, such as the energy efficiency, which is defined as the ratio of service output of a process to the energy input into that process. Energy efficiency can be used for analysis of industrial operation and its performance, especially at the macrolevel. Thermodynamic, thermophysical, thermoeconomic, and economic metrics can be categorized through energy performance indicators [1,2]. Global total final energy consumption of the manufacture industry was 1978 Mtoe in 2016 and 74.7% of energy belongs to the mechanical manufacturing industry [3]. The industrial sector in Europe had a final energy consumption of 274.7 Mtoe in 2015, which accounted for 25.35% of the whole energy used in this region [4]. The food sector is an essential industry in this region, which has an energy intensity of 23 toe/10 6 € in 2015 [5]. The values are different in other regions; for example, China’s food industry consumed 76.61 (Mtoe), which represented 3.2% of the entire manufacturing industry [6]. The industry in Brazil had an estimated energy intensity of 586 toe/10 6 $, where the most important industries were iron and steel, pulp and paper, food, and beverage [7]. Sustainability 2021, 13, 5209. https://doi.org/10.3390/su13095209 https://www.mdpi.com/journal/sustainability

Welcome message from author
This document is posted to help you gain knowledge. Please leave a comment to let me know what you think about it! Share it to your friends and learn new things together.
Transcript
sustainability
Article
Energy Efficiency Measures in Bakeries towardCompetitiveness and Sustainability—Case Studies inQuito, Ecuador
Marco Briceño-León 1,2,∗ , Dennys Pazmiño-Quishpe 1 and Jean-Michel Clairand 1,∗
and Guillermo Escrivá-Escrivá 2
�����������������
Citation: Briceño-León, M.;
Pazmiño-Quishpe, D.; Clairand, J.-M.;
Escrivá-Escrivá, G. Energy Efficiency
Measures in Bakeries toward
Competitiveness and Sustainability
—Case Studies in Quito, Ecuadorr.
Sustainability 2021, 13, 5209. https://
doi.org/10.3390/su13095209
Academic Editor: Tomonobu Senjyu
and Ingliang Wong
Received: 13 April 2021
Accepted: 28 April 2021
Published: 7 May 2021
Publisher’s Note: MDPI stays neutral
with regard to jurisdictional claims in
published maps and institutional affil-
iations.
Copyright: © 2021 by the authors.
Licensee MDPI, Basel, Switzerland.
This article is an open access article
distributed under the terms and
conditions of the Creative Commons
Attribution (CC BY) license (https://
creativecommons.org/licenses/by/
4.0/).
1 Facultad de Ingeniería y Ciencias Aplicadas, Universidad de las Américas—Ecuador, Quito 170122, Ecuador;[email protected]
2 Institute for Energy Engineering, Universitat Politècnica de València, 46022 València, Spain;[email protected]
* Correspondence: [email protected] (M.B.-L.); [email protected] (J.-M.C.);Tel.:+593-9-8180-9631 (M.-B.L.) +593-9-9586-0613 (J.-M.C.)
Abstract: This paper evaluates the energy efficiency in the bakery industry toward competitivenessand sustainability through energy audits that were carried out on six bakeries located in Quito,Ecuador. Firstly, an initial meeting was held. After this, an energy survey was carried out in allareas of the bakeries. The information of the energy consumption of the facilities was collected. Thiswas based on electricity bills, power data, equipment usage time, habits, and monthly consumption.With the energy balances, the critical points were identified, resulting in the baking process andthe production activity, as those with the highest energy consumption within each establishment.Subsequently, with the indicator of electrical energy consumed per unit produced, the energyconsumption by production processes and the bakery’s total energy consumption were determined.Several improvement proposals were generated for the bakery industry based on the results. Finally,it is concluded that the consumption of electrical energy in the bakery industry in Quito is efficientwhen compared to other bakeries, since they use less energy per unit of mass processed to produceproducts.
Keywords: eco-efficiency; emission reduction; energy efficiency; energy management; energy savingstrategies; power analysis
1. Introduction
The depletion of fossil fuels and environmental concerns have to be addressed inthe short future. Many energy policies have been imposed in various energy-consumingactivities, such as the energy efficiency, which is defined as the ratio of service output of aprocess to the energy input into that process. Energy efficiency can be used for analysis ofindustrial operation and its performance, especially at the macrolevel. Thermodynamic,thermophysical, thermoeconomic, and economic metrics can be categorized through energyperformance indicators [1,2].
Global total final energy consumption of the manufacture industry was 1978 Mtoein 2016 and 74.7% of energy belongs to the mechanical manufacturing industry [3]. Theindustrial sector in Europe had a final energy consumption of 274.7 Mtoe in 2015, whichaccounted for 25.35% of the whole energy used in this region [4]. The food sector is anessential industry in this region, which has an energy intensity of 23 toe/106 € in 2015 [5].The values are different in other regions; for example, China’s food industry consumed76.61 (Mtoe), which represented 3.2% of the entire manufacturing industry [6]. The industryin Brazil had an estimated energy intensity of 586 toe/106$, where the most importantindustries were iron and steel, pulp and paper, food, and beverage [7].
Sustainability 2021, 13, 5209. https://doi.org/10.3390/su13095209 https://www.mdpi.com/journal/sustainability

Sustainability 2021, 13, 5209 2 of 20
Many studies have performed energy audits in various industries. For example, in [8],an energy audit in a paper mill in China was executed in order to reduce the energyuse and CO2 emissions. The authors of [9] carried out an energy audit in a Scandinavianchemical wood-pulp mill, resulting in some proposals for energy-saving. In [10], thermalenergy audit analysis was employed for a pyroprocessing unit of a typical dry processcement plant in the North-east of Nigeria. The authors of [11] investigated the outcomesof energy efficiency improvements and analyzed the benefits that were achieved undervarious energy efficiency measures from energy audits based on case studies. In [12], anovel methodology for energy audit was presented and applied in a large manufacturingcompany in the home appliances industry.
Based on the energy audits, many improvements in technologies or devices have beenalso proposed and studied in industries. For example, in [13], the potential of differentcontrol strategies in heating, ventilation, and air-conditioning (HVAC) systems was as-sessed to minimize the energy use. The authors of [14] improved the use of water pumpsof petrochemical plant operations to obtain electricity savings. In [15], the existence ofnon-energy benefits that can be taken into account in an energy efficiency investment in anoil and gas processing center in México was presented. The authors of [16] described threeidentical groundwater heat pumps for heating two pig houses on a farm in West Germany.
The bakery industry is one of the most important activities in the food industry.The world bakery market was approximately valued in $216 billion in 2020 [17]. Europehad 190,000 small and medium enterprises in the bakery sector, where the craft bakeriesrepresent 55% and the industrial sector 45%. The industrial bakery is different in eachcountry, for instance, in UK, industrial bakery represents 80% of the market, while, inGermany, it is 40%, in France, 30%, and in Spain it is 19% [18]. In Latin America, thebakery sector is mainly developed by micro-business or artisan bakeries, like in Mexico,where 97% of bakeries are micro-business, and Peru, where 80% of bakeries are artisan [19].Ecuador has 166 formal bakery companies and 76 formal companies that elaborate cakes in2021 [20]. Nevertheless, Ecuador had 8200 bakeries in 2010, and most of them were artisanbakeries [21].
Only a few works have studied the energy efficiency in bakeries. For example, in [22],some energy management practices in a bakery in Germany were proposed. The authorsof [23] compared the thermodynamic performance of three industrial bakeries, demonstrat-ing that a par-baked brown bun production chain had the best thermodynamic performance.In [24], the impact of electrical and hybrid heating on bread quality during baking wasanalyzed; the hybrid heating mode resulted in the best performance in terms of moisture,volume, and firmness. The authors of [25] proposed a point energy technology for im-proving the the insight of the energy usage in a bakery in Northern Ireland. In [26], anenergy consumption analysis was performed in a bakery by optimizing the total energythat is absorbed by the food product. The authors of [27] integrated a solar thermal energystorage reactor to improve the performance of a solar bakery.
The aim of this paper is to provide specific data from a sector where there are notmuch data published and that can be used as benchmarks, since they are small stores.Still, they are very numerous in towns and cities all over the world. The work performedenergy audits in six bakeries in Quito, Ecuador, by evaluating electricity bills, power data,equipment usage time, habits, and monthly energy consumption. The relative indices ofconsumption per kg of material produced have been calculated. Using energy consumptiondata that were provided in the invoices ensures that the consumption considered are thosethat occur and are data that may be available in other studies at no additional cost. It isessential to highlight that the main processes in which the energy is consumed have beenanalyzed. Different efficiency measures have been proposed to improve efficiency that canserve as a basis for other studies. After that, the energy-saving potential will be assessed inthe bakeries.

Sustainability 2021, 13, 5209 3 of 20
The rest of this paper is organized, as follows: Section 2 describes a background ofthe bakery industry. Section 3 presents the energy efficiency methodology. The results arediscussed in Section 4. Finally, Section 5 is devoted to the main conclusions.
2. Background2.1. Bakeries
The process of making bread, cake, and small pastry (cookies, chocolates, nougat,truffles, alfajores, brownies, etc.) consists of some stages, such as mixing and kneadingingredients based on a previous recipe to give a form of homogeneous and uniform dough,which will later be subjected to forming processes to finish with baking. The variousprocesses are described in Figure 1 and they are detailed below:
Figure 1. Processes in Bakery.
• Weighing: The first stage of production uses a scale to weigh all solid ingredients suchas flour and yeast. After that, the eggs, salt, sugar, and butter are added to a container.Afterward, liquids, such as water, are measured. Finally, all of the ingredients areplaced in a container.
• Kneading: With the ingredients already weighed, it is deposited inside the kneadingequipment. They are combined for around 5 to 10 min., depending on the quantity. Inthe end, the mixture is collected from the kneader. Subsequently, the final mixture isdeposited in a container to rest for a time of 10 min.
• Forming: Once the dough rests, we proceed to make cuts with previously indicateddimensions and then shape the dough. Besides, to add some other necessary detailfor the bread, cake or little bakery. They are then placed in cans or molds, so that, inthis way, they can enter the oven.
• Leavening: This stage is specifically for bread preparation. Here the cake or minorbakery is not included. With the help of cars, the loaves are entered into the fermenta-tion chamber. They will remain for about 45 min., so that the bread takes the necessarysize before baking. After the loaves come out of the chamber, let it rest for about 5 min.
• Baking: In this stage, electric ovens with a maximum temperature of 250 ◦C are used,regular cooking is from 190 ◦C to 250 ◦C; this depends on the size and quantity of thesmaller bread, cake, or bakery, and this will be for a time of 20 to 45 min.

Sustainability 2021, 13, 5209 4 of 20
2.2. Energy Efficiency Policies: ISO Standard 50001
This standard is based on energy management systems analysis to improve organi-zations’ energy performance based on energy efficiency use, and energy consumption tominimize environmental problems, such as gas emissions and save energy payment. Thiscan be applied with the commitment of the organization’s stakeholders, especially of thetop management in any industry, company, or business.
Having the ISO 50001 is an advantage, since it reduces maintenance prices, includesa culture of progressive improvement and assistance to have workers committed to theirwork. Likewise, it manages to save 5% to 15% by measures implemented in the operat-ing area.
To implement this standard, the following steps are required:
• Pre-Audit: It is the beginning of the contact between the two parties whose purposeis to inspect the establishment, in addition to previously verifying the requirementsof the standard. During this period, a team is usually established with part of theconsulting firm and company personnel.
• First Phase of the Audit: All of the data concerning energy consumption in theestablishment are collected, such as natural gas, fuel, and electricity consumption bills.The staff in charge of this work will reveal the establishment’s location and the areawith the highest energy consumption.
2.3. Energy Baseline
The UNE-EN ISO 50001: 2011 Standard defines a quantitative reference that providesthe basis for the comparison of energy performance. For this reason, it reflects the conditionsof a specific period. It is also used to calculate energy savings as a reference before andafter taking actions to improve energy performance.
2.4. State of the Facilities
In this activity of an energy audit, the facilities’ current conditions are analyzed.Some of the actions are surveying of equipment characteristics, like power, time of use ofequipment, and behavior of employees.
2.5. Energy Audit
It is a process of systematic evaluation and monitoring to obtain a complete judgmenton energy consumption and its cost. Likewise, it allows for seeing which factors influencehigher energy consumption and to assess the different opportunities for improvement.It plays the role of finding the possible sources of reduction of electricity consumptionin the industry, by examining the areas in search of viable energy savings or consideringindividual energy saving measures.
2.6. Energy Indicator
They are used for comparison between energy use with productive values. Theseindicators reveal where energy savings can be implemented in the processes. They alsoprovide information on trends in relation to historical energy use or for benchmarking.
3. Methodology
Figure 2 describes the methodology followed, and it will be explained below.

Sustainability 2021, 13, 5209 5 of 20
Figure 2. Methodology.
3.1. ManagementCase Study Description
The selected case studies were carried out in the San Carlos Sector on Machala andtransversal avenues, located in the north of Quito, Ecuador. The bakeries have an averagearea of 60 square meters. Their daily production is around 4000 loaves, nine cakes, and130 pieces of a small pastry. For elaborating these products, equipment, such as thekneader or mixer, leavening chamber, and oven are required, related to energy consumption.Additionally, other additional activities are carried out in the establishment, such as thesale of dairy products, sausages, and other essential products. Figure 3 illustrates the mapof the six selected bakeries.
Bakery 1
Bakery 2Bakery 3
Bakery 4
Bakery 5
Bakery 6
Figure 3. Location of the six selected bakeries.
3.2. Surveying
The surveying was divided in the following steps:
• First Meeting: At this stage, a confidentiality agreement was established for the projectdata with the bakeries and communication with those responsible for the industry, andhow the information from the establishment will be collected. Finally, an appointmentwas scheduled for a technical and visual examination of the equipment.
• Energy Review: A visit was made to all areas of the bakeries, for both sale andproduction, to record the status of the equipment and electrical appliances present inthe facilities to obtain all of the characteristics of the equipment and the tasks that arecarried out in the place. This was done with the help of a weekly schedule.
Sustainability 2021, 13, 5209 6 of 20
3.3. Data Gathering
Detailed information regardinf the energy consumption of the facilities is acquiredthrough the administration with surveys. It was based primarily on the establishment’selectricity bill.
• Interviews: Information was collected through interviews with those in charge ofenergy consumption data for April 2020 and measures related to production equip-ment consumption. Furthermore, the review of essential documents and records todetermine energy consumption and management was performed. Likewise, whetherthe devices or equipment are in good condition was analyzed. The questions consid-ered in the interviews carried out were divided based on the different activities andprocesses (see Appendices A–E).
• Use of equipment: Information was collected regarding the use of the equipmentand working hours; the lighting system and lower consumption electrical equipmentwere verified during the week and weekends to determine the consumption duringthe month.
• Consumption habits: Information was collected about the employees’ consumptionhabits within the establishment through personnel surveys to obtain data on hours ofconsumption and the use of electrical equipment during their recess or end of theirhours of workdays. Awareness and proper energy management by management andemployees were also taken into account.
3.4. Energy Accounting3.4.1. Energy Balance
With the data from the surveys, an energy balance was generated for April. This monthwas taken as a reference, since it was the date on which the information from the bakerieswas collected. Additionally, points of highest consumption were identified according tothe area, the type of production equipment, and energy consumption of other electricalequipment types present in the establishment.
To carry out the energy balance, the following equation was used:
Hm = H · F + Ho · Fo (1)
where Hm is the hours of use per month, H the hours of daily use on weekdays per device,Ho the hours of daily use weekend per device, F the working weekdays factor, which is20 weekdays for the month of April, and Fo the working weekends factor, which is 10weekend days for the month analyzed.
Moreover, the device consumption is defined:
Ed = P · Hm (2)
where Ed is the device energy consumption per month (kWh/month) and P is the powerconsumption (kW)
The production energy consumption (kWh/month) is defined:
Ep = Ek + Ebr + Eba (3)
where Ek is the energy consumed by the kneading (kWh/month), Ebr the energy consumedby the leavening (kWh/month), and Eba the energy consumed by the baking (kWh/month).
The total energy consumption is defined:
ET = EP + ER + EL + EO (4)
where EP is the production energy consumption (kWh/month), ER the refrigeration energyconsumption (kWh/month), EL the lighting energy consumption (kWh/month), and EOthe rest of the energy consumption (kWh/month).
Sustainability 2021, 13, 5209 7 of 20
3.4.2. Energy Audit
In this section was compared the energy balance with the electrical bills. With theenergy audit results, the processes and activities with the highest consumption wereanalyzed in order to develop proposals that reduce energy consumption.
3.4.3. Indicators
According to the energy balance data, the points with the highest energy consumptionwere found based on the processes and activities that were present in the establishment.
To identify those critical points, the indicator of electrical energy by quantity of flourper process is defined:
Ip =Ep
W f(5)
where W f is the weight of flour used per process (kg/month).
4. Results and Discussion4.1. Energy Audit
With each bakery’s bill and electricity consumption values, a balance was made ofthe processes present in the production stage. Likewise, any activity carried out in thebakery requires the use of electrical energy. Thus, the first instance was to determine thehours of use per month using Equation (1). Subsequently, to find the value of equipmentconsumption with Equation (2) and to immediately find the total consumption of eachprocess with Equation (3). Next, with the help of Equation (4), each bakery’s total energyconsumption values were determined. Finally, the percentage of error for each bakery wascompared to the electricity bill’s value of April, which considers 30 days, as summarized inTable 1.
Table 1. Energy Consumption in each studied bakery.
Electricity BillTotal ElectricityConsumption(kWh/month)
Electricity Bill($)
EstimatedElectricity
Consumption(kWh/month)
Error (%)
Bakery 1 1043 137.18 1049.82 0.653Bakery 2 1492 171.43 1472.31 1.320Bakery 3 1303 165.69 1295.00 0.614Bakery 4 1101 138.52 1063.22 3.431Bakery 5 1324 168.57 1316.69 0.552Bakery 6 1176 148.26 1154.85 1.798
4.2. Indicators
With each bakery’s electricity consumption value and the respective total amount offlour used during the month, the value of the energy consumption indicator of each bakerywas determined. For this, Equation (5) was used first, which corresponds to the electricalenergy per quantity of flour per process. Equation (5) was also used to analyze the wholeenergy used in the bakery per amount of flour of all products. The best energy indicatorcorresponds to bakery 2, which has a value of 0.124 kWh/kg. This means that it is the mostefficient bakery, since it requires less energy and produces greaters quantities. On the otherhand, bakery 4, with a value of 0.315 kWh/kg, has the worst indicator since it consumesmore energy for production, as shown in Table 2. The mean value of the energy indicatorsof the six Bakeries analyzed is 0.204 kWh/kg.
According to the data that were obtained in each baker’s interview about the timeof use of each equipment for production, it was divided bread production processes intokneading or mixing, leavening, baking, and, additionally, the entire process was analyzed.Subsequently, with Equation (5), the amount of energy used per month was calculated by

Sustainability 2021, 13, 5209 8 of 20
the amount of flour in each of the processes. The Energy Indicator for bread productionby bakery is depicted in Figure 4 and in Appendix F in the Appendix section. Besides, itis observed that bakery 2 presents better results than the other bakeries. This is becauseits equipment works properly without presenting poor handling problems or is sub-usedlike bakeries 1, 3, and 5. It is important to note that bakeries 1, 2, 3, and 5 have ovenswith similar space and power capacities, as shown in Appendix B. However, bakery twoprocesses more mass of flour, as shown in Table 2. Likewise, it can be observed that bakery 1presents results that are not so adequate for its production, some equipment are householdequipment, like the kneader, and others are subutilized, like the fermentation chamberand oven.
Table 2. Energy Indicator by bakery.
Energy Use Mass of Flour Processed Energy Indicator(kWh/month) (kg/month) (kWh/kg)
Bakery 1 1043.00 3628 0.287Bakery 2 1491.22 12,000 0.124Bakery 3 1303.00 9000 0.145Bakery 4 1101.00 3500 0.315Bakery 5 1325.00 10,000 0.133Bakery 6 1173.00 5000 0.235
1 2 3 4 5 6
Bakery
0.02
0.04
0.06
0.08
0.1
0.12
0.14
0.16
0.18
0.2
En
erg
y I
nd
ica
tor
(kW
h/k
g)
Kneading
Baking
Leavening
Figure 4. Energy Indicator for bread production by bakery.
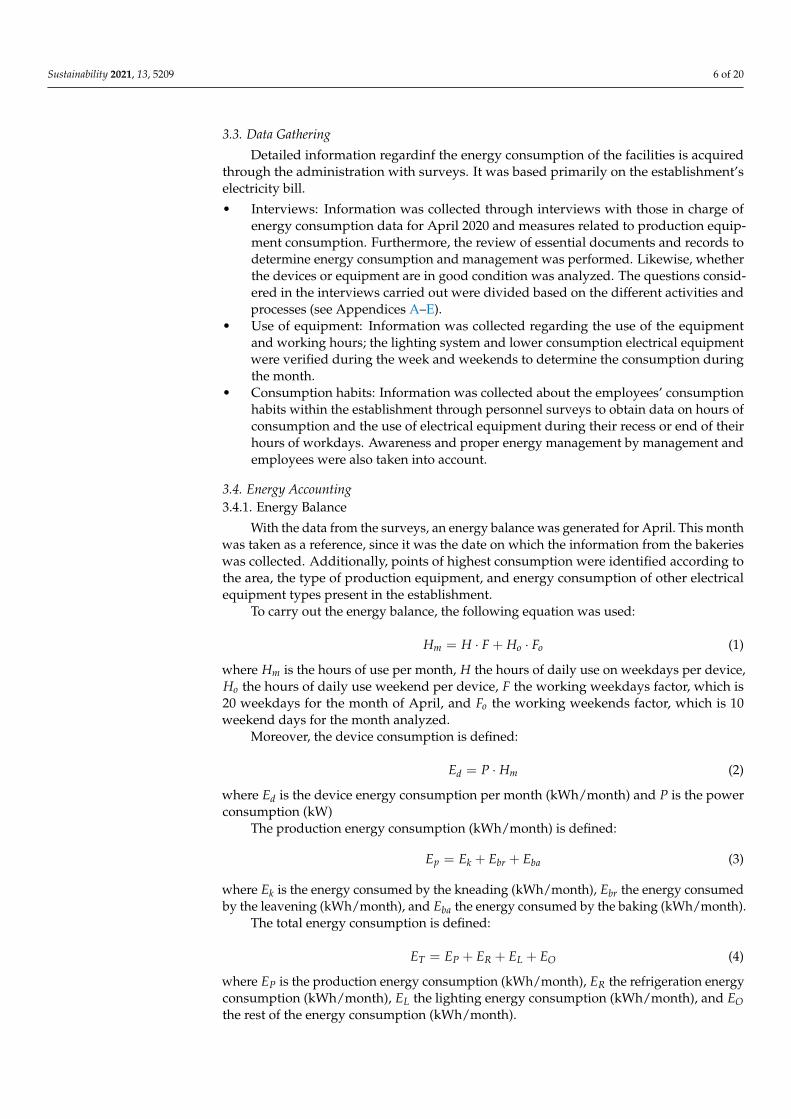
According to the data that were obtained in the interview of each baker about the timeof use of each equipment for production, it was divided by cake production processes, suchas kneading or mixing and baking; without counting on the leavening process because thisprocess only corresponds to the production of bread. Next, with Equation (5), the amountof energy used per month was calculated by the amount of flour in each of the processes.The Energy Indicator for cake production by bakery is illustrated in Figure 5 and detailedin Appendix G. In addition, it can be seen how bakery 3 presents better results than otherbakeries. Moreover, bakery 4 has the poorest results, since it consumes a more significantamount of electrical energy in all cake production processes.
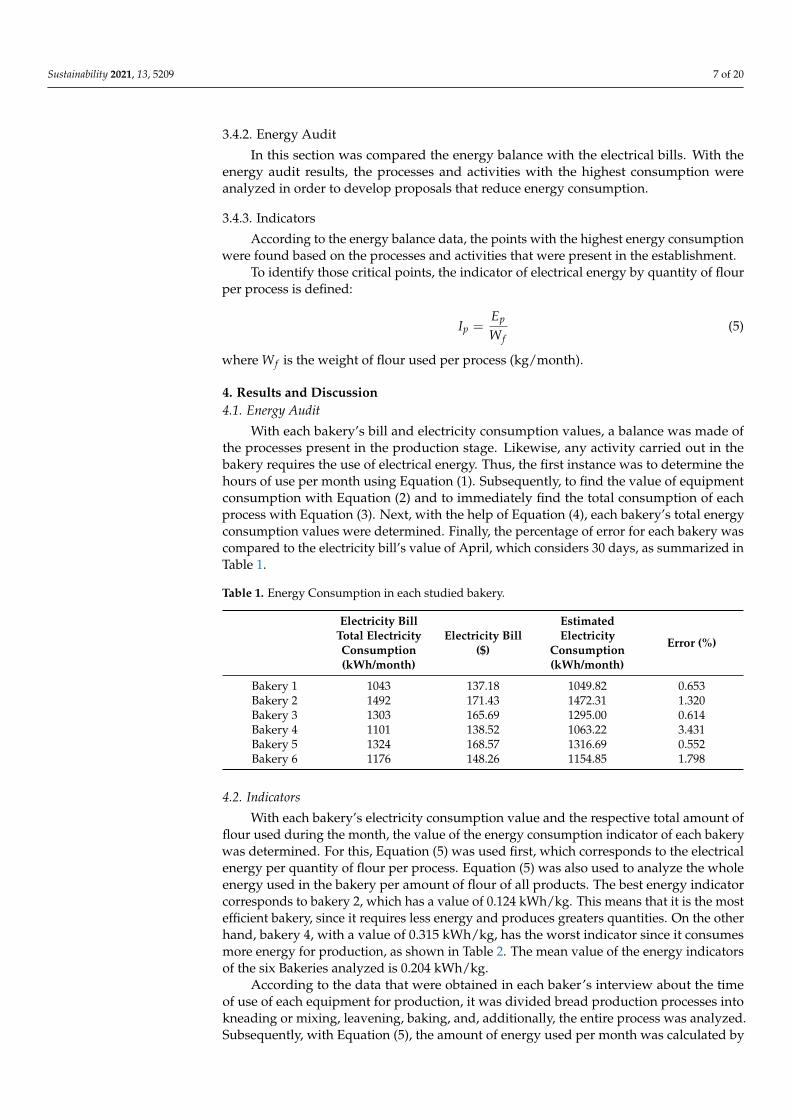
According to the data that were obtained in the interview of each baker about the timeof use of each piece of equipment for production, it was divided by the production processesof little bakery, such as kneading or mixing and baking. In Figure 6 and Appendix H , the
Sustainability 2021, 13, 5209 9 of 20
Energy Indicator for minor pastry by bakery is depicted. Note that bakery 2 presents betterresults than other bakeries. This is because the production works properly and it generatesless electrical energy losses in the little bakery’s production process. It can also be seenhow bakery 4 is less favorable than the rest. This is because it consumes a more significantamount of electrical energy in all smaller bakery production processes.
1 2 3 4 5 6
Bakery
0
0.02
0.04
0.06
0.08
0.1
0.12
0.14
0.16
0.18
0.2
Energ
y Indic
ato
r (k
Wh/k
g)
Kneading
Baking
Figure 5. Energy Indicator for cake production by bakery.
1 2 3 4 5 6
Bakery
0
0.025
0.05
0.075
0.1
0.125
0.15
Energ
y Indic
ato
r (k
Wh/k
g)
Kneading
Baking
Figure 6. Energy Indicator for minor pastry by bakery.
4.3. Higher Consumption Processes
Figure 7 illustrates the monthly energy consumption by bread, cake, and small pastryprocesses in Bakery 2, which is the bakery with the best results in terms of energy efficiency.The baking process within the bread production stage represents the activity with the high-est consumption due to the product’s cooking, whose energy demand is high. Leaveningis the next most consuming process because the bread is given the ability to take volume,which requires more electrical energy and time. Finally, the mixing or kneading processconsumes less electricity. This is because it takes little time to mix the ingredients.
The production of cakes has two processes that use energy, such as mixing or kneadingand baking. The last consumes more energy, because it requires more time and greaterelectricity consumption.

Sustainability 2021, 13, 5209 10 of 20
The production of minor bakery products has only two processes that take up energy,such as mixing or kneading and baking. Baking has the highest electricity consumption,which is based on the product’s cooking.
Bread Cake Small Pastry
Process
0
50
100
150
200
250
300
350
400
450
500
Month
ly E
nerg
y C
onsum
ption (
kW
h) Kneading
Baking
Leavening
Figure 7. Share of Energy Consumption by Process from Bakery 2.
4.4. Higher Consumption Activities
Each bakery was divided according to their activities into production, refrigeration,lighting, and other activities. These activities were determined based on the function thatthey fulfill within the bakery and considering the energy consumption. The values of eachbakery are shown in Appendix I. Figure 8 illustrates the share of each consumption activityin bakery 2. It was observed that the production activity is the highest value of electricalenergy used, representing 46% of the entire bakery with 679 kWh. Subsequently, therefrigeration activity consumes 626 kWh of the total, because the refrigeration equipmentis frequently on for the sale of products. Besides, at least one refrigeration equipment is on24 h a day because it fulfills a preserving function all foods present, such as the productsnecessary for bakery, dairy products, sausages, or other foods. Lighting consumes 91 kWh,and the other activities 76 kWh, representing a small share of the total energy consumption.
46%
43%
5%
6% Production
Refrigeration
Others
Lighting
Figure 8. Share of Energy Consumption of the Bread Process per activity from Bakery 2.

Sustainability 2021, 13, 5209 11 of 20
4.5. Proposals for the Improvement of Energy Efficiency
After analyzing the energy audit, once the bakery processes and activities with thehighest consumption have been identified, improvement activities and actions are pro-posed. They cover general logistics needs, habits of use, economics, and electric reductionconsumption. They are detailed below. This section analyzes bakery 1, since the primaryprocess in all bakeries is to make bread, and this bakery has the worst performance.
• A change of equipment was proposed for the kneading process. Table 3 shows dataof old and new proposal. The proposed equipment has a higher capacity for doughprocessing, with 10 kg per cycle, which will reduce the processing time from 120 h ina month to 36 h. Moreover, the proposed equipment has less power with 750 W, andthe energy-saving will be 105 kWh/month. NPV and IRR were calculated with a rateof discount of 6.94% taken from the Central Bank of Ecuador, and an average cost ofinvestment of $636.96 for the kneader after analyzing three different models with thesame characteristics, and an annual profit of $ 163.8 for the reduction in the energybill. The NPV for this proposal after ten years was $555.04 and IRR of 22%.
Table 3. Kneaders comparison data of bakery 1.
Kneaders Power Capacity CostW kg/cycle $
Old 1100 3 121.03New Option 750 10 636.96
• For the fermentation chamber, better process management was proposed since thefermentation chamber was partially used due to the limitations of the kneadingprocess. This action will reduce the time of use from 300 h in a month to 96 h, with anenergy saving of 102 kWh/month.
• The oven was also partially used due to constraints in the kneading process, and betterprocess management will reduce the time of use with savings of 200 kWh/month.
• The refrigeration activity has a poor performance since the heat emission from ovensis quickly gained by refrigerators. It is recommended to improve thermal isolation inall bakeries. The heat gained by refrigerators was not measured, since it is a secondarybakeries activity, and it should be analyzed in future studies.
• Lighting and minor equipment were not analyzed in detail, since they represent 11%of the whole energy consumption. However, the time of use of this equipment couldbe reduced with staff training.
In total, 407 kWh/month could be reduced in bakery 1, which represents 39% of theenergy saving.
After analyzing all bakeries’ data, it is determined that bakeries with low mass pro-cessing capacity, like bakeries 1, 4, and 6, have the highest energy indicators. These bakerieshave similar problems, like bakery 1, such as the equipment’s capacity is not appropriatefor the production, which is too small or too big. Therefore, equipment with inadequatecapacity limits the following processes, and some equipment is partially used, which causesa waste of energy.
5. Conclusions
This paper presents energy efficiency proposals for bakeries in Quito, Ecuador. Basedon the energy audits that were carried out, energy consumption and payment values weredetermined to reaffirm the relationship between the real payment value and obtainedduring the investigation. It can be concluded that bakery 2 presents the best energyindicators, since its total production requires a lower amount of electrical energy than others.Besides, bakery 2 shows the best energy performance in all of its production processes,since it works at its optimum capacity. On the other hand, bakery 4 presents the worst

Sustainability 2021, 13, 5209 12 of 20
energy consumption indicators, since it presents energy losses due to the subutilization ofequipment.
Within the bakeries that were located north of Quito, it was established that the processwith the highest energy consumption is baking for bread, since the equipment used in thisprocess has the longest usage time per day. Moreover, the high energy consumption isrepresented by the leavening process, since it is performed daily, as is the baking process,and the equipment’s energy consumption is high. The refrigeration equipment has a highenergy consumption, since the heat emission from ovens is gained by refrigerators.
The energy indicator of 0.204 kWh/kg in the bakeries in the city of Quito shows anefficient process in general, since the bakeries do not have room heating systems or airconditioners since they are not necessary due to weather conditions. In addition, the equip-ment presents greater efficiency because the processes are more straightforward for breadand its derivatives. For this reason, the energy indicator shows an average consumptionthat was lower than other bakeries in developed countries, such as a case study of Germany,where the energy indicator was 0.383 kWh/kg for the source of electricity [22]. This isprimarily because bakeries in Quito are artisans and they employ labor to shape, design,and flavor products. Other developed countries are governed to use more equipment,machinery, and less labor force.
The main limitation of this work is that energy consumption values were providedby the invoices of the stores, since this information is available for all consumers, andthey do not have an additional cost. Moreover, there were some restrictions in measuringequipment’s energy use due to safety protocols that were implemented during the COVID-19 pandemic restrictions. Thus, it could be essential to obtain real measurements of energyconsumption in future work through an energy monitoring system.
Author Contributions: Conceptualization, M.B.-L.; Data curation, D.P.-Q.; Formal analysis, D.P.-Q.; Investigation, M.B.-L.; Methodology, M.B.-L.; Supervision, M.B.-L.; Validation, J.-M.C., G.E.-E.;Writing—original draft, M.B.-L., D.P.-Q., J.-M.C.; Writing—review & editing, M.B.-L., J.-M.C., G.E.-E.All authors have read and agreed to the published version of the manuscript.
Funding: This paper belongs to the project IEA.JCG.20.02 from Universidad de las Américas- Ecuador.
Institutional Review Board Statement: Not applicable.
Informed Consent Statement: Not applicable.
Data Availability Statement: Not applicable.
Acknowledgments: The authors would like to thank Mario González-Rodríguez from Universidadde las Américas-Ecuador for providing Figure 3.
Conflicts of Interest: The authors declare no conflict of interest.
AbbreviationsThe following abbreviations are used in this manuscript:
HVAC Heating Ventilation and Air-ConditioningIRR Internal Rate of ReturnNPV Net Present Value

Sustainability 2021, 13, 5209 13 of 20
Appendix A. Survey of Behavior
This survey analyzes schedule of operation and activities developed in bakery.
QuestionsAnswers
Bakery 1 Bakery 2 Bakery 3 Bakery 4 Bakery 5 Bakery 6
Monday through Friday, how manyhours does the facility operate daily?
15 12 12 12 13 12
How many hours does the facilityoperate daily on weekends?
15 12 12 12 13 12
What kind of activities does he fulfill?You can choose from several options.
kneading kneading kneading kneading kneading kneadingbaking baking baking baking baking baking
decoration decoration decoration decoration decoration decorationsales sales sales sales sales sales
- administration - - administration -
In the course of your workday doyou have a break?
yes yes yes yes yes yes
How long is your break? 30 min 30 min 30 min 30 min 30 min 30 min
When you leave your workday or break,do you leave electrical equipment or appliances on?
yes yes yes no yes no
Which appliances or equipment remain on? refrigeration equipment oven refrigerator none refrigeration equipment nonecash register machine
Do you unplug the cables of electrical equipmentor appliances that you do not use?
yes yes yes no yes no
What are the electrical equipment orappliances that you disconnect?
fan mixer refrigerator
none
mixer
nonetelevision oven cash register machine ovenradio hand mixer hand mixer
baking machine
How do you consider the operation andcondition of the electrical equipment?
regular good good regular good good
Sustainability 2021, 13, 5209 14 of 20
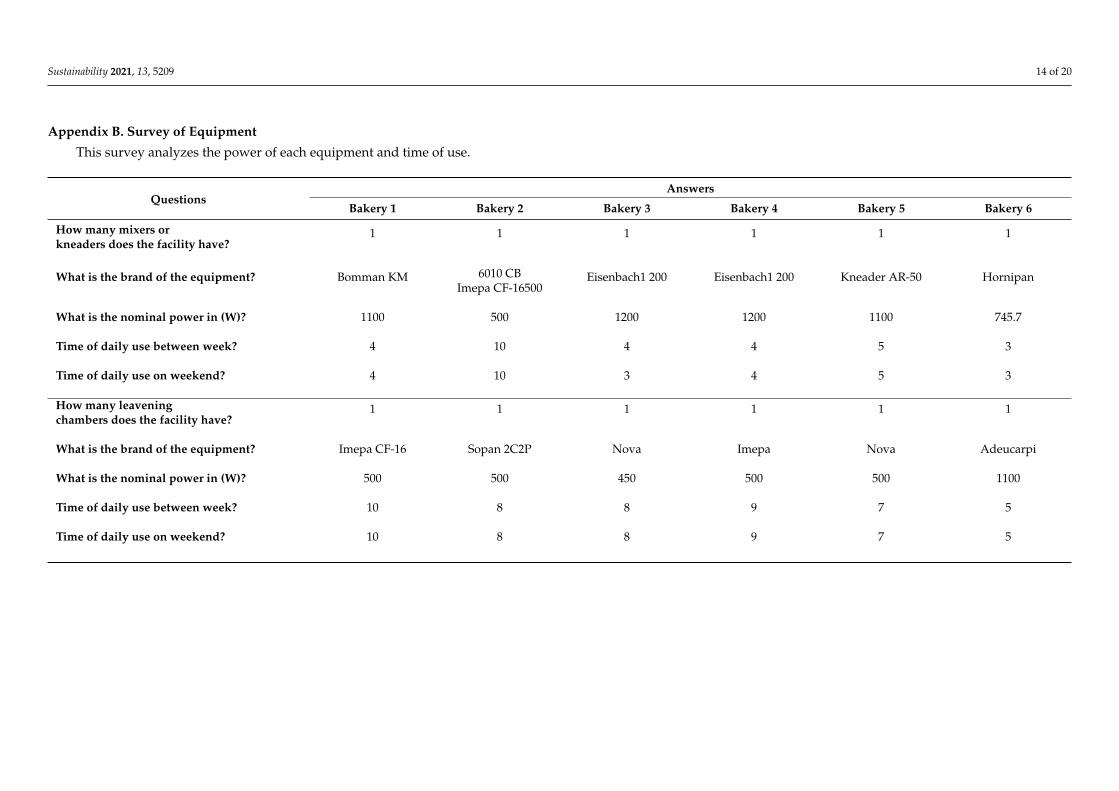
Appendix B. Survey of Equipment
This survey analyzes the power of each equipment and time of use.
QuestionsAnswers
Bakery 1 Bakery 2 Bakery 3 Bakery 4 Bakery 5 Bakery 6
How many mixers orkneaders does the facility have?
1 1 1 1 1 1
What is the brand of the equipment? Bomman KM 6010 CBImepa CF-16500
Eisenbach1 200 Eisenbach1 200 Kneader AR-50 Hornipan
What is the nominal power in (W)? 1100 500 1200 1200 1100 745.7
Time of daily use between week? 4 10 4 4 5 3
Time of daily use on weekend? 4 10 3 4 5 3
How many leaveningchambers does the facility have?
1 1 1 1 1 1
What is the brand of the equipment? Imepa CF-16 Sopan 2C2P Nova Imepa Nova Adeucarpi
What is the nominal power in (W)? 500 500 450 500 500 1100
Time of daily use between week? 10 8 8 9 7 5
Time of daily use on weekend? 10 8 8 9 7 5
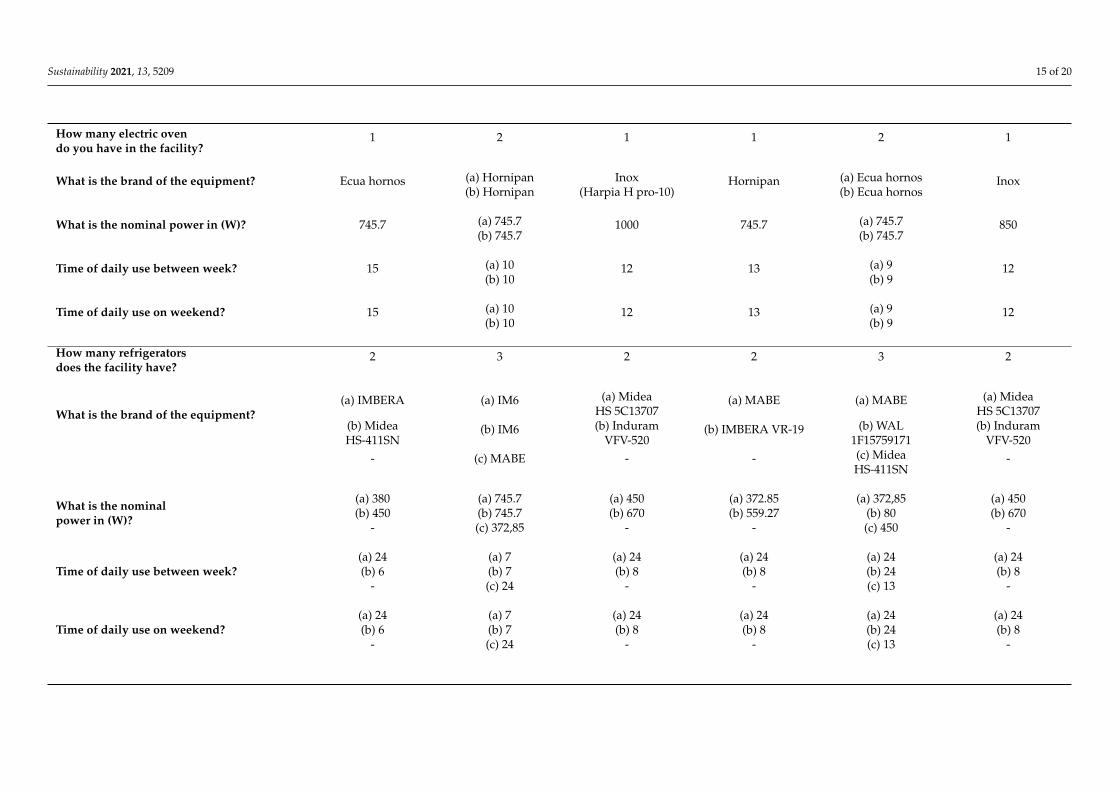
Sustainability 2021, 13, 5209 15 of 20
How many electric ovendo you have in the facility?
1 2 1 1 2 1
What is the brand of the equipment? Ecua hornos (a) Hornipan(b) Hornipan
Inox(Harpia H pro-10)
Hornipan (a) Ecua hornos(b) Ecua hornos
Inox
What is the nominal power in (W)? 745.7 (a) 745.7(b) 745.7
1000 745.7 (a) 745.7(b) 745.7
850
Time of daily use between week? 15 (a) 10(b) 10
12 13 (a) 9(b) 9
12
Time of daily use on weekend? 15 (a) 10(b) 10
12 13 (a) 9(b) 9
12
How many refrigeratorsdoes the facility have?
2 3 2 2 3 2
What is the brand of the equipment?(a) IMBERA (a) IM6 (a) Midea
HS 5C13707(a) MABE (a) MABE (a) Midea
HS 5C13707(b) MideaHS-411SN
(b) IM6 (b) InduramVFV-520
(b) IMBERA VR-19 (b) WAL1F15759171
(b) InduramVFV-520
- (c) MABE - - (c) MideaHS-411SN
-
What is the nominalpower in (W)?
(a) 380 (a) 745.7 (a) 450 (a) 372.85 (a) 372,85 (a) 450(b) 450 (b) 745.7 (b) 670 (b) 559.27 (b) 80 (b) 670
- (c) 372,85 - - (c) 450 -
Time of daily use between week?(a) 24 (a) 7 (a) 24 (a) 24 (a) 24 (a) 24(b) 6 (b) 7 (b) 8 (b) 8 (b) 24 (b) 8
- (c) 24 - - (c) 13 -
Time of daily use on weekend?(a) 24 (a) 7 (a) 24 (a) 24 (a) 24 (a) 24(b) 6 (b) 7 (b) 8 (b) 8 (b) 24 (b) 8
- (c) 24 - - (c) 13 -

Sustainability 2021, 13, 5209 16 of 20
Have any changes beenmade to appliances orequipment in the last year?
no no yes yes no yes
What devices orequipment havebeen changed?
- - refrigerator oven - mixer
Approximately how longago was the change in thelast year?
- - 12 months 6 months - 12 months
What equipment orappliances do you run ona daily ?
refrigerationequipment
refrigerator refrigerator refrigerator refrigeratorand cooler
refrigerationequipment
How many hours are turnon this equipment?
24 24 24 24 24 24
Appendix C. Survey of Lighting
This survey analyzes the power and time of use of lighting.
QuestionsAnswers
Bakery 1 Bakery 2 Bakery 3 Bakery 4 Bakery 5 Bakery 6
How many hours per day are theluminaires on, by area?
Production: 15 h Production: 12 h Production: 12h Production: 13 h Production: 13 h Production: 12 hSales: 15 h Sales: 12 h Sales: 12 h Sales: 13 h Sales: 13 h Sales: 12 h
Do you turn off the lights you arenot occupying?
yes yes yes yes yes yes
How many lights do you have in the facility? 5 9 7 6 7 7What is the nominal power in (W)? 10 28 60 18 32 32

Sustainability 2021, 13, 5209 17 of 20
Appendix D. Survey of Production
This survey analyzes the mass used for each product in the bakeries.
QuestionsAnswers
Bakery 1 Bakery 2 Bakery 3 Bakery 4 Bakery 5 Bakery 6
Approximately how much flour isused daily in (kg)?
80 400 300 120 350 170
Approximately how much flour isused Monday through Friday in (kg)?
400 2000 1500 600 1750 850
Approximately how much flour isused on weekends?
200 800 600 220 600 320
Approximately how many loaves ofbread are produced daily?
2500 6000 5000 4000 5000 3000
Approximately how many loaves areproduced from Monday to Friday?
12,500 30,000 25,000 20,000 25,000 15,000
Approximately how many loaves areproduced on weekends?
5000 12,000 10,000 8000 8000 6000
Approximately how many cakes areproduced from Monday to Friday?
15 100 50 40 40 30
Approximately how many cakes areproduced on weekends?
6 40 20 16 10 15
How many (cookies, chocolates, nougats,truffles, alfajores, brownies, etc.)approximately are produced daily?
50 200 150 130 180 150
How many (cookies, chocolates, nougats,truffles, alfajores, brownies, etc.)approximately are produced from Mondayto Friday?
250 1000 750 650 900 750
How many (cookies, chocolates, nougats,truffles, alfajores, brownies, etc.)approximately are produced on weekends?
100 400 300 260 360 300

Sustainability 2021, 13, 5209 18 of 20
Appendix E. Survey of Maintenance
This surveys analyzes maintenance of equipment and energy savings measures in the bakeries.
QuestionsAnswers
Bakery 1 Bakery 2 Bakery 3 Bakery 4 Bakery 5 Bakery 6
Have you performed maintenance onelectrical installations and equipment?
yes yes yes yes yes no
What electrical facilities or equipmenthave been maintained?
oven - mixer oven oven oven andrefrigerator
How often is the maintenance orrenewal of the machines performed?
1–2 years - 1–2 years 1–2 years 1–2 years 1–2 years
Do you know about the energyconsumption used by electricalinstallations and equipment?
yes yes yes no yes no
Does the facility have an energy plan? no no no no no no
Have you ever performed an energyconsumption diagnosis of the facilities?
no no no no no no
Have you ever implemented any energysaving measures?
no unknown no no no unknown
Appendix F. Energy Indicator for Bread Production by Bakery
Process Bakery 1 Bakery 2 Bakery 3 Bakery 4 Bakery 5 Bakery 6[kWh/kg] [kWh/kg] [kWh/kg] [kWh/kg] [kWh/kg] [kWh/kg]
Kneading 0.032 0.008 0.013 0.035 0.015 0.013Leavening 0.058 0.047 0.042 0.052 0.037 0.064Baking 0.096 0.036 0.042 0.070 0.039 0.057
Total 0.186 0.091 0.096 0.158 0.091 0.134

Sustainability 2021, 13, 5209 19 of 20
Appendix G. Energy Indicator for Cake Production by Bakery
Process Bakery 1 Bakery 2 Bakery 3 Bakery 4 Bakery 5 Bakery 6[kWh/kg] [kWh/kg] [kWh/kg] [kWh/kg] [kWh/kg] [kWh/kg]
Kneading 0.044 0.014 0.020 0.061 0.029 0.017Baking 0.103 0.047 0.035 0.132 0.053 0.085
Total 0.147 0.061 0.055 0.192 0.082 0.102
Appendix H. Energy Indicator for Minor Pastry production by bakery
Process Bakery 1 Bakery 2 Bakery 3 Bakery 4 Bakery 5 Bakery 6[kWh/kg] [kWh/kg] [kWh/kg] [kWh/kg] [kWh/kg] [kWh/kg]
Kneading 0.050 0.007 0.019 0.051 0.011 0.012Baking 0.056 0.029 0.037 0.096 0.030 0.046
Total 0.106 0.036 0.056 0.147 0.041 0.058
Appendix I. Energy Use by Activities
Process Bakery 1 Bakery 2 Bakery 3 Bakery 4 Bakery 5 Bakery 6[kWh/kg] [kWh/kg] [kWh/kg] [kWh/kg] [kWh/kg] [kWh/kg]
Production 618 679 600 570 662 538Refrigeration 382 626 485 403 382 485Others 28 76 59 49 66 51Lighting 23 91 151 42 87 81
Total 1050 1472 1295 1063 1197 1155

Sustainability 2021, 13, 5209 20 of 20
References1. Li, M.J.; Tao, W.Q. Review of methodologies and polices for evaluation of energy efficiency in high energy-consuming industry.
Appl. Energy 2017, 187, 203–215. [CrossRef]2. Clairand, J.M.; Briceño-León, M.; Escrivá-Escrivá, G.; Pantaleo, A.M. Review of Energy Efficiency Technologies in the Food
Industry: Trends, Barriers, and Opportunities. IEEE Access 2020, 8, 48015–48029. [CrossRef]3. Cai, W.; Liu, C.; Lai, K.h.; Li, L.; Cunha, J.; Hu, L. Energy performance certification in mechanical manufacturing industry: A
review and analysis. Energy Conver. Manag. 2019, 186, 415–432. [CrossRef]4. Malinauskaite, J.; Jouhara, H.; Ahmad, L.; Milani, M.; Montorsi, L.; Venturelli, M. Energy efficiency in industry: EU and national
policies in Italy and the UK. Energy 2019, 172, 255–269. [CrossRef]5. Millán, G.; Llano, E.; Globisch, J.; Durand, A.; Hettesheimer, T.; Alcalde, E. Increasing energy efficiency in the food and beverage
industry: A human-centered design approach. Sustainability 2020, 12, 7037. [CrossRef]6. Xie, X.; Lin, B. Understanding the energy intensity change in China’s food industry: A comprehensive decomposition method.
Energy Policy 2019, 129, 53–68. [CrossRef]7. Sola, A.V.; Mota, C.M. Influencing factors on energy management in industries. J. Clean. Prod. 2020, 248. [CrossRef]8. Kong, L.; Price, L.; Hasanbeigi, A.; Liu, H.; Li, J. Potential for reducing paper mill energy use and carbon dioxide emissions
through plant-wide energy audits: A case study in China. Appl. Energy 2013, 102, 1334–1342. [CrossRef]9. Klugman, S.; Karlsson, M.; Moshfegh, B. A Scandinavian chemical wood pulp mill. Part 1. Energy audit aiming at efficiency
measures. Appl. Energy 2007, 84, 326–339. [CrossRef]10. Kabir, G.; Abubakar, A.I.; El-Nafaty, U.A. Energy audit and conservation opportunities for pyroprocessing unit of a typical dry
process cement plant. Energy 2010, 35, 1237–1243. [CrossRef]11. Kluczek, A.; Olszewski, P. Energy audits in industrial processes. J. Clean. Prod. 2017, 142, 3437–3453. [CrossRef]12. Chiaroni, D.; Chiesa, V.; Franzò, S.; Frattini, F.; Manfredi Latilla, V. Overcoming internal barriers to industrial energy efficiency
through energy audit: A case study of a large manufacturing company in the home appliances industry. Clean Technol. Environ.Policy 2017, 19, 1031–1046. [CrossRef]
13. Escrivá-Escrivá, G.; Segura-Heras, I.; Alcázar-Ortega, M. Application of an energy management and control system to assess thepotential of different control strategies in HVAC systems. Energy Build. 2010, 42, 2258–2267. [CrossRef]
14. Hin, M.; Chan, E.; Chu, K.k.; Chow, H.f.; Tsang, C.w.; Kuen, C.; Ho, D.; Ho, S.K. Improving the Energy E ffi ciency of PetrochemicalPlant Operations: A Measurement and Verification Case Study Using a Balanced Wave Optimizer. Energies 2019, 12, 4136.
15. Arriola-Medellín, A.M.; López-Cisneros, L.F.; Aragón-Aguilar, A.; Romo-Millares, C.A.; Fernández-Montiel, M.F. Energyefficiency to increase production and quality of products in industrial processes: Case study oil and gas processing center. EnergyEffic. 2019, 12, 1619–1634. [CrossRef]
16. Licharz, H.; Rösmann, P.; Krommweh, M.S.; Mostafa, E.; Büscher, W. Energy Efficiency of a Heat Pump System: Case Study inTwo Pig Houses. Energies 2020, 13, 662. [CrossRef]
17. Schroeder, E. Global Bread and Rolls Market Approaching $200 Billion. Available online: https://www.bakingbusiness.com/articles/29484 (accessed on 16 February 2021).
18. Federation of Bakers. European Bread Market. Available online: https://www.fob.uk.com/about-the-bread-industry/industry-facts/european-bread-market/ (accessed on 16 February 2021).
19. Malovany, D. Latin American Baking Industry Undergoing Significant Transformation. Available online: https://www.bakingbusiness.com/articles/48886 (accessed on 16 February 2021).
20. SUPERCIAS. Companies by Economic Activity. Available online: https://reporteria.supercias.gob.ec/portal (accessed on16 February 2021).
21. INEC. National Economic Census. Available online: http://redatam.inec.gob.ec/ (accessed on 16 February 2021).22. Kannan, R.; Boie, W. Energy management practices in SME-Case study of a bakery in Germany. Energy Convers. Manag. 2003,
44, 945–959. [CrossRef]23. Zisopoulos, F.K.; Moejes, S.N.; Rossier-Miranda, F.J.; Van Der Goot, A.J.; Boom, R.M. Exergetic comparison of food waste
valorization in industrial bread production. Energy 2015, 82, 640–649. [CrossRef]24. Chhanwal, N.; Ezhilarasi, P.N.; Indrani, D.; Anandharamakrishnan, C. Influence of electrical and hybrid heating on bread quality
during baking. J. Food Sci. Technol. 2015, 52, 4467–4474. [CrossRef]25. Wang, Y.; Li, K.; Gan, S.; Cameron, C. Analysis of energy saving potentials in intelligent manufacturing: A case study of bakery
plants. Energy 2019, 172, 477–486. [CrossRef]26. Papasidero, D.; Pierucci, S.; Manenti, F. Energy optimization of bread baking process undergoing quality constraints. Energy
2016, 116, 1417–1422. [CrossRef]27. Ayub, I.; Nasir, M.S.; Liu, Y.; Munir, A.; Yang, F.; Zhang, Z. Performance improvement of solar bakery unit by integrating with
metal hydride based solar thermal energy storage reactor. Renew. Energy 2020, 161, 1011–1024. [CrossRef]
Related Documents