Energy efficiency in the British housing stock: Energy demand and the Homes Energy Efficiency Database $ Ian G. Hamilton n , Philip J. Steadman, Harry Bruhns, Alex J. Summerfield, Robert Lowe University College London, UCL Energy Institute, Central House, 14 Upper Woburn Place, London WC1H 0NN, UK HIGHLIGHTS The energy efficiency level for 50% of the British housing stock is described. Energy demand is influenced by size and age and energy performance. Housing retrofits (e.g. cavity insulation, glazing and boiler replacements) save energy. Historic differences in energy performance show persistent long-term energy savings. article info Article history: Received 1 April 2012 Accepted 2 April 2013 Available online 9 May 2013 Keywords: Energy Housing Retrofit abstract The UK Government has unveiled an ambitious retrofit programme that seeks significant improvement to the energy efficiency of the housing stock. High quality data on the energy efficiency of buildings and their related energy demand is critical to supporting and targeting investment in energy efficiency. Using existing home improvement programmes over the past 15 years, the UK Government has brought together data on energy efficiency retrofits in approximately 13 million homes into the Homes Energy Efficiency Database (HEED), along with annual metered gas and electricity use for the period of 2004–2007. This paper describes the HEED sample and assesses its representativeness in terms of dwelling characteristics, the energy demand of different energy performance levels using linked gas and electricity meter data, along with an analysis of the impact retrofit measures has on energy demand. Energy savings are shown to be associated with the installation of loft and cavity insulation, and glazing and boiler replacement. The analysis illustrates this source of ‘in-action’ data can be used to provide empirical estimates of impacts of energy efficiency retrofit on energy demand and provides a source of empirical data from which to support the development of national housing energy efficiency retrofit policies. & 2013 The Authors. Published by Elsevier Ltd. All rights reserved. 1. Introduction The UK government has identified the residential building stock as being one of the most cost-effective and technology- ready sectors to substantially reduce the greenhouse gas (GHG) emissions over the next decade (DECC, 2012a). Proposals, for example, include cutting GHG emissions in existing homes by 29% by 2020 through a challenging ‘whole house’ retrofit pro- gramme, enabled under the ‘Green Deal’ (DECC, 2010a); plans also include all new homes to be ‘zero carbon’ by 2016 (CLG, 2007). These targets have set out a pathway that will see many billions of pounds invested in technologies to improve energy efficiency of demand (DECC, 2012a; European Commission, 2011; UNEP, 2011). Yet achieving these reductions in practice will depend on the ability to measure and track the energy demand of dwellings that have been the subject energy efficiency retrofits. The overall aim of this paper is to examine the effectiveness of one possible approach to measurement and tracking of energy demand through an analysis of the impact that historic energy efficiency interventions had on energy demand in UK dwellings between 2004 and 2007. Developing energy efficiency intervention programmes for the UK housing stock that are capable of achieving significant and sustained reduction in energy demand requires nothing less than a step change in the available information on the state of the existing stock. The fact is, however, that such data has in the past been difficult to come by, for reasons of lack of interest, limited invest- ment in high quality data, poor coordination and limited connexion between existing datasets and the ability of all stakeholders to learn and innovate (Dietz, 2010; Lowe and Oreszczyn, 2008; Oreszczyn and Lowe, 2010). The government, in acknowledging this need for data and its importance in meeting their GHG reduction commit- ments has developed a data-framework that draws together Contents lists available at SciVerse ScienceDirect journal homepage: www.elsevier.com/locate/enpol Energy Policy 0301-4215/$ - see front matter & 2013 The Authors. Published by Elsevier Ltd. All rights reserved. http://dx.doi.org/10.1016/j.enpol.2013.04.004 $ This is an open-access article distributed under the terms of the Creative Commons Attribution-NonCommercial-No Derivative Works License, which per- mits non-commercial use, distribution, and reproduction in any medium, provided the original author and source are credited. n Corresponding author. Tel.: +44 20 31085982. E-mail address: [email protected] (I.G. Hamilton). Energy Policy 60 (2013) 462–480

Welcome message from author
This document is posted to help you gain knowledge. Please leave a comment to let me know what you think about it! Share it to your friends and learn new things together.
Transcript
Energy Policy 60 (2013) 462–480
Contents lists available at SciVerse ScienceDirect
Energy Policy
0301-42http://d
$ThisCommomits nothe orig
n CorrE-m
journal homepage: www.elsevier.com/locate/enpol
Energy efficiency in the British housing stock: Energy demandand the Homes Energy Efficiency Database$
Ian G. Hamilton n, Philip J. Steadman, Harry Bruhns, Alex J. Summerfield, Robert LoweUniversity College London, UCL Energy Institute, Central House, 14 Upper Woburn Place, London WC1H 0NN, UK
H I G H L I G H T S
� The energy efficiency level for 50% of the British housing stock is described.
� Energy demand is influenced by size and age and energy performance.� Housing retrofits (e.g. cavity insulation, glazing and boiler replacements) save energy.� Historic differences in energy performance show persistent long-term energy savings.a r t i c l e i n f o
Article history:Received 1 April 2012Accepted 2 April 2013Available online 9 May 2013
Keywords:EnergyHousingRetrofit
15/$ - see front matter & 2013 The Authors. Px.doi.org/10.1016/j.enpol.2013.04.004
is an open-access article distributed undens Attribution-NonCommercial-No Derivativen-commercial use, distribution, and reproductinal author and source are credited.esponding author. Tel.: +44 20 31085982.ail address: [email protected] (I.G. Hamilton
a b s t r a c t
The UK Government has unveiled an ambitious retrofit programme that seeks significant improvement tothe energy efficiency of the housing stock. High quality data on the energy efficiency of buildings and theirrelated energy demand is critical to supporting and targeting investment in energy efficiency. Usingexisting home improvement programmes over the past 15 years, the UKGovernment has brought togetherdata on energy efficiency retrofits in approximately 13 million homes into the Homes Energy EfficiencyDatabase (HEED), along with annual metered gas and electricity use for the period of 2004–2007.
This paper describes the HEED sample and assesses its representativeness in terms of dwellingcharacteristics, the energy demand of different energy performance levels using linked gas and electricitymeter data, along with an analysis of the impact retrofit measures has on energy demand. Energy savingsare shown to be associated with the installation of loft and cavity insulation, and glazing and boilerreplacement. The analysis illustrates this source of ‘in-action’ data can be used to provide empiricalestimates of impacts of energy efficiency retrofit on energy demand and provides a source of empiricaldata from which to support the development of national housing energy efficiency retrofit policies.
& 2013 The Authors. Published by Elsevier Ltd. All rights reserved.
1. Introduction
The UK government has identified the residential buildingstock as being one of the most cost-effective and technology-ready sectors to substantially reduce the greenhouse gas (GHG)emissions over the next decade (DECC, 2012a). Proposals, forexample, include cutting GHG emissions in existing homes by29% by 2020 through a challenging ‘whole house’ retrofit pro-gramme, enabled under the ‘Green Deal’ (DECC, 2010a); plans alsoinclude all new homes to be ‘zero carbon’ by 2016 (CLG, 2007).These targets have set out a pathway that will see many billions ofpounds invested in technologies to improve energy efficiency ofdemand (DECC, 2012a; European Commission, 2011; UNEP, 2011).
ublished by Elsevier Ltd. All rights
r the terms of the CreativeWorks License, which per-
ion in any medium, provided
).
Yet achieving these reductions in practice will depend on theability to measure and track the energy demand of dwellings thathave been the subject energy efficiency retrofits. The overall aim ofthis paper is to examine the effectiveness of one possible approachto measurement and tracking of energy demand through ananalysis of the impact that historic energy efficiency interventionshad on energy demand in UK dwellings between 2004 and 2007.
Developing energy efficiency intervention programmes for theUK housing stock that are capable of achieving significant andsustained reduction in energy demand requires nothing less than astep change in the available information on the state of the existingstock. The fact is, however, that such data has in the past beendifficult to come by, for reasons of lack of interest, limited invest-ment in high quality data, poor coordination and limited connexionbetween existing datasets and the ability of all stakeholders to learnand innovate (Dietz, 2010; Lowe and Oreszczyn, 2008; Oreszczynand Lowe, 2010). The government, in acknowledging this need fordata and its importance in meeting their GHG reduction commit-ments has developed a data-framework that draws together
reserved.
1 Following 2008, government statistics on national housing sector energydemand was revised using an update model (DECC, 2012b). As such, 2008 isselected to ensure accurate comparison against previous years.
2 Residential energy demand by service type is estimated from DUKES data,national totals, and Domestic Energy Fact File data, service fractions. Renewableenergy is not included. Services of Fuels o1% of total are not shown but areaccounted for in the total.
3 The standard assessment procedure (SAP) is a measure of the space and hotwater heating cost normalised for floor area with an assumed standard heatingprofile (BRE & DECC, 2009). The SAP 2005 index is based on a logarithmic scale thatruns from 1 to 100. The methodology has changed several times and makes preciseinterpretation of time series difficult.
4 The English House Condition Survey (EHCS) was integrated with the Surveyof English Housing (SEH) in April 2008; this created the English HousingSurvey (EHS).
I.G. Hamilton et al. / Energy Policy 60 (2013) 462–480 463
information on the UK's dwelling stock and its energy performance(DECC, 2011).
Since 1995 to 2012, the Homes Energy Efficiency Database(HEED) has collected data on energy efficiency measures installedin approximately 13 million dwellings in the UK, or half thehousing stock, from a number of different sources including:energy suppliers, government funded schemes directed at vulner-able households (e.g. fuel poor, elderly, low income), energyefficiency surveys and retrofit installers (Energy Saving Trust,2010). HEED offers a unique data source that provides informationon both the features of the dwelling (e.g. age, size, type, location),its energy performance (e.g. loft insulation levels, wall construc-tion, etc…), along with details on the installed efficiency measures(e.g. loft insulation, cavity filling, boiler replacement, etc…). Inaddition to this source of dwelling level energy details, thegovernment has collected annual gas and electricity meter datafrom energy suppliers on energy demand for statistical reportingsince 2004 (DECC, 2009b). In this study, these two sources of datawere linked together by the government using the physicalproperty address and made available for analysis.
The datasets in HEED represent ‘in action’ data, i.e. the product(and by-product) of a range of disparate activities that are centred onhome energy efficiency. Its continual collection over the past 15 yearshas created a large population level database, detailing and tracking alarge amount of retrofit activity in the housing stock. Linked to dataon energy demand practices, these population level databases offer arich resource from which to draw together evidence on energyperformance, the uptake of energy efficiency measures along withchanges in energy demand associated with such measures. In usingthis resource there are important issues that need to be explored todetermine whether databases from a wide number of suppliers canbe used to elucidate trends and relationships for dwelling energydemand and energy efficiency. It is also necessary to consider how aresource of this type will contribute to the on-going development ofnational housing energy efficiency retrofit policy.
The aims of this paper are to: (1) describe the HEED data, inparticular to assess its overall representativeness as compared toother housing data for Great Britain (GB); (2) to describe thedifferences in energy demand (gas and electricity) of the HEEDhousing stock, segmented by built form characteristics and level ofenergy efficiency; (3) to determine the change in energy demandassociated with the presence of energy efficiency interventions asthey relate to changes in energy demand for a selected period (i.e.2005–2007); and (4) to consider the policy implications of this ‘inaction’ population level data source on developing housing energyefficiency retrofit policy.
1.1. Background
Although significant investments in energy efficient technolo-gies and policies have seen a drop in per capita energy demand forkey services (i.e. heating and hot water), total energy use indeveloped countries has grown steadily, particularly electricityuse (IEA, 2008; Pérez-Lombard et al., 2008). Despite this growth,national GHG reduction plans and security of supply are depen-dent on considerable and rapid reductions in energy demand frombuildings (European Commission, 2011; UK CCC, 2010). The UKCommittee on Climate Change has acknowledged that an overallGHG emission reduction of greater than 80% by 2050 is required inthe built environment (DECC, 2009a; UK CCC, 2010). Further, theGovernment has supported a target of ‘zero carbon’ for all newbuildings by 2019 and near zero emissions from all existingbuildings by 2030 (CLG, 2007; DECC and DCLG, 2010). Deliveringthis transformation will not only require a range of effectivetechnology interventions but also a deeper level of understandingof the underlying relationships between people, energy use,
buildings and environment. Without this insight the ability todevelop evidence-based policies to tackle energy demand inbuildings is severely compromised (Oreszczyn and Lowe, 2010).
1.2. Energy demand in UK houses
Between 1970 and 20081 estimates of per capita energydemand for lighting and appliances increased by 88%, meanwhilespace heating is estimated to have peaked in the 1980s and hasdeclined by approximately 8% per capita (DECC, 2012b). Totaldelivered energy demand in dwellings has grown by 30% duringthe same period, though peaking around 2004. Gas demand hasfallen by 20% between 2005 and 2010; temperature, price and ageneral improvement in efficiency are cited as reasons for thisdecline (DECC, 2010b).
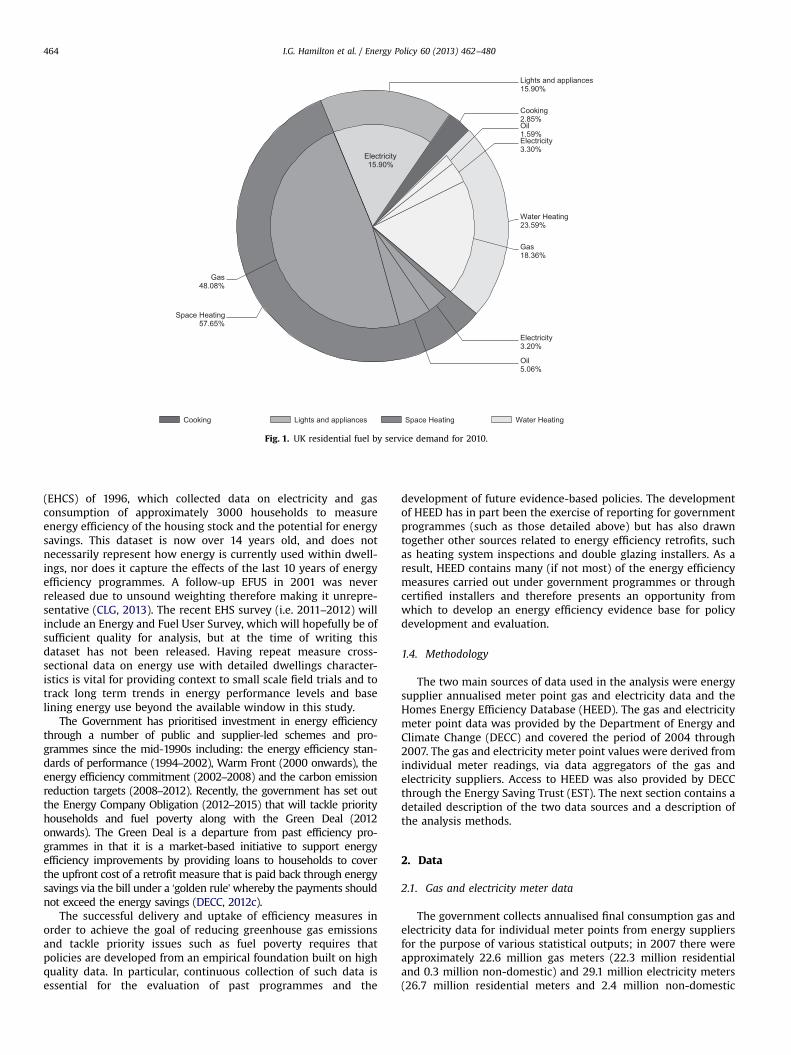
In 2010, domestic (i.e. residential) delivered energy accountedfor approximately 33% (490 TWh) of total GB energy demand byfinal consumption, of which gas and electricity accounted forapproximately 70% (344 TWh) and 23% (113 TWh) respectively(DECC, 2013). Fig. 1 shows an estimate of the total residentialdemand by service type and fuel2 (DECC, 2010b). The majority ofresidential energy demand is for space and hot water heating(78%) with the remainder for appliances (16%) and cooking (3%).
1.3. Energy efficiency retrofit in UK houses
Since 1970, estimates of the average UK home energy effi-ciency, as defined by the Standard Assessment Procedure (SAP)20053, have risen from 17.6 SAP points in 1970 to 54.7 SAP pointsin 2010 and the mean heat loss coefficient of dwellings isestimated to have fallen from 376 W/K to below 286 W/K(Palmer and Cooper, 2013). This increase in efficiency has largelybeen attributed to the increased uptake in whole house heatingsystems, more efficient boilers, improved glazing, and loft andcavity insulation and fuel switching to electricity.
Data on energy demand and energy efficiency of residentialbuildings in the UK takes various forms. There are several publiclyavailable datasets on the UK housing stock, ranging from largecross-sectional surveys on the overall condition of homes and theirtheoretical energy performance, as found in the English HousingSurvey4 (EHS), to smaller most selective data sets from studysurveys of home energy use (e.g. the CaRB Home Energy Survey(Shipworth et al., 2010)), or field trails that focus on particulardwelling or household features or technologies (e.g. the MiltonKeynes Energy park (Summerfield et al., 2007)).
However, until recently, data that featured both energydemand and house characteristics at a population level amongthe UK housing stock was severely limited to historic surveys andsmall field studies. The most comprehensive and representativedataset that drew together information on energy demand anddwelling characteristics was the Energy and Fuel Use Survey(EFUS), a subset survey from the English House Condition Survey
Cooking Lights and appliances Space Heating Water Heating
Cooking2.85%
Lights and appliances15.90%
Electricity15.90%
Space Heating57.65%
Gas48.08%
Oil5.06%
Electricity3.20%
Water Heating23.59%
Gas18.36%
Electricity3.30%
Oil1.59%
Fig. 1. UK residential fuel by service demand for 2010.
I.G. Hamilton et al. / Energy Policy 60 (2013) 462–480464
(EHCS) of 1996, which collected data on electricity and gasconsumption of approximately 3000 households to measureenergy efficiency of the housing stock and the potential for energysavings. This dataset is now over 14 years old, and does notnecessarily represent how energy is currently used within dwell-ings, nor does it capture the effects of the last 10 years of energyefficiency programmes. A follow-up EFUS in 2001 was neverreleased due to unsound weighting therefore making it unrepre-sentative (CLG, 2013). The recent EHS survey (i.e. 2011–2012) willinclude an Energy and Fuel User Survey, which will hopefully be ofsufficient quality for analysis, but at the time of writing thisdataset has not been released. Having repeat measure cross-sectional data on energy use with detailed dwellings character-istics is vital for providing context to small scale field trials and totrack long term trends in energy performance levels and baselining energy use beyond the available window in this study.
The Government has prioritised investment in energy efficiencythrough a number of public and supplier-led schemes and pro-grammes since the mid-1990s including: the energy efficiency stan-dards of performance (1994–2002), Warm Front (2000 onwards), theenergy efficiency commitment (2002–2008) and the carbon emissionreduction targets (2008–2012). Recently, the government has set outthe Energy Company Obligation (2012–2015) that will tackle priorityhouseholds and fuel poverty along with the Green Deal (2012onwards). The Green Deal is a departure from past efficiency pro-grammes in that it is a market-based initiative to support energyefficiency improvements by providing loans to households to coverthe upfront cost of a retrofit measure that is paid back through energysavings via the bill under a ‘golden rule’whereby the payments shouldnot exceed the energy savings (DECC, 2012c).
The successful delivery and uptake of efficiency measures inorder to achieve the goal of reducing greenhouse gas emissionsand tackle priority issues such as fuel poverty requires thatpolicies are developed from an empirical foundation built on highquality data. In particular, continuous collection of such data isessential for the evaluation of past programmes and the
development of future evidence-based policies. The developmentof HEED has in part been the exercise of reporting for governmentprogrammes (such as those detailed above) but has also drawntogether other sources related to energy efficiency retrofits, suchas heating system inspections and double glazing installers. As aresult, HEED contains many (if not most) of the energy efficiencymeasures carried out under government programmes or throughcertified installers and therefore presents an opportunity fromwhich to develop an energy efficiency evidence base for policydevelopment and evaluation.
1.4. Methodology
The two main sources of data used in the analysis were energysupplier annualised meter point gas and electricity data and theHomes Energy Efficiency Database (HEED). The gas and electricitymeter point data was provided by the Department of Energy andClimate Change (DECC) and covered the period of 2004 through2007. The gas and electricity meter point values were derived fromindividual meter readings, via data aggregators of the gas andelectricity suppliers. Access to HEED was also provided by DECCthrough the Energy Saving Trust (EST). The next section contains adetailed description of the two data sources and a description ofthe analysis methods.
2. Data
2.1. Gas and electricity meter data
The government collects annualised final consumption gas andelectricity data for individual meter points from energy suppliersfor the purpose of various statistical outputs; in 2007 there wereapproximately 22.6 million gas meters (22.3 million residentialand 0.3 million non-domestic) and 29.1 million electricity meters(26.7 million residential meters and 2.4 million non-domestic
I.G. Hamilton et al. / Energy Policy 60 (2013) 462–480 465
meters) (DECC, 2009b). UK gas and electricity meters are classifiedinto two types: daily (gas) or half-hourly (electricity) metered, andnon-daily (gas) or non-half hourly (electricity) metered. The non-half hourly and non-daily meter data was linked to HEED byGovernment for use in this project. Between 2004 and 2008, gasand electricity accounted for just over 90% of total fuel delivered toUK dwellings (DECC, 2012b).
Gas non-daily meters are divided into categories based on theirtotal expected annual load demand; gas meters contain no useridentification and ‘residential’ users are determined to be those whosedemand was less than 73.2 MWh/yr and those above are commercialor industrial (DECC, 2009b). Meter readings are converted into annualconsumption values by the suppliers using a common methodologywith two meter readings at least 6 months apart (when no meterreading is available an estimate based on past demand is used in itsplace) and is corrected to a seasonal normal demand and an end-userclimate sensitivity adjustment to derive a total annual demand(OFGEM, 2013). The purpose of the seasonal correction is to allowfor inter-year comparisons that are independent of weather. In termsof what the weather correction might mean for assessing the impactof energy efficiency interventions through the detection of changes inenergy demand between years, it may be that long-term trends aremore significant than year-on-year changes, but this will depend onthe frequency of meter readings for which no information is available.The gas data annual period is 1 October to 30 September and covers aheating season.
Electricity non-half hourly meters are defined into classesrepresenting likely demand profiles and contains a user typeidentifier. Residential electricity meters are classed into two typesbased on the meter, i.e. unrestricted electricity or Economy 7.Economy 7 refers to meters that are on a time charge tariff offeringcheaper electricity during off-peak hours, typically an 8 h period,and are either time or radio switched (DECC, 2009b); in dwellings,these meters are most often associated with electric heating, eitherspace heating (e.g. storage heaters) or hot water, offering thecustomer the advantage of electricity bought at off-peak rates andstored as heat for daytime use; in this work Economy 7 mwere keptas distinct. Unrestricted meters are all other types of meters; thesemeters may be used for heating but are not time or radio switched.Electricity meters are annualised using actual meter readings or, ifno readings are available estimates based on past use and historicusage patterns and are smoothed across an annual profile to derivea total annual demand in kWh (Elexon, 2010). The annualisedelectricity values are not corrected for weather. The electricity dataannual period is from 30 January to 29 January.
Both the gas and electricity data underwent a cleaning process toremove or identify potentially erroneous data points, such asnegatives and dummy values (e.g. ‘1’ values). In this paper, a datasetthat removed erroneous data points was used in all energy analysis.
2.2. Home Energy Efficiency Database
The Homes Energy Efficiency Database (HEED) currently con-tains information on the characteristics and energy efficiency onover 13 million homes from England, Wales, Scotland and North-ern Ireland5. In 2010, there were approximately 27.3 milliondwellings in the UK6 and HEED covers approximately 50% of theUK housing stock (Energy Saving Trust, 2010). HEED was drawntogether from approximately 60 datasets and collected fromapproximately 20 organisations. The bulk of HEED data was
5 The Homes Energy Efficiency Database (HEED) is collected and maintained bythe EST on behalf of DECC.
6 In 2010 it is estimated there are 22.7 million dwellings in England, 1.3 millionin Wales, 2.5 million in Scotland and 0.75 million in Northern Ireland (DSDNI, 2011;Scottish Government, 2011; Welsh Assembly Government, 2011).
classified using the Reduced Standard Assessment Procedure(rdSAP) format, which attempts to categorise dwellings intocommon bands relevant to modelling energy demand (BRE andDECC, 2009). Where other forms were used, additional variableswere added or were allocated to the best available class withinrdSAP. The Energy Saving Trust undertook this data cleaning priorto the data being made available for use in this study.
The extract of the database in February of 2009 used in thisstudy contained approximately 11.5 million distinct home identi-fiers. The data provided in HEED draws from survey data, and dataon specific measures installed under a variety of governmentbacked schemes and energy supplier obligations. Table 1 providesa summary list of these data sources and Fig. 2 shows a breakdownof the sources for the analysed extract of HEED. Note that thevariables collected under each source vary and many sources formeasures include survey data. HEED comprises information at theindividual dwelling level rather than by households or occupants.It contains no information on households or dwelling occupant,aside from household tenure, and thus socio-cultural and eco-nomic factors cannot be determined directly. The database pri-marily contains information on the physical features of thedwelling as they pertain to the energy efficiency of the structure(i.e. fabric) and the heating system; see Table 2 for a summary ofthe survey and measures data. Approximately 2.7 M homes appearin at least two programmes (i.e. source datasets) and 1 M in threeprogrammes, while the majority (7.2 M) are present in only oneprogramme, see Appendix A for more details on HEED.
2.3. HEED and energy demand
For this study, a dataset containing all matched HEED dwellingsand related annualised gas and electricity values for the period2004–2007 was used; Table 3 shows the number of recordscontained within the source data sets. Note the number of recordsin electricity and gas represent all meters in Great Britain, bothdomestic (i.e. residential) and non-domestic and that the numberof records for electricity meters includes those on a time-tariff (i.e.these meters have two records each for on and off-peak time). Thetwo time tariffs are subsequently summed together for a singleannual value. Also, the 2007 gas demand is for homes in HEEDonly and not the whole UK—this data was not made available foruse in this work. For those comparisons between HEED and non-HEED energy demand, 2006 data was used. Comparisons of energyuse and for installed efficiency measures were based on 2007 datain order to capture a longer time period and more interventions.
2.4. Analysis methods
The first step in the analysis sought to determine how repre-sentative of the British (i.e. England, Wales, Scotland) housingstock the meter-matched HEED sample was for a selection of keyvariables, i.e. age, type, tenure size and location. This was done bycomparing HEED with three other databases: the 2008 EnglishHousing Survey (EHS), the 2007–2009 Scottish House ConditionsSurvey (SHCS), and the 2010 Valuation Office Agency (VOA)Council Tax Property Attributes database for England and Wales.Together these data sources provide more or less complete cover-age of the housing stock of Great Britain. Chi-square tests forgoodness-of-fit at a 95% confidence interval were used to deter-mine statistical significance. For computational purposes, a 10%randomly selected sample of approximately 1.2 million dwellingrecords representative of HEED was used for the populationcomparison, rather than the full HEED database (i.e. 11.5 M), seeAppendix B for a χ2 test for the HEED sample and full HEEDdatabase.
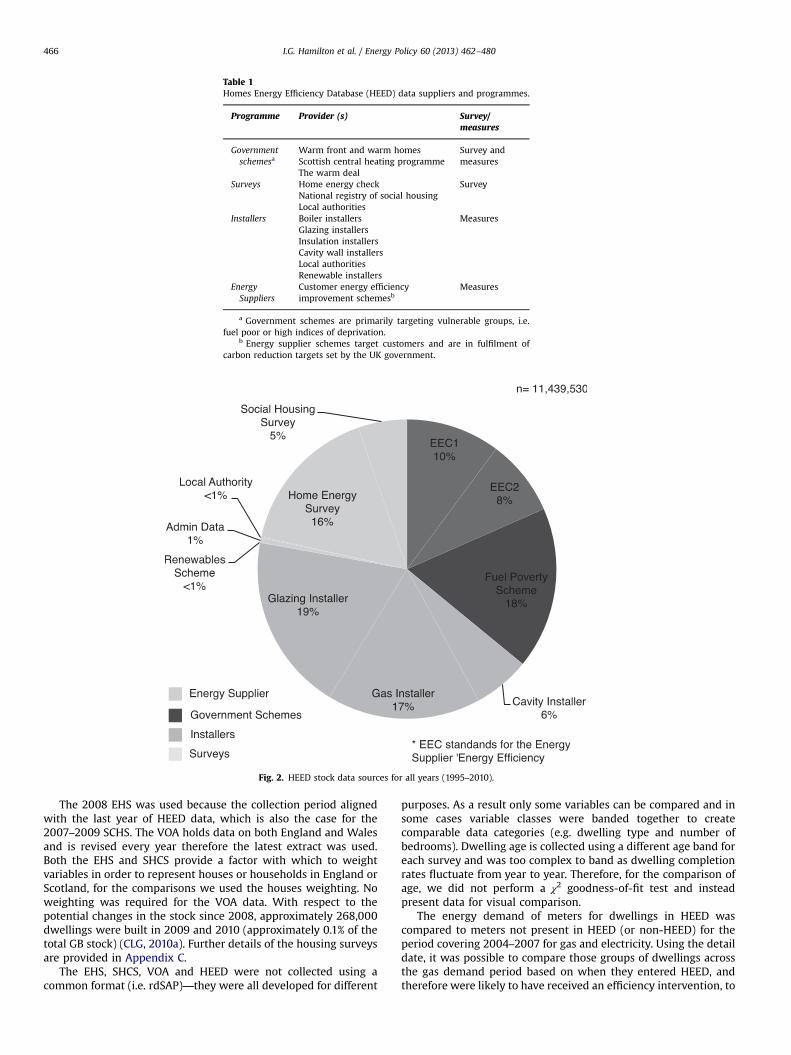
Table 1Homes Energy Efficiency Database (HEED) data suppliers and programmes.
Programme Provider (s) Survey/measures
Governmentschemesa
Warm front and warm homes Survey andmeasuresScottish central heating programme
The warm dealSurveys Home energy check Survey
National registry of social housingLocal authorities
Installers Boiler installers MeasuresGlazing installersInsulation installersCavity wall installersLocal authoritiesRenewable installers
EnergySuppliers
Customer energy efficiencyimprovement schemesb
Measures
a Government schemes are primarily targeting vulnerable groups, i.e.fuel poor or high indices of deprivation.
b Energy supplier schemes target customers and are in fulfilment ofcarbon reduction targets set by the UK government.
Fig. 2. HEED stock data sources for all years (1995–2010).
I.G. Hamilton et al. / Energy Policy 60 (2013) 462–480466
The 2008 EHS was used because the collection period alignedwith the last year of HEED data, which is also the case for the2007–2009 SCHS. The VOA holds data on both England and Walesand is revised every year therefore the latest extract was used.Both the EHS and SHCS provide a factor with which to weightvariables in order to represent houses or households in England orScotland, for the comparisons we used the houses weighting. Noweighting was required for the VOA data. With respect to thepotential changes in the stock since 2008, approximately 268,000dwellings were built in 2009 and 2010 (approximately 0.1% of thetotal GB stock) (CLG, 2010a). Further details of the housing surveysare provided in Appendix C.
The EHS, SHCS, VOA and HEED were not collected using acommon format (i.e. rdSAP)—they were all developed for different
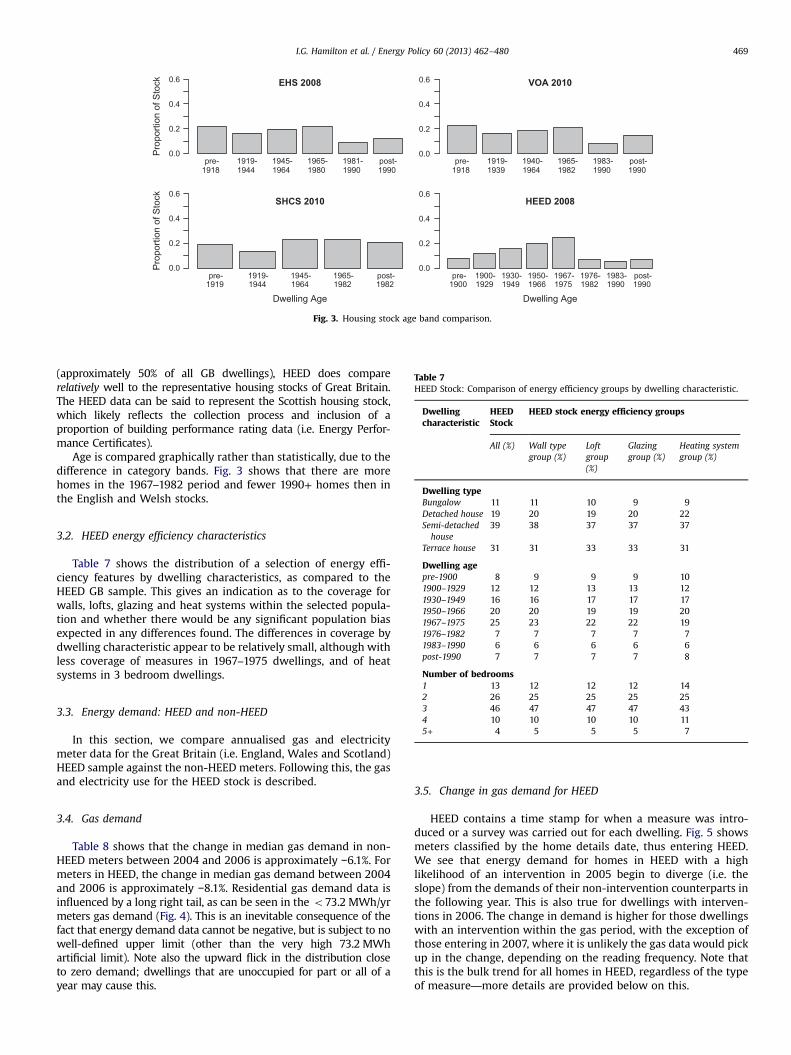
purposes. As a result only some variables can be compared and insome cases variable classes were banded together to createcomparable data categories (e.g. dwelling type and number ofbedrooms). Dwelling age is collected using a different age band foreach survey and was too complex to band as dwelling completionrates fluctuate from year to year. Therefore, for the comparison ofage, we did not perform a χ2 goodness-of-fit test and insteadpresent data for visual comparison.
The energy demand of meters for dwellings in HEED wascompared to meters not present in HEED (or non-HEED) for theperiod covering 2004–2007 for gas and electricity. Using the detaildate, it was possible to compare those groups of dwellings acrossthe gas demand period based on when they entered HEED, andtherefore were likely to have received an efficiency intervention, to
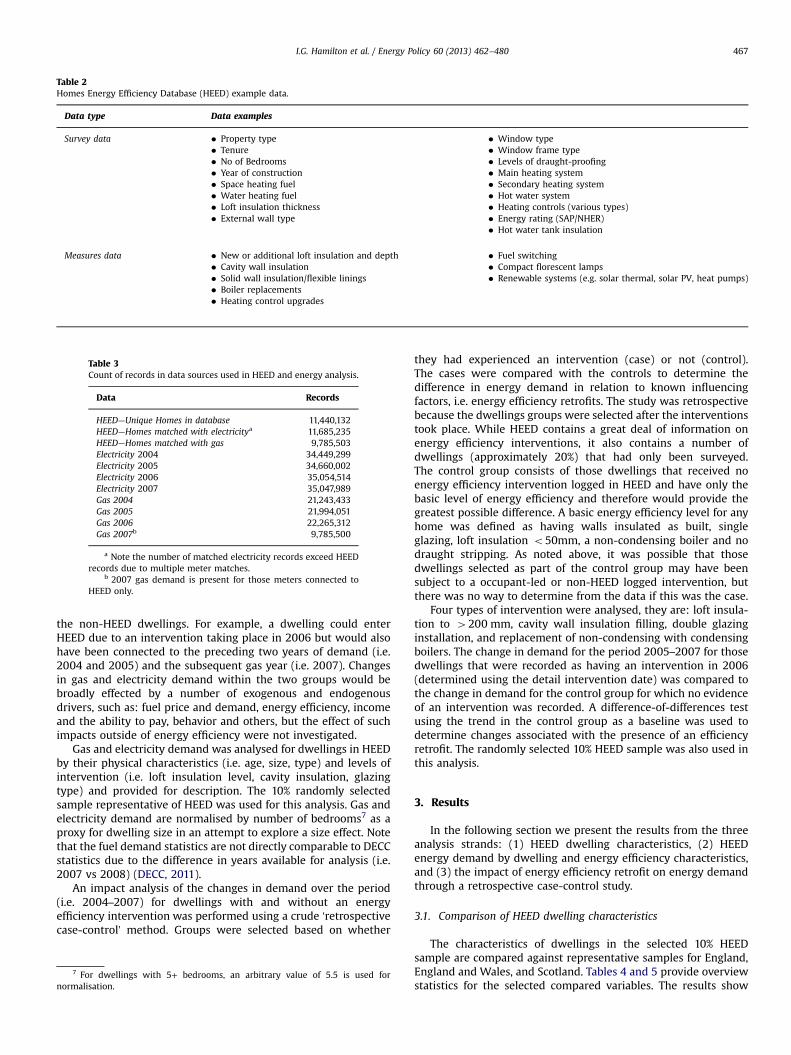
Table 2Homes Energy Efficiency Database (HEED) example data.
Data type Data examples
Survey data � Property type� Tenure� No of Bedrooms� Year of construction� Space heating fuel� Water heating fuel� Loft insulation thickness� External wall type
� Window type� Window frame type� Levels of draught-proofing� Main heating system� Secondary heating system� Hot water system� Heating controls (various types)� Energy rating (SAP/NHER)� Hot water tank insulation
Measures data � New or additional loft insulation and depth� Cavity wall insulation� Solid wall insulation/flexible linings� Boiler replacements� Heating control upgrades
� Fuel switching� Compact florescent lamps� Renewable systems (e.g. solar thermal, solar PV, heat pumps)
Table 3Count of records in data sources used in HEED and energy analysis.
Data Records
HEED—Unique Homes in database 11,440,132HEED—Homes matched with electricitya 11,685,235HEED—Homes matched with gas 9,785,503Electricity 2004 34,449,299Electricity 2005 34,660,002Electricity 2006 35,054,514Electricity 2007 35,047,989Gas 2004 21,243,433Gas 2005 21,994,051Gas 2006 22,265,312Gas 2007b 9,785,500
a Note the number of matched electricity records exceed HEEDrecords due to multiple meter matches.
b 2007 gas demand is present for those meters connected toHEED only.
I.G. Hamilton et al. / Energy Policy 60 (2013) 462–480 467
the non-HEED dwellings. For example, a dwelling could enterHEED due to an intervention taking place in 2006 but would alsohave been connected to the preceding two years of demand (i.e.2004 and 2005) and the subsequent gas year (i.e. 2007). Changesin gas and electricity demand within the two groups would bebroadly effected by a number of exogenous and endogenousdrivers, such as: fuel price and demand, energy efficiency, incomeand the ability to pay, behavior and others, but the effect of suchimpacts outside of energy efficiency were not investigated.
Gas and electricity demand was analysed for dwellings in HEEDby their physical characteristics (i.e. age, size, type) and levels ofintervention (i.e. loft insulation level, cavity insulation, glazingtype) and provided for description. The 10% randomly selectedsample representative of HEED was used for this analysis. Gas andelectricity demand are normalised by number of bedrooms7 as aproxy for dwelling size in an attempt to explore a size effect. Notethat the fuel demand statistics are not directly comparable to DECCstatistics due to the difference in years available for analysis (i.e.2007 vs 2008) (DECC, 2011).
An impact analysis of the changes in demand over the period(i.e. 2004–2007) for dwellings with and without an energyefficiency intervention was performed using a crude ‘retrospectivecase-control’ method. Groups were selected based on whether
7 For dwellings with 5+ bedrooms, an arbitrary value of 5.5 is used fornormalisation.
they had experienced an intervention (case) or not (control).The cases were compared with the controls to determine thedifference in energy demand in relation to known influencingfactors, i.e. energy efficiency retrofits. The study was retrospectivebecause the dwellings groups were selected after the interventionstook place. While HEED contains a great deal of information onenergy efficiency interventions, it also contains a number ofdwellings (approximately 20%) that had only been surveyed.The control group consists of those dwellings that received noenergy efficiency intervention logged in HEED and have only thebasic level of energy efficiency and therefore would provide thegreatest possible difference. A basic energy efficiency level for anyhome was defined as having walls insulated as built, singleglazing, loft insulation o50mm, a non-condensing boiler and nodraught stripping. As noted above, it was possible that thosedwellings selected as part of the control group may have beensubject to a occupant-led or non-HEED logged intervention, butthere was no way to determine from the data if this was the case.
Four types of intervention were analysed, they are: loft insula-tion to 4200 mm, cavity wall insulation filling, double glazinginstallation, and replacement of non-condensing with condensingboilers. The change in demand for the period 2005–2007 for thosedwellings that were recorded as having an intervention in 2006(determined using the detail intervention date) was compared tothe change in demand for the control group for which no evidenceof an intervention was recorded. A difference-of-differences testusing the trend in the control group as a baseline was used todetermine changes associated with the presence of an efficiencyretrofit. The randomly selected 10% HEED sample was also used inthis analysis.
3. Results
In the following section we present the results from the threeanalysis strands: (1) HEED dwelling characteristics, (2) HEEDenergy demand by dwelling and energy efficiency characteristics,and (3) the impact of energy efficiency retrofit on energy demandthrough a retrospective case-control study.
3.1. Comparison of HEED dwelling characteristics
The characteristics of dwellings in the selected 10% HEEDsample are compared against representative samples for England,England and Wales, and Scotland. Tables 4 and 5 provide overviewstatistics for the selected compared variables. The results show
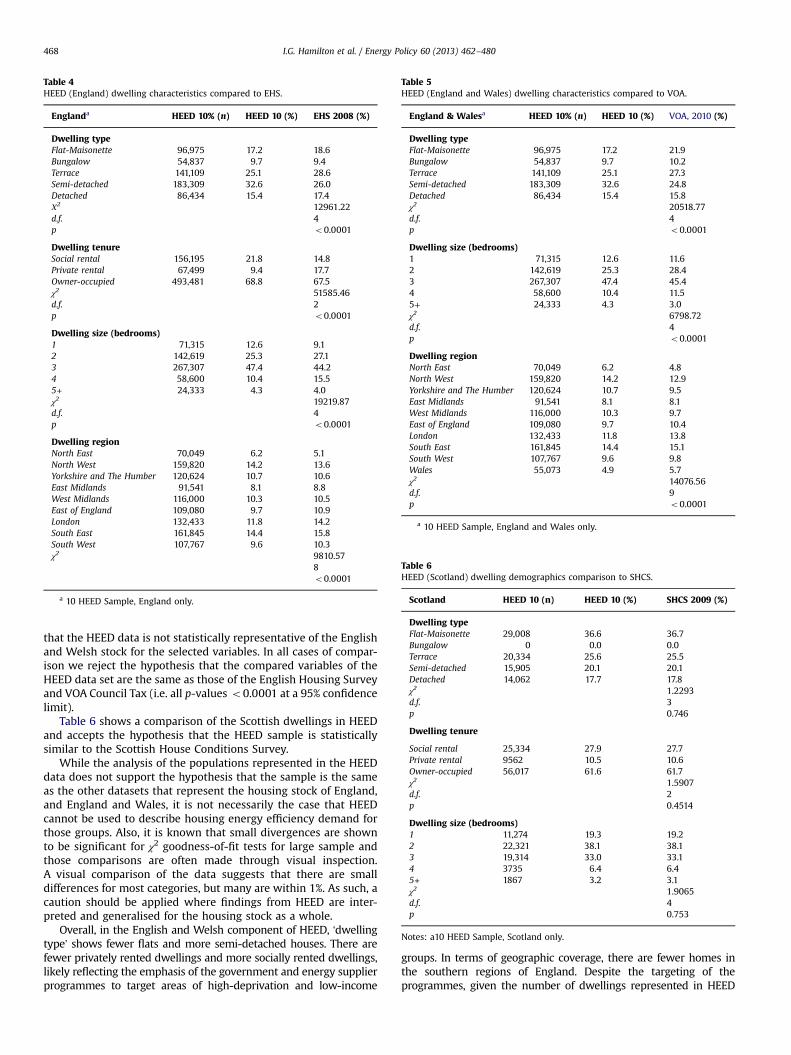
Table 4HEED (England) dwelling characteristics compared to EHS.
Englanda HEED 10% (n) HEED 10 (%) EHS 2008 (%)
Dwelling typeFlat-Maisonette 96,975 17.2 18.6Bungalow 54,837 9.7 9.4Terrace 141,109 25.1 28.6Semi-detached 183,309 32.6 26.0Detached 86,434 15.4 17.4Χ2 12961.22d.f. 4p o0.0001
Dwelling tenureSocial rental 156,195 21.8 14.8Private rental 67,499 9.4 17.7Owner-occupied 493,481 68.8 67.5χ2 51585.46d.f. 2p o0.0001
Dwelling size (bedrooms)1 71,315 12.6 9.12 142,619 25.3 27.13 267,307 47.4 44.24 58,600 10.4 15.55+ 24,333 4.3 4.0χ2 19219.87d.f. 4p o0.0001
Dwelling regionNorth East 70,049 6.2 5.1North West 159,820 14.2 13.6Yorkshire and The Humber 120,624 10.7 10.6East Midlands 91,541 8.1 8.8West Midlands 116,000 10.3 10.5East of England 109,080 9.7 10.9London 132,433 11.8 14.2South East 161,845 14.4 15.8South West 107,767 9.6 10.3χ2 9810.57
8o0.0001
a 10 HEED Sample, England only.
Table 5HEED (England and Wales) dwelling characteristics compared to VOA.
England & Walesa HEED 10% (n) HEED 10 (%) VOA, 2010 (%)
Dwelling typeFlat-Maisonette 96,975 17.2 21.9Bungalow 54,837 9.7 10.2Terrace 141,109 25.1 27.3Semi-detached 183,309 32.6 24.8Detached 86,434 15.4 15.8χ2 20518.77d.f. 4p o0.0001
Dwelling size (bedrooms)1 71,315 12.6 11.62 142,619 25.3 28.43 267,307 47.4 45.44 58,600 10.4 11.55+ 24,333 4.3 3.0χ2 6798.72d.f. 4p o0.0001
Dwelling regionNorth East 70,049 6.2 4.8North West 159,820 14.2 12.9Yorkshire and The Humber 120,624 10.7 9.5East Midlands 91,541 8.1 8.1West Midlands 116,000 10.3 9.7East of England 109,080 9.7 10.4London 132,433 11.8 13.8South East 161,845 14.4 15.1South West 107,767 9.6 9.8Wales 55,073 4.9 5.7χ2 14076.56d.f. 9p o0.0001
a 10 HEED Sample, England and Wales only.
Table 6HEED (Scotland) dwelling demographics comparison to SHCS.
Scotland HEED 10 (n) HEED 10 (%) SHCS 2009 (%)
Dwelling typeFlat-Maisonette 29,008 36.6 36.7Bungalow 0 0.0 0.0Terrace 20,334 25.6 25.5Semi-detached 15,905 20.1 20.1Detached 14,062 17.7 17.8χ2 1.2293d.f. 3p 0.746
Dwelling tenure
Social rental 25,334 27.9 27.7Private rental 9562 10.5 10.6Owner-occupied 56,017 61.6 61.7χ2 1.5907d.f. 2p 0.4514
Dwelling size (bedrooms)1 11,274 19.3 19.22 22,321 38.1 38.13 19,314 33.0 33.14 3735 6.4 6.45+ 1867 3.2 3.1χ2 1.9065d.f. 4p 0.753
Notes: a10 HEED Sample, Scotland only.
I.G. Hamilton et al. / Energy Policy 60 (2013) 462–480468
that the HEED data is not statistically representative of the Englishand Welsh stock for the selected variables. In all cases of compar-ison we reject the hypothesis that the compared variables of theHEED data set are the same as those of the English Housing Surveyand VOA Council Tax (i.e. all p-values o0.0001 at a 95% confidencelimit).
Table 6 shows a comparison of the Scottish dwellings in HEEDand accepts the hypothesis that the HEED sample is statisticallysimilar to the Scottish House Conditions Survey.
While the analysis of the populations represented in the HEEDdata does not support the hypothesis that the sample is the sameas the other datasets that represent the housing stock of England,and England and Wales, it is not necessarily the case that HEEDcannot be used to describe housing energy efficiency demand forthose groups. Also, it is known that small divergences are shownto be significant for χ2 goodness-of-fit tests for large sample andthose comparisons are often made through visual inspection.A visual comparison of the data suggests that there are smalldifferences for most categories, but many are within 1%. As such, acaution should be applied where findings from HEED are inter-preted and generalised for the housing stock as a whole.
Overall, in the English and Welsh component of HEED, ‘dwellingtype’ shows fewer flats and more semi-detached houses. There arefewer privately rented dwellings and more socially rented dwellings,likely reflecting the emphasis of the government and energy supplierprogrammes to target areas of high-deprivation and low-income
groups. In terms of geographic coverage, there are fewer homes inthe southern regions of England. Despite the targeting of theprogrammes, given the number of dwellings represented in HEED
pre-1918
1919-1944
1945-1964
1965-1980
1981-1990
post-1990
EHS 2008
Pro
porti
on o
f Sto
ckpre-
19181919-1939
1940-1964
1965-1982
1983-1990
post-1990
VOA 2010
pre-1919
1919-1944
1945-1964
1965-1982
post-1982
SHCS 2010
Dwelling Age
pre-1900
1900-1929
1930-1949
1950-1966
1967-1975
1976-1982
1983-1990
post-1990
HEED 2008
Dwelling Age
0.0
0.2
0.4
0.6
Pro
porti
on o
f Sto
ck
0.0
0.2
0.4
0.6
0.0
0.2
0.4
0.6
0.0
0.2
0.4
0.6
Fig. 3. Housing stock age band comparison.
Table 7HEED Stock: Comparison of energy efficiency groups by dwelling characteristic.
Dwellingcharacteristic
HEEDStock
HEED stock energy efficiency groups
All (%) Wall typegroup (%)
Loftgroup(%)
Glazinggroup (%)
Heating systemgroup (%)
Dwelling typeBungalow 11 11 10 9 9
I.G. Hamilton et al. / Energy Policy 60 (2013) 462–480 469
(approximately 50% of all GB dwellings), HEED does comparerelatively well to the representative housing stocks of Great Britain.The HEED data can be said to represent the Scottish housing stock,which likely reflects the collection process and inclusion of aproportion of building performance rating data (i.e. Energy Perfor-mance Certificates).
Age is compared graphically rather than statistically, due to thedifference in category bands. Fig. 3 shows that there are morehomes in the 1967–1982 period and fewer 1990+ homes then inthe English and Welsh stocks.
Detached house 19 20 19 20 22Semi-detachedhouse
39 38 37 37 37
Terrace house 31 31 33 33 31
Dwelling agepre-1900 8 9 9 9 101900–1929 12 12 13 13 121930–1949 16 16 17 17 171950–1966 20 20 19 19 201967–1975 25 23 22 22 191976–1982 7 7 7 7 71983–1990 6 6 6 6 6post-1990 7 7 7 7 8
Number of bedrooms
3.2. HEED energy efficiency characteristics
Table 7 shows the distribution of a selection of energy effi-ciency features by dwelling characteristics, as compared to theHEED GB sample. This gives an indication as to the coverage forwalls, lofts, glazing and heat systems within the selected popula-tion and whether there would be any significant population biasexpected in any differences found. The differences in coverage bydwelling characteristic appear to be relatively small, although withless coverage of measures in 1967–1975 dwellings, and of heatsystems in 3 bedroom dwellings.
1 13 12 12 12 142 26 25 25 25 253 46 47 47 47 434 10 10 10 10 115+ 4 5 5 5 7
3.3. Energy demand: HEED and non-HEED
In this section, we compare annualised gas and electricitymeter data for the Great Britain (i.e. England, Wales and Scotland)HEED sample against the non-HEED meters. Following this, the gasand electricity use for the HEED stock is described.
3.4. Gas demand
Table 8 shows that the change in median gas demand in non-HEED meters between 2004 and 2006 is approximately −6.1%. Formeters in HEED, the change in median gas demand between 2004and 2006 is approximately −8.1%. Residential gas demand data isinfluenced by a long right tail, as can be seen in the o73.2 MWh/yrmeters gas demand (Fig. 4). This is an inevitable consequence of thefact that energy demand data cannot be negative, but is subject to nowell-defined upper limit (other than the very high 73.2 MWhartificial limit). Note also the upward flick in the distribution closeto zero demand; dwellings that are unoccupied for part or all of ayear may cause this.
3.5. Change in gas demand for HEED
HEED contains a time stamp for when a measure was intro-duced or a survey was carried out for each dwelling. Fig. 5 showsmeters classified by the home details date, thus entering HEED.We see that energy demand for homes in HEED with a highlikelihood of an intervention in 2005 begin to diverge (i.e. theslope) from the demands of their non-intervention counterparts inthe following year. This is also true for dwellings with interven-tions in 2006. The change in demand is higher for those dwellingswith an intervention within the gas period, with the exception ofthose entering in 2007, where it is unlikely the gas data would pickup in the change, depending on the reading frequency. Note thatthis is the bulk trend for all homes in HEED, regardless of the typeof measure—more details are provided below on this.
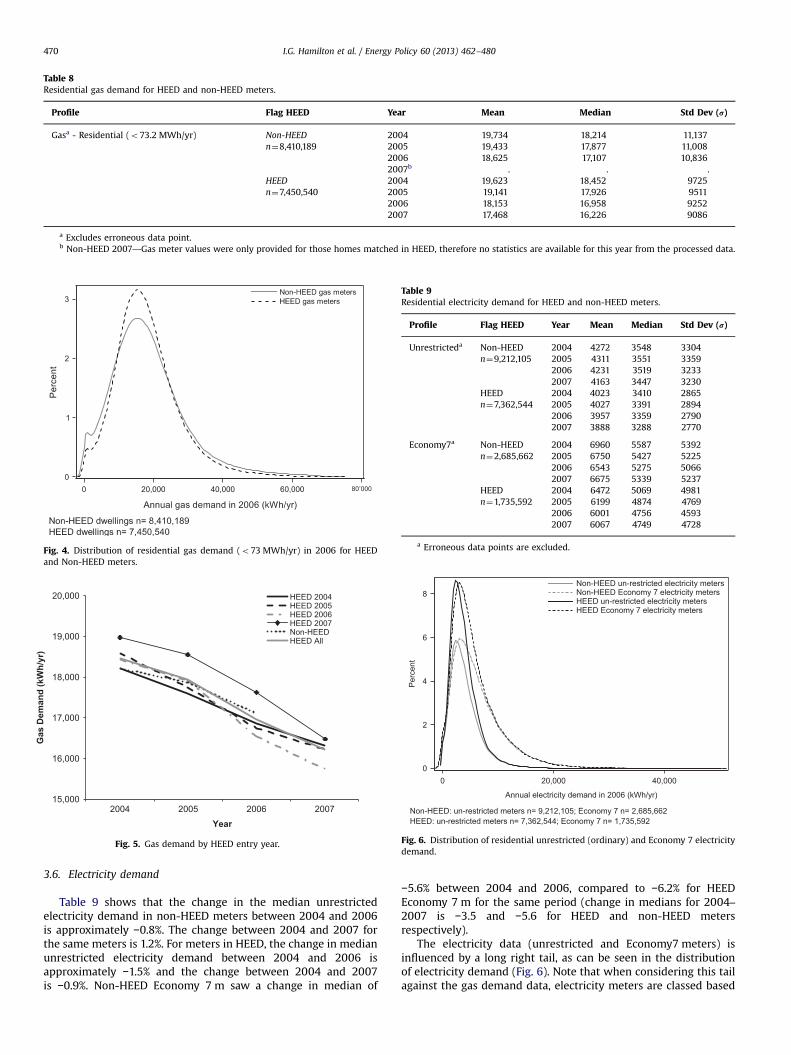
Table 8Residential gas demand for HEED and non-HEED meters.
Profile Flag HEED Year Mean Median Std Dev (r)
Gasa - Residential (o73.2 MWh/yr) Non-HEED 2004 19,734 18,214 11,137n¼8,410,189 2005 19,433 17,877 11,008
2006 18,625 17,107 10,8362007b . . .
HEED 2004 19,623 18,452 9725n¼7,450,540 2005 19,141 17,926 9511
2006 18,153 16,958 92522007 17,468 16,226 9086
a Excludes erroneous data point.b Non-HEED 2007—Gas meter values were only provided for those homes matched in HEED, therefore no statistics are available for this year from the processed data.
Fig. 4. Distribution of residential gas demand (o73 MWh/yr) in 2006 for HEEDand Non-HEED meters.
15,000
16,000
17,000
18,000
19,000
20,000
2004 2005 2006 2007
Gas
Dem
and
(kW
h/yr
)
Year
HEED 2004HEED 2005HEED 2006HEED 2007Non-HEEDHEED All
Fig. 5. Gas demand by HEED entry year.
Table 9Residential electricity demand for HEED and non-HEED meters.
Profile Flag HEED Year Mean Median Std Dev (r)
Unrestricteda Non-HEED 2004 4272 3548 3304n¼9,212,105 2005 4311 3551 3359
2006 4231 3519 32332007 4163 3447 3230
HEED 2004 4023 3410 2865n¼7,362,544 2005 4027 3391 2894
2006 3957 3359 27902007 3888 3288 2770
Economy7a Non-HEED 2004 6960 5587 5392n¼2,685,662 2005 6750 5427 5225
2006 6543 5275 50662007 6675 5339 5237
HEED 2004 6472 5069 4981n¼1,735,592 2005 6199 4874 4769
2006 6001 4756 45932007 6067 4749 4728
a Erroneous data points are excluded.
0 20,000 40,000
Annual electricity demand in 2006 (kWh/yr)
0
2
4
6
8
Per
cent
HEED Economy 7 electricity metersHEED un-restricted electricity metersNon-HEED Economy 7 electricity metersNon-HEED un-restricted electricity meters
Non-HEED: un-restricted meters n= 9,212,105; Economy 7 n= 2,685,662HEED: un-restricted meters n= 7,362,544; Economy 7 n= 1,735,592
Fig. 6. Distribution of residential unrestricted (ordinary) and Economy 7 electricitydemand.
I.G. Hamilton et al. / Energy Policy 60 (2013) 462–480470
3.6. Electricity demand
Table 9 shows that the change in the median unrestrictedelectricity demand in non-HEED meters between 2004 and 2006is approximately −0.8%. The change between 2004 and 2007 forthe same meters is 1.2%. For meters in HEED, the change in medianunrestricted electricity demand between 2004 and 2006 isapproximately −1.5% and the change between 2004 and 2007is −0.9%. Non-HEED Economy 7 m saw a change in median of
−5.6% between 2004 and 2006, compared to −6.2% for HEEDEconomy 7 m for the same period (change in medians for 2004–2007 is −3.5 and −5.6 for HEED and non-HEED metersrespectively).
The electricity data (unrestricted and Economy7 meters) isinfluenced by a long right tail, as can be seen in the distributionof electricity demand (Fig. 6). Note that when considering this tailagainst the gas demand data, electricity meters are classed based
3,000
3,250
3,500
3,750
4,000
2004 2005 2006 2007
Elec
tric
ity (u
nres
tric
ted)
Dem
and
(kW
h/yr
)
Year
HEED 2004HEED 2005HEED 2006HEED 2007Non-HEEDHEED All
Fig. 7. Unrestricted electricity demand by HEED entry year.
3,000
3,500
4,000
4,500
5,000
5,500
6,000
2004 2005 2006 2007
Elec
tric
ity (E
con7
) Dem
and
(kW
h/yr
)
Year
HEED 2004HEED 2005HEED 2006HEED 2007Non-HEEDHEED All
Fig. 8. Economy 7 electricity demand by HEED entry year.
8 In order to control the effect that large energy using meters may have on theresults, Tukey's method of determining outliers is used. This method treats anyvalue as an outlier that is greater than the 75th percentile plus 1.5 times the inter-quartile distance, or less than the 25th percentile minus 1.5 times the inter-quartiledistance. No data with missing classes is used in these figures.
9 The distinction between pre- and post-2002 double glazing refers to arequirement introduced in the British Building Regulations of 2002 requiring allwindows (and replacement windows) to conform to lower U-values.
I.G. Hamilton et al. / Energy Policy 60 (2013) 462–480 471
on a user type and tariff, whereas the gas data is classifiedaccording to consumption. While the long right tail in gas mayhold a number of non-domestic users, electricity demand isreflecting large users.
3.7. Change in electricity demand for HEED meters
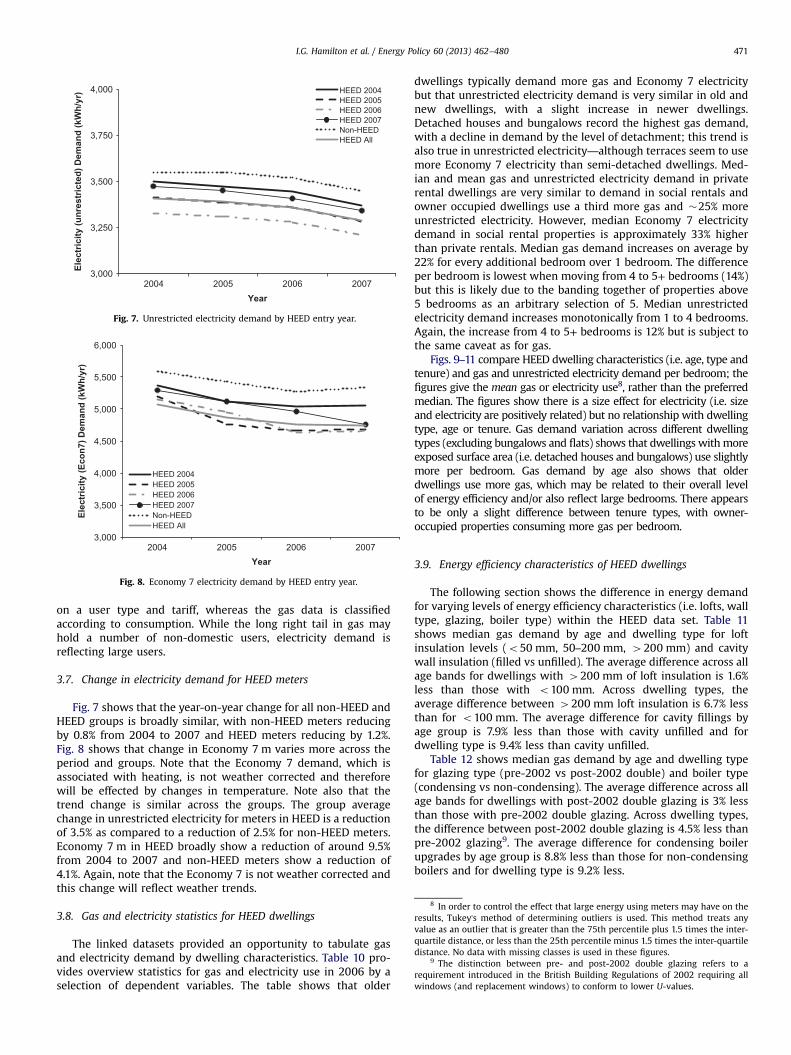
Fig. 7 shows that the year-on-year change for all non-HEED andHEED groups is broadly similar, with non-HEED meters reducingby 0.8% from 2004 to 2007 and HEED meters reducing by 1.2%.Fig. 8 shows that change in Economy 7 m varies more across theperiod and groups. Note that the Economy 7 demand, which isassociated with heating, is not weather corrected and thereforewill be effected by changes in temperature. Note also that thetrend change is similar across the groups. The group averagechange in unrestricted electricity for meters in HEED is a reductionof 3.5% as compared to a reduction of 2.5% for non-HEED meters.Economy 7 m in HEED broadly show a reduction of around 9.5%from 2004 to 2007 and non-HEED meters show a reduction of4.1%. Again, note that the Economy 7 is not weather corrected andthis change will reflect weather trends.
3.8. Gas and electricity statistics for HEED dwellings
The linked datasets provided an opportunity to tabulate gasand electricity demand by dwelling characteristics. Table 10 pro-vides overview statistics for gas and electricity use in 2006 by aselection of dependent variables. The table shows that older
dwellings typically demand more gas and Economy 7 electricitybut that unrestricted electricity demand is very similar in old andnew dwellings, with a slight increase in newer dwellings.Detached houses and bungalows record the highest gas demand,with a decline in demand by the level of detachment; this trend isalso true in unrestricted electricity—although terraces seem to usemore Economy 7 electricity than semi-detached dwellings. Med-ian and mean gas and unrestricted electricity demand in privaterental dwellings are very similar to demand in social rentals andowner occupied dwellings use a third more gas and �25% moreunrestricted electricity. However, median Economy 7 electricitydemand in social rental properties is approximately 33% higherthan private rentals. Median gas demand increases on average by22% for every additional bedroom over 1 bedroom. The differenceper bedroom is lowest when moving from 4 to 5+ bedrooms (14%)but this is likely due to the banding together of properties above5 bedrooms as an arbitrary selection of 5. Median unrestrictedelectricity demand increases monotonically from 1 to 4 bedrooms.Again, the increase from 4 to 5+ bedrooms is 12% but is subject tothe same caveat as for gas.
Figs. 9–11 compare HEED dwelling characteristics (i.e. age, type andtenure) and gas and unrestricted electricity demand per bedroom; thefigures give the mean gas or electricity use8, rather than the preferredmedian. The figures show there is a size effect for electricity (i.e. sizeand electricity are positively related) but no relationship with dwellingtype, age or tenure. Gas demand variation across different dwellingtypes (excluding bungalows and flats) shows that dwellings withmoreexposed surface area (i.e. detached houses and bungalows) use slightlymore per bedroom. Gas demand by age also shows that olderdwellings use more gas, which may be related to their overall levelof energy efficiency and/or also reflect large bedrooms. There appearsto be only a slight difference between tenure types, with owner-occupied properties consuming more gas per bedroom.
3.9. Energy efficiency characteristics of HEED dwellings
The following section shows the difference in energy demandfor varying levels of energy efficiency characteristics (i.e. lofts, walltype, glazing, boiler type) within the HEED data set. Table 11shows median gas demand by age and dwelling type for loftinsulation levels (o50 mm, 50–200 mm, 4200 mm) and cavitywall insulation (filled vs unfilled). The average difference across allage bands for dwellings with 4200 mm of loft insulation is 1.6%less than those with o100 mm. Across dwelling types, theaverage difference between 4200 mm loft insulation is 6.7% lessthan for o100 mm. The average difference for cavity fillings byage group is 7.9% less than those with cavity unfilled and fordwelling type is 9.4% less than cavity unfilled.
Table 12 shows median gas demand by age and dwelling typefor glazing type (pre-2002 vs post-2002 double) and boiler type(condensing vs non-condensing). The average difference across allage bands for dwellings with post-2002 double glazing is 3% lessthan those with pre-2002 double glazing. Across dwelling types,the difference between post-2002 double glazing is 4.5% less thanpre-2002 glazing9. The average difference for condensing boilerupgrades by age group is 8.8% less than those for non-condensingboilers and for dwelling type is 9.2% less.
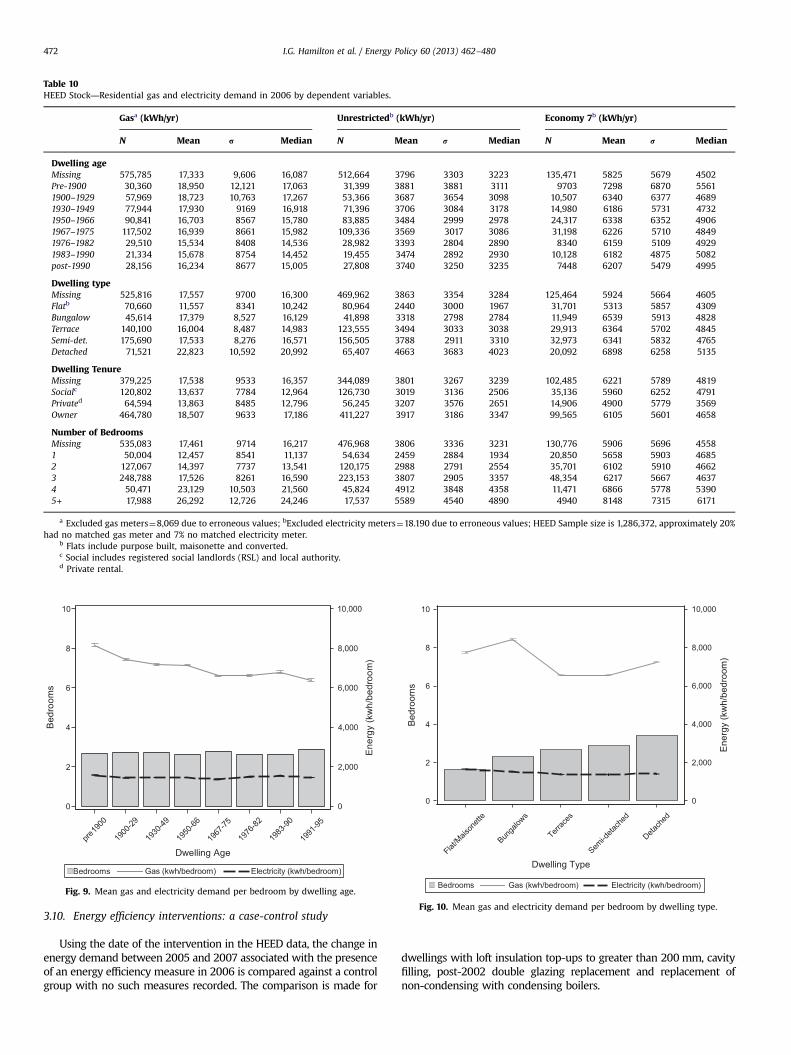
Table 10HEED Stock—Residential gas and electricity demand in 2006 by dependent variables.
Gasa (kWh/yr) Unrestrictedb (kWh/yr) Economy 7b (kWh/yr)
N Mean r Median N Mean r Median N Mean r Median
Dwelling ageMissing 575,785 17,333 9,606 16,087 512,664 3796 3303 3223 135,471 5825 5679 4502Pre-1900 30,360 18,950 12,121 17,063 31,399 3881 3881 3111 9703 7298 6870 55611900–1929 57,969 18,723 10,763 17,267 53,366 3687 3654 3098 10,507 6340 6377 46891930–1949 77,944 17,930 9169 16,918 71,396 3706 3084 3178 14,980 6186 5731 47321950–1966 90,841 16,703 8567 15,780 83,885 3484 2999 2978 24,317 6338 6352 49061967–1975 117,502 16,939 8661 15,982 109,336 3569 3017 3086 31,198 6226 5710 48491976–1982 29,510 15,534 8408 14,536 28,982 3393 2804 2890 8340 6159 5109 49291983–1990 21,334 15,678 8754 14,452 19,455 3474 2892 2930 10,128 6182 4875 5082post-1990 28,156 16,234 8677 15,005 27,808 3740 3250 3235 7448 6207 5479 4995
Dwelling typeMissing 525,816 17,557 9700 16,300 469,962 3863 3354 3284 125,464 5924 5664 4605Flatb 70,660 11,557 8341 10,242 80,964 2440 3000 1967 31,701 5313 5857 4309Bungalow 45,614 17,379 8,527 16,129 41,898 3318 2798 2784 11,949 6539 5913 4828Terrace 140,100 16,004 8,487 14,983 123,555 3494 3033 3038 29,913 6364 5702 4845Semi-det. 175,690 17,533 8,276 16,571 156,505 3788 2911 3310 32,973 6341 5832 4765Detached 71,521 22,823 10,592 20,992 65,407 4663 3683 4023 20,092 6898 6258 5135
Dwelling TenureMissing 379,225 17,538 9533 16,357 344,089 3801 3267 3239 102,485 6221 5789 4819Socialc 120,802 13,637 7784 12,964 126,730 3019 3136 2506 35,136 5960 6252 4791Privated 64,594 13,863 8485 12,796 56,245 3207 3576 2651 14,906 4900 5779 3569Owner 464,780 18,507 9633 17,186 411,227 3917 3186 3347 99,565 6105 5601 4658
Number of BedroomsMissing 535,083 17,461 9714 16,217 476,968 3806 3336 3231 130,776 5906 5696 45581 50,004 12,457 8541 11,137 54,634 2459 2884 1934 20,850 5658 5903 46852 127,067 14,397 7737 13,541 120,175 2988 2791 2554 35,701 6102 5910 46623 248,788 17,526 8261 16,590 223,153 3807 2905 3357 48,354 6217 5667 46374 50,471 23,129 10,503 21,560 45,824 4912 3848 4358 11,471 6866 5778 53905+ 17,988 26,292 12,726 24,246 17,537 5589 4540 4890 4940 8148 7315 6171
a Excluded gas meters¼8,069 due to erroneous values; bExcluded electricity meters¼18.190 due to erroneous values; HEED Sample size is 1,286,372, approximately 20%had no matched gas meter and 7% no matched electricity meter.
b Flats include purpose built, maisonette and converted.c Social includes registered social landlords (RSL) and local authority.d Private rental.
Fig. 9. Mean gas and electricity demand per bedroom by dwelling age.
Flat/M
aison
ette
Bunga
lows
Terrac
es
Semi-d
etach
ed
Detach
ed
Dwelling Type
0
2
4
6
8
10
Bed
room
s
0
2,000
4,000
6,000
8,000
10,000
Ene
rgy
(kw
h/be
droo
m)
Electricity (kwh/bedroom)Gas (kwh/bedroom)Bedrooms
Fig. 10. Mean gas and electricity demand per bedroom by dwelling type.
I.G. Hamilton et al. / Energy Policy 60 (2013) 462–480472
3.10. Energy efficiency interventions: a case-control study
Using the date of the intervention in the HEED data, the change inenergy demand between 2005 and 2007 associated with the presenceof an energy efficiency measure in 2006 is compared against a controlgroup with no such measures recorded. The comparison is made for
dwellings with loft insulation top-ups to greater than 200 mm, cavityfilling, post-2002 double glazing replacement and replacement ofnon-condensing with condensing boilers.
I.G. Hamilton et al. / Energy Policy 60 (2013) 462–480 473
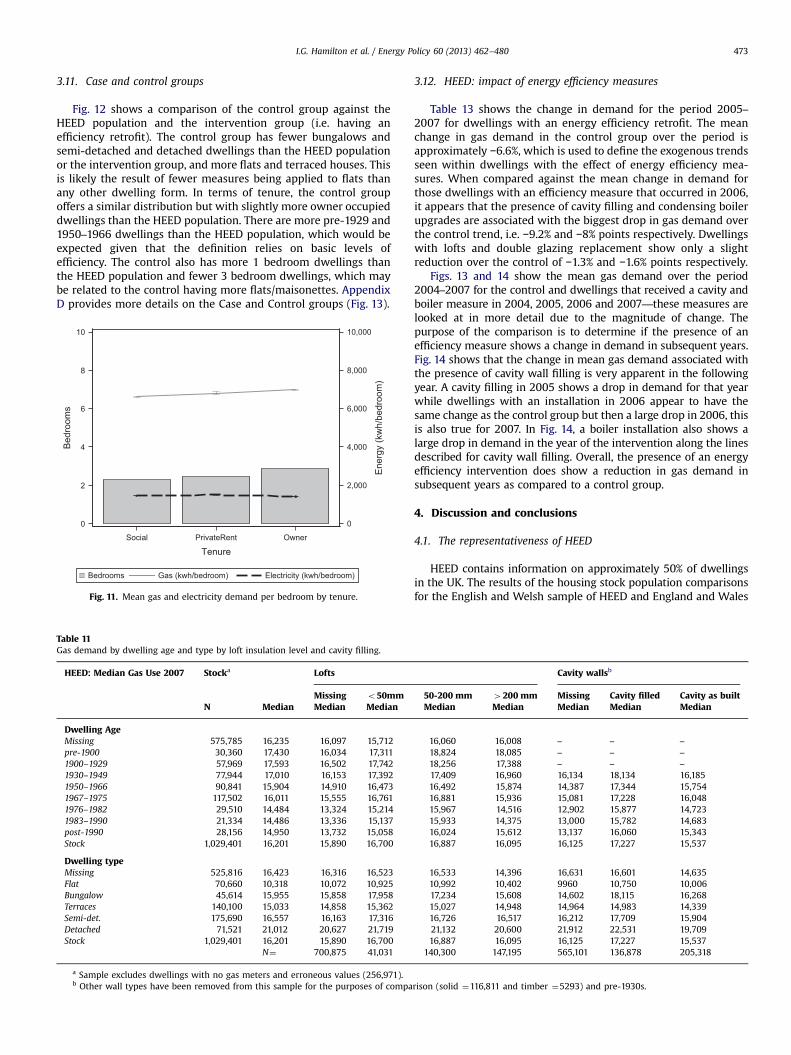
3.11. Case and control groups
Fig. 12 shows a comparison of the control group against theHEED population and the intervention group (i.e. having anefficiency retrofit). The control group has fewer bungalows andsemi-detached and detached dwellings than the HEED populationor the intervention group, and more flats and terraced houses. Thisis likely the result of fewer measures being applied to flats thanany other dwelling form. In terms of tenure, the control groupoffers a similar distribution but with slightly more owner occupieddwellings than the HEED population. There are more pre-1929 and1950–1966 dwellings than the HEED population, which would beexpected given that the definition relies on basic levels ofefficiency. The control also has more 1 bedroom dwellings thanthe HEED population and fewer 3 bedroom dwellings, which maybe related to the control having more flats/maisonettes. AppendixD provides more details on the Case and Control groups (Fig. 13).
Social PrivateRent Owner
Tenure
0
2
4
6
8
10
Bed
room
s
0
2,000
4,000
6,000
8,000
10,000
Ene
rgy
(kw
h/be
droo
m)
Electricity (kwh/bedroom)Gas (kwh/bedroom)Bedrooms
Fig. 11. Mean gas and electricity demand per bedroom by tenure.
Table 11Gas demand by dwelling age and type by loft insulation level and cavity filling.
HEED: Median Gas Use 2007 Stocka Lofts
Missing o50mmN Median Median Median
Dwelling AgeMissing 575,785 16,235 16,097 15,712pre-1900 30,360 17,430 16,034 17,3111900–1929 57,969 17,593 16,502 17,7421930–1949 77,944 17,010 16,153 17,3921950–1966 90,841 15,904 14,910 16,4731967–1975 117,502 16,011 15,555 16,7611976–1982 29,510 14,484 13,324 15,2141983–1990 21,334 14,486 13,336 15,137post-1990 28,156 14,950 13,732 15,058Stock 1,029,401 16,201 15,890 16,700
Dwelling typeMissing 525,816 16,423 16,316 16,523Flat 70,660 10,318 10,072 10,925Bungalow 45,614 15,955 15,858 17,958Terraces 140,100 15,033 14,858 15,362Semi-det. 175,690 16,557 16,163 17,316Detached 71,521 21,012 20,627 21,719Stock 1,029,401 16,201 15,890 16,700
N¼ 700,875 41,031
a Sample excludes dwellings with no gas meters and erroneous values (256,971).b Other wall types have been removed from this sample for the purposes of compa
3.12. HEED: impact of energy efficiency measures
Table 13 shows the change in demand for the period 2005–2007 for dwellings with an energy efficiency retrofit. The meanchange in gas demand in the control group over the period isapproximately −6.6%, which is used to define the exogenous trendsseen within dwellings with the effect of energy efficiency mea-sures. When compared against the mean change in demand forthose dwellings with an efficiency measure that occurred in 2006,it appears that the presence of cavity filling and condensing boilerupgrades are associated with the biggest drop in gas demand overthe control trend, i.e. −9.2% and −8% points respectively. Dwellingswith lofts and double glazing replacement show only a slightreduction over the control of −1.3% and −1.6% points respectively.
Figs. 13 and 14 show the mean gas demand over the period2004–2007 for the control and dwellings that received a cavity andboiler measure in 2004, 2005, 2006 and 2007—these measures arelooked at in more detail due to the magnitude of change. Thepurpose of the comparison is to determine if the presence of anefficiency measure shows a change in demand in subsequent years.Fig. 14 shows that the change in mean gas demand associated withthe presence of cavity wall filling is very apparent in the followingyear. A cavity filling in 2005 shows a drop in demand for that yearwhile dwellings with an installation in 2006 appear to have thesame change as the control group but then a large drop in 2006, thisis also true for 2007. In Fig. 14, a boiler installation also shows alarge drop in demand in the year of the intervention along the linesdescribed for cavity wall filling. Overall, the presence of an energyefficiency intervention does show a reduction in gas demand insubsequent years as compared to a control group.
4. Discussion and conclusions
4.1. The representativeness of HEED
HEED contains information on approximately 50% of dwellingsin the UK. The results of the housing stock population comparisonsfor the English and Welsh sample of HEED and England and Wales
Cavity wallsb
50-200 mm 4200 mm Missing Cavity filled Cavity as builtMedian Median Median Median Median
16,060 16,008 – – –
18,824 18,085 – – –
18,256 17,388 – – –
17,409 16,960 16,134 18,134 16,18516,492 15,874 14,387 17,344 15,75416,881 15,936 15,081 17,228 16,04815,967 14,516 12,902 15,877 14,72315,933 14,375 13,000 15,782 14,68316,024 15,612 13,137 16,060 15,34316,887 16,095 16,125 17,227 15,537
16,533 14,396 16,631 16,601 14,63510,992 10,402 9960 10,750 10,00617,234 15,608 14,602 18,115 16,26815,027 14,948 14,964 14,983 14,33916,726 16,517 16,212 17,709 15,90421,132 20,600 21,912 22,531 19,70916,887 16,095 16,125 17,227 15,537
140,300 147,195 565,101 136,878 205,318
rison (solid ¼116,811 and timber ¼5293) and pre-1930s.
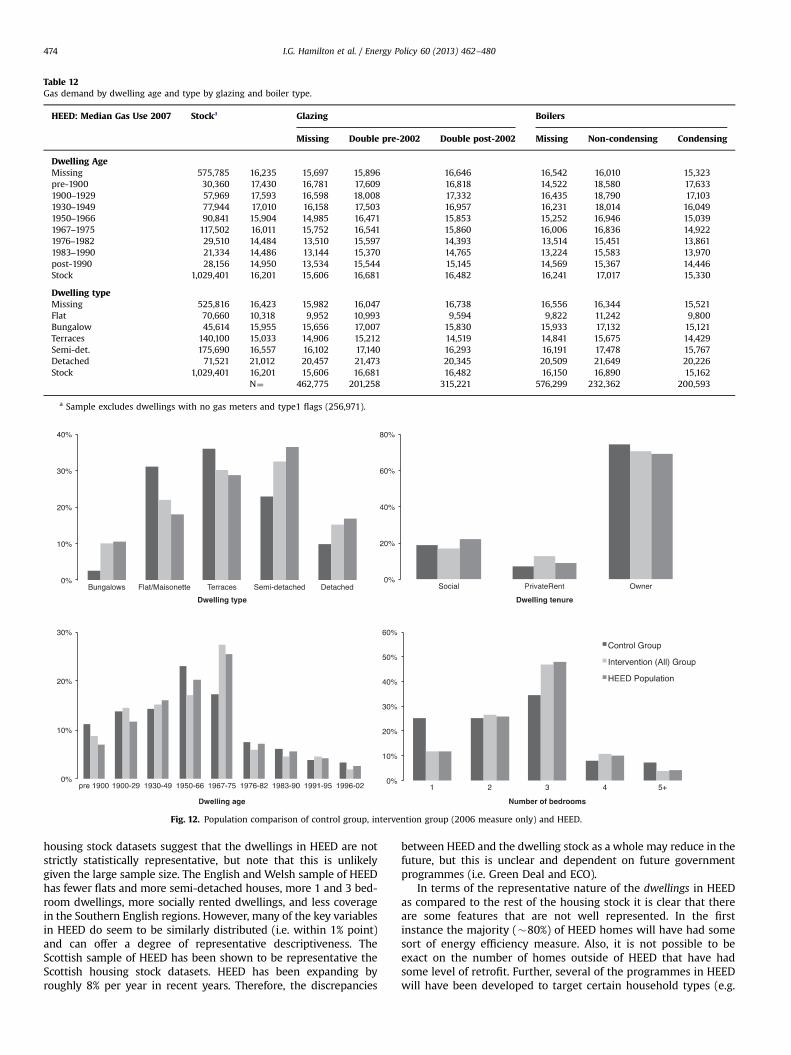
Table 12Gas demand by dwelling age and type by glazing and boiler type.
HEED: Median Gas Use 2007 Stocka Glazing Boilers
Missing Double pre-2002 Double post-2002 Missing Non-condensing Condensing
Dwelling AgeMissing 575,785 16,235 15,697 15,896 16,646 16,542 16,010 15,323pre-1900 30,360 17,430 16,781 17,609 16,818 14,522 18,580 17,6331900–1929 57,969 17,593 16,598 18,008 17,332 16,435 18,790 17,1031930–1949 77,944 17,010 16,158 17,503 16,957 16,231 18,014 16,0491950–1966 90,841 15,904 14,985 16,471 15,853 15,252 16,946 15,0391967–1975 117,502 16,011 15,752 16,541 15,860 16,006 16,836 14,9221976–1982 29,510 14,484 13,510 15,597 14,393 13,514 15,451 13,8611983–1990 21,334 14,486 13,144 15,370 14,765 13,224 15,583 13,970post-1990 28,156 14,950 13,534 15,544 15,145 14,569 15,367 14,446Stock 1,029,401 16,201 15,606 16,681 16,482 16,241 17,017 15,330
Dwelling typeMissing 525,816 16,423 15,982 16,047 16,738 16,556 16,344 15,521Flat 70,660 10,318 9,952 10,993 9,594 9,822 11,242 9,800Bungalow 45,614 15,955 15,656 17,007 15,830 15,933 17,132 15,121Terraces 140,100 15,033 14,906 15,212 14,519 14,841 15,675 14,429Semi-det. 175,690 16,557 16,102 17,140 16,293 16,191 17,478 15,767Detached 71,521 21,012 20,457 21,473 20,345 20,509 21,649 20,226Stock 1,029,401 16,201 15,606 16,681 16,482 16,150 16,890 15,162
N¼ 462,775 201,258 315,221 576,299 232,362 200,593
a Sample excludes dwellings with no gas meters and type1 flags (256,971).
Fig. 12. Population comparison of control group, intervention group (2006 measure only) and HEED.
I.G. Hamilton et al. / Energy Policy 60 (2013) 462–480474
housing stock datasets suggest that the dwellings in HEED are notstrictly statistically representative, but note that this is unlikelygiven the large sample size. The English and Welsh sample of HEEDhas fewer flats and more semi-detached houses, more 1 and 3 bed-room dwellings, more socially rented dwellings, and less coveragein the Southern English regions. However, many of the key variablesin HEED do seem to be similarly distributed (i.e. within 1% point)and can offer a degree of representative descriptiveness. TheScottish sample of HEED has been shown to be representative theScottish housing stock datasets. HEED has been expanding byroughly 8% per year in recent years. Therefore, the discrepancies
between HEED and the dwelling stock as a whole may reduce in thefuture, but this is unclear and dependent on future governmentprogrammes (i.e. Green Deal and ECO).
In terms of the representative nature of the dwellings in HEEDas compared to the rest of the housing stock it is clear that thereare some features that are not well represented. In the firstinstance the majority (�80%) of HEED homes will have had somesort of energy efficiency measure. Also, it is not possible to beexact on the number of homes outside of HEED that have hadsome level of retrofit. Further, several of the programmes in HEEDwill have been developed to target certain household types (e.g.
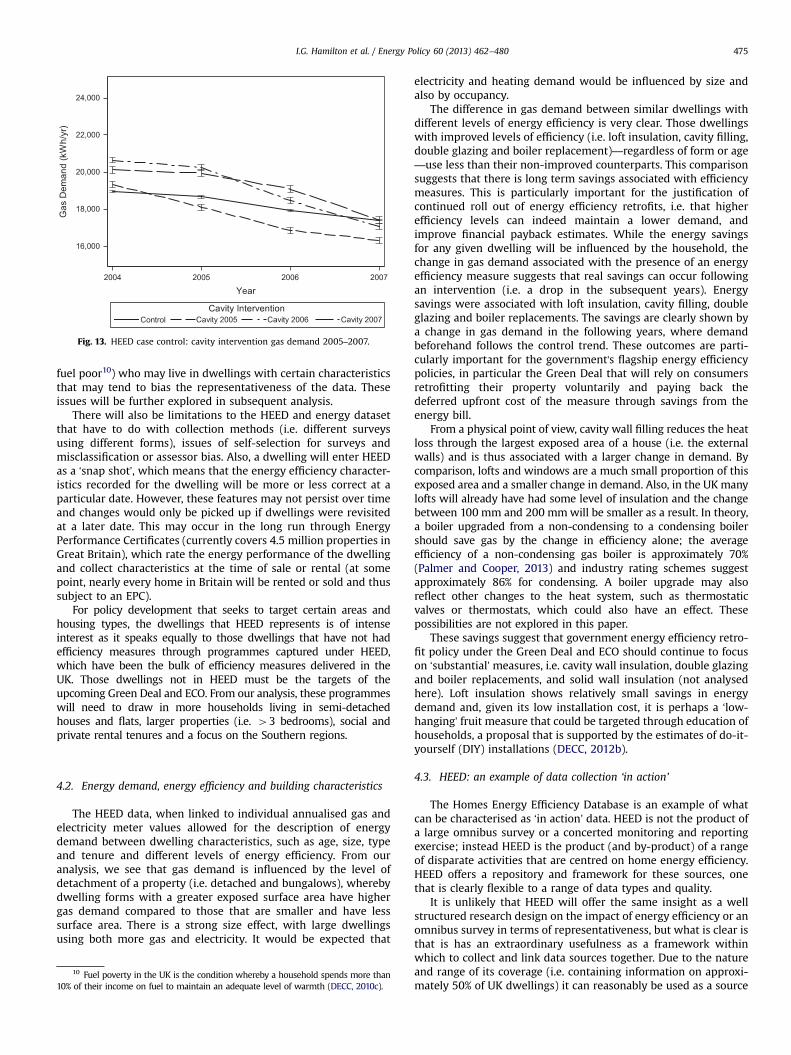
Fig. 13. HEED case control: cavity intervention gas demand 2005–2007.
I.G. Hamilton et al. / Energy Policy 60 (2013) 462–480 475
fuel poor10) who may live in dwellings with certain characteristicsthat may tend to bias the representativeness of the data. Theseissues will be further explored in subsequent analysis.
There will also be limitations to the HEED and energy datasetthat have to do with collection methods (i.e. different surveysusing different forms), issues of self-selection for surveys andmisclassification or assessor bias. Also, a dwelling will enter HEEDas a ‘snap shot’, which means that the energy efficiency character-istics recorded for the dwelling will be more or less correct at aparticular date. However, these features may not persist over timeand changes would only be picked up if dwellings were revisitedat a later date. This may occur in the long run through EnergyPerformance Certificates (currently covers 4.5 million properties inGreat Britain), which rate the energy performance of the dwellingand collect characteristics at the time of sale or rental (at somepoint, nearly every home in Britain will be rented or sold and thussubject to an EPC).
For policy development that seeks to target certain areas andhousing types, the dwellings that HEED represents is of intenseinterest as it speaks equally to those dwellings that have not hadefficiency measures through programmes captured under HEED,which have been the bulk of efficiency measures delivered in theUK. Those dwellings not in HEED must be the targets of theupcoming Green Deal and ECO. From our analysis, these programmeswill need to draw in more households living in semi-detachedhouses and flats, larger properties (i.e. 43 bedrooms), social andprivate rental tenures and a focus on the Southern regions.
4.2. Energy demand, energy efficiency and building characteristics
The HEED data, when linked to individual annualised gas andelectricity meter values allowed for the description of energydemand between dwelling characteristics, such as age, size, typeand tenure and different levels of energy efficiency. From ouranalysis, we see that gas demand is influenced by the level ofdetachment of a property (i.e. detached and bungalows), wherebydwelling forms with a greater exposed surface area have highergas demand compared to those that are smaller and have lesssurface area. There is a strong size effect, with large dwellingsusing both more gas and electricity. It would be expected that
10 Fuel poverty in the UK is the condition whereby a household spends more than10% of their income on fuel to maintain an adequate level of warmth (DECC, 2010c).
electricity and heating demand would be influenced by size andalso by occupancy.
The difference in gas demand between similar dwellings withdifferent levels of energy efficiency is very clear. Those dwellingswith improved levels of efficiency (i.e. loft insulation, cavity filling,double glazing and boiler replacement)—regardless of form or age—use less than their non-improved counterparts. This comparisonsuggests that there is long term savings associated with efficiencymeasures. This is particularly important for the justification ofcontinued roll out of energy efficiency retrofits, i.e. that higherefficiency levels can indeed maintain a lower demand, andimprove financial payback estimates. While the energy savingsfor any given dwelling will be influenced by the household, thechange in gas demand associated with the presence of an energyefficiency measure suggests that real savings can occur followingan intervention (i.e. a drop in the subsequent years). Energysavings were associated with loft insulation, cavity filling, doubleglazing and boiler replacements. The savings are clearly shown bya change in gas demand in the following years, where demandbeforehand follows the control trend. These outcomes are parti-cularly important for the government's flagship energy efficiencypolicies, in particular the Green Deal that will rely on consumersretrofitting their property voluntarily and paying back thedeferred upfront cost of the measure through savings from theenergy bill.
From a physical point of view, cavity wall filling reduces the heatloss through the largest exposed area of a house (i.e. the externalwalls) and is thus associated with a larger change in demand. Bycomparison, lofts and windows are a much small proportion of thisexposed area and a smaller change in demand. Also, in the UKmanylofts will already have had some level of insulation and the changebetween 100 mm and 200 mmwill be smaller as a result. In theory,a boiler upgraded from a non-condensing to a condensing boilershould save gas by the change in efficiency alone; the averageefficiency of a non-condensing gas boiler is approximately 70%(Palmer and Cooper, 2013) and industry rating schemes suggestapproximately 86% for condensing. A boiler upgrade may alsoreflect other changes to the heat system, such as thermostaticvalves or thermostats, which could also have an effect. Thesepossibilities are not explored in this paper.
These savings suggest that government energy efficiency retro-fit policy under the Green Deal and ECO should continue to focuson ‘substantial’ measures, i.e. cavity wall insulation, double glazingand boiler replacements, and solid wall insulation (not analysedhere). Loft insulation shows relatively small savings in energydemand and, given its low installation cost, it is perhaps a ‘low-hanging’ fruit measure that could be targeted through education ofhouseholds, a proposal that is supported by the estimates of do-it-yourself (DIY) installations (DECC, 2012b).
4.3. HEED: an example of data collection ‘in action’
The Homes Energy Efficiency Database is an example of whatcan be characterised as ‘in action’ data. HEED is not the product ofa large omnibus survey or a concerted monitoring and reportingexercise; instead HEED is the product (and by-product) of a rangeof disparate activities that are centred on home energy efficiency.HEED offers a repository and framework for these sources, onethat is clearly flexible to a range of data types and quality.
It is unlikely that HEED will offer the same insight as a wellstructured research design on the impact of energy efficiency or anomnibus survey in terms of representativeness, but what is clear isthat is has an extraordinary usefulness as a framework withinwhich to collect and link data sources together. Due to the natureand range of its coverage (i.e. containing information on approxi-mately 50% of UK dwellings) it can reasonably be used as a source
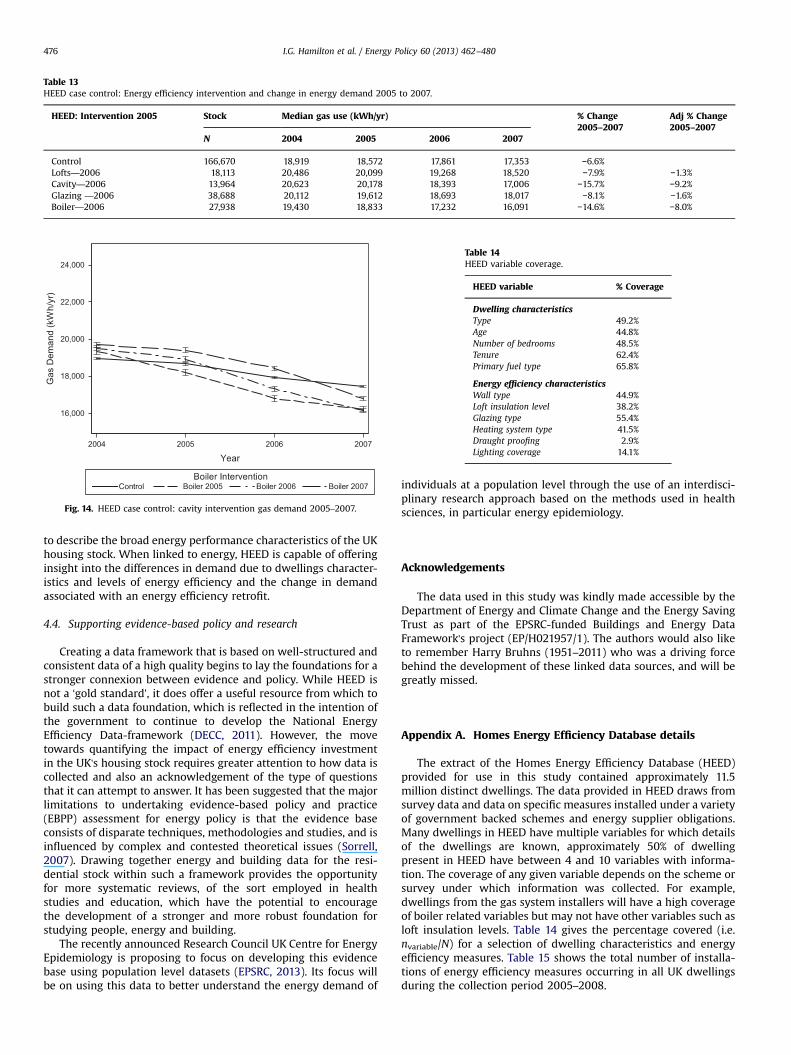
Table 14HEED variable coverage.
HEED variable % Coverage
Dwelling characteristicsType 49.2%Age 44.8%Number of bedrooms 48.5%Tenure 62.4%Primary fuel type 65.8%
Energy efficiency characteristicsWall type 44.9%Loft insulation level 38.2%Glazing type 55.4%Heating system type 41.5%Draught proofing 2.9%Lighting coverage 14.1%
Table 13HEED case control: Energy efficiency intervention and change in energy demand 2005 to 2007.
HEED: Intervention 2005 Stock Median gas use (kWh/yr) % Change2005–2007
Adj % Change2005–2007
N 2004 2005 2006 2007
Control 166,670 18,919 18,572 17,861 17,353 −6.6%Lofts—2006 18,113 20,486 20,099 19,268 18,520 −7.9% −1.3%Cavity—2006 13,964 20,623 20,178 18,393 17,006 −15.7% −9.2%Glazing —2006 38,688 20,112 19,612 18,693 18,017 −8.1% −1.6%Boiler—2006 27,938 19,430 18,833 17,232 16,091 −14.6% −8.0%
Fig. 14. HEED case control: cavity intervention gas demand 2005–2007.
I.G. Hamilton et al. / Energy Policy 60 (2013) 462–480476
to describe the broad energy performance characteristics of the UKhousing stock. When linked to energy, HEED is capable of offeringinsight into the differences in demand due to dwellings character-istics and levels of energy efficiency and the change in demandassociated with an energy efficiency retrofit.
4.4. Supporting evidence-based policy and research
Creating a data framework that is based on well-structured andconsistent data of a high quality begins to lay the foundations for astronger connexion between evidence and policy. While HEED isnot a ‘gold standard’, it does offer a useful resource from which tobuild such a data foundation, which is reflected in the intention ofthe government to continue to develop the National EnergyEfficiency Data-framework (DECC, 2011). However, the movetowards quantifying the impact of energy efficiency investmentin the UK's housing stock requires greater attention to how data iscollected and also an acknowledgement of the type of questionsthat it can attempt to answer. It has been suggested that the majorlimitations to undertaking evidence-based policy and practice(EBPP) assessment for energy policy is that the evidence baseconsists of disparate techniques, methodologies and studies, and isinfluenced by complex and contested theoretical issues (Sorrell,2007). Drawing together energy and building data for the resi-dential stock within such a framework provides the opportunityfor more systematic reviews, of the sort employed in healthstudies and education, which have the potential to encouragethe development of a stronger and more robust foundation forstudying people, energy and building.
The recently announced Research Council UK Centre for EnergyEpidemiology is proposing to focus on developing this evidencebase using population level datasets (EPSRC, 2013). Its focus willbe on using this data to better understand the energy demand of
individuals at a population level through the use of an interdisci-plinary research approach based on the methods used in healthsciences, in particular energy epidemiology.
Acknowledgements
The data used in this study was kindly made accessible by theDepartment of Energy and Climate Change and the Energy SavingTrust as part of the EPSRC-funded Buildings and Energy DataFramework's project (EP/H021957/1). The authors would also liketo remember Harry Bruhns (1951–2011) who was a driving forcebehind the development of these linked data sources, and will begreatly missed.
Appendix A. Homes Energy Efficiency Database details
The extract of the Homes Energy Efficiency Database (HEED)provided for use in this study contained approximately 11.5million distinct dwellings. The data provided in HEED draws fromsurvey data and data on specific measures installed under a varietyof government backed schemes and energy supplier obligations.Many dwellings in HEED have multiple variables for which detailsof the dwellings are known, approximately 50% of dwellingpresent in HEED have between 4 and 10 variables with informa-tion. The coverage of any given variable depends on the scheme orsurvey under which information was collected. For example,dwellings from the gas system installers will have a high coverageof boiler related variables but may not have other variables such asloft insulation levels. Table 14 gives the percentage covered (i.e.nvariable/N) for a selection of dwelling characteristics and energyefficiency measures. Table 15 shows the total number of installa-tions of energy efficiency measures occurring in all UK dwellingsduring the collection period 2005–2008.
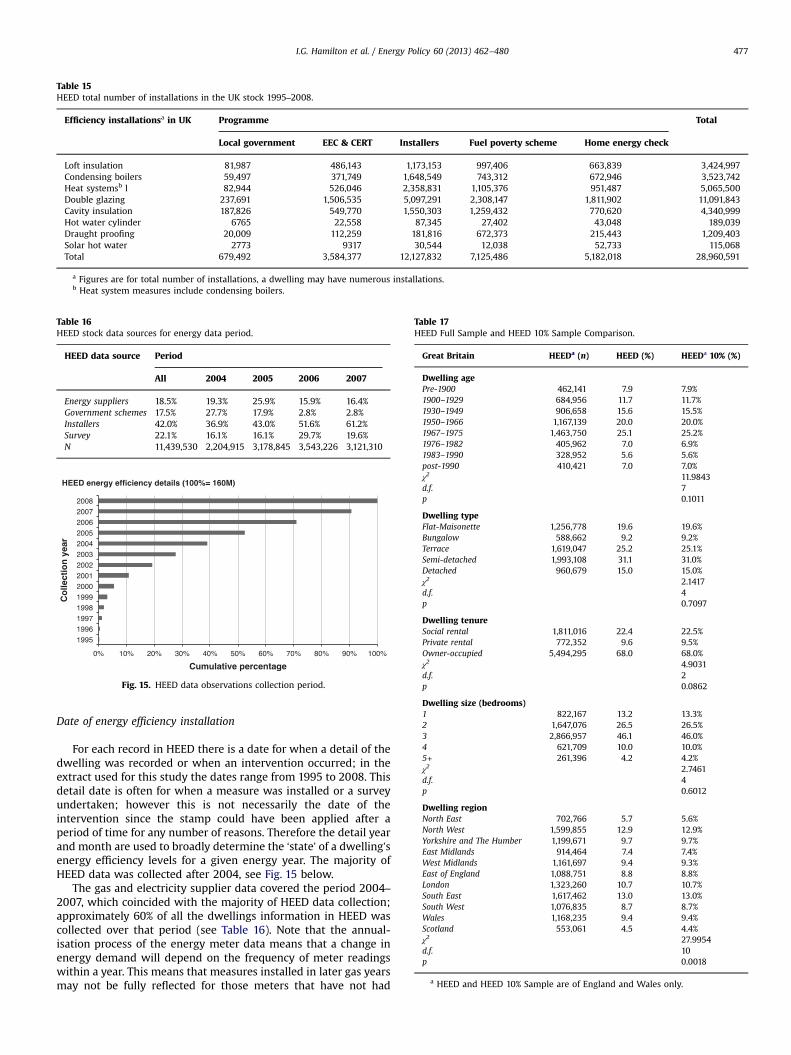
Table 15HEED total number of installations in the UK stock 1995–2008.
Efficiency installationsa in UK Programme Total
Local government EEC & CERT Installers Fuel poverty scheme Home energy check
Loft insulation 81,987 486,143 1,173,153 997,406 663,839 3,424,997Condensing boilers 59,497 371,749 1,648,549 743,312 672,946 3,523,742Heat systemsb l 82,944 526,046 2,358,831 1,105,376 951,487 5,065,500Double glazing 237,691 1,506,535 5,097,291 2,308,147 1,811,902 11,091,843Cavity insulation 187,826 549,770 1,550,303 1,259,432 770,620 4,340,999Hot water cylinder 6765 22,558 87,345 27,402 43,048 189,039Draught proofing 20,009 112,259 181,816 672,373 215,443 1,209,403Solar hot water 2773 9317 30,544 12,038 52,733 115,068Total 679,492 3,584,377 12,127,832 7,125,486 5,182,018 28,960,591
a Figures are for total number of installations, a dwelling may have numerous installations.b Heat system measures include condensing boilers.
Table 16HEED stock data sources for energy data period.
HEED data source Period
All 2004 2005 2006 2007
Energy suppliers 18.5% 19.3% 25.9% 15.9% 16.4%Government schemes 17.5% 27.7% 17.9% 2.8% 2.8%Installers 42.0% 36.9% 43.0% 51.6% 61.2%Survey 22.1% 16.1% 16.1% 29.7% 19.6%N 11,439,530 2,204,915 3,178,845 3,543,226 3,121,310
Table 17HEED Full Sample and HEED 10% Sample Comparison.
Great Britain HEEDa (n) HEED (%) HEEDa 10% (%)
Dwelling agePre-1900 462,141 7.9 7.9%1900–1929 684,956 11.7 11.7%1930–1949 906,658 15.6 15.5%1950–1966 1,167,139 20.0 20.0%1967–1975 1,463,750 25.1 25.2%1976–1982 405,962 7.0 6.9%1983–1990 328,952 5.6 5.6%post-1990 410,421 7.0 7.0%χ2 11.9843d.f. 7p 0.1011
Dwelling typeFlat-Maisonette 1,256,778 19.6 19.6%Bungalow 588,662 9.2 9.2%Terrace 1,619,047 25.2 25.1%Semi-detached 1,993,108 31.1 31.0%Detached 960,679 15.0 15.0%χ2 2.1417d.f. 4p 0.7097
Dwelling tenureSocial rental 1,811,016 22.4 22.5%Private rental 772,352 9.6 9.5%Owner-occupied 5,494,295 68.0 68.0%χ2 4.9031d.f. 2p 0.0862
Dwelling size (bedrooms)1 822,167 13.2 13.3%2 1,647,076 26.5 26.5%3 2,866,957 46.1 46.0%4 621,709 10.0 10.0%5+ 261,396 4.2 4.2%χ2 2.7461d.f. 4p 0.6012
Dwelling regionNorth East 702,766 5.7 5.6%North West 1,599,855 12.9 12.9%Yorkshire and The Humber 1,199,671 9.7 9.7%East Midlands 914,464 7.4 7.4%West Midlands 1,161,697 9.4 9.3%East of England 1,088,751 8.8 8.8%London 1,323,260 10.7 10.7%South East 1,617,462 13.0 13.0%South West 1,076,835 8.7 8.7%Wales 1,168,235 9.4 9.4%Scotland 553,061 4.5 4.4%χ2 27.9954d.f. 10p 0.0018
a HEED and HEED 10% Sample are of England and Wales only.
Fig. 15. HEED data observations collection period.
I.G. Hamilton et al. / Energy Policy 60 (2013) 462–480 477
Date of energy efficiency installation
For each record in HEED there is a date for when a detail of thedwelling was recorded or when an intervention occurred; in theextract used for this study the dates range from 1995 to 2008. Thisdetail date is often for when a measure was installed or a surveyundertaken; however this is not necessarily the date of theintervention since the stamp could have been applied after aperiod of time for any number of reasons. Therefore the detail yearand month are used to broadly determine the ‘state’ of a dwelling’senergy efficiency levels for a given energy year. The majority ofHEED data was collected after 2004, see Fig. 15 below.
The gas and electricity supplier data covered the period 2004–2007, which coincided with the majority of HEED data collection;approximately 60% of all the dwellings information in HEED wascollected over that period (see Table 16). Note that the annual-isation process of the energy meter data means that a change inenergy demand will depend on the frequency of meter readingswithin a year. This means that measures installed in later gas yearsmay not be fully reflected for those meters that have not had
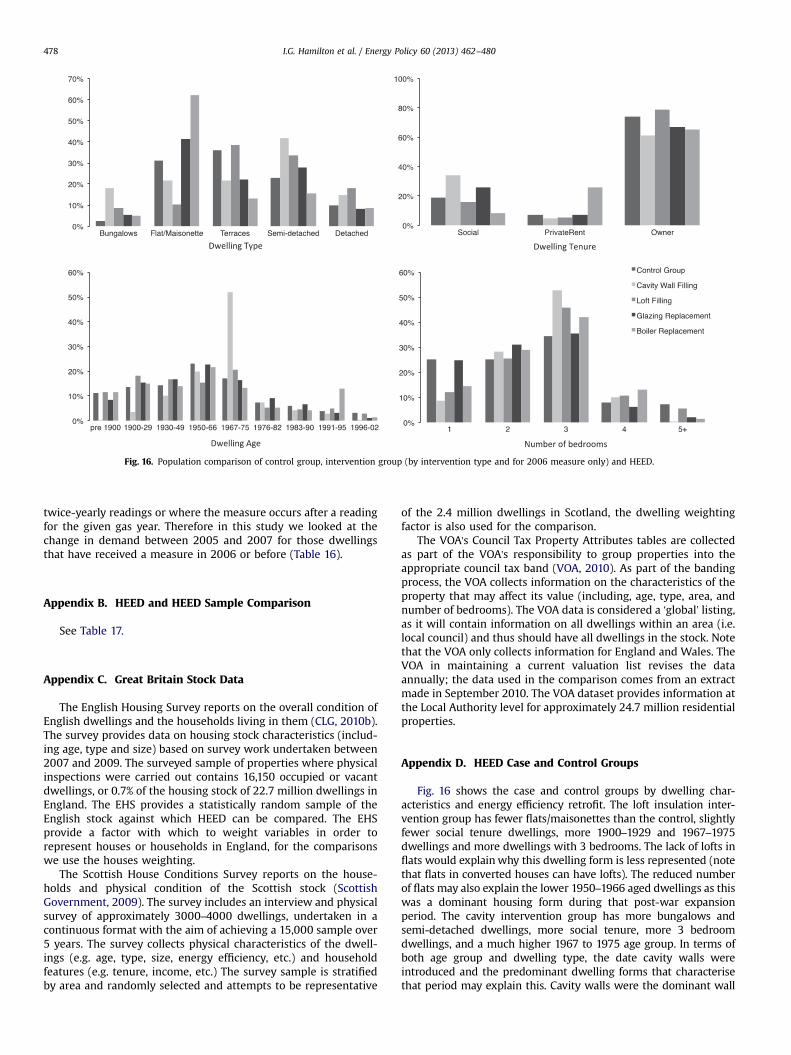
Fig. 16. Population comparison of control group, intervention group (by intervention type and for 2006 measure only) and HEED.
I.G. Hamilton et al. / Energy Policy 60 (2013) 462–480478
twice-yearly readings or where the measure occurs after a readingfor the given gas year. Therefore in this study we looked at thechange in demand between 2005 and 2007 for those dwellingsthat have received a measure in 2006 or before (Table 16).
Appendix B. HEED and HEED Sample Comparison
See Table 17.
Appendix C. Great Britain Stock Data
The English Housing Survey reports on the overall condition ofEnglish dwellings and the households living in them (CLG, 2010b).The survey provides data on housing stock characteristics (includ-ing age, type and size) based on survey work undertaken between2007 and 2009. The surveyed sample of properties where physicalinspections were carried out contains 16,150 occupied or vacantdwellings, or 0.7% of the housing stock of 22.7 million dwellings inEngland. The EHS provides a statistically random sample of theEnglish stock against which HEED can be compared. The EHSprovide a factor with which to weight variables in order torepresent houses or households in England, for the comparisonswe use the houses weighting.
The Scottish House Conditions Survey reports on the house-holds and physical condition of the Scottish stock (ScottishGovernment, 2009). The survey includes an interview and physicalsurvey of approximately 3000–4000 dwellings, undertaken in acontinuous format with the aim of achieving a 15,000 sample over5 years. The survey collects physical characteristics of the dwell-ings (e.g. age, type, size, energy efficiency, etc.) and householdfeatures (e.g. tenure, income, etc.) The survey sample is stratifiedby area and randomly selected and attempts to be representative
of the 2.4 million dwellings in Scotland, the dwelling weightingfactor is also used for the comparison.
The VOA's Council Tax Property Attributes tables are collectedas part of the VOA's responsibility to group properties into theappropriate council tax band (VOA, 2010). As part of the bandingprocess, the VOA collects information on the characteristics of theproperty that may affect its value (including, age, type, area, andnumber of bedrooms). The VOA data is considered a ‘global’ listing,as it will contain information on all dwellings within an area (i.e.local council) and thus should have all dwellings in the stock. Notethat the VOA only collects information for England and Wales. TheVOA in maintaining a current valuation list revises the dataannually; the data used in the comparison comes from an extractmade in September 2010. The VOA dataset provides information atthe Local Authority level for approximately 24.7 million residentialproperties.
Appendix D. HEED Case and Control Groups
Fig. 16 shows the case and control groups by dwelling char-acteristics and energy efficiency retrofit. The loft insulation inter-vention group has fewer flats/maisonettes than the control, slightlyfewer social tenure dwellings, more 1900–1929 and 1967–1975dwellings and more dwellings with 3 bedrooms. The lack of lofts inflats would explain why this dwelling form is less represented (notethat flats in converted houses can have lofts). The reduced numberof flats may also explain the lower 1950–1966 aged dwellings as thiswas a dominant housing form during that post-war expansionperiod. The cavity intervention group has more bungalows andsemi-detached dwellings, more social tenure, more 3 bedroomdwellings, and a much higher 1967 to 1975 age group. In terms ofboth age group and dwelling type, the date cavity walls wereintroduced and the predominant dwelling forms that characterisethat period may explain this. Cavity walls were the dominant wall
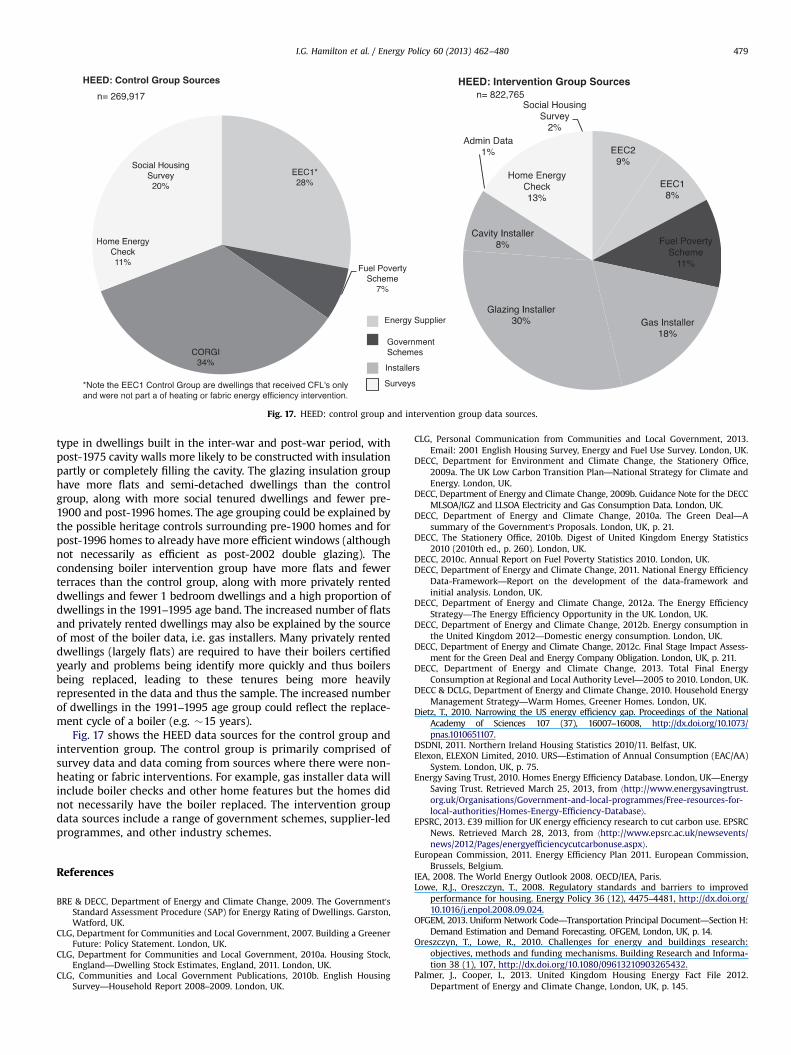
Fig. 17. HEED: control group and intervention group data sources.
I.G. Hamilton et al. / Energy Policy 60 (2013) 462–480 479
type in dwellings built in the inter-war and post-war period, withpost-1975 cavity walls more likely to be constructed with insulationpartly or completely filling the cavity. The glazing insulation grouphave more flats and semi-detached dwellings than the controlgroup, along with more social tenured dwellings and fewer pre-1900 and post-1996 homes. The age grouping could be explained bythe possible heritage controls surrounding pre-1900 homes and forpost-1996 homes to already have more efficient windows (althoughnot necessarily as efficient as post-2002 double glazing). Thecondensing boiler intervention group have more flats and fewerterraces than the control group, along with more privately renteddwellings and fewer 1 bedroom dwellings and a high proportion ofdwellings in the 1991–1995 age band. The increased number of flatsand privately rented dwellings may also be explained by the sourceof most of the boiler data, i.e. gas installers. Many privately renteddwellings (largely flats) are required to have their boilers certifiedyearly and problems being identify more quickly and thus boilersbeing replaced, leading to these tenures being more heavilyrepresented in the data and thus the sample. The increased numberof dwellings in the 1991–1995 age group could reflect the replace-ment cycle of a boiler (e.g. �15 years).
Fig. 17 shows the HEED data sources for the control group andintervention group. The control group is primarily comprised ofsurvey data and data coming from sources where there were non-heating or fabric interventions. For example, gas installer data willinclude boiler checks and other home features but the homes didnot necessarily have the boiler replaced. The intervention groupdata sources include a range of government schemes, supplier-ledprogrammes, and other industry schemes.
References
BRE & DECC, Department of Energy and Climate Change, 2009. The Government'sStandard Assessment Procedure (SAP) for Energy Rating of Dwellings. Garston,Watford, UK.
CLG, Department for Communities and Local Government, 2007. Building a GreenerFuture: Policy Statement. London, UK.
CLG, Department for Communities and Local Government, 2010a. Housing Stock,England—Dwelling Stock Estimates, England, 2011. London, UK.
CLG, Communities and Local Government Publications, 2010b. English HousingSurvey—Household Report 2008–2009. London, UK.
CLG, Personal Communication from Communities and Local Government, 2013.Email: 2001 English Housing Survey, Energy and Fuel Use Survey. London, UK.
DECC, Department for Environment and Climate Change, the Stationery Office,2009a. The UK Low Carbon Transition Plan—National Strategy for Climate andEnergy. London, UK.
DECC, Department of Energy and Climate Change, 2009b. Guidance Note for the DECCMLSOA/IGZ and LLSOA Electricity and Gas Consumption Data. London, UK.
DECC, Department of Energy and Climate Change, 2010a. The Green Deal—Asummary of the Government's Proposals. London, UK, p. 21.
DECC, The Stationery Office, 2010b. Digest of United Kingdom Energy Statistics2010 (2010th ed., p. 260). London, UK.
DECC, 2010c. Annual Report on Fuel Poverty Statistics 2010. London, UK.DECC, Department of Energy and Climate Change, 2011. National Energy Efficiency
Data-Framework—Report on the development of the data-framework andinitial analysis. London, UK.
DECC, Department of Energy and Climate Change, 2012a. The Energy EfficiencyStrategy—The Energy Efficiency Opportunity in the UK. London, UK.
DECC, Department of Energy and Climate Change, 2012b. Energy consumption inthe United Kingdom 2012—Domestic energy consumption. London, UK.
DECC, Department of Energy and Climate Change, 2012c. Final Stage Impact Assess-ment for the Green Deal and Energy Company Obligation. London, UK, p. 211.
DECC, Department of Energy and Climate Change, 2013. Total Final EnergyConsumption at Regional and Local Authority Level—2005 to 2010. London, UK.
DECC & DCLG, Department of Energy and Climate Change, 2010. Household EnergyManagement Strategy—Warm Homes, Greener Homes. London, UK.
Dietz, T., 2010. Narrowing the US energy efficiency gap. Proceedings of the NationalAcademy of Sciences 107 (37), 16007–16008, http://dx.doi.org/10.1073/pnas.1010651107.
DSDNI, 2011. Northern Ireland Housing Statistics 2010/11. Belfast, UK.Elexon, ELEXON Limited, 2010. URS—Estimation of Annual Consumption (EAC/AA)
System. London, UK, p. 75.Energy Saving Trust, 2010. Homes Energy Efficiency Database. London, UK—Energy
Saving Trust. Retrieved March 25, 2013, from ⟨http://www.energysavingtrust.org.uk/Organisations/Government-and-local-programmes/Free-resources-for-local-authorities/Homes-Energy-Efficiency-Database⟩.
EPSRC, 2013. £39 million for UK energy efficiency research to cut carbon use. EPSRCNews. Retrieved March 28, 2013, from ⟨http://www.epsrc.ac.uk/newsevents/news/2012/Pages/energyefficiencycutcarbonuse.aspx⟩.
European Commission, 2011. Energy Efficiency Plan 2011. European Commission,Brussels, Belgium.
IEA, 2008. The World Energy Outlook 2008. OECD/IEA, Paris.Lowe, R.J., Oreszczyn, T., 2008. Regulatory standards and barriers to improved
performance for housing. Energy Policy 36 (12), 4475–4481, http://dx.doi.org/10.1016/j.enpol.2008.09.024.
OFGEM, 2013. Uniform Network Code—Transportation Principal Document—Section H:Demand Estimation and Demand Forecasting. OFGEM, London, UK, p. 14.
Oreszczyn, T., Lowe, R., 2010. Challenges for energy and buildings research:objectives, methods and funding mechanisms. Building Research and Informa-tion 38 (1), 107, http://dx.doi.org/10.1080/09613210903265432.
Palmer, J., Cooper, I., 2013. United Kingdom Housing Energy Fact File 2012.Department of Energy and Climate Change, London, UK, p. 145.

I.G. Hamilton et al. / Energy Policy 60 (2013) 462–480480
Pérez-Lombard, L., Ortiz, J., Pout, C., 2008. A review on buildings energy consump-tion information. Energy and Buildings 40 (3), 394–398, http://dx.doi.org/10.1016/j.enbuild.2007.03.007.
Scottish Government, 2009. Scottish House Condition Survey—Key Findings 2008.Edinburgh, UK.
Scottish Government, 2011. Housing Statistics for Scotland—Key Information andSummary Tables. Edinburgh, UK.
Shipworth, M., Firth, S.K., Gentry, M.I., Wright, A.J., Shipworth, D.T., Lomas, K.J., 2010.Central heating thermostat settings and timing: building demographics. BuildingResearch and Information 38 (1), 50, http://dx.doi.org/10.1080/09613210903263007.
Sorrell, S., 2007. Improving the evidence base for energy policy: the role ofsystematic reviews. Energy Policy 35 (3), 1858–1871, http://dx.doi.org/10.1016/j.enpol.2006.06.008.
Summerfield, A.J., Lowe, R.J., Bruhns, H.R., Caeiro, J.A., Steadman, J.P., Oreszczyn, T.,2007. Milton Keynes Energy Park revisited: changes in internal temperaturesand energy usage. Energy and Buildings 39 (7), 783–791, http://dx.doi.org/10.1016/j.enbuild.2007.02.012.
UK CCC, 2010. Fourth Carbon Budget. UK Committee on Climate Change, London,UK, p. 375.
UNEP, 2011. Towards a Green Economy—Pathways to Sustainable Development andPoverty Eradication. United Nations Environment Programme, Paris, France.
VOA, September 2010. Council Tax Property Attribute Data. Valuation Office Agency.Welsh Assembly Government, 2011. Dwelling Stock Estimates, 2009–2010. Cardiff, UK.
Related Documents