Center for Energy Efficiency (CENEf) Energy efficiency in Buildings: Untapped Reserves for Uzbekistan Sustainable Development Moscow, November 2013

Welcome message from author
This document is posted to help you gain knowledge. Please leave a comment to let me know what you think about it! Share it to your friends and learn new things together.
Transcript
Center for Energy Efficiency (CENEf)
Energy efficiency in Buildings: Untapped Reserves for Uzbekistan Sustainable Development
Moscow, November 2013
INTRODUCTION
CONTENTS
5
A BBREV IA TIO N S.............................................................................................................................................................................6
SUM M ARY. MAJOR FINDINGS AND RECOMMENDATIONS RELATED TO ENERGY EFFICIENCY POLICIES IN THE UZBEKISTANI BUILDINGS SEC TO R .............................................................................................................................................. 7
Housing and public buildings stock: 560 mln. m2 in 2 01 1......................................................................................................7More than 50% of primary energy is spent on energy supply to the buildings sector.........................................................8Heatsupply systems of the Uzbekistan Republic are worn and inefficient..........................................................................10A SET OF MATHEMATICAL MODELS WAS USED FOR ENERGY CONSUMPTION PROJECTIONS IN THE BUILDINGS SECTOR..........................11In order to implement the energy saving potential, it is importantto pass the dense rock of energy
EFFICIENCY BARRIERS......................................................................................................................................................................11Energy efficiency activities in the Uzbekistani buildings sector have been spurred in the recent years, yet...THERE IS MUCH TO DO................................................................................................................................................................... 11Baseline scenario.......................................................................................................................................................................12"Step into the future" scen a rio .............................................................................................................................................. 12"Soft way" scen ario ................................................................................................................................................................. 14Costs and social and economic benefits.................................................................................................................................16
1. RESIDENTIAL STOCK SHAPE AND EVOLUTION............................................................................................................. 19
1.1. Residential stock evolution and structure.............................................................................................................191.2. New construction dynam ics..................................................................................................................................... 211.3. Capital refurbishment d ynam ics...............................................................................................................................211.4. Housing am enities...................................................................................................................................................... 221.5. A ppliances per household..........................................................................................................................................231.6. Energy and water meters saturation of housing .................................................................................................. 231.7. Residents' satisfaction with the housing and municipal utility services............................................................. 231.8. A ffordability of housing and municipal utility services........................................................................................ 231.9. Housing affordability................................................................................................................................................ 251.10. Assessment of the remaining buildingstock........................................................................................................... 27
2. ENERGY CONSUMPTION IN BUILDINGS........................................................................................................................29
2.1. Role of the buildings sector in Uzbekistani energy balance...................................................................................292.2. Residential energy consumption dynamics in 2000-2011...................................................................................... 322.3. Energy consumption for residential space heating................................................................................................ 352.4. Results of random energy audits of residential bu ildings....................................................................................39
2.4.1. Multifamily b uildin gs...................................................................................................................................... 392.4.2. Single-family houses........................................................................................................................................43
2.5. Energy consumption for residential hot water su pply ..........................................................................................442.6. Energy consumption for residential cooking ......................................................................................................... 452.7. Energy consumption for lighting purposes.............................................................................................................462.8. Energy consumption for air conditioning...............................................................................................................472.9. Energy consumption by major appliances................................................................................................................472.10. Energy consumption by electronic equipment and other appliances................................................................... 482.11. T he results of random audits of public buildings.................................................................................................. 49
3. THE SHAPE OF HEAT SUPPLY SYSTEM S......................................................................................................................... 52
3.1. Heat balance............................................................................................................................................................... 523.2. Uzbekistan heat so urces............................................................................................................................................533.3. Heating netw orks...................................................................................................................................................... 59
2
4. ASSESSM ENT OF THE ENERGY SAVING PO TENTIAL....................................................................................................61
4.1. Definitions of the technical, economic, and market energy saving potentials................................................... 614.2. Residential sec to r ...................................................................................................................................................... 614.3. Heat supply system s....................................................................................................................................................67
5. ANALYSIS OF BARRIERS TO ENERGY EFFICIENCY IN BU ILD IN G S..............................................................................71
6. ENERGY EFFICIENCY POLICIES IN BUILDINGS................................................................................................................75
6.1. T he Uzbekistan experience..........................................................................................................................................756.2. Comparing measures implemented in Uzbekistan buildings with the IEA recommendations............................. 76
6.2.1. Measures related to the building codes, windows and translucent structures....................................766.2.2. Improving energy efficiency o f appliances................................................................................................. 776.2.3. Improving the energy efficiency of lighting ................................................................................................ 78
7. ENERGY EFFICIENCY SCENARIOS IN THE BUILDINGS SEC TO R .................................................................................. 80
7.1. Macroeconomic projection ...................................................................................................................................... 807.2. Baseline scenario........................................................................................................................................................ 86
7.2.1. Residential buildings........................................................................................................................................867.2.1.1. Baseline scenario assumptions...................................................................................................................... 867.2.1.2. Baseline scenario calculations....................................................................................................................... 88
7.2.2. Public and commercial buildings.................................................................................................................. 937.3. "Step into the XXI century" ........................................................................................................................................93
7.3.1. Residential buildings........................................................................................................................................937.3.1.1. Assumptions of the "Step into the XXI century" scenario.............................................................................937.3.1.2. Calculations under the "Step into the XXI century" scenario........................................................................95
7.3.2. Public and commercial buildings................................................................................................................1007.4. "Soft way" ................................................................................................................................................................ 100
7.4.1. Residential buildings..................................................................................................................................... 1007.4.1.1. Assumptions of the "Soft way" scenario..................................................................................................... 1007.4.1.2. Calculations under the "Soft way" scenario................................................................................................ 102
7.4.2. Public and commercial buildings................................................................................................................106
8. HEAT SUPPLY ENERGY EFFICIENCY IMPROVEMENT SCEN A R IO S.......................................................................... 107
8.1. Baseline scenario...................................................................................................................................................... 1078.1.1. Heat sources...................................................................................................................................................107
8.1.1.1. Baseline scenario assumptions.................................................................................................................... 1078.1.1.2. The results of calculations in the baseline scenario....................................................................................107
8.1.2. Heating networks..........................................................................................................................................1098.1.2.1. Assumptions of the baseline scenario......................................................................................................... 1098.1.2.2. Calculation results in the baseline scenario................................................................................................ 110
8.2. "Step in to th eXXI century" ..................................................................................................................................... I l l8.2.1. Heat sources...................................................................................................................................................I l l
8.2.1.1. Assumptions in the "Step into the XXI century" scenario...........................................................................I l l8.2.1.2. Calculations under the "Step into the XXI century" scenario......................................................................I l l
8.2.2. Heating networks..........................................................................................................................................1138.2.2.1. Assumptions in the "Step into the XXI century" scenario...........................................................................1138.2.2.2. Results of calculations in the "Step into the XXI century" scenario............................................................114
9. SOCIAL AND ECONOMIC BENEFITS OF ENERGY EFFICIENCY IMPROVEMENTS IN BU ILD IN G S........................115
9.1. Millennium goals.....................................................................................................................................................1159.2. Energy security and developm ent.......................................................................................................................... 1169.3. Economic gro w th ....................................................................................................................................................117
3

9.4. Costs and benefits....................................................................................................................................................1189.5. Creation of jo b s ....................................................................................................................................................... 1199.6. Eradication of poverty and maintaining energy affordability...........................................................................1209.7. Improving the standard of living and health ....................................................................................................... 1209.8. Environmental security and reduction of contamination and GHG em issions................................................ 121
ATTACHMENT 1. THE M ODELS............................................................................................................................................... 124
Brief description of the RES-UZ m odel.................................................................................................................................124General modeling logics and initial data to assess the model param eters........................................................... 124
Economic growth and housing construction sim ulation................................................................................................. 126
ATTACHMENT 2. FOREIGN EXPERIENCE IN PROMOTING ENERGY EFFICIENCY IN BUILDINGS.................................129
4
IntroductionThe objective o f this study was to assess the perspectives for energy efficiency improvement in the Uzbekistani residential sector, as well as the energy saving potential and relevant social and economic benefits that may be obtained before 2050. Such time horizon allows it to go beyond the persistence o f thinking, to avoid a primitive extrapolation o f the current situation for the future, and to see and assess the perspectives that today may seem unrealistic. The goal was not formulated so as to “ shift” the past and the present into the future; rather it was to estimate the future possibilities and to verify the current policies accordingly in order to early enough lay the basis for a bright future, which is seen as an innovative “green” economy, and to turn future “maths” into current practices.
The major findings and results o f the study are summarized in the Summary and explained in more detail in further sections. Chapter 1 shows the shape and evolution o f the housing stock, as well as tariffs for housing and municipal utility services, and estimates the affordability o f these services for the households. Chapter 2 provides information on the volume and efficiency of energy consumption in buildings. Chapter 3 describes the current shape o f the heat supply systems. The energy saving potential in buildings and heat supply systems is shown in Chapter 4. Barriers to energy efficiency improvement in the buildings sector are shown in Chapter 5. Chapter 6 elaborates on the energy efficiency regulatory framework in Uzbekistan versus the ГЕА recommendations and current EE regulatory practices in the developed countries.
Estimates o f energy efficiency improvement perspectives in the Uzbekistani buildings are shown in Chapter 7 for three scenarios: baseline, “ Step into the XXI century”, and “ Soft way” . Chapter 8 estimates the perspectives for heat supply energy efficiency improvement. Chapter 9 elaborates on the assessment o f various social and economic benefits for Uzbekistan associated with energy efficiency improvement in the buildings sector.
Development o f projections until 2050 required a set o f mathematical models for long-term projections that are described in Attachment 1.
This study was accomplished for the UNDP office in Uzbekistan by CEN Ef staff: Igor Bashmakov, Vladimir Bashmakov, Konstantin Borisov, Maxim Dzedzichek, Oleg Lebedev, Alexey Lunin, and Anna Myshak. Editing and layout by Tatiana Shishkina and Oksana Ganzyuk. Translated into English by Tatiana Shishkina.
The authors wish to express their gratitude to Liliya Zavyalova, K. Usmanov, P. Salikhov and other employees o f the UNDP office in Uzbekistan and to M arina Olshanskaya o f the UNDP office in Europe and Central Asia for their assistance in data collection and for their advice on a variety o f topics covered in this report.
Igor Bashmakov
Executive Director, CENEf
5
Abbreviations
ADEME French Environment and Energy M anagement AgencyAIM Asian Integrated ModelBP British PetroleumCSE Cost o f Saving EnergyIEA International Energy AgencyPV PhotovoltaicRES-UZ Residential energy consumption modelTACIS Technical Assistance for the Commonwealth o f Independent StatesADB Asian Development BankGDP Gross Domestic ProductHIV/AIDS Human Immunodeficiency Virus/Acquired Immunodeficiency SyndromeGEF Global Environmental FacilityEBRD European Bank for Reconstruction and DevelopmentEU European UnionIFEB Integrated Fuel and Energy BalanceEEC European Economic CommunityWHO W orld Health OrganizationOJSC Open Joint Stock CompanyOECD Organization for Economic Cooperation and DevelopmentGHG Greenhouse gasesUNDP United Nations Development ProgrammeRF The Russian FederationCIS Commonwealth o f Independent StatesGAK Federal jo int stock companyU.S. United States o f AmericaHOA Home Owners AssociationCHP Combined heat and power plantTPP Thermal power plantCENEf Center for Energy Efficiency
6
Summary. Major findings and recommendations related to energy efficiency policies in the Uzbekistani buildings sector
Housing and public buildings stock: 560 mln. m2 in 2011In 2012, the Uzbekistani housing stock totaled to 450 mln. m2. The share o f private housing was 98.9%. As the individual construction developed, the share o f multifamily housing went down from 0.9% to 0.8% in 2000-2012, and the share o f multifamily housing floor area dropped from 17% in 2000 to 13% in 2012. As o f July 1, 2013, multifamily housing o f the Uzbekistan Republic included 31671 houses with the total o f 965,801 flats and 58.3 mln. m2 O f these, 9,596 houses with the total o f 25.7 mln. m 2 are located in Tashkent. In the recent years, annual construction rate is around 30-40 multifamily houses. [1.1]
As of January 1, 2013, the population of Uzbekistan stood at around 30 mln. people. Housing per capita grew up from 13.8 m2 in 2000 to 15.2 m2 in 2012. Commissioning o f new buildings increased from 8 mln. m 2 in 2000 to 10.4 mln. m2 in 2012, i.e. the average commissioning rate was 0.35 m2/person/year. In 2012, only 24% of the newly constructed floor area was commissioned in the urban regions; the remaining floor area was commissioned in the rural regions. The share o f individual housing in the total commissioned floor area grew up from 97% in 2000 to 99% in 2012. [1.2]
According to the available data, in 2002-2010 22,585 multifamily buildings, i.e. 73% of the overall number of multifamily buildings, were capitally refurbished. In multifamily buildings, capital refurbishment primarily involved renovation o f in-house heat and water supply networks, doors and windows in the entrance halls, and installation o f hot and cold-water meters. [1.3]
If the quality of housing and municipal utility services is to be improved, it is important to substantially improve the housing amenities, primarily provide access to tap water supply.In 2010, only 66% of the Uzbekistani housing stock had access to tap water supply, 31% to sewage, 43% to district heating, 80% to natural gas supply, 24% to DHW supply, and 25% were equipped with bath tubs. Around 95% of residential gas consumers are equipped with meters. 74% of the total number o f flats and individual buildings with access to DHW are equipped with meters. And only 4% of residential buildings have building-level heat meters. [1.4]
By C E N E fs estimates, the share of housing and municipal utility services spending exceeds 10% of residential incomes and is beyond the affordability thresholds. This is proved by a low housing and municipal utility services payment discipline in Uzbekistan. And this is with 3.5 years housing affordability ratio, which means a very affordable housing by the international standards. [1.8]
Public and commercial floor area in Uzbekistan may be estimated at 110 mln. m2. More than a half o f these belong to educational institutions. In Uzbekistan, statistics take account of only some o f the parameters o f commercial and public floor area. The missing data need to be estimated. No information is available on the public and commercial sector amenities, but they must correlate with the housing stock amenities. [1.10]
7
More than 50% of primary energy is spent on energy supply to the buildings sectorThe buildings sector was responsible for 55% of the 2011 end-use energy consumption (or 50% of primary energy consumption, if account is taken of electricity and heat generation and transmission losses and of the fuel and energy complex process needs). Buildings are responsible for 75% of final heat consumption; 26% of final electricity consumption; 64% of final natural gas consumption; and nearly one third o f the overall natural gas consumption (including the fuel and energy complex process needs). W ith electricity and heat generation for the buildings sector, they are responsible for 56% of natural gas consumption. W ith this volume halved through improved efficiency o f natural gas, electricity, and heat use, natural gas export could more than double. [2.1]
Residential buildings are the largest energy consumer in Uzbekistan: more energy is spent in this sector, than for electricity or heat generation purposes. Residential buildings are responsible for 33% of primary energy consumption and 46% of final energy consumption; 60% of final heat consumption; 18% of final electricity consumption; 54% of final natural gas consumption. With an account o f energy consumption for electricity and heat generation for residential buildings, as well as o f own needs and losses associated with energy generation, the share o f residential buildings in primary energy consumption in 2011 was 41%. C E N E f s estimate o f the overall residential energy consumption shows, that after a slight reduction it practically stabilized by 2003 at 15-16 mln. toe (22-23 mln. tee) and varies depending on the weather. Natural gas absolutely dominates (84%) in the consumption structure. [2.1, 2.2]
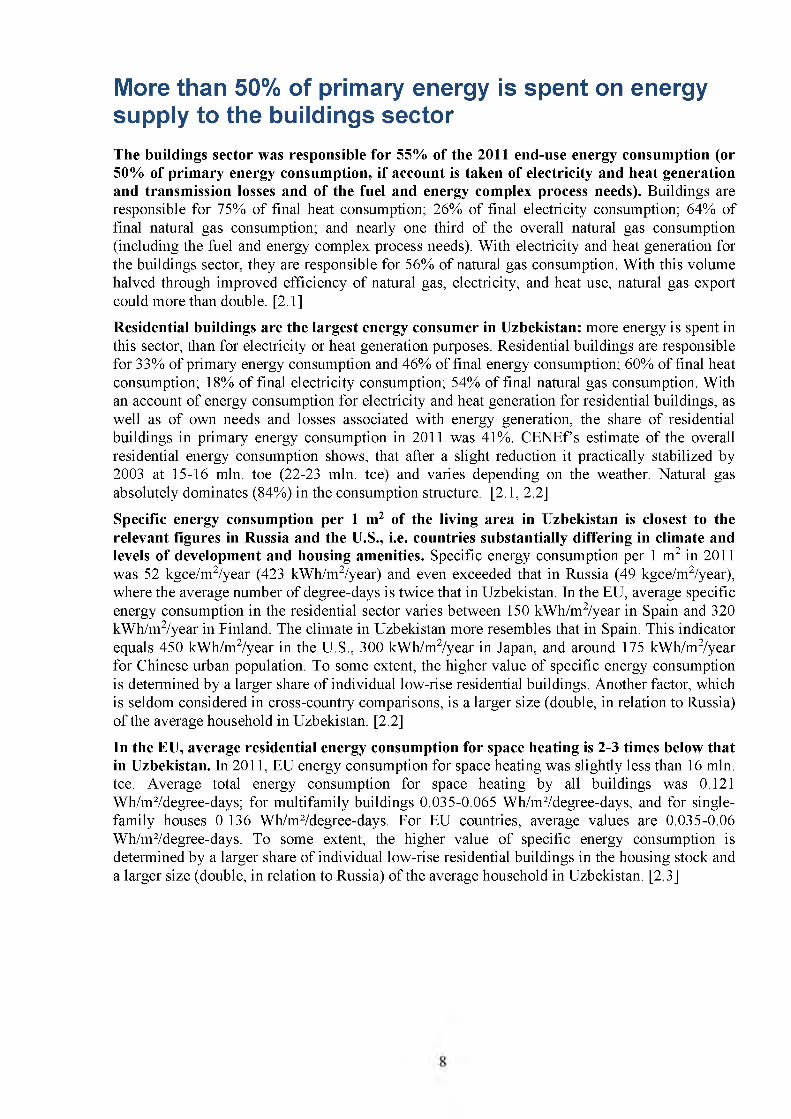
Specific energy consumption per 1 m2 of the living area in Uzbekistan is closest to the relevant figures in Russia and the U.S., i.e. countries substantially differing in climate and levels of development and housing amenities. Specific energy consumption per 1 m2 in 2011 was 52 kgce/m2/year (423 kW h/m2/year) and even exceeded that in Russia (49 kgce/m2/year), where the average number o f degree-days is twice that in Uzbekistan. In the EU, average specific energy consumption in the residential sector varies between 150 kW h/m2/year in Spain and 320 kW h/m2/year in Finland. The climate in Uzbekistan more resembles that in Spain. This indicator equals 450 kW h/m2/year in the U.S., 300 kW h/m2/year in Japan, and around 175 kW h/m2/year for Chinese urban population. To some extent, the higher value o f specific energy consumption is determined by a larger share o f individual low-rise residential buildings. Another factor, which is seldom considered in cross-country comparisons, is a larger size (double, in relation to Russia) o f the average household in Uzbekistan. [2.2]
In the EU, average residential energy consumption for space heating is 2-3 times below that in Uzbekistan. In 2011, EU energy consumption for space heating was slightly less than 16 mln. tee. Average total energy consumption for space heating by all buildings was 0.121 W h/m2/degree-days; for multifamily buildings 0.035-0.065 W h/m2/degree-days, and for singlefamily houses 0.136 W h/m2/degree-days. For EU countries, average values are 0.035-0.06 W h/m2/degree-days. To some extent, the higher value o f specific energy consumption is determined by a larger share o f individual low-rise residential buildings in the housing stock and a larger size (double, in relation to Russia) o f the average household in Uzbekistan. [2.3]
Figure 1 Evolution of specific residential energy consumption in Uzbekistan in 2000-2011
on
7П -
60 -
* ----
— А — * —50 -
-4 in♦ -
— * - — — * - — * -ш
- *
£ Ш"s 50 ■
‘РП -
1П - гI и
AU
1
Ооосм
ооCM
Spain
смоосм
с
сооосм
оосм
inland
LOОосм
<£>Оосм
h-оосм
Jzbekis
СОоосм
itan
о>оосм
1 1 О ч-о о см см
Russia
Source: C EN Ef s estimates
Two thirds of residential energy consumption is related to space heating. Heat for this purpose is primarily generated from natural gas. A large part o f natural gas is also used for domestic hot water supply and cooking. The share o f energy consumed by lighting and appliances is relatively small: around 4%. Energy consumption by DHW, cooking and appliances is growing up. [2.2]
Since the share of residential buildings that have access to district heat is relatively low(13% of the overall floor space), specific energy consumption to a large degree depends on the efficiency o f space heating equipment used. In Uzbekistan, this efficiency is around 75% for gas- fired systems and 55-60% for space heating using other fuels. Average efficiency o f district heating boilers is only 68%. W ith an account o f 15% or higher distribution losses, it does not make sense to go on with district heating in zones with low heat load densities. Even if gas- fired district heat boilers are replaced with more efficient models, and individual consumers are equipped with condensing boilers, the above finding is still correct. [2.3]
Energy saving potential in residential space heating, based on comparative analysis, is 8-13 mln. tee (51-83% of the 2011 energy consumption for this purpose). This estimate was obtained both through a cross-country analysis and based on the analysis of random audits data. There is a substantial energy saving potential in space heating and DHW. It is singlefamily individual houses that are responsible for the major gap in space heating efficiency. [2.3]
A more careful estimate of the technical energy saving potential in the residential sector with all houses brought in compliance with the KM K 2.01.18-00* “Pre-determined levels of energy consumption for space heating, ventilation, and air conditioning in buildings and facilities” is 13.8 mln. tee (61% of the 2011 consumption), and with all houses brought in compliance with the passive buildings requirements it is 17.6 mln. tee (77% of the 2011 consumption). The economic energy saving potential was estimated based on the incremental costs and using natural gas export price as an opportunity cost and equals 13.8 and 14.9 mln. tee respectively. The market energy saving potential was estimated based on the incremental costs and 12% discount rate by two methods at 0.3 and 4.1 mln. tee, and with more stringent households’ and HOA requirements to the energy efficiency investment paybacks and 33% discount rate it does not exceed 0.5 mln. tee. [4.2]
9
Cheap energy resources are the basic reason for the relatively low market energy savingpotential in Uzbekistan. It is hardly possible to raise energy prices without going beyond the residential energy affordability thresholds. Since the economic energy saving potential is quite substantial, introduction of subsidies for energy efficiency improvements in buildings is animportant tool for implementing this potential until 2020, bringing significant additional natural gas export revenues. [4.2]
Since 2000, “Pre-determined levels of energy consumption for space heating, ventilation, and air conditioning in buildings and facilities” KM K 2.01.18-00* have been developed, adopted, and enacted in Uzbekistan. Under the UNDP/GEF project in the recent years (basically, in 2011) 10 key building codes were revised. According to the revised building codes, energy consumption for space heating declined by 30-40% from the previous level. Even in the developed countries the building codes requirements are not always met. It is not clear, to what extent these requirements are met in individual housing construction, which dominates in the country. However, average energy consumption for space heating in single-family houses dropped by 17% in 2000-2011 (fewer degree-days o f the heating season). This drop was partially determined by the weather factor, but the leading role was played by energy efficiency improvements induced by the building codes that were enforced in 2000 and by weatherization measures taken by households (installation o f glass units); these two latter factors contributed around 14% to the space heating energy consumption decline. [2.3]
Audits of single-family houses built under the standard construction in rural areas programme showed, that specific energy consumption by such houses is high. This is determined both by poor quality installation o f the heating systems and windows and by the lack o f thermal performance requirements in the buildings design. If all single-family buildings are replaced with passive houses, energy savings would amount to 12.7 mln. tee, or 55% of the overall residential energy consumption and 18.6% of primary energy consumption in 2011. [2.4.2]
Public and commercial buildings are responsible for around 10% of final energy consumption. These basically include 1- and 2-storey buildings with 204-450 kW h/m2/year specific energy consumption for space heating. As shown by the preliminary estimates o f benefits obtained through the UNDP/GEF pilot project on energy efficiency improvement in public buildings, savings brought by already implemented measures may amount to 50-65%. The technical energy saving potential in public and commercial buildings may be estimated at 2.4-2.9 mln. tee (70-84% of the 2011 consumption), and the potential o f fuel substitution with renewable energy is nearly 0.5 mln. tee. [2.11]
Heat supply systems of the Uzbekistan Republic are worn and inefficientThe Uzbekistan Republic does not develop heat balances, which makes it difficult to assess the shape of heat supply systems. Natural gas is the major fuel used by thermal power plants and boiler-houses. W ear o f basic and auxiliary energy equipment o f Uzbekistani boiler-houses is approximately 70%. Therefore, the efficiency o f most boilers is 68-75% on average. [3.1]
Around 31% of heating networks are dilapidated. The length o f heating networks has been declining since 1997. Poor maintenance is the reason why nearly 30% of pipes have no insulation. Poor shape o f in-house networks determines large network water leakages. Heat losses are estimated at 27.6% of the total heat generation. The current frequency o f accidents and emergencies in the heating networks 5-10 times exceeds the relevant values in large Russian cities. [3.3]
10
A set of mathematical models was used for energy consumption projections in the buildings sectorEnergy efficiency policy implementation perspectives in the Uzbekistani buildings sector were assessed using two mathematical models. The first model (RES-UZ) relates to residential energy consumption and includes the following blocks: energy consumption for residential space heating; energy consumption for DHW supply; energy consumption for cooking; energy consumption by appliances; and economic growth and housing commissioning. Since no longterm projections until 2050 or even 2020 are available in Uzbekistan, another model was used for the projections o f GDP growth, investments, investments in the housing construction, and new housing commissioning. Besides, a Comparison Model was developed to compare potential development options and to assess costs and benefits o f various scenarios. [A pp.l]
In order to implement the energy saving potential, it is important to pass the dense rock of energy efficiency barriersAll barriers to energy efficiency improvements can be categorized by 4 large groups: lack of incentives; lack of information; lack of financial resources and “long-term money”; and lack of organization and coordination. There used to be another group o f barriers, lack of technologies. These barriers are o f a very different origin: related to prices and financing; to economy and market structure and organization; institutional, social, cultural, behavioral barriers, etc. Nearly all o f them are removable through energy efficiency policy measures. Technological barriers include lack o f design skills, lack o f materials and technologies, and lack o f experience in operating energy efficient buildings. Another technological barrier is caused by lack o f monitoring and assessing during the process o f construction or renovation. In buildings construction, a motivation gap (a principal - agent problem) is an important barrier to energy efficiency. Also important are such barriers as uncertainty; initial cost o f equipment and construction; a large share o f poor families; small size o f projects; low and subsidized energy prices for residential consumers; low payment discipline; risk perception; poor statistics on residential buildings; lack o f municipal utility consumers’ awareness and trust; lack o f energy efficiency policies and relevant funds; and lack o f qualified personnel. [5]
Energy efficiency activities in the Uzbekistani buildings sector have been spurred in the recent years, yet... there is much to doEnergy efficiency and renewable energy regulatory framework is being eventually developed. Under the UNDP/GEF project and in cooperation with three national design institutions 10 building codes have been revised and are expected to lead to at least 25% reduction o f specific energy consumption both in renovated and new buildings. However, energy efficiency policies implemented in Uzbekistan just to a small degree comply with the IEA recommendations. [6.1, 6.2]
A large experience in implementing energy efficiency policies in buildings has been accumulated by many countries in the recent 40 years, and this experience can be applied in Uzbekistan. The major policies include: energy efficiency requirements in the building codes; mandatory standards for the energy efficiency o f appliances; buildings and equipment certification and labeling; federal procurement o f only efficient buildings and equipment; energy
11
service contracts; energy efficiency improvement by utilities through integrated resource planning, demand management, white certificates and energy efficiency resource standards; energy service financing; preferential loan programs, including preferential mortgage schemes for energy efficient buildings and “green” buildings; federal subsidies; tax benefits; public- private partnerships in the development and market penetration o f new technologies; housing stock inventory and improvement o f statistics; energy audits; information campaigns. [6.2]
Baseline scenarioBy 2050, the housing stock will have grown up to 949-987 mln. m2, whereas housing per capita to approximately 26 m2 per person. The assumption is that in 2014-2050 the share of multifamily buildings in the overall commissioned housing will be 2%. Housing stock amenities will substantially improve by 2050. It is assumed, that the requirements o f KMK 2.01.18-2000* “Pre-determined energy consumption for space heating, ventilation, and air conditioning of buildings and facilities” set forth in 2011 will not be revised until 2050, and the requirements of KMK 2.01.18-2000* are only related to the new construction. Residential income growth leads to a substantial increase o f appliances per household, while the efficiency o f appliances will demonstrate only inertial growth. It is assumed that the quality o f energy supply will be improving. In the baseline scenario the assumption is made that the share o f renewable in the DHW production will not exceed 6.5% until 2050. [7.2.1.1]
In the baseline scenario, growing natural gas demand cuts the gas export potential by two thirds. This scenario does not help terminate residential energy consumption growth, despite the fact that by 2050 specific energy consumption in the residential sector nearly halves, and specific energy consumption by new houses drops below 20 kgce/m2 (163 kW h/m2). Residential energy demand increase in the baseline scenario is primarily determined by space heating needs o f the growing housing stock. Energy consumption for DHW and cooking grows up, then flattens and starts declining. Appliances and lighting show the most dynamic growth. Electricity consumption increase is nearly 10 bln. kWh, or around 20% of the 2011 electricity consumption. Natural gas dominates in the residential fuel balance throughout the whole period. Growing gas demand by two thirds cuts the gas export potential. In 2010-2050, energy consumption by public and commercial buildings grows up by 37%. [7.2.1.2, 7.2.2]
“Step into the future” scenario“Step into the XXI century” scenario suggests expansion of the KM K regulations through integrating energy efficiency requirements in comprehensive capital retrofits of existing buildings; and for new buildings it suggests integration o f sufficiency (buildings orientation, roof color, and other bioclimate parameters o f projects aimed at energy demand reduction), efficiency (requirements to buildings thermal performance and equipment efficiency), and supply from renewables (energy generation from renewable energy sources in buildings). New building codes in Europe require transition to zero energy buildings and energy plus buildings (Fig. 2).
12
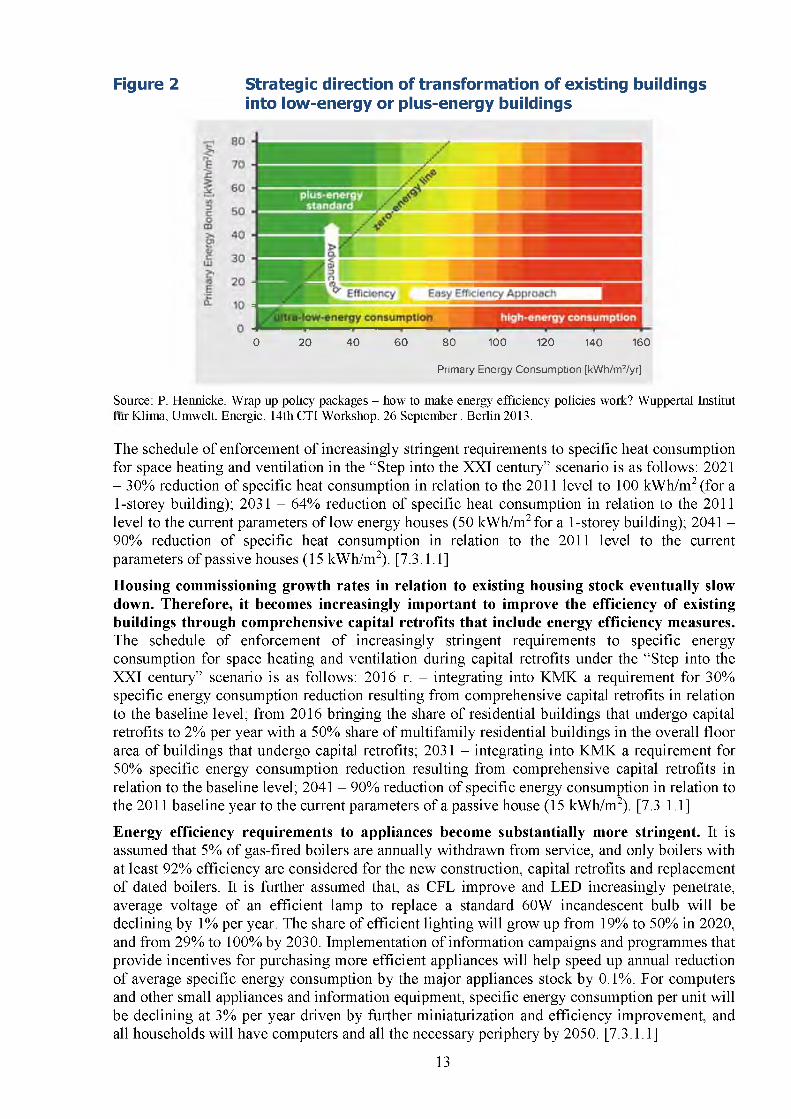
Figure 2 Strategic direction of transformation of existing buildingsinto low-energy or plus-energy buildings
0 20 40 60 80 100 120 140 160
Primary Energy Consumption [kWh/m2/yr]
Source: P. Hennicke. Wrap up policy packages - how to make energy efficiency policies work? Wuppertal Institut fur Klima, Umwelt, Energie. 14th CTI Workshop. 26 Septem ber. Berlin 2013.
The schedule o f enforcement o f increasingly stringent requirements to specific heat consumption for space heating and ventilation in the “ Step into the XXI century” scenario is as follows: 2021 - 30% reduction o f specific heat consumption in relation to the 2011 level to 100 kW h/m2 (for a 1-storey building); 2031 - 64% reduction o f specific heat consumption in relation to the 2011 level to the current parameters o f low energy houses (50 kW h/m2 for a 1-storey building); 2041 - 90% reduction o f specific heat consumption in relation to the 2011 level to the current parameters o f passive houses (15 kW h/m2). [7.3.1.1]
Housing commissioning growth rates in relation to existing housing stock eventually slow down. Therefore, it becomes increasingly important to improve the efficiency of existing buildings through comprehensive capital retrofits that include energy efficiency measures.The schedule o f enforcement o f increasingly stringent requirements to specific energy consumption for space heating and ventilation during capital retrofits under the “Step into the XXI century” scenario is as follows: 2016 r. - integrating into KMK a requirement for 30% specific energy consumption reduction resulting from comprehensive capital retrofits in relation to the baseline level; from 2016 bringing the share o f residential buildings that undergo capital retrofits to 2% per year with a 50% share o f multifamily residential buildings in the overall floor area o f buildings that undergo capital retrofits; 2031 - integrating into KMK a requirement for 50% specific energy consumption reduction resulting from comprehensive capital retrofits in relation to the baseline level; 2041 - 90% reduction o f specific energy consumption in relation to the 2011 baseline year to the current parameters o f a passive house (15 kW h/m2). [7.3.1.1]
Energy efficiency requirements to appliances become substantially more stringent. It isassumed that 5% of gas-fired boilers are annually withdrawn from service, and only boilers with at least 92% efficiency are considered for the new construction, capital retrofits and replacement o f dated boilers. It is further assumed that, as CFL improve and LED increasingly penetrate, average voltage o f an efficient lamp to replace a standard 60W incandescent bulb will be declining by 1% per year. The share o f efficient lighting will grow up from 19% to 50% in 2020, and from 29% to 100% by 2030. Implementation o f information campaigns and programmes that provide incentives for purchasing more efficient appliances will help speed up annual reduction o f average specific energy consumption by the major appliances stock by 0.1%. For computers and other small appliances and information equipment, specific energy consumption per unit will be declining at 3% per year driven by further miniaturization and efficiency improvement, and all households will have computers and all the necessary periphery by 2050. [7.3.1.1]
13
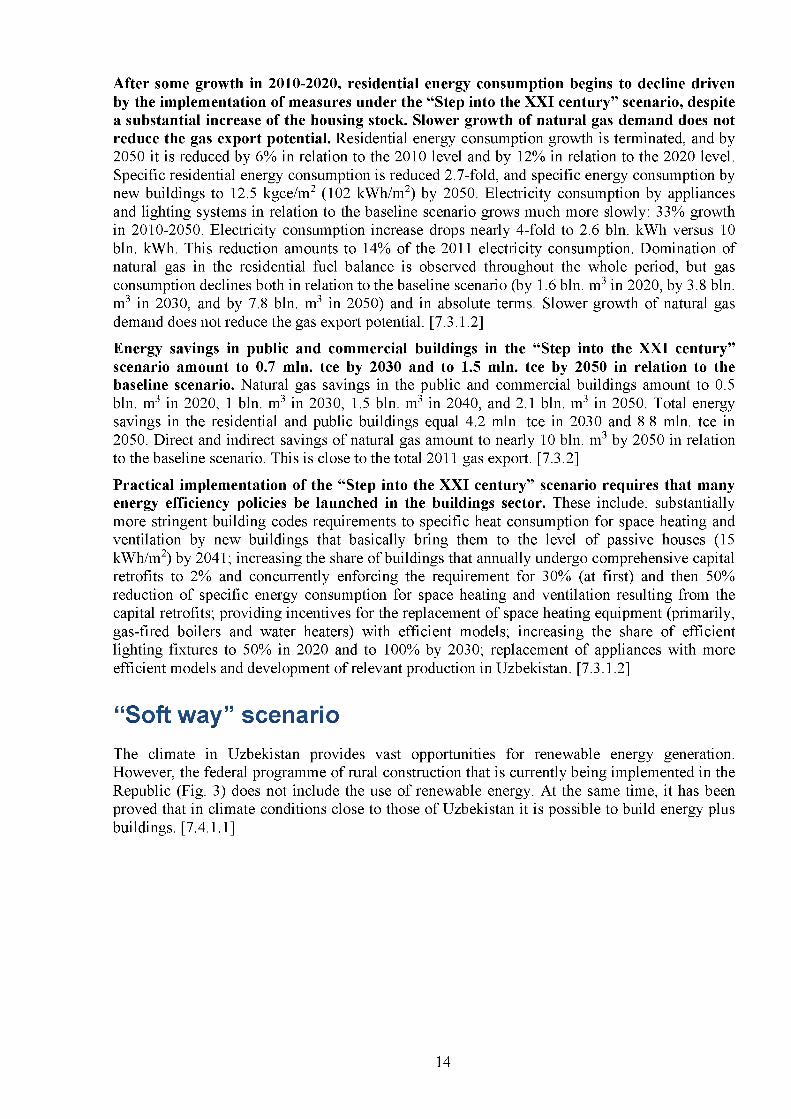
After some growth in 2010-2020, residential energy consumption begins to decline driven by the implementation of measures under the “Step into the XXI century” scenario, despite a substantial increase of the housing stock. Slower growth of natural gas demand does not reduce the gas export potential. Residential energy consumption growth is terminated, and by 2050 it is reduced by 6% in relation to the 2010 level and by 12% in relation to the 2020 level. Specific residential energy consumption is reduced 2.7-fold, and specific energy consumption by new buildings to 12.5 kgce/m2 (102 kW h/m2) by 2050. Electricity consumption by appliances and lighting systems in relation to the baseline scenario grows much more slowly: 33% growth in 2010-2050. Electricity consumption increase drops nearly 4-fold to 2.6 bln. kWh versus 10 bln. kWh. This reduction amounts to 14% of the 2011 electricity consumption. Domination of natural gas in the residential fuel balance is observed throughout the whole period, but gas consumption declines both in relation to the baseline scenario (by 1.6 bln. m3 in 2020, by 3.8 bln. m3 in 2030, and by 7.8 bln. m3 in 2050) and in absolute terms. Slower growth o f natural gas demand does not reduce the gas export potential. [7.3.1.2]
Energy savings in public and commercial buildings in the “Step into the XXI century” scenario amount to 0.7 mln. tee by 2030 and to 1.5 mln. tee by 2050 in relation to the baseline scenario. Natural gas savings in the public and commercial buildings amount to 0.5 bln. m3 in 2020, 1 bln. m3 in 2030, 1.5 bln. m3 in 2040, and 2.1 bln. m3 in 2050. Total energy savings in the residential and public buildings equal 4.2 mln. tee in 2030 and 8.8 mln. tee in 2050. Direct and indirect savings o f natural gas amount to nearly 10 bln. m3 by 2050 in relation to the baseline scenario. This is close to the total 2011 gas export. [7.3.2]
Practical implementation of the “Step into the XXI century” scenario requires that many energy efficiency policies be launched in the buildings sector. These include: substantially more stringent building codes requirements to specific heat consumption for space heating and ventilation by new buildings that basically bring them to the level o f passive houses (15 kW h/m2) by 2041; increasing the share o f buildings that annually undergo comprehensive capital retrofits to 2% and concurrently enforcing the requirement for 30% (at first) and then 50% reduction o f specific energy consumption for space heating and ventilation resulting from the capital retrofits; providing incentives for the replacement o f space heating equipment (primarily, gas-fired boilers and water heaters) with efficient models; increasing the share o f efficient lighting fixtures to 50% in 2020 and to 100% by 2030; replacement o f appliances with more efficient models and development o f relevant production in Uzbekistan. [7.3.1.2]
“Soft way” scenarioThe climate in Uzbekistan provides vast opportunities for renewable energy generation. However, the federal programme o f rural construction that is currently being implemented in the Republic (Fig. 3) does not include the use o f renewable energy. At the same time, it has been proved that in climate conditions close to those o f Uzbekistan it is possible to build energy plus buildings. [7.4.1.1]
14
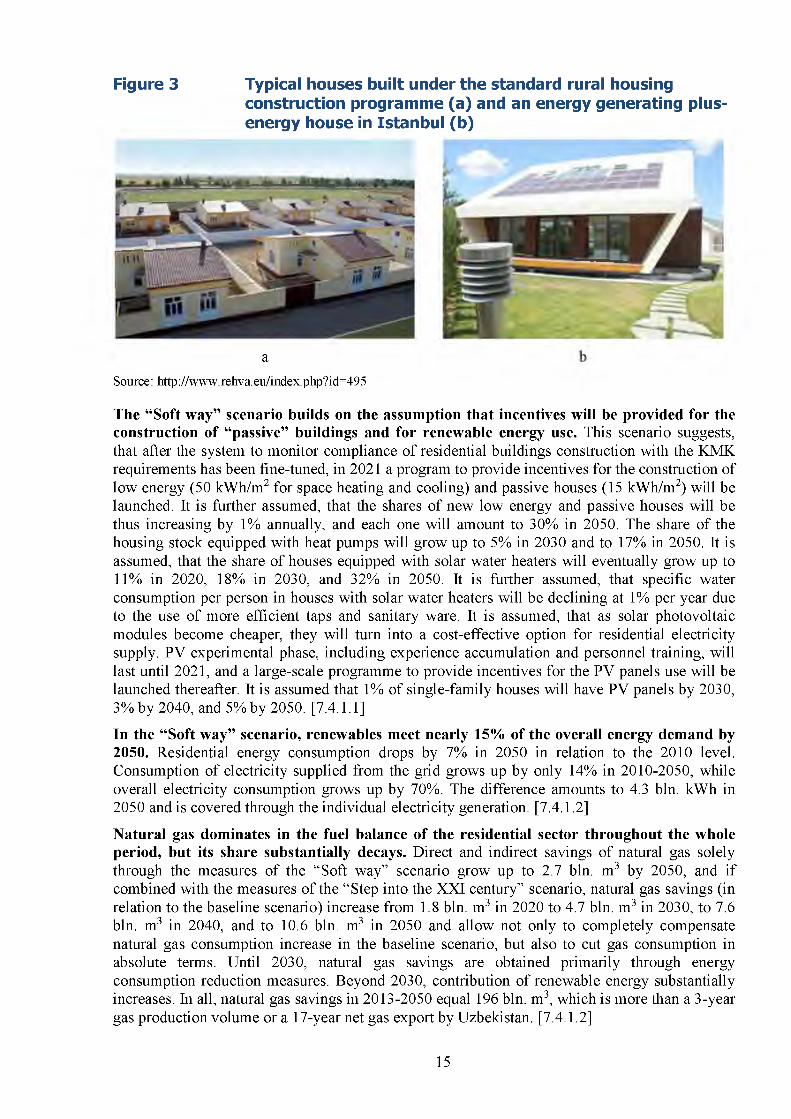
Figure 3 Typical houses built under the standard rural housing construction programme (a) and an energy generating plus- energy house in Istanbul (b)
a
Source: http://www.rehva.eu/index.php?id=495
The “Soft way” scenario builds on the assumption that incentives will be provided for the construction of “passive” buildings and for renewable energy use. This scenario suggests, that after the system to monitor compliance o f residential buildings construction with the KMK requirements has been fine-tuned, in 2021 a program to provide incentives for the construction of low energy (50 kW h/m2 for space heating and cooling) and passive houses (15 kW h/m2) will be launched. It is further assumed, that the shares o f new low energy and passive houses will be thus increasing by 1% annually, and each one will amount to 30% in 2050. The share o f the housing stock equipped with heat pumps will grow up to 5% in 2030 and to 17% in 2050. It is assumed, that the share o f houses equipped with solar water heaters will eventually grow up to 11% in 2020, 18% in 2030, and 32% in 2050. It is further assumed, that specific water consumption per person in houses with solar w ater heaters will be declining at 1% per year due to the use o f more efficient taps and sanitary ware. It is assumed, that as solar photovoltaic modules become cheaper, they will turn into a cost-effective option for residential electricity supply. PV experimental phase, including experience accumulation and personnel training, will last until 2021, and a large-scale programme to provide incentives for the PV panels use will be launched thereafter. It is assumed that 1% of single-family houses will have PV panels by 2030, 3% by 2040, and 5% by 2050. [7.4.1.1]
In the “Soft w ay” scenario, renewables meet nearly 15% of the overall energy demand by 2050. Residential energy consumption drops by 7% in 2050 in relation to the 2010 level. Consumption o f electricity supplied from the grid grows up by only 14% in 2010-2050, while overall electricity consumption grows up by 70%. The difference amounts to 4.3 bln. kW h in 2050 and is covered through the individual electricity generation. [7.4.1.2]
Natural gas dominates in the fuel balance of the residential sector throughout the whole period, but its share substantially decays. Direct and indirect savings o f natural gas solely through the measures o f the “ Soft way” scenario grow up to 2.7 bln. m 3 by 2050, and if combined with the measures o f the “ Step into the XXI century” scenario, natural gas savings (in relation to the baseline scenario) increase from 1.8 bln. m3 in 2020 to 4.7 bln. m 3 in 2030, to 7.6 bln. m3 in 2040, and to 10.6 bln. m3 in 2050 and allow not only to completely compensate natural gas consumption increase in the baseline scenario, but also to cut gas consumption in absolute terms. Until 2030, natural gas savings are obtained primarily through energy consumption reduction measures. Beyond 2030, contribution o f renewable energy substantially increases. In all, natural gas savings in 2013-2050 equal 196 bln. m 3, which is more than a 3-year gas production volume or a 17-year net gas export by Uzbekistan. [7.4.1.2]
15
According to the BP, proven reserves o f natural gas in Uzbekistan were 1.1 trillion m3 in 2012. Residential fuel supply alone amounts to 660 bln. m3 o f natural gas in 2013-2050, or to 770 bln. m3, if combined with fuel supply to the public and commercial sector. Another 310 bln. m3 of natural gas will be needed over these years for electricity and heat generation for the buildings sector. At least 300 bln. m3 reserves are needed, if gas production level is to be equal to gas consumption by buildings for at least another 10 years. Therefore, buildings energy demand in 2013-2050 is 1.1 trillion m3, and even more than that beyond 2050. [9.2]
Measures of the “Soft w ay” scenario do not bring any noticeable additional energy savings in commercial buildings, but they bring additional natural gas savings. By 2050, nearly 17% o f the whole commercial energy demand will be met through distributed renewable energy. Direct natural gas consumption shows substantial decline: by 60% in 2050 in relation to the baseline scenario. In all, natural gas savings in 2013-2050 in relation to the baseline scenario are 50.6 bln. m 3. Grid electricity consumption grows up only by 14%. Heat consumption drops by 15%. [7.4.2]
Implementation of the “Soft way” scenario requires that many policies to provide incentives for renewable energy development be launched in 2021 at the latest, including: incentives for the use o f heat pumps so as to increase the share o f single-family houses equipped with heat pumps to 5% in 2030 and to 17% in 2050; incentives for the use o f solar w ater heaters so as to increase the share o f single-family houses equipped with solar water heaters to 11% in 2020, to 18% in 2030, and to 32% in 2050; incentives for the use o f PV panels so as to increase the share o f single-family houses equipped with PV panels to 1% in 2030, 3% in 2040, and 5% in 2050. [7.4.1.2]
Costs and social and economic benefitsAdditional costs in the “Step into the XXI century” scenario in 2014-2050 equal USD 27 bln.1 in the 2013 prices, and in the “Soft w ay” scenario another USD 11 bln. in the 2013 prices, totaling to USD 38 bln. in the 2013 prices. The costs o f housing construction, retrofits and equipment show 20% growth by 2020, 37% growth by 2030, and 53% growth by 2050. M easures o f the “ Step into the XXI century” scenario add 18% to these costs by 2020, 27% by 2030, and 35% by 2050. Revenues obtained through the export o f gas savings (attained in the residential sector alone) are much above these costs and amount to USD 57 bln. in 2014-2050 in the 2013 prices (or USD 95 bln., with gas export prices growing at a rate 2% above the inflation rate). The revenues are above the costs throughout the whole period o f 2014-2050 (Fig. 4). M onetization o f the additional effects will substantially (by 30-70%) increase the estimated economic effect. [9.4]
Reduction of natural gas consumption through improved gas efficiency in buildings becomes an important means of maintaining the natural gas export potential. In all, natural gas savings in the residential sector will amount to 246 bln. m3 in 2013-2050, which equals a 4-year gas production volume or a 21-year net gas export by Uzbekistan. Natural gas savings obtained through the measures o f the “ Step into the XXI century” and “ Soft way” scenarios set free for export 2.1 bln. m3 in 2020, 4.9 bln. m3 in 2030, 7.4 bln. m 3 in 2040, and 10 bln. m3 in 2050. Until 2030, natural gas savings are obtained primarily through energy consumption reduction measures. Beyond 2030, contribution o f renewable energy substantially increases. [9.2]
1 Hereinafter estimates are provided in U.S. dollars.
16
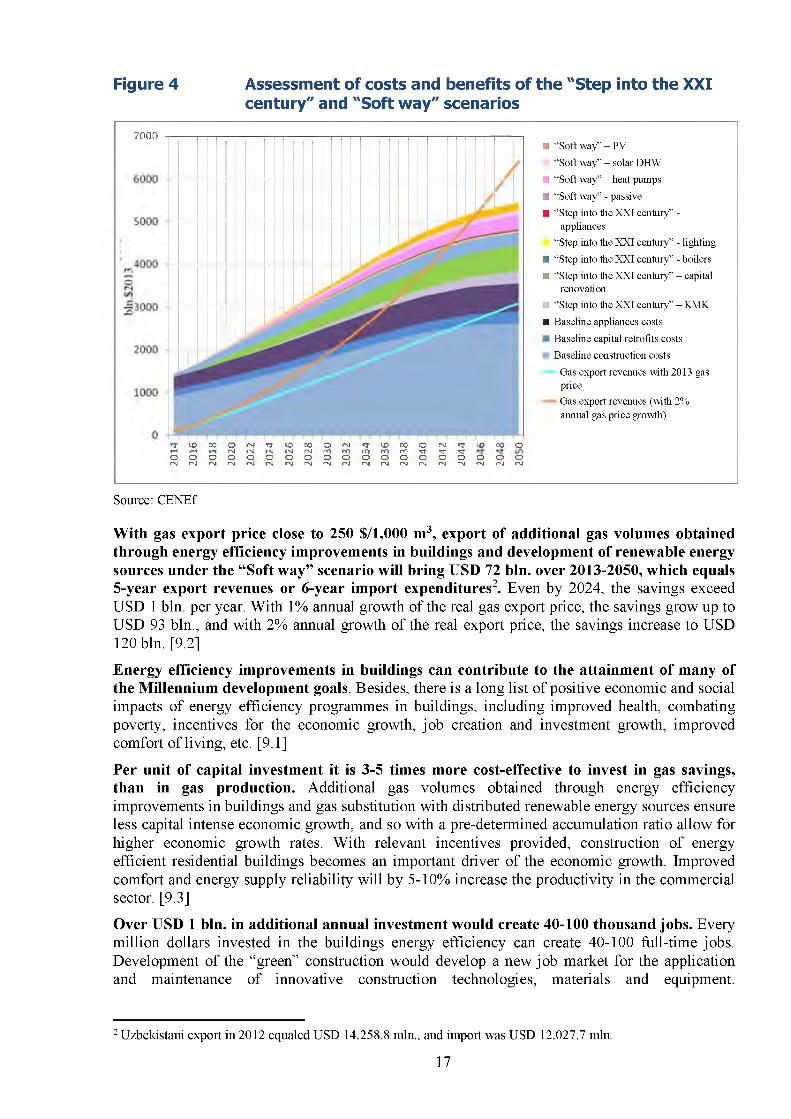
Figure 4 Assessment of costs and benefits of the "Step into the XXI century" and "Soft way" scenarios
7000■ “Soft way” - PV
“Soft way” - solar DHW
■ “Soft way” - heat pumps
■ “Soft way” - passive
■ “Step into the XXI century” -appliances
“Step into the XXI century” - lighting
■ “Step into the XXI century” - boilers
■ “Step into the XXI century” - capitalrenovation
■ “Step into the XXI century” - KMK
■ Baseline appliances costs
Baseline capital retrofits costs
Baseline construction costs
Gas export revenues with 2013 gas priceGas export revenues (with 2% annual gas price growth)
n f v O O O O o j ^ J - l O O O O r s l n J ^ O O O O r s l ^ f l O O O O г н г н г н г м г д г д г ^ г ч г о г о г о г о г о ^ ^ ^ O O O O O O O O O O O O O O O O O O O г * д г м г м г м г ч 1 г м г м г м г ч | г м г ч | г м г м г м г ч | г м с м г д г ч |
Source: CENEf
W ith gas export price close to 250 $/1,000 m3, export of additional gas volumes obtained through energy efficiency improvements in buildings and development of renewable energy sources under the “Soft w ay” scenario will bring USD 72 bln. over 2013-2050, which equals 5-year export revenues or 6-year import expenditures2. Even by 2024, the savings exceed USD 1 bln. per year. W ith 1% annual growth o f the real gas export price, the savings grow up to USD 93 bln., and with 2% annual growth o f the real export price, the savings increase to USD 120 bln. [9.2]
Energy efficiency improvements in buildings can contribute to the attainment of many of the Millennium development goals. Besides, there is a long list o f positive economic and social impacts o f energy efficiency programmes in buildings, including improved health, combating poverty, incentives for the economic growth, job creation and investment growth, improved comfort o f living, etc. [9.1]
Per unit of capital investment it is 3-5 times more cost-effective to invest in gas savings, than in gas production. Additional gas volumes obtained through energy efficiency improvements in buildings and gas substitution with distributed renewable energy sources ensure less capital intense economic growth, and so with a pre-determined accumulation ratio allow for higher economic growth rates. W ith relevant incentives provided, construction o f energy efficient residential buildings becomes an important driver o f the economic growth. Improved comfort and energy supply reliability will by 5-10% increase the productivity in the commercial sector. [9.3]
Over USD 1 bln. in additional annual investment would create 40-100 thousand jobs. Every million dollars invested in the buildings energy efficiency can create 40-100 full-time jobs. Development o f the “green” construction would develop a new job market for the application and maintenance o f innovative construction technologies, materials and equipment.
2 Uzbekistani export in 2012 equaled USD 14,258.8 mln., and import was USD 12,027.7 mln.
17
M anufacturing all o f them domestically would help reduce import expenditures and spur industrial and commercial development. [9.5]
Implementation of the projects integrated into the “Step into the XXI century” and “Soft w ay” scenarios will increase the share of individual incomes spent on the housing purchase and reduce the share of incomes spent on housing energy bills. Passive houses construction experience demonstrates, that additional costs are hardly above 10-30% of normal construction costs but allow for 70-80% reduction o f energy consumption. [9.4]
Residential energy supply costs in relation to the baseline scenario show 12% drop by 2020, 28% drop by 2030, 40% drop by 2040, and 50% drop by 2050. Residential energy supply cost savings in 2013-2050 will amount to USD 24 bln. (in the 2013 prices, November 2013 exchange rate). The proposed measures will allow it for residential consumers to keep within the energy affordability thresholds. Assistance provided by the state to low-income families in getting or purchasing low energy or plus energy housing will completely eliminate the need for subsidies required to eradicate the “energy poverty” . Reduction o f sickness cases that relate to low comfort leads to reduced sickness-related income losses and medical expenses, which is exceptionally important for low-income families. [9.6]
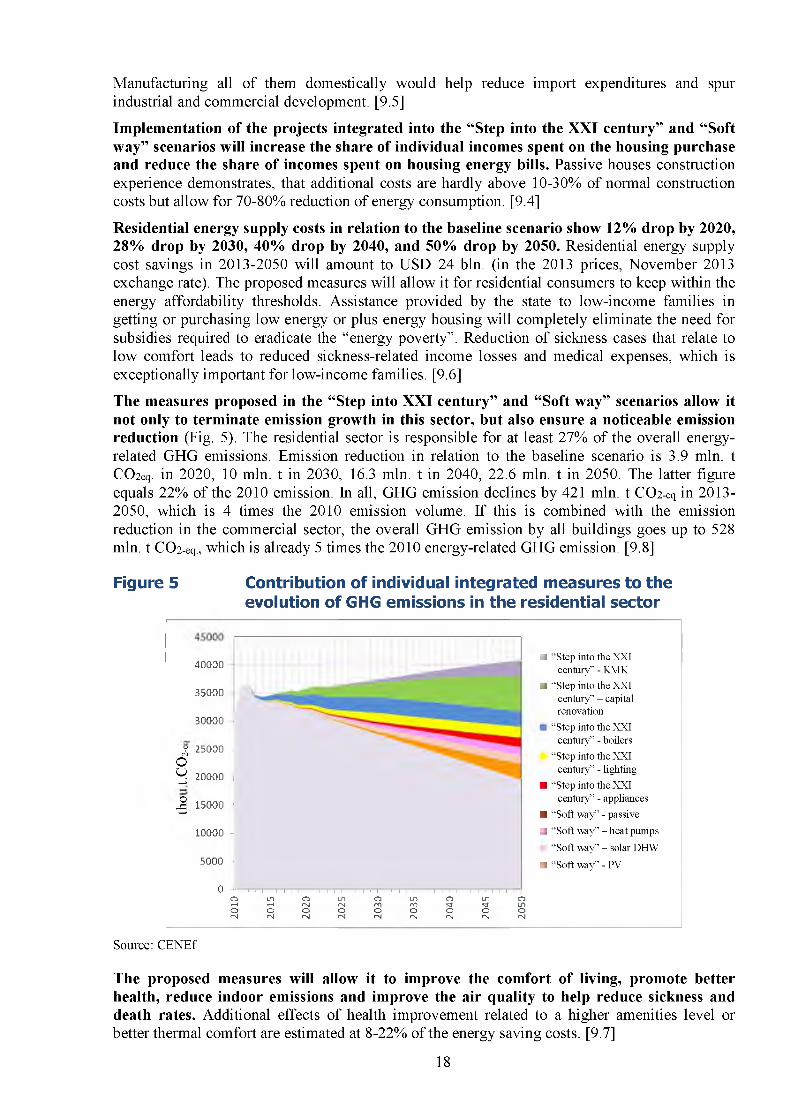
The measures proposed in the “Step into XXI century” and “Soft w ay” scenarios allow it not only to terminate emission growth in this sector, but also ensure a noticeable emission reduction (Fig. 5). The residential sector is responsible for at least 27% of the overall energy- related GHG emissions. Emission reduction in relation to the baseline scenario is 3.9 mln. t CC>2eq. in 2020, 10 mln. t in 2030, 16.3 mln. t in 2040, 22.6 mln. t in 2050. The latter figure equals 22% of the 2010 emission. In all, GHG emission declines by 421 mln. t СОг-eq in 2013- 2050, which is 4 times the 2010 emission volume. If this is combined with the emission reduction in the commercial sector, the overall GHG emission by all buildings goes up to 528 mln. t СОг-eq., which is already 5 times the 2010 energy-related GHG emission. [9.8]
Figure 5 Contribution of individual integrated measures to the evolution of GHG emissions in the residential sector
■ “Step into the XXIcentury” - KMK
■ “Step into the XXIcentury” - capital renovation
“Step into the XXI century” - boilers
“Step into the XXI century” - lighting
■ “Step into the XXIcentury” - appliances
■ “Soft way” - passive
■ “Soft way” - heat pumps
“Soft way” - solar DHW
■ “Soft way” - PV
O L n O L n O L O O L n Oг Н ч - 1 Г ч 1 Г ч 1 Г О Г О ,̂ ^ Г 1 ЛO O O O O O O O Oo 4 r s | r M r s J r s | P 4 < N f > J r s |
Source: CENEf
The proposed measures will allow it to improve the comfort of living, promote better health, reduce indoor emissions and improve the air quality to help reduce sickness and death rates. Additional effects o f health improvement related to a higher amenities level or better thermal comfort are estimated at 8-22% of the energy saving costs. [9.7]
18
40000
35000
30000
V 25000<4o^ 20000 +->
Я 150004—*
10000 -
5000
0 I I i I i i Г i I I i I i i I i I I i I i i I i 1 I i i i i I i I I i i i i I
1. Residential stock shape and evolution
1.1. Residential stock evolution and structureIn 2012, residential stock o f the Uzbekistan Republic amounted to 450 mln m 2 In 2000-2012, it grew up by 19.5%, showing average annual growth o f slightly more than 9 mln m2 The share of private housing equaled 98.9%. The share o f urban housing, according to the statistics, was 53% (according to the M inistry o f Economics, only 31%), whereas o f rural housing 47%3.
As the individual construction developed, the share o f multifamily housing went down from 0.9% to 0.8% in 2000-2012, and the share o f multifamily housing floor area dropped from 17% in 2000 to 13% in 2012. As o f July 1, 2013, multifamily housing o f the Uzbekistan Republic included 31671 houses with the total o f 965,801 flats and 58.3 mln. m2 O f these, 9,596 houses with the total o f 25.7 mln. m 2 are located in Tashkent. In the recent years, annual construction rate is around 30-40 multifamily houses.
The share multifamily houses with 2 or 3 floors is 13.5%; 4 floors - 63.9%; 5 floors - 15.2%; 6- 8 floors - 0.7%; 9 floors - 6.3%; 10 or more floors - 0.5%. Therefore, 4 or 5 floor houses dominate in the structure o f the multifamily housing stock. Distribution o f the multifamily housing stock by the time o f construction is as follows: houses built before 1920 - 3%, in 1921- 1945 - 4%; in 1946-1970 - 28%; in 1971-1995 - 58%; in 1995-1999 - 3.9%; after 2000 - 3%. The share o f multifamily houses built before 1960 is only 10%.
Before 1996, i.e. prior to the enforcement o f the Uzbekistani Law “On the houseowners associations”, the multifamily housing stock was managed by federal housing operators. After this law was enforced, federal housing operators were eliminated, and houseowners associations took their place. In 2006, a restated Law “On the associations o f private houseowners” was enacted. At present, 92% of the overall number o f multifamily houses are managed by 5,026 associations o f private houseowners (APH), o f which 1,416 manage one multifamily house, 536 two houses, 480 three houses, 447 four houses, 631 five houses, and 1516 six or more houses. Associations o f private houseowners were set up for the purpose o f uniting, providing practical aid to, and protecting the interests of, housing stock operators in the face o f federal authorities, utilities, etc. As o f July 1, 2013, 63 associations were established.
The number o f individual houses is 4.08 mln with the overall floor area amounting to 392 mln m2 and average floor area to 96 m2 In the recent years individual houses have been erected with the average floor area o f 124 m2 Distribution o f individual buildings by the time o f construction is very different from that o f the multifamily housing: the share o f buildings erected before 1920 is 4%, in 1921-1945 - 6%; in 1946-1970 - 37%; in 1971-1995 - 25%; in 1995-1999 - 8%, and after 2000 - 20%.
In 2010, 32% o f houses were built o f sun-dried earth brick, 22% of burnt brick, 24% o f clay. Only 10% of the housing stock were large panel or reinforced concrete buildings4.
As o f January 1, 2013, population o f the Uzbekistan Republic was around 30 mln. people. Housing per capita grew up from 13.8 m2 in 2000 to 15.2 m2 in 2012.
3 Statistical book „Uzbekistan Housing Stock 2012“. Committee for Statistics of the Uzbekistan Republic.4 Ibid.
19
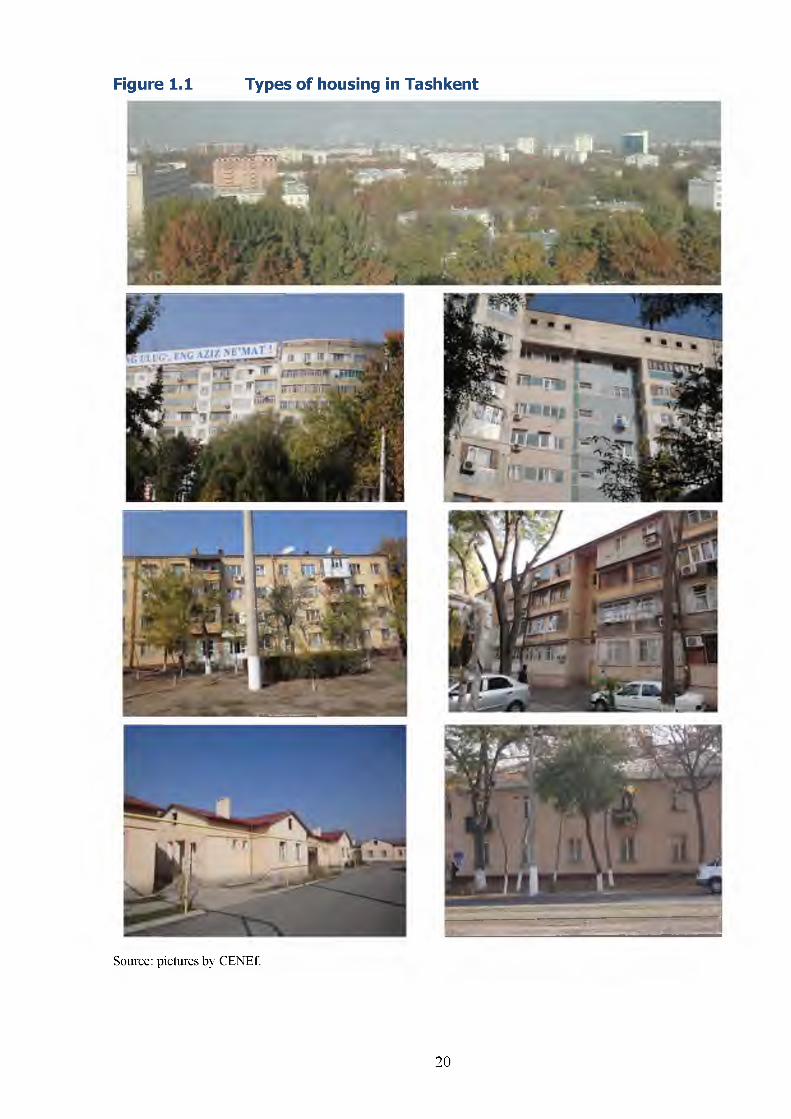
Figure 1.1 Types of housing in Tashkent
Source: pictures by CENEf.
20
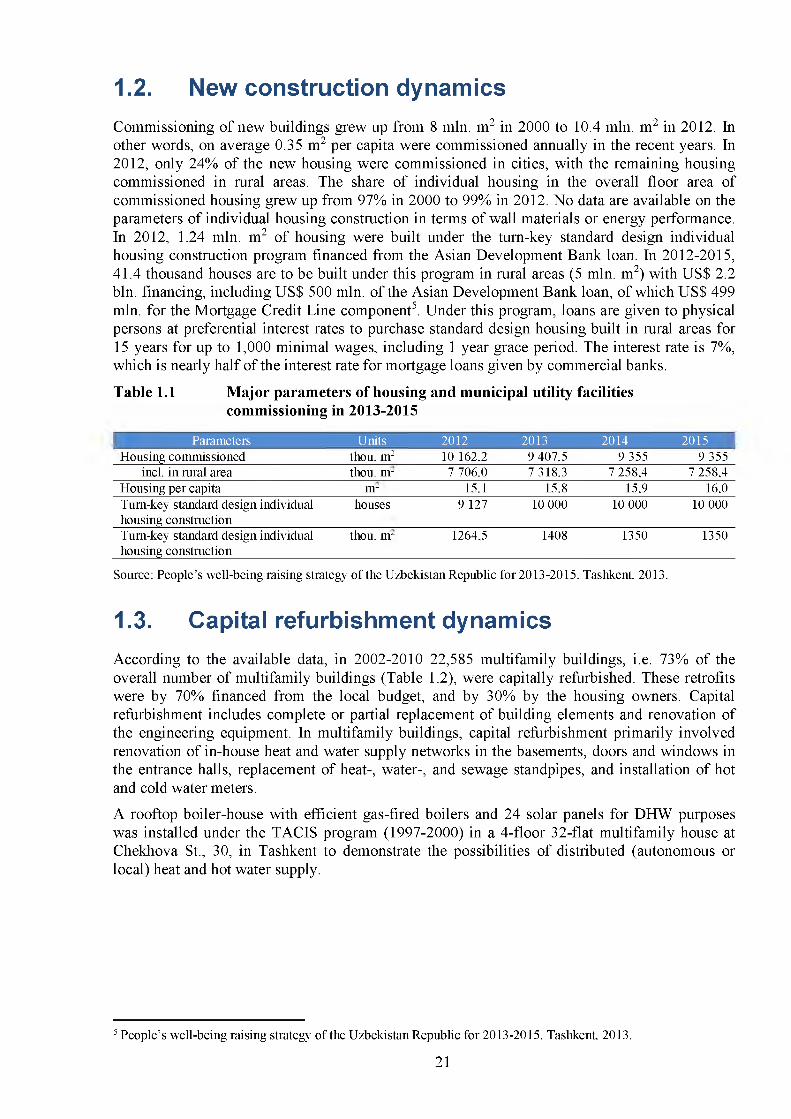
1.2. New construction dynamicsCommissioning o f new buildings grew up from 8 mln. m2 in 2000 to 10.4 mln. m 2 in 2012. In other words, on average 0.35 m2 per capita were commissioned annually in the recent years. In 2012, only 24% of the new housing were commissioned in cities, with the remaining housing commissioned in rural areas. The share o f individual housing in the overall floor area of commissioned housing grew up from 97% in 2000 to 99% in 2012. No data are available on the parameters o f individual housing construction in terms o f wall materials or energy performance. In 2012, 1.24 mln. m2 o f housing were built under the turn-key standard design individual housing construction program financed from the Asian Development Bank loan. In 2012-2015, 41.4 thousand houses are to be built under this program in rural areas (5 mln. m2) with US$ 2.2 bln. financing, including US$ 500 mln. o f the Asian Development Bank loan, o f which US$ 499 mln. for the Mortgage Credit Line component5. Under this program, loans are given to physical persons at preferential interest rates to purchase standard design housing built in rural areas for 15 years for up to 1,000 minimal wages, including 1 year grace period. The interest rate is 7%, which is nearly half o f the interest rate for mortgage loans given by commercial banks.
Table 1.1 M ajor parameters of housing and municipal utility facilitiescommissioning in 2013-2015
1 Parameters Units 2012 2013 2014 2015 1Housing commissioned thou, m2 10 162,2 9 407,5 9 355 9 355
incl. in rural area thou, n r 7 706,0 7 318,3 7 258,4 7 258,4Housing per capita n r 15,1 15,8 15,9 16,0Turn-key standard design individual housing construction
houses 9 127 10 000 10 000 10 000
Turn-key standard design individual housing construction
thou, n r 1264,5 1408 1350 1350
Source: People’s well-being raising strategy of the Uzbekistan Republic for 2013-2015. Tashkent 2013.
1.3. Capital refurbishment dynamicsAccording to the available data, in 2002-2010 22,585 multifamily buildings, i.e. 73% of the overall number o f multifamily buildings (Table 1.2), were capitally refurbished. These retrofits were by 70% financed from the local budget, and by 30% by the housing owners. Capital refurbishment includes complete or partial replacement o f building elements and renovation of the engineering equipment. In multifamily buildings, capital refurbishment primarily involved renovation o f in-house heat and water supply networks in the basements, doors and windows in the entrance halls, replacement o f heat-, water-, and sewage standpipes, and installation o f hot and cold w ater meters.
A rooftop boiler-house with efficient gas-fired boilers and 24 solar panels for DHW purposes was installed under the TACIS program (1997-2000) in a 4-floor 32-flat multifamily house at Chekhova St., 30, in Tashkent to demonstrate the possibilities o f distributed (autonomous or local) heat and hot w ater supply.
5 People’s well-being raising strategy of the Uzbekistan Republic for 2013-2015. Tashkent 2013.
21
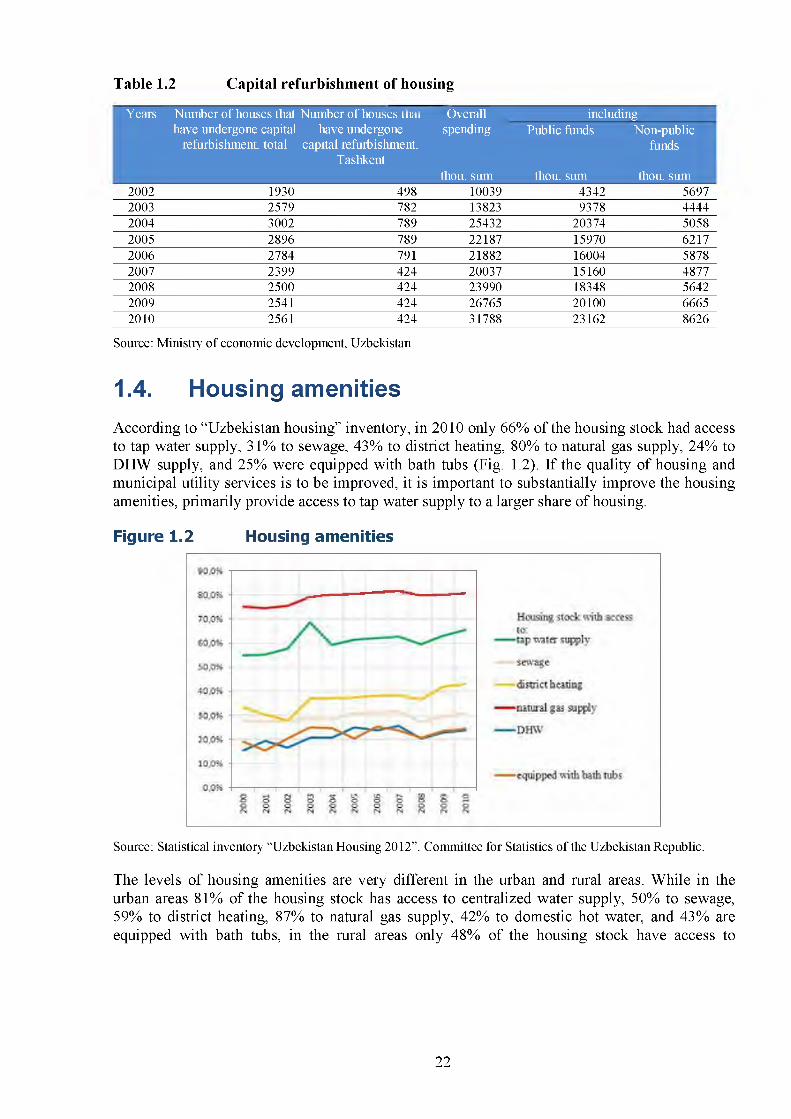
Table 1.2 Capital refurbishment of housing
Years Number of houses that have undergone capital
refurbishment, total
Number of houses that have undergone
capital refurbishment, Tashkent
Overallspending
thou, sum
including Public funds Non-public
funds
thou, sum thou, sum2002 1930 498 10039 4342 56972003 2579 782 13823 9378 44442004 3002 789 25432 20374 50582005 2896 789 22187 15970 62172006 2784 791 21882 16004 58782007 2399 424 20037 15160 48772008 2500 424 23990 18348 56422009 2541 424 26765 20100 66652010 2561 424 31788 23162 8626
Source: Ministry o f economic development, Uzbekistan
1.4. Housing amenitiesAccording to “Uzbekistan housing” inventory, in 2010 only 66% of the housing stock had access to tap water supply, 31% to sewage, 43% to district heating, 80% to natural gas supply, 24% to DHW supply, and 25% were equipped with bath tubs (Fig. 1.2). If the quality o f housing and municipal utility services is to be improved, it is important to substantially improve the housing amenities, primarily provide access to tap water supply to a larger share o f housing.
Figure 1.2 Housing amenities
Source: Statistical inventory “Uzbekistan Housing 2012”. Committee for Statistics of the Uzbekistan Republic.
The levels o f housing amenities are very different in the urban and rural areas. W hile in the urban areas 81% of the housing stock has access to centralized water supply, 50% to sewage, 59% to district heating, 87% to natural gas supply, 42% to domestic hot water, and 43% are equipped with bath tubs, in the rural areas only 48% of the housing stock have access to
22
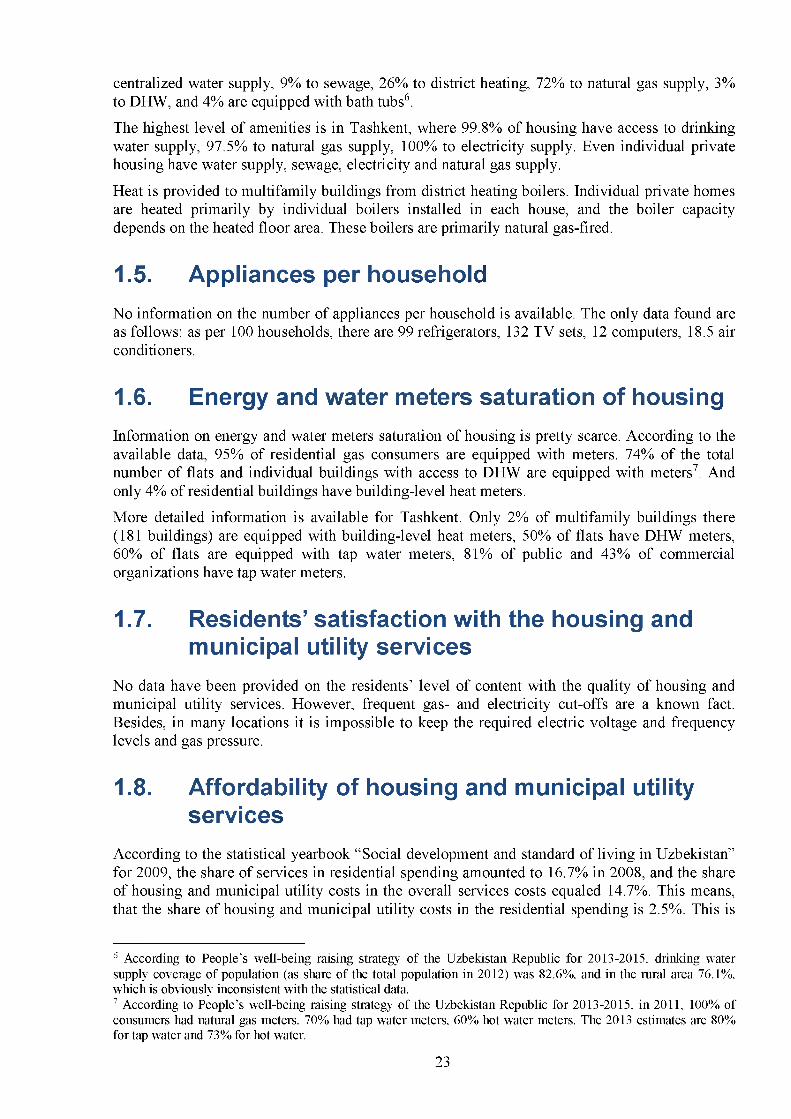
centralized water supply, 9% to sewage, 26% to district heating, 72% to natural gas supply, 3% to DHW, and 4% are equipped with bath tubs6.
The highest level o f amenities is in Tashkent, where 99.8% of housing have access to drinking w ater supply, 97.5% to natural gas supply, 100% to electricity supply. Even individual private housing have water supply, sewage, electricity and natural gas supply.
Heat is provided to multifamily buildings from district heating boilers. Individual private homes are heated primarily by individual boilers installed in each house, and the boiler capacity depends on the heated floor area. These boilers are primarily natural gas-fired.
1.5. Appliances per householdNo information on the number o f appliances per household is available. The only data found are as follows: as per 100 households, there are 99 refrigerators, 132 TV sets, 12 computers, 18.5 air conditioners.
1.6. Energy and water meters saturation of housingInformation on energy and water meters saturation o f housing is pretty scarce. According to the available data, 95% of residential gas consumers are equipped with meters. 74% of the total number o f flats and individual buildings with access to DHW are equipped with meters7. And only 4% of residential buildings have building-level heat meters.
M ore detailed information is available for Tashkent. Only 2% of multifamily buildings there (181 buildings) are equipped with building-level heat meters, 50% of flats have DHW meters, 60% of flats are equipped with tap w ater meters, 81% of public and 43% of commercial organizations have tap w ater meters.
1.7. Residents’ satisfaction with the housing and municipal utility services
N o data have been provided on the residents’ level o f content with the quality o f housing and municipal utility services. However, frequent gas- and electricity cut-offs are a known fact. Besides, in many locations it is impossible to keep the required electric voltage and frequency levels and gas pressure.
1.8. Affordability of housing and municipal utility services
According to the statistical yearbook “ Social development and standard o f living in Uzbekistan” for 2009, the share o f services in residential spending amounted to 16.7% in 2008, and the share o f housing and municipal utility costs in the overall services costs equaled 14.7%. This means, that the share o f housing and municipal utility costs in the residential spending is 2.5%. This is
6 According to People’s well-being raising strategy of the Uzbekistan Republic for 2013-2015, drinking water supply coverage of population (as share of the total population in 2012) was 82.6%, and in the rural area 76.1%, which is obviously inconsistent with the statistical data.7 According to People’s well-being raising strategy of the Uzbekistan Republic for 2013-2015, in 2011, 100% of consumers had natural gas meters, 70% had tap water meters, 60% hot water meters. The 2013 estimates are 80% for tap water and 73% for hot water.
23
not a large share. For the sake o f comparison: in 2012 in Russia it was 10%. However, with an account o f the low level amenities and the high share o f individual housing, these data might not include the entire residential spending on the housing maintenance and water- and electricity supply.
According to the M inistry o f Economy, a typical family in Tashkent consisting o f 6 people, including 2 retirees, 2 working people and 2 dependents, having an average monthly income of around 1,800 sum, living in a 3-room flat with 45m2 living area, spends 2% of the overall household income for space heating alone with the 705.42 sum/m2 tariff. W ith gas-, electricity-, and DHW costs included, the share o f energy supply costs alone in the household income exceeds 3.5%.
According to the “Uzbekistan in figures” inventory, overall personal incomes in 2011 amounted to 62,716 billion sum. Let us assume that by 2013 they grew up by 45% to reach 91,000 billion sum. The price o f natural gas for residential consumers is 151 sum/m3 (Table 1.3), annual gas consumption is around 17 billion m3. Thereby gas costs equal 2,567 billion sum, or 2.8% of overall personal incomes. Proceeding with this evaluation to account for the 2013 tariffs (Table 1.3), water supply spending equals 4,294 billion sum, heat supply 609 billion sum, electricity 940 billion sum. The overall spending, net o f the housing maintenance costs, equals 8,410 billion sum, or 9.2% of actual overall personal incomes. W ith the sewage and housing costs included, the share o f housing and municipal utility costs exceeds 10% o f the overall personal incomes8, and the share o f residential energy supply costs exceeds 4.5% thereof (and with an account o f liquefied gas, wood fuel and kerosene, maybe even 5%) and goes beyond the affordability threshold. Residential energy and w ater prices in Uzbekistan are about 3 times lower than in Russia.
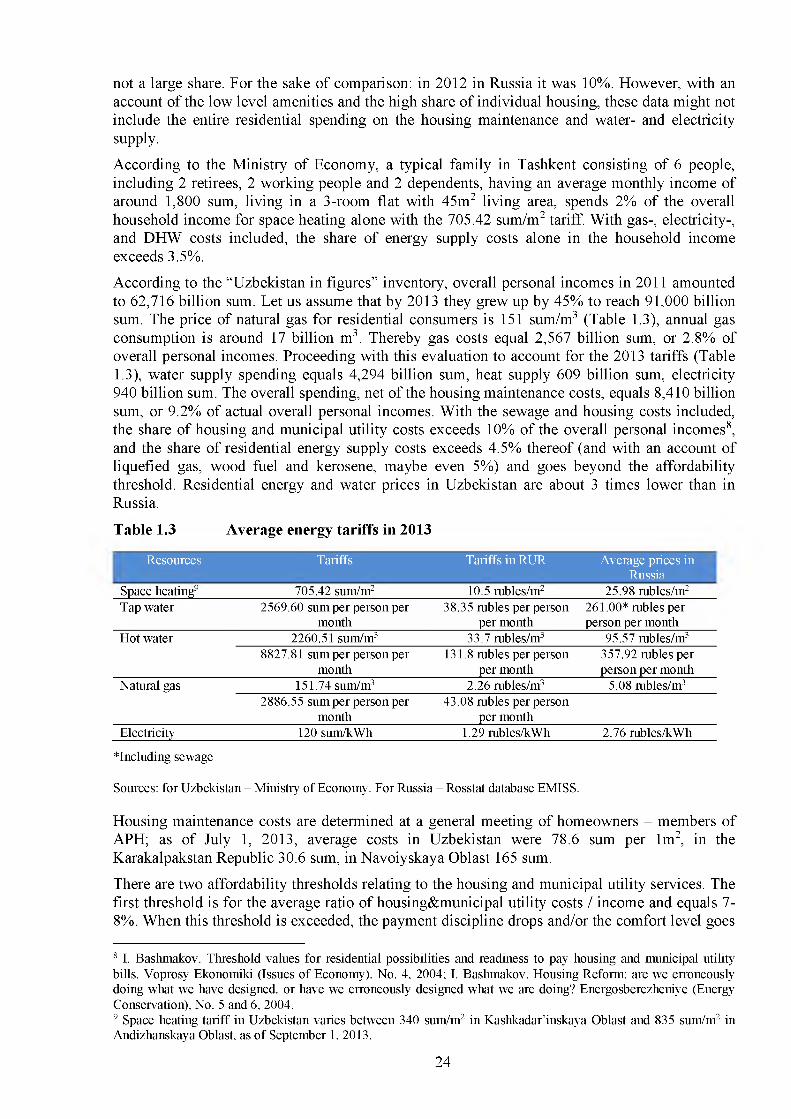
Table 1.3 Average energy tariffs in 2013
Resources Tariffs Tariffs inR U R Average prices in Russia
Space heating9 705.42 sum/m2 10.5 rubles/m2 25.98 rubles/m2Tap water 2569.60 sum per person per
month38.35 rubles per person
per month261.00* rubles per person per month
Hot water 2260.51 sum/m3 33.7 rubles/m3 95.57 rubles/m38827.81 sum per person per
month131.8 rubles per person
per month357.92 rubles per person per month
Natural gas 151.74 sum/m3 2.26 rubles/m3 5.08 rubles/m32886.55 sum per person per
month43.08 rubles per person
per monthElectricity 120 sum/kWh 1.29 rubles/kWh 2.76 rubles/kWh
in c lu d in g sewage
Sources: for Uzbekistan - Ministry of Economy. For Russia - Rosstat database EMISS.
Housing maintenance costs are determined at a general meeting o f homeowners - members o f APH; as o f July 1, 2013, average costs in Uzbekistan were 78.6 sum per lm 2, in the Karakalpakstan Republic 30.6 sum, in Navoiyskaya Oblast 165 sum.
There are two affordability thresholds relating to the housing and municipal utility services. The first threshold is for the average ratio o f housing&municipal utility costs / income and equals 7- 8%. W hen this threshold is exceeded, the payment discipline drops and/or the comfort level goes
8 I. Bashmakov. Threshold values for residential possibilities and readiness to pay housing and municipal utility bills. Voprosy Ekonomiki (Issues of Economy), No. 4, 2004; I. Bashmakov. Housing Reform: are we erroneously doing what we have designed, or have we erroneously designed what we are doing? Energosberezheniye (Energy Conservation), No. 5 and 6, 2004.9 Space heating tariff in Uzbekistan varies between 340 sum/m2 in Kashkadar’inskaya Oblast and 835 sum/m2 in Andizhanskaya Oblast, as o f September 1, 2013.
24
down. The further beyond the 7-8% threshold the ratio goes, the larger the drop. The second threshold is for the ratio o f housing&municipal utility costs / subsistence level and equals 15%. W ith this threshold exceeded, no payment collection measures, no matter how severe they may be, can help improve the payment discipline. This second threshold is critical for the development o f welfare programs. Specifically, these two thresholds manifest as shown in Table 1.4.
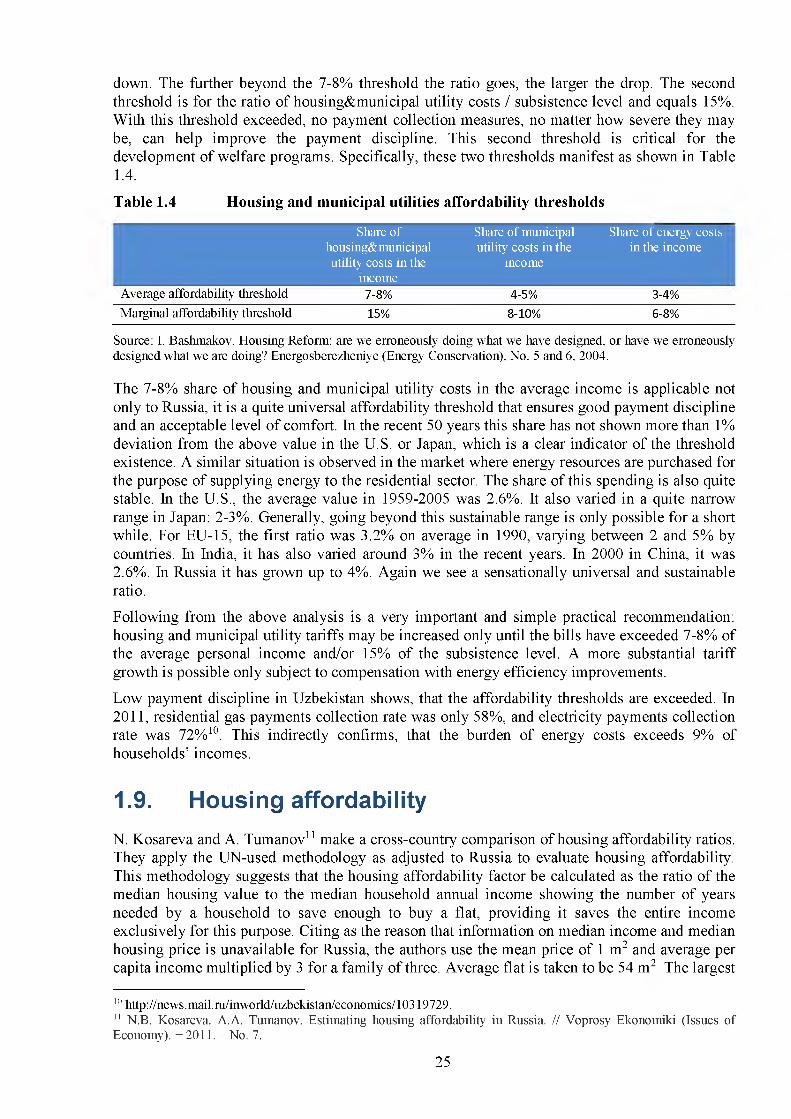
Table 1.4 Housing and municipal utilities affordability thresholds
Share of Share of municipal Share of energy costshousing&municipal utility costs in the in the incomeutility costs in the income
incomeAverage affordability threshold 7-8% 4-5% 3-4%Marginal affordability threshold 15% 8-10% 6-8%
Source: I. Bashmakov. Housing Reform: are we erroneously doing what we have designed, or have we erroneously designed what we are doing? Energosberezheniye (Energy Conservation), No. 5 and 6, 2004.
The 7-8% share o f housing and municipal utility costs in the average income is applicable not only to Russia, it is a quite universal affordability threshold that ensures good payment discipline and an acceptable level o f comfort. In the recent 50 years this share has not shown more than 1% deviation from the above value in the U.S. or Japan, which is a clear indicator o f the threshold existence. A similar situation is observed in the market where energy resources are purchased for the purpose o f supplying energy to the residential sector. The share o f this spending is also quite stable. In the U.S., the average value in 1959-2005 was 2.6%. It also varied in a quite narrow range in Japan: 2-3%. Generally, going beyond this sustainable range is only possible for a short while. For EU-15, the first ratio was 3.2% on average in 1990, varying between 2 and 5% by countries. In India, it has also varied around 3% in the recent years. In 2000 in China, it was 2.6%. In Russia it has grown up to 4%. Again we see a sensationally universal and sustainable ratio.
Following from the above analysis is a very important and simple practical recommendation: housing and municipal utility tariffs may be increased only until the bills have exceeded 7-8% of the average personal income and/or 15% of the subsistence level. A more substantial tariff growth is possible only subject to compensation with energy efficiency improvements.
Low payment discipline in Uzbekistan shows, that the affordability thresholds are exceeded. In 2011, residential gas payments collection rate was only 58%, and electricity payments collection rate was 72% 10. This indirectly confirms, that the burden o f energy costs exceeds 9% of households’ incomes.
1.9. Housing affordabilityN. Kosareva and A. Tum anov11 make a cross-country comparison o f housing affordability ratios. They apply the UN-used methodology as adjusted to Russia to evaluate housing affordability. This methodology suggests that the housing affordability factor be calculated as the ratio o f the median housing value to the median household annual income showing the number o f years needed by a household to save enough to buy a flat, providing it saves the entire income exclusively for this purpose. Citing as the reason that information on median income and median housing price is unavailable for Russia, the authors use the mean price o f 1 m2 and average per capita income multiplied by 3 for a family o f three. Average flat is taken to be 54 m 2 The largest
111 http://news.mail.ru/inworld/uzbekistan/economics/10319729.11 N.B. Kosareva, A.A. Tumanov. Estimating housing affordability in Russia. // Voprosy Ekonomiki (Issues of Economy). - 2011. - No. 7.
25
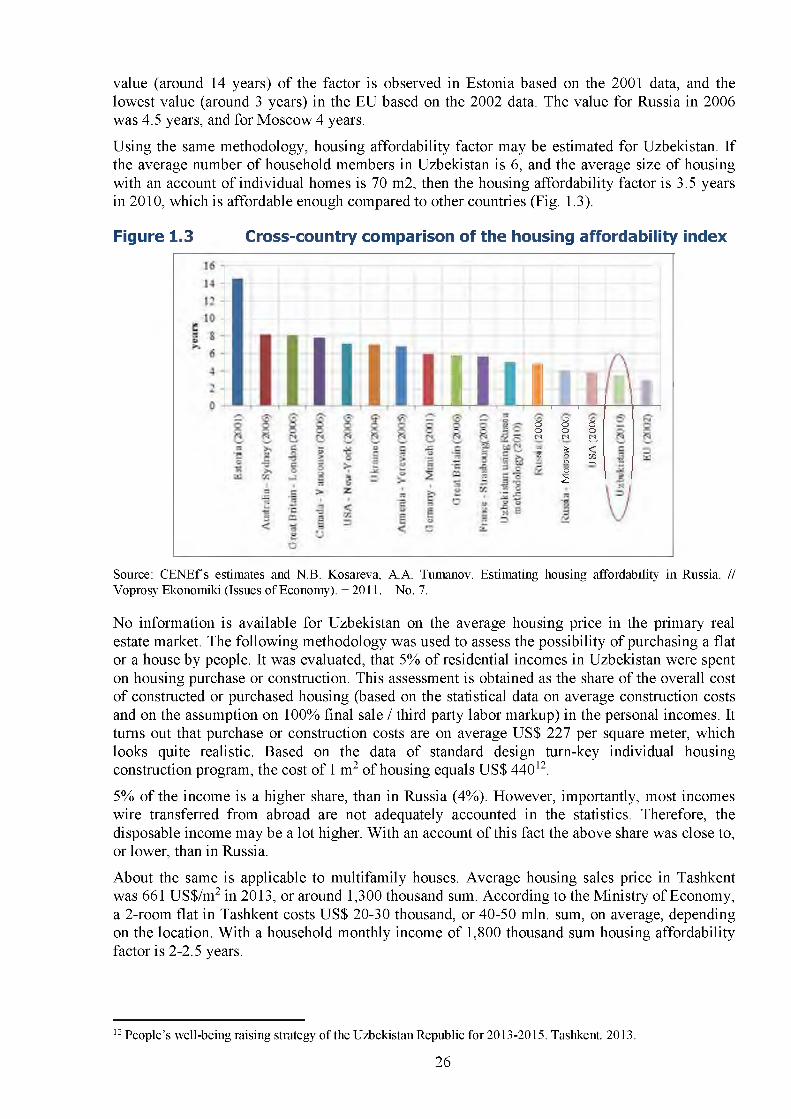
value (around 14 years) o f the factor is observed in Estonia based on the 2001 data, and the lowest value (around 3 years) in the EU based on the 2002 data. The value for Russia in 2006 was 4.5 years, and for M oscow 4 years.
Using the same methodology, housing affordability factor may be estimated for Uzbekistan. If the average number o f household members in Uzbekistan is 6, and the average size o f housing with an account o f individual homes is 70 m2, then the housing affordability factor is 3.5 years in 2010, which is affordable enough compared to other countries (Fig. 1.3).
Figure 1.3 Cross-country comparison of the housing affordability index
~i r~b 8 Zо О С:сч. сч О
% <у. 'Ло 1—|о
2
Source: C EN Ef s estimates and N.B. Kosareva, A.A. Tumanov. Estimating housing affordability in Russia. // Voprosy Ekonomiki (Issues of Economy). - 2011. - No. 7.
No information is available for Uzbekistan on the average housing price in the primary real estate market. The following methodology was used to assess the possibility o f purchasing a flat or a house by people. It was evaluated, that 5% o f residential incomes in Uzbekistan were spent on housing purchase or construction. This assessment is obtained as the share o f the overall cost o f constructed or purchased housing (based on the statistical data on average construction costs and on the assumption on 100% final sale / third party labor markup) in the personal incomes. It turns out that purchase or construction costs are on average US$ 227 per square meter, which looks quite realistic. Based on the data o f standard design turn-key individual housing construction program, the cost o f 1 m2 o f housing equals US$ 44012.
5% of the income is a higher share, than in Russia (4%). However, importantly, most incomes wire transferred from abroad are not adequately accounted in the statistics. Therefore, the disposable income may be a lot higher. W ith an account o f this fact the above share was close to, or lower, than in Russia.
About the same is applicable to multifamily houses. Average housing sales price in Tashkent was 661 US$/m2 in 2013, or around 1,300 thousand sum. According to the M inistry o f Economy, a 2-room flat in Tashkent costs US$ 20-30 thousand, or 40-50 mln. sum, on average, depending on the location. W ith a household monthly income o f 1,800 thousand sum housing affordability factor is 2-2.5 years.
12 People’s well-being raising strategy of the Uzbekistan Republic for 2013-2015. Tashkent, 2013.
26
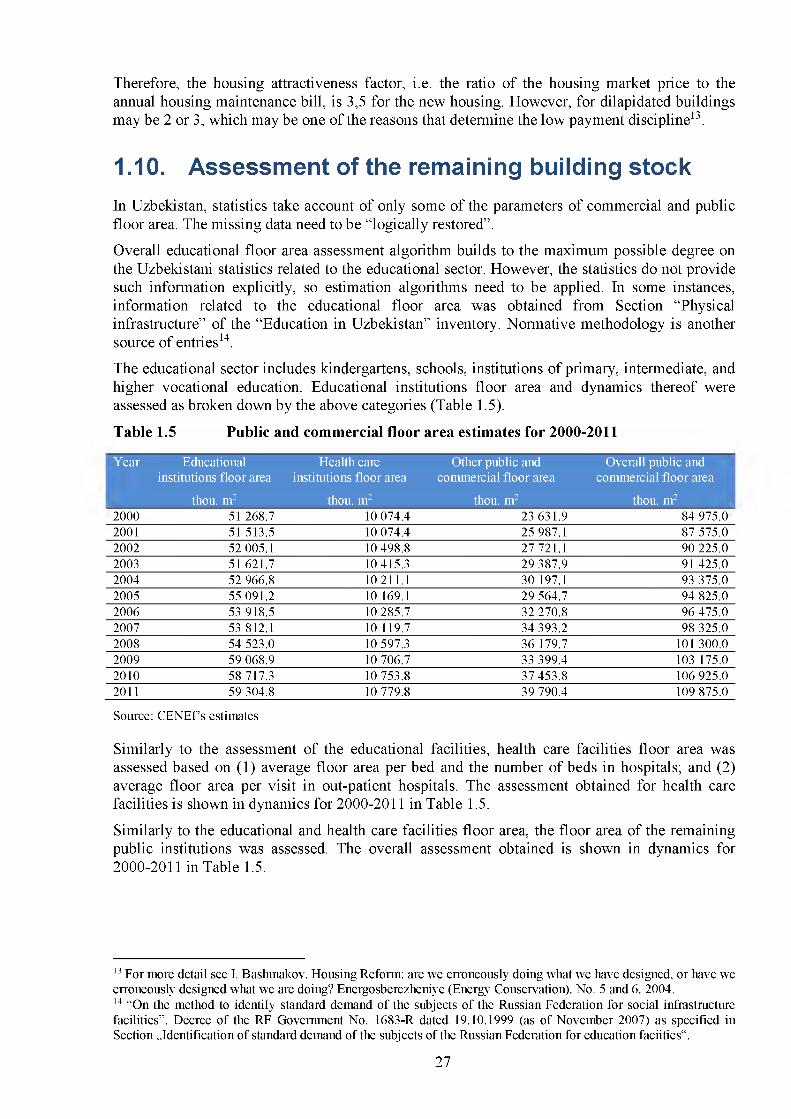
Therefore, the housing attractiveness factor, i.e. the ratio o f the housing market price to the annual housing maintenance bill, is 3,5 for the new housing. However, for dilapidated buildings may be 2 or 3, which may be one o f the reasons that determine the low payment discipline13.
1.10. Assessment of the remaining building stockIn Uzbekistan, statistics take account o f only some o f the parameters o f commercial and public floor area. The missing data need to be “logically restored” .
Overall educational floor area assessment algorithm builds to the maximum possible degree on the Uzbekistani statistics related to the educational sector. However, the statistics do not provide such information explicitly, so estimation algorithms need to be applied. In some instances, information related to the educational floor area was obtained from Section “Physical infrastructure” o f the “Education in Uzbekistan” inventory. Normative methodology is another source o f entries14.
The educational sector includes kindergartens, schools, institutions o f primary, intermediate, and higher vocational education. Educational institutions floor area and dynamics thereof were assessed as broken down by the above categories (Table 1.5).
Table 1.5 Public and commercial floor area estimates for 2000-2011
Year Educational institutions floor area
Health care institutions floor area
Other public and commercial floor area
Overall public and commercial floor area
thou, m2 thou, m2 thou, m2 thou, m22000 51 268.7 10 074.4 23 631.9 84 975.02001 51 513.5 10 074.4 25 987.1 87 575.02002 52 005.1 10 498.8 27 721.1 90 225.02003 51 621.7 10 415.3 29 387.9 91 425.02004 52 966.8 10211.1 30 197.1 93 375.02005 55 091.2 10 169.1 29 564.7 94 825.02006 53 918.5 10 285.7 32 270.8 96 475.02007 53 812.1 10 119.7 34 393.2 98 325.02008 54 523.0 10 597.3 36 179.7 101 300.02009 59 068.9 10 706.7 33 399.4 103 175.02010 58 717.3 10 753.8 37 453.8 106 925.02011 59 304.8 10 779.8 39 790.4 109 875.0
Source: C EN Ef s estimates
Similarly to the assessment o f the educational facilities, health care facilities floor area was assessed based on (1) average floor area per bed and the number o f beds in hospitals; and (2) average floor area per visit in out-patient hospitals. The assessment obtained for health care facilities is shown in dynamics for 2000-2011 in Table 1.5.
Similarly to the educational and health care facilities floor area, the floor area o f the remaining public institutions was assessed. The overall assessment obtained is shown in dynamics for 2000-2011 in Table 1.5.
13 For more detail see I. Bashmakov. Housing Reform: are we erroneously doing what we have designed, or have we erroneously designed what we are doing? Energosberezheniye (Energy Conservation), No. 5 and 6, 2004.14 “On the method to identify standard demand of the subjects o f the Russian Federation for social infrastructure facilities”. Decree of the RF Government No. 1683-R dated 19.10.1999 (as of November 2007) as specified in Section „Identification of standard demand of the subjects of the Russian Federation for education faciities“.
27

Therefore, public and commercial floor area equals 24% of the residential floor area. This is around the ratio observed in Romania (25%). In Tashkent, heat supply to public institutions is 31% of heat supply to the residential consumers. In a capital, the ratio o f public and commercial buildings to residential buildings should be higher, than the countrywide average. Such verification for consistency proves the reliability o f the assessment o f public buildings floor area. In terms o f amenities, public buildings do not seem to differ much from residential buildings, but should be slightly above them.
28
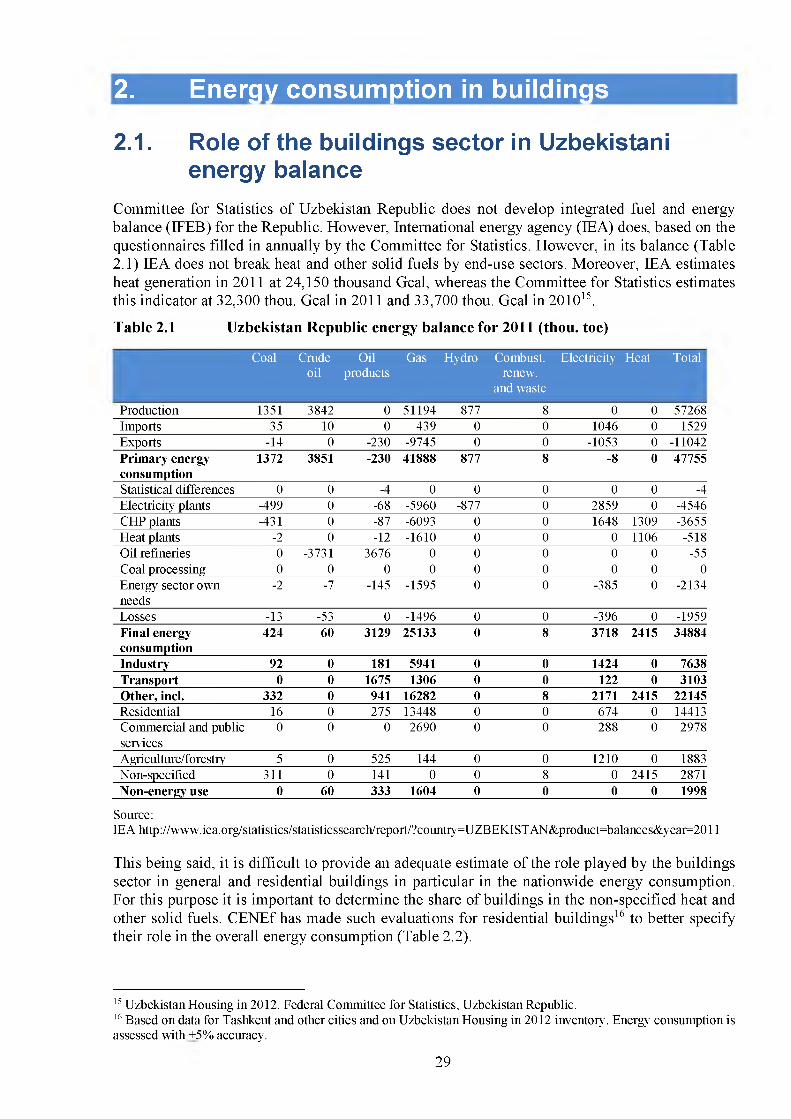
2. Energy consumption in buildings
2.1. Role of the buildings sector in Uzbekistani energy balance
Committee for Statistics o f Uzbekistan Republic does not develop integrated fuel and energy balance (IFEB) for the Republic. However, International energy agency (IEA) does, based on the questionnaires filled in annually by the Committee for Statistics. However, in its balance (Table 2.1) IEA does not break heat and other solid fuels by end-use sectors. Moreover, IEA estimates heat generation in 2011 at 24,150 thousand Gcal, whereas the Committee for Statistics estimates this indicator at 32,300 thou. Gcal in 2011 and 33,700 thou. Gcal in 201015.
Table 2.1 Uzbekistan Republic energy balance for 2011 (thou, toe)
Coal Crudeoil
Oilproducts
Gas Hydro Combust.renew,
and waste
Electricity Heat Total
Production 1351 3842 0 51194 877 8 0 0 57268Imports 35 10 0 439 0 0 1046 0 1529Exports -14 0 -230 -9745 0 0 -1053 0 -11042Primary energy consumption
1372 3851 -230 41888 877 8 -8 0 47755
Statistical differences 0 0 -4 0 0 0 0 0 -4Electricity plants -499 0 -68 -5960 -877 0 2859 0 -4546CHP plants -431 0 -87 -6093 0 0 1648 1309 -3655Heat plants -2 0 -12 -1610 0 0 0 1106 -518Oil refineries 0 -3731 3676 0 0 0 0 0 -55Coal processing 0 0 0 0 0 0 0 0 0Energy sector own needs
-2 -7 -145 -1595 0 0 -385 0 -2134
Losses -13 -53 0 -1496 0 0 -396 0 -1959Final energy consumption
424 60 3129 25133 0 8 3718 2415 34884
Industry 92 0 181 5941 0 0 1424 0 7638Transport 0 0 1675 1306 0 0 122 0 3103Other, incl. 332 0 941 16282 0 8 2171 2415 22145Residential 16 0 275 13448 0 0 674 0 14413Commercial and public services
0 0 0 2690 0 0 288 0 2978
Agriculture/forestry 5 0 525 144 0 0 1210 0 1883Non-specified 311 0 141 0 0 8 0 2415 2871Non-energy use 0 60 333 1604 0 0 0 0 1998
Source:IEA http://www.iea.org/statistics/statisticssearch/report/?country=UZBEKISTAN&product=balances&year=2011
This being said, it is difficult to provide an adequate estimate o f the role played by the buildings sector in general and residential buildings in particular in the nationwide energy consumption. For this purpose it is important to determine the share o f buildings in the non-specified heat and other solid fuels. CENEf has made such evaluations for residential buildings16 to better specify their role in the overall energy consumption (Table 2.2).
15 Uzbekistan Housing in 2012. Federal Committee for Statistics, Uzbekistan Republic.16 Based on data for Tashkent and other cities and on Uzbekistan Housing in 2012 inventory. Energy consumption is assessed with +5% accuracy.
29
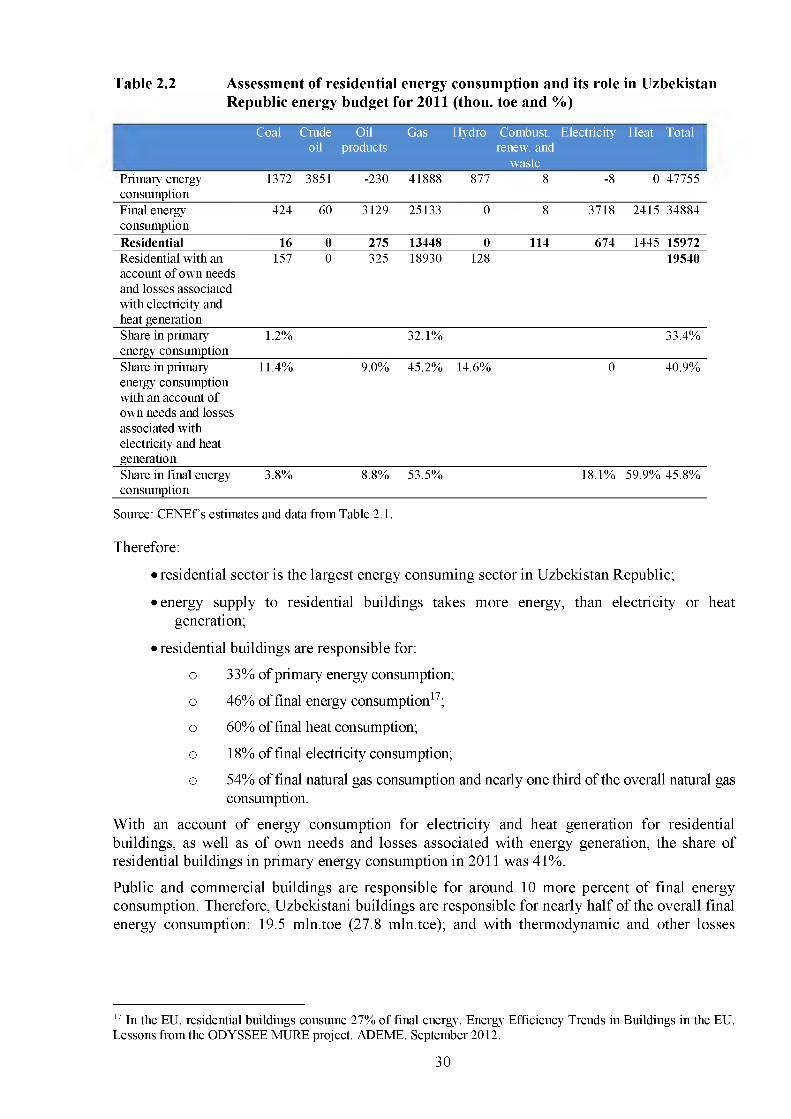
Table 2.2 Assessment of residential energy consumption and its role in UzbekistanRepublic energy budget for 2011 (thou, toe and %)
Coal Crudeoil
Oilproducts
Gas Hydro Combust, renew, and
waste
Electricity Heat Total
Primary energy 1372 3851 -230 41888 877 8 -8 0 47755consumptionFinal energy 424 60 3129 25133 0 8 3718 2415 34884consumptionResidential 16 0 275 13448 0 114 674 1445 15972Residential with an 157 0 325 18930 128 19540account of own needsand losses associatedwith electricity andheat generationShare in primary 1.2% 32.1% 33.4%energy consumptionShare in primary 11.4% 9.0% 45.2% 14.6% 0 40.9%energy consumption with an account of own needs and losses associated with electricity and heatgeneration________________________________________________________________________________________Share in final energy 3.8% 8.8% 53.5% 18.1% 59.9% 45.8% consumption______________________________________________________________________________________
Source: C EN Ef s estimates and data from Table 2.1.
Therefore:
• residential sector is the largest energy consuming sector in Uzbekistan Republic;
• energy supply to residential buildings takes more energy, than electricity or heatgeneration;
• residential buildings are responsible for:
о 33% of primary energy consumption;
о 46% of final energy consumption17;
о 60% of final heat consumption;
о 18% of final electricity consumption;
о 54% of final natural gas consumption and nearly one third of the overall natural gas consumption.
W ith an account o f energy consumption for electricity and heat generation for residential buildings, as well as o f own needs and losses associated with energy generation, the share of residential buildings in primary energy consumption in 2011 was 41%.
Public and commercial buildings are responsible for around 10 more percent o f final energy consumption. Therefore, Uzbekistani buildings are responsible for nearly half o f the overall final energy consumption: 19.5 mln.toe (27.8 mln.tee); and with thermodynamic and other losses
17 In the EU, residential buildings consume 27% o f final energy. Energy Efficiency Trends in Buildings in the EU. Lessons from the ODYSSEE MURE project. ADEME. September 2012.
30
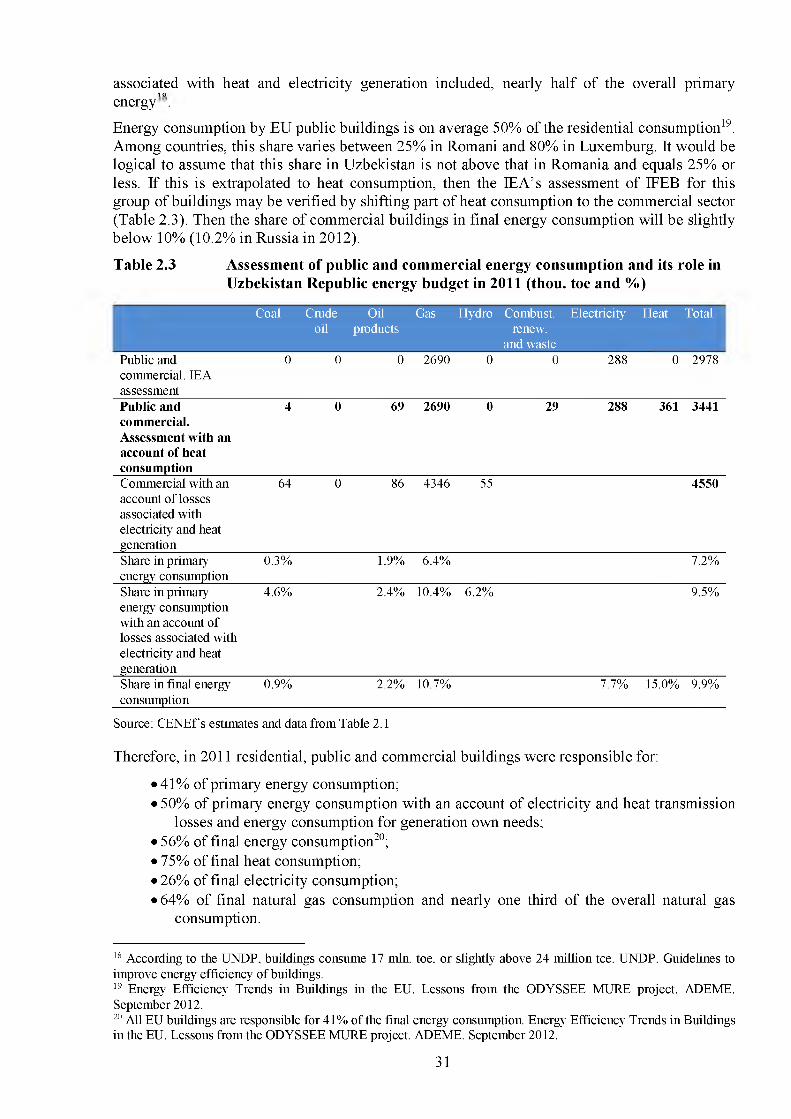
associated with heat and electricity generation included, nearly half o f the overall primary1 о
energy .
Energy consumption by EU public buildings is on average 50% of the residential consumption19. Among countries, this share varies between 25% in Romani and 80% in Luxemburg. It would be logical to assume that this share in Uzbekistan is not above that in Romania and equals 25% or less. If this is extrapolated to heat consumption, then the IEA’s assessment o f IFEB for this group o f buildings may be verified by shifting part o f heat consumption to the commercial sector (Table 2.3). Then the share o f commercial buildings in final energy consumption will be slightly below 10% (10.2% in Russia in 2012).
Table 2.3 Assessment of public and commercial energy consumption and its role inUzbekistan Republic energy budget in 2011 (thou, toe and %)
Coal Crudeoil
Oilproducts
Gas Hydro Combust.renew,
and waste
Electricity Heat Total
Public and 0 0 0 2690 0 0 288 0 2978commercial. IEAassessmentPublic and 4 0 69 2690 0 29 288 361 3441commercial.Assessment with anaccount of heatconsumptionCommercial with an 64 0 86 4346 55 4550account of lossesassociated withelectricity and heatgenerationShare in primary 0.3% 1.9% 6.4% 7.2%energy consumptionShare in primary 4.6% 2.4% 10.4% 6.2% 9.5%energy consumption with an account oflosses associated with electricity and heatgeneration___________________________________________________________________________________________Share in final energy 0.9% 2.2% 10.7% 7.7% 15.0% 9.9% consumption_________________________________________________________________________________________
Source: C EN Ef s estimates and data from Table 2.1
Therefore, in 2011 residential, public and commercial buildings were responsible for:
• 41% of primary energy consumption;• 50% of primary energy consumption with an account o f electricity and heat transmission
losses and energy consumption for generation own needs;• 56% of final energy consumption20;• 75% of final heat consumption;• 26% of final electricity consumption;• 64% of final natural gas consumption and nearly one third o f the overall natural gas
consumption.
18 According to the UNDP, buildings consume 17 mln. toe, or slightly above 24 million tee. UNDP. Guidelines to improve energy efficiency of buildings.19 Energy Efficiency Trends in Buildings in the EU. Lessons from the ODYSSEE MURE project. ADEME. September 2012.211 All EU buildings are responsible for 41% of the final energy consumption. Energy Efficiency Trends in Buildings in the EU. Lessons from the ODYSSEE MURE project. ADEME. September 2012.
31
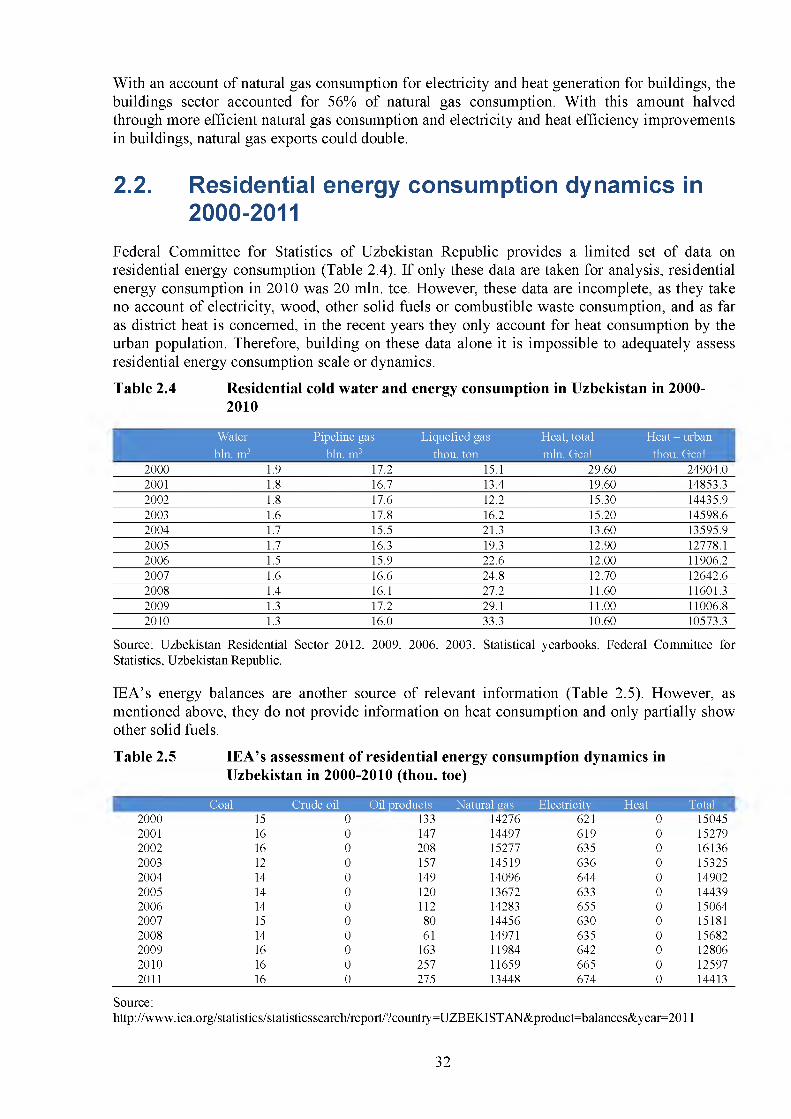
W ith an account o f natural gas consumption for electricity and heat generation for buildings, the buildings sector accounted for 56% of natural gas consumption. W ith this amount halved through more efficient natural gas consumption and electricity and heat efficiency improvements in buildings, natural gas exports could double.
2.2. Residential energy consumption dynamics in 2000-2011
Federal Committee for Statistics o f Uzbekistan Republic provides a limited set o f data on residential energy consumption (Table 2.4). If only these data are taken for analysis, residential energy consumption in 2010 was 20 mln. tee. However, these data are incomplete, as they take no account o f electricity, wood, other solid fuels or combustible waste consumption, and as far as district heat is concerned, in the recent years they only account for heat consumption by the urban population. Therefore, building on these data alone it is impossible to adequately assess residential energy consumption scale or dynamics.
Table 2.4 Residential cold water and energy consumption in Uzbekistan in 2000-2010
Water bln. m3
Pipeline gas bln. m3
Liquefied gas thou, ton
Heat, total mln. Gcal
Heat - urban thou. Gcal
2000 1.9 17.2 15.1 29.60 24904.02001 1.8 16.7 13.4 19.60 14853.32002 1.8 17.6 12.2 15.30 14435.92003 1.6 17.8 16.2 15.20 14598.62004 1.7 15.5 21.3 13.60 13595.92005 1.7 16.3 19.3 12.90 12778.12006 1.5 15.9 22.6 12.00 11906.22007 1.6 16.6 24.8 12.70 12642.62008 1.4 16.1 27.2 11.60 11601.32009 1.3 17.2 29.1 11.00 11006.82010 1.3 16.0 33.3 10.60 10573.3
Source: Uzbekistan Residential Sector 2012, 2009, 2006, 2003. Statistical yearbooks. Federal Committee for Statistics, Uzbekistan Republic.
IEA ’s energy balances are another source o f relevant information (Table 2.5). However, as mentioned above, they do not provide information on heat consumption and only partially show other solid fuels.
Table 2.5 IEA’s assessment of residential energy consumption dynamics inUzbekistan in 2000-2010 (thou, toe)
Coal Crude oil Oil products Natural gas Electricity Heat Total 92000 15 0 133 14276 621 0 150452001 16 0 147 14497 619 0 152792002 16 0 208 15277 635 0 161362003 12 0 157 14519 636 0 153252004 14 0 149 14096 644 0 149022005 14 0 120 13672 633 0 144392006 14 0 112 14283 655 0 150642007 15 0 80 14456 630 0 151812008 14 0 61 14971 635 0 156822009 16 0 163 11984 642 0 128062010 16 0 257 11659 665 0 125972011 16 0 275 13448 674 0 14413
Source:http://www.iea.org/statistics/statisticssearch/report/?country=UZBEKISTAN&product=balances&year=2011
32
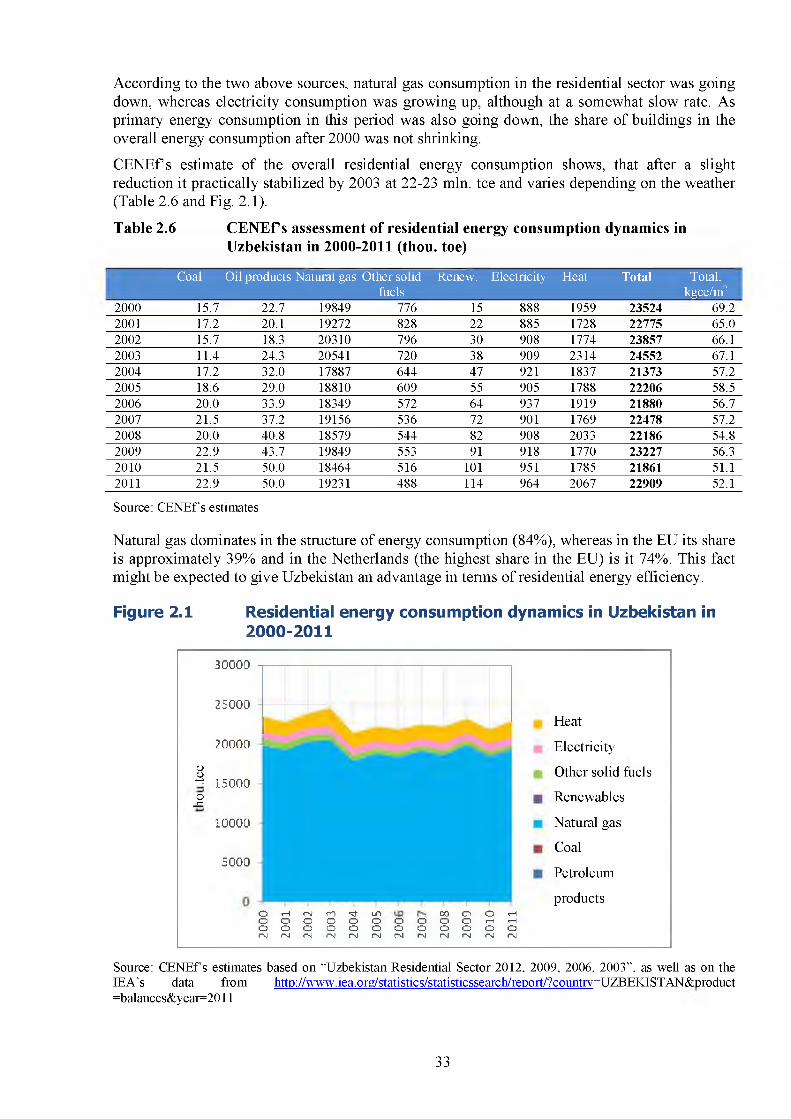
According to the two above sources, natural gas consumption in the residential sector was going down, whereas electricity consumption was growing up, although at a somewhat slow rate. As primary energy consumption in this period was also going down, the share o f buildings in the overall energy consumption after 2000 was not shrinking.
C E N E fs estimate o f the overall residential energy consumption shows, that after a slight reduction it practically stabilized by 2003 at 22-23 mln. tee and varies depending on the weather (Table 2.6 and Fig. 2.1).
Table 2.6 C E N E fs assessment of residential energy consumption dynamics inUzbekistan in 2000-2011 (thou, toe)
Coal Oil products Natural gas Other solidfuels
Renew. Electricity Heat Total Total,kgce/nf
2000 15.7 22.7 19849 776 15 888 1959 23524 69.22001 17.2 20.1 19272 828 22 885 1728 22775 65.02002 15.7 18.3 20310 796 30 908 1774 23857 66.12003 11.4 24.3 20541 720 38 909 2314 24552 67.12004 17.2 32.0 17887 644 47 921 1837 21373 57.22005 18.6 29.0 18810 609 55 905 1788 22206 58.52006 20.0 33.9 18349 572 64 937 1919 21880 56.72007 21.5 37.2 19156 536 72 901 1769 22478 57.22008 20.0 40.8 18579 544 82 908 2033 22186 54.82009 22.9 43.7 19849 553 91 918 1770 23227 56.32010 21.5 50.0 18464 516 101 951 1785 21861 51.12011 22.9 50.0 19231 488 114 964 2067 22909 52.1
Source: C EN Efs estimates
Natural gas dominates in the structure o f energy consumption (84%), whereas in the EU its share is approximately 39% and in the Netherlands (the highest share in the EU) is it 74%. This fact might be expected to give Uzbekistan an advantage in terms o f residential energy efficiency.
Figure 2.1 Residential energy consumption dynamics in Uzbekistan in 2000-2011
оо-t-;О-a
30000
25000
20000
15000
10000
5000
Heat
Electricity
Other solid fuels
Renewables
Natural gas
Coal
Petroleum
productsо t-H rsl ГО <3- LO 00 О О тНо О О О О о О О О О чтН г—1о О О О О о О О О О О оГМ Psl гм гм rsl rsl гм гм rsl rsl ГМ rsl
Source: C EN Efs estimates based on “Uzbekistan Residential Sector 2012, 2009, 2006, 2003”, as well as on the IEA’s data from http://www.iea.org/statistics/statisticssearch/report/?countrv=UZBEKISTAN&product =balances&year=2011
33
Nevertheless, specific energy consumption per 1 m2 in 2011 was 52 kgce/m2/year (423 kW h/m2/year) and even exceeded that in Russia (49 kgce/m2/year), where the average number of degree-days is twice that in Uzbekistan (Fig. 2.2). Specific energy consumption per person is 780 kgce, or approximately 23 GJ, which is consistent with many developed countries.
Figure 2.2 Specific residential energy consumption dynamics in Uzbekistan in 2000-2011
on
7 П -
60 -
A»
—* —*—,
50 -
rL ЛП -
— — - 0
.s . u1o ou
^ 90 -
1П - гI иnu -1
ОооCM
ооCM
s
CMооCM
pain
COооCM
Fii
оосм
lland
шоосм
AL
<£>оосм
Izbckis
h"оосм
;tan
сооосм
i Rus
CDоосм
;sia
оосм
1
осм
Source: CENEf’s estimates
In the EU, average specific energy consumption in the residential sector varies between 150 kW h/m2/year in Spain and 320 kW h/m2/year in Finland. The climate in Uzbekistan more resembles that in Spain. This indicator equals 450 kW h/m2/year in the U.S., 300 kW h/m2/year in Japan, and around 175 kW h/m2/year for Chinese urban population21. Therefore, specific energy consumption in Uzbekistan is closer to those in Russia or U.S., i.e. countries that differ a lot in climate, as well as in the economic development level.
To some extent, the higher value o f specific energy consumption is determined by a larger share o f individual low-rise residential buildings. Another factor, which is seldom considered in crosscountry comparisons, is a larger size (double, in relation to Russia) o f the average household in Uzbekistan. W ith more household members and low housing floor area per capita, energy consumption for cooking and lighting purposes is estimated in relation to smaller floor area, resulting in relatively large specific energy consumption per 1 m2 for these purposes. In EU countries, electricity consumption per 1 m2 varies between 30 kW h in Romania and 170 kW h in Norway22. In Russia, it equals 41 kWh versus just 18 kW h in Uzbekistan.
Two thirds o f residential energy consumption is related to space heating (Fig. 2.3). Heat for this purpose is primarily generated from natural gas. Energy consumption for space heating is to a large extent determined by weather fluctuations, and after some reduction in 2000-2005 it showed no further drop anymore.
21 Global Energy Assessment. Towards a Sustainable Future. IIASA. Austria. 2012.22 Energy Efficiency Trends in Buildings in the EU. Lessons from the ODYSSEE MURE project. ADEME. September 2012.
34
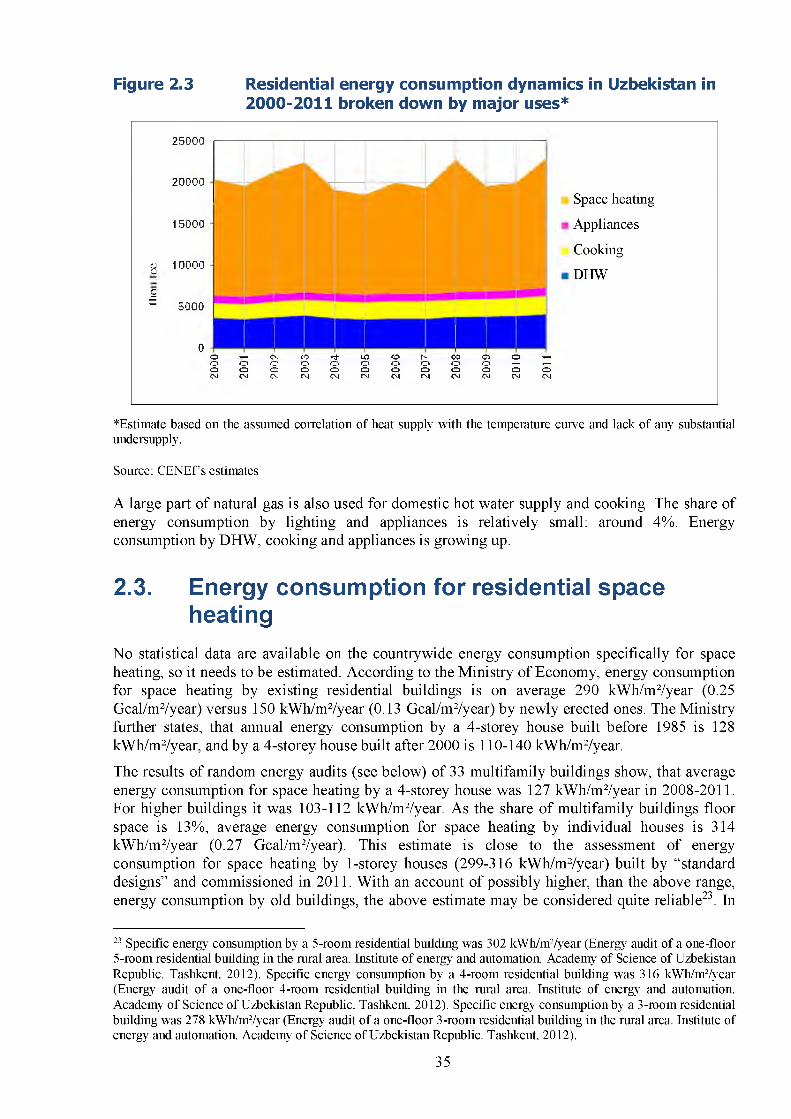
Figure 2.3 Residential energy consumption dynamics in Uzbekistan in 2000-2011 broken down by major uses*
25000
20000
15000
и 10000(JС
5 5000
0O ' — O - J c O ' ^ - L O O h - O O O O ^ O O O O O O O O O O r — ’r—o o o o o o o o o o o o< 4 C 4 C 4 J C 4 C 4 < N C 4 C 4 C 4 < 4 C 4 C 4
Space heating
Appliances
Cooking
DHW
*Estimate based on the assumed correlation of heat supply with the temperature curve and lack of any substantial undersupply.
Source: C EN Ef s estimates
A large part o f natural gas is also used for domestic hot water supply and cooking. The share of energy consumption by lighting and appliances is relatively small: around 4%. Energy consumption by DHW, cooking and appliances is growing up.
2.3. Energy consumption for residential space heating
No statistical data are available on the countrywide energy consumption specifically for space heating, so it needs to be estimated. According to the M inistry o f Economy, energy consumption for space heating by existing residential buildings is on average 290 kW h/m2/year (0.25 Gcal/m2/year) versus 150 kW h/m2/year (0.13 Gcal/m2/year) by newly erected ones. The M inistry further states, that annual energy consumption by a 4-storey house built before 1985 is 128 kW h/m2/year, and by a 4-storey house built after 2000 is 110-140 kW h/m2/year.
The results o f random energy audits (see below) o f 33 multifamily buildings show, that average energy consumption for space heating by a 4-storey house was 127 kW h/m2/year in 2008-2011. For higher buildings it was 103-112 kW h/m2/year. As the share o f multifamily buildings floor space is 13%, average energy consumption for space heating by individual houses is 314 kW h/m2/year (0.27 Gcal/m2/year). This estimate is close to the assessment o f energy consumption for space heating by 1-storey houses (299-316 kW h/m2/year) built by “standard designs” and commissioned in 2011. W ith an account o f possibly higher, than the above range, energy consumption by old buildings, the above estimate may be considered quite reliable23. In
23 Specific energy consumption by a 5-room residential building was 302 kWh/m2/year (Energy audit o f a one-floor 5-room residential building in the rural area. Institute of energy and automation. Academy of Science of Uzbekistan Republic. Tashkent 2012). Specific energy consumption by a 4-room residential building was 316 kWh/m2/year (Energy audit of a one-floor 4-room residential building in the rural area. Institute of energy and automation. Academy o f Science of Uzbekistan Republic. Tashkent 2012). Specific energy consumption by a 3-room residential building was 278 kWh/m2/year (Energy audit o f a one-floor 3-room residential building in the rural area. Institute of energy and automation. Academy o f Science of Uzbekistan Republic. Tashkent 2012).
35
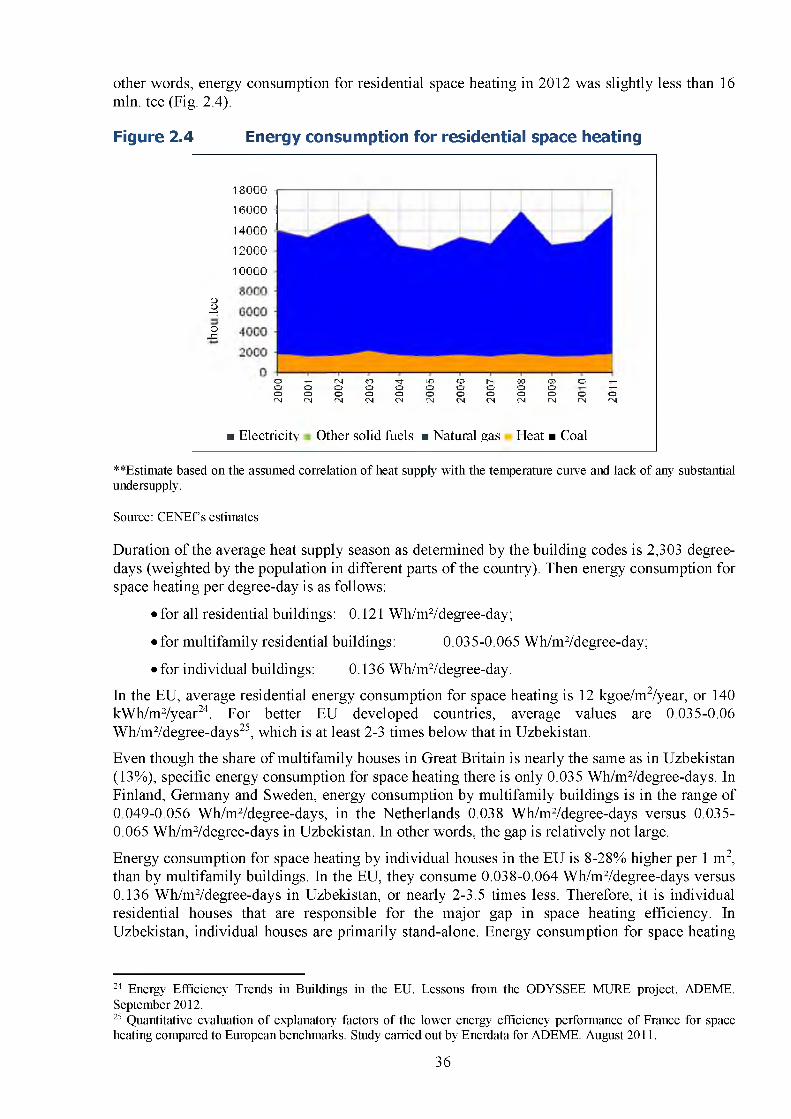
other words, energy consumption for residential space heating in 2012 was slightly less than 16 mln. tee (Fig. 2.4).
Figure 2.4 Energy consumption for residential space heating
оо-t-;О-a
18000
16000 -
14000
12000 10000
О •С— см <г> ’■'t LO CD г- со о о —о о о о о о о о о о -Г---о о о о о о о о о о о осм см см см см см см см (М см см см
■ Electricity Other solid fuels ■ Natural gas Heat ■ Coal
**Estimate based on the assumed correlation o f heat supply with the temperature curve and lack of any substantial undersupply.
Source: C E N E fs estimates
Duration o f the average heat supply season as determined by the building codes is 2,303 degree- days (weighted by the population in different parts o f the country). Then energy consumption for space heating per degree-day is as follows:
• for all residential buildings: 0.121 W h/m2/degree-day;
• for multifamily residential buildings: 0.035-0.065 W h/m2/degree-day;
• for individual buildings: 0.136 W h/m2/degree-day.
In the EU, average residential energy consumption for space heating is 12 kgoe/m2/year, or 140 kW h/m2/year24. For better EU developed countries, average values are 0.035-0.06 W h/m2/degree-days25, which is at least 2-3 times below that in Uzbekistan.
Even though the share o f multifamily houses in Great Britain is nearly the same as in Uzbekistan (13%), specific energy consumption for space heating there is only 0.035 W h/m2/degree-days. In Finland, Germany and Sweden, energy consumption by multifamily buildings is in the range of 0.049-0.056 W h/m2/degree-days, in the Netherlands 0.038 W h/m2/degree-days versus 0.035- 0.065 W h/m2/degree-days in Uzbekistan. In other words, the gap is relatively not large.
Energy consumption for space heating by individual houses in the EU is 8-28% higher per 1 m 2, than by multifamily buildings. In the EU, they consume 0.038-0.064 W h/m 2/degree-days versus 0.136 W h/m2/degree-days in Uzbekistan, or nearly 2-3.5 times less. Therefore, it is individual residential houses that are responsible for the major gap in space heating efficiency. In Uzbekistan, individual houses are primarily stand-alone. Energy consumption for space heating
24 Energy Efficiency Trends in Buildings in the EU. Lessons from the ODYSSEE MURE project. ADEME. September 2012.25 Quantitative evaluation o f explanatory factors of the lower energy efficiency performance of France for space heating compared to European benchmarks. Study carried out by Enerdata for ADEME. August 2011.
36
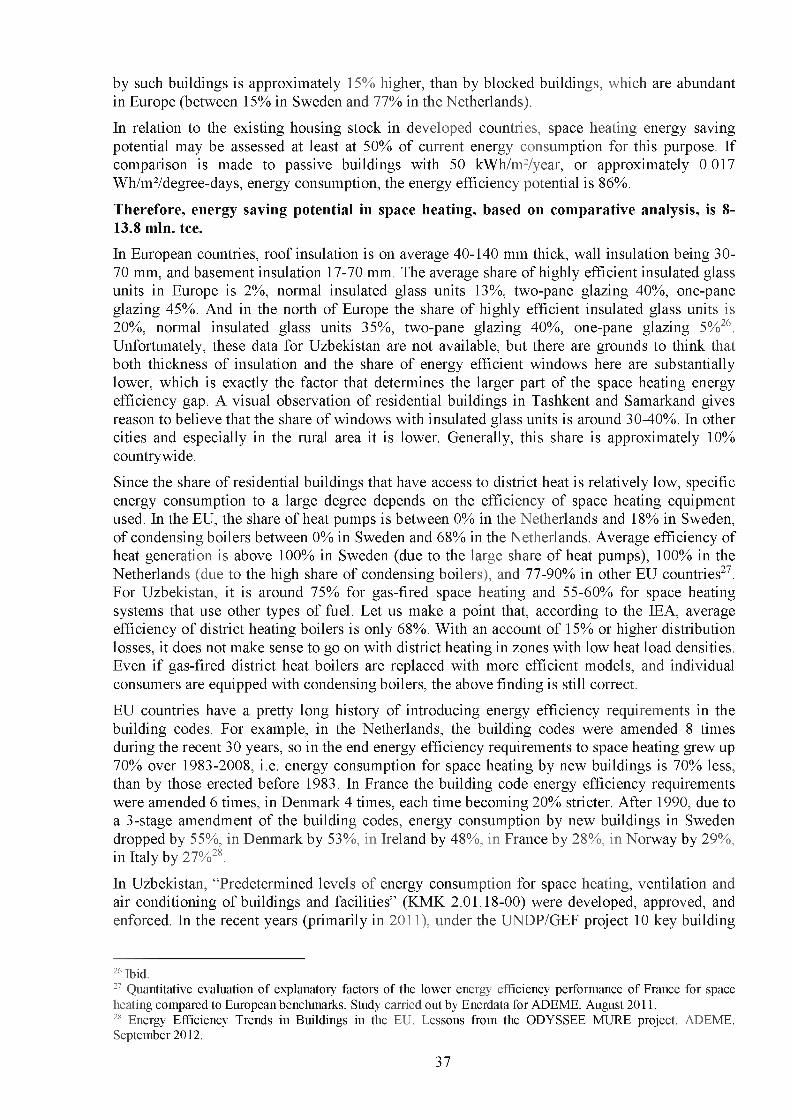
by such buildings is approximately 15% higher, than by blocked buildings, which are abundant in Europe (between 15% in Sweden and 77% in the Netherlands).
In relation to the existing housing stock in developed countries, space heating energy saving potential may be assessed at least at 50% of current energy consumption for this purpose. If comparison is made to passive buildings with 50 kW h/m2/year, or approximately 0.017 W h/m2/degree-days, energy consumption, the energy efficiency potential is 86%.
Therefore, energy saving potential in space heating, based on comparative analysis, is 8- 13.8 mln. tee.
In European countries, roof insulation is on average 40-140 mm thick, wall insulation being 30- 70 mm, and basement insulation 17-70 mm. The average share o f highly efficient insulated glass units in Europe is 2%, normal insulated glass units 13%, two-pane glazing 40%, one-pane glazing 45%. And in the north o f Europe the share o f highly efficient insulated glass units is 20%, normal insulated glass units 35%, two-pane glazing 40%, one-pane glazing 5%26. Unfortunately, these data for Uzbekistan are not available, but there are grounds to think that both thickness o f insulation and the share o f energy efficient windows here are substantially lower, which is exactly the factor that determines the larger part o f the space heating energy efficiency gap. A visual observation o f residential buildings in Tashkent and Samarkand gives reason to believe that the share o f windows with insulated glass units is around 30-40%. In other cities and especially in the rural area it is lower. Generally, this share is approximately 10% countrywide.
Since the share o f residential buildings that have access to district heat is relatively low, specific energy consumption to a large degree depends on the efficiency o f space heating equipment used. In the EU, the share o f heat pumps is between 0% in the Netherlands and 18% in Sweden, o f condensing boilers between 0% in Sweden and 68% in the Netherlands. Average efficiency of heat generation is above 100% in Sweden (due to the large share o f heat pumps), 100% in the Netherlands (due to the high share o f condensing boilers), and 77-90% in other EU countries27. For Uzbekistan, it is around 75% for gas-fired space heating and 55-60% for space heating systems that use other types o f fuel. Let us make a point that, according to the IEA, average efficiency o f district heating boilers is only 68%. W ith an account o f 15% or higher distribution losses, it does not make sense to go on with district heating in zones with low heat load densities. Even if gas-fired district heat boilers are replaced with more efficient models, and individual consumers are equipped with condensing boilers, the above finding is still correct.
EU countries have a pretty long history o f introducing energy efficiency requirements in the building codes. For example, in the Netherlands, the building codes were amended 8 times during the recent 30 years, so in the end energy efficiency requirements to space heating grew up 70% over 1983-2008, i.e. energy consumption for space heating by new buildings is 70% less, than by those erected before 1983. In France the building code energy efficiency requirements were amended 6 times, in Denmark 4 times, each time becoming 20% stricter. After 1990, due to a 3-stage amendment o f the building codes, energy consumption by new buildings in Sweden dropped by 55%, in Denmark by 53%, in Ireland by 48%, in France by 28%, in Norway by 29%, in Italy by 27%28.
In Uzbekistan, “Predetermined levels o f energy consumption for space heating, ventilation and air conditioning o f buildings and facilities” (KMK 2.01.18-00) were developed, approved, and enforced. In the recent years (primarily in 2011), under the UNDP/GEF project 10 key building
26 Ibid.27 Quantitative evaluation o f explanatory factors of the lower energy efficiency performance of France for space heating compared to European benchmarks. Study carried out by Enerdata for ADEME. August 2011.28 Energy Efficiency Trends in Buildings in the EU. Lessons from the ODYSSEE MURE project. ADEME. September 2012.
37
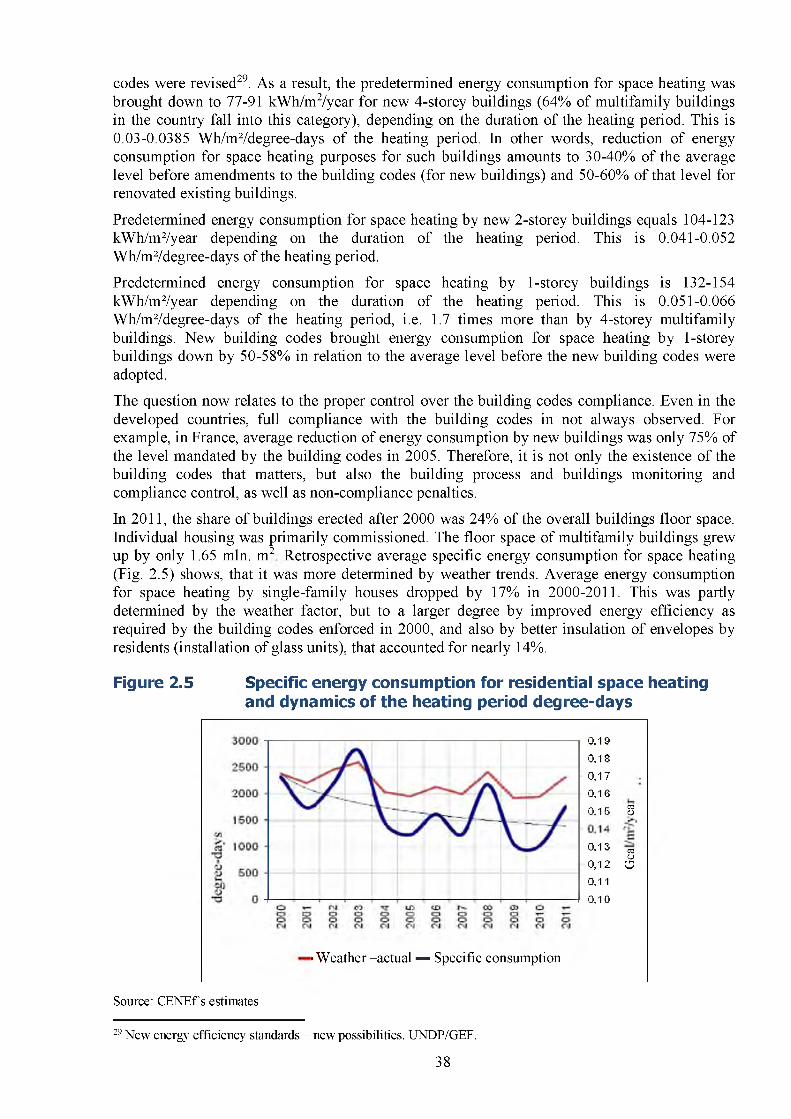
codes were revised29. As a result, the predetermined energy consumption for space heating was brought down to 77-91 kW h/m2/year for new 4-storey buildings (64% of multifamily buildings in the country fall into this category), depending on the duration o f the heating period. This is0.03-0.0385 W h/m2/degree-days o f the heating period. In other words, reduction o f energy consumption for space heating purposes for such buildings amounts to 30-40% of the average level before amendments to the building codes (for new buildings) and 50-60% of that level for renovated existing buildings.
Predetermined energy consumption for space heating by new 2-storey buildings equals 104-123 kW h/m2/year depending on the duration o f the heating period. This is 0.041-0.052 W h/m2/degree-days o f the heating period.
Predetermined energy consumption for space heating by 1-storey buildings is 132-154 kW h/m2/year depending on the duration o f the heating period. This is 0.051-0.066 W h/m2/degree-days o f the heating period, i.e. 1.7 times more than by 4-storey multifamily buildings. New building codes brought energy consumption for space heating by 1-storey buildings down by 50-58% in relation to the average level before the new building codes were adopted.
The question now relates to the proper control over the building codes compliance. Even in the developed countries, full compliance with the building codes in not always observed. For example, in France, average reduction o f energy consumption by new buildings was only 75% of the level mandated by the building codes in 2005. Therefore, it is not only the existence o f the building codes that matters, but also the building process and buildings monitoring and compliance control, as well as non-compliance penalties.
In 2011, the share o f buildings erected after 2000 was 24% of the overall buildings floor space. Individual housing was primarily commissioned. The floor space o f multifamily buildings grew up by only 1.65 mln. m2 Retrospective average specific energy consumption for space heating (Fig. 2.5) shows, that it was more determined by weather trends. Average energy consumption for space heating by single-family houses dropped by 17% in 2000-2011. This was partly determined by the weather factor, but to a larger degree by improved energy efficiency as required by the building codes enforced in 2000, and also by better insulation o f envelopes by residents (installation o f glass units), that accounted for nearly 14%.
Figure 2.5 Specific energy consumption for residential space heating and dynamics of the heating period degree-days
0,19
0,1 S
0,17
0,16
0.15
0,13
0,120,11
0.10
03<D
03оо
■ Weather -actual — Specific consumption
Source: C EN Ef s estimates
29 New energy efficiency standards - new possibilities. UNDP/GEF.
38
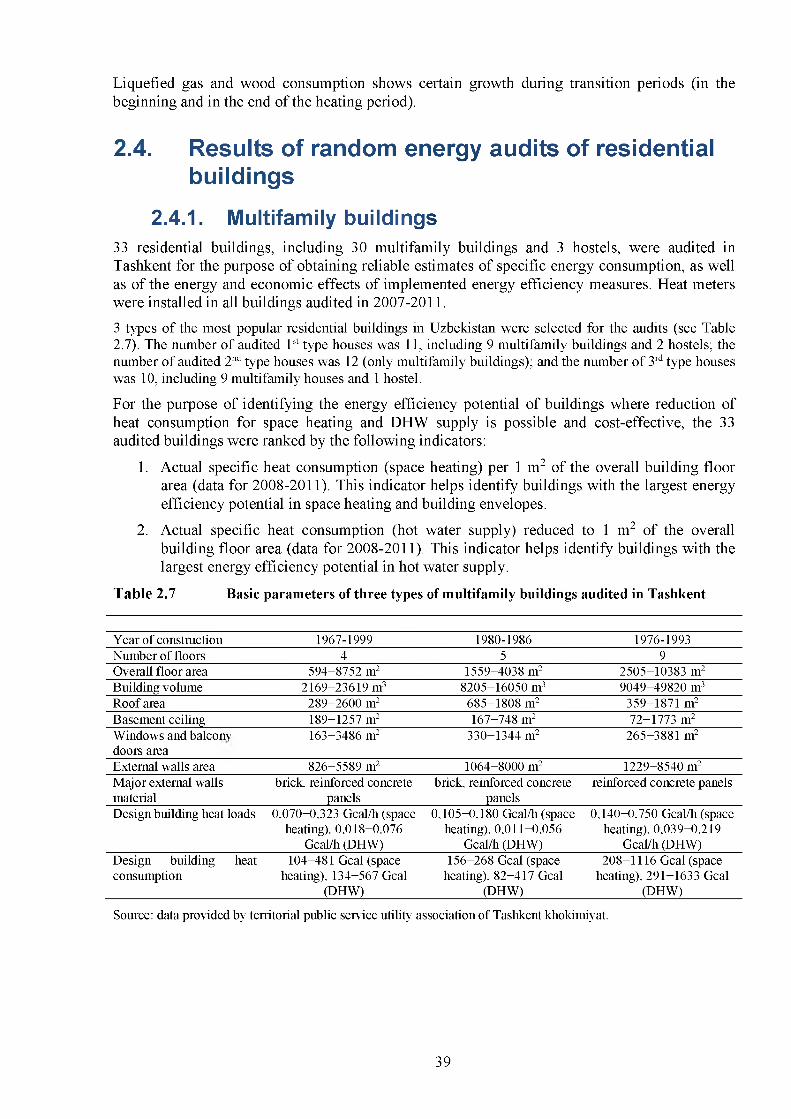
Liquefied gas and wood consumption shows certain growth during transition periods (in the beginning and in the end o f the heating period).
2.4. Results of random energy audits of residential buildings
2.4.1. Multifamily buildings33 residential buildings, including 30 multifamily buildings and 3 hostels, were audited in Tashkent for the purpose o f obtaining reliable estimates o f specific energy consumption, as well as o f the energy and economic effects o f implemented energy efficiency measures. Heat meters were installed in all buildings audited in 2007-2011.
3 types of the most popular residential buildings in Uzbekistan were selected for the audits (see Table 2.7). The number of audited 1st type houses was 11, including 9 multifamily buildings and 2 hostels; the number of audited 2nd type houses was 12 (only multifamily buildings); and the number of 3rd type houses was 10, including 9 multifamily houses and 1 hostel.
For the purpose o f identifying the energy efficiency potential o f buildings where reduction of heat consumption for space heating and DHW supply is possible and cost-effective, the 33 audited buildings were ranked by the following indicators:
1. Actual specific heat consumption (space heating) per 1 m2 o f the overall building floor area (data for 2008-2011). This indicator helps identify buildings with the largest energy efficiency potential in space heating and building envelopes.
2. Actual specific heat consumption (hot water supply) reduced to 1 m2 o f the overall building floor area (data for 2008-2011). This indicator helps identify buildings with the largest energy efficiency potential in hot water supply.
Table 2.7 Basic parameters of three types of multifamily buildings audited in Tashkent
Year of constmction 1967-1999 1980-1986 1976-1993Number of floors 4 5 9Overall floor area 594-8752 m2 1559-4038 m2 2505-10383 m2Building volume 2169-23619m3 8205-16050 m3 9049-49820 m3Roof area 289-2600 n f 685-1808 m2 359-1871 n fBasement ceiling 189-1257 m2 167-748 m2 72-1773 m2Windows and balcony 163-3486 m2 330-1344 m2 265-3881 n fdoors areaExternal walls area 826-5589 n f 1064-8000 m2 1229-8540 n fMajor external walls brick, reinforced concrete brick, reinforced concrete reinforced concrete panelsmaterial panels panelsDesign building heat loads 0,070-0,323 Gcal/h (space
heating), 0,018-0,076 Gcal/h (DHW)
0,105-0,180 Gcal/h (space heating), 0,011-0,056
Gcal/h (DHW)
0,140-0,750 Gcal/h (space heating), 0,039-0,219
Gcal/h (DHW)Design building heat consumption
104-481 Gcal (space heating), 134-567 Gcal
(DHW)
156-268 Gcal (space heating), 82-417 Gcal
(DHW)
208-1116 Gcal (space heating), 291-1633 Gcal
(DHW)
Source: data provided by territorial public service utility association of Tashkent khokimiyat.
39
Ranking o f the audited residential buildings by specific heat consumption for space heating and hot water supply per 1 m 2 o f the overall floor area is shown in Fig. 2.6 and 2.7.
Analysis o f data presented in Fig. 2.6 and 2.7 allows for the following findings:
• In nine residential buildings, actual specific heat consumption for space heating per 1 m2of the overall building floor area is above the maximum predetermined value verified for actual degree-days o f the heating period (0.095 Gcal/m2 for 4-storey o f lower residential buildings);
• In six buildings, actual specific heat consumption for hot water supply per 1 m2 o f theoverall building floor area is above the predetermined value (0.088 Gcal/m2).
An energy audit o f a 4-storey residential building (ESIB project)30 showed, that the design value o f energy consumption was 128 kW h/m2/year, whereas its current energy consumption is above 230 kW h/m2/year. The reasons for excessive heat consumption include too large heat losses through balconies, stair-wells, untight joints, etc.
311 http://www.inogate-ee.org/ru
40
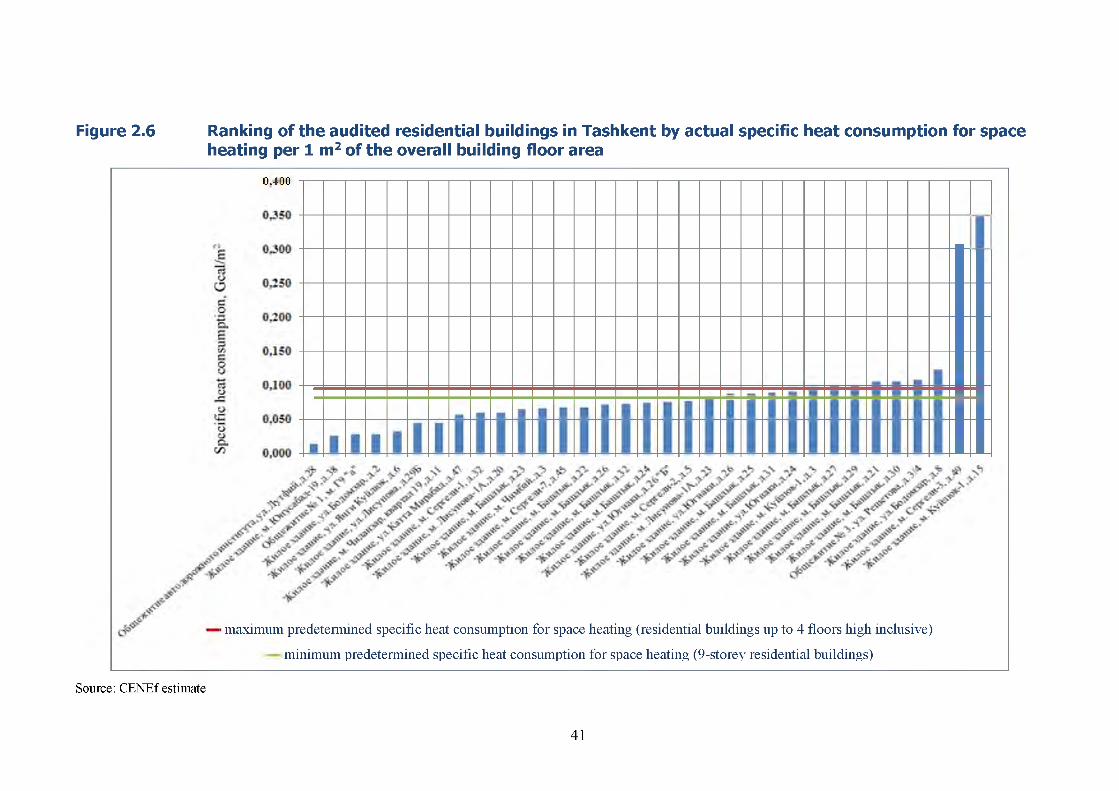
Figure 2.6 Ranking of the audited residential buildings in Tashkent by actual specific heat consumption for spaceheating per 1 m2 of the overall building floor area
0.400
■ m axim um predeterm ined specific heat consum ption fo r space heating (residential build ings up to 4 floors h igh inclusive)
m inim um predeterm ined specific heat consum ption fo r space heating (9-storey residential buildings)
Source: CENEf estimate
41
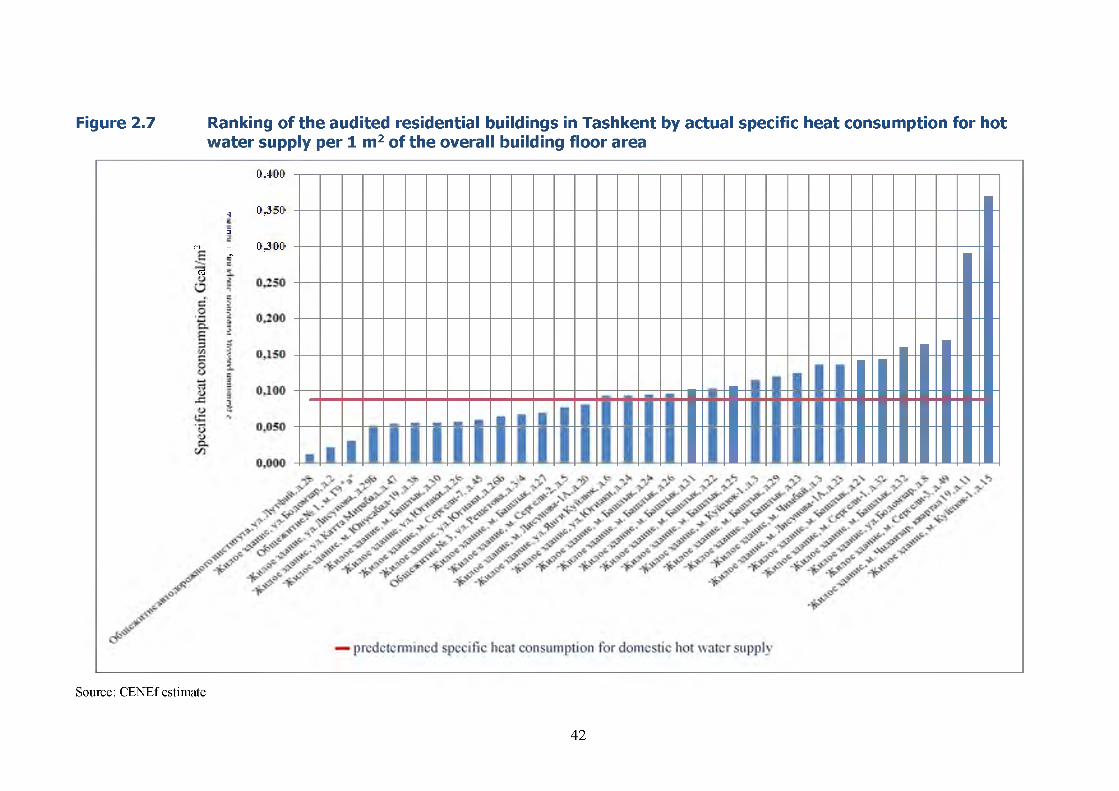
0,400 -r----- ----------- ----- ----------- ----- ----------- ----- ----------- ----- ----------- ----- ----------- ----- ----- ----- ----- ----------- ----- ----- ----- ----- ----------- ----- -----------
4 0,350 -------------------------------------------------------------------------------------------------------------------------------------------------------------------------------------------- ----
5c, - 0,300 -------------------------------------------------------------------------------------------------------------------------------------------------------------------------------------------- ----
-Г
Figure 2.7 Ranking of the audited residential buildings in Tashkent by actual specific heat consumption for hotwater supply per 1 m2 of the overall building floor area
c3
Source: CENEf estimate
42
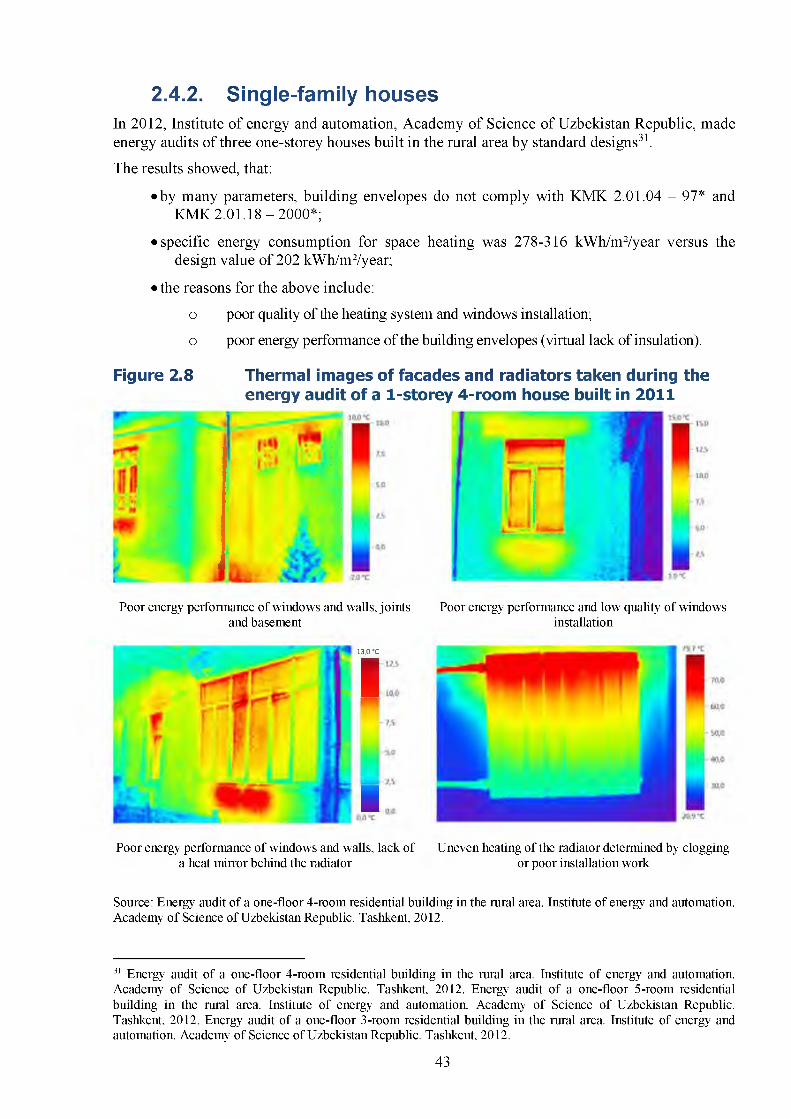
2.4.2. Single-family housesIn 2012, Institute o f energy and automation, Academy o f Science o f Uzbekistan Republic, made energy audits o f three one-storey houses built in the rural area by standard designs31.
The results showed, that:
• by many parameters, building envelopes do not comply with KMK 2.01.04 - 97* andKMK 2 .0 1 .18 -2000* ;
• specific energy consumption for space heating was 278-316 kW h/m2/year versus thedesign value o f 202 kW h/m2/year;
• the reasons for the above include:
о poor quality of the heating system and windows installation;
о poor energy performance of the building envelopes (virtual lack of insulation).
Figure 2.8 Thermal images of facades and radiators taken during the energy audit of a 1-storey 4-room house built in 2011
Poor energy performance of windows and walls, joints Poor energy performance and low quality of windows and basement installation
Poor energy performance of windows and walls, lack of Uneven heating of the radiator determined by clogging a heat mirror behind the radiator or poor installation work
Source: Energy audit o f a one-floor 4-room residential building in the rural area. Institute of energy and automation. Academy o f Science of Uzbekistan Republic. Tashkent, 2012.
31 Energy audit of a one-floor 4-room residential building in the rural area. Institute of energy and automation. Academy of Science of Uzbekistan Republic. Tashkent, 2012. Energy audit of a one-floor 5-room residential building in the rural area. Institute of energy and automation. Academy of Science of Uzbekistan Republic. Tashkent, 2012. Energy audit of a one-floor 3-room residential building in the rural area. Institute of energy and automation. Academy of Science of Uzbekistan Republic. Tashkent, 2012.
13,0 "C
I
.
43
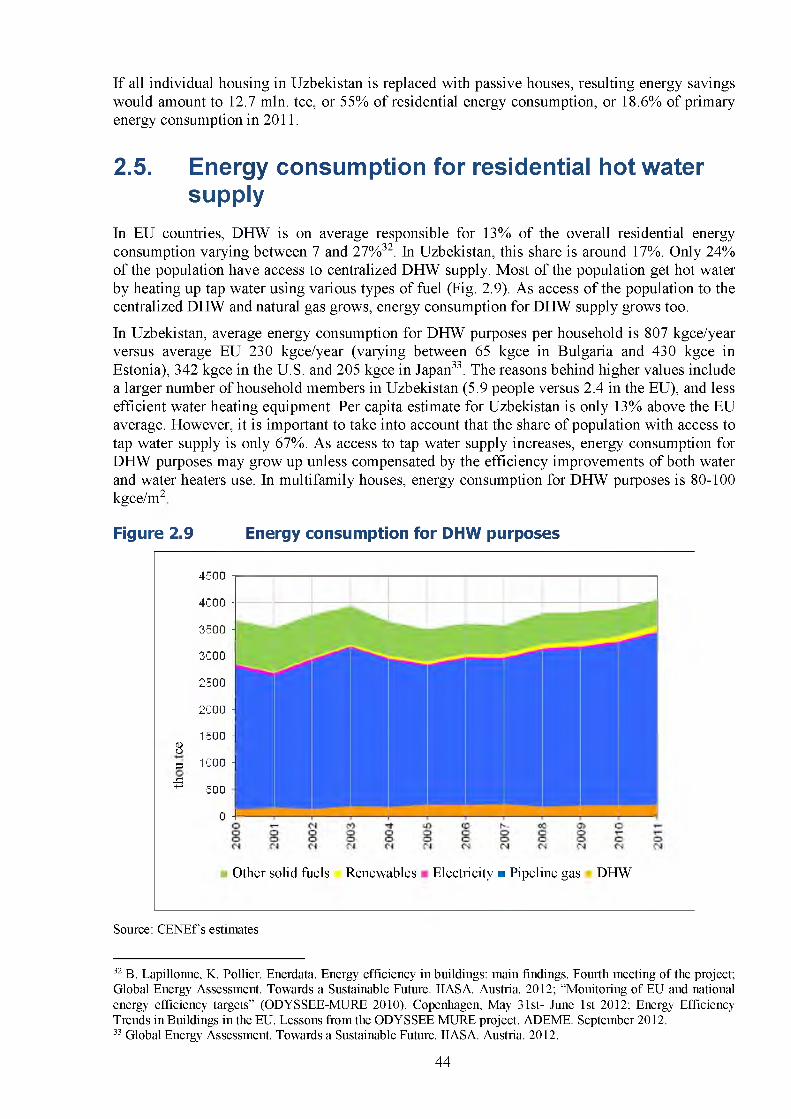
2.5. Energy consumption for residential hot water supply
In EU countries, DHW is on average responsible for 13% of the overall residential energy consumption varying between 7 and 27%32. In Uzbekistan, this share is around 17%. Only 24% of the population have access to centralized DHW supply. Most of the population get hot water by heating up tap water using various types of fuel (Fig. 2.9). As access of the population to the centralized DHW and natural gas grows, energy consumption for DHW supply grows too.
In Uzbekistan, average energy consumption for DHW purposes per household is 807 kgce/year versus average EU 230 kgce/year (varying between 65 kgee in Bulgaria and 430 kgee in Estonia), 342 kgee in the U.S. and 205 kgee in Japan33. The reasons behind higher values include a larger number of household members in Uzbekistan (5.9 people versus 2.4 in the EU), and less efficient water heating equipment. Per capita estimate for Uzbekistan is only 13% above the EU average. However, it is important to take into account that the share of population with access to tap water supply is only 67%. As access to tap water supply increases, energy consumption for DHW purposes may grow up unless compensated by the efficiency improvements of both water and water heaters use. In multifamily houses, energy consumption for DHW purposes is 80-100 kgce/m2
Figure 2.9 Energy consumption for DHW purposes
If all individual housing in Uzbekistan is replaced with passive houses, resulting energy savingswould amount to 12.7 mln. tee, or 55% of residential energy consumption, or 18.6% of primaryenergy consumption in 2011.
4500 и
4000 -
3500 -j
3000
2500
2000 \ 1500 ]ОО
з 1000 ]
* 500
о 4
Other solid fuels Renewables Electricity ■ Pipeline gas DHW
Source: CENEf s estimates
32 B. Lapillonne, K. Pollier. Enerdata. Energy efficiency in buildings: main findings. Fourth meeting of the project; Global Energy Assessment. Towards a Sustainable Future. HAS A. Austria. 2012; “Monitoring of EU and national energy efficiency targets” (ODYSSEE-MURE 2010). Copenhagen, May 31st- June 1st 2012; Energy Efficiency Trends in Buildings in the EU. Lessons from the ODYSSEE MURE project. ADEME. September 2012.33 Global Energy Assessment. Towards a Sustainable Future. IIASA. Austria. 2012.
44
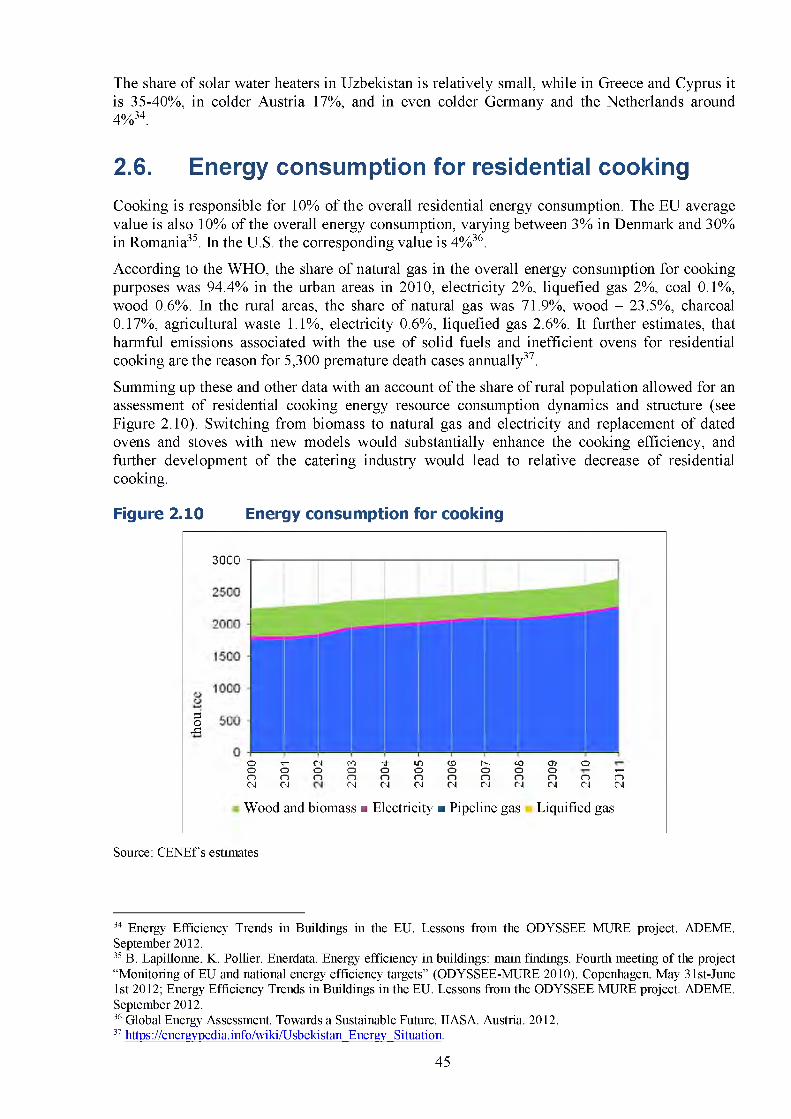
The share of solar water heaters in Uzbekistan is relatively small, while in Greece and Cyprus it is 35-40%, in colder Austria 17%, and in even colder Germany and the Netherlands around4%34.
2.6. Energy consumption for residential cookingCooking is responsible for 10% of the overall residential energy consumption. The EU average value is also 10% of the overall energy consumption, varying between 3% in Denmark and 30% in Romania35. In the U.S. the corresponding value is 4%36.
According to the WHO, the share of natural gas in the overall energy consumption for cooking purposes was 94.4% in the urban areas in 2010, electricity 2%, liquefied gas 2%, coal 0.1%, wood 0.6%. In the rural areas, the share of natural gas was 71.9%, wood - 23.5%, charcoal0.17%, agricultural waste 1.1%, electricity 0.6%, liquefied gas 2.6%. It further estimates, that harmful emissions associated with the use of solid fuels and inefficient ovens for residential cooking are the reason for 5,300 premature death cases annually37.
Summing up these and other data with an account of the share of rural population allowed for an assessment of residential cooking energy resource consumption dynamics and structure (see Figure 2.10). Switching from biomass to natural gas and electricity and replacement of dated ovens and stoves with new models would substantially enhance the cooking efficiency, and further development of the catering industry would lead to relative decrease of residential cooking.
Figure 2.10 Energy consumption for cooking
3о-a
Wood and biomass ■ Electricity ■ Pipeline gas Liquified gas
Source: CENEf s estimates
34 Energy Efficiency Trends in Buildings in the EU. Lessons from the ODYSSEE MURE project. ADEME. September 2012.35 B. Lapillonne, K. Pollier. Enerdata. Energy efficiency in buildings: main findings. Fourth meeting of the project “Monitoring of EU and national energy efficiency targets” (ODYSSEE-MURE 2010). Copenhagen, May 31st-June 1st 2012; Energy Efficiency Trends in Buildings in the EU. Lessons from the ODYSSEE MURE project. ADEME. September 2012.36 Global Energy Assessment. Towards a Sustainable Future. IIASA. Austria. 2012.37 https://energypedia.info/wiki/Usbekistan Energy Situation.
3000
О ч— сч со 'ф ю со Г'*- СО о> оо О о о о о о о о О т—о о о о о о о о о о о о<N Osl СМ С\| см OJ IN СЧ см сч IN
45
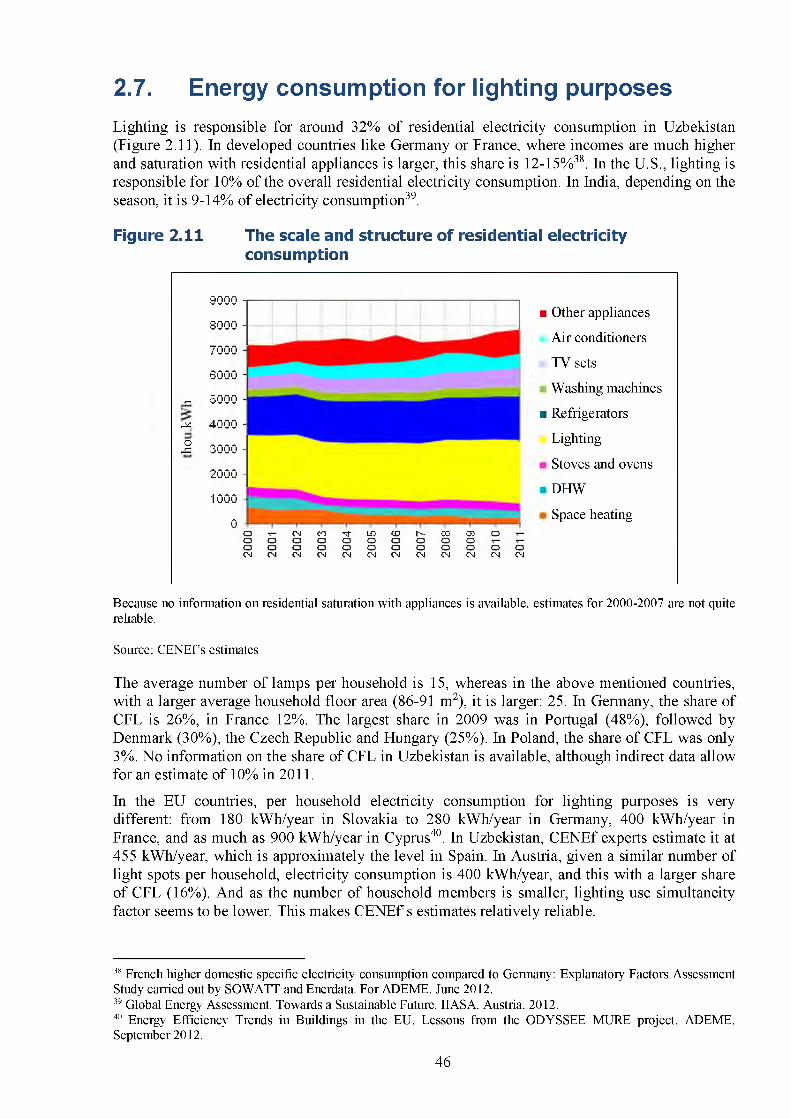
2.7. Energy consumption for lighting purposesLighting is responsible for around 32% of residential electricity consumption in Uzbekistan (Figure 2.11). In developed countries like Germany or France, where incomes are much higher and saturation with residential appliances is larger, this share is 12-15%38. In the U.S., lighting is responsible for 10% of the overall residential electricity consumption. In India, depending on the season, it is 9-14% of electricity consumption39.
Figure 2.11 The scale and structure of residential electricity consumption
9000 -
8000 -
7000 -
6000 -
- 5000 -
^4 4000 -
Я зооо - 2000 -
1000 -
0 -O T - C 4 C O T t L D C O h - C O C D O T - O O O O O O O O O O ^ ^o o o o o o o o o o o o с ч с ч с ч с ч с ч с ч с ч с ч с ч с ч с ч с ч
Because no information on residential saturation with appliances is available, estimates for 2000-2007 are not quite reliable.
Source: CENEfs estimates
The average number of lamps per household is 15, whereas in the above mentioned countries, with a larger average household floor area (86-91 m2), it is larger: 25. In Germany, the share of CFL is 26%, in France 12%. The largest share in 2009 was in Portugal (48%), followed by Denmark (30%), the Czech Republic and Hungary (25%). In Poland, the share of CFL was only 3%. No information on the share of CFL in Uzbekistan is available, although indirect data allow for an estimate of 10% in 2011.
In the EU countries, per household electricity consumption for lighting purposes is very different: from 180 kWh/year in Slovakia to 280 kWh/year in Germany, 400 kWh/year in France, and as much as 900 kWh/year in Cyprus40. In Uzbekistan, CENEf experts estimate it at 455 kWh/year, which is approximately the level in Spain. In Austria, given a similar number of light spots per household, electricity consumption is 400 kWh/year, and this with a larger share of CFL (16%). And as the number of household members is smaller, lighting use simultaneity factor seems to be lower. This makes CEN Efs estimates relatively reliable.
38 French higher domestic specific electricity consumption compared to Germany: Explanatory Factors Assessment Study carried out by SOWATT and Enerdata. For ADEME. June 2012.39 Global Energy Assessment. Towards a Sustainable Future. IIASA. Austria. 2012.411 Energy Efficiency Trends in Buildings in the EU. Lessons from the ODYSSEE MURE project. ADEME. September 2012.
■ Other appliances
Air conditioners
TV sets
Washing machines
■ Refrigerators
Lighting
Stoves and ovens
■ DHW
Space heating
46
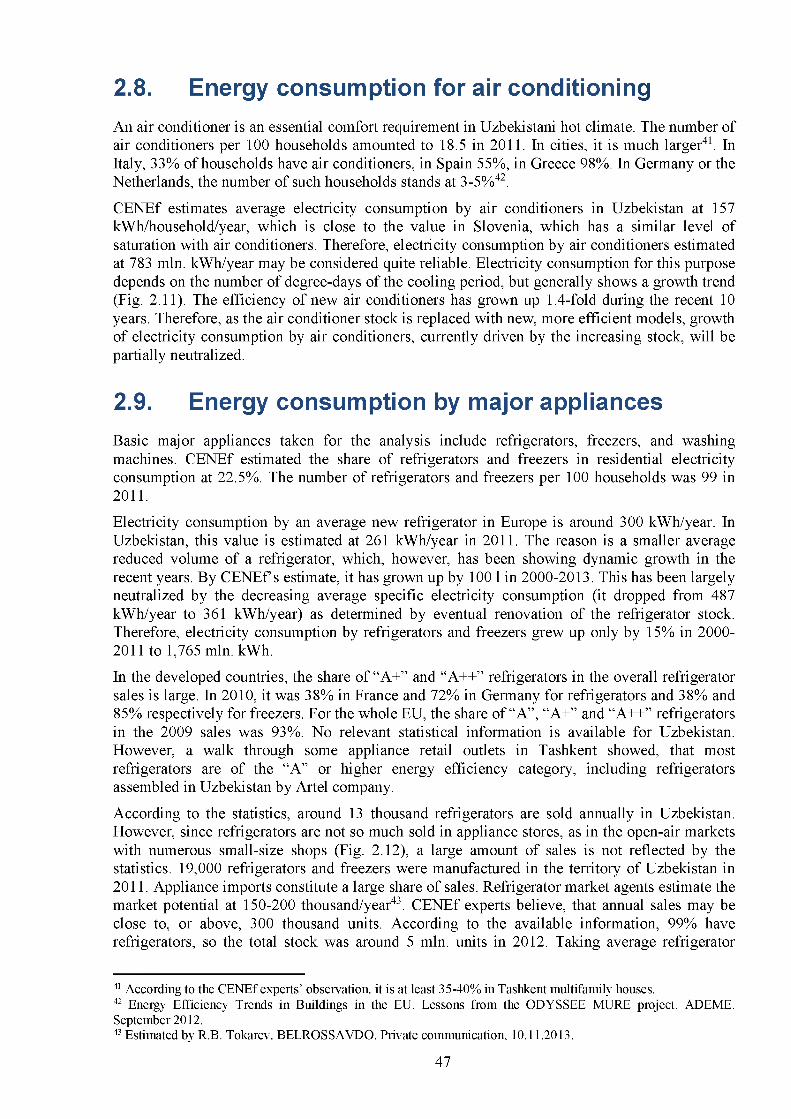
2.8. Energy consumption for air conditioningAn air conditioner is an essential comfort requirement in Uzbekistani hot climate. The number of air conditioners per 100 households amounted to 18.5 in 2011. In cities, it is much larger41. In Italy, 33% of households have air conditioners, in Spain 55%, in Greece 98%. In Germany or the Netherlands, the number of such households stands at 3-5%42.
CENEf estimates average electricity consumption by air conditioners in Uzbekistan at 157 kWh/household/year, which is close to the value in Slovenia, which has a similar level of saturation with air conditioners. Therefore, electricity consumption by air conditioners estimated at 783 mln. kWh/year may be considered quite reliable. Electricity consumption for this purpose depends on the number of degree-days of the cooling period, but generally shows a growth trend (Fig. 2.11). The efficiency of new air conditioners has grown up 1.4-fold during the recent 10 years. Therefore, as the air conditioner stock is replaced with new, more efficient models, growth of electricity consumption by air conditioners, currently driven by the increasing stock, will be partially neutralized.
2.9. Energy consumption by major appliancesBasic major appliances taken for the analysis include refrigerators, freezers, and washing machines. CENEf estimated the share of refrigerators and freezers in residential electricity consumption at 22.5%. The number of refrigerators and freezers per 100 households was 99 in 2011 .
Electricity consumption by an average new refrigerator in Europe is around 300 kWh/year. In Uzbekistan, this value is estimated at 261 kWh/year in 2011. The reason is a smaller average reduced volume of a refrigerator, which, however, has been showing dynamic growth in the recent years. By CENEf s estimate, it has grown up by 100 1 in 2000-2013. This has been largely neutralized by the decreasing average specific electricity consumption (it dropped from 487 kWh/year to 361 kWh/year) as determined by eventual renovation of the refrigerator stock. Therefore, electricity consumption by refrigerators and freezers grew up only by 15% in 2000- 2011 to 1,765 mln. kWh.
In the developed countries, the share of “A+” and “A++” refrigerators in the overall refrigerator sales is large. In 2010, it was 38% in France and 72% in Germany for refrigerators and 38% and 85% respectively for freezers. For the whole EU, the share of “A”, “A+” and “A++” refrigerators in the 2009 sales was 93%. No relevant statistical information is available for Uzbekistan. However, a walk through some appliance retail outlets in Tashkent showed, that most refrigerators are of the “A” or higher energy efficiency category, including refrigerators assembled in Uzbekistan by Artel company.
According to the statistics, around 13 thousand refrigerators are sold annually in Uzbekistan. However, since refrigerators are not so much sold in appliance stores, as in the open-air markets with numerous small-size shops (Fig. 2.12), a large amount of sales is not reflected by the statistics. 19,000 refrigerators and freezers were manufactured in the territory of Uzbekistan in 2011. Appliance imports constitute a large share of sales. Refrigerator market agents estimate the market potential at 150-200 thousand/year43. CENEf experts believe, that annual sales may be close to, or above, 300 thousand units. According to the available information, 99% have refrigerators, so the total stock was around 5 mln. units in 2012. Taking average refrigerator
41 According to the CENEf experts’ observation, it is at least 35-40% in Tashkent multifamily houses.42 Energy Efficiency Trends in Buildings in the EU. Lessons from the ODYSSEE MURE project. ADEME. September 2012.43 Estimated by R.B. Tokarev, BELROSSAVDO. Private communication, 10.11.2013.
47
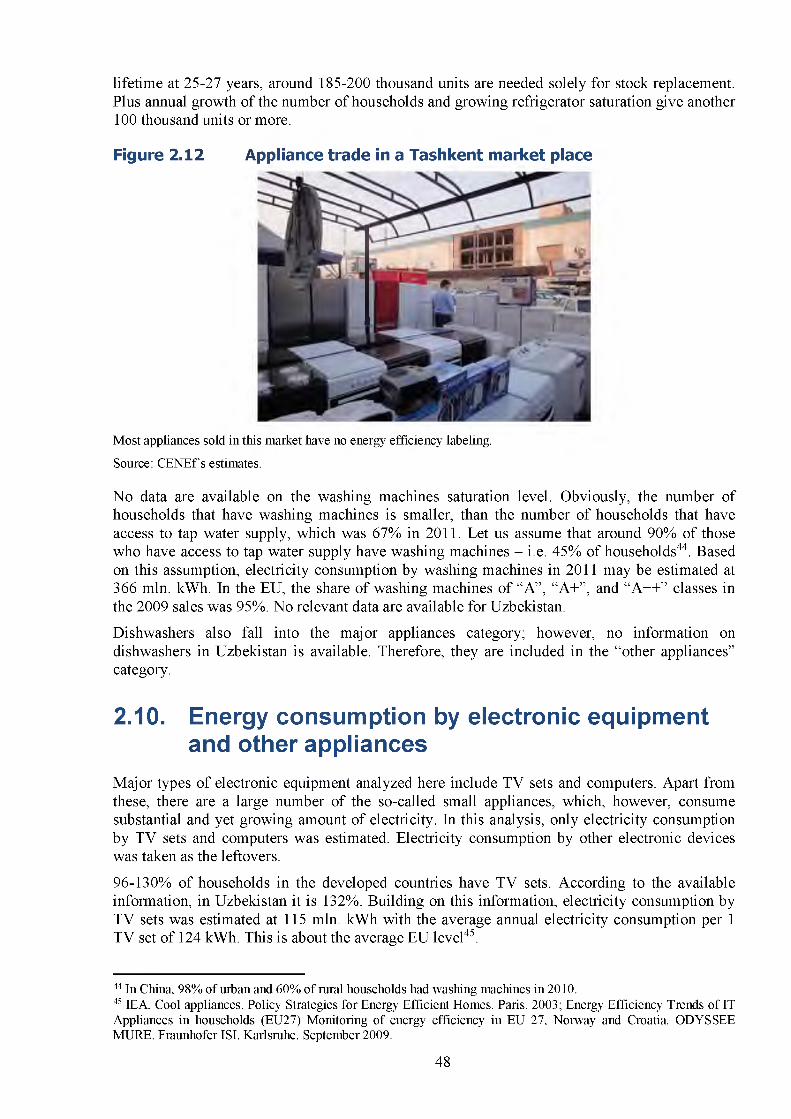
lifetime at 25-27 years, around 185-200 thousand units are needed solely for stock replacement. Plus annual growth of the number of households and growing refrigerator saturation give another 100 thousand units or more.
Figure 2.12 Appliance trade in a Tashkent market place
Most appliances sold in this market have no energy efficiency labeling.
Source: CENEf s estimates.
No data are available on the washing machines saturation level. Obviously, the number of households that have washing machines is smaller, than the number of households that have access to tap water supply, which was 67% in 2011. Let us assume that around 90% of those who have access to tap water supply have washing machines - i.e. 45% of households44. Based on this assumption, electricity consumption by washing machines in 2011 may be estimated at 366 mln. kWh. In the EU, the share of washing machines of “A”, “A+”, and “A++” classes in the 2009 sales was 95%. No relevant data are available for Uzbekistan.
Dishwashers also fall into the major appliances category; however, no information on dishwashers in Uzbekistan is available. Therefore, they are included in the “other appliances” category.
2.10. Energy consumption by electronic equipment and other appliances
Major types of electronic equipment analyzed here include TV sets and computers. Apart from these, there are a large number of the so-called small appliances, which, however, consume substantial and yet growing amount of electricity. In this analysis, only electricity consumption by TV sets and computers was estimated. Electricity consumption by other electronic devices was taken as the leftovers.
96-130% of households in the developed countries have TV sets. According to the available information, in Uzbekistan it is 132%. Building on this information, electricity consumption by TV sets was estimated at 115 mln. kWh with the average annual electricity consumption per 1 TV set of 124 kWh. This is about the average EU level45.
44 In China, 98% of urban and 60% of rural households had washing machines in 2010.45IEA. Cool appliances. Policy Strategies for Energy Efficient Homes. Paris. 2003; Energy Efficiency Trends of IT Appliances in households (EU27) Monitoring of energy efficiency in EU 27, Norway and Croatia. ODYSSEE MURE. Fraunhofer ISI. Karlsruhe. September 2009.
48
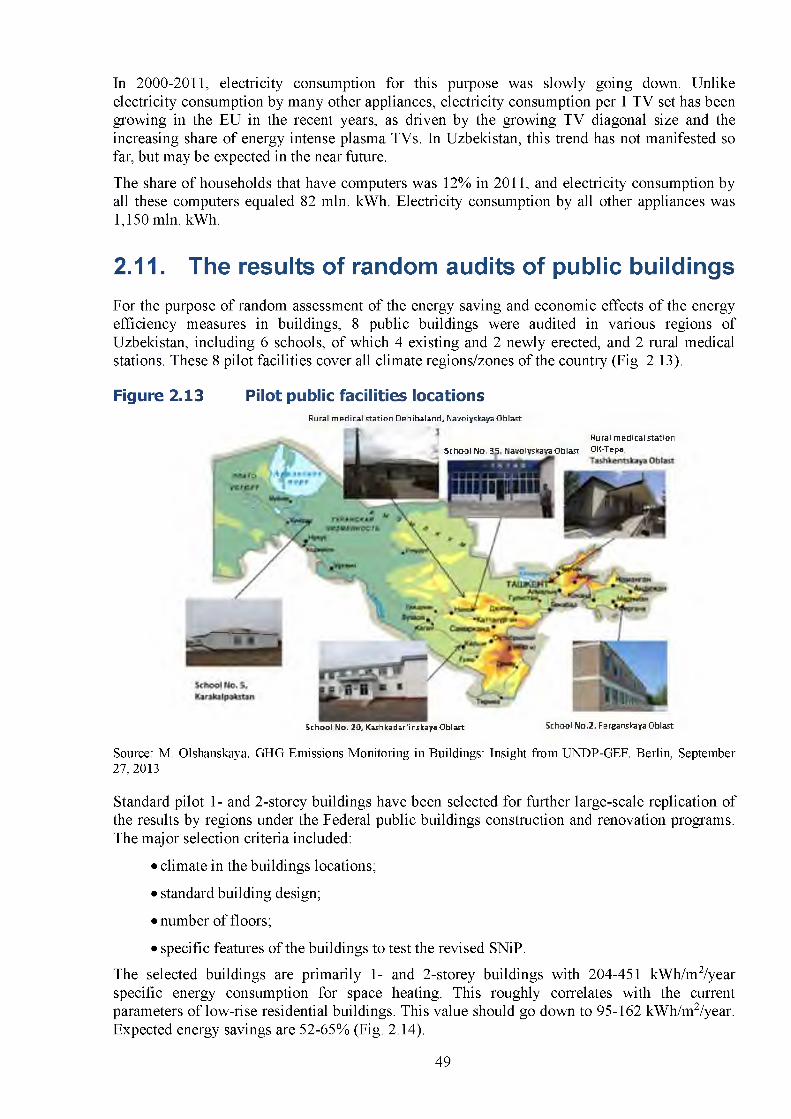
In 2000-2011, electricity consumption for this purpose was slowly going down. Unlike electricity consumption by many other appliances, electricity consumption per 1 TV set has been growing in the EU in the recent years, as driven by the growing TV diagonal size and the increasing share of energy intense plasma TVs. In Uzbekistan, this trend has not manifested so far, but may be expected in the near future.
The share of households that have computers was 12% in 2011, and electricity consumption by all these computers equaled 82 mln. kWh. Electricity consumption by all other appliances was 1,150 mln. kWh.
2.11. The results of random audits of public buildingsFor the purpose of random assessment of the energy saving and economic effects of the energy efficiency measures in buildings, 8 public buildings were audited in various regions of Uzbekistan, including 6 schools, of which 4 existing and 2 newly erected, and 2 rural medical stations. These 8 pilot facilities cover all climate regions/zones of the country (Fig. 2.13).
Figure 2.13 Pilot public facilities locationsRural medical station Dehibaland, Navoiyskaya Oblast
Rural medical station School No. 3*5, Navoiyskaya Oblast OK-Tepa,
School No. 20, Kashkadar’inskaya Oblast School No.2, Ferganskaya Oblast
Source: M. Olshanskaya. GHG Emissions Monitoring in Buildings: Insight from UNDP-GEF. Berlin, September 27, 2013
Standard pilot 1- and 2-storey buildings have been selected for further large-scale replication of the results by regions under the Federal public buildings construction and renovation programs. The major selection criteria included:
• climate in the buildings locations;
• standard building design;
• number of floors;
• specific features of the buildings to test the revised SNiP.
The selected buildings are primarily 1- and 2-storey buildings with 204-451 kWh/m2/year specific energy consumption for space heating. This roughly correlates with the current parameters of low-rise residential buildings. This value should go down to 95-162 kWh/m2/year. Expected energy savings are 52-65% (Fig. 2.14).
49
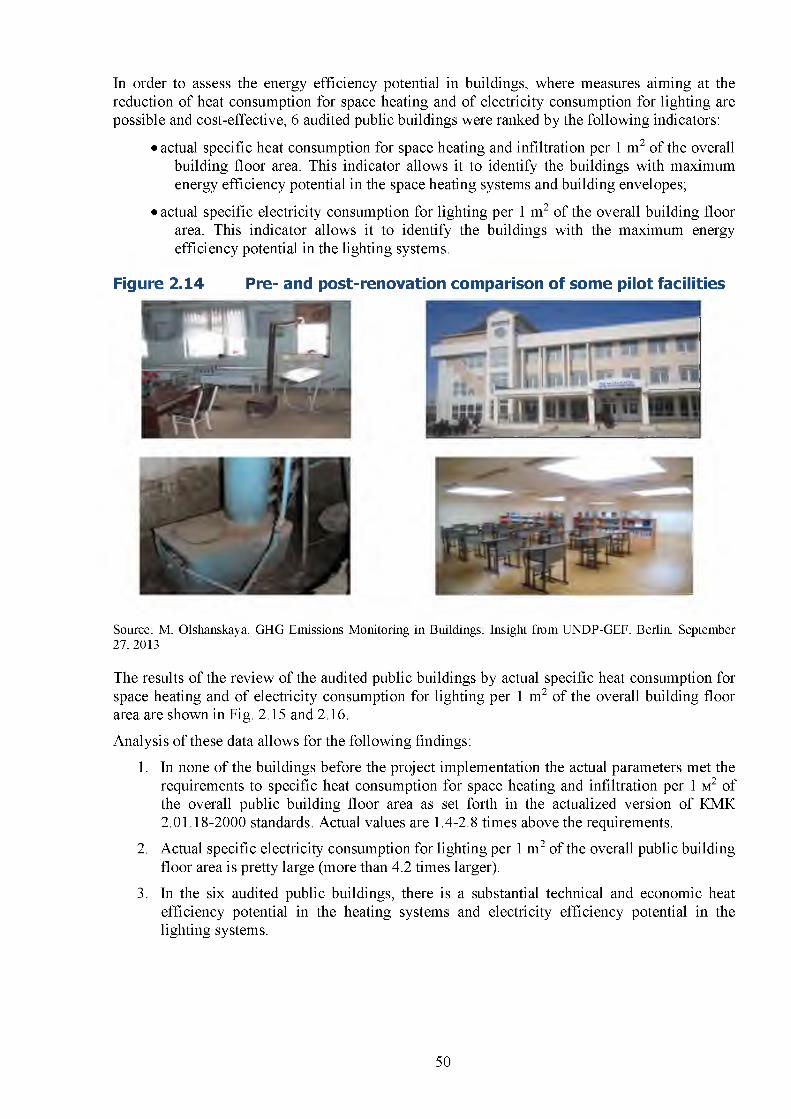
In order to assess the energy efficiency potential in buildings, where measures aiming at the reduction of heat consumption for space heating and of electricity consumption for lighting are possible and cost-effective, 6 audited public buildings were ranked by the following indicators:
• actual specific heat consumption for space heating and infiltration per 1 m2 of the overallbuilding floor area. This indicator allows it to identify the buildings with maximum energy efficiency potential in the space heating systems and building envelopes;
• actual specific electricity consumption for lighting per 1 m2 of the overall building floorarea. This indicator allows it to identify the buildings with the maximum energy efficiency potential in the lighting systems.
Figure 2.14 Pre- and post-renovation comparison of some pilot facilities
Source: M. Olshanskaya. GHG Emissions Monitoring in Buildings: Insight from UNDP-GEF. Berlin, September 27,2013
The results of the review of the audited public buildings by actual specific heat consumption for space heating and of electricity consumption for lighting per 1 m2 of the overall building floor area are shown in Fig. 2.15 and 2.16.
Analysis of these data allows for the following findings:
1. In none of the buildings before the project implementation the actual parameters met the requirements to specific heat consumption for space heating and infiltration per 1 m 2 of the overall public building floor area as set forth in the actualized version of KMK2.01.18-2000 standards. Actual values are 1.4-2.8 times above the requirements.
2. Actual specific electricity consumption for lighting per 1 m2 of the overall public building floor area is pretty large (more than 4.2 times larger).
3. In the six audited public buildings, there is a substantial technical and economic heat efficiency potential in the heating systems and electricity efficiency potential in the lighting systems.
50
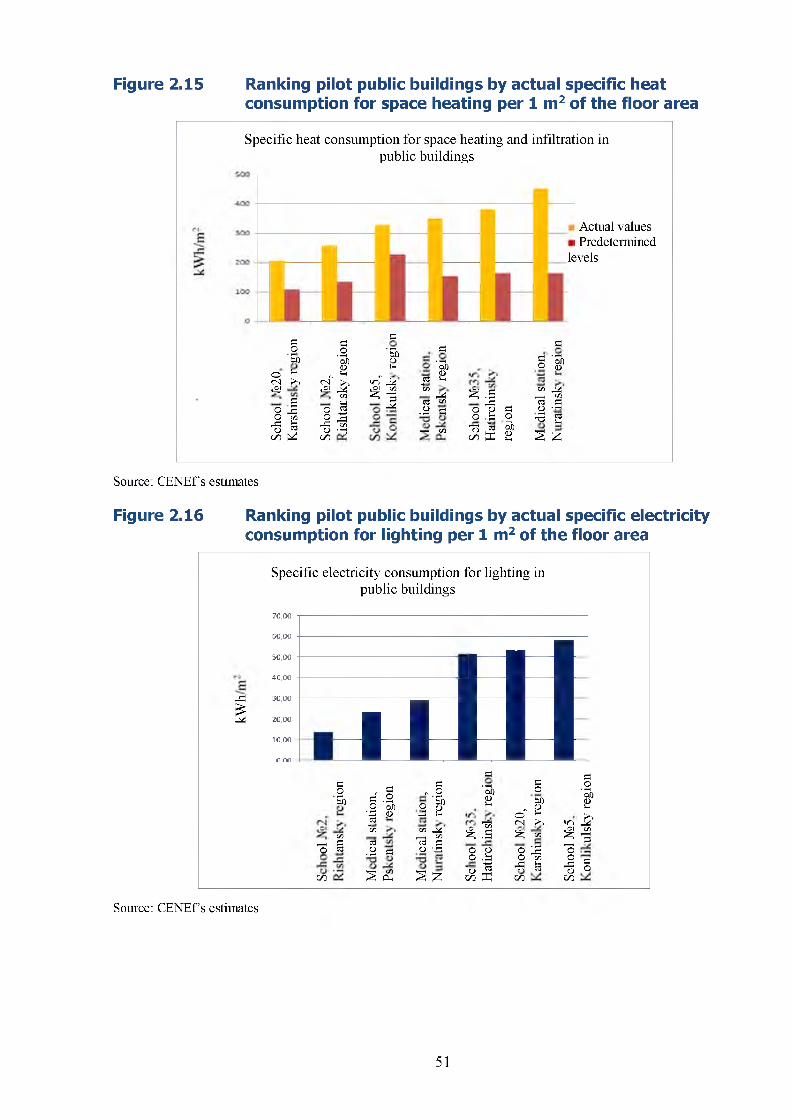
Figure 2.15 Ranking pilot public buildings by actual specific heatconsumption for space heating per 1 m2 of the floor area
Specific heat consumption for space heating and infiltration in public buildings
Actual values i Predetermined
levels
яо'So
° £ fN >> (£!я
9, ^О сn Л Ь О ^00 W
йо’3)(D л *н<N ^ «°! ̂се
о §9 S1-М с/з О --J 05
Й
’3)(D*нг-«о J4 ,о\ с/з ̂3 ̂
Й
’3)о*н031/3 М Й м.а яЧ—( С/3
ЙО
й’3)о
Ъ .3 й̂ ° во .U 73 te 5Ь и Д 2
ЙО
и ^1—1 СЛй ЙО • rt■3 2S £
Source: CENEf s estimates
Figure 2.16 Ranking pilot public buildings by actual specific electricity consumption for lighting per 1 m2 of the floor area
-aI
Specific electricity consumption for lighting in public buildings
70.00
60.00
50.00
40.00
30.00
20.00
10,00
n nn
ЙО’3)
- 1О Й
00
Г. йй .2О ед\й р СЗ 1/2 СЗ.а яV—( СО2 Он
Й- .°
о "БЬо (D+2 *нт ^41—( слСв Й О \Д
S 2
nrl11г!NII
й’3)о*н
йо
-а£.до о о .ь■о 3оо Д
ад„ и
° £ (N >>^ И§ i ̂ ta
00
«оSоо-йо00
йо’3)о
*н
£С/З3йо
Source: CENEf s estimates
51
Е The shape of heat supply systems
3.1. Heat balanceThe Uzbekistan Republic does not develop heat balances. According to the Federal committee of the Uzbekistan Republic, heat production was 33.7 mln. Gcal in 2009 and 32.3 mln. Gcal in 201046. Data from the same source show, that heat supply (obviously, to the grid) was 33.4 and 30.4 mln. Gcal respectively. Therefore, heat sources own needs amounted to 1.9 mln. Gcal in 2010. According to the Ministry of Economy, heat consumption countrywide for own needs and process losses was around 1,440 thou. Gcal.
Heat supply to end-users equaled 22.1 and 19.5 mln. Gcal respectively, including 11 and 10.6 mln. Gcal to the residential sector. The latter figure shows heat supply to the urban population, taking no account of the rural population. CENEf estimated overall 2010 residential heat consumption at 12.5 mln. Gcal. The difference between overall heat supply and heat supply to “own” customers may be either supply to retailers (heating networks) or consumption for heat source owners’ own (process) needs.
According to the “Concept of the Uzbekistan Republic heat supply system reform for 2010- 2020”, only 14.7 mln. Gcal of heat were produced in 2008, of which 7.8 mln. Gcal were sold, including 5.2 mln. Gcal to the residential sector47. Therefore, heat production estimates differ more than 2-fold. This difference can be explained by the fact that the statistical data cover all heat sources, including industrial boilers that only produce heat to meet the process demand, whereas the data presented in the “Concept” only cover heat sources that belong to the government or a municipality or sources with tariff regulation.
According to the Ministry of Economy, 13.7 mln. Gcal of heat were produced in 2011, of which heat losses amounted to nearly 5.6 mln. Gcal, or 41% of heat production. In reality, available data show, that pre-determined transportation and distribution losses amount to 10%, the remaining being excess losses, leakage, or siphoning off (one purpose being the use of hot water from the space heating system as DHW). The TACIS project estimated distribution heat losses approximately equal to 29%, of which 24% relate to heat distribution networks and 5% to in- house space heating systems.
If we assume that heat distribution losses are 25%, they amount to 7.7 mln. Gcal versus 30.4 mln. Gcal supplied to the grid. Then Uzbekistan heat balance as of 2010 may look as follows (mln. Gcal):
Heat production 32.3Heat supply own needs 1.9Heat supply to the grid 30.4Heat distribution losses 7.7-8.4'Heat sales to customers 22.7Industrial customers 7.2Commercial and other customers 3.0Residential customers 12.5
Estimation accuracy of the heat balance parameters leaves much to be desired. Estimation accuracy of residential heat consumption is +10%.
46 Uzbekistan housing sector in 2012. Uzbekistan Republic federal committee.47 Minutes of the 20.12.2009 meeting of the commission for fuel and energy resource savings “On the approval and implementation of the first-stage measures of the Concept of heat supply system reform in the Uzbekistan Republic for 2010-2020”.48 CENEf s upper estimate (Table 3.6).
52
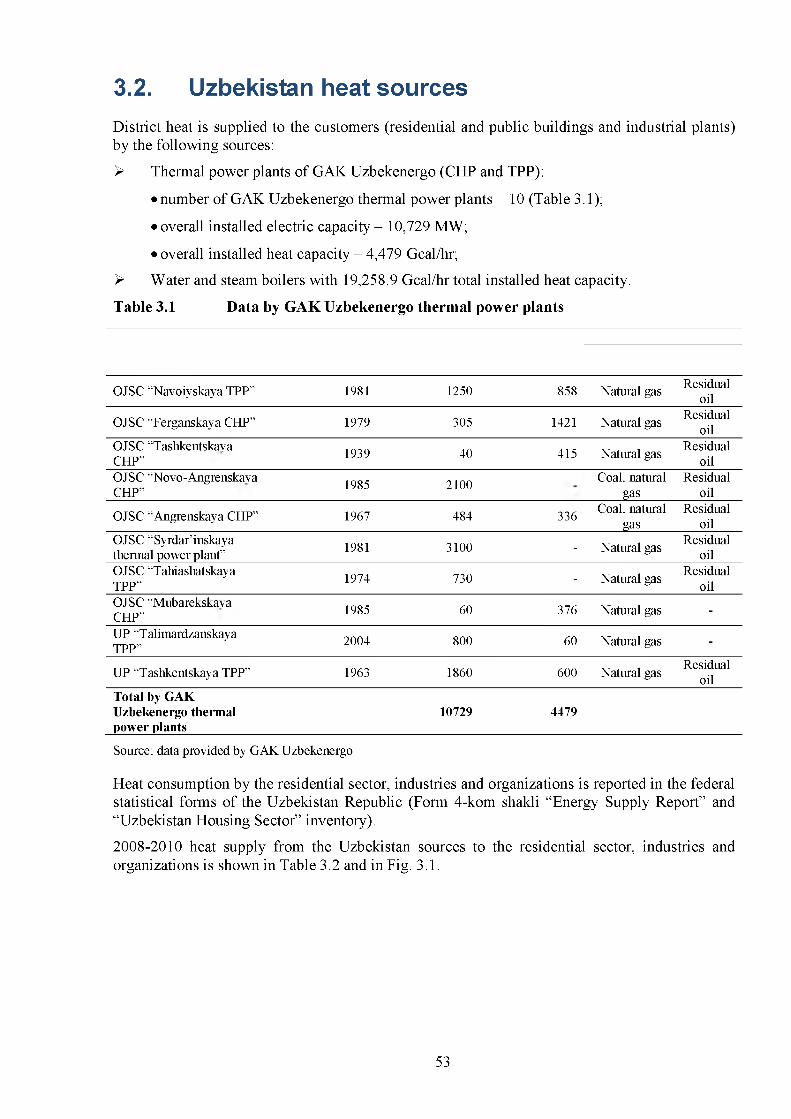
3.2. Uzbekistan heat sourcesDistrict heat is supplied to the customers (residential and public buildings and industrial plants) by the following sources:
> Thermal power plants of GAK Uzbekenergo (CHP and TPP):
• number of GAK Uzbekenergo thermal power plants - 10 (Table 3.1);
• overall installed electric capacity - 10,729 MW;
• overall installed heat capacity - 4,479 Gcal/hr;
> Water and steam boilers with 19,258.9 Gcal/hr total installed heat capacity.
Table 3.1 Data by GAK Uzbekenergo thermal power plants
OJSC “Navoiyskaya TPP” 1981 1250 858 Natural gas Residualoil
OJSC “Ferganskaya CHP” 1979 305 1421 Natural gas Residualoil
OJSC “Tashkentskaya CHP” 1939 40 415 Natural gas Residual
oilOJSC “Novo-Angrenskaya 1985 2100 Coal, natural ResidualCHP” gas oil
OJSC “Angrenskaya CHP” 1967 484 336 Coal, natural gas
Residualoil
OJSC “Syrdar’inskaya thermal power plant” 1981 3100 - Natural gas Residual
oilOJSC “Tahiashatskaya TPP”
1974 730 - Natural gas Residualoil
OJSC “Mubarekskaya CHP” 1985 60 376 Natural gas -
UP “Talimardzanskaya TPP”
2004 800 60 Natural gas -
UP “Tashkentskaya TPP” 1963 1860 600 Natural gasResidual
oilTotal by GAKUzbekenergo thermal 10729 4479power plants
Source: data provided by GAK Uzbekenergo
Heat consumption by the residential sector, industries and organizations is reported in the federal statistical forms of the Uzbekistan Republic (Form 4-kom shakli “Energy Supply Report” and “Uzbekistan Housing Sector” inventory).
2008-2010 heat supply from the Uzbekistan sources to the residential sector, industries and organizations is shown in Table 3.2 and in Fig. 3.1.
53
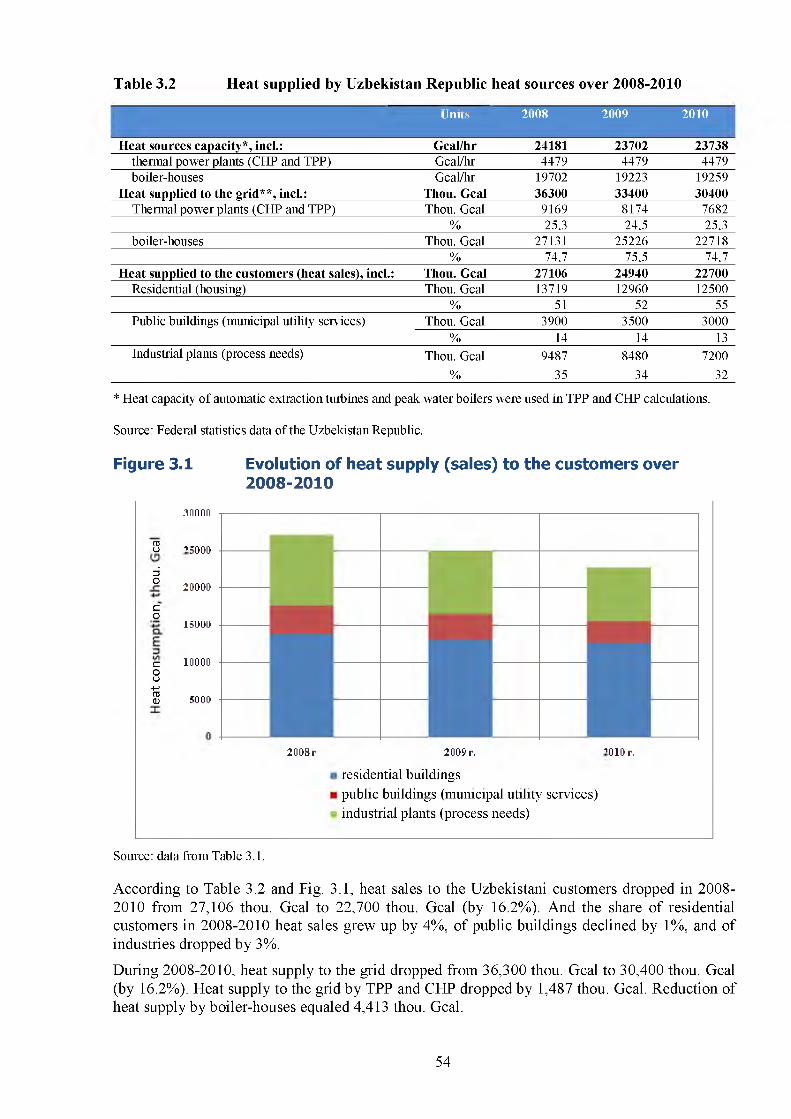
Table 3.2 Heat supplied by Uzbekistan Republic heat sources over 2008-2010
Units 2008 2009 2010
Heat sources capacity*, incl.: Gcal/hr 24181 23702 23738thermal power plants (CHP and TPP) Gcal/hr 4479 4479 4479boiler-houses Gcal/hr 19702 19223 19259
Heat supplied to the grid**, incl.: Thou. Gcal 36300 33400 30400Thermal power plants (CHP and TPP) Thou. Gcal 9169 8174 7682
% 25,3 24,5 25,3boiler-houses Thou. Gcal 27131 25226 22718
% 74,7 75,5 74,7Heat supplied to the customers (heat sales), incl.: Thou. Gcal 27106 24940 22700
Residential (housing) Thou. Gcal 13719 12960 12500% 51 52 55
Public buildings (municipal utility services) Thou. Gcal 3900 3500 3000% 14 14 13
Industrial plants (process needs) Thou. Gcal 9487 8480 7200% 35 34 32
* Heat capacity o f automatic extraction turbines and peak water boilers were used in TPP and CHP calculations.
Source: Federal statistics data of the Uzbekistan Republic.
Figure 3.1 Evolution of heat supply (sales) to the customers over 2008-2010
roиdо
со
сои+-*госи
30000
’ 5000
20000
15000
10 ООО
5000
200&г 2009 г. ’ 010 г.
residential buildingspublic buildings (municipal utility services) industrial plants (process needs)
Source: data from Table 3.1.
According to Table 3.2 and Fig. 3.1, heat sales to the Uzbekistani customers dropped in 2008- 2010 from 27,106 thou. Gcal to 22,700 thou. Gcal (by 16.2%). And the share of residential customers in 2008-2010 heat sales grew up by 4%, of public buildings declined by 1%, and of industries dropped by 3%.
During 2008-2010, heat supply to the grid dropped from 36,300 thou. Gcal to 30,400 thou. Gcal (by 16.2%). Heat supply to the grid by TPP and CHP dropped by 1,487 thou. Gcal. Reduction of heat supply by boiler-houses equaled 4,413 thou. Gcal.
54
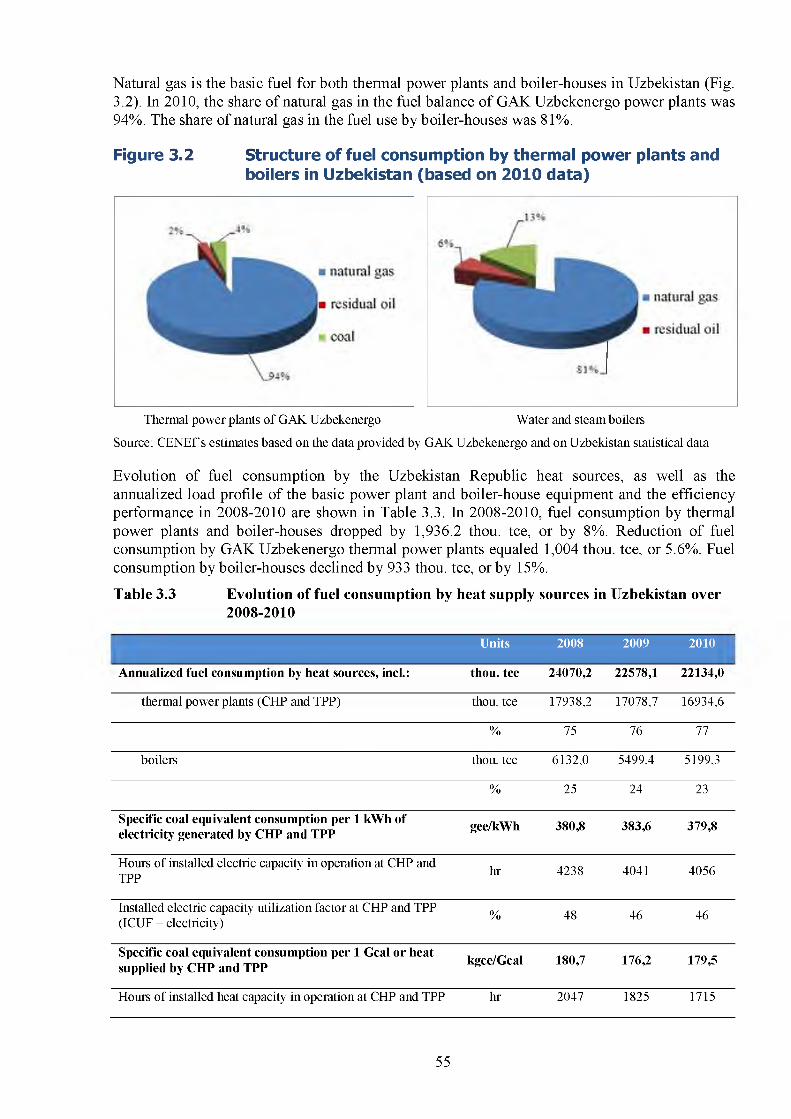
Natural gas is the basic fuel for both thermal power plants and boiler-houses in Uzbekistan (Fig. 3.2). In 2010, the share of natural gas in the fuel balance of GAK Uzbekenergo power plants was 94%. The share of natural gas in the fuel use by boiler-houses was 81%.
Figure 3.2 Structure of fuel consumption by thermal power plants and boilers in Uzbekistan (based on 2010 data)
Thermal power plants of GAK Uzbekenergo Water and steam boilers
Source: CENEf s estimates based on the data provided by GAK Uzbekenergo and on Uzbekistan statistical data
Evolution of fuel consumption by the Uzbekistan Republic heat sources, as well as the annualized load profile of the basic power plant and boiler-house equipment and the efficiency performance in 2008-2010 are shown in Table 3.3. In 2008-2010, fuel consumption by thermal power plants and boiler-houses dropped by 1,936.2 thou, tee, or by 8%. Reduction of fuel consumption by GAK Uzbekenergo thermal power plants equaled 1,004 thou, tee, or 5.6%. Fuel consumption by boiler-houses declined by 933 thou, tee, or by 15%.
Table 3.3 Evolution of fuel consumption by heat supply sources in Uzbekistan over2008-2010
Units 2008 2009 2010
Annualized fuel consumption by heat sources, incl.: thou, tee 24070,2 22578,1 22134,0
thermal power plants (CHP and TPP) thou, tee 17938,2 17078,7 16934,6
% 75 76 77
boilers thou, tee 6132,0 5499,4 5199,3
% 25 24 23
Specific coal equivalent consumption per 1 kWh of electricity generated by CHP and TPP gee/kWh 380,8 383,6 379,8
Hours of installed electric capacity in operation at CHP and TPP hr 4238 4041 4056
Installed electric capacity utilization factor at CHP and TPP (ICUF - electricity) % 48 46 46
Specific coal equivalent consumption per 1 Gcal or heat supplied by CHP and TPP kgce/Gcal 180,7 176,2 179,5
Hours of installed heat capacity in operation at CHP and TPP hr 2047 1825 1715
55
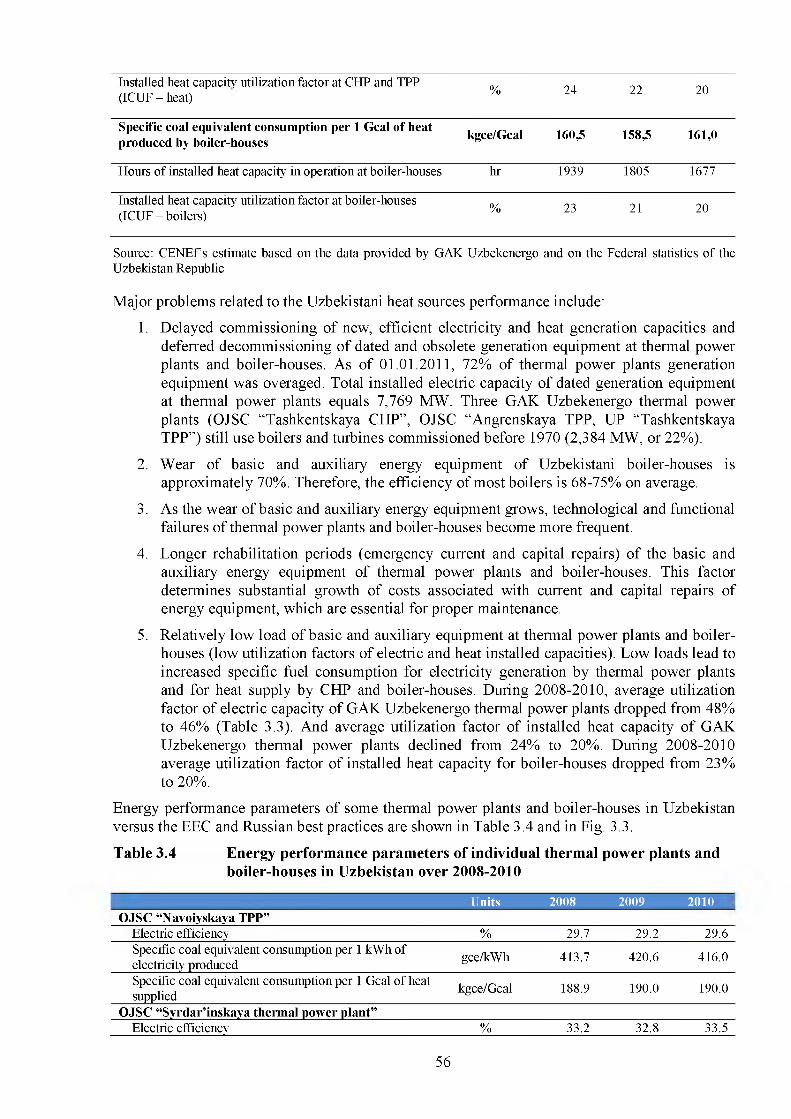
Installed heat capacity utilization factor at CHP and TPP (ICUF - heat) % 24 22 20
Specific coal equivalent consumption per 1 Gcal of heat produced by boiler-houses kgce/Gcal 160,5 158,5 161,0
Hours of installed heat capacity in operation at boiler-houses hr 1939 1805 1677
Installed heat capacity utilization factor at boiler-houses (ICUF - boilers) % 23 21 20
Source: CENEfs estimate based on the data provided by GAK Uzbekenergo and on the Federal statistics of the Uzbekistan Republic
Major problems related to the Uzbekistani heat sources performance include:
1. Delayed commissioning of new, efficient electricity and heat generation capacities and deferred decommissioning of dated and obsolete generation equipment at thermal power plants and boiler-houses. As of 01.01.2011, 72% of thermal power plants generation equipment was overaged. Total installed electric capacity of dated generation equipment at thermal power plants equals 7,769 MW. Three GAK Uzbekenergo thermal power plants (OJSC “Tashkentskaya CHP”, OJSC “Angrenskaya TPP, UP “Tashkentskaya TPP”) still use boilers and turbines commissioned before 1970 (2,384 MW, or 22%).
2. Wear of basic and auxiliary energy equipment of Uzbekistani boiler-houses is approximately 70%. Therefore, the efficiency of most boilers is 68-75% on average.
3. As the wear of basic and auxiliary energy equipment grows, technological and functional failures of thermal power plants and boiler-houses become more frequent.
4. Longer rehabilitation periods (emergency current and capital repairs) of the basic and auxiliary energy equipment of thermal power plants and boiler-houses. This factor determines substantial growth of costs associated with current and capital repairs of energy equipment, which are essential for proper maintenance.
5. Relatively low load of basic and auxiliary equipment at thermal power plants and boiler- houses (low utilization factors of electric and heat installed capacities). Low loads lead to increased specific fuel consumption for electricity generation by thermal power plants and for heat supply by CHP and boiler-houses. During 2008-2010, average utilization factor of electric capacity of GAK Uzbekenergo thermal power plants dropped from 48% to 46% (Table 3.3). And average utilization factor of installed heat capacity of GAK Uzbekenergo thermal power plants declined from 24% to 20%. During 2008-2010 average utilization factor of installed heat capacity for boiler-houses dropped from 23% to 20%.
Energy performance parameters of some thermal power plants and boiler-houses in Uzbekistan versus the EEC and Russian best practices are shown in Table 3.4 and in Fig. 3.3.
Table 3.4 Energy performance parameters of individual thermal power plants andboiler-houses in Uzbekistan over 2008-2010
Units 2008 2009 2010 IOJSC “Navoiyskaya TPP”
Electric efficiency % 29.7 29.2 29.6Specific coal equivalent consumption per 1 kWh of electricity produced
gee/kWh 413.7 420.6 416.0
Specific coal equivalent consumption per 1 Gcal of heat supplied kgce/Gcal 188.9 190.0 190.0
OJSC “Syrdar’inskaya thermal power plant”Electric efficiency % 33.2 32.8 33.5
56
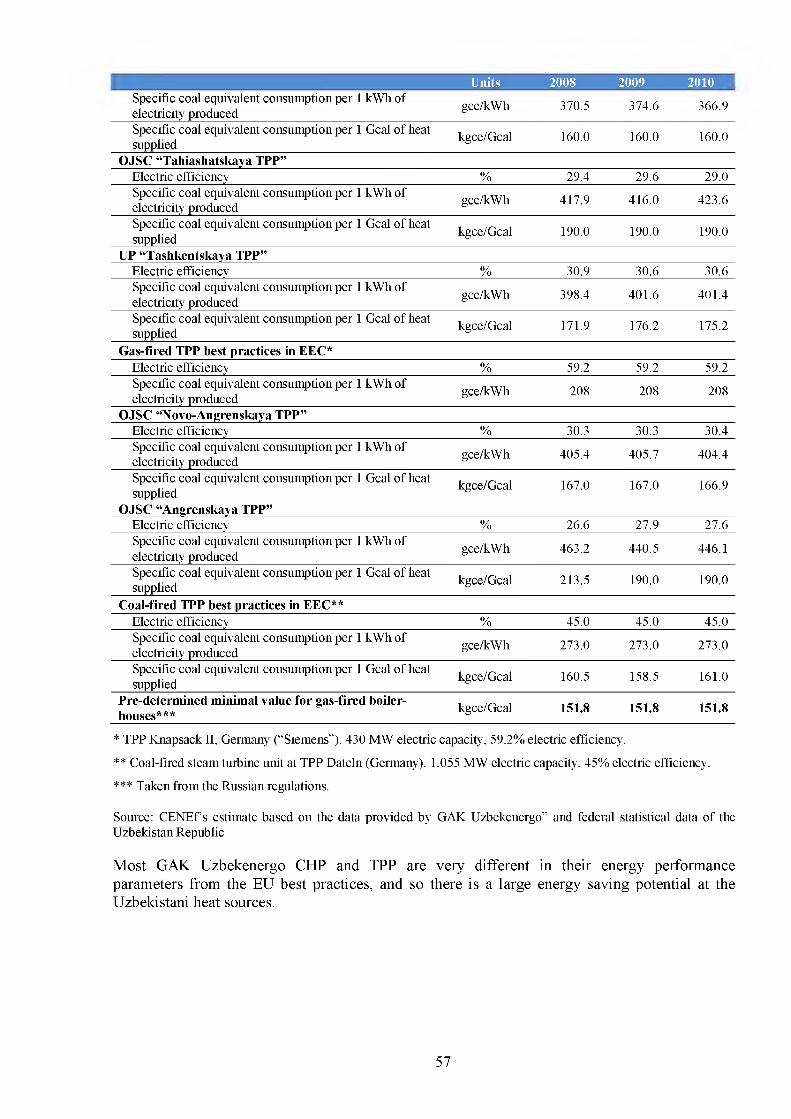
Units 2008 2009 2010 1Specific coal equivalent consumption per 1 kWh of electricity produced
gee/kWh 370.5 374.6 366.9
Specific coal equivalent consumption per 1 Gcal of heat supplied kgce/Gcal 160.0 160.0 160.0
OJSC “Tahiashatskaya TPP”Electric efficiency % 29.4 29.6 29.0Specific coal equivalent consumption per 1 kWh of electricity produced
gee/kWh 417.9 416.0 423.6
Specific coal equivalent consumption per 1 Gcal of heat supplied kgce/Gcal 190.0 190.0 190.0
UP “Tashkentskaya TPP”Electric efficiency % 30.9 30.6 30.6Specific coal equivalent consumption per 1 kWh of electricity produced
gee/kWh 398.4 401.6 401.4
Specific coal equivalent consumption per 1 Gcal of heat supplied kgce/Gcal 171.9 176.2 175.2
Gas-fired TPP best practices in EEC*Electric efficiency % 59.2 59.2 59.2Specific coal equivalent consumption per 1 kWh of electricity produced
gee/kWh 208 208 208
OJSC “Novo-Angrenskaya TPP”Electric efficiency % 30.3 30.3 30.4Specific coal equivalent consumption per 1 kWh of electricity produced gee/kWh 405.4 405.7 404.4
Specific coal equivalent consumption per 1 Gcal of heat supplied
kgce/Gcal 167.0 167.0 166.9
OJSC “Angrenskaya TPP”Electric efficiency % 26.6 27.9 27.6Specific coal equivalent consumption per 1 kWh of electricity produced
gee/kWh 463.2 440.5 446.1
Specific coal equivalent consumption per 1 Gcal of heat supplied kgce/Gcal 213.5 190.0 190.0
Coal-fired TPP best practices in EEC**Electric efficiency % 45.0 45.0 45.0Specific coal equivalent consumption per 1 kWh of electricity produced
gee/kWh 273.0 273.0 273.0
Specific coal equivalent consumption per 1 Gcal of heat supplied kgce/Gcal 160.5 158.5 161.0
Pre-determined minimal value for gas-fired boiler-houses*** kgce/Gcal 151.8 151.8 151.8
* TPP Knapsack II, Germany (“Siemens”). 430 MW electric capacity, 59.2% electric efficiency.
** Coal-fired steam turbine unit at TPP Dateln (Germany). 1,055 MW electric capacity, 45% electric efficiency.
*** Taken from the Russian regulations.
Source: CENEf s estimate based on the data provided by GAK Uzbekenergo” and federal statistical data of the Uzbekistan Republic
Most GAK Uzbekenergo CHP and TPP are very different in their energy performance parameters from the EU best practices, and so there is a large energy saving potential at the Uzbekistani heat sources.
57
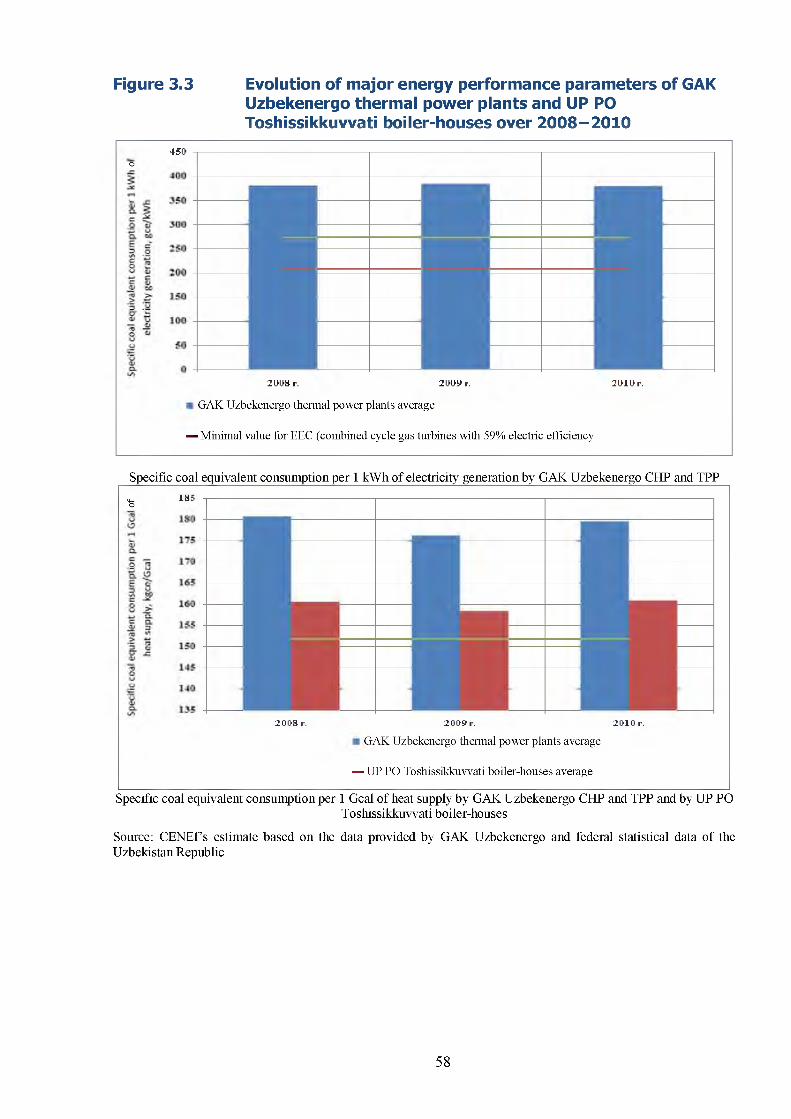
Figure 3.3 Evolution of major energy performance parameters of GAK Uzbekenergo thermal power plants and UP PO Toshissikkuwati boiler-houses over 2008-2010
450о
2003 г . 2009 г. 2010 г.
GAK Uzbekenergo thermal power plants average
— Minimal value for EEC (combined cycle gas turbines with 59% electric efficiency
Specific coal equivalent consumption per 1 kWh of electricity generation by GAK Uzbekenergo CHP and TPPц_ 1S5о
2003 г. 200S>r. 2010 г.
GAK Uzbekenergo thermal power plants average
— UP PO Toshissikkuwati boiler-houses average
Specific coal equivalent consumption per 1 Gcal of heat supply by GAK Uzbekenergo CHP and TPP and by UP POToshissikkuwati boiler-houses
Source: CENEf s estimate based on the data provided by GAK Uzbekenergo and federal statistical data of the Uzbekistan Republic
58
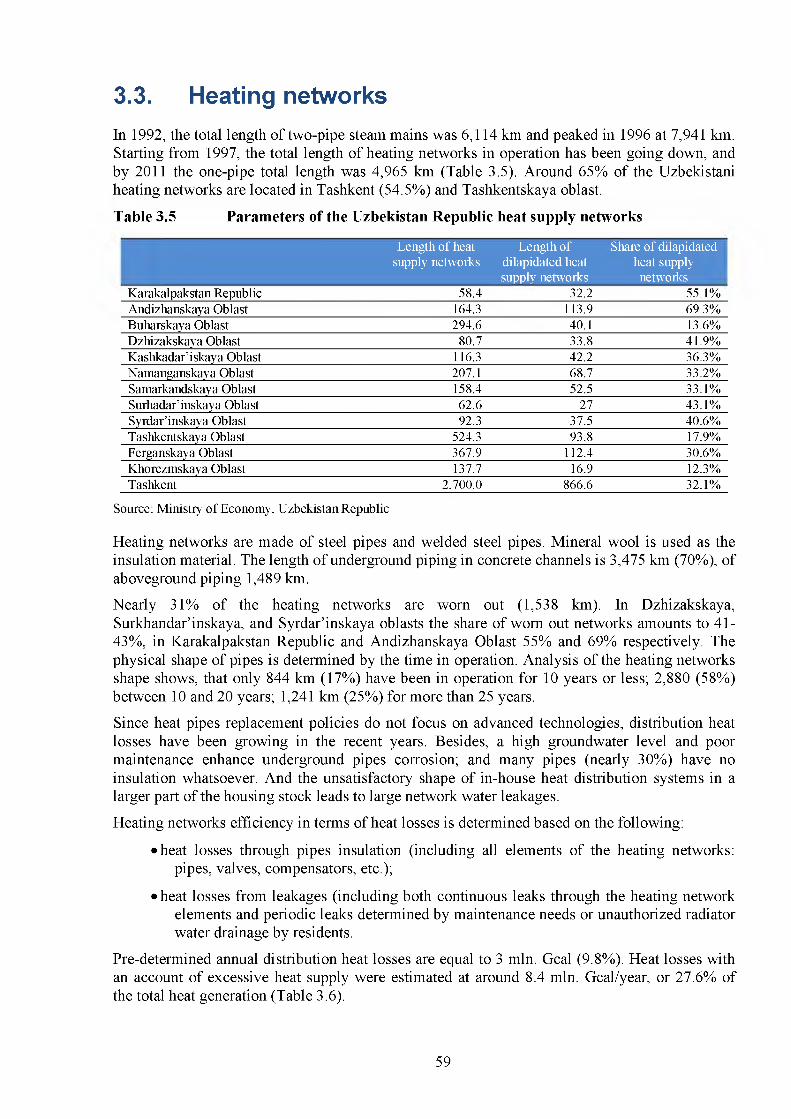
3.3. Heating networksIn 1992, the total length of two-pipe steam mains was 6,114 km and peaked in 1996 at 7,941 km. Starting from 1997, the total length of heating networks in operation has been going down, and by 2011 the one-pipe total length was 4,965 km (Table 3.5). Around 65% of the Uzbekistani heating networks are located in Tashkent (54.5%) and Tashkentskaya oblast.
Table 3.5 Parameters of the Uzbekistan Republic heat supply networks
Length of heat Length of Share of dilapidatedsupply networks dilapidated heat heat supply
supply networks networksKarakalpakstan Republic 58.4 32.2 55.1%Andizhanskaya Oblast 164.3 113.9 69.3%Buharskaya Oblast 294.6 40.1 13.6%Dzhizakskaya Oblast 80.7 33.8 41.9%Kashkadar’iskaya Oblast 116.3 42.2 36.3%Namanganskaya Oblast 207.1 68.7 33.2%Samarkandskaya Oblast 158.4 52.5 33.1%Surhadar’inskaya Oblast 62.6 27 43.1%Syrdar’inskaya Oblast 92.3 37.5 40.6%Tashkentskaya Oblast 524.3 93.8 17.9%Ferganskaya Oblast 367.9 112.4 30.6%Khorezmskaya Oblast 137.7 16.9 12.3%Tashkent 2,700.0 866.6 32.1%
Source: Ministry o f Economy, Uzbekistan Republic
Heating networks are made of steel pipes and welded steel pipes. Mineral wool is used as the insulation material. The length of underground piping in concrete channels is 3,475 km (70%), of aboveground piping 1,489 km.
Nearly 31% of the heating networks are worn out (1,538 km). In Dzhizakskaya, Surkhandar’inskaya, and Syrdar’inskaya oblasts the share of worn out networks amounts to 41- 43%, in Karakalpakstan Republic and Andizhanskaya Oblast 55% and 69% respectively. The physical shape of pipes is determined by the time in operation. Analysis of the heating networks shape shows, that only 844 km (17%) have been in operation for 10 years or less; 2,880 (58%) between 10 and 20 years; 1,241 km (25%) for more than 25 years.
Since heat pipes replacement policies do not focus on advanced technologies, distribution heat losses have been growing in the recent years. Besides, a high groundwater level and poor maintenance enhance underground pipes corrosion; and many pipes (nearly 30%) have no insulation whatsoever. And the unsatisfactory shape of in-house heat distribution systems in a larger part of the housing stock leads to large network water leakages.
Heating networks efficiency in terms of heat losses is determined based on the following:
• heat losses through pipes insulation (including all elements of the heating networks:pipes, valves, compensators, etc.);
• heat losses from leakages (including both continuous leaks through the heating networkelements and periodic leaks determined by maintenance needs or unauthorized radiator water drainage by residents.
Pre-determined annual distribution heat losses are equal to 3 mln. Gcal (9.8%). Heat losses with an account of excessive heat supply were estimated at around 8.4 mln. Gcal/year, or 27.6% of the total heat generation (Table 3.6).
59
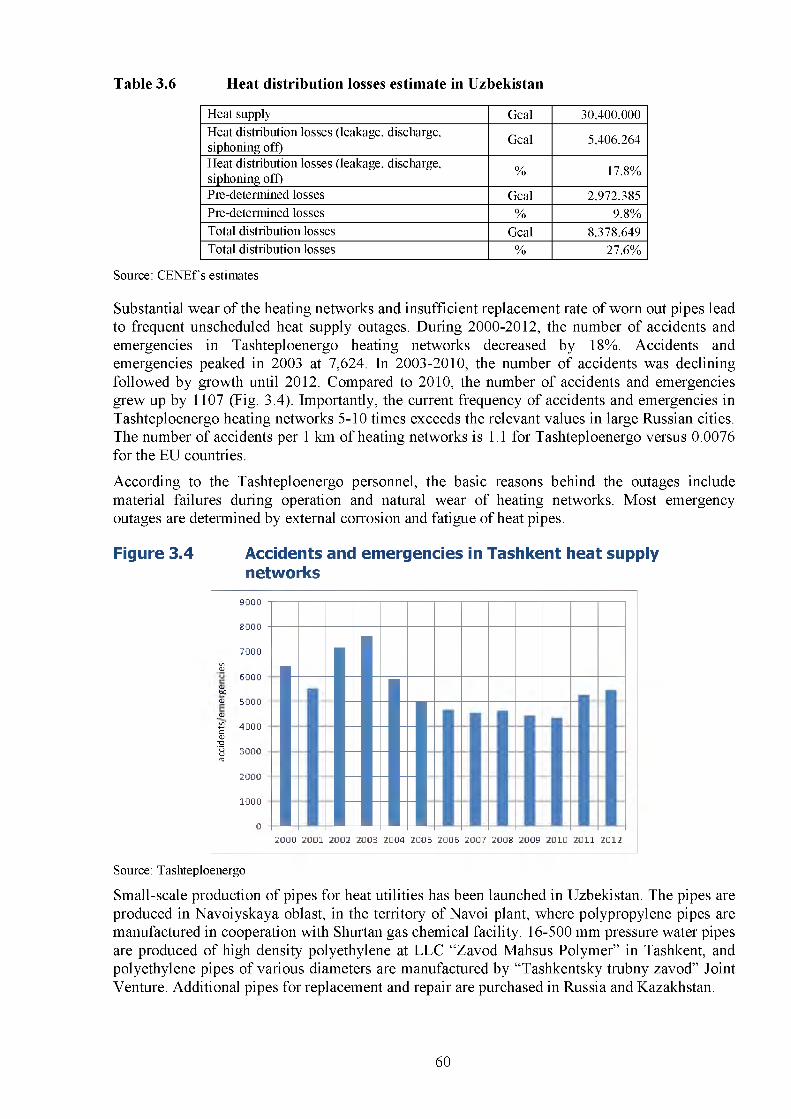
Table 3.6 Heat distribution losses estimate in Uzbekistan
Heat supply Gcal 30,400,000Heat distribution losses (leakage, discharge, siphoning off) Gcal 5,406,264
Heat distribution losses (leakage, discharge, siphoning off) % 17.8%
Pre-detennined losses Gcal 2,972,385Pre-detennined losses % 9.8%Total distribution losses Gcal 8,378,649Total distribution losses % 27.6%
Source: CENEf s estimates
Substantial wear of the heating networks and insufficient replacement rate of worn out pipes lead to frequent unscheduled heat supply outages. During 2000-2012, the number of accidents and emergencies in Tashteploenergo heating networks decreased by 18%. Accidents and emergencies peaked in 2003 at 7,624. In 2003-2010, the number of accidents was declining followed by growth until 2012. Compared to 2010, the number of accidents and emergencies grew up by 1107 (Fig. 3.4). Importantly, the current frequency of accidents and emergencies in Tashteploenergo heating networks 5-10 times exceeds the relevant values in large Russian cities. The number of accidents per 1 km of heating networks is 1.1 for Tashteploenergo versus 0.0076 for the EU countries.
According to the Tashteploenergo personnel, the basic reasons behind the outages include material failures during operation and natural wear of heating networks. Most emergency outages are determined by external corrosion and fatigue of heat pipes.
Figure 3.4 Accidents and emergencies in Tashkent heat supply networks
9000
8000
7000in Ф
6000CD ■ьр ■
« 5000-ф.
■2 4000с ф ■g■у 300003
2000
1000
02000 2001 2002 2003 2004 2005 2006 2007 2008 2009 2010 2011 2012
Source: Tashteploenergo
Small-scale production of pipes for heat utilities has been launched in Uzbekistan. The pipes are produced in Navoiyskaya oblast, in the territory of Navoi plant, where polypropylene pipes are manufactured in cooperation with Shurtan gas chemical facility. 16-500 mm pressure water pipes are produced of high density polyethylene at LLC “Zavod Mahsus Polymer” in Tashkent, and polyethylene pipes of various diameters are manufactured by “Tashkentsky trubny zavod” Joint Venture. Additional pipes for replacement and repair are purchased in Russia and Kazakhstan.
60
Assessment of the energy saving potential
4.1. Definitions of the technical, economic, and market energy saving potentials
Depending on the goal of research, energy saving potential may be identified in relation to the “practical minimum”49 or to “average energy consumption abroad”. There are three major definitions of the energy saving potential:
Technical (technological) potential can be estimated based on the assumption that all equipment is overnight replaced with the best available technologies with the “practical minimum” specific energy consumption. The technical potential only shows hypothetical energy efficiency opportunities, taking no account of costs or other restriction.
Economic potential is part of the technical potential that is economically attractive assuming the use of public criteria in investment decision-making.
Market potential is part of the economic potential that is cost-effective assuming the use of private criteria in decision-making with the real market environment (actual equipment and energy prices, tax rates, etc.).
4.2. Residential sectorTwo approaches were used to evaluate the energy saving potential in residential buildings. The first one assumes that individually heated houses are “equal to passive houses”, only with some additional electricity consumption for space heating and air conditioning (not more than 15 kWh/m2/year). The second approach assumes that such houses meet the requirements of KMK2.01.18-2000* “Pre-determined levels of energy consumption for space heating, ventilation, and air conditioning in buildings and facilities” to specific energy consumption for space heating by rural single-family houses, subject to 2000-3000 degree-days of the heating period. Also, the following assumptions were used in the assessment of the technical potential:
•S The practical minimum for multi-family buildings was taken equal to the weighted average KMK 2.01.18-2000* norms by distribution of buildings by the number of stories for 4-, 5-, and 9-storey buildings with 2000-3000 degree-days of the heating period;
v' The DHW system is 30% more efficient than the current system;
•S The practical minimum for refrigerators with the most popular volumes of the chilling and freezing chambers is 0.5 kWh/day;
•S The practical minimum for washing machines with up to 5 kg load is 0.57 kWh/cycle;
•S The practical minimum for TV sets is 61 kWh/year;
v' All lighting fixtures in residential buildings use CFL;
v' Electricity consumption by other appliances remains constant;
•S All gas equipment in use is energy efficient.
49 Energy Efficiency in Russia: Untapped Reserve. The World Bank Group and CENEf. Moscow, 2008; I. Bashmakov, K. Borisov, M. Dzedzichek, A. Lunin, I. Gritsevich. Resource of energy efficiency in Russia: scale, costs and benefits, CENEf. 2008, www.cenef.ru; Energy technology perspectives 2010.Scenarios and strategies to 2050. IEA/OECD. Paris. 2010; Energy technology transitions for industry. Strategies for the next industrial revolution. IEA/OECD. Paris. 2009.
61
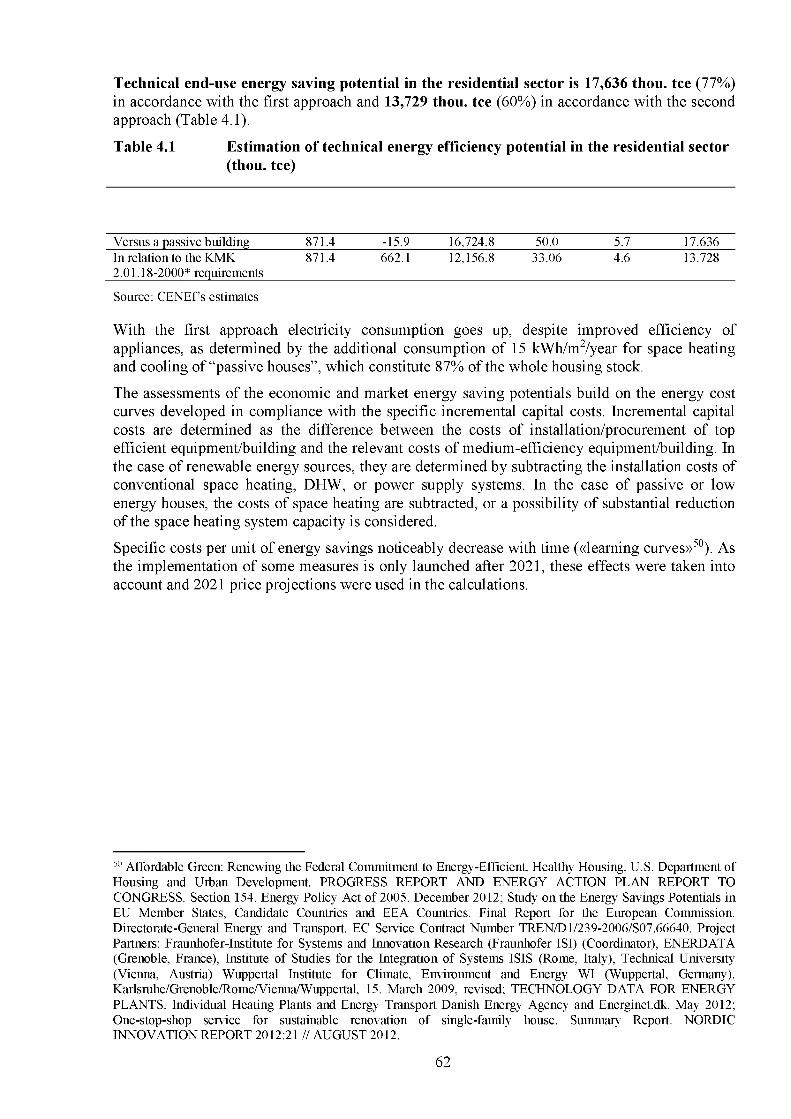
Technical end-use energy saving potential in the residential sector is 17,636 thou, tee (77%) in accordance with the first approach and 13,729 thou, tee (60%) in accordance with the second approach (Table 4.1).
Table 4.1 Estimation of technical energy efficiency potential in the residential sector(thou, tee)
Versus a passive building 871.4 -15.9 16,724.8 50.0 5.7 17.636In relation to the KMK 2.01.18-2000* requirements
871.4 662.1 12,156.8 33.06 4.6 13.728
Source: CENEf s estimates
With the first approach electricity consumption goes up, despite improved efficiency of appliances, as determined by the additional consumption of 15 kWh/m2/year for space heating and cooling of “passive houses”, which constitute 87% of the whole housing stock.
The assessments of the economic and market energy saving potentials build on the energy cost curves developed in compliance with the specific incremental capital costs. Incremental capital costs are determined as the difference between the costs of installation/procurement of top efficient equipment/building and the relevant costs of medium-efficiency equipment/building. In the case of renewable energy sources, they are determined by subtracting the installation costs of conventional space heating, DHW, or power supply systems. In the case of passive or low energy houses, the costs of space heating are subtracted, or a possibility of substantial reduction of the space heating system capacity is considered.
Specific costs per unit of energy savings noticeably decrease with time («learning curves»50). As the implementation of some measures is only launched after 2021, these effects were taken into account and 2021 price projections were used in the calculations.
50 Affordable Green: Renewing the Federal Commitment to Energy-Efficient, Healthy Housing. U.S. Department of Housing and Urban Development. PROGRESS REPORT AND ENERGY ACTION PLAN REPORT TO CONGRESS. Section 154. Energy Policy Act of 2005. December 2012; Study on the Energy Savings Potentials in EU Member States, Candidate Countries and EEA Countries. Final Report for the European Commission. Directorate-General Energy and Transport. EC Service Contract Number TREN/D1/239-2006/S07.66640. Project Partners: Fraunhofer-Institute for Systems and Innovation Research (Fraunhofer ISI) (Coordinator), ENERDATA (Grenoble, France), Institute of Studies for the Integration of Systems ISIS (Rome, Italy), Technical University (Vienna, Austria) Wuppertal Institute for Climate, Environment and Energy WI (Wuppertal, Germany). Karlsruhe/Grenoble/Rome/Vienna/Wuppertal, 15. March 2009, revised; TECHNOLOGY DATA FOR ENERGY PLANTS. Individual Heating Plants and Energy Transport Danish Energy Agency and Energinet.dk. May 2012; One-stop-shop service for sustainable renovation of single-family house. Summary Report. NORDIC INNOVATION REPORT 2012:21 // AUGUST 2012.
62
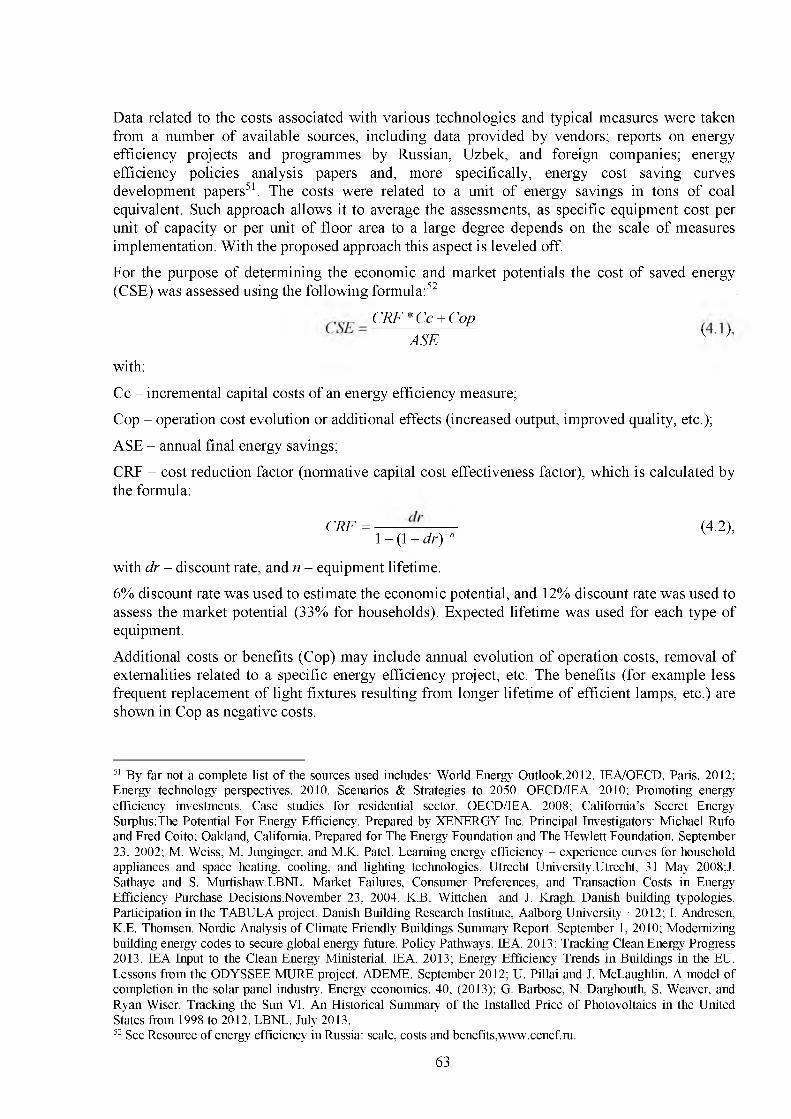
Data related to the costs associated with various technologies and typical measures were taken from a number of available sources, including data provided by vendors; reports on energy efficiency projects and programmes by Russian, Uzbek, and foreign companies; energy efficiency policies analysis papers and, more specifically, energy cost saving curves development papers51. The costs were related to a unit of energy savings in tons of coal equivalent. Such approach allows it to average the assessments, as specific equipment cost per unit of capacity or per unit of floor area to a large degree depends on the scale of measures implementation. With the proposed approach this aspect is leveled off.
For the purpose of determining the economic and market potentials the cost of saved energy (CSE) was assessed using the following formula:52
CBF*Cc + CopASE v '
with:
Cc - incremental capital costs of an energy efficiency measure;
Cop - operation cost evolution or additional effects (increased output, improved quality, etc.);
ASE - annual final energy savings;
CRF - cost reduction factor (normative capital cost effectiveness factor), which is calculated by the formula:
CRF = -------—------- (4.2),1 - (1 + dr) n
with dr - discount rate, and n - equipment lifetime.
6% discount rate was used to estimate the economic potential, and 12% discount rate was used to assess the market potential (33% for households). Expected lifetime was used for each type of equipment.
Additional costs or benefits (Cop) may include annual evolution of operation costs, removal of externalities related to a specific energy efficiency project, etc. The benefits (for example less frequent replacement of light fixtures resulting from longer lifetime of efficient lamps, etc.) are shown in Cop as negative costs.
51 By far not a complete list o f the sources used includes: World Energy 0utlook.2012. IEA/OECD. Paris. 2012; Energy technology perspectives. 2010. Scenarios & Strategies to 2050. OECD/IEA. 2010; Promoting energy efficiency investments. Case studies for residential sector. OECD/IEA. 2008; California’s Secret Energy Surplus:The Potential For Energy Efficiency. Prepared by XENERGY Inc. Principal Investigators: Michael Rufo and Fred Coito; Oakland, California. Prepared for The Energy Foundation and The Hewlett Foundation. September 23, 2002; M. Weiss, M. Junginger, and M.K. Patel. Learning energy efficiency - experience curves for household appliances and space heating, cooling, and lighting technologies. Utrecht University.Utrecht, 31 May 2008;J. Sathaye and S. Murtishaw.LBNL. Market Failures, Consumer Preferences, and Transaction Costs in Energy Efficiency Purchase Decisions.November 23, 2004. K.B. Wittchen and J. Kragh. Danish building typologies. Participation in the TABULA project. Danish Building Research Institute, Aalborg University • 2012; I. Andresen, K.E. Thomsen. Nordic Analysis of Climate Friendly Buildings Summary Report. September 1, 2010; Modernizing building energy codes to secure global energy future. Policy Pathways. IEA. 2013: Tracking Clean Energy Progress 2013. IEA Input to the Clean Energy Ministerial. IEA. 2013; Energy Efficiency Trends in Buildings in the EU. Lessons from the ODYSSEE MURE project. ADEME. September 2012; U. Pillai and J. McLaughlin. A model of completion in the solar panel industry. Energy economics. 40, (2013); G. Barbose, N. Darghouth, S. Weaver, and Ryan Wiser. Tracking the Sun VI. An Historical Summary of the Installed Price of Photovoltaics in the United States from 1998 to 2012. LBNL. July 2013.52 See Resource of energy efficiency in Russia: scale, costs and benefits,www.cenef.ru.
63
Estimation of additional costs and benefits (Cop) is very important to develop the cost of saved energy curve (CSEC), yet pretty complicated. A special analysis of additional costs and benefits of 81 energy efficiency projects in the U.S. has revealed, that additional effects add 44% on average to the project effects and reduce paybacks to 1 year. It is exactly because of such additional effects that the cost of saved energy may be negative53. A special attention is to be paid to the estimation of additional costs and benefits. This paper to a maximum possible degree takes account of emerging additional effects plus to incremental capital costs (Cc). Therefore, implementation costs of each proposed measure are determined with an account of all costs and all benefits.
For each measure, the volume of final energy savings were evaluated. Ranking these measures by the cost of saved energy allows it to draw up an energy saving curve. As a matter of fact, two or three curves are drawn up: for a public (6%) and a private (12% and/or 33%) discount rate.
The difference between the economic and the market potential includes, inter alia, taking account of externalities, the most important of which is natural gas export price as a potential economic benefit obtained through residential energy savings. Some other factors may be viewed as additional effects (such as improved standard of living, no need for an extended electricity network in the event of PV modules expansion, etc.).
In order to answer the question, if a technical measure is effective from the economic or market point of view, the cost of saved energy (CSE) should be compared with the final energy price. Public benefits are revealed in the course of the economic potential assessment, therefore a low (6%) discount rate and current natural gas export price are used, as well as IEA-projected 2035 natural gas price for Europe54.
High discount rates (12% and 33%) were used in market energy saving potential assessments. The 33% discount rate is normally used for countries with relatively low individual incomes. Current retail natural gas prices were used in the assessments.
Two prices were also used for the assessment of electricity saving measures: 2013 residential retail price to assess the market potential, and a price calculated with the assumption that the price of gas for power plants equals gas export price - to assess the economic potential.
The following measures were selected to implement the technical potential in the residential sector:
• insulation of walls;• insulation of basement ceilings;• installation of efficient windows;• installation of automated heat control units in multi-family buildings;• chemical washing of heat supply systems in multi-family buildings;• heat mirrors behind the radiators;• replacement of incandescent bulbs with CFL;• replacement of refrigerators and freezers with energy efficient models;• replacement of washing machines with energy efficient models;• replacement of TV sets with energy efficient models;• replacement of air conditioners with energy efficient models;• installation of solar collectors;• installation of heat pumps;• installation of PV modules.
53 R. Lung, A. McKane, R. Leach, D. Marsh. Ancillary Savings and Production Benefits in the Evaluation of Industrial Energy Efficiency Measures, 2005.ACEEE 2005.54 World Energy Outlook 2011 - Global Energy Trends, c. 64.
64
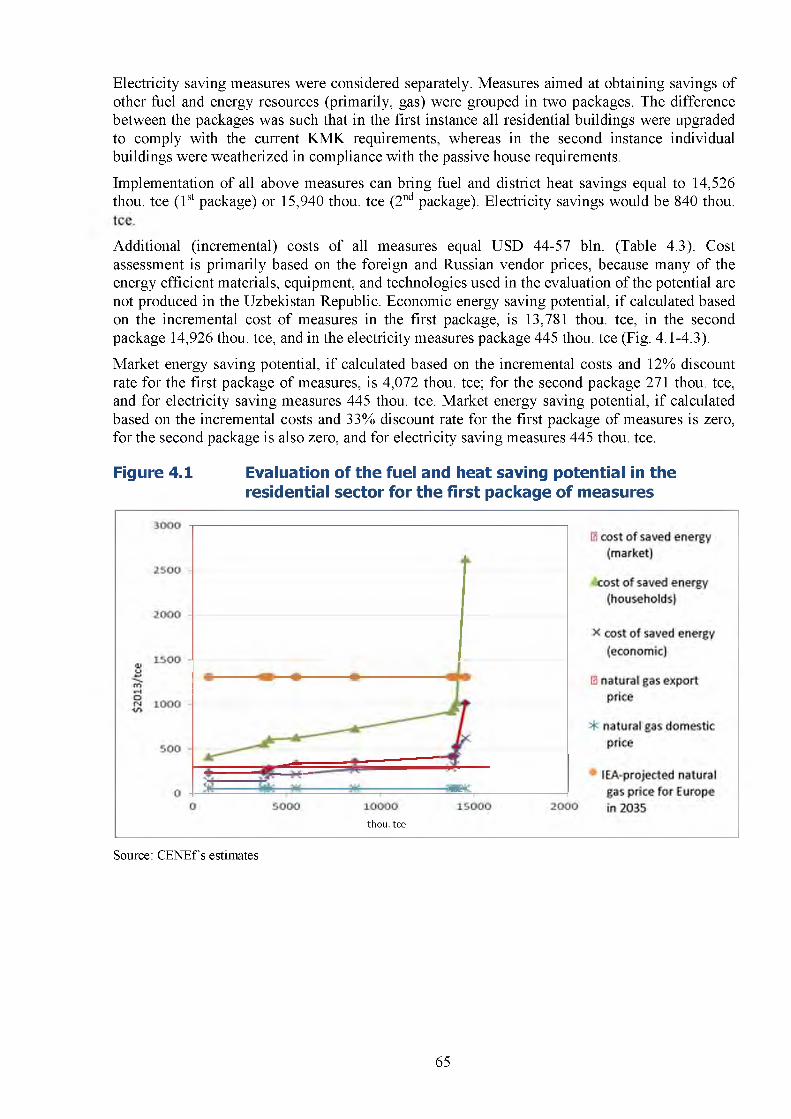
Electricity saving measures were considered separately. Measures aimed at obtaining savings of other fuel and energy resources (primarily, gas) were grouped in two packages. The difference between the packages was such that in the first instance all residential buildings were upgraded to comply with the current KMK requirements, whereas in the second instance individual buildings were weatherized in compliance with the passive house requirements.
Implementation of all above measures can bring fuel and district heat savings equal to 14,526 thou, tee (1st package) or 15,940 thou, tee (2nd package). Electricity savings would be 840 thou.
Additional (incremental) costs of all measures equal USD 44-57 bln. (Table 4.3). Cost assessment is primarily based on the foreign and Russian vendor prices, because many of the energy efficient materials, equipment, and technologies used in the evaluation of the potential are not produced in the Uzbekistan Republic. Economic energy saving potential, if calculated based on the incremental cost of measures in the first package, is 13,781 thou, tee, in the second package 14,926 thou, tee, and in the electricity measures package 445 thou, tee (Fig. 4.1-4.3).
Market energy saving potential, if calculated based on the incremental costs and 12% discount rate for the first package of measures, is 4,072 thou, tee; for the second package 271 thou, tee, and for electricity saving measures 445 thou. tee. Market energy saving potential, if calculated based on the incremental costs and 33% discount rate for the first package of measures is zero, for the second package is also zero, and for electricity saving measures 445 thou. tee.
Figure 4.1 Evaluation of the fuel and heat saving potential in the residential sector for the first package of measures
thou, tee
Source: CENEf s estimates
65
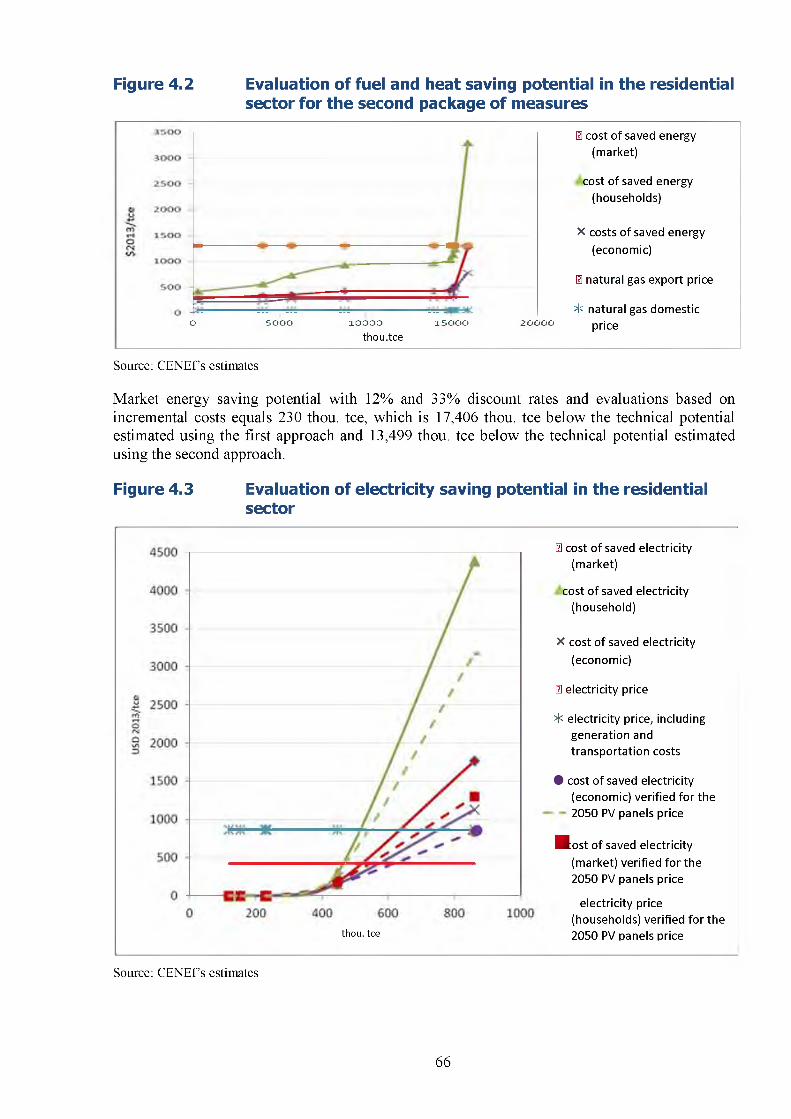
Figure 4.2 Evaluation of fuel and heat saving potential in the residential sector for the second package of measures
Ш cost of saved energy (market)
cost of saved energy (households)
X costs of saved energy (economic)
13 natural gas export price
He natural gas domesticO 5000 ЮООО 15000 20000 price
thou.tce
Source: CENEf s estimates
Market energy saving potential with 12% and 33% discount rates and evaluations based on incremental costs equals 230 thou, tee, which is 17,406 thou, tee below the technical potential estimated using the first approach and 13,499 thou, tee below the technical potential estimated using the second approach.
Figure 4.3 Evaluation of electricity saving potential in the residential sector
thou.tee
13 cost of saved electricity (market)
cost of saved electricity (household)
X cost of saved electricity (economic)
13 electricity price
^ electricity price, including generation and transportation costs
О cost of saved electricity (economic) verified for the 2050 PV panels price
H o s t of saved electricity (market) verified for the 2050 PV panels price
electricity price (households) verified for the 2050 PV panels price
Source: CENEf s estimates
66
Low energy prices are the major reason behind a relatively low market potential in the Uzbekistani residential sector. And energy price jump is impossible without exceeding the affordability thresholds.
Since the economic energy saving potential is quite substantial, it is important to promote the implementation of relevant measures by providing subsidies to improve the energy efficiency of buildings. This mechanism will generate considerable additional government revenues of exporting an equivalent volume of natural gas.
The analysis shows, that the technical energy saving potential can be implemented through the following top priority tasks:
• eventual termination of cross-subsidies between residential and other customers;
• promotion of energy efficient materials, products, and equipment production in theterritory of Uzbekistan Republic to cut the costs of measures;
• using subsidies and other mechanisms to induce households to implement energyefficiency measures;
• introduction of “white” and “green” certificates.
4.3. Heat supply systemsTechnical energy saving potential in electricity and heat generation in the Uzbekistan Republic is assessed by comparing actual specific fuel and electricity consumption (2010 data) with power plants and boiler-house best practices in the EU and Russia.
Technical energy saving potential of thermal power plants and boiler-houses in the Uzbekistan Republic is assessed at 8,834.4 thou, tee, or 39.8% (Table 4.2), including:
• technical natural gas saving potential - 6,991.5 mln. m3 (8,110.2 thou, tee);
• technical coal saving potential - 1,638.2 thou, tons (499.7 thou, tee);
• technical electricity saving potential - 646.9 mln. kWh (79.6 thou, tee);
• additional electricity generation by thermal power plants and cogeneration units in boiler-houses - 1,178.9 mln. kWh (145.0 thou. tee).
A large part of the technical energy saving potential of thermal power plants and boiler-houses can be implemented through economically and financially viable investments.
In order to make sound decisions related to energy efficiency investments in Uzbekistani heat supply, it is recommended to use the cost of saved energy indicator (CSE, USD/tce). Comparison of CSE allows it to determine the most effective energy efficiency measures and technologies, which are first and foremost recommended for thermal power plants and boiler-houses.
67
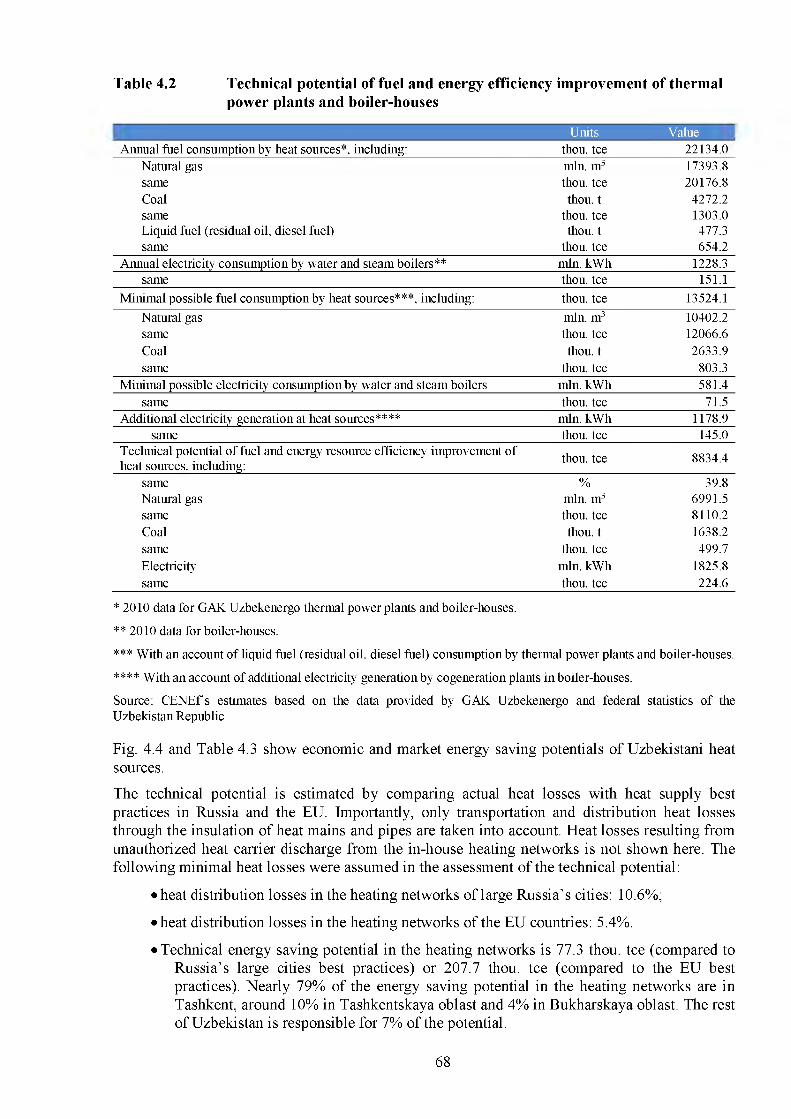
Table 4.2 Technical potential of fuel and energy efficiency improvement of thermalpower plants and boiler-houses
Units Value 1Annual fuel consumption by heat sources*, including: thou, tee 22134.0
Natural gas mln. m3 17393.8same thou, tee 20176.8Coal thou, t 4272.2same thou, tee 1303.0Liquid fuel (residual oil, diesel fuel) thou, t 477.3same thou, tee 654.2
Annual electricity consumption by water and steam boilers** mln. kWh 1228.3same thou, tee 151.1
Minimal possible fuel consumption by heat sources***, including: thou, tee 13524.1Natural gas mln. m3 10402.2same thou, tee 12066.6Coal thou, t 2633.9same thou, tee 803.3
Minimal possible electricity consumption by water and steam boilers mln. kWh 581.4same thou, tee 71.5
Additional electricity generation at heat sources**** mln. kWh 1178.9same thou, tee 145.0
Technical potential o f fuel and energy resource efficiency improvement of heat sources, including: thou, tee 8834.4
same % 39.8Natural gas mln. m3 6991.5same thou, tee 8110.2Coal thou, t 1638.2same thou, tee 499.7Electricity mln. kWh 1825.8same thou, tee 224.6
* 2010 data for GAK Uzbekenergo thermal power plants and boiler-houses.
** 2010 data for boiler-houses.
*** With an account of liquid fuel (residual oil. diesel fuel) consumption by thermal power plants and boiler-houses.
**** w ith an account of additional electricity generation by cogeneration plants in boiler-houses.
Source: CENEfs estimates based on the data provided by GAK Uzbekenergo and federal statistics of the Uzbekistan Republic
Fig. 4.4 and Table 4.3 show economic and market energy saving potentials of Uzbekistani heat sources.
The technical potential is estimated by comparing actual heat losses with heat supply best practices in Russia and the EU. Importantly, only transportation and distribution heat losses through the insulation of heat mains and pipes are taken into account. Heat losses resulting from unauthorized heat carrier discharge from the in-house heating networks is not shown here. The following minimal heat losses were assumed in the assessment of the technical potential:
• heat distribution losses in the heating networks of large Russia’s cities: 10.6%;
• heat distribution losses in the heating networks of the EU countries: 5.4%.
• Technical energy saving potential in the heating networks is 77.3 thou, tee (compared toRussia’s large cities best practices) or 207.7 thou, tee (compared to the EU best practices). Nearly 79% of the energy saving potential in the heating networks are in Tashkent, around 10% in Tashkentskaya oblast and 4% in Bukharskaya oblast. The rest of Uzbekistan is responsible for 7% of the potential.
68
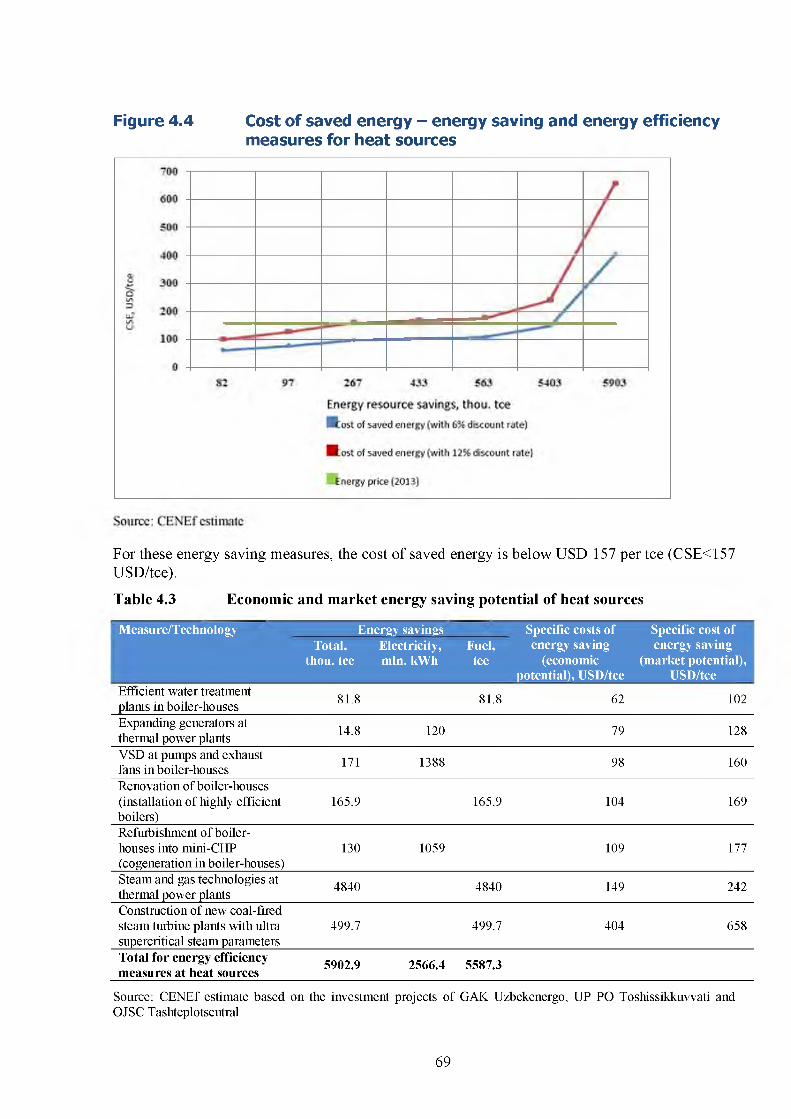
Figure 4.4 Cost of saved energy - energy saving and energy efficiency measures for heat sources
For these energy saving measures, the cost of saved energy is below USD 157 per tee (CSE<157 USD/tce).
Table 4.3 Economic and market energy saving potential of heat sources
Measure/Technology Energy savings Specific costs of Specific cost ofTotal, Electricity, Fuel, energy saving energy saving
thou, tee mln. kWh tee (economic potential), USD/tce
(market potential), USD/tce
Efficient water treatment plants in boiler-houses 81.8 81.8 62 102
Expanding generators at thermal power plants 14.8 120 79 128
VSD at pumps and exhaust fans in boiler-houses 171 1388 98 160
Renovation of boiler-houses(installation of highly efficient 165.9 165.9 104 169boilers)Refurbishment o f boiler-houses into mini-CHP 130 1059 109 177(cogeneration in boiler-houses)Steam and gas technologies at thermal power plants
4840 4840 149 242
Construction of new coal-firedsteam turbine plants with ultra 499.7 499.7 404 658supercritical steam parametersTotal for energy efficiency measures at heat sources 5902.9 2566.4 5587.3
Source: CENEf estimate based on the investment projects of GAK Uzbekenergo, UP PO Toshissikkuwati and OJSC Tashteplotsentral
69
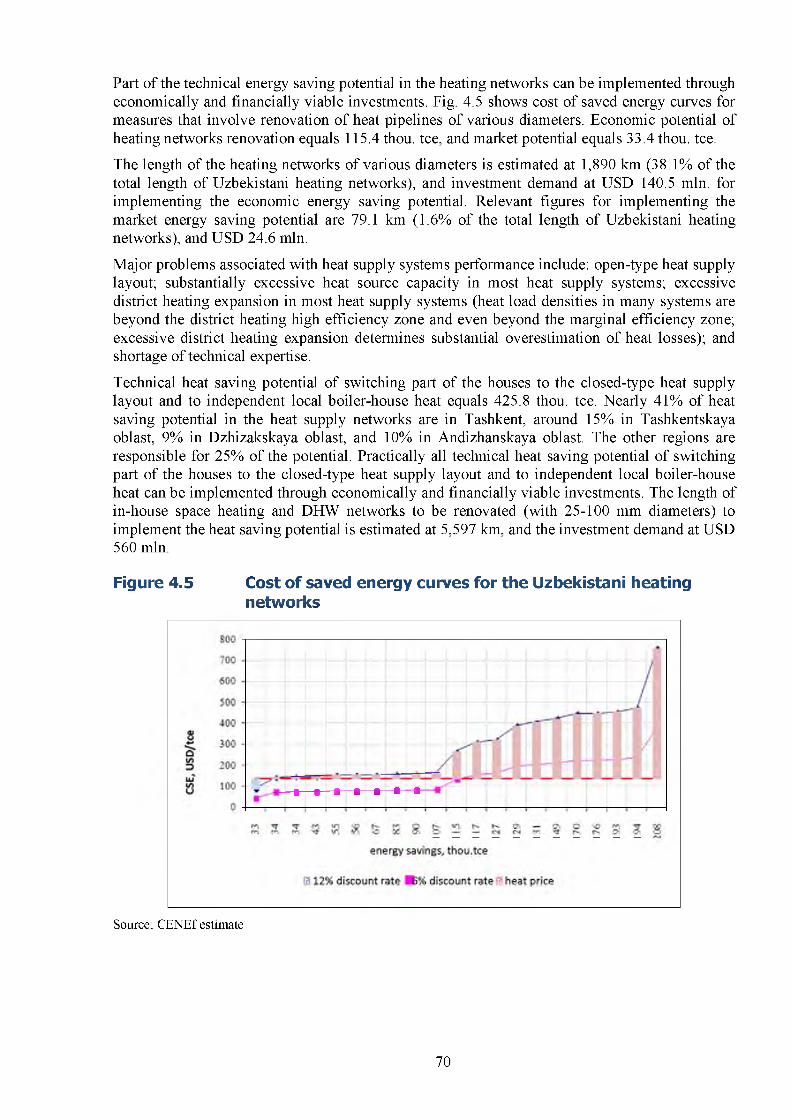
Part of the technical energy saving potential in the heating networks can be implemented through economically and financially viable investments. Fig. 4.5 shows cost of saved energy curves for measures that involve renovation of heat pipelines of various diameters. Economic potential of heating networks renovation equals 115.4 thou, tee, and market potential equals 33.4 thou. tee.
The length of the heating networks of various diameters is estimated at 1,890 km (38.1% of the total length of Uzbekistani heating networks), and investment demand at USD 140.5 mln. for implementing the economic energy saving potential. Relevant figures for implementing the market energy saving potential are 79.1 km (1.6% of the total length of Uzbekistani heating networks), and USD 24.6 mln.
Major problems associated with heat supply systems performance include: open-type heat supply layout; substantially excessive heat source capacity in most heat supply systems; excessive district heating expansion in most heat supply systems (heat load densities in many systems are beyond the district heating high efficiency zone and even beyond the marginal efficiency zone; excessive district heating expansion determines substantial overestimation of heat losses); and shortage of technical expertise.
Technical heat saving potential of switching part of the houses to the closed-type heat supply layout and to independent local boiler-house heat equals 425.8 thou. tee. Nearly 41% of heat saving potential in the heat supply networks are in Tashkent, around 15% in Tashkentskaya oblast, 9% in Dzhizakskaya oblast, and 10% in Andizhanskaya oblast. The other regions are responsible for 25% of the potential. Practically all technical heat saving potential of switching part of the houses to the closed-type heat supply layout and to independent local boiler-house heat can be implemented through economically and financially viable investments. The length of in-house space heating and DHW networks to be renovated (with 25-100 mm diameters) to implement the heat saving potential is estimated at 5,597 km, and the investment demand at USD 560 mln.
Figure 4.5 Cost of saved energy curves for the Uzbekistani heating networks
Source: CENEf estimate
70
5. Analysis of barriers to energy efficiency in buildings
Energy efficiency potential is similar to oil and natural gas deposits: it may be large, but until a “well” is drilled, it stays “in situ” . In order to start implementation, it is important to pass the dense rock of energy efficiency barriers. These barriers are of a very different origin: related to prices and financing; to economy and market structure and organization; institutional, social, cultural, behavioral barriers, etc. Nearly all of them are removable through energy efficiency policy measures. To make these policies most effective, it is important to identify the barriers that impede introduction of energy efficiency technologies and behavioral patterns.
All barriers to energy efficiency can be categorized by 4 large groups: lack of incentives; lack of information; lack of financial resources and “long-term money”; and lack of organization and coordination. There used to be another group of barriers, lack of technologies; however, at this point this constraint in Uzbekistan is not so important as it used to be. The market offers a wide range of efficient equipment, materials and energy consulting services.
Lack of incentives is determined by soft budget constraints, withholding of obtained savings in the corporate, budgetary, or tariff processes, relatively low tariffs. Limited competition coupled with a possibility to shift the burden of growing expenses onto consumers (until the affordability limit is achieved), cross-subsidies, lack of meters and controls are all factors that reduce energy saving incentives. Economic mechanisms are designed in a manner that the savings beneficiary is not always determined, which is all the more true for multifamily houses. Not always there is a clear answer to a simple question: who benefits from energy savings?
Withholding obtained savings in the corporate, budgetary, or tariff processes is a serious barrier. Under the circumstances, growing energy prices provide incentives for the justification of further price growth or for applications for additional financing, rather than for energy efficiency improvements. Energy efficiency indicators should be in the list of indicators used to assign budgets.
Lack of public financial support for energy efficiency measures makes them politically unnoticeable and weak.
Lack of information. Providing information and incentives for decision-making is often ignored. This aspect of the decision-making process is yet to be realized. Information is essential to make an educated and timely decision. Not many people can afford spending time or money in search of information, most of them act according to a set pattern. Behavioral stereotypes (“Do as everyone does!”) are so widespread exactly because they save the effort of both looking for information and decision-making. Residents may be feeling very cold at homes but would not take simple insulation steps to increase the indoor air temperature by 3 to 5°C; industrial firms and municipalities struggle for gas budgets instead of implementing energy conservation programs.
Market price information alone is not sufficient to speed up the energy efficiency process. If market signals are to be perceived (subject to a technical possibility to react to market signals), they must be sown in prepared soil. In many instances energy price elasticity (for example, in district heat supply to multifamily houses) is practically zero. Introduction of energy efficiency standards blocks inefficient technologies and equipment penetration and so is very effective in the sectors where the information barrier is most important.
Lack of financing and “long-term” loans determines insufficient financing for energy efficiency activities and energy supply systems maintenance. Banks call for a very high return on investment to compensate the risk of energy efficiency projects. New construction projects do not have to meet such a strict criterion. Banks do not provide loans to energy utilities that have
71
large debts. Those in the poorest financial shape and so lacking own funds to finance projects are at the same time least energy efficient, yet cannot attract loans. They cannot pass the financial sustainability test. But they could pledge consumer payments to be obtained for housing and municipal utility services to the lender-bank.
Weak organization and coordination takes place at all decision-making levels. In Uzbekistan, there are no federal authorities that coordinate energy efficiency activities. Energy efficiency improvements are yet to be perceived by the national government as a means to address a large scope of economic problems. However, housing retrofits programs require better expertise and government effort.
In the buildings sector, there are specific barriers to energy efficiency improvements.
Technological barriers include lack of skills and technologies, lack of materials and experience in operating energy efficient buildings. Other technological barriers include lack of monitoring and assessment during the process of construction or renovation, insufficient quantity of installed meters, regulations and controls in residential buildings.
In buildings construction, a motivation gap (a principal - agent problem) is an important barrier to energy efficiency. Additional energy efficiency measures may lead to increased construction costs, which may not be in the general interest of constructors and developers who want to quickly sell the housing. Large energy bills will have to be paid by residents, who cannot make energy efficiency decisions at this stage. The same problem arises in the housing rent market. The tenants will not be willing to pay for energy efficient equipment that they cannot take with them.
Uncertainty. Energy savings are an estimate. Lack of classifications of residential buildings, energy saving statistics in typical buildings and of standardised measurements and verifications protocols makes it difficult to obtain reliable estimates of savings, which to a large degree depends on the building operation. Investors or customers cannot be sure of the energy saving potential.
Initial cost of equipment and construction. The initial cost barrier refers to the fact that energy-efficient products tend to be more expensive than their less efficient counterparts. In the economic analysis, they are to be assessed as incremental costs, i.e. the difference between the cost of the energy efficient product and a medium- or low-efficient counterpart. This assessment is often missing in decision-making related to the use of efficient equipment, and full costs are assessed in relation to the energy saving effect. This leads to an order of magnitude overestimation of paybacks and feeds the myth that building energy efficiency investments have long paybacks.
Large share of poor families. For poor families, equipment or housing price is the key factor. Prices of energy efficient equipment are often perceived as impracticable (if no subsidies or cheap loans are available). So it is poor families who use the cheapest and least efficient equipment and spend a high share of their incomes to pay their energy bills.
Small size of projects. Specific costs of an energy efficient building or equipment are higher, the less the purchased batch. In the housing sector, purchases of single quantities are not rare, substantially increasing the cost of improvements in relation to wholesale procurement. It is more difficult to attract loan financing for such projects, and loan terms are not nearly as attractive as for wholesale procurement. This barrier may be overcome through standard design turn-key individual housing construction coupled with substantially increased requirements to the energy efficiency performance of newly erected buildings. This problem may be addressed under a “white certificates” scheme or standards for demand-side energy efficiency. Energy utilities can have much better prices for equipment purchased.
72
Low and subsidized energy prices. In order to assess the role of energy tariffs, it is necessary to determine the share of energy costs in household incomes rather than to mechanically compare energy prices in Uzbekistan and elsewhere. The consumer reacts to the growing share of energy cost in his income. If he can compensated the energy cost growth by improving energy efficiency, then rising energy prices do not slow down economic growth, or speed up inflation, or reduce the payment discipline. Energy tariffs may be rising, as household incomes grow. With the share of housing and municipal utility costs close to the threshold values (Chapter 2), residents are motivated for investing in energy efficiency.
Low payment discipline. With low payment discipline, residents have no incentives to use energy more efficiently. If it is impossible to cut-off those who do not pay their energy bills, growing energy prices may lead to the growth of debt to energy suppliers, rather than to more efficient energy use. Perception of a right to municipal utilities irrespective of the payment discipline is deeply rooted in the Soviet past.
Risk perception. Banks in Uzbekistan have little experience in financing residential energy efficiency projects. Commercial banks prefer low-risk investments. Investing in energy efficiency improvements in individual houses is perceived as very risky.
Poor statistics on residential buildings. A large bulk of statistical data is required for the development of energy efficiency projects and programs in the residential sector. This should include information on the time of commissioning; level of amenities; number of floors; wall materials; technical shape; energy consumption; meters and appliances saturation and technical parameters; water and energy resources consumption standards and levels; satisfaction with municipal utilities, etc. In Uzbekistan, this kind of statistical information is very scarce. Yet it is critical for both energy efficiency programs development and monitoring.
Lack of consumer awareness and trust prevent consumers from making correct investment and operation decisions and are important barriers to energy efficiency. Information barriers include asymmetric access and mere lack of information. Beyond the lack of available information, its clarity to the average customer is also a major obstacle. It is often very difficult for non-experts to understand the small amount of information to which they have access. Even a motivated consumer, financial experts or building firms may choose to reject their plans, absent professional support, as they are not aware of the parameters of energy efficiency projects.
Lack of energy efficiency policies and relevant funds. Policies and funding are some of the most important conditions for promoting energy savings in buildings. The door swings both ways: lack of these policies and, in particular, of co-funding schemes makes it difficult to develop a comprehensive energy efficiency programme (see Chapter 8). CIS countries usually face the following barriers related to the lack of policies—:
• low rank in the list of priorities: the government does not perceive energy efficiency as apriority;
• lack of awareness: the government does not realize a relationship between energyefficiency and energy security or economic benefits;
• incomplete policies: the government underestimates the potential for demand-sideimprovements;
• lack of policies to address the principal-agent (PA) problems in the many situations whenthe government is an overseer, an owner, or a purchaser of energy services56;
• lack of clear quantified energy efficiency policies and targets;
55 ECS (2008) “Energy Efficiency in the Public Sector. Policies and Programmes in ECT Member Countries”.56See IEA Mind the Gap: Quantifying Principal-Agent Problems in Energy Efficiency, OECD/IEA, Paris, 2007.
73

• insufficient political support: laws do not have enough political support to pass throughthe parliament.
• lack of follow-through: legislation, when approved, is not followed by implementationplans or is implemented inadequately.
Lack of qualified personnel. Cadre are a key to everything... although sometimes a wrong one. Improving residential energy efficiency requires a large number of well-trained experts in the authorities, research institutions, well-trained architects, designers, construction workers, vendors of building materials and equipment, financial experts, consultants, utility and maintenance experts, housing management experts, etc. All of them need to be trained in good time. Lack of well-trained experts can substantially impede progress in residential energy efficiency improvement.
74
6. Energy efficiency policies in buildings
6.1. The Uzbekistan experienceFollowing the launch of the UNDP/GEF project “Promoting energy efficiency in public buildings” in 2009, energy efficiency activities in Uzbekistani buildings sector have been spurred in the recent years.
This project aims at the reduction of energy consumption and greenhouse gas emissions by public buildings through the improvement of the building codes in force, implementation of pilot projects, development of an efficient energy consumption management system, and training.
Under this, as well as other, projects:
•S eight pilot projects in public buildings were implemented under the “Promoting energy efficiency in public buildings” project;
•S a heliohouse was built in Burchmulla - a Passive House project. Annual energy consumption by the house went down to 30 kWh/m2 due to the efficient insulation of the building envelopes and using solar energy for space heating;
v' efficient energy consumption management systems are being installed in all public buildings;
•S the number of consumers equipped with gas- and water meters has substantially increased;
v' energy efficiency of a 32-flat 4-storey residential building in Tashkent was substantially improved due to the demonstration of modem meters and controls. Energy consumption and energy efficiency control has been established; a strategy for the introduction of European energy efficiency technologies was developed;
•S a pilot demo zone was established in 11 4-storey standard buildings of Kuilyuck-2 residential block, Mirabadsky region of Tashkent, to vividly demonstrate the possibilities for switching the existing “open” DHW system and dependent district heating system to a “close” and independent system respectively using heat exchangers. Tap- and hot water meters and gas meters were installed in flats, as well as various metering equipment for energy audits and equipment monitoring purposes;
•S a pilot demo zone was established in the boiler-house of Vodnick residential block, Bektemirsky region of Tashkent, to install solar collectors for water preheating and demonstrate the possibilities for the reduction of gas consumption and C02 emission in Uzbekistan through the use of solar energy and improved residential heat supply. In 2002, 920 m2 of solar collectors were installed for feed water preheating;
•S a Pilot demo energy efficiency zone was established in Chilansar region, makhall Madaniyat. Energy meters were installed in flats, as well as an electricity consumption automated control system;
•S as required by the Presidential Resolution PP1297 dated 04.03.2010 “On measures to improve heat supply in Khorezmskaya Oblast with a grant provided by the Korean Government”, boilers and boiler equipment were replaced in 54 boiler-houses and gas-, water- and electricity meters were installed. These measures brought heat generation costs down and helped obtain 15% electricity savings. Currently, dated wooden window units are being replaced with two- or three-pane glazing in aluminium or plastic units. Energy saving lighting is also increasingly used.
75
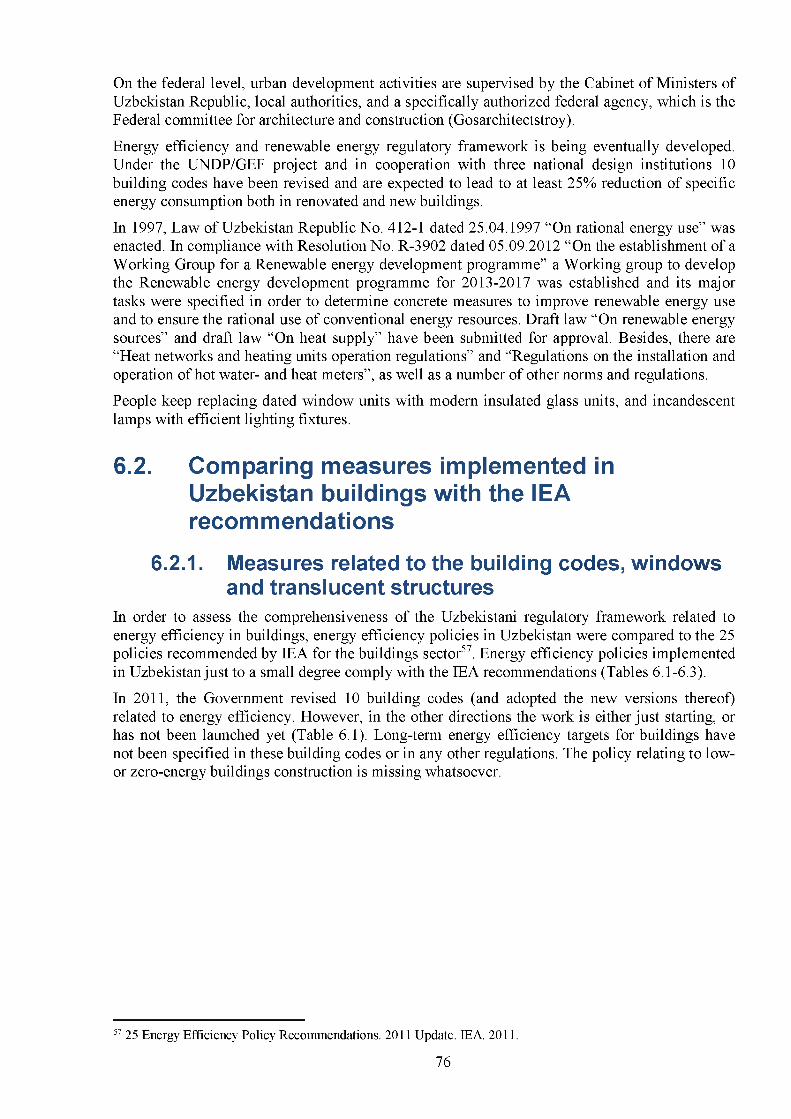
On the federal level, urban development activities are supervised by the Cabinet of Ministers of Uzbekistan Republic, local authorities, and a specifically authorized federal agency, which is the Federal committee for architecture and construction (Gosarchitectstroy).
Energy efficiency and renewable energy regulatory framework is being eventually developed. Under the UNDP/GEF project and in cooperation with three national design institutions 10 building codes have been revised and are expected to lead to at least 25% reduction of specific energy consumption both in renovated and new buildings.
In 1997, Law of Uzbekistan Republic No. 412-1 dated 25.04.1997 “On rational energy use” was enacted. In compliance with Resolution No. R-3902 dated 05.09.2012 “On the establishment of a Working Group for a Renewable energy development programme” a Working group to develop the Renewable energy development programme for 2013-2017 was established and its major tasks were specified in order to determine concrete measures to improve renewable energy use and to ensure the rational use of conventional energy resources. Draft law “On renewable energy sources” and draft law “On heat supply” have been submitted for approval. Besides, there are “Heat networks and heating units operation regulations” and “Regulations on the installation and operation of hot water- and heat meters”, as well as a number of other norms and regulations.
People keep replacing dated window units with modern insulated glass units, and incandescent lamps with efficient lighting fixtures.
6.2. Comparing measures implemented in Uzbekistan buildings with the IEA recommendations
6.2.1. Measures related to the building codes, windows and translucent structures
In order to assess the comprehensiveness of the Uzbekistani regulatory framework related to energy efficiency in buildings, energy efficiency policies in Uzbekistan were compared to the 25 policies recommended by IEA for the buildings sector57. Energy efficiency policies implemented in Uzbekistan just to a small degree comply with the IEA recommendations (Tables 6.1-6.3).
In 2011, the Government revised 10 building codes (and adopted the new versions thereof) related to energy efficiency. However, in the other directions the work is either just starting, or has not been launched yet (Table 6.1). Long-term energy efficiency targets for buildings have not been specified in these building codes or in any other regulations. The policy relating to low- or zero-energy buildings construction is missing whatsoever.
57 25 Energy Efficiency Policy Recommendations. 2011 Update. IEA. 2011.
76
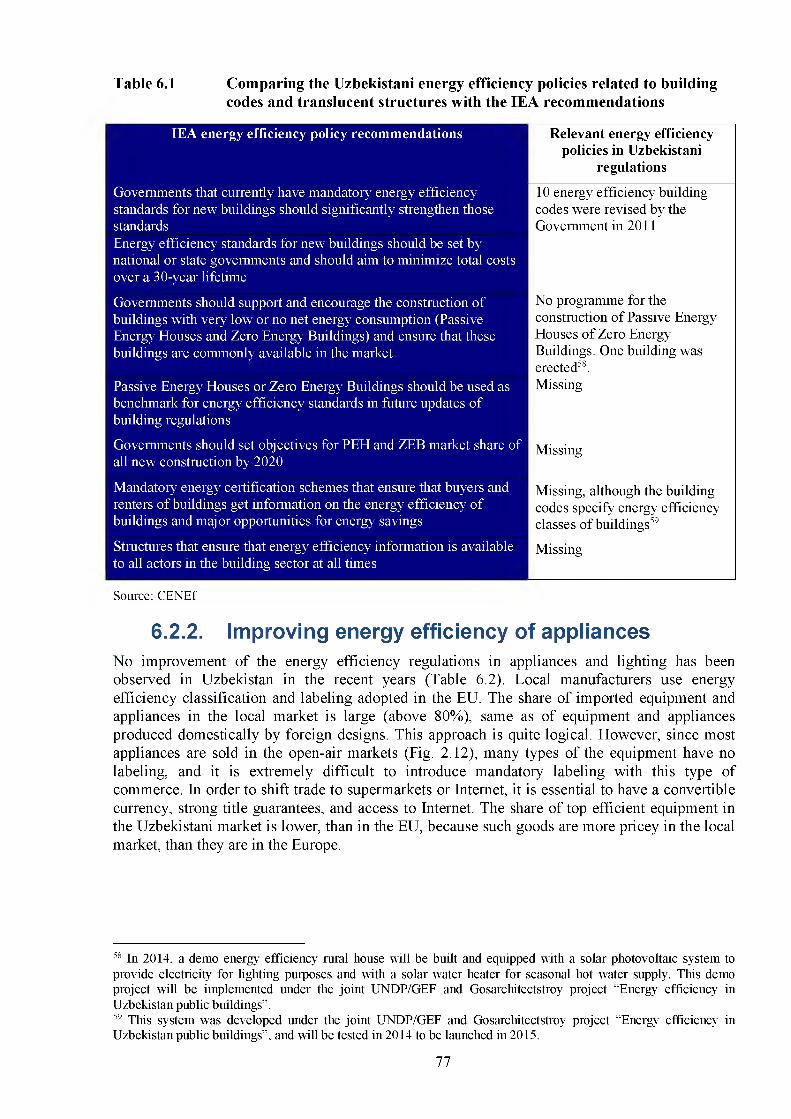
Table 6.1 Comparing the Uzbekistani energy efficiency policies related to buildingcodes and translucent structures with the IEA recommendations
IEA energy efficiency policy recommendations
Governments that currently have mandatory energy efficiency standards for new buildings should significantly strengthen those standardsEnergy efficiency standards for new buildings should be set by national or state governments and should aim to minimize total costs over a 30-year lifetime
Governments should support and encourage the construction of buildings with very low or no net energy consumption (Passive Energy Houses and Zero Energy Buildings) and ensure that these buildings are commonly available in the market
Passive Energy Houses or Zero Energy Buildings should be used as benchmark for energy efficiency standards in future updates of building regulations
Governments should set objectives for PEH and ZEB market share of all new construction by 2020
Mandatory energy certification schemes that ensure that buyers and renters of buildings get information on the energy efficiency of buildings and major opportunities for energy savings
Structures that ensure that energy efficiency information is available to all actors in the building sector at all times
Relevant energy efficiency policies in Uzbekistani
regulations
10 energy efficiency building codes were revised by the Government in 2011
No programme for the construction of Passive Energy Houses of Zero Energy Buildings. One building was erected58.Missing
Missing
Missing, although the building codes specify energy efficiency classes of buildings59
Missing
Source: CENEf
6.2.2. Improving energy efficiency of appliancesNo improvement of the energy efficiency regulations in appliances and lighting has been observed in Uzbekistan in the recent years (Table 6.2). Local manufacturers use energy efficiency classification and labeling adopted in the EU. The share of imported equipment and appliances in the local market is large (above 80%), same as of equipment and appliances produced domestically by foreign designs. This approach is quite logical. However, since most appliances are sold in the open-air markets (Fig. 2.12), many types of the equipment have no labeling, and it is extremely difficult to introduce mandatory labeling with this type of commerce. In order to shift trade to supermarkets or Internet, it is essential to have a convertible currency, strong title guarantees, and access to Internet. The share of top efficient equipment in the Uzbekistani market is lower, than in the EU, because such goods are more pricey in the local market, than they are in the Europe.
58 In 2014, a demo energy efficiency rural house will be built and equipped with a solar photovoltaic system to provide electricity for lighting purposes and with a solar water heater for seasonal hot water supply. This demo project will be implemented under the joint UNDP/GEF and Gosarchitectstroy project “Energy efficiency in Uzbekistan public buildings”.59 This system was developed under the joint UNDP/GEF and Gosarchitectstroy project “Energy efficiency in Uzbekistan public buildings”, and will be tested in 2014 to be launched in 2015.
77
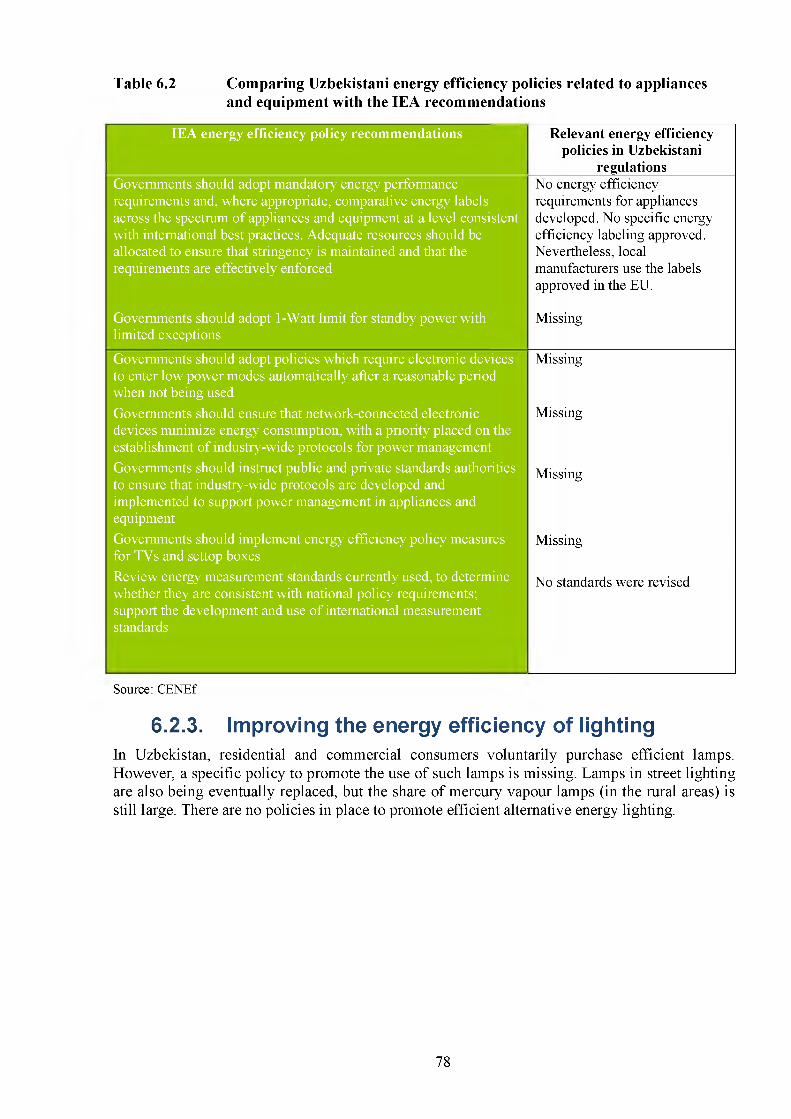
Table 6.2 Comparing Uzbekistani energy efficiency policies related to appliancesand equipment with the IEA recommendations
IEA energy efficiency policy recommendations
Governments should adopt mandatory energy performance requirements and, where appropriate, comparative energy labels across the spectrum of appliances and equipment at a level consistent with international best practices. Adequate resources should be allocated to ensure that stringency is maintained and that the requirements are effectively enforced
Governments should adopt 1-Watt limit for standby power with limited exceptions
Governments should adopt policies which require electronic devices to enter low power modes automatically after a reasonable period when not being usedGovernments should ensure that network-connected electronic devices minimize energy consumption, with a priority placed on the establishment of industry-wide protocols for power management Governments should instruct public and private standards authorities to ensure that industry-wide protocols are developed and implemented to support power management in appliances and equipmentGovernments should implement energy efficiency policy measures for TVs and settop boxesReview energy measurement standards currently used, to determine whether they are consistent with national policy requirements; support the development and use of international measurement standards
Relevant energy efficiency policies in Uzbekistani
__________ regulations________No energy efficiency requirements for appliances developed. No specific energy efficiency labeling approved. Nevertheless, local manufacturers use the labels approved in the EU.
Missing
Missing
Missing
Missing
Missing
No standards were revised
Source: CENEf
6.2.3. Improving the energy efficiency of lightingIn Uzbekistan, residential and commercial consumers voluntarily purchase efficient lamps. However, a specific policy to promote the use of such lamps is missing. Lamps in street lighting are also being eventually replaced, but the share of mercury vapour lamps (in the rural areas) is still large. There are no policies in place to promote efficient alternative energy lighting.
78
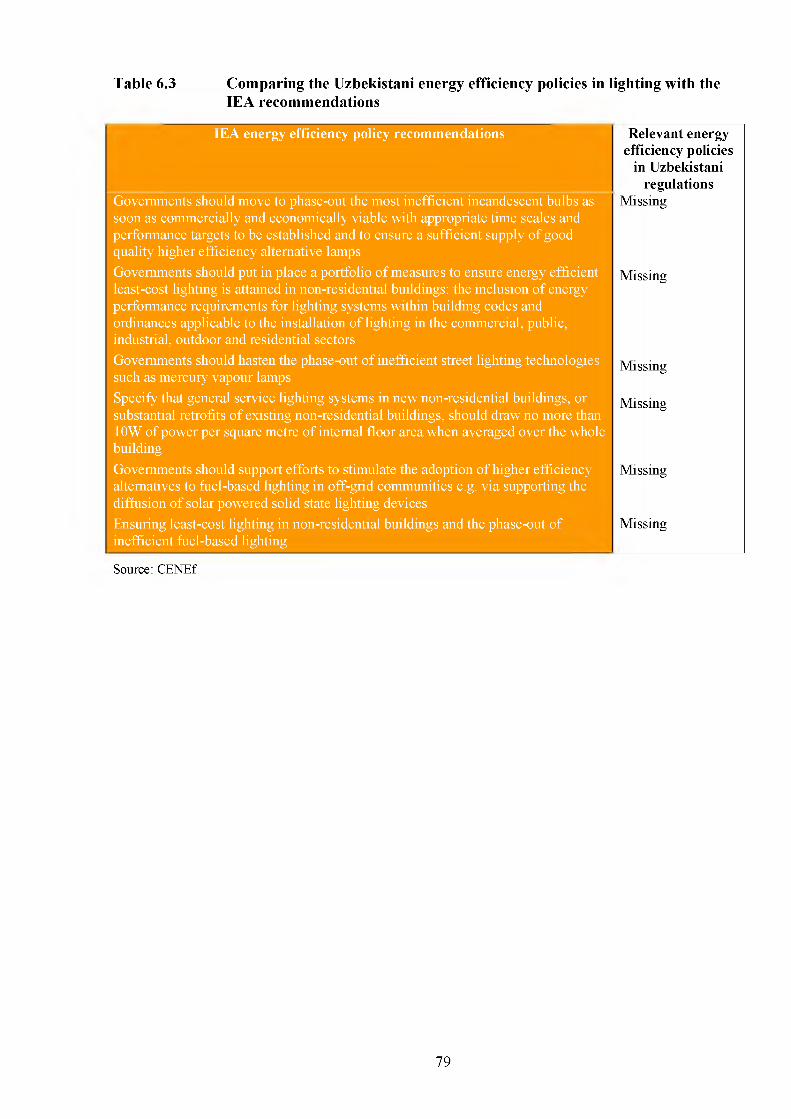
Table 6.3 Comparing the Uzbekistani energy efficiency policies in lighting with theIEA recommendations
IEA energy efficiency policy recommendations Relevant energy efficiency policies
in Uzbekistani regulations
Governments should move to phase-out the most inefficient incandescent bulbs as soon as commercially and economically viable with appropriate time scales and performance targets to be established and to ensure a sufficient supply of good quality higher efficiency alternative lamps
Missing
Governments should put in place a portfolio of measures to ensure energy efficient least-cost lighting is attained in non-residential buildings: the inclusion of energy performance requirements for lighting systems within building codes and ordinances applicable to the installation of lighting in the commercial, public, industrial, outdoor and residential sectors
Missing
Governments should hasten the phase-out of inefficient street lighting technologies such as mercury vapour lamps
Missing
Specify that general service lighting systems in new non-residential buildings, or substantial retrofits of existing non-residential buildings, should draw no more than 10W of power per square metre of internal floor area when averaged over the whole building
Missing
Governments should support efforts to stimulate the adoption of higher efficiency alternatives to fuel-based lighting in off-grid communities e.g. via supporting the diffusion of solar powered solid state lighting devices
Missing
Ensuring least-cost lighting in non-residential buildings and the phase-out of inefficient fuel-based lighting
Missing
Source: CENEf
79
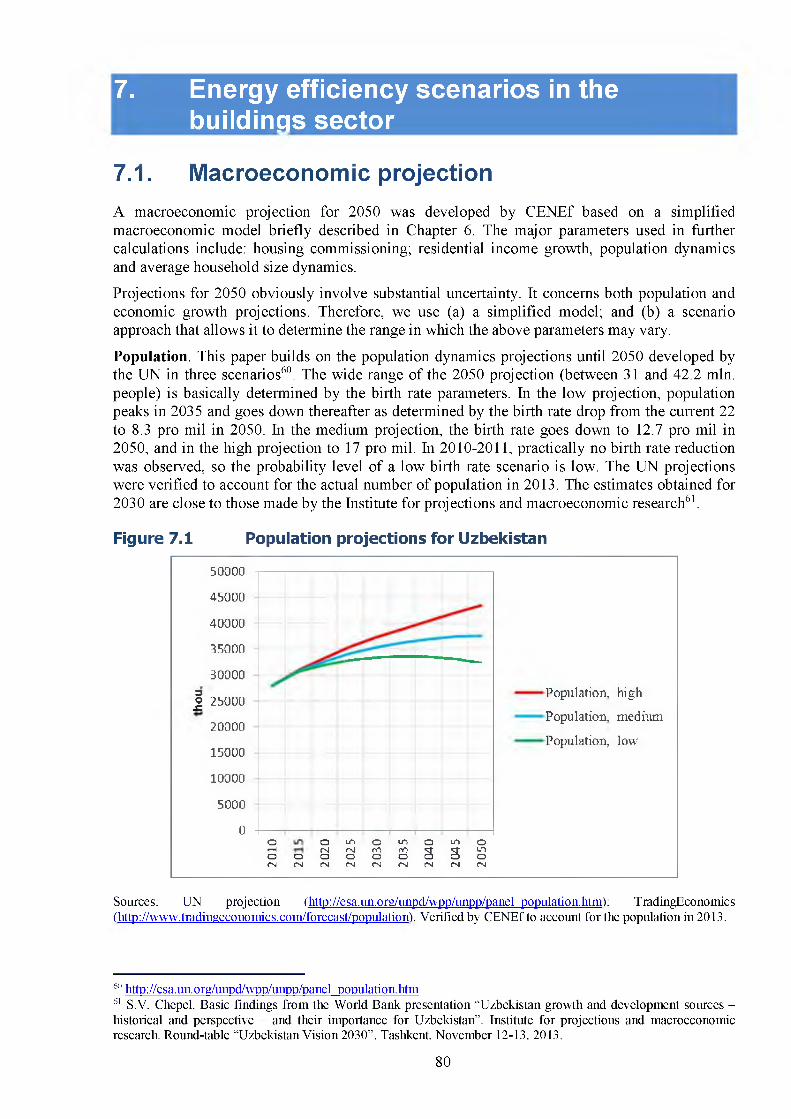
7. Energy efficiency scenarios in the buildinqs sector
7.1. Macroeconomic projectionA macroeconomic projection for 2050 was developed by CENEf based on a simplified macroeconomic model briefly described in Chapter 6. The major parameters used in further calculations include: housing commissioning; residential income growth, population dynamics and average household size dynamics.
Projections for 2050 obviously involve substantial uncertainty. It concerns both population and economic growth projections. Therefore, we use (a) a simplified model; and (b) a scenario approach that allows it to determine the range in which the above parameters may vary.
Population. This paper builds on the population dynamics projections until 2050 developed by the UN in three scenarios60. The wide range of the 2050 projection (between 31 and 42.2 mln. people) is basically determined by the birth rate parameters. In the low projection, population peaks in 2035 and goes down thereafter as determined by the birth rate drop from the current 22 to 8.3 pro mil in 2050. In the medium projection, the birth rate goes down to 12.7 pro mil in 2050, and in the high projection to 17 pro mil. In 2010-2011, practically no birth rate reduction was observed, so the probability level of a low birth rate scenario is low. The UN projections were verified to account for the actual number of population in 2013. The estimates obtained for 2030 are close to those made by the Institute for projections and macroeconomic research61.
Figure 7.1 Population projections for Uzbekistan
50000
45000
40000
35000
30000
J 25000
20000
15000
10000
5000
0О о lO О 1Л о LO о1-H rsl rsl го го S 3 1Ло О О О о о оCM гм rsl ГМ гм гм гм гм гм
Population, high
Population, medium
Population, low
Sources: UN projection (http://esa.un.org/unpd/wpp/unpp/panel population.htm): TradingEconomics (http://www.tradingeconomics.com/forecast/population). Verified by CENEf to account for the population in 2013.
611 http://esa.un.org/unpd/wpp/unpp/panel population.htm61 S.V. Chepel. Basic findings from the World Bank presentation “Uzbekistan growth and development sources - historical and perspective - and their importance for Uzbekistan”. Institute for projections and macroeconomic research. Round-table “Uzbekistan Vision 2030”. Tashkent November 12-13, 2013.
80
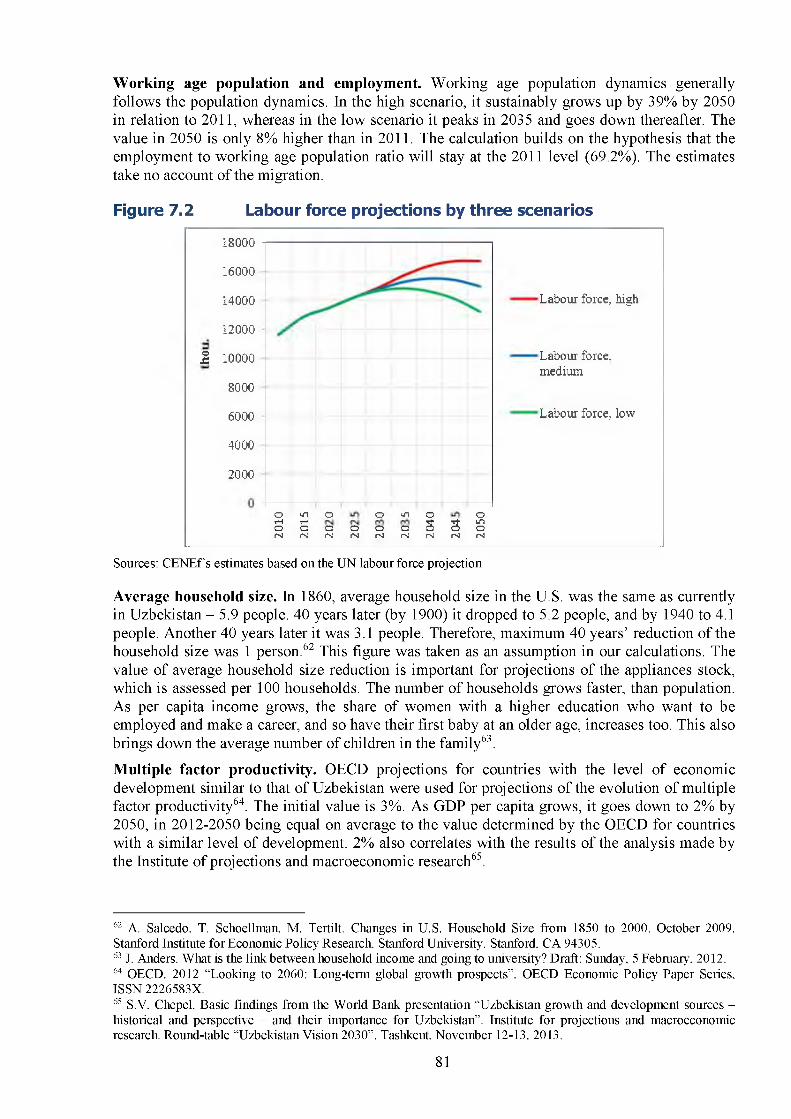
Working age population and employment. Working age population dynamics generally follows the population dynamics. In the high scenario, it sustainably grows up by 39% by 2050 in relation to 2011, whereas in the low scenario it peaks in 2035 and goes down thereafter. The value in 2050 is only 8% higher than in 2011. The calculation builds on the hypothesis that the employment to working age population ratio will stay at the 2011 level (69.2%). The estimates take no account of the migration.
Figure 7.2 Labour force projections by three scenarios
18000
16000
14000
12000
i 10000
8000
6000
4000
2000
О 1Л о о 1Л о отНо «но о О о о 3 3 шоГМ гм ГМ гм гм гм гм гм гм
Labour force, high
Labour force, medium
Labour force, low
Sources: CENEfs estimates based on the UN labour force projection
Average household size. In 1860, average household size in the U.S. was the same as currently in Uzbekistan - 5.9 people. 40 years later (by 1900) it dropped to 5.2 people, and by 1940 to 4.1 people. Another 40 years later it was 3.1 people. Therefore, maximum 40 years’ reduction of the household size was 1 person.62 This figure was taken as an assumption in our calculations. The value of average household size reduction is important for projections of the appliances stock, which is assessed per 100 households. The number of households grows faster, than population. As per capita income grows, the share of women with a higher education who want to be employed and make a career, and so have their first baby at an older age, increases too. This also brings down the average number of children in the family63.
Multiple factor productivity. OECD projections for countries with the level of economic development similar to that of Uzbekistan were used for projections of the evolution of multiple factor productivity64. The initial value is 3%. As GDP per capita grows, it goes down to 2% by 2050, in 2012-2050 being equal on average to the value determined by the OECD for countries with a similar level of development. 2% also correlates with the results of the analysis made by the Institute of projections and macroeconomic research65.
62 A. Salcedo, T. Schoellman, M. Tertilt. Changes in U.S. Household Size from 1850 to 2000. October 2009. Stanford Institute for Economic Policy Research. Stanford University. Stanford, CA 94305.63 J. Anders. What is the link between household income and going to university? Draft: Sunday, 5 February, 2012.64 OECD, 2012 “Looking to 2060: Long-term global growth prospects”, OECD Economic Policy Paper Series, ISSN2226583X.65 S.V. Chepel. Basic findings from the World Bank presentation “Uzbekistan growth and development sources -historical and perspective - and their importance for Uzbekistan”. Institute for projections and macroeconomicresearch. Round-table “Uzbekistan Vision 2030”. Tashkent, November 12-13, 2013.
81
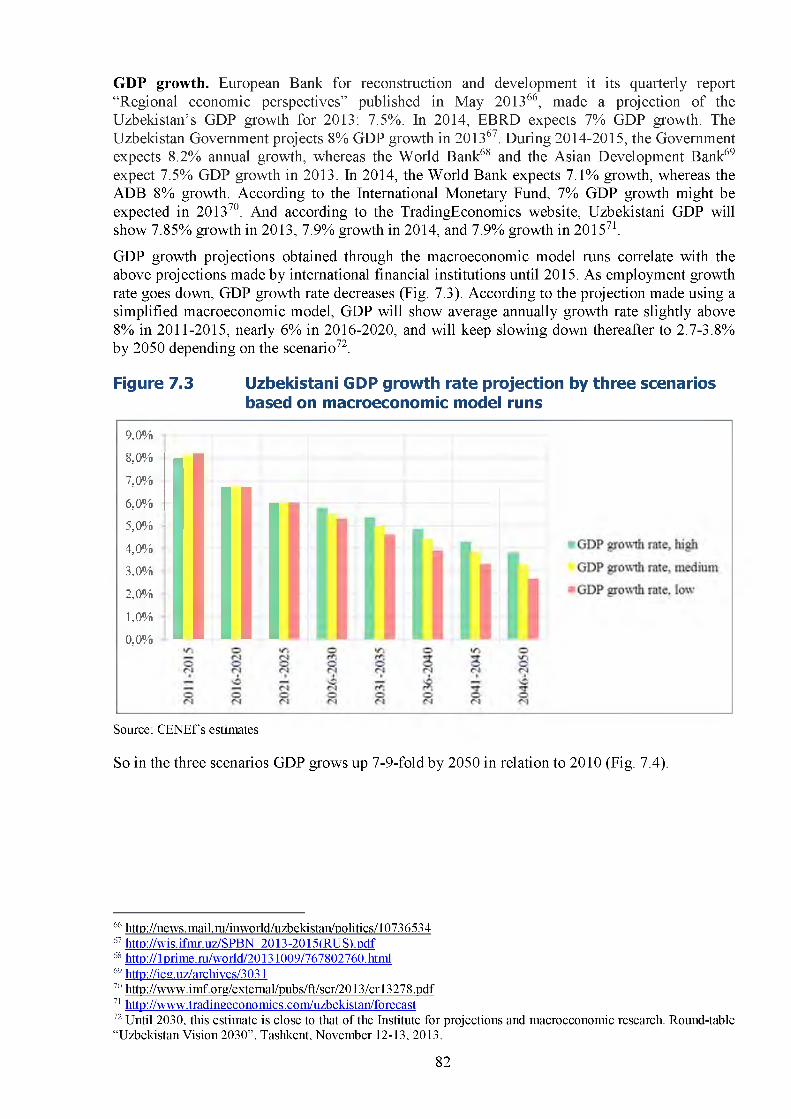
GDP growth. European Bank for reconstruction and development it its quarterly report “Regional economic perspectives” published in May 201366, made a projection of the Uzbekistan’s GDP growth for 2013: 7.5%. In 2014, EBRD expects 7% GDP growth. The Uzbekistan Government projects 8% GDP growth in 201367. During 2014-2015, the Government expects 8.2% annual growth, whereas the World Bank68 and the Asian Development Bank69 expect 7.5% GDP growth in 2013. In 2014, the World Bank expects 7.1% growth, whereas the ADB 8% growth. According to the International Monetary Fund, 7% GDP growth might be expected in 201370. And according to the TradingEconomics website, Uzbekistani GDP will show 7.85% growth in 2013, 7.9% growth in 2014, and 7.9% growth in 201571.
GDP growth projections obtained through the macroeconomic model runs correlate with the above projections made by international financial institutions until 2015. As employment growth rate goes down, GDP growth rate decreases (Fig. 7.3). According to the projection made using a simplified macroeconomic model, GDP will show average annually growth rate slightly above 8% in 2011-2015, nearly 6% in 2016-2020, and will keep slowing down thereafter to 2.7-3.8% by 2050 depending on the scenario72.
Figure 7.3 Uzbekistani GDP growth rate projection by three scenarios based on macroeconomic model runs
9,0%
8,0%
7,0%
6,0%
5,0%
4,0%
3,0%
2,0%
1,0%
0,0%
Source: CENEf s estimates
So in the three scenarios GDP grows up 7-9-fold by 2050 in relation to 2010 (Fig. 7.4).
66 llt tD //news. mail. ru/inworld/uzbekistan/Dolitics/1073653467 llt tD //wis.ifmr.uz/SPBN 2013-2015(RUS).Ddf68 llttD //lDrime.ru/world/20131009/767802760.html69 http //iee.uz/arcliives/3031711 llttD //www.imf.org/external/Dubs/ft/scr/2013/crl3278.Ddf71 http //www.tradineeconomics.com/uzbekistan/forecast72 Until 2030, this estimate is close to that of the Institute for projections and macroeconomic research. Round-table “Uzbekistan Vision 2030”. Tashkent, November 12-13, 2013.
82
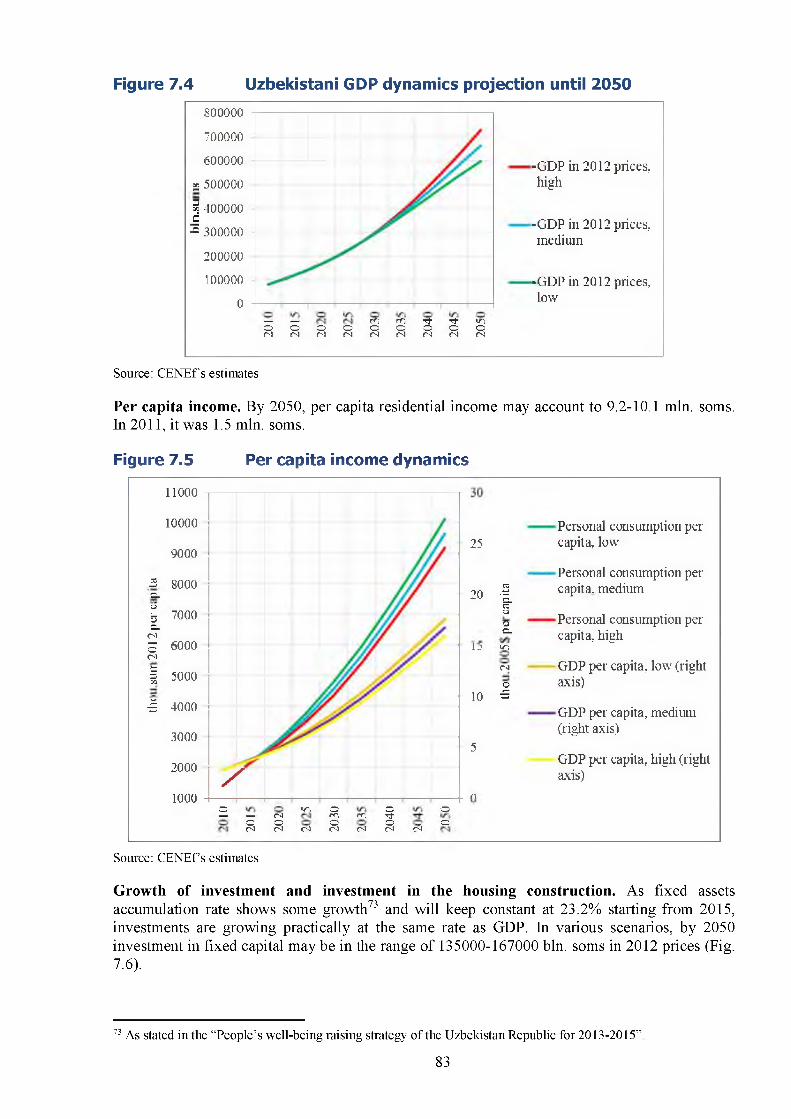
Figure 7.4 Uzbekistani GDP dynamics projection until 2050
800000
700000
600000
2 500000
Щ400000 _cs 300000
200000
100000
0 -
— — w r<i Tf *3- </">o o o o o o o o ot s f s < s ( s e s r s f s < s ( s
Source: CENEf s estimates
Per capita income. By 2050, per capita residential income may account to 9.2-10.1 mln. soms. In 2011, it was 1.5 mln. soms.
Figure 7.5 Per capita income dynamics
Personal consumption per capita, low
Personal consumption per capita, medium
Personal consumption per capita, high
GDP per capita, low (right axis)
GDP per capita, medium (right axis)
GDP per capita, high (right axis)
Source: CENEf s estimates
Growth of investment and investment in the housing construction. As fixed assets accumulation rate shows some growth73 and will keep constant at 23.2% starting from 2015, investments are growing practically at the same rate as GDP. In various scenarios, by 2050 investment in fixed capital may be in the range of 135000-167000 bln. soms in 2012 prices (Fig. 7.6).
11000
10000
9000
2 8000 n.
£ 7000c .C-l5 6000 rj| 5000
ё 4000
3000
2000
10003 УГ, Q О о— — <4 rr, ГГ-, 5о о о о С:
CN) OJ C4 <N 04 сч сЗ
25
к> о
capi
ta
ос_1J ^
САо
10 -5
5
/л
-GDP in 2012 prices, high
-GDP in 2012 prices, medium
-GDP in 2012 prices, low
73 As stated in the “People’s well-being raising strategy of the Uzbekistan Republic for 2013-2015”
83
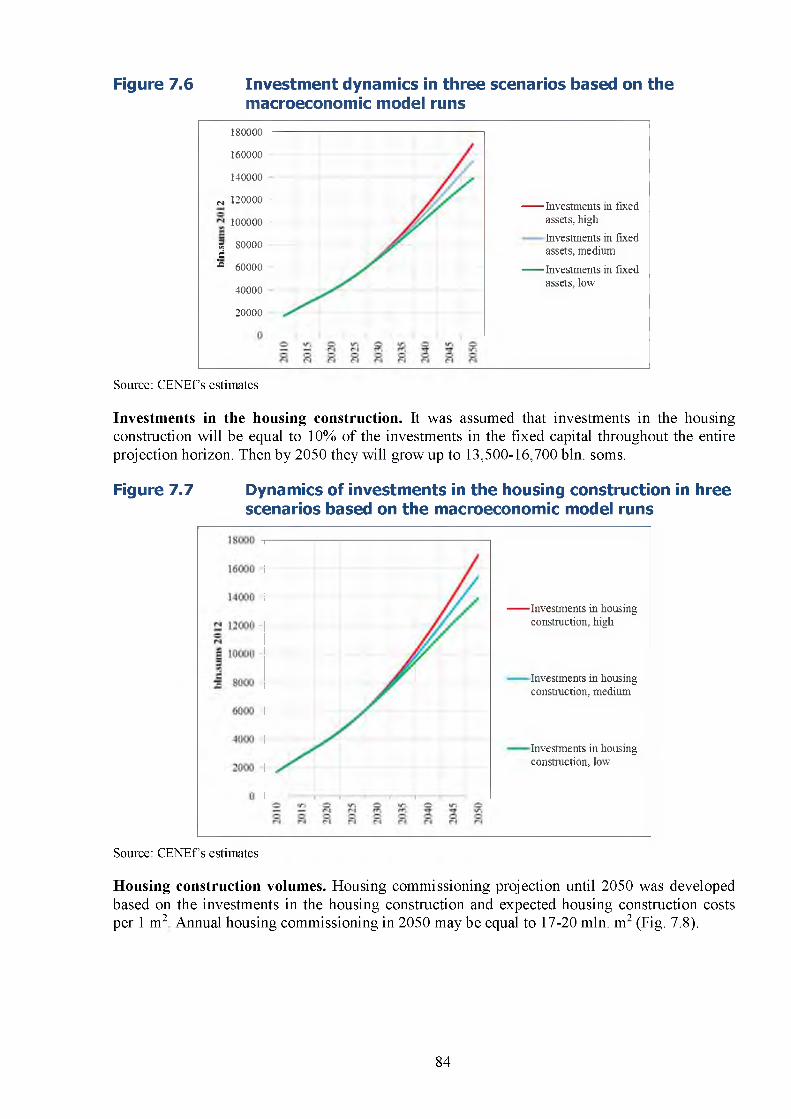
Figure 7.6 Investment dynamics in three scenarios based on the macroeconomic model runs
------ Investments in fixedassets, high
Investments in fixed assets, medium
------ Investments in fixedassets, low
180000
160000
140000
M 120000
100000i 80000 _d■° 60000
40000
20000
Source: CENEfs estimates
Investments in the housing construction. It was assumed that investments in the housing construction will be equal to 10% of the investments in the fixed capital throughout the entire projection horizon. Then by 2050 they will grow up to 13,500-16,700 bln. soms.
Figure 7.7 Dynamics of investments in the housing construction in hree scenarios based on the macroeconomic model runs
------ Investments in housingconstruction, high
Investments in housing construction, medium
Investments in housing construction, low
Source: CENEfs estimates
Housing construction volumes. Housing commissioning projection until 2050 was developed based on the investments in the housing construction and expected housing construction costs per 1 m2 Annual housing commissioning in 2050 may be equal to 17-20 mln. m2 (Fig. 7.8).
84
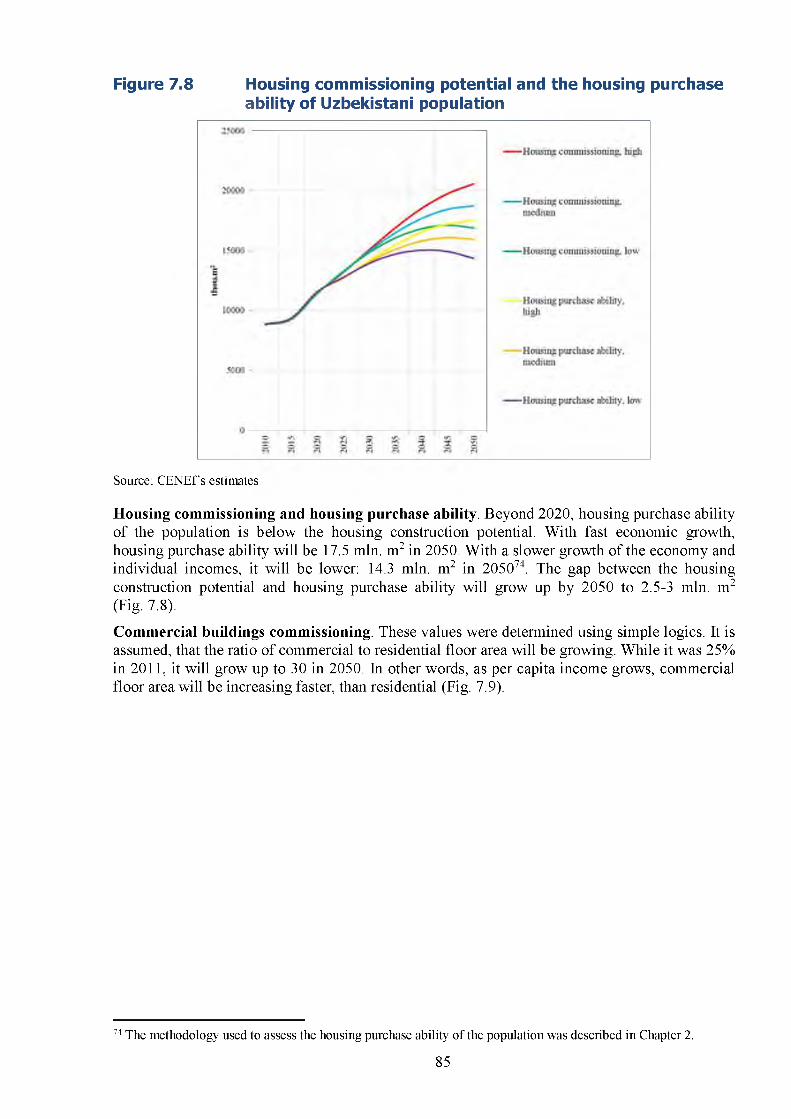
Figure 7.8 Housing commissioning potential and the housing purchase ability of Uzbekistani population
Source: CENEf s estimates
Housing commissioning and housing purchase ability. Beyond 2020, housing purchase ability of the population is below the housing construction potential. With fast economic growth, housing purchase ability will be 17.5 mln. m2 in 2050. With a slower growth of the economy and individual incomes, it will be lower: 14.3 mln. m2 in 205074. The gap between the housing construction potential and housing purchase ability will grow up by 2050 to 2.5-3 mln. m2 (Fig. 7.8).
Commercial buildings commissioning. These values were determined using simple logics. It is assumed, that the ratio of commercial to residential floor area will be growing. While it was 25% in 2011, it will grow up to 30 in 2050. In other words, as per capita income grows, commercial floor area will be increasing faster, than residential (Fig. 7.9).
74 The methodology used to assess the housing purchase ability of the population was described in Chapter 2.
85
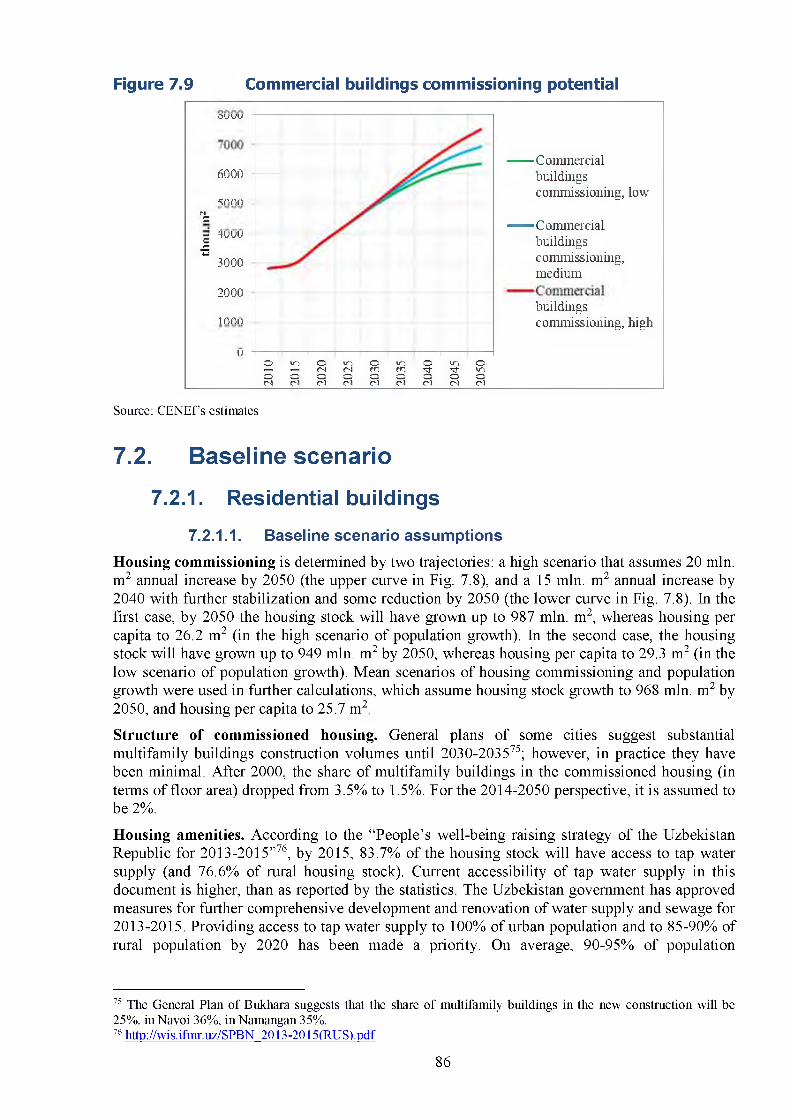
Figure 7.9 Commercial buildings commissioning potential
О UKJU
------ Commercial6000
snnn
buildingscommissioning, low
NС ------ Commercial— 4UUU О £~ 3000
2000
1ППП
buildingscommissioning,medium
buildingscommissioning, high
и
2010
2015
2020
2025
2030
2035
2040
2045
2050
Source: CENEfs estimates
7.2. Baseline scenario7.2.1. Residential buildings
7.2.1.1. Baseline scenario assumptionsHousing commissioning is determined by two trajectories: a high scenario that assumes 20 mln. m2 annual increase by 2050 (the upper curve in Fig. 7.8), and a 15 mln. m2 annual increase by 2040 with further stabilization and some reduction by 2050 (the lower curve in Fig. 7.8). In the first case, by 2050 the housing stock will have grown up to 987 mln. m2, whereas housing per capita to 26.2 m2 (in the high scenario of population growth). In the second case, the housing stock will have grown up to 949 mln. m2 by 2050, whereas housing per capita to 29.3 m2 (in the low scenario of population growth). Mean scenarios of housing commissioning and population growth were used in further calculations, which assume housing stock growth to 968 mln. m2 by 2050, and housing per capita to 25.7 m2
Structure of commissioned housing. General plans of some cities suggest substantial multifamily buildings construction volumes until 2030-203575; however, in practice they have been minimal. After 2000, the share of multifamily buildings in the commissioned housing (in terms of floor area) dropped from 3.5% to 1.5%. For the 2014-2050 perspective, it is assumed to be 2%.
Housing amenities. According to the “People’s well-being raising strategy of the Uzbekistan Republic for 2013-2015”76, by 2015, 83.7% of the housing stock will have access to tap water supply (and 76.6% of rural housing stock). Current accessibility of tap water supply in this document is higher, than as reported by the statistics. The Uzbekistan government has approved measures for further comprehensive development and renovation of water supply and sewage for 2013-2015. Providing access to tap water supply to 100% of urban population and to 85-90% of rural population by 2020 has been made a priority. On average, 90-95% of population
75 The General Plan of Bukhara suggests that the share of multifainily buildings in the new construction will be 25%, in Navoi 36%, in Namangan 35%.76 http://wis.ifmr.uz/SPBN 2013-2015(RUS).pdf
86
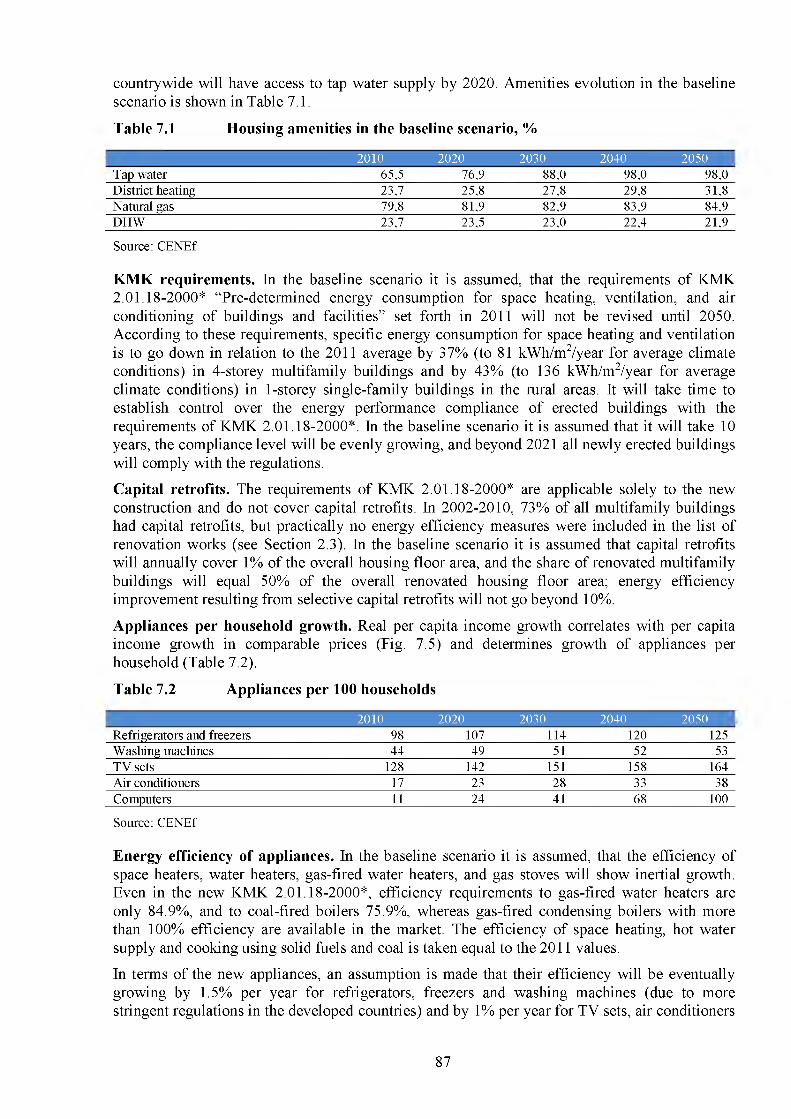
countrywide will have access to tap water supply by 2020. Amenities evolution in the baseline scenario is shown in Table 7.1.
Table 7.1 Housing amenities in the baseline scenario, %
2010 2020 2030 2040 2050 ITap water 65,5 76,9 88,0 98,0 98,0District heating 23,7 25,8 27,8 29,8 31,8Natural gas 79,8 81,9 82,9 83,9 84,9DHW 23,7 23,5 23,0 22,4 21,9
Source: CENEf
KMK requirements. In the baseline scenario it is assumed, that the requirements of KMK2.01.18-2000* “Pre-determined energy consumption for space heating, ventilation, and air conditioning of buildings and facilities” set forth in 2011 will not be revised until 2050. According to these requirements, specific energy consumption for space heating and ventilation is to go down in relation to the 2011 average by 37% (to 81 kWh/m2/year for average climate conditions) in 4-storey multifamily buildings and by 43% (to 136 kWh/m2/year for average climate conditions) in 1-storey single-family buildings in the rural areas. It will take time to establish control over the energy performance compliance of erected buildings with the requirements of KMK 2.01.18-2000*. In the baseline scenario it is assumed that it will take 10 years, the compliance level will be evenly growing, and beyond 2021 all newly erected buildings will comply with the regulations.
Capital retrofits. The requirements of KMK 2.01.18-2000* are applicable solely to the new construction and do not cover capital retrofits. In 2002-2010, 73% of all multifamily buildings had capital retrofits, but practically no energy efficiency measures were included in the list of renovation works (see Section 2.3). In the baseline scenario it is assumed that capital retrofits will annually cover 1% of the overall housing floor area, and the share of renovated multifamily buildings will equal 50% of the overall renovated housing floor area; energy efficiency improvement resulting from selective capital retrofits will not go beyond 10%.
Appliances per household growth. Real per capita income growth correlates with per capita income growth in comparable prices (Fig. 7.5) and determines growth of appliances per household (Table 7.2).
Table 7.2 Appliances per 100 households
2010 2020 2030 2040 2050 IRefrigerators and freezers 98 107 114 120 125Washing machines 44 49 51 52 53TV sets 128 142 151 158 164Air conditioners 17 23 28 33 38Computers 11 24 41 68 100
Source: CENEf
Energy efficiency of appliances. In the baseline scenario it is assumed, that the efficiency of space heaters, water heaters, gas-fired water heaters, and gas stoves will show inertial growth. Even in the new KMK 2.01.18-2000*, efficiency requirements to gas-fired water heaters are only 84.9%, and to coal-fired boilers 75.9%, whereas gas-fired condensing boilers with more than 100% efficiency are available in the market. The efficiency of space heating, hot water supply and cooking using solid fuels and coal is taken equal to the 2011 values.
In terms of the new appliances, an assumption is made that their efficiency will be eventually growing by 1.5% per year for refrigerators, freezers and washing machines (due to more stringent regulations in the developed countries) and by 1% per year for TV sets, air conditioners
87
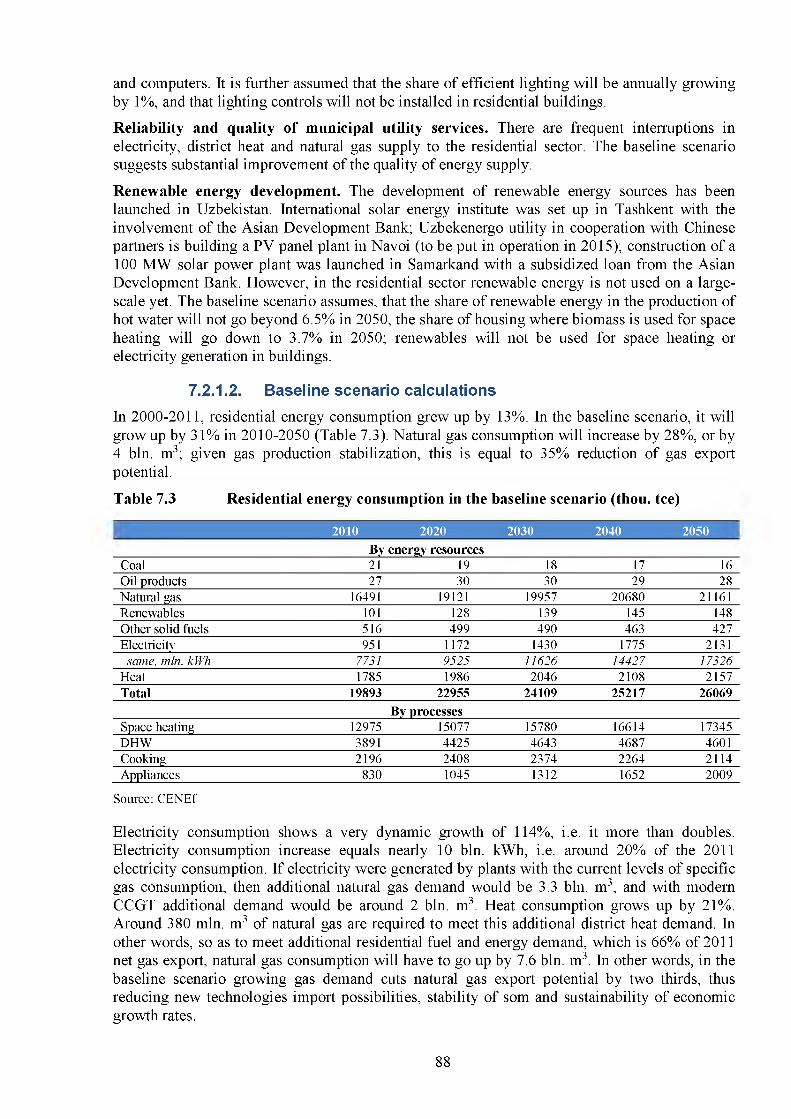
and computers. It is further assumed that the share of efficient lighting will be annually growing by 1%, and that lighting controls will not be installed in residential buildings.
Reliability and quality of municipal utility services. There are frequent interruptions in electricity, district heat and natural gas supply to the residential sector. The baseline scenario suggests substantial improvement of the quality of energy supply.
Renewable energy development. The development of renewable energy sources has been launched in Uzbekistan. International solar energy institute was set up in Tashkent with the involvement of the Asian Development Bank; Uzbekenergo utility in cooperation with Chinese partners is building a PV panel plant in Navoi (to be put in operation in 2015); construction of a 100 MW solar power plant was launched in Samarkand with a subsidized loan from the Asian Development Bank. However, in the residential sector renewable energy is not used on a large- scale yet. The baseline scenario assumes, that the share of renewable energy in the production of hot water will not go beyond 6.5% in 2050, the share of housing where biomass is used for space heating will go down to 3.7% in 2050; renewables will not be used for space heating or electricity generation in buildings.
7.2.1.2. Baseline scenario calculationsIn 2000-2011, residential energy consumption grew up by 13%. In the baseline scenario, it will grow up by 31% in 2010-2050 (Table 7.3). Natural gas consumption will increase by 28%, or by 4 bln. m3; given gas production stabilization, this is equal to 35% reduction of gas export potential.
Table 7.3 Residential energy consumption in the baseline scenario (thou, tee)
2010 2020 2030 2040 2050 IBy energy resources
Coal 21 19 18 17 16Oil products 27 30 30 29 28Natural gas 16491 19121 19957 20680 21161Renewables 101 128 139 145 148Other solid fuels 516 499 490 463 427Electricity 951 1172 1430 1775 2131
same, mln. kWh 7731 9525 11626 14427 17326Heat 1785 1986 2046 2108 2157Total 19893 22955 24109 25217 26069
By processesSpace heating 12975 15077 15780 16614 17345DHW 3891 4425 4643 4687 4601Cooking 2196 2408 2374 2264 2114Appliances 830 1045 1312 1652 2009
Source: CENEf
Electricity consumption shows a very dynamic growth of 114%, i.e. it more than doubles. Electricity consumption increase equals nearly 10 bln. kWh, i.e. around 20% of the 2011 electricity consumption. If electricity were generated by plants with the current levels of specific gas consumption, then additional natural gas demand would be 3.3 bln. m3, and with modem CCGT additional demand would be around 2 bln. m3. Heat consumption grows up by 21%. Around 380 mln. m3 of natural gas are required to meet this additional district heat demand. In other words, so as to meet additional residential fuel and energy demand, which is 66% of 2011 net gas export, natural gas consumption will have to go up by 7.6 bln. m3. In other words, in the baseline scenario growing gas demand cuts natural gas export potential by two thirds, thus reducing new technologies import possibilities, stability of som and sustainability of economic growth rates.
88
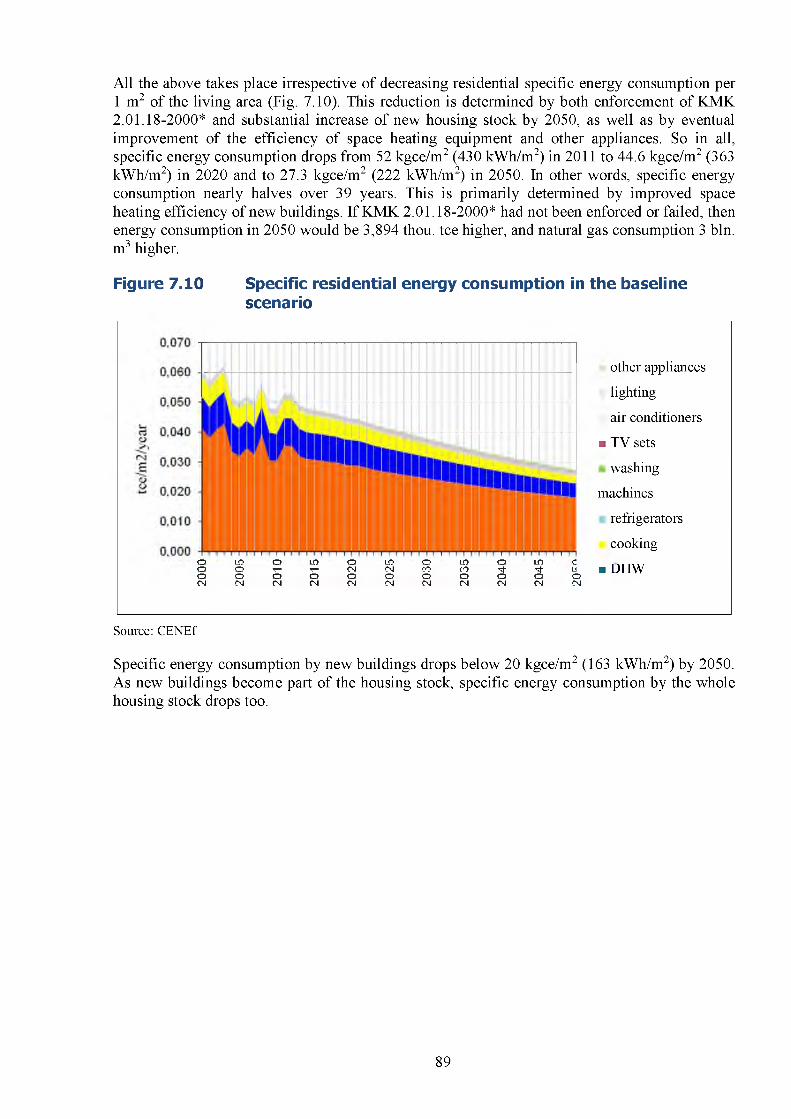
All the above takes place irrespective of decreasing residential specific energy consumption per 1 m2 of the living area (Fig. 7.10). This reduction is determined by both enforcement of KMK2.01.18-2000* and substantial increase of new housing stock by 2050, as well as by eventual improvement of the efficiency of space heating equipment and other appliances. So in all, specific energy consumption drops from 52 kgce/m2 (430 kWh/ т 2) in 2011 to 44.6 kgce/m2 (363 kWh/m2) in 2020 and to 27.3 kgce/m2 (222 kWh/m2) in 2050. In other words, specific energy consumption nearly halves over 39 years. This is primarily determined by improved space heating efficiency of new buildings. If KMK 2.01.18-2000* had not been enforced or failed, then energy consumption in 2050 would be 3,894 thou, tee higher, and natural gas consumption 3 bln. m3 higher.
Figure 7.10 Specific residential energy consumption in the baseline scenario
other appliances
lighting
air conditioners
■ TV sets
washing
machines
refrigerators
cookingO L O O L O O L O O L O O L O CО О т - т - С Ч С Ч С О С О ^ - ^ - Ц И D H W o o o o o o o o o o oС М С Ч С М С М С Ч С М С М С Ч С М С М С Ч
Source: CENEf
Specific energy consumption by new buildings drops below 20 kgce/m2 (163 kWh/m2) by 2050. As new buildings become part of the housing stock, specific energy consumption by the whole housing stock drops too.
89
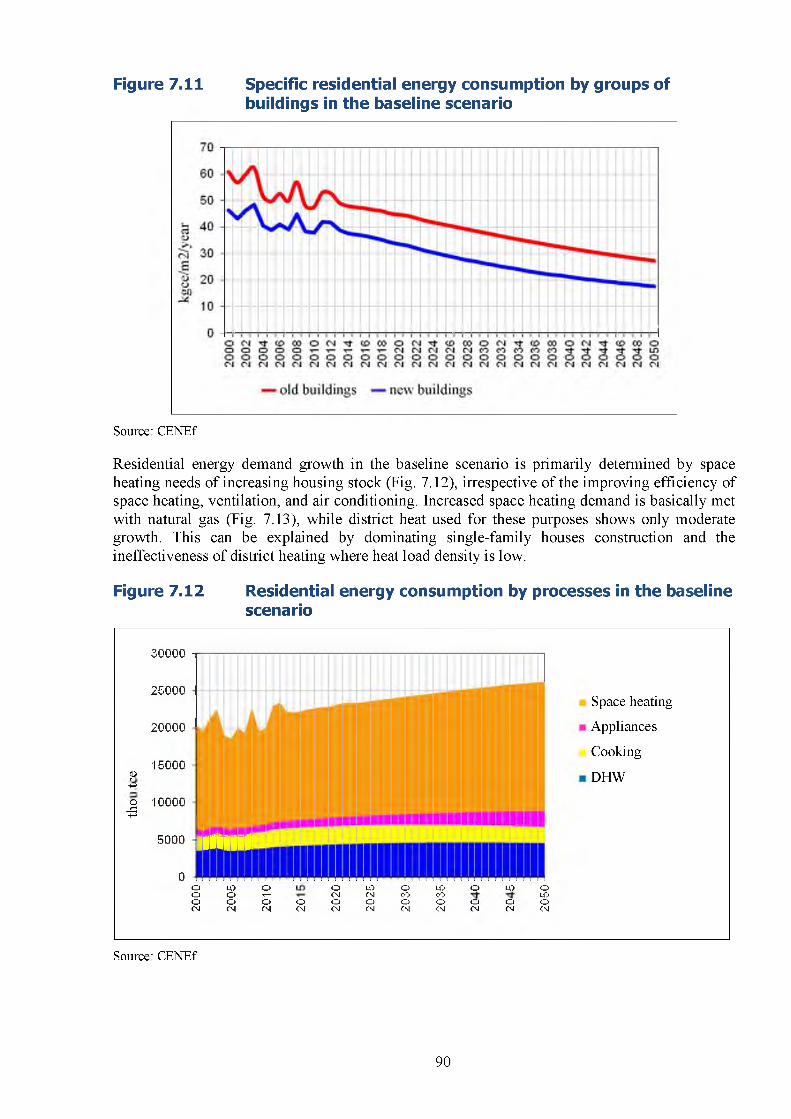
Figure 7.11 Specific residential energy consumption by groups ofbuildings in the baseline scenario
Source: CENEf
Residential energy demand growth in the baseline scenario is primarily determined by space heating needs of increasing housing stock (Fig. 7.12), irrespective of the improving efficiency of space heating, ventilation, and air conditioning. Increased space heating demand is basically met with natural gas (Fig. 7.13), while district heat used for these purposes shows only moderate growth. This can be explained by dominating single-family houses construction and the ineffectiveness of district heating where heat load density is low.
Figure 7.12 Residential energy consumption by processes in the baseline scenario
30000
25000
20000
15000CDг+->
О 10000-В
5000
Space heating
Appliances
Cooking
DHW
0 -
MlIlllIHH
ооосч
LO ОО т-о осч сч
осч
осчосч
LO
счосч
осоосч
LOсоосч
оосч
LOосч
оLO
осч
Source: CENEf
90
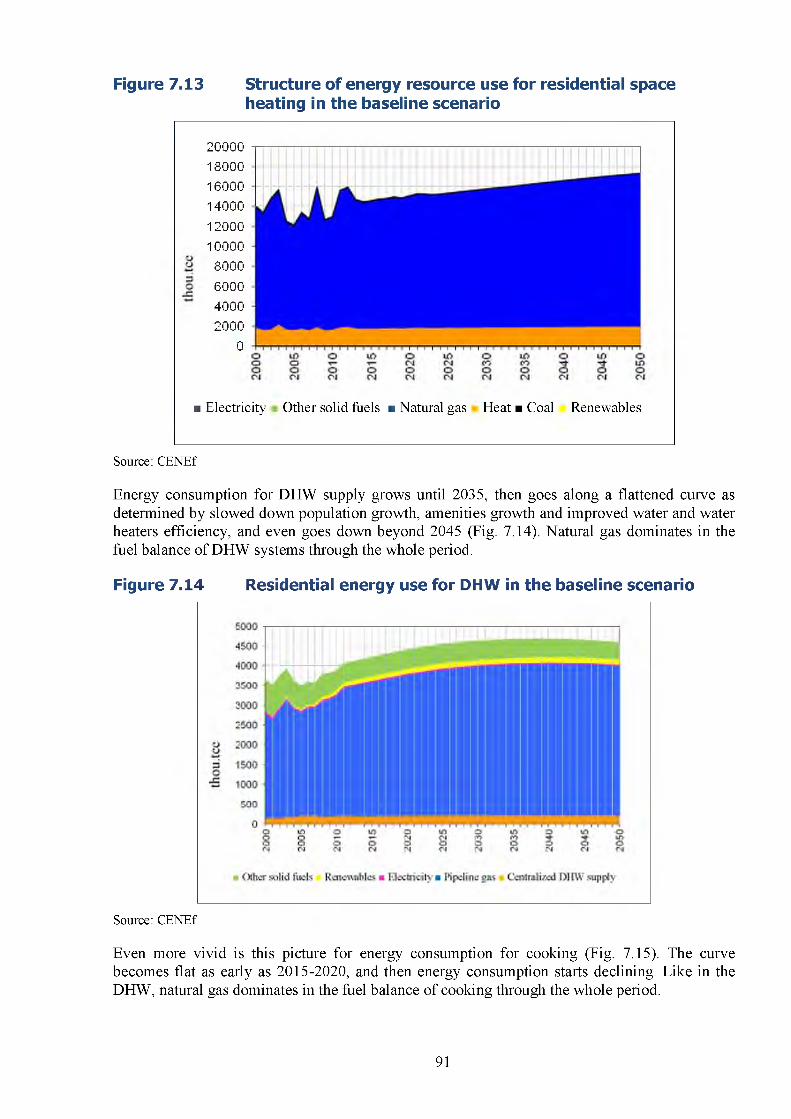
Figure 7.13 Structure of energy resource use for residential spaceheating in the baseline scenario
■ Electricity Other solid fuels ■ Natural gas Heat ■ Coal Renewables
20000180001600014000
1200010000
8000
600040002000
0
Source: CENEf
Energy consumption for DHW supply grows until 2035, then goes along a flattened curve as determined by slowed down population growth, amenities growth and improved water and water heaters efficiency, and even goes down beyond 2045 (Fig. 7.14). Natural gas dominates in the fuel balance of DHW systems through the whole period.
Figure 7.14 Residential energy use for DHW in the baseline scenario
Source: CENEf
Even more vivid is this picture for energy consumption for cooking (Fig. 7.15). The curve becomes flat as early as 2015-2020, and then energy consumption starts declining. Like in the DHW, natural gas dominates in the fuel balance of cooking through the whole period.
91
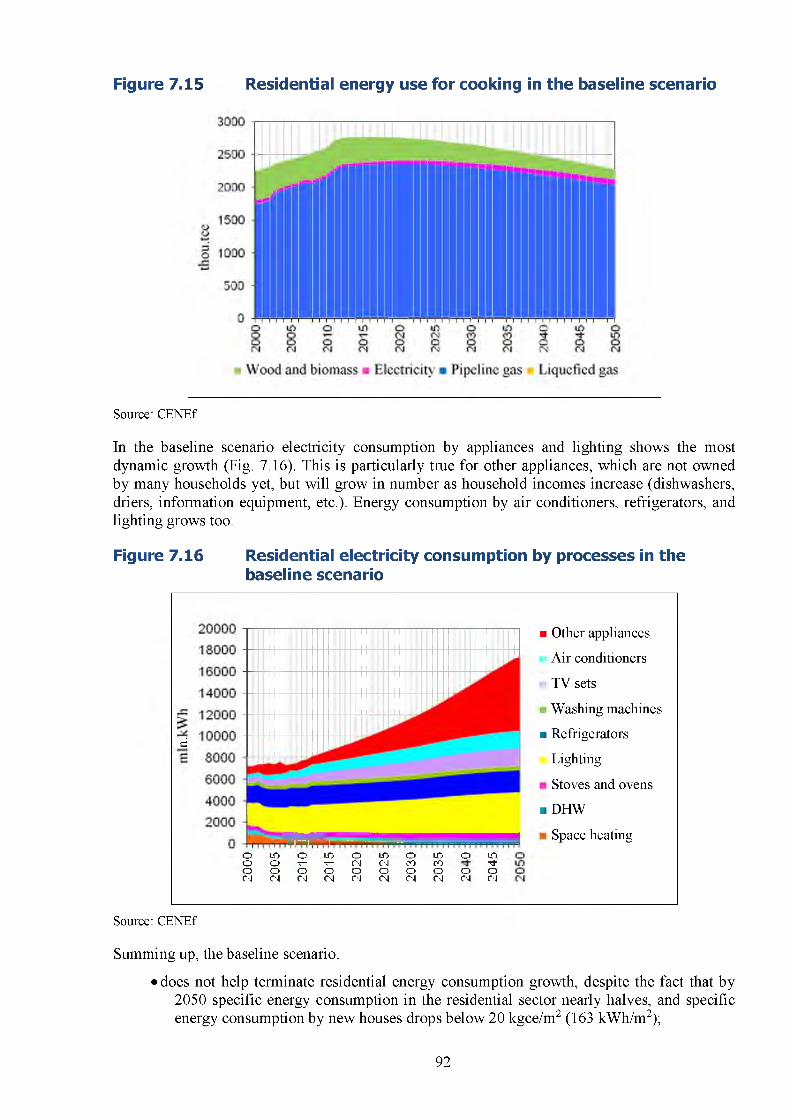
Figure 7.15 Residential energy use for cooking in the baseline scenario
Source: CENEf
In the baseline scenario electricity consumption by appliances and lighting shows the most dynamic growth (Fig. 7.16). This is particularly true for other appliances, which are not owned by many households yet, but will grow in number as household incomes increase (dishwashers, driers, information equipment, etc.). Energy consumption by air conditioners, refrigerators, and lighting grows too.
Figure 7.16 Residential electricity consumption by processes in the baseline scenario
ri
О Ю О Ю О Ю О Ю О Юо О 7— т— (N OJ СО СО 'Фо О О О О о О О О О<N 04 CN (N 04 04 04 04 04 04
■ Other appliances
Air conditioners
TV sets
Washing machines
■ Refrigerators
Lighting
Stoves and ovens
■ DHW
Space heating
Source: CENEf
Summing up, the baseline scenario:
• does not help terminate residential energy consumption growth, despite the fact that by 2050 specific energy consumption in the residential sector nearly halves, and specific energy consumption by new houses drops below 20 kgce/m2 (163 kWh/m2);
92
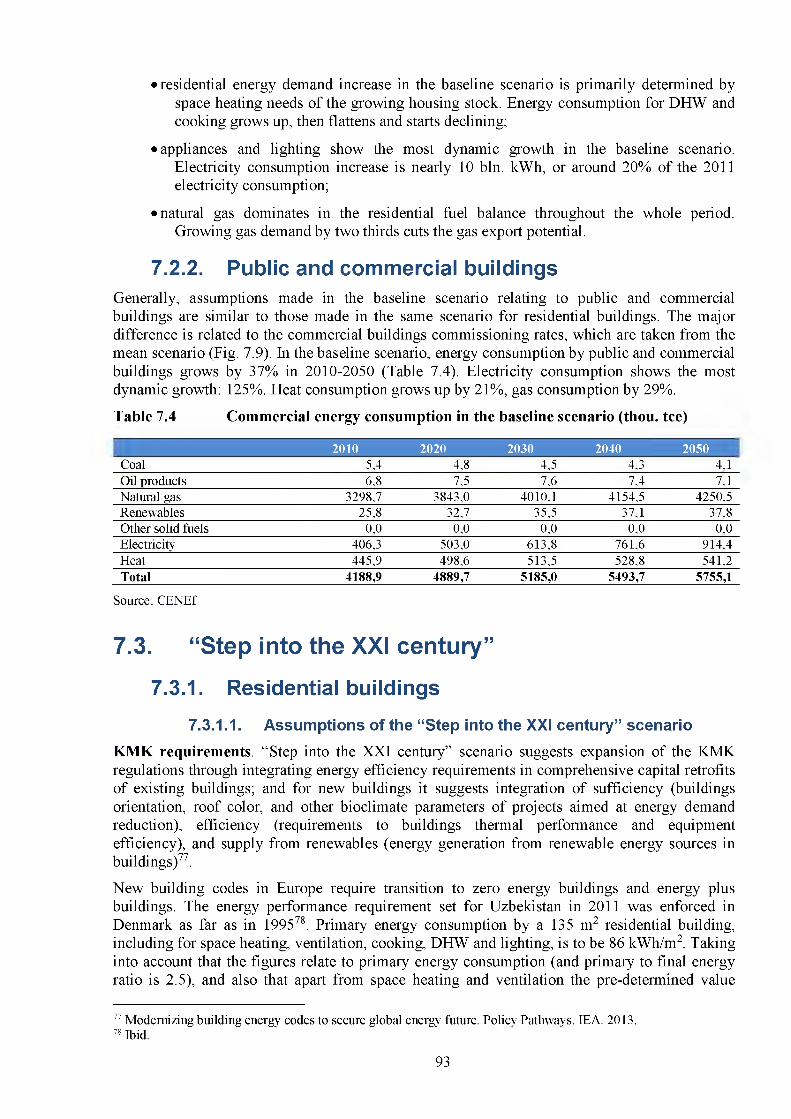
• residential energy demand increase in the baseline scenario is primarily determined byspace heating needs of the growing housing stock. Energy consumption for DHW and cooking grows up, then flattens and starts declining;
• appliances and lighting show the most dynamic growth in the baseline scenario.Electricity consumption increase is nearly 10 bln. kWh, or around 20% of the 2011 electricity consumption;
• natural gas dominates in the residential fuel balance throughout the whole period.Growing gas demand by two thirds cuts the gas export potential.
7.2.2. Public and commercial buildingsGenerally, assumptions made in the baseline scenario relating to public and commercial buildings are similar to those made in the same scenario for residential buildings. The major difference is related to the commercial buildings commissioning rates, which are taken from the mean scenario (Fig. 7.9). In the baseline scenario, energy consumption by public and commercial buildings grows by 37% in 2010-2050 (Table 7.4). Electricity consumption shows the most dynamic growth: 125%. Heat consumption grows up by 21%, gas consumption by 29%.
Table 7.4 Commercial energy consumption in the baseline scenario (thou, tee)
2010 2020 2030 2040 2050 ICoal 5,4 4,8 4,5 4,3 4,1Oil products 6,8 7,5 7,6 7,4 7,1Natural gas 3298,7 3843,0 4010,1 4154,5 4250,5Renewables 25,8 32,7 35,5 37,1 37,8Other solid fuels 0,0 0,0 0,0 0,0 0,0Electricity 406,3 503,0 613,8 761,6 914,4Heat 445,9 498,6 513,5 528,8 541,2Total 4188,9 4889,7 5185,0 5493,7 5755,1
Source: CENEf
7.3. “Step into the XXI century”7.3.1. Residential buildings
7.3.1.1. Assumptions of the “Step into the XXI century” scenarioKMK requirements. “Step into the XXI century” scenario suggests expansion of the KMK regulations through integrating energy efficiency requirements in comprehensive capital retrofits of existing buildings; and for new buildings it suggests integration of sufficiency (buildings orientation, roof color, and other bioclimate parameters of projects aimed at energy demand reduction), efficiency (requirements to buildings thermal performance and equipment efficiency), and supply from renewables (energy generation from renewable energy sources in buildings)77.
New building codes in Europe require transition to zero energy buildings and energy plus buildings. The energy performance requirement set for Uzbekistan in 2011 was enforced in Denmark as far as in 199578. Primary energy consumption by a 135 m2 residential building, including for space heating, ventilation, cooking, DHW and lighting, is to be 86 kWh/ т 2. Taking into account that the figures relate to primary energy consumption (and primary to final energy ratio is 2.5), and also that apart from space heating and ventilation the pre-determined value
77 Modernizing building energy codes to secure global energy future. Policy Pathways. IEA. 2013.78 Ibid.
93
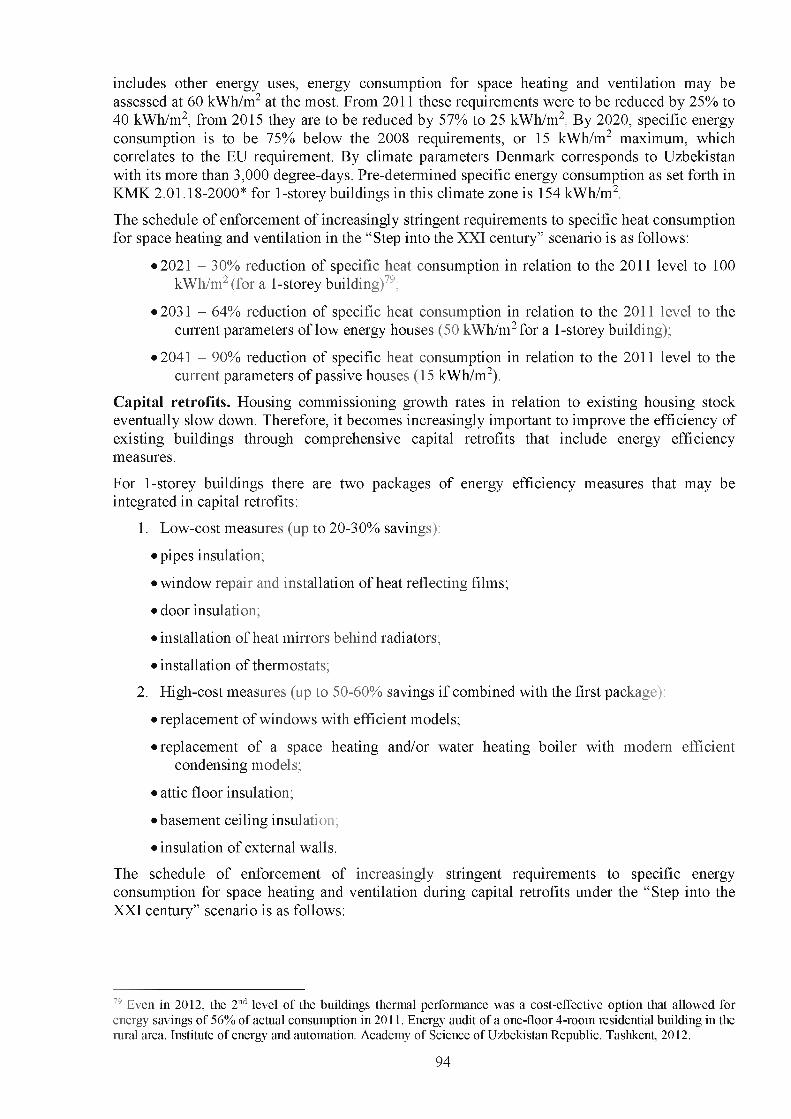
includes other energy uses, energy consumption for space heating and ventilation may be assessed at 60 kWh/ т 2 at the most. From 2011 these requirements were to be reduced by 25% to 40 kWh/ т 2, from 2015 they are to be reduced by 57% to 25 kWh/m2 By 2020, specific energy consumption is to be 75% below the 2008 requirements, or 15 kWh/m2 maximum, which correlates to the EU requirement. By climate parameters Denmark corresponds to Uzbekistan with its more than 3,000 degree-days. Pre-determined specific energy consumption as set forth in KMK 2.01.18-2000* for 1-storey buildings in this climate zone is 154 kWh/m2
The schedule of enforcement of increasingly stringent requirements to specific heat consumption for space heating and ventilation in the “Step into the XXI century” scenario is as follows:
• 2021 - 30% reduction of specific heat consumption in relation to the 2011 level to 100kWh/m2 (for a 1-storey building)79;
• 2031 - 64% reduction of specific heat consumption in relation to the 2011 level to thecurrent parameters of low energy houses (50 kWh/m2 for a 1-storey building);
• 2041 - 90% reduction of specific heat consumption in relation to the 2011 level to thecurrent parameters of passive houses (15 kWh/m2).
Capital retrofits. Housing commissioning growth rates in relation to existing housing stock eventually slow down. Therefore, it becomes increasingly important to improve the efficiency of existing buildings through comprehensive capital retrofits that include energy efficiency measures.
For 1-storey buildings there are two packages of energy efficiency measures that may be integrated in capital retrofits:
1. Low-cost measures (up to 20-30% savings):
• pipes insulation;
• window repair and installation of heat reflecting films;
• door insulation;
• installation of heat mirrors behind radiators;
• installation of thermostats;
2. High-cost measures (up to 50-60% savings if combined with the first package):
• replacement of windows with efficient models;
• replacement of a space heating and/or water heating boiler with modem efficientcondensing models;
• attic floor insulation;
• basement ceiling insulation;
• insulation of external walls.
The schedule of enforcement of increasingly stringent requirements to specific energy consumption for space heating and ventilation during capital retrofits under the “Step into the XXI century” scenario is as follows:
79 Even in 2012, the 2nd level o f the buildings thermal performance was a cost-effective option that allowed for energy savings of 56% of actual consumption in 2011. Energy audit o f a one-floor 4-room residential building in the rural area. Institute of energy and automation. Academy of Science of Uzbekistan Republic. Tashkent, 2012.
94
• 2016 г. - integrating into KMK a requirement for 30% specific energy consumptionreduction resulting from comprehensive capital retrofits in relation to the baseline level;
• from 2016 bringing the share of residential buildings that undergo capital retrofits to 2%per year with a 50% share of multifamily residential buildings in the overall floor area of buildings that undergo capital retrofits;
• 2031 - integrating into KMK a requirement for 50% specific energy consumptionreduction resulting from comprehensive capital retrofits in relation to the baseline level;
• 2041 - 90% reduction of specific energy consumption in relation to the 2011 baselineyear to the current parameters of a passive house (15 kWh/m2).
The requirements of KMK 2.01.18-2000* are applicable solely to the new construction and do not cover capital retrofits. In 2002-2010, 73% of all multifamily buildings had capital retrofits, but practically no energy efficiency measures were included in the list of renovation works (see Section 2.3). In the baseline scenario it is assumed that capital retrofits will annually cover 1% of the overall housing floor area, and the share of renovated multifamily buildings will equal 50% of the overall renovated housing floor area; energy efficiency improvement resulting from selective capital retrofits will not go beyond 10%.
Energy efficiency of space- and water heating boilers. It is assumed that 5% of gas-fired boilers are annually withdrawn from service, and only boilers with at least 92% efficiency are considered for the new construction, capital retrofits and replacement of dated boilers (the share of such boilers grows up to 100% after 2021) and boilers with the efficiency in the range from 86% and 92% (the share of such boilers drops to zero by 2021). As a result, the average efficiency of gas-fired boilers grows up from 75% in 2010 to 82% in 2020 and to 91% by 2050. It is further assumed that the efficiency of space heating and water heating systems that use other fuels will be growing at the same rate as the efficiency of gas-fired boilers.
Energy efficiency of lighting. In this scenario an assumption is made that, as CFL improve and LED increasingly penetrate, average voltage of an efficient lamp to replace a standard 60W incandescent bulb will be declining by 1% per year. The share of efficient lighting in relation to the baseline scenario will grow up from 19% to 50% in 2020, and from 29% to 100% by 2030.
Energy efficiency of appliances. It is assumed that implementation of information campaigns and programmes that provide incentives for purchasing more efficient appliances will help speed up annual reduction of average specific energy consumption by the major appliances stock by 0.1%. For computers and other small appliances and information equipment, specific energy consumption per unit will be declining at 3% per year driven by further miniaturization and efficiency improvement, and all households will have computers and all the necessary periphery by 2050.
7.3.1.2. Calculations under the “Step into the XXI century” scenarioAfter some growth in 2010-2020, residential energy consumption begins to decline driven by the implementation of measures under the “Step into the XXI century” scenario, despite a substantial increase of the housing stock (Table 7.5). It is possible to first cap the growth of natural gas consumption and then make it go down. Natural gas consumption declines by 5 bln. m3 in relation to the baseline scenario. Electricity consumption growth rate slows down substantially and is only 33% versus 114% in the baseline scenario. Electricity consumption increase is only 2.6 bln. kWh versus 10 bln. kWh in the baseline scenario. Heat consumption shows some growth by 2020 followed by 85% decline by 2050 in relation to the 2010 level.
95
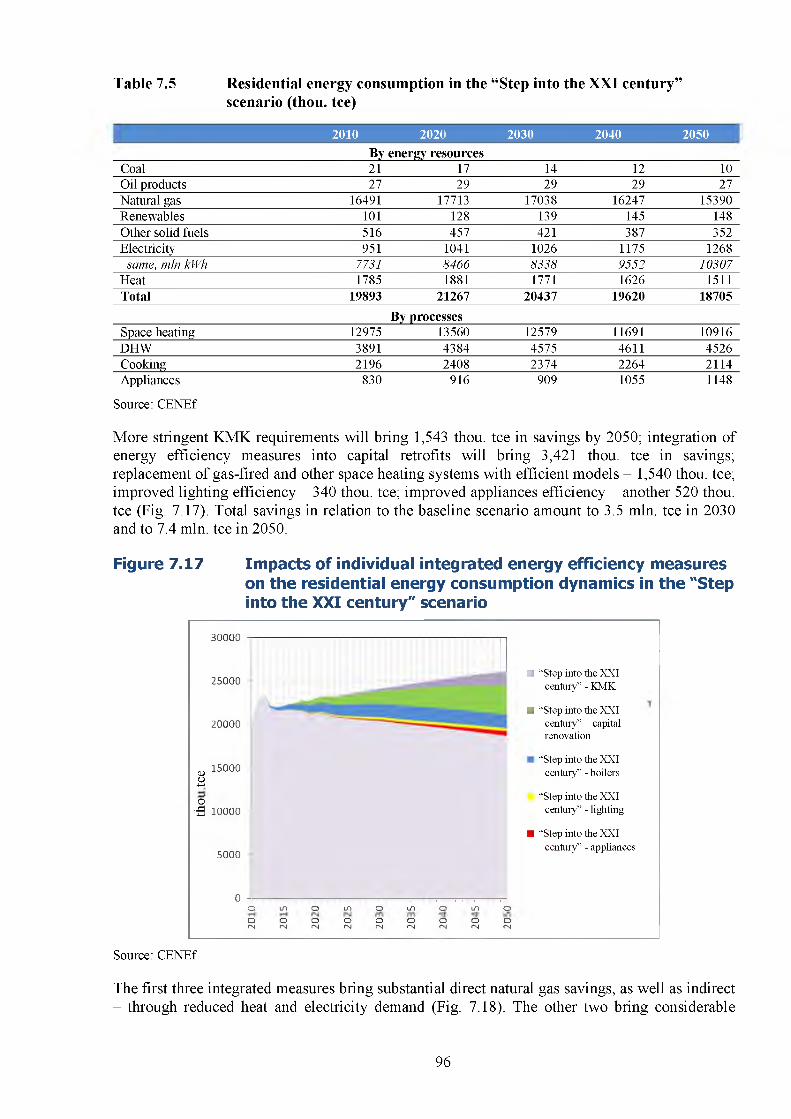
Table 7.5 Residential energy consumption in the “Step into the XXI century”scenario (thou, tee)
2010 2020 2030 2040 2050 IBy energy resources
Coal 21 17 14 12 10Oil products 27 29 29 29 27Natural gas 16491 17713 17038 16247 15390Renewables 101 128 139 145 148Other solid fuels 516 457 421 387 352Electricity 951 1041 1026 1175 1268
same, mln kWh 7731 8466 8338 9552 10307Heat 1785 1881 1771 1626 1511Total 19893 21267 20437 19620 18705
By processesSpace heating 12975 13560 12579 11691 10916DHW 3891 4384 4575 4611 4526Cooking 2196 2408 2374 2264 2114Appliances 830 916 909 1055 1148
Source: CENEf
More stringent KMK requirements will bring 1,543 thou, tee in savings by 2050; integration of energy efficiency measures into capital retrofits will bring 3,421 thou, tee in savings; replacement of gas-fired and other space heating systems with efficient models - 1,540 thou, tee; improved lighting efficiency - 340 thou, tee; improved appliances efficiency - another 520 thou, tee (Fig. 7.17). Total savings in relation to the baseline scenario amount to 3.5 mln. tee in 2030 and to 7.4 mln. tee in 2050.
Figure 7.17 Impacts of individual integrated energy efficiency measures on the residential energy consumption dynamics in the "Step into the XXI century" scenario
30000
25000
20000
u 15000О+->О
-Й 10000
5000
0 -} . , , . , ----- . . I I . I I i i . i i ■ i i i ............................. т i© L n O L n O U - t O L D Oo o o o o o o o or 4 r g r N P g r 4 r \ i f N P \ i r 4
■ “Step into the XXIcentury” - KMK
■ “Step into the XXIcentury” - capital renovation
“Step into the XXI century” - boilers
“Step into the XXI century” - lighting
■ “Step into the XXIcentury” - appliances
Source: CENEf
The first three integrated measures bring substantial direct natural gas savings, as well as indirect - through reduced heat and electricity demand (Fig. 7.18). The other two bring considerable
96
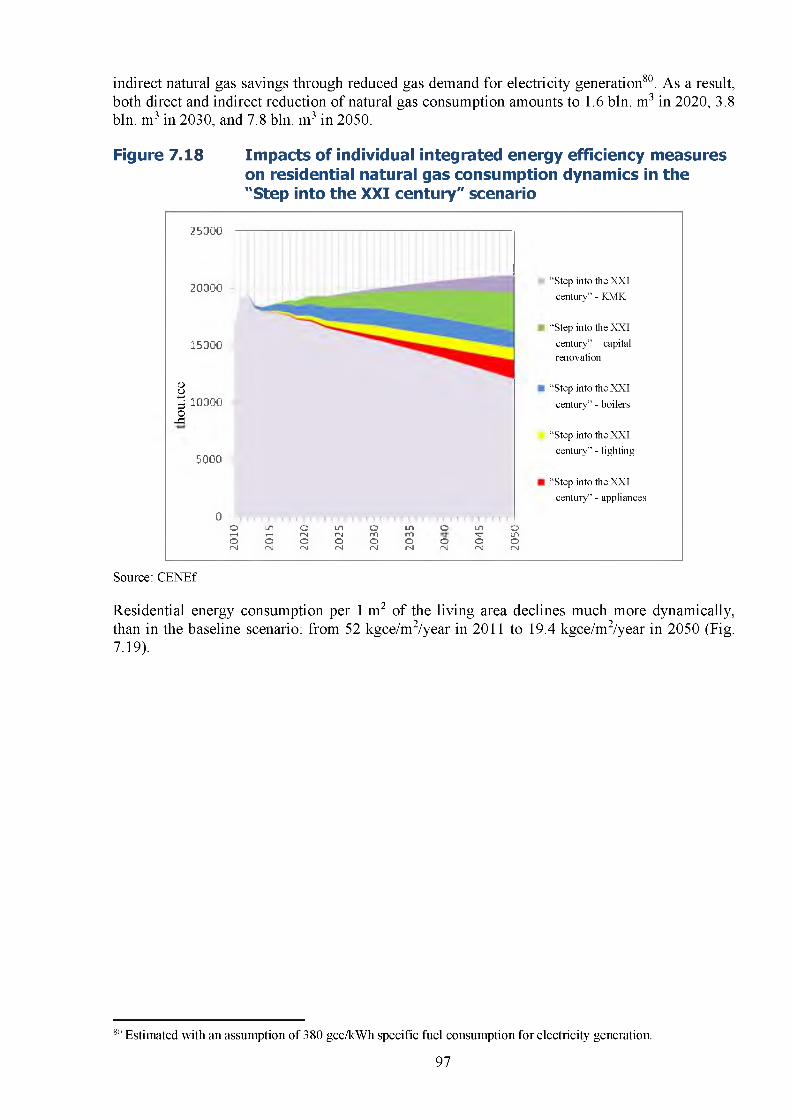
indirect natural gas savings through reduced gas demand for electricity generation80. As a result, both direct and indirect reduction of natural gas consumption amounts to 1.6 bln. m3 in 2020, 3.8 bln. m3 in 2030, and 7.8 bln. m3 in 2050.
Figure 7.18 Impacts of individual integrated energy efficiency measures on residential natural gas consumption dynamics in the "Step into the XXI century" scenario
25000
20000
15000
CDО£ 10000о-a
5000
0О 1Л О ш о 1Л о 1Л оrH гЧ гм гм го го <3- 1ЛО О О о о о О О огм гм гм гм гм ГМ гм гм гм
“Step into the XXI century” - KMK
“Step into the XXI century” - capital renovation
“Step into the XXI century” - boilers
“Step into the XXI century” - lighting
“Step into the XXI century” - appliances
Source: CENEf
Residential energy consumption per 1 m2 of the living area declines much more dynamically, than in the baseline scenario: from 52 kgce/m2/year in 2011 to 19.4 kgce/m2/year in 2050 (Fig. 7.19).
811 Estimated with an assumption of 380 gee/kWh specific fuel consumption for electricity generation.
97
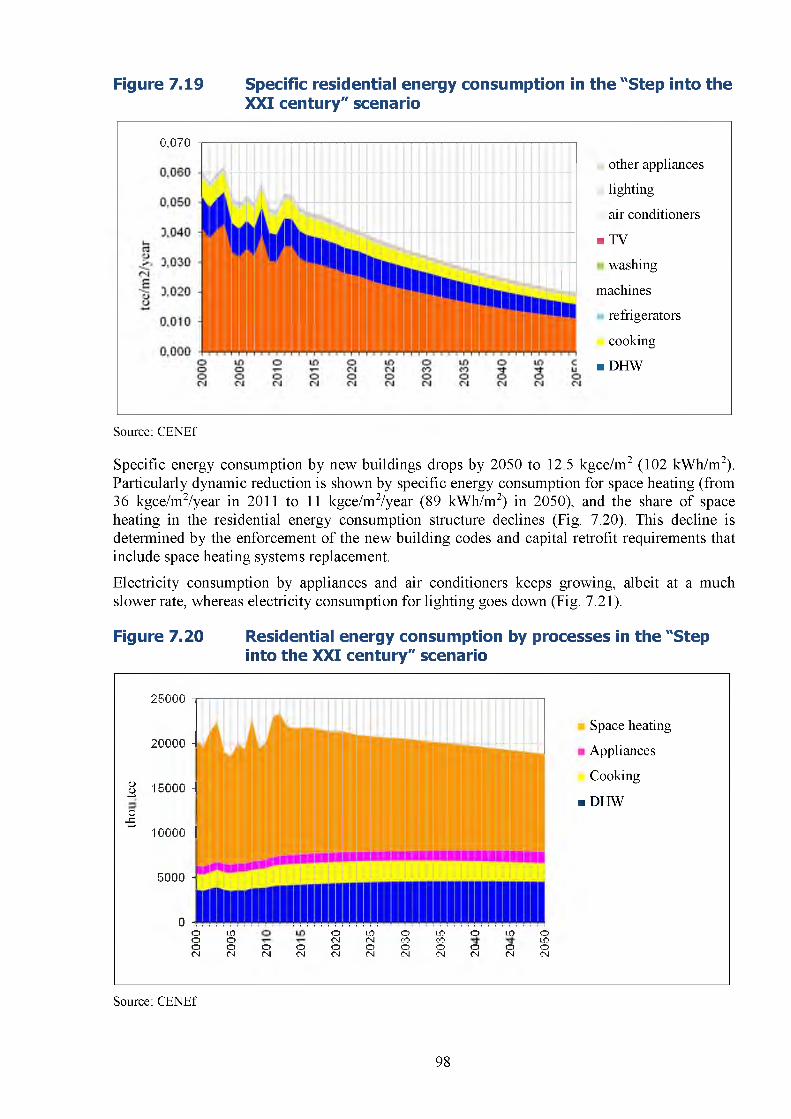
Figure 7.19 Specific residential energy consumption in the "Step into theXXI century" scenario
0,070
other appliances
lighting
air conditioners
■ TV
washing
machines
refrigerators
cooking
■ DHW
Source: CENEf
Specific energy consumption by new buildings drops by 2050 to 12.5 kgce/m2 (102 kWh/m2). Particularly dynamic reduction is shown by specific energy consumption for space heating (from 36 kgce/m2/year in 2011 to 11 kgce/m2/year (89 kWh/ т 2) in 2050), and the share of space heating in the residential energy consumption structure declines (Fig. 7.20). This decline is determined by the enforcement of the new building codes and capital retrofit requirements that include space heating systems replacement.
Electricity consumption by appliances and air conditioners keeps growing, albeit at a much slower rate, whereas electricity consumption for lighting goes down (Fig. 7.21).
Figure 7.20 Residential energy consumption by processes in the "Step into the XXI century" scenario
25000
20000 A
8 15000 A+-> ' О'В .ю о о о H
5000 -
о -ооосч
LO
оОСЧ
ОСМ
ОСЧ
ОСЧОСЧ
LO
СЧоСЧ
осооСЧ
LOсооСЧ
ооСЧ
LOоСЧ
оLOоСЧ
Space heating
Appliances
Cooking
■ DHW
Source: CENEf
98
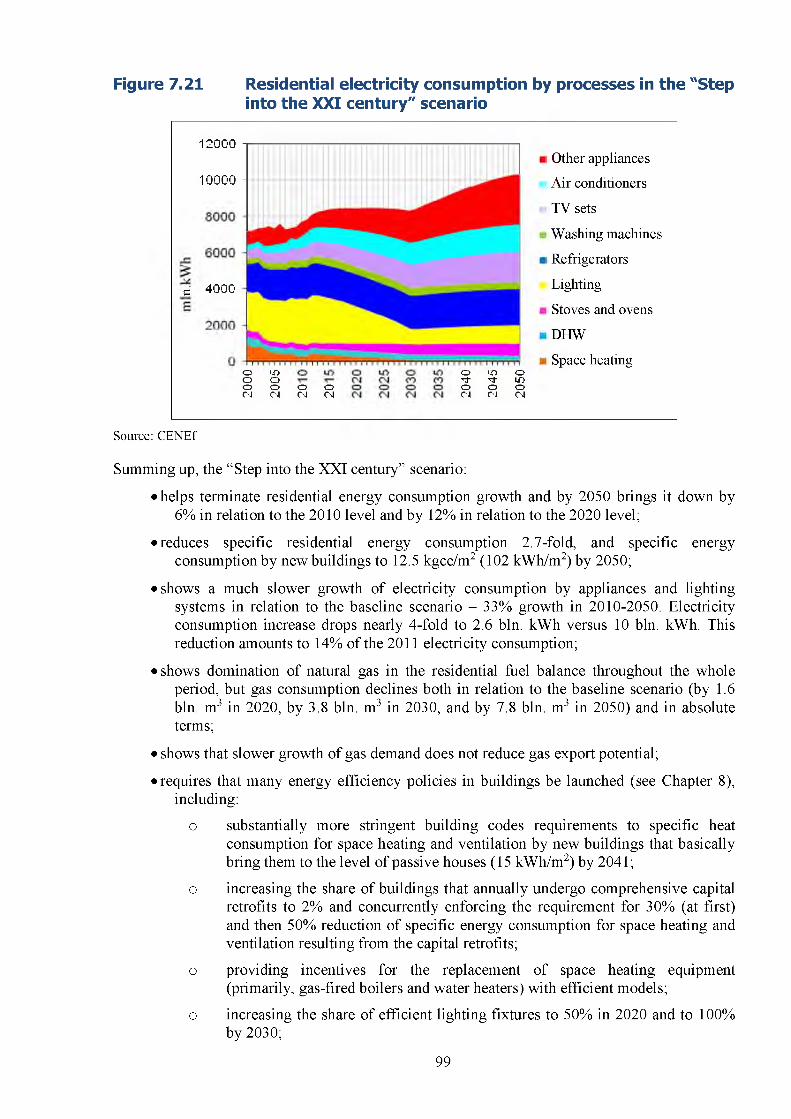
Figure 7.21 Residential electricity consumption by processes in the "Stepinto the XXI century" scenario
12000
10000 -
d 4000
о ю о оО О О СЧ OJ СЧ
осмо ю о т|- т|- юО О Осч сч OJ
i Other appliances
Air conditioners
TV sets
Washing machines
i Refrigerators
Lighting
Stoves and ovens
DHW
Space heating
Source: CENEf
Summing up, the “Step into the XXI century” scenario:
• helps terminate residential energy consumption growth and by 2050 brings it down by6% in relation to the 2010 level and by 12% in relation to the 2020 level;
• reduces specific residential energy consumption 2.7-fold, and specific energyconsumption by new buildings to 12.5 kgce/m2 (102 kWh/m2) by 2050;
• shows a much slower growth of electricity consumption by appliances and lightingsystems in relation to the baseline scenario - 33% growth in 2010-2050. Electricity consumption increase drops nearly 4-fold to 2.6 bln. kWh versus 10 bln. kWh. This reduction amounts to 14% of the 2011 electricity consumption;
• shows domination of natural gas in the residential fuel balance throughout the wholeperiod, but gas consumption declines both in relation to the baseline scenario (by 1.6 bln. m3 in 2020, by 3.8 bln. m3 in 2030, and by 7.8 bln. m3 in 2050) and in absolute terms;
• shows that slower growth of gas demand does not reduce gas export potential;
• requires that many energy efficiency policies in buildings be launched (see Chapter 8),including:
о substantially more stringent building codes requirements to specific heat consumption for space heating and ventilation by new buildings that basically bring them to the level of passive houses (15 kWh/m2) by 2041;
о increasing the share of buildings that annually undergo comprehensive capital retrofits to 2% and concurrently enforcing the requirement for 30% (at first) and then 50% reduction of specific energy consumption for space heating and ventilation resulting from the capital retrofits;
о providing incentives for the replacement of space heating equipment (primarily, gas-fired boilers and water heaters) with efficient models;
о increasing the share of efficient lighting fixtures to 50% in 2020 and to 100% by 2030;
99
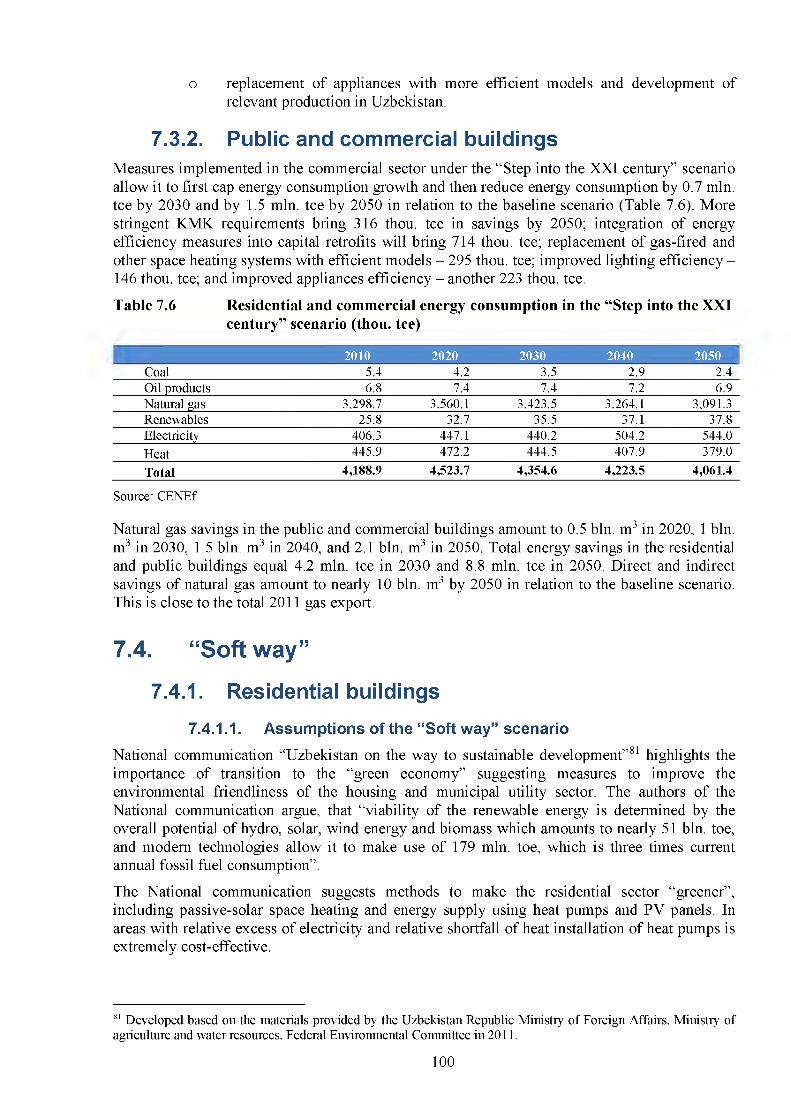
о replacement of appliances with more efficient models and development of relevant production in Uzbekistan.
7.3.2. Public and commercial buildingsMeasures implemented in the commercial sector under the “Step into the XXI century” scenario allow it to first cap energy consumption growth and then reduce energy consumption by 0.7 mln. tee by 2030 and by 1.5 mln. tee by 2050 in relation to the baseline scenario (Table 7.6). More stringent KMK requirements bring 316 thou, tee in savings by 2050; integration of energy efficiency measures into capital retrofits will bring 714 thou, tee; replacement of gas-fired and other space heating systems with efficient models - 295 thou, tee; improved lighting efficiency - 146 thou, tee; and improved appliances efficiency - another 223 thou. tee.
Table 7.6 Residential and commercial energy consumption in the “Step into the XXIcentury” scenario (thou, tee)
2010 2020 2030 2040 2050 |Coal 5.4 4.2 3.5 2.9 2.4Oil products 6.8 7.4 7.4 7.2 6.9Natural gas 3,298.7 3,560.1 3,423.5 3,264.1 3,091.3Renewables 25.8 32.7 35.5 37.1 37.8Electricity 406.3 447.1 440.2 504.2 544.0Heat 445.9 472.2 444.5 407.9 379.0
Total 4,188.9 4,523.7 4,354.6 4,223.5 4,061.4
Source: CENEf
Natural gas savings in the public and commercial buildings amount to 0.5 bln. m3 in 2020, 1 bln. m3 in 2030, 1.5 bln. m3 in 2040, and 2.1 bln. m3 in 2050. Total energy savings in the residential and public buildings equal 4.2 mln. tee in 2030 and 8.8 mln. tee in 2050. Direct and indirect savings of natural gas amount to nearly 10 bln. m3 by 2050 in relation to the baseline scenario. This is close to the total 2011 gas export.
7.4. “Soft way”7.4.1. Residential buildings
7.4.1.1. Assumptions of the “Soft way” scenarioNational communication “Uzbekistan on the way to sustainable development”81 highlights the importance of transition to the “green economy” suggesting measures to improve the environmental friendliness of the housing and municipal utility sector. The authors of the National communication argue, that “viability of the renewable energy is determined by the overall potential of hydro, solar, wind energy and biomass which amounts to nearly 51 bln. toe, and modem technologies allow it to make use of 179 mln. toe, which is three times current annual fossil fuel consumption”.
The National communication suggests methods to make the residential sector “greener”, including passive-solar space heating and energy supply using heat pumps and PV panels. In areas with relative excess of electricity and relative shortfall of heat installation of heat pumps is extremely cost-effective.
81 Developed based on the materials provided by the Uzbekistan Republic Ministry o f Foreign Affairs, Ministry of agriculture and water resources. Federal Environmental Committee in 2011.
100
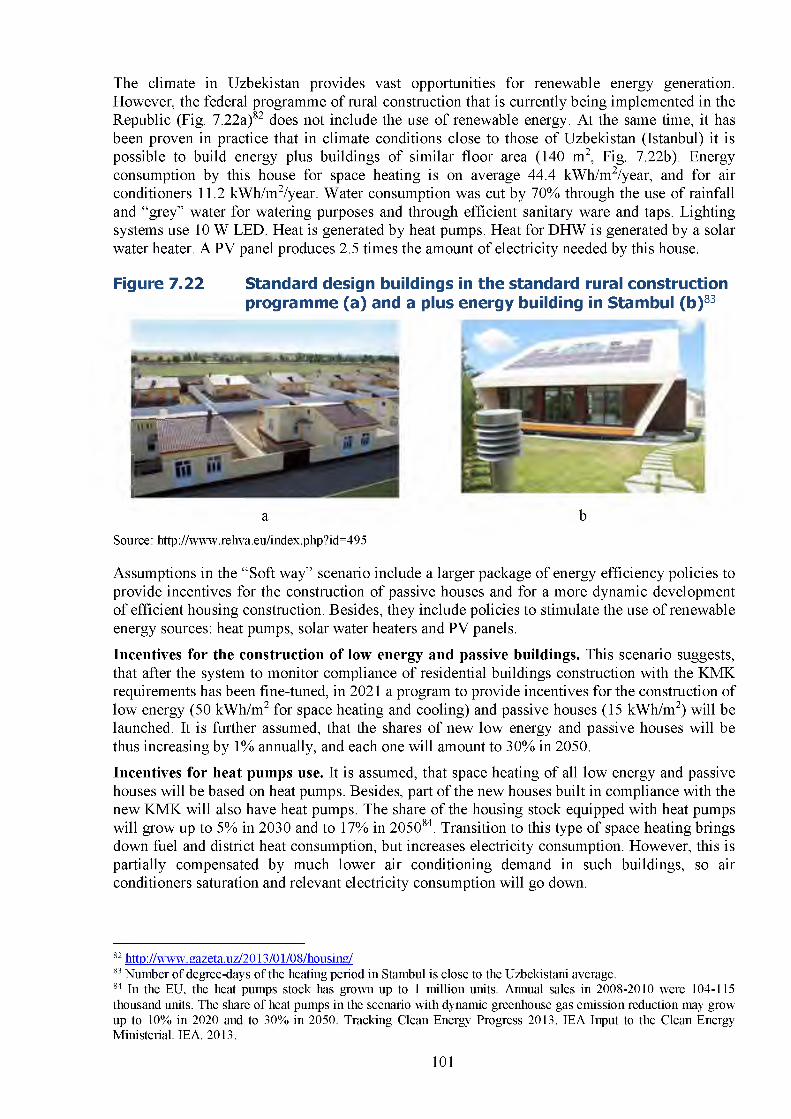
The climate in Uzbekistan provides vast opportunities for renewable energy generation. However, the federal programme of rural construction that is currently being implemented in the Republic (Fig. 7.22a)82 does not include the use of renewable energy. At the same time, it has been proven in practice that in climate conditions close to those of Uzbekistan (Istanbul) it is possible to build energy plus buildings of similar floor area (140 m2, Fig. 7.22b). Energy consumption by this house for space heating is on average 44.4 kWh/m2/year, and for air conditioners 11.2 kWh/m2/year. Water consumption was cut by 70% through the use of rainfall and “grey” water for watering purposes and through efficient sanitary ware and taps. Lighting systems use 10 W LED. Heat is generated by heat pumps. Heat for DHW is generated by a solar water heater. A PV panel produces 2.5 times the amount of electricity needed by this house.
Figure 7.22 Standard design buildings in the standard rural construction programme (a) and a plus energy building in Stambul (b)83
a bSource: http://www.rehva.eu/index.php?id=495
Assumptions in the “Soft way” scenario include a larger package of energy efficiency policies to provide incentives for the construction of passive houses and for a more dynamic development of efficient housing construction. Besides, they include policies to stimulate the use of renewable energy sources: heat pumps, solar water heaters and PV panels.
Incentives for the construction of low energy and passive buildings. This scenario suggests, that after the system to monitor compliance of residential buildings construction with the KMK requirements has been fine-tuned, in 2021 a program to provide incentives for the construction of low energy (50 kWh/m2 for space heating and cooling) and passive houses (15 kWh/m2) will be launched. It is further assumed, that the shares of new low energy and passive houses will be thus increasing by 1% annually, and each one will amount to 30% in 2050.
Incentives for heat pumps use. It is assumed, that space heating of all low energy and passive houses will be based on heat pumps. Besides, part of the new houses built in compliance with the new KMK will also have heat pumps. The share of the housing stock equipped with heat pumps will grow up to 5% in 2030 and to 17% in 205084. Transition to this type of space heating brings down fuel and district heat consumption, but increases electricity consumption. However, this is partially compensated by much lower air conditioning demand in such buildings, so air conditioners saturation and relevant electricity consumption will go down.
82 http://www. gazeta.uz/2013/01/08/housing/83 Number of degree-days of the heating period in Stambul is close to the Uzbekistani average.84 In the EU, the heat pumps stock lias grown up to 1 million units. Annual sales in 2008-2010 were 104-115 thousand units. The share of heat pumps in the scenario with dynamic greenhouse gas emission reduction may grow up to 10% in 2020 and to 30% in 2050. Tracking Clean Energy Progress 2013. IEA Input to the Clean Energy Ministerial. IEA. 2013.
101
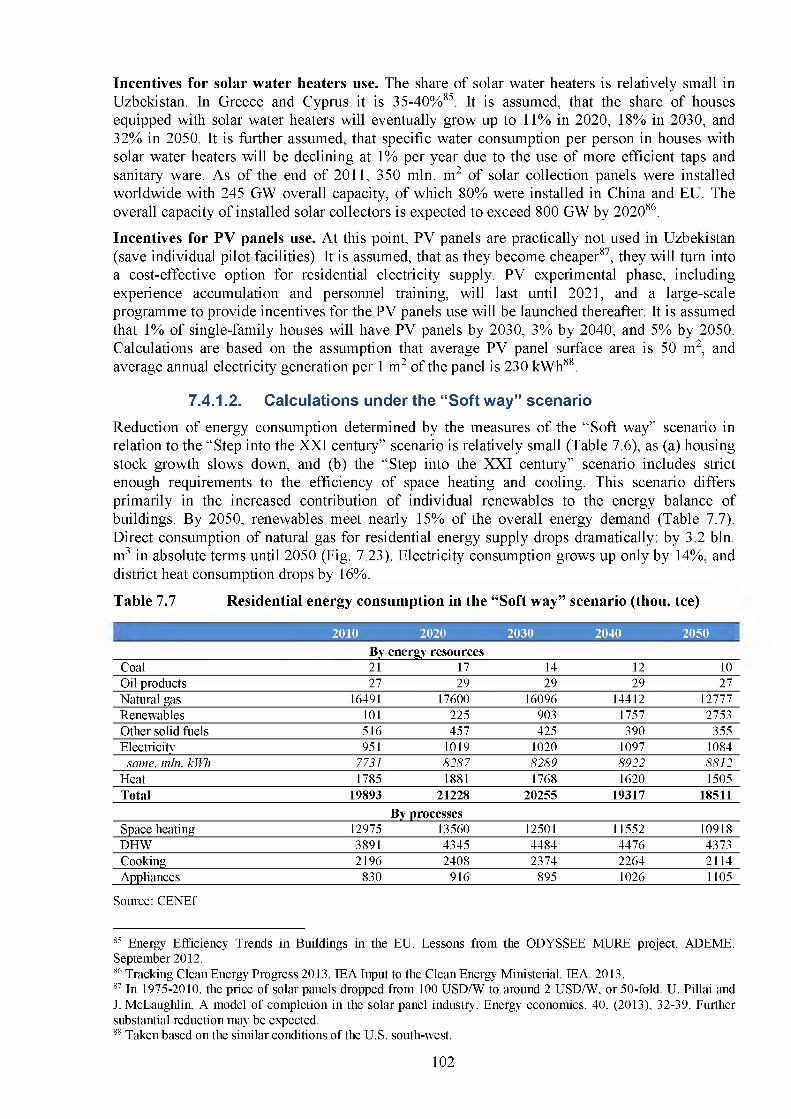
Incentives for solar water heaters use. The share of solar water heaters is relatively small in Uzbekistan. In Greece and Cyprus it is 35-40%85. It is assumed, that the share of houses equipped with solar water heaters will eventually grow up to 11% in 2020, 18% in 2030, and 32% in 2050. It is further assumed, that specific water consumption per person in houses with solar water heaters will be declining at 1% per year due to the use of more efficient taps and sanitary ware. As of the end of 2011, 350 mln. m2 of solar collection panels were installed worldwide with 245 GW overall capacity, of which 80% were installed in China and EU. The overall capacity of installed solar collectors is expected to exceed 800 GW by 202086.
Incentives for PV panels use. At this point, PV panels are practically not used in Uzbekistan (save individual pilot facilities). It is assumed, that as they become cheaper87, they will turn into a cost-effective option for residential electricity supply. PV experimental phase, including experience accumulation and personnel training, will last until 2021, and a large-scale programme to provide incentives for the PV panels use will be launched thereafter. It is assumed that 1% of single-family houses will have PV panels by 2030, 3% by 2040, and 5% by 2050. Calculations are based on the assumption that average PV panel surface area is 50 m2, and average annual electricity generation per 1 m2 of the panel is 230 kWh88.
7.4.1.2. Calculations under the “Soft way” scenarioReduction of energy consumption determined by the measures of the “Soft way” scenario in relation to the “Step into the XXI century” scenario is relatively small (Table 7.6), as (a) housing stock growth slows down, and (b) the “Step into the XXI century” scenario includes strict enough requirements to the efficiency of space heating and cooling. This scenario differs primarily in the increased contribution of individual renewables to the energy balance of buildings. By 2050, renewables meet nearly 15% of the overall energy demand (Table 7.7). Direct consumption of natural gas for residential energy supply drops dramatically: by 3.2 bln. m3 in absolute terms until 2050 (Fig. 7.23). Electricity consumption grows up only by 14%, and district heat consumption drops by 16%.
Table 7.7 Residential energy consumption in the “Soft way” scenario (thou, tee)
2010 2020 2030 2040 2050 IBy energy resources
Coal 21 17 14 12 10Oil products 27 29 29 29 27Natural gas 16491 17600 16096 14412 12777Renewables 101 225 903 1757 2753Other solid fuels 516 457 425 390 355Electricity 951 1019 1020 1097 1084
same, mln. kWh 7731 8287 8289 8922 8812Heat 1785 1881 1768 1620 1505Total 19893 21228 20255 19317 18511
By processesSpace heating 12975 13560 12501 11552 10918DHW 3891 4345 4484 4476 4373Cooking 2196 2408 2374 2264 2114Appliances 830 916 895 1026 1105
Source: CENEf
85 Energy Efficiency Trends in Buildings in the EU. Lessons from the ODYSSEE MURE project. ADEME. September 2012.86 Tracking Clean Energy Progress 2013. IEA Input to the Clean Energy Ministerial. IEA. 2013.87 In 1975-2010, the price of solar panels dropped from 100 USD/W to around 2 USDAV, or 50-fold. U. Pillai and J. McLaughlin. A model o f completion in the solar panel industry. Energy economics. 40, (2013), 32-39. Further substantial reduction may be expected.88 Taken based on the similar conditions of the U.S. south-west.
102
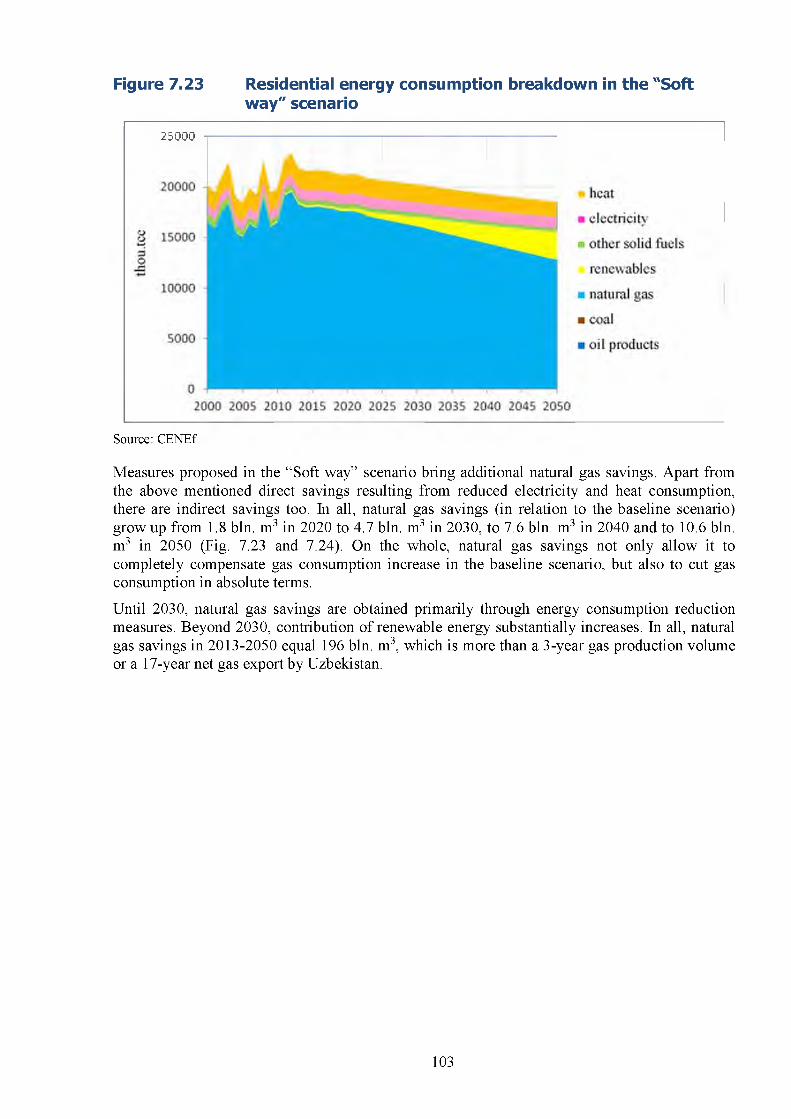
Figure 7.23 Residential energy consumption breakdown in the "Softway" scenario
25000
Source: CENEf
Measures proposed in the “Soft way” scenario bring additional natural gas savings. Apart from the above mentioned direct savings resulting from reduced electricity and heat consumption, there are indirect savings too. In all, natural gas savings (in relation to the baseline scenario) grow up from 1.8 bln. m3 in 2020 to 4.7 bln. m3 in 2030, to 7.6 bln. m3 in 2040 and to 10.6 bln. m3 in 2050 (Fig. 7.23 and 7.24). On the whole, natural gas savings not only allow it to completely compensate gas consumption increase in the baseline scenario, but also to cut gas consumption in absolute terms.
Until 2030, natural gas savings are obtained primarily through energy consumption reduction measures. Beyond 2030, contribution of renewable energy substantially increases. In all, natural gas savings in 2013-2050 equal 196 bln. m3, which is more than a 3-year gas production volume or a 17-year net gas export by Uzbekistan.
103
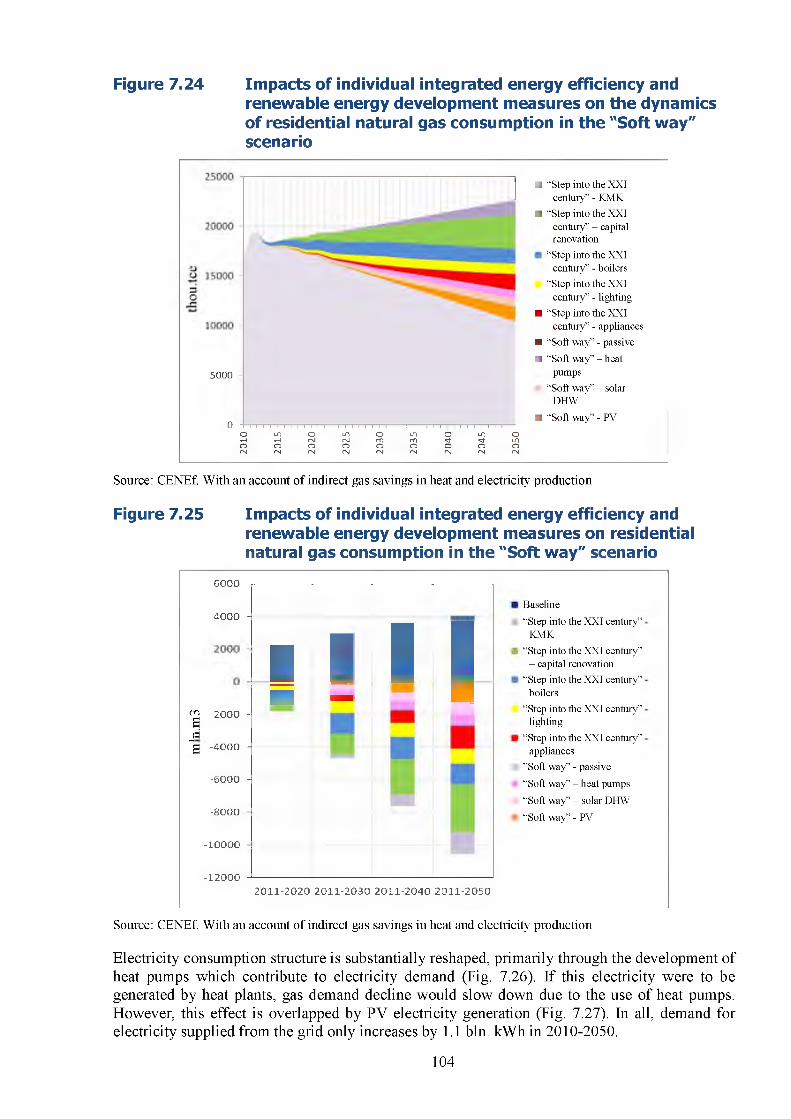
Figure 7.24 Impacts of individual integrated energy efficiency and renewable energy development measures on the dynamics of residential natural gas consumption in the "Soft way" scenario
5000
0 -.....T T Г “ Г Т T T 1 1 Г T Г “ Г Т T I Г Г T Г Г “ Г Т 1 7 T 1 7 r - • Г T r - T I T Г 1O lO O lO O lO O iO O^ H r H r M r s l f ' O r O ^ ^ L O O O O O O O O O O n l J N r M r M C s l r N r J l N r M
■ “Step into the XXIcentury” - KMK
■ “Step into the XXIcentury” - capital renovation
“Step into the XXI century” - boilers
“Step into the XXI century” - lighting
■ “Step into the XXIcentury” - appliances
■ “Soft way” - passive
■ “Soft way” - heatpumps
“Soft way” - solar DHW ’
■ “Soft way” - PV
Source: CENEf. With an account of indirect gas savings in heat and electricity production
Figure 7.25 Impacts of individual integrated energy efficiency and renewable energy development measures on residential natural gas consumption in the "Soft way" scenario
6000 -|---------------------------------------------------------------------
4000 -
i | I |-4000 -
^ -2000 -
jdg -4000 H
-6000 -
-8000
-10000
-12000
Baseline
“Step into the XXI century” KMK
“Step into the XXI century” - capital renovation
“Step into the XXI century” boilers
“Step into the XXI century” lighting
“Step into the XXI century” appliances
’’Soft way” - passive
“Soft way” - heat pumps
“Soft way” - solar DHW
“Soft way” - PV
2011-2020 2011-2030 2011-2040 2011-2050
Source: CENEf. With an account of indirect gas savings in heat and electricity production
Electricity consumption structure is substantially reshaped, primarily through the development of heat pumps which contribute to electricity demand (Fig. 7.26). If this electricity were to be generated by heat plants, gas demand decline would slow down due to the use of heat pumps. However, this effect is overlapped by PV electricity generation (Fig. 7.27). In all, demand for electricity supplied from the grid only increases by 1.1 bln. kWh in 2010-2050.
104
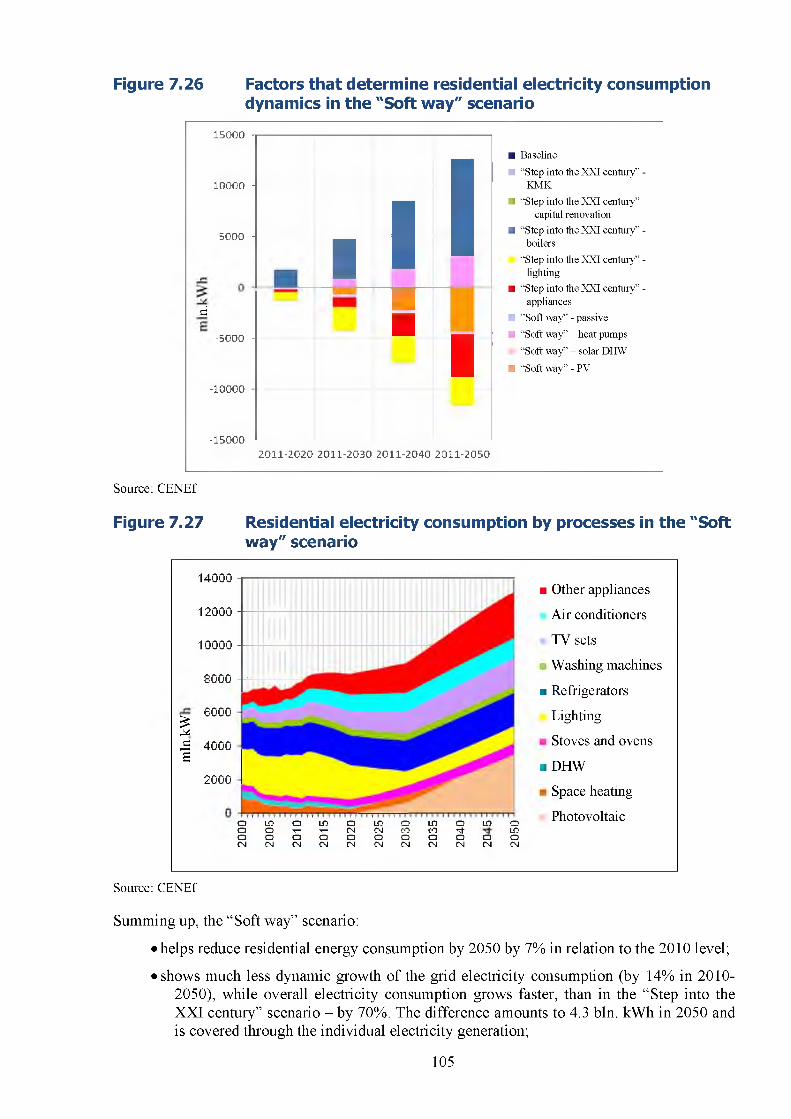
Figure 7.26 Factors that determine residential electricity consumptiondynamics in the "Soft way" scenario
15000
10000 -
5000
ri
-5000
-10000
-15000
I-
1l l 1
-
1■1
2011-2020 2011-2030 2011-2040 2011-2050
■ Baseline
■ “Step into the XXI century” -KMK
■ “Step into the XXI century”- capital renovation
■ “Step into the XXI century” -boilers
“Step into the XXI century” - lighting
■ “Step into the XXI century” -appliances
■ ’’Soft way” - passive
■ “Soft way” - heat pumps
“Soft way” - solar DHW
■ “Soft way” - PV
Source: CENEf
Figure 7.27 Residential electricity consumption by processes in the "Soft way" scenario
■ Other appliances
Air conditioners
TV sets
Washing machines
■ Refrigerators
Lighting
Stoves and ovens
■ DHW
Space heating
Photovoltaic
14000
12000
10000
8000
6000I.5 4000 S
2000
о L O о ю о LO о L O о L O оо о т— т— сч сч со со t̂ LO
о о о о о о о о о о осч сч сч сч сч сч сч сч сч сч сч
Source: CENEf
Summing up, the “Soft way” scenario:
• helps reduce residential energy consumption by 2050 by 7% in relation to the 2010 level;
• shows much less dynamic growth of the grid electricity consumption (by 14% in 2010-2050), while overall electricity consumption grows faster, than in the “Step into the XXI century” scenario - by 70%. The difference amounts to 4.3 bln. kWh in 2050 and is covered through the individual electricity generation;
105
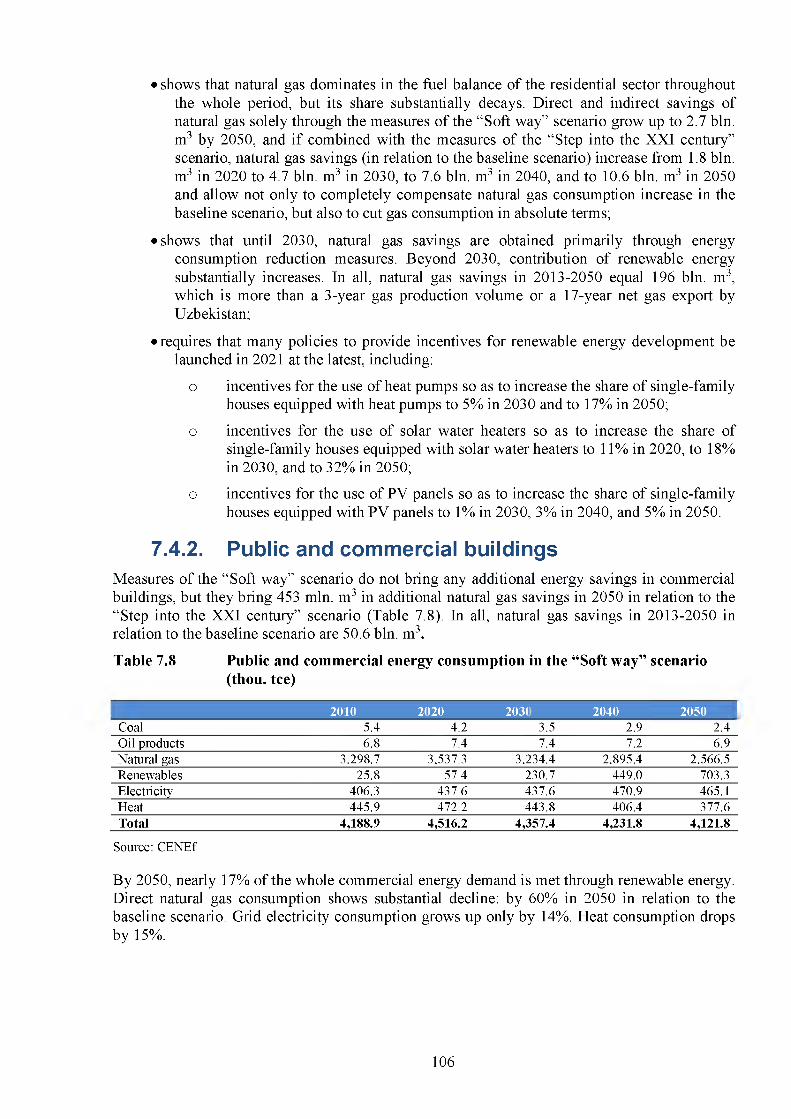
• shows that natural gas dominates in the fuel balance of the residential sector throughoutthe whole period, but its share substantially decays. Direct and indirect savings of natural gas solely through the measures of the “Soft way” scenario grow up to 2.7 bln. m3 by 2050, and if combined with the measures of the “Step into the XXI century” scenario, natural gas savings (in relation to the baseline scenario) increase from 1.8 bln. m3 in 2020 to 4.7 bln. m3 in 2030, to 7.6 bln. m3 in 2040, and to 10.6 bln. m3 in 2050 and allow not only to completely compensate natural gas consumption increase in the baseline scenario, but also to cut gas consumption in absolute terms;
• shows that until 2030, natural gas savings are obtained primarily through energyconsumption reduction measures. Beyond 2030, contribution of renewable energy substantially increases. In all, natural gas savings in 2013-2050 equal 196 bln. m3, which is more than a 3-year gas production volume or a 17-year net gas export by Uzbekistan;
• requires that many policies to provide incentives for renewable energy development belaunched in 2021 at the latest, including:
о incentives for the use of heat pumps so as to increase the share of single-family houses equipped with heat pumps to 5% in 2030 and to 17% in 2050;
о incentives for the use of solar water heaters so as to increase the share of single-family houses equipped with solar water heaters to 11% in 2020, to 18% in 2030, and to 32% in 2050;
о incentives for the use of PV panels so as to increase the share of single-family houses equipped with PV panels to 1% in 2030, 3% in 2040, and 5% in 2050.
7.4.2. Public and commercial buildingsMeasures of the “Soft way” scenario do not bring any additional energy savings in commercial buildings, but they bring 453 mln. m3 in additional natural gas savings in 2050 in relation to the “Step into the XXI century” scenario (Table 7.8). In all, natural gas savings in 2013-2050 in relation to the baseline scenario are 50.6 bln. m3.
Table 7.8 Public and commercial energy consumption in the “Soft way” scenario(thou, tee)
2010 2020 2030 2040 2050 |
Coal 5.4 4.2 3.5 2.9 2.4Oil products 6.8 7.4 7.4 7.2 6.9Natural gas 3,298.7 3,537.3 3,234.4 2,895.4 2,566.5Renewables 25.8 57.4 230.7 449.0 703.3Electricity 406.3 437.6 437.6 470.9 465.1Heat 445.9 472.2 443.8 406.4 377.6T o ta l 4 ,1 8 8 .9 4 ,5 1 6 .2 4 ,3 5 7 .4 4 ,2 3 1 .8 4 ,1 2 1 .8
Source: CENEf
By 2050, nearly 17% of the whole commercial energy demand is met through renewable energy. Direct natural gas consumption shows substantial decline: by 60% in 2050 in relation to the baseline scenario. Grid electricity consumption grows up only by 14%. Heat consumption drops by 15%.
106
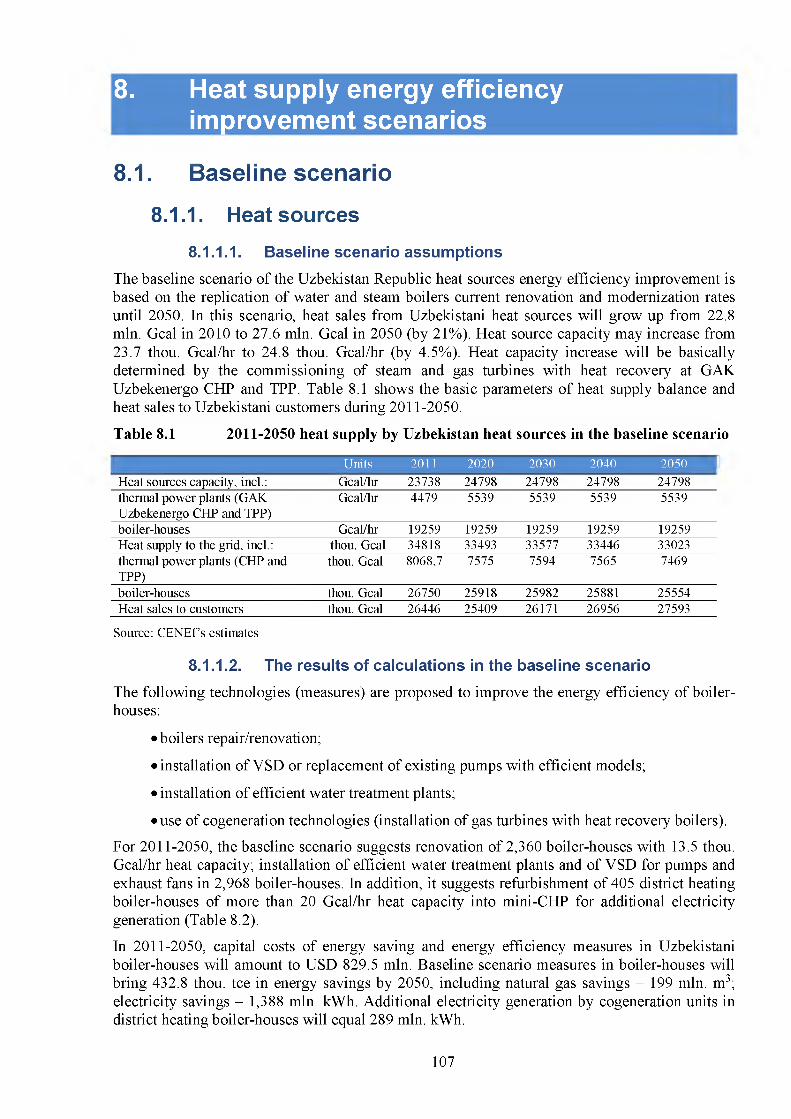
8. Heat supply energy efficiency improvement scenarios
8.1. Baseline scenario8.1.1. Heat sources
8.1.1.1. Baseline scenario assumptionsThe baseline scenario of the Uzbekistan Republic heat sources energy efficiency improvement is based on the replication of water and steam boilers current renovation and modernization rates until 2050. In this scenario, heat sales from Uzbekistani heat sources will grow up from 22.8 mln. Gcal in 2010 to 27.6 mln. Gcal in 2050 (by 21%). Heat source capacity may increase from 23.7 thou. Gcal/hr to 24.8 thou. Gcal/hr (by 4.5%). Heat capacity increase will be basically determined by the commissioning of steam and gas turbines with heat recovery at GAK Uzbekenergo CHP and TPP. Table 8.1 shows the basic parameters of heat supply balance and heat sales to Uzbekistani customers during 2011-2050.
Table 8.1 2011-2050 heat supply by Uzbekistan heat sources in the baseline scenario
Units 2011 2020 2030 2040 2050 IHeat sources capacity, incl.: Gcal/hr 23738 24798 24798 24798 24798thermal power plants (GAK Uzbekenergo CHP and TPP)
Gcal/hr 4479 5539 5539 5539 5539
boiler-houses Gcal/hr 19259 19259 19259 19259 19259Heat supply to the grid, incl.: thou. Gcal 34818 33493 33577 33446 33023thermal power plants (CHP and TPP)
thou. Gcal 8068,7 7575 7594 7565 7469
boiler-houses thou. Gcal 26750 25918 25982 25881 25554Heat sales to customers thou. Gcal 26446 25409 26171 26956 27593
Source: CENEf s estimates
8.1.1.2. The results of calculations in the baseline scenarioThe following technologies (measures) are proposed to improve the energy efficiency of boiler- houses:
• boilers repair/renovation;
• installation of VSD or replacement of existing pumps with efficient models;
• installation of efficient water treatment plants;
• use of cogeneration technologies (installation of gas turbines with heat recovery boilers).
For 2011-2050, the baseline scenario suggests renovation of 2,360 boiler-houses with 13.5 thou. Gcal/hr heat capacity; installation of efficient water treatment plants and of VSD for pumps and exhaust fans in 2,968 boiler-houses. In addition, it suggests refurbishment of 405 district heating boiler-houses of more than 20 Gcal/hr heat capacity into mini-CHP for additional electricity generation (Table 8.2).
In 2011-2050, capital costs of energy saving and energy efficiency measures in Uzbekistani boiler-houses will amount to USD 829.5 mln. Baseline scenario measures in boiler-houses will bring 432.8 thou, tee in energy savings by 2050, including natural gas savings - 199 mln. m3; electricity savings - 1,388 mln. kWh. Additional electricity generation by cogeneration units in district heating boiler-houses will equal 289 mln. kWh.
107
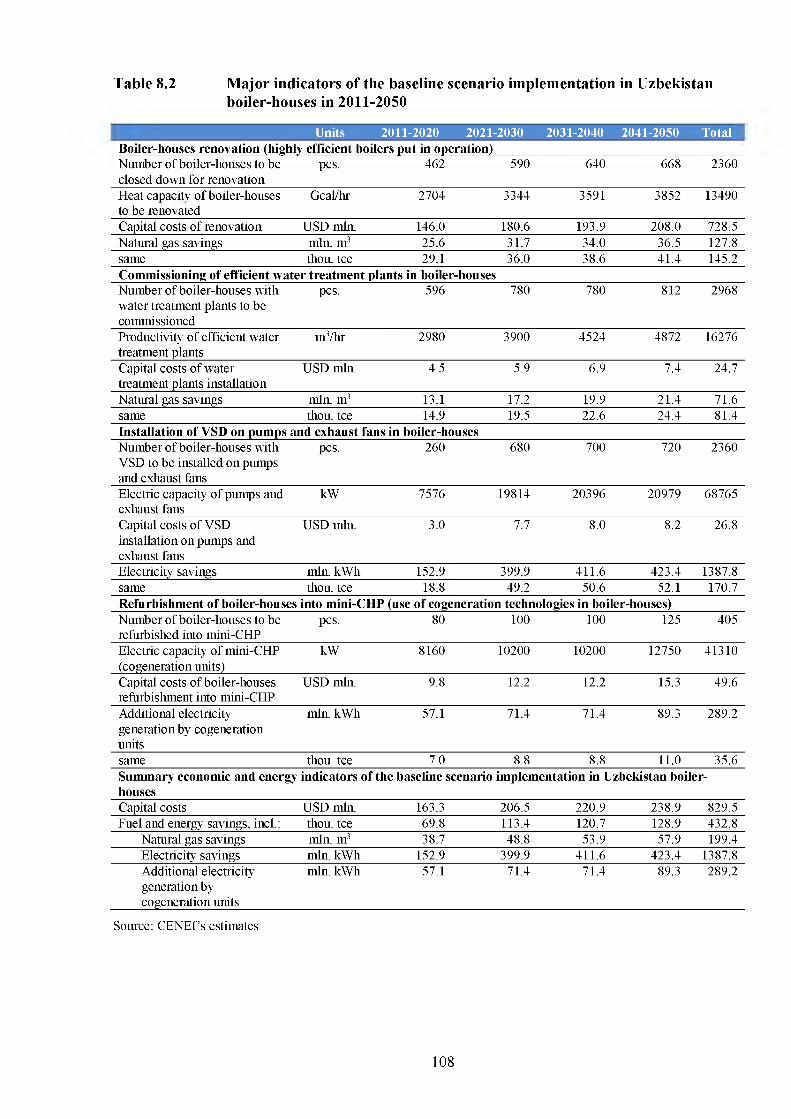
Table 8.2 Major indicators of the baseline scenario implementation in Uzbekistanboiler-houses in 2011-2050
Units 2011-2020 2021-2030 2031-2040 2041-2050 Total IBoiler-houses renovation (highly efficient boilers put in operation)Number of boiler-houses to be pcs. 462 590 640 668 2360closed down for renovationHeat capacity of boiler-houses Gcal/hr 2704 3344 3591 3852 13490to be renovatedCapital costs of renovation USD mln. 146.0 180.6 193.9 208.0 728.5Natural gas savings mln. m3 25.6 31.7 34.0 36.5 127.8same thou, tee 29.1 36.0 38.6 41.4 145.2Commissioning of efficient water treatment plants in boiler-housesNumber of boiler-houses with pcs. 596 780 780 812 2968water treatment plants to becommissionedProductivity of efficient water m3/hr 2980 3900 4524 4872 16276treatment plantsCapital costs of water USD mln. 4.5 5.9 6.9 7.4 24.7treatment plants installationNatural gas savings mln. m3 13.1 17.2 19.9 21.4 71.6same thou, tee 14.9 19.5 22.6 24.4 81.4Installation of VSD on pumps and exhaust fans in boiler-housesNumber of boiler-houses with pcs. 260 680 700 720 2360VSD to be installed on pumpsand exhaust fansElectric capacity of pumps and kW 7576 19814 20396 20979 68765exhaust fansCapital costs of VSD USD mln. 3.0 7.7 8.0 8.2 26.8installation on pumps andexhaust fansElectricity savings mln. kWh 152.9 399.9 411.6 423.4 1387.8same thou, tee 18.8 49.2 50.6 52.1 170.7Refurbishment of boiler-houses into mini-CHP (use of cogeneration technologies in boiler-houses)Number of boiler-houses to be pcs. 80 100 100 125 405refurbished into mini-CHPElectric capacity of mini-CHP kW 8160 10200 10200 12750 41310(cogeneration units)Capital costs of boiler-houses USD mln. 9.8 12.2 12.2 15.3 49.6refurbishment into mini-CHPAdditional electricity mln. kWh 57.1 71.4 71.4 89.3 289.2generation by cogenerationunitssame thou, tee 7.0 8.8 8.8 11.0 35.6Summary economic and energy indicators of the baseline scenario implementation in Uzbekistan boiler-housesCapital costs USD mln. 163.3 206.5 220.9 238.9 829.5Fuel and energy savings, incl.: thou, tee 69.8 113.4 120.7 128.9 432.8
Natural gas savings mln. m3 38.7 48.8 53.9 57.9 199.4Electricity savings mln. kWh 152.9 399.9 411.6 423.4 1387.8Additional electricity mln. kWh 57.1 71.4 71.4 89.3 289.2generation bycogeneration units
Source: CENEfs estimates
108
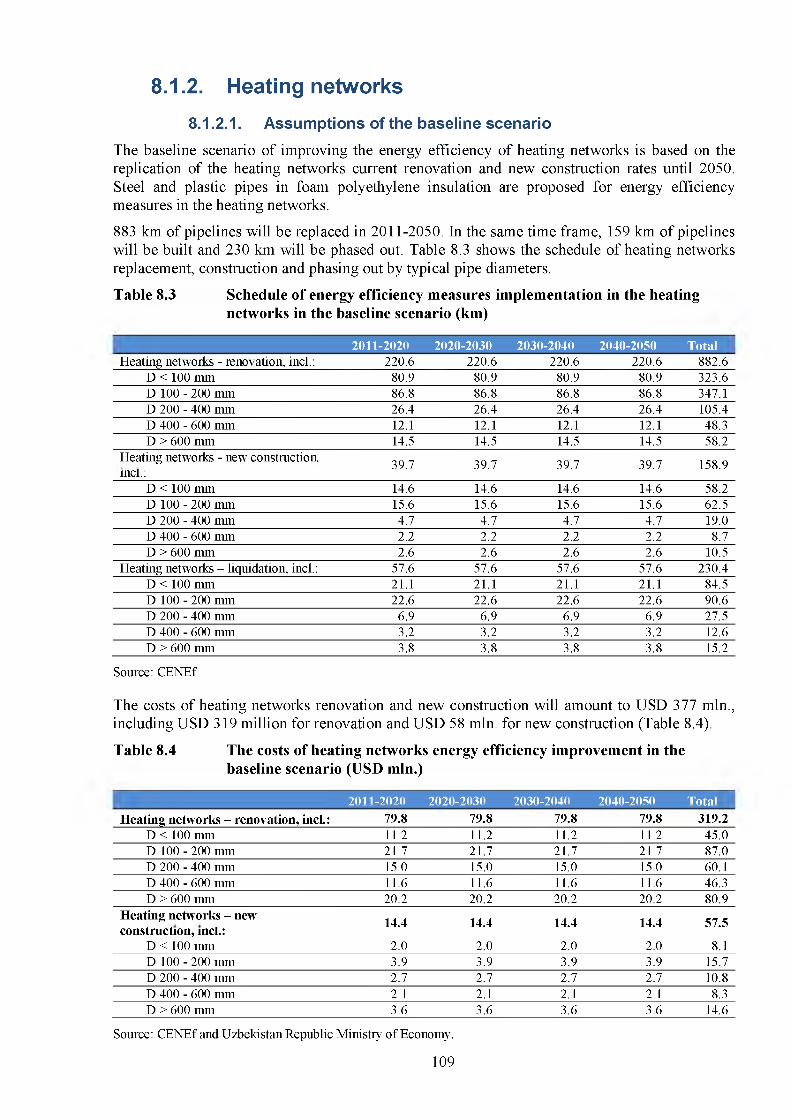
8.1.2. Heating networks8.1.2.1. Assumptions of the baseline scenario
The baseline scenario of improving the energy efficiency of heating networks is based on the replication of the heating networks current renovation and new construction rates until 2050. Steel and plastic pipes in foam polyethylene insulation are proposed for energy efficiency measures in the heating networks.
883 km of pipelines will be replaced in 2011-2050. In the same time frame, 159 km of pipelines will be built and 230 km will be phased out. Table 8.3 shows the schedule of heating networks replacement, construction and phasing out by typical pipe diameters.
Table 8.3 Schedule of energy efficiency measures implementation in the heatingnetworks in the baseline scenario (km)
2011-2020 2020-2030 2030-2040 2040-2050 TotalHeating networks - renovation, incl.: 220.6 220.6 220.6 220.6 882.6
D < 100 mm 80.9 80.9 80.9 80.9 323.6D 100 - 200 mm 86.8 86.8 86.8 86.8 347.1D 200 - 400 mm 26.4 26.4 26.4 26.4 105.4D 400 - 600 mm 12.1 12.1 12.1 12.1 48.3D > 600 mm 14.5 14.5 14.5 14.5 58.2
Heating networks - new construction. 39.7 39.7 39.7 39.7 158.9incl.:
D < 100 mm 14.6 14.6 14.6 14.6 58.2D 100 - 200 mm 15.6 15.6 15.6 15.6 62.5D 200 - 400 mm 4.7 4.7 4.7 4.7 19.0D 400 - 600 mm 2.2 2.2 2.2 2.2 8.7D > 600 mm 2.6 2.6 2.6 2.6 10.5
Heating networks - liquidation, incl.: 57.6 57.6 57.6 57.6 230.4D < 100 mm 21.1 21.1 21.1 21.1 84.5D 100 - 200 mm 22.6 22.6 22.6 22.6 90.6D 200 - 400 mm 6.9 6.9 6.9 6.9 27.5D 400 - 600 mm 3.2 3.2 3.2 3.2 12.6D > 600 mm 3.8 3.8 3.8 3.8 15.2
Source: CENEf
The costs of heating networks renovation and new construction will amount to USD 377 mln.,including USD 319 million for renovation and USD 58 mln. for new construction (Table 8.4).
Table 8.4 The costs of heating networks energy efficiency improvement in the baseline scenario (USD mln.)
2011-2020 2020-2030 2030-2040 2040-2050 TotalHeating networks - renovation, incl.: 79.8 79.8 79.8 79.8 319.2
D < 100 mm 11.2 11.2 11.2 11.2 45.0D 100 - 200 mm 21.7 21.7 21.7 21.7 87.0D 200 - 400 mm 15.0 15.0 15.0 15.0 60.1D 400 - 600 mm 11.6 11.6 11.6 11.6 46.3D > 600 mm 20.2 20.2 20.2 20.2 80.9
Heating networks - new 14.4 14.4 14.4 14.4 57.5construction, incl.:D < 100 mm 2.0 2.0 2.0 2.0 8.1D 100 - 200 mm 3.9 3.9 3.9 3.9 15.7D 200 - 400 mm 2.7 2.7 2.7 2.7 10.8D 400 - 600 mm 2.1 2.1 2.1 2.1 8.3D > 600 mm 3.6 3.6 3.6 3.6 14.6
Source: CENEf and Uzbekistan Republic Ministry o f Economy.
109
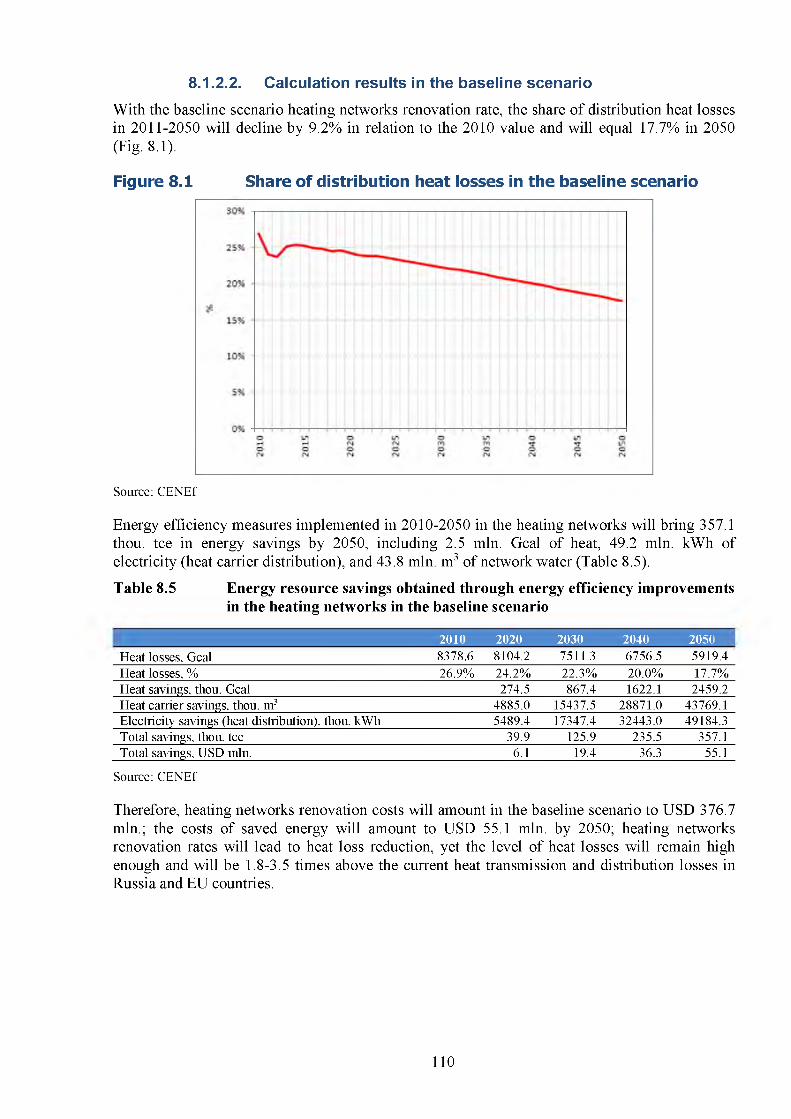
With the baseline scenario heating networks renovation rate, the share of distribution heat losses in 2011-2050 will decline by 9.2% in relation to the 2010 value and will equal 17.7% in 2050 (Fig. 8.1).
Figure 8.1 Share of distribution heat losses in the baseline scenario
8.1.2.2. Ca lcu lation resu lts in the baseline scenario
Source: CENEf
Energy efficiency measures implemented in 2010-2050 in the heating networks will bring 357.1 thou, tee in energy savings by 2050, including 2.5 mln. Gcal of heat, 49.2 mln. kWh of electricity (heat carrier distribution), and 43.8 mln. m3 of network water (Table 8.5).
Table 8.5 Energy resource savings obtained through energy efficiency improvementsin the heating networks in the baseline scenario
2010 2020 2030 2040 2050 I
Heat losses, Gcal 8378.6 8104.2 7511.3 6756.5 5919.4Heat losses, % 26.9% 24.2% 22.3% 20.0% 17.7%Heat savings, thou. Gcal 274.5 867.4 1622.1 2459.2Heat carrier savings, thou, m3 4885.0 15437.5 28871.0 43769.1Electricity savings (heat distribution), thou. kWh 5489.4 17347.4 32443.0 49184.3Total savings, thou, tee 39.9 125.9 235.5 357.1Total savings, U S D mln. 6.1 19.4 36.3 55.1
Source: CENEf
Therefore, heating networks renovation costs will amount in the baseline scenario to USD 376.7 mln.; the costs of saved energy will amount to USD 55.1 mln. by 2050; heating networks renovation rates will lead to heat loss reduction, yet the level of heat losses will remain high enough and will be 1.8-3.5 times above the current heat transmission and distribution losses in Russia and EU countries.
110
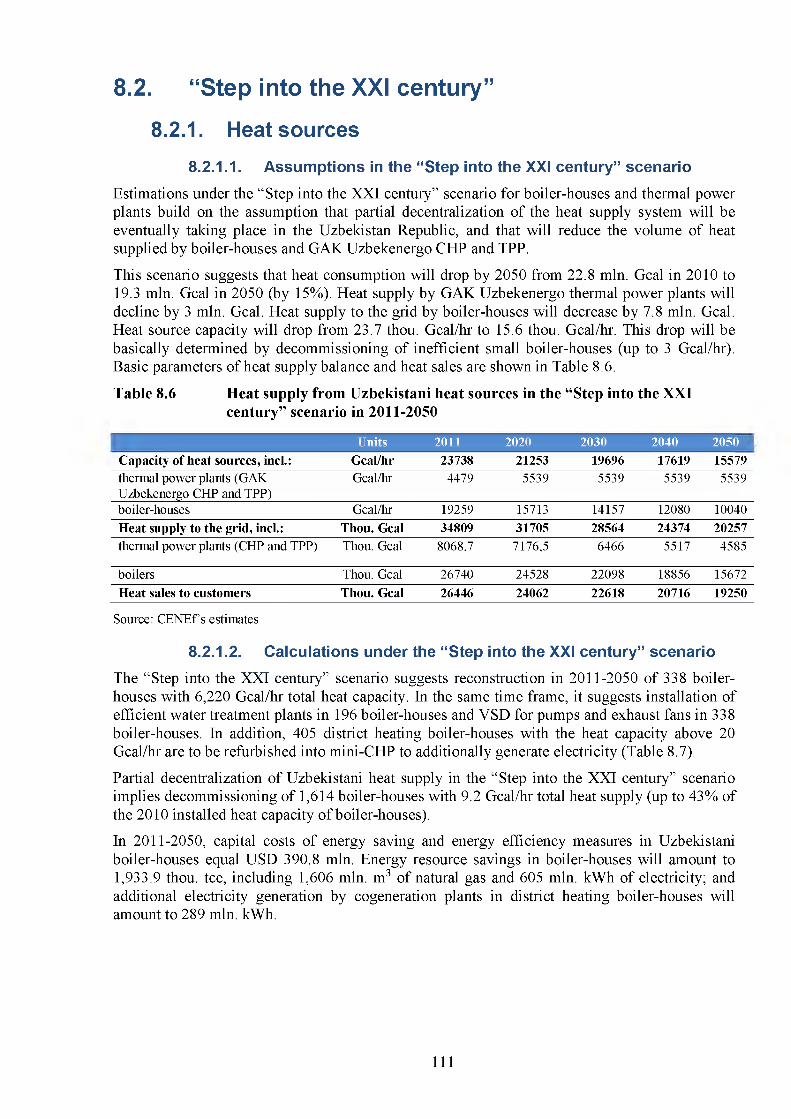
8.2. “Step into the XXI century”8.2.1. Heat sources
8.2.1.1. Assumptions in the “Step into the XXI century” scenarioEstimations under the “Step into the XXI century” scenario for boiler-houses and thermal power plants build on the assumption that partial decentralization of the heat supply system will be eventually taking place in the Uzbekistan Republic, and that will reduce the volume of heat supplied by boiler-houses and GAK Uzbekenergo CHP and TPP.
This scenario suggests that heat consumption will drop by 2050 from 22.8 mln. Gcal in 2010 to 19.3 mln. Gcal in 2050 (by 15%). Heat supply by GAK Uzbekenergo thermal power plants will decline by 3 mln. Gcal. Heat supply to the grid by boiler-houses will decrease by 7.8 mln. Gcal. Heat source capacity will drop from 23.7 thou. Gcal/hr to 15.6 thou. Gcal/hr. This drop will be basically determined by decommissioning of inefficient small boiler-houses (up to 3 Gcal/hr). Basic parameters of heat supply balance and heat sales are shown in Table 8.6.
Table 8.6 Heat supply from Uzbekistani heat sources in the “Step into the XXIcentury” scenario in 2011-2050
Units 2011 2020 2030 2040 2050 ICapacity of heat sources, incl.: Gcal/hr 23738 21253 19696 17619 15579thermal power plants (GAK Uzbekenergo CHP and TPP)
Gcal/hr 4479 5539 5539 5539 5539
boiler-houses Gcal/hr 19259 15713 14157 12080 10040Heat supply to the grid, incl.: Thou. Gcal 34809 31705 28564 24374 20257thermal power plants (CHP and TPP) Thou. Gcal 8068,7 7176,5 6466 5517 4585
boilers Thou. Gcal 26740 24528 22098 18856 15672Heat sales to customers Thou. Gcal 26446 24062 22618 20716 19250
Source: CENEfs estimates
8.2.1.2. Calculations under the “Step into the XXI century” scenarioThe “Step into the XXI century” scenario suggests reconstruction in 2011-2050 of 338 boiler- houses with 6,220 Gcal/hr total heat capacity. In the same time frame, it suggests installation of efficient water treatment plants in 196 boiler-houses and VSD for pumps and exhaust fans in 338 boiler-houses. In addition, 405 district heating boiler-houses with the heat capacity above 20 Gcal/hr are to be refurbished into mini-CHP to additionally generate electricity (Table 8.7).
Partial decentralization of Uzbekistani heat supply in the “Step into the XXI century” scenario implies decommissioning of 1,614 boiler-houses with 9.2 Gcal/hr total heat supply (up to 43% of the 2010 installed heat capacity of boiler-houses).
In 2011-2050, capital costs of energy saving and energy efficiency measures in Uzbekistani boiler-houses equal USD 390.8 mln. Energy resource savings in boiler-houses will amount to 1,933.9 thou, tee, including 1,606 mln. m3 of natural gas and 605 mln. kWh of electricity; and additional electricity generation by cogeneration plants in district heating boiler-houses will amount to 289 mln. kWh.
Ill
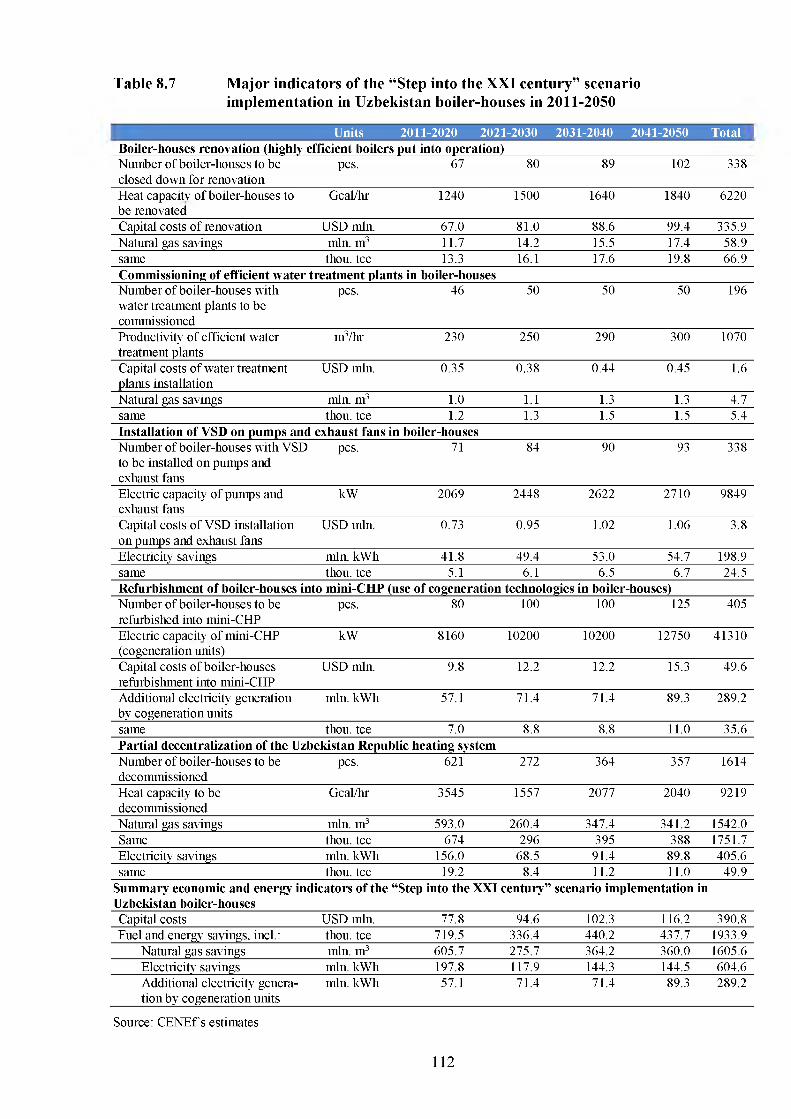
Table 8.7 Major indicators of the “Step into the XXI century” scenarioimplementation in Uzbekistan boiler-houses in 2011-2050
Units 2011-2020 2021-2030 2031-2040 2041-2050 Total IBoiler-houses renovation (highly efficient boilers put into operation)Number of boiler-houses to be pcs. 67 80 89 102 338closed down for renovationHeat capacity of boiler-houses to Gcal/hr 1240 1500 1640 1840 6220be renovatedCapital costs of renovation USD mln. 67.0 81.0 88.6 99.4 335.9Natural gas savings mln. m3 11.7 14.2 15.5 17.4 58.9same thou, tee 13.3 16.1 17.6 19.8 66.9Commissioning of efficient water treatment plants in boiler-housesNumber of boiler-houses with pcs. 46 50 50 50 196water treatment plants to becommissionedProductivity of efficient water m3/hr 230 250 290 300 1070treatment plantsCapital costs of water treatment USD mln. 0.35 0.38 0.44 0.45 1.6plants installationNatural gas savings mln. m3 1.0 1.1 1.3 1.3 4.7same thou, tee 1.2 1.3 1.5 1.5 5.4Installation of VSD on pumps and exhaust fans in boiler-housesNumber of boiler-houses with VSD pcs. 71 84 90 93 338to be installed on pumps andexhaust fansElectric capacity of pumps and exhaust fans
kW 2069 2448 2622 2710 9849
Capital costs of VSD installation USD mln. 0.73 0.95 1.02 1.06 3.8on pumps and exhaust fansElectricity savings mln. kWh 41.8 49.4 53.0 54.7 198.9same thou, tee 5.1 6.1 6.5 6.7 24.5Refurbishment of boiler-houses into mini-CHP (use of cogeneration technologies in boiler-houses)Number of boiler-houses to be pcs. 80 100 100 125 405refurbished into mini-CHPElectric capacity of mini-CHP kW 8160 10200 10200 12750 41310(cogeneration units)Capital costs of boiler-houses USD mln. 9.8 12.2 12.2 15.3 49.6refurbishment into mini-CHPAdditional electricity generation mln. kWh 57.1 71.4 71.4 89.3 289.2by cogeneration unitssame thou, tee 7.0 8.8 8.8 11.0 35.6Partial decentralization of the Uzbekistan Republic heating systemNumber of boiler-houses to be pcs. 621 272 364 357 1614decommissionedHeat capacity to be Gcal/hr 3545 1557 2077 2040 9219decommissionedNatural gas savings mln. m3 593.0 260.4 347.4 341.2 1542.0Same thou, tee 674 296 395 388 1751.7Electricity savings mln. kWh 156.0 68.5 91.4 89.8 405.6same thou, tee 19.2 8.4 11.2 11.0 49.9
Summary economic and energy indicators of the Uzbekistan boiler-houses
; “Step into the XXI century” scenario implementation in
Capital costs USD mln. 77.8 94.6 102.3 116.2 390.8Fuel and energy savings, incl.: thou, tee 719.5 336.4 440.2 437.7 1933.9
Natural gas savings mln. m3 605.7 275.7 364.2 360.0 1605.6Electricity savings mln. kWh 197.8 117.9 144.3 144.5 604.6Additional electricity genera mln. kWh 57.1 71.4 71.4 89.3 289.2tion by cogeneration units
Source: CENEf s estimates
112
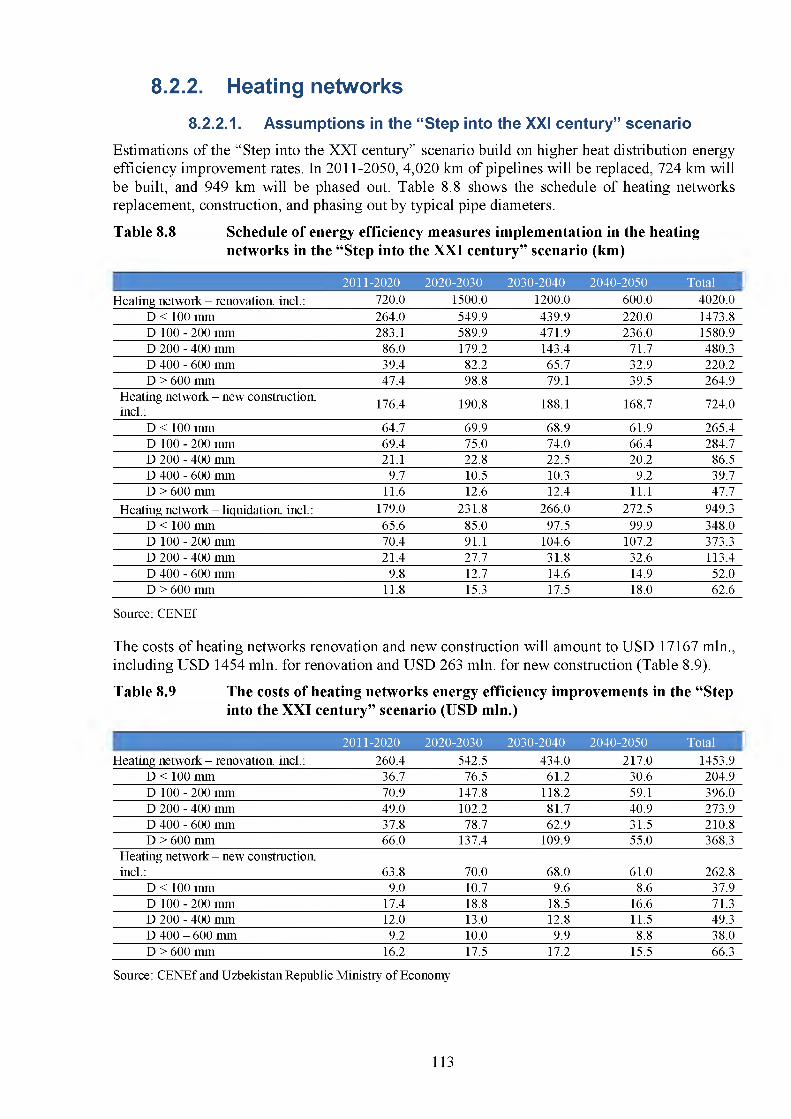
8.2.2. Heating networks
Estimations of the “Step into the XXI century” scenario build on higher heat distribution energy efficiency improvement rates. In 2011-2050, 4,020 km of pipelines will be replaced, 724 km will be built, and 949 km will be phased out. Table 8.8 shows the schedule of heating networks replacement, construction, and phasing out by typical pipe diameters.
Table 8.8 Schedule of energy efficiency measures implementation in the heatingnetworks in the “Step into the XXI century” scenario (km)
8.2.2.1. A ssum ptions in the “ Step into the XXI century” scenario
2011-2020 2020-2030 2030-2040 2040-2050 Total fHeating network - renovation, incl.: 720.0 1500.0 1200.0 600.0 4020.0
D < 100 mm 264.0 549.9 439.9 220.0 1473.8D 100 - 200 mm 283.1 589.9 471.9 236.0 1580.9D 200 - 400 mm 86.0 179.2 143.4 71.7 480.3D 400 - 600 mm 39.4 82.2 65.7 32.9 220.2D > 600 mm 47.4 98.8 79.1 39.5 264.9
Heating network - new construction, incl.: 176.4 190.8 188.1 168.7 724.0
D < 100 mm 64.7 69.9 68.9 61.9 265.4D 100 - 200 mm 69.4 75.0 74.0 66.4 284.7D 200 - 400 mm 21.1 22.8 22.5 20.2 86.5D 400 - 600 mm 9.7 10.5 10.3 9.2 39.7D > 600 mm 11.6 12.6 12.4 11.1 47.7
Heating network - liquidation, incl.: 179.0 231.8 266.0 272.5 949.3D < 100 mm 65.6 85.0 97.5 99.9 348.0D 100 - 200 mm 70.4 91.1 104.6 107.2 373.3D 200 - 400 mm 21.4 27.7 31.8 32.6 113.4D 400 - 600 mm 9.8 12.7 14.6 14.9 52.0D > 600 mm 11.8 15.3 17.5 18.0 62.6
Source: CENEf
The costs of heating networks renovation and new construction will amount to USD 17167 mln., including USD 1454 mln. for renovation and USD 263 mln. for new construction (Table 8.9).
Table 8.9 The costs of heating networks energy efficiency improvements in the “Stepinto the XXI century” scenario (USD mln.)
2011-2020 2020-2030 2030-2040 2040-2050 Total IHeating network - renovation, incl.: 260.4 542.5 434.0 217.0 1453.9
D < 100 mm 36.7 76.5 61.2 30.6 204.9D 100 - 200 mm 70.9 147.8 118.2 59.1 396.0D 200 - 400 mm 49.0 102.2 81.7 40.9 273.9D 400 - 600 mm 37.8 78.7 62.9 31.5 210.8D > 600 mm 66.0 137.4 109.9 55.0 368.3
Heating network - new construction, incl.: 63.8 70.0 68.0 61.0 262.8
D < 100 mm 9.0 10.7 9.6 8.6 37.9D 100 - 200 mm 17.4 18.8 18.5 16.6 71.3D 200 - 400 mm 12.0 13.0 12.8 11.5 49.3D 400 - 600 mm 9.2 10.0 9.9 8.8 38.0D > 600 mm 16.2 17.5 17.2 15.5 66.3
Source: CENEf and Uzbekistan Republic Ministry o f Economy
113
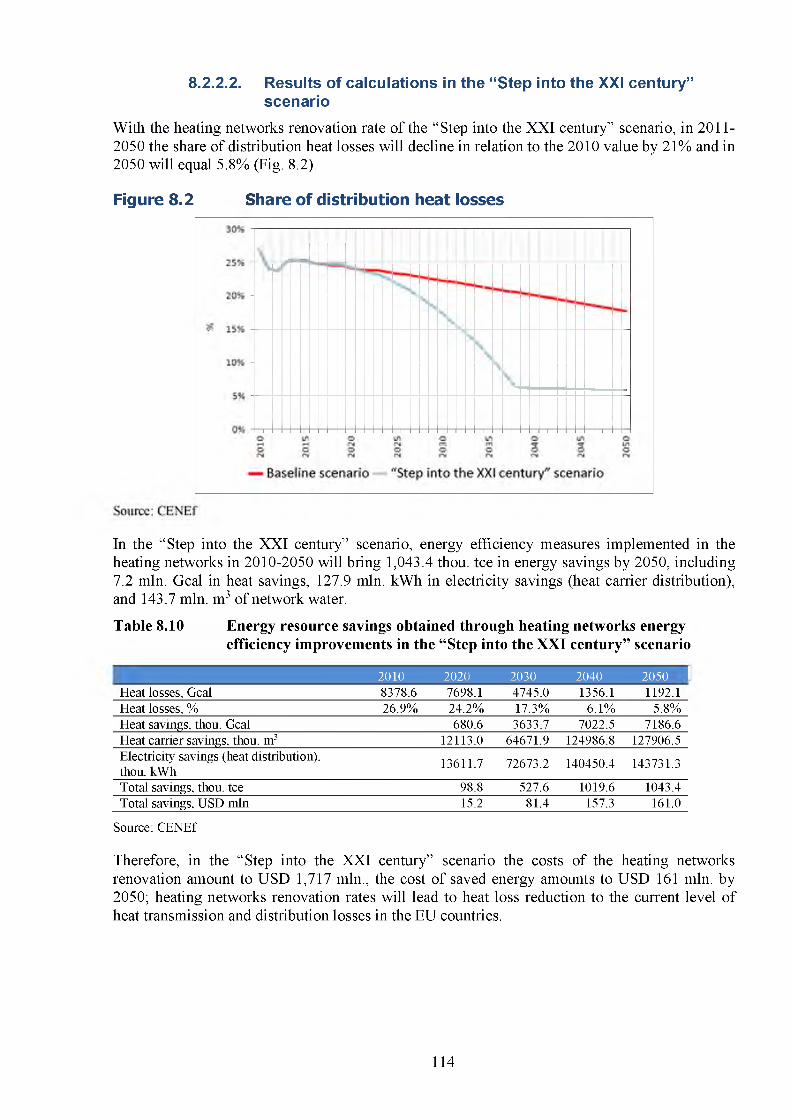
8.2.2.2. Results of calculations in the “Step into the XXI century” scenario
With the heating networks renovation rate of the “Step into the XXI century” scenario, in 2011- 2050 the share of distribution heat losses will decline in relation to the 2010 value by 21% and in 2050 will equal 5.8% (Fig. 8.2).
Figure 8.2 Share of distribution heat losses
In the “Step into the XXI century” scenario, energy efficiency measures implemented in the heating networks in 2010-2050 will bring 1,043.4 thou, tee in energy savings by 2050, including 7.2 mln. Gcal in heat savings, 127.9 mln. kWh in electricity savings (heat carrier distribution), and 143.7 mln. m3 of network water.
Table 8.10 Energy resource savings obtained through heating networks energy efficiency improvements in the “Step into the XXI century” scenario
2010 2020 2030 2040 2050 IHeat losses, Gcal 8378.6 7698.1 4745.0 1356.1 1192.1Heat losses, % 26.9% 24.2% 17.3% 6.1% 5.8%Heat savings, thou. Gcal 680.6 3633.7 7022.5 7186.6Heat carrier savings, thou, m3 12113.0 64671.9 124986.8 127906.5Electricity savings (heat distribution), thou. kWh
13611.7 72673.2 140450.4 143731.3
Total savings, thou, tee 98.8 527.6 1019.6 1043.4Total savings, USD mln 15.2 81.4 157.3 161.0
Source: CENEf
Therefore, in the “Step into the XXI century” scenario the costs of the heating networks renovation amount to USD 1,717 mln., the cost of saved energy amounts to USD 161 mln. by 2050; heating networks renovation rates will lead to heat loss reduction to the current level of heat transmission and distribution losses in the EU countries.
114
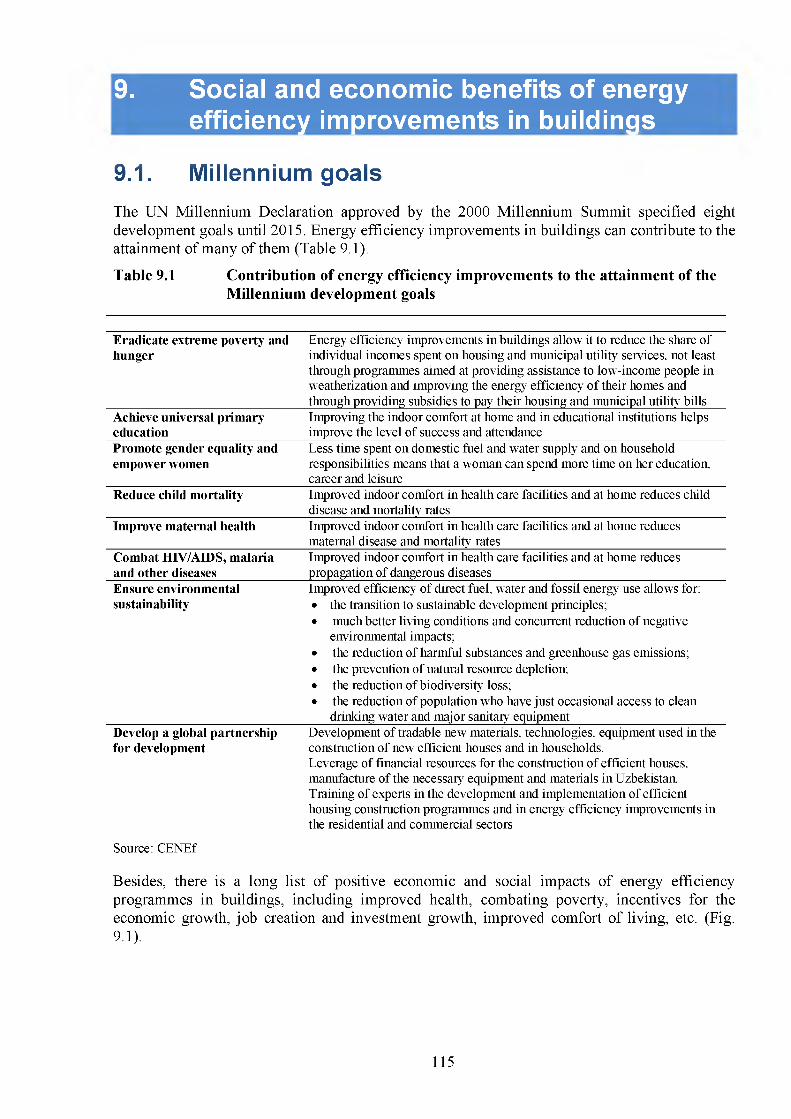
9. Social and economic benefits of energyefficiency improvements in buildings
9.1. Millennium goalsThe UN Millennium Declaration approved by the 2000 Millennium Summit specified eight development goals until 2015. Energy efficiency improvements in buildings can contribute to the attainment of many of them (Table 9.1).
Table 9.1 Contribution of energy efficiency improvements to the attainment of the Millennium development goals
Eradicate extreme poverty and hunger
Energy efficiency improvements in buildings allow it to reduce the share of individual incomes spent on housing and municipal utility services, not least through programmes aimed at providing assistance to low-income people in weatherization and improving the energy efficiency o f their homes and through providing subsidies to pay their housing and municipal utility bills
Achieve universal primary education
Improving the indoor comfort at home and in educational institutions helps improve the level of success and attendance
Promote gender equality and empower women
Less time spent on domestic fuel and water supply and on household responsibilities means that a woman can spend more time on her education, career and leisure
Reduce child mortality Improved indoor comfort in health care facilities and at home reduces child disease and mortality rates
Improve maternal health Improved indoor comfort in health care facilities and at home reduces maternal disease and mortality rates
Combat HIV/AIDS, malaria and other diseases
Improved indoor comfort in health care facilities and at home reduces propagation of dangerous diseases
Ensure environmental sustainability
Improved efficiency of direct fuel, water and fossil energy use allows for:• the transition to sustainable development principles;• much better living conditions and concurrent reduction of negative
environmental impacts;• the reduction of harmful substances and greenhouse gas emissions;• the prevention of natural resource depletion;• the reduction of biodiversity loss;• the reduction of population who have just occasional access to clean
drinking water and major sanitary equipmentDevelop a global partnership for development
Development of tradable new materials, technologies, equipment used in the construction of new efficient houses and in households.Leverage of financial resources for the construction of efficient houses, manufacture of the necessary equipment and materials in Uzbekistan. Training of experts in the development and implementation of efficient housing construction programmes and in energy efficiency improvements in the residential and commercial sectors
Source: CENEf
Besides, there is a long list of positive economic and social impacts of energy efficiency programmes in buildings, including improved health, combating poverty, incentives for the economic growth, job creation and investment growth, improved comfort of living, etc. (Fig. 9.1).
115
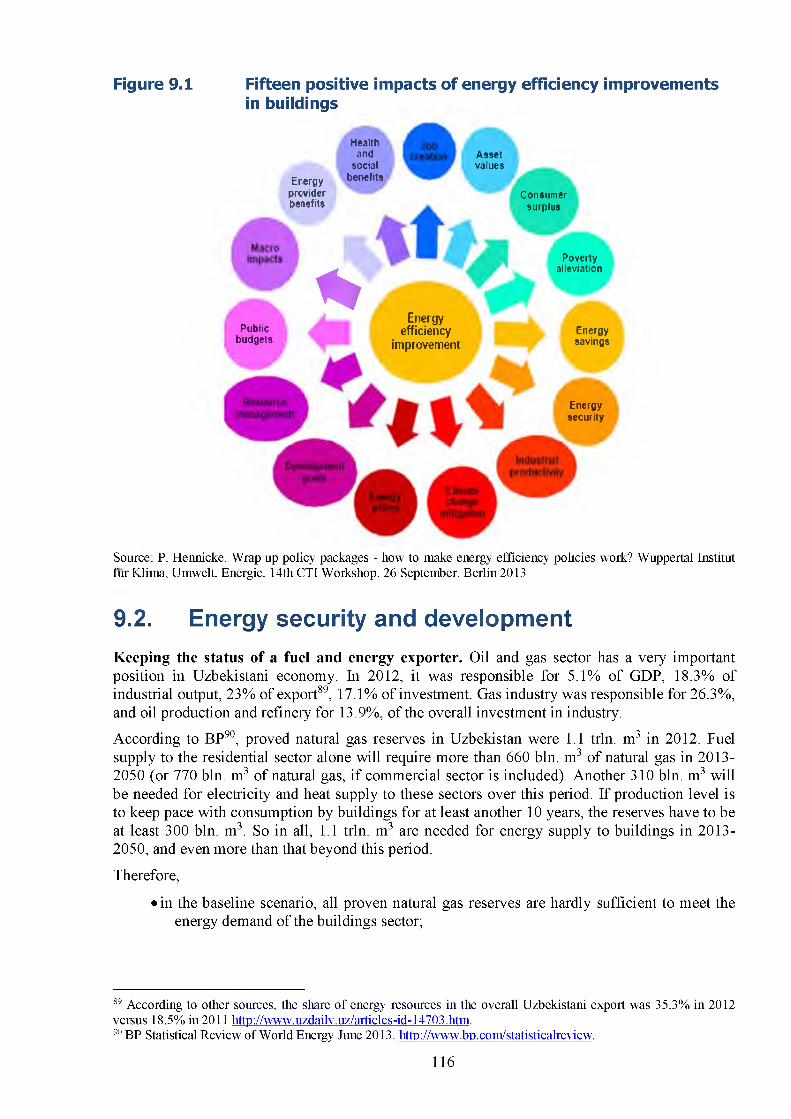
Figure 9.1 Fifteen positive impacts of energy efficiency improvements in buildings
Energyproviderbenefits
Healthand
socialbenefits
Assetvalues
%
Consumersurplus
Povertyalleviation
Publicbudgets
Energyefficiency Energy
improvement savings
Energysecurity
Source: P. Hennicke. Wrap up policy packages - how to make energy efficiency policies work? Wuppertal Institut fur Klima, Umwelt Energie. 14th CTI Workshop. 26 September. Berlin 2013
9.2. Energy security and developmentKeeping the status of a fuel and energy exporter. Oil and gas sector has a very important position in Uzbekistani economy. In 2012, it was responsible for 5.1% of GDP, 18.3% of industrial output, 23% of export89, 17.1% of investment. Gas industry was responsible for 26.3%, and oil production and refinery for 13.9%, of the overall investment in industry.
According to BP90, proved natural gas reserves in Uzbekistan were 1.1 trln. m3 in 2012. Fuel supply to the residential sector alone will require more than 660 bln. m3 of natural gas in 2013- 2050 (or 770 bln. m3 of natural gas, if commercial sector is included). Another 310 bln. m3 will be needed for electricity and heat supply to these sectors over this period. If production level is to keep pace with consumption by buildings for at least another 10 years, the reserves have to be at least 300 bln. m3. So in all, 1.1 trln. m3 are needed for energy supply to buildings in 2013- 2050, and even more than that beyond this period.
Therefore,
• in the baseline scenario, all proven natural gas reserves are hardly sufficient to meet the energy demand of the buildings sector;
89 According to other sources, the share o f energy resources in the overall Uzbekistani export was 35.3% in 2012 versus 18.5% in 2011 http://www.uzdailY.uz/articles-id-14703.htm.911 BP Statistical Review of World Energy June 2013. http://www.bp.com/statisticalreview.
116
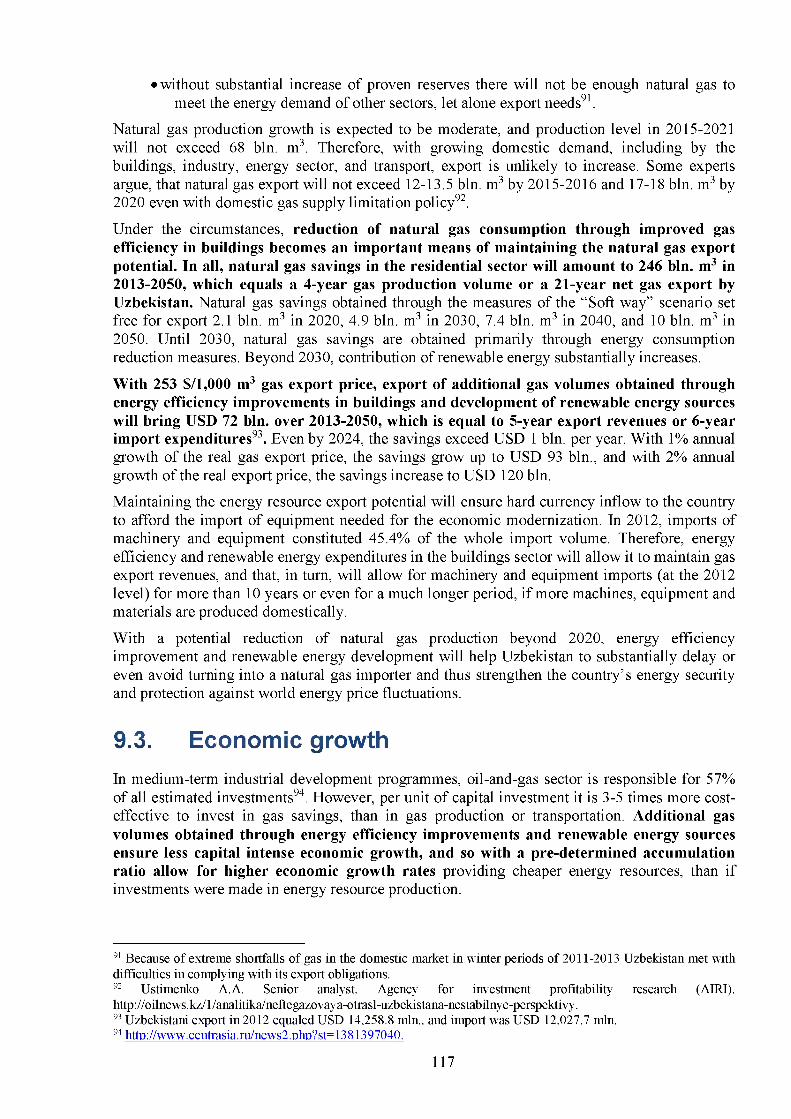
• without substantial increase of proven reserves there will not be enough natural gas to meet the energy demand of other sectors, let alone export needs91.
Natural gas production growth is expected to be moderate, and production level in 2015-2021 will not exceed 68 bln. m3. Therefore, with growing domestic demand, including by the buildings, industry, energy sector, and transport, export is unlikely to increase. Some experts argue, that natural gas export will not exceed 12-13.5 bln. m3 by 2015-2016 and 17-18 bln. m3 by 2020 even with domestic gas supply limitation policy92.
Under the circumstances, reduction of natural gas consumption through improved gas efficiency in buildings becomes an important means of maintaining the natural gas export potential. In all, natural gas savings in the residential sector will amount to 246 bln. m3 in 2013-2050, which equals a 4-year gas production volume or a 21-year net gas export by Uzbekistan. Natural gas savings obtained through the measures of the “Soft way” scenario set free for export 2.1 bln. m3 in 2020, 4.9 bln. m3 in 2030, 7.4 bln. m3 in 2040, and 10 bln. m3 in 2050. Until 2030, natural gas savings are obtained primarily through energy consumption reduction measures. Beyond 2030, contribution of renewable energy substantially increases.
With 253 $/1,000 m3 gas export price, export of additional gas volumes obtained through energy efficiency improvements in buildings and development of renewable energy sources will bring USD 72 bln. over 2013-2050, which is equal to 5-year export revenues or 6-year import expenditures93. Even by 2024, the savings exceed USD 1 bln. per year. With 1% annual growth of the real gas export price, the savings grow up to USD 93 bln., and with 2% annual growth of the real export price, the savings increase to USD 120 bln.
Maintaining the energy resource export potential will ensure hard currency inflow to the country to afford the import of equipment needed for the economic modernization. In 2012, imports of machinery and equipment constituted 45.4% of the whole import volume. Therefore, energy efficiency and renewable energy expenditures in the buildings sector will allow it to maintain gas export revenues, and that, in turn, will allow for machinery and equipment imports (at the 2012 level) for more than 10 years or even for a much longer period, if more machines, equipment and materials are produced domestically.
With a potential reduction of natural gas production beyond 2020, energy efficiency improvement and renewable energy development will help Uzbekistan to substantially delay or even avoid turning into a natural gas importer and thus strengthen the country’s energy security and protection against world energy price fluctuations.
9.3. Economic growthIn medium-term industrial development programmes, oil-and-gas sector is responsible for 57% of all estimated investments94. However, per unit of capital investment it is 3-5 times more cost- effective to invest in gas savings, than in gas production or transportation. Additional gas volumes obtained through energy efficiency improvements and renewable energy sources ensure less capital intense economic growth, and so with a pre-determined accumulation ratio allow for higher economic growth rates providing cheaper energy resources, than if investments were made in energy resource production.
91 Because o f extreme shortfalls of gas in the domestic market in winter periods of 2011-2013 Uzbekistan met with difficulties in complying with its export obligations.92 Ustimenko A. A. Senior analyst. Agency for investment profitability research (AIRI). http://oilnews.kz/l/analitika/neftegazovaya-otrasl-uzbekistana-nestabilnye-perspektivy.93 Uzbekistani export in 2012 equaled USD 14,258.8 mln., and import was USD 12,027.7 mln.94 http://www.centrasia.ru/news2.php?st=1381397040.
117
With relevant incentives provided, construction of energy efficient residential buildings becomes an important driver of the economic growth. USD 38 bln. of additional investment (or more than USD 1 bln annually on average) are expected under the buildings energy efficiency programme. This could spur investment and economic growth.
Construction is responsible for 6% of GDP, buildings for 2.6% of GDP, municipal utility services for 1.5%, and building materials for another 1.2% of GDP (4.9% of industrial output). In all, construction and housing are responsible for more than 10% of GDP95. The buildings sector is responsible for 10% of the overall investment, or for 15-17% if the buildings equipment is taken into account.
Maintaining good performance of the housing construction sector and natural gas export potential will bring additional tax revenues. Government revenues from saved gas export and additional investments in buildings and appliances may be quite substantial.
Improved comfort and energy supply reliability will by 5-10% increase the productivity in the commercial sector, whose share in the GDP is growing. Expansion of domestic manufacture of efficient materials and equipment will decrease the import reliance and promote innovative economic development.
9.4. Costs and benefitsBuildings energy efficiency programme involves additional costs. Cognition comes through comparison, so it is important to see, how much these costs will contribute to the overall construction and equipment costs in the residential and commercial sectors. At first, baseline construction costs, capital retrofit costs, and equipment costs were estimated96 (Fig. 9.2). Then additional project costs were assessed, as well as the benefits (associated solely with natural gas savings that can be exported). The findings are as follows:
• the costs of housing construction, retrofits and equipment in the “Step into the XXI century” scenario show 20% growth by 2020, 37% growth by 2030, and 53% growth by 2050;
• measures of the “Step into the XXI century” scenario add 18% to these costs by 2020, 27% by 2030, and 35% by 2050;
• in all, additional costs in the “Step into the XXI century” scenario in 2014-2050 equal USD 27 bln. in the 2013 prices, and in the “Soft way” scenario another USD 11 bln. in the 2013 prices, totaling to USD 38 bln. in the 2013 prices;
• revenues obtained through the export of gas savings in the “Step into the XXI century scenario” are much above these costs and amount to USD 57 bln. in 2014-2050 in the 2013 prices (or USD 95 bln., with gas export prices growing at a rate 2% above the inflation rate);
• the revenues are above the costs throughout the whole period of 2014-2050;• monetization of the additional effects will substantially (by 30-70%) increase the
estimated economic effect.
95 The buildings sector accounted for 8% of global GDP (USD 4.9 trillion) in 2010 (GC, 2012) which makes the sector a key component of the global economy. Modernising Building Energy Codes to Secure our Global Energy Future. IEA. 2013.96 Based on 30 U S$/nf capital retrofit costs and 35 US$/m2 appliances procurement costs for new buildings.
118
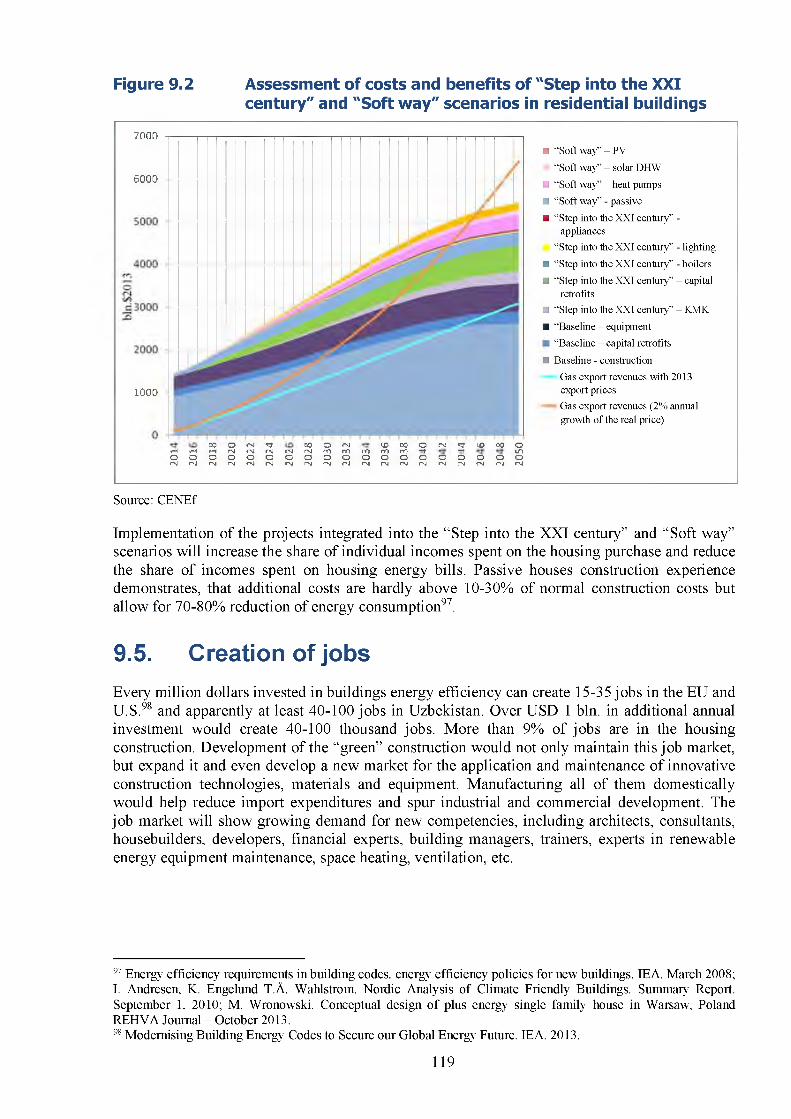
Figure 9.2 Assessment of costs and benefits of "Step into the XXI century" and "Soft way" scenarios in residential buildings
■ “Soft way” - PV
“Soft way” - solar DHW
■ “Soft way” - heat pumps
■ “Soft way” - passive
■ “Step into the XXI century” -appliances
“Step into the XXI century” - lighting
■ “Step into the XXI century” - boilers
■ “Step into the XXI century” - capitalretrofits
■ “Step into the XXI century” - KMK
■ “Baseline - equipment
“Baseline - capital retrofits
■ Baseline - construction
Gas export revenues with 2013 export pricesGas export revenues (2% annual growth of the real price)
Source: CENEf
Implementation of the projects integrated into the “Step into the XXI century” and “Soft way” scenarios will increase the share of individual incomes spent on the housing purchase and reduce the share of incomes spent on housing energy bills. Passive houses construction experience demonstrates, that additional costs are hardly above 10-30% of normal construction costs but allow for 70-80% reduction of energy consumption97.
9.5. Creation of jobsEvery million dollars invested in buildings energy efficiency can create 15-35 jobs in the EU and U.S.98 and apparently at least 40-100 jobs in Uzbekistan. Over USD 1 bln. in additional annual investment would create 40-100 thousand jobs. More than 9% of jobs are in the housing construction. Development of the “green” construction would not only maintain this job market, but expand it and even develop a new market for the application and maintenance of innovative construction technologies, materials and equipment. Manufacturing all of them domestically would help reduce import expenditures and spur industrial and commercial development. The job market will show growing demand for new competencies, including architects, consultants, housebuilders, developers, financial experts, building managers, trainers, experts in renewable energy equipment maintenance, space heating, ventilation, etc.
97 Energy efficiency requirements in building codes, energy efficiency policies for new buildings. IEA. March 2008; I. Andresen, K. Engelund T.A. Wahlstrom. Nordic Analysis of Climate Friendly Buildings. Summary Report. September 1, 2010; M. Wronowski. Conceptual design o f plus energy single family house in Warsaw, Poland REHVA Journal - October 2013.98 Modernising Building Energy Codes to Secure our Global Energy Future. IEA. 2013.
119
7000
6000
1000
00 О гм «3- 00 о гм <х> 00 О ГМ <3- Ю 00 оrH rH t-н гм fNJ CN гм гм го го го го ГО г̂ -г LDО О О О О о О о о о о О О О О о о о оr s l ГМ гм Г \ | ГМ гм гм гм r s l r s l r s l гм гм r s l ГМ ГМ гм гм r s l
9.6. Eradication of poverty and maintaining energy affordability
Residential energy supply costs in relation to the baseline scenario show 12% drop by 2020, 28% drop by 2030, 40% drop by 2040, and 50% drop by 2050. Residential energy supply cost savings in 2013-2050 will amount to USD 24 bln. (in the 2013 prices, November 2013 exchange rate). The share of electricity, natural gas, and heat bills in overall residential spending goes down from 7% in 2013 to 1.5% in 2050. If it were not for energy efficiency and renewable energy measures, this share would be twice larger in 2040-2050.
The above refers to the situation where residential energy prices are maintained at the 2013 level. However, potential insufficient supply of natural gas in the baseline scenario will not let maintain the price at the 2013 level for a long time. Therefore, the cost savings may be much larger. Withh residential energy prices sustainably growing at a rate 2% above the inflation rate, the savings will amount to USD 40 bln. The share of electricity, natural gas and heat bills in the overall residential spending drops to 3.1% in 2050. If the measures under the “Soft way” scenario are not implemented, it will equal 4.8%. Finally, with annual residential energy prices growing at a rate 3% above the inflation rate, and the described measures not implemented, the share of electricity, natural gas and heat bills in the overall residential spending would not decline. However, even with such energy bills growth, the above measures would help keep the share of energy bills at 4.4% of the overall residential spending, which is close to the average residential energy affordability threshold (see Chapter 2). Normally, the share of energy bills in the spending of low-income households is twice larger, than the countrywide average (see Chapter 2). This means, that for low-income households this share will remain close to the affordability threshold even with energy prices sustainably growing at a rate 4% above the inflation rate until 2050.
Assistance provided to low-income families in getting or purchasing low energy or plus energy housing will completely eliminate the need for subsidies required to eradicate the “energy poverty”. This will reduce the burden on the government related to subsidizing the housing and municipal utility sector and providing support to the population in paying their housing and utility bills. Reduction of sickness cases that relate to low comfort leads to reduced sickness- related income losses and medical expenses, which is exceptionally important for low-income families.
9.7. Improving the standard of living and healthAs mentioned before in Chapter 3, WHO reports 5,300 premature death cases in Uzbekistan annually related to cooking using solid fuels and inefficient ovens".
The proposed measures will allow it to improve the comfort of living, promote better health, reduce indoor emissions and improve the air quality to help reduce asthma, allergy, and other respiratory disease cases.
According to the available estimates, excess death rate grows 10-40% in regions with insufficient thermal comfort during the heat supply season. Seasonal death rate fluctuation factor in Portugal, where weatherization is much weaker, than in Finland, is 2.8 times higher100. Even Poland, Germany or Spain report around 10 thousand excess death cases in the “energy poor” families in winter time, which is above the car accident death rate. Obviously, 20-30 thousand death cases would be a reliable estimate for Uzbekistan.
99 https://energypedia.info/wiki/Usbekistan Energy Situation.11111 Modernising Building Energy Codes to Secure our Global Energy Future. IEA. 2013.
120
According to the WHO estimates, additional effects related to health improvement equal USc 2.7 per year (or USc 68 over 25 years) per each dollar invested in housing weatherization101. The effects of health improvement related to a higher amenities level or better thermal comfort are estimated at 8-22% of the energy saving costs in the developed countries, and are even higher in developing states102.
Over 1 trillion soms are secured in the 2013 federal budget for the construction of 8,510 modern rural houses by standard design in 326 settlements under the Single-Family Rural Houses Construction Programme. If weatherization requirements to these houses are made more stringent, they will perform another important social function, namely health improvement. This also refers to public buildings. Financing is secured in the 2013 federal budget for capital retrofits and renovation of 313 comprehensive schools and 228 academic lyceums and professional colleges from the non-budgetary fund for renovation and capital retrofits.
9.8. Environmental security and reduction of contamination and GHG emissions
Emissions of contaminants into the air from stationary sources amounted to 773 thou, t in 2011. Per capita emissions of sulphur dioxide equaled 13.3 kg, of carbon monoxide 4.1 kg, nitrogen oxide 0.7 kg103. Unfortunately, no data are available on the distribution of contaminants emissions from stationary sources by groups of sources, so it is difficult to estimate the effect of emission reduction determined by the EE and renewable energy measures in buildings on the overall emission dynamics.
According to the IEA, CO2 emissions from fossil fuels in Uzbekistan were 100.2 mln. t in 2010, of which 27.26 mln. t. were emitted in the buildings sector104. CENEf estimates 2010 emission by the buildings sector at 27.11 mln. t CO2, and emissions of three major GHG (CO2, СШ and N 2O) at 30.75 mln. t СОг-eq. Therefore, the residential sector is responsible for at least 27% of the overall energy-related GHG emissions, and so no GHG emission control strategy can ignore this sector. The measures proposed in the “Step into XXI century” and “Soft way” scenarios allow it not only to terminate emission growth in this sector, but also ensure a noticeable emission reduction (Fig. 9.3).
Emission reduction in relation to the baseline scenario is 3.9 mln. t СОг-eq. in 2020, 10 mln. t in 2030, 16.3 mln. t in 2040, 22.6 mln. t in 2050. The latter figure equals 22% of the 2010 emission. In all, GHG emission declines by 421 mln. t СОг-eq in 2013-2050, which is 4 times the 2010 emission volume. If this is combined with the emission reduction in the commercial sector, the overall GHG emission by all buildings goes up to 528 mln. t СОг-eq., which is already 5 times the 2010 energy-related GHG emission.
1111 World Health Organization, 2011.1112 Levy J., Y. Nishioka, and J. Spengler (2003). The public health benefits of insulation retrofits in existing housing in the United States. Environmental Health: A Global Access Science Source 2. Available at: http://en.scientificcommons.org/1467252: N;ess-Schmidt H.S., M.B. Hansen, and C. von Utfall Danielsson (2012).Multiple benefits o f investing in energy efficient renovation o f buildings: impact on public finances. Copenhagen Economics.1113 Uzbekistan in figures. 2012. Federal Committee for Statistics of Uzbekistan Republic.104 C02 EMISSIONS FROM FUEL COMBUSTION. 2012 Edition. IEA. 2012.
121
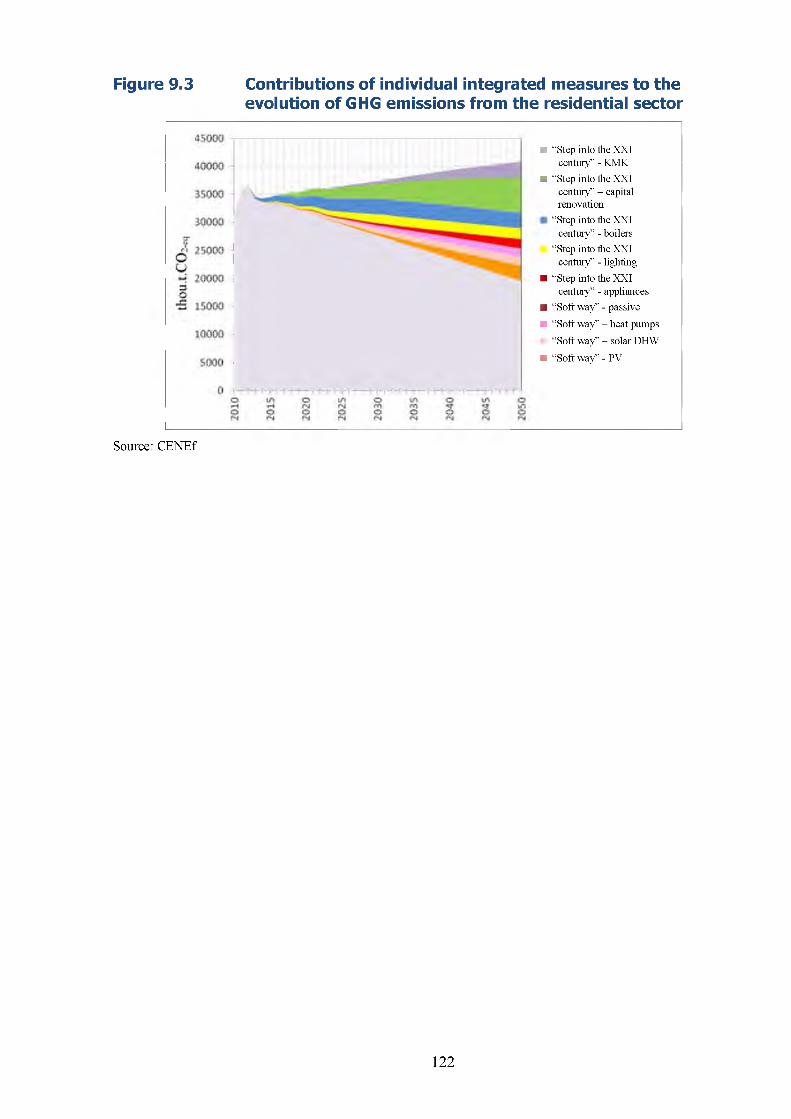
Figure 9.3 Contributions of individual integrated measures to the evolution of GHG emissions from the residential sector
■ “Step into the XXIcentury” - KMK
■ “Step into the XXIcentury” - capital renovation
“Step into the XXI century” - boilers
“Step into the XXI century” - lighting
■ “Step into the XXIcentury” - appliances
■ “Soft way” - passive
■ “Soft way” - heat pumps
“Soft way” - solar DHW
■ “Soft way” - PV
Source: CENEf
122

123
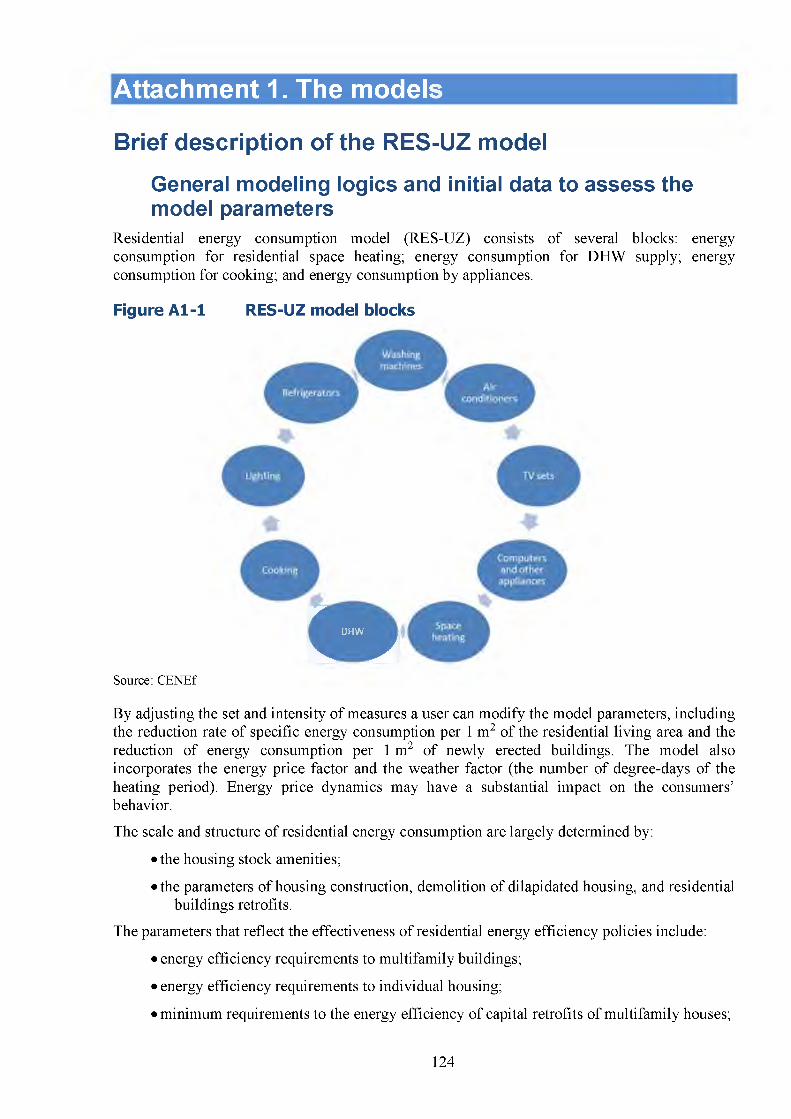
Attachment 1. The models
Brief description of the RES-UZ model
General modeling logics and initial data to assess the model parameters
Residential energy consumption model (RES-UZ) consists of several blocks: energy consumption for residential space heating; energy consumption for DHW supply; energy consumption for cooking; and energy consumption by appliances.
Figure Al-1 RES-UZ model blocks
r DHW
L JSource: CENEf
By adjusting the set and intensity of measures a user can modify the model parameters, including the reduction rate of specific energy consumption per 1 m2 of the residential living area and the reduction of energy consumption per 1 m2 of newly erected buildings. The model also incorporates the energy price factor and the weather factor (the number of degree-days of the heating period). Energy price dynamics may have a substantial impact on the consumers’ behavior.
The scale and structure of residential energy consumption are largely determined by:
• the housing stock amenities;
• the parameters of housing construction, demolition of dilapidated housing, and residentialbuildings retrofits.
The parameters that reflect the effectiveness of residential energy efficiency policies include:
• energy efficiency requirements to multifamily buildings;
• energy efficiency requirements to individual housing;
• minimum requirements to the energy efficiency of capital retrofits of multifamily houses;
124
• existence and effectiveness of housing insulation;
• existence of hot water and gas meters installation programs;
• energy efficiency standards for appliances;
• share of efficient lamps in the structure of lighting fixture sales;
• the share of plasma TV sets in the structure of TV sales;
• the share of dated refrigerators and washing machines replaced with new, more efficientmodels.
Classifying energy efficiency policies in buildings, the ODYSSEE project views measures that generate energy savings of less than 0.1% of the overall energy consumption in buildings as inefficient; measures that generate energy savings of 0.1 to 0.5% as medium efficient, and measures that generated more than 0.5% energy savings as highly efficient105. The RES-UZ model uses the same classification.
Regulatory administrative measures dominated in the structure of European energy efficiency policies in the 90’s. They included introduction of energy efficiency improvement requirements for buildings and of standards for appliances; prohibition of sales of certain types of equipment. In the 2000’s, the priority was given to the economic incentives for the construction of energy efficient buildings and purchases of efficient equipment. These were followed by mandatory information measures (energy efficiency labeling of buildings and equipment) and educational programmes. The share of tariff and tax incentives is relatively small. Generally, the ODYSSEE- MURE experts show, that the more measures implemented, the larger the effect. The largest effect is produced by the regulatory administrative measures (building codes and standards for appliances). In the recent years, the impact of economic incentives has also increased106.
Energy efficiency dynamics and residential energy consumption levels are largely affected by the scale of new housing construction, demolition of dilapidated buildings, and residential buildings retrofits.
In Uzbekistan, statistics only take account of a few parameters used in the RES-UZ model. Other data have to be “logically restored” using the balancing and analogue methods; predetermined values of energy resource consumption that are used by various ministries and agencies; analysis of the appliance market and database; the results of random audits, etc. The results are tied to one another in a manner that would allow it to obtain minimal deviations from the IFEB parameters for an individual region in the residential sector. It is important to make a point here, that the costs associated with direct collection of the information required for the model runs (for example, distribution of all residential buildings by energy consumption per 1 m2, or annual electricity consumption by the entire refrigerator stock, or precise number of incandescent lamps in the residential sector) would be exorbitant and comparable to the cost of population census.
Collection of statistical data by some of the parameters and “logical restoration” of the missing data allows it obtain the structure of residential energy consumption by processes: space heating, DHW supply, cooking, lighting, refrigerating, washing, TV, etc. For each of the above the structure of energy resource use and types of equipment is identified.
To ensure the reliability of the results obtained, many parameters and the very structure of residential energy consumption were compared to the foreign data from the ODYSSEE database operated by ADEME; data of the Energy Information Administration of the U.S. Ministry of Energy; data of the International Energy Agency; Japanese database of the AIM model and some
1115 ODYSSEE database, www.enerdata.fr1116 Overall Energy Efficiency Trends and Policies in the EU 27. ODYSSEE MURE project. ADEME. October, 2009.
125
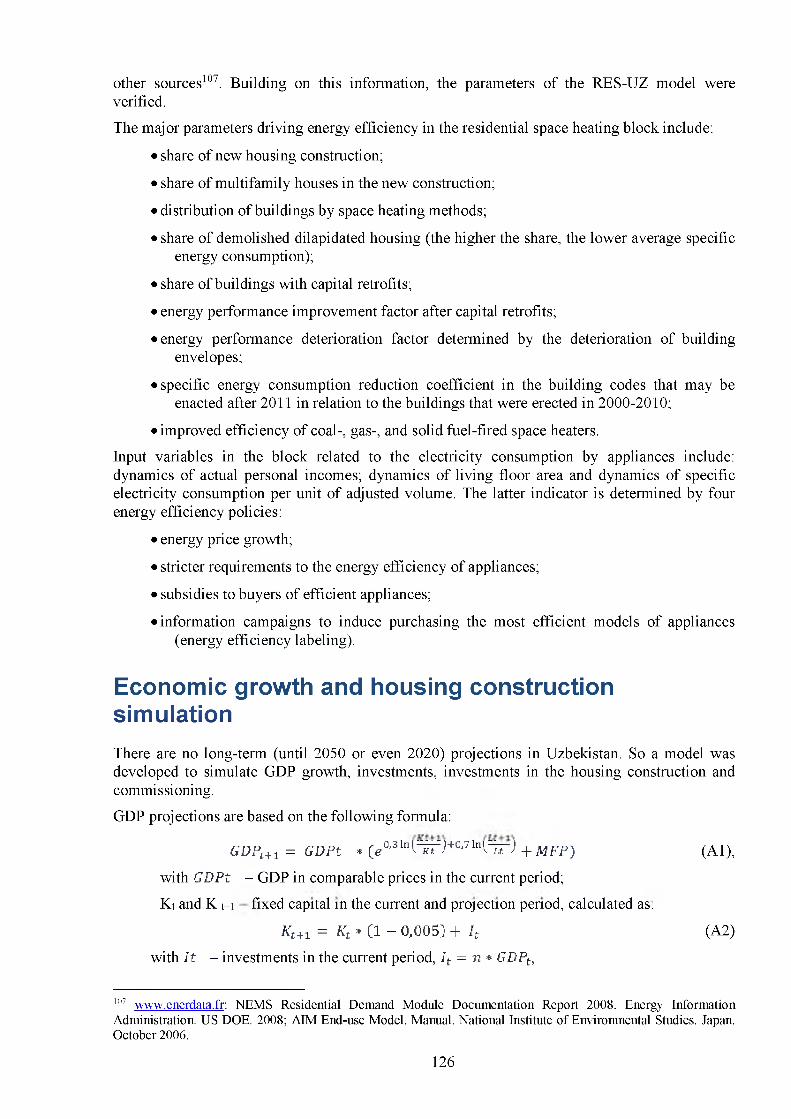
other sources107. Building on this information, the parameters of the RES-UZ model were verified.
The major parameters driving energy efficiency in the residential space heating block include:
• share of new housing construction;
• share of multifamily houses in the new construction;
• distribution of buildings by space heating methods;
• share of demolished dilapidated housing (the higher the share, the lower average specificenergy consumption);
• share of buildings with capital retrofits;
• energy performance improvement factor after capital retrofits;
• energy performance deterioration factor determined by the deterioration of buildingenvelopes;
• specific energy consumption reduction coefficient in the building codes that may beenacted after 2011 in relation to the buildings that were erected in 2000-2010;
• improved efficiency of coal-, gas-, and solid fuel-fired space heaters.
Input variables in the block related to the electricity consumption by appliances include: dynamics of actual personal incomes; dynamics of living floor area and dynamics of specific electricity consumption per unit of adjusted volume. The latter indicator is determined by four energy efficiency policies:
• energy price growth;
• stricter requirements to the energy efficiency of appliances;
• subsidies to buyers of efficient appliances;
• information campaigns to induce purchasing the most efficient models of appliances(energy efficiency labeling).
Economic growth and housing construction simulationThere are no long-term (until 2050 or even 2020) projections in Uzbekistan. So a model was developed to simulate GDP growth, investments, investments in the housing construction and commissioning.
GDP projections are based on the following formula:
GDPt + 1 = GDPt * (e °'3lnh ^ +0‘7lnU r J + M F P ) (Al),
with GDPt - GDP in comparable prices in the current period;
Kt and К t+i fixed capital in the current and projection period, calculated as.
Kt+1 = Kt * ( l - 0 ,0 0 5 ) + It (A2)
with I t - investments in the current period, It = n * GDPt,
1117 www.enerdata.fr: NEMS Residential Demand Module Documentation Report 2008. Energy Information Administration. US DOE. 2008; AIM End-use Model. Manual. National Institute of Enviromnental Studies. Japan. October 2006.
126
n - accumulation rate (taken at 23.2% in 2015-2050108),
Lt and Lt+i - number of employed in the current and projection periods;
MFP - multiple factor productivity growth. The MFP parameter is taken equal to 2% based on the regression analysis results109.
Multiple factor productivity dynamics. OECD projections for countries with the level of economic development similar to that of Uzbekistan were used for projections of the evolution of multiple factor productivity110. The initial value is 3%. As GDP per capita grows, it goes down to 2% by 2050, in 2012-2050 being equal on average to the value determined by the OECD for countries with a similar level of development.
Elasticity coefficients 0.3 and 0.7 are also obtained based on the results of the regression analysis of the GDP function of capital and labor in 2000-2010111. Labor projection builds on the UN projection of population for the 15-59 year-olds category.
Future individual consumption, investments in fixed assets and investments in housing construction until 2050 are calculated based on the GDP projection.
Housing commissioning until 2050 is estimated based on the projection of housing construction investments and retrospective data on the housing commissioning in 2000-2011. The housing construction costs per 1 m2 in 2000-2011 is calculated using the housing construction investments to housing commissioning ratio, which is taken constant until 2050.
The following methodology was used to assess the housing purchase ability of the population. In order to assess the amount that the population can spend to improve the housing conditions, the model uses the ratio of housing purchase costs to the household consumption. The 5% estimate was obtained for Uzbekistan as the share of the total costs of housing purchased in 2010 (which is the sum of the construction costs and a 40% markup) in the household consumption. In 2011- 2025, the share of housing purchase costs is taken constant with a subsequent 1.005-fold annual growth. Then the share of housing purchase costs will equal 5.6% by 2050.
The costs of housing purchase per 1 m2 in 2011-2050 is estimated based on the housing construction costs and a 40% markup. The ability of the population to buy new housing is estimated as the ratio of potential purchase costs and the price of 1 m2
108 Such assumption builds on the accumulation rate values in 2000-2010 and is supported in PwC Economics (World in 2050. The BRICs and beyond: prospects, challenges and opportunities. January 2013, 130107-105940- ET-OS), where accumulation rates of around 20% are taken for India, Indonesia, China, and Malaysia.109 In its projection until 2060 OECD provides the MFP parameter close to this value for many countries. See OECD. (2012). Looking to 2060: Long-term global growth prospects. A going for growth report. The 2% value also corresponds to the analysis presented in the report by the Institute for projections and macroeconomic research titled “Major findings of the World Bank presentation “Uzbekistan growth and development sources: historical and perspective” and their importance for Uzbekistan” presented at the Uzbekistan Vision 2030 round table in Tashkent, November 12-13, 2013.110 OECD, 2012 “Looking to 2060: Long-term global growth prospects”, OECD Economic Policy Paper Series, ISSN2226583X.111 O. Lugovoi and R. Entov in Chapter “Growth trends in Russia after 1998” of the book “A Look at the Past” use 0.4 and 0.6 as exogenous factor shares for capital and labor respectively for the decomposition analysis of Russia’s GDP growth referring to a similar assumption by Bosworth and Collins for China and India (Bosworth, B. and S. Collins. 2007. “Accounting Growth: Comparing China and India,” NBER Working Paper 12943).
127

128
Attachment 2. Foreign experience in promoting enerqv efficiency in buildingsA large experience in implementing energy efficiency policies in buildings has been accumulated by many countries in the recent 40 years. Up to 38 policies in the residential sector are being implemented in some of the EU countries, the average being around 10 policies per country (Fig. A2-1), and up to 43 policies in the commercial sector (Fig. A2-2).
The major energy efficiency policies in the buildings sector include:
• energy efficiency requirements in the building codes;
• mandatory standards for the energy efficiency of appliances;
• buildings and equipment certification and labeling;
• federal procurement of only efficient buildings and equipment;
• energy service contracts;
• energy efficiency improvement by utilities through integrated resource planning, demandmanagement, white certificates and energy efficiency resource standards;
• energy service financing;
• preferential loan programs, including preferential mortgage schemes for energy efficientbuildings and “green” buildings;
• federal subsidies;
• tax benefits;
• public-private partnerships in the development and market penetration of newtechnologies;
• housing stock inventory and improvement of statistics;
• energy audits;
• information campaigns.
129
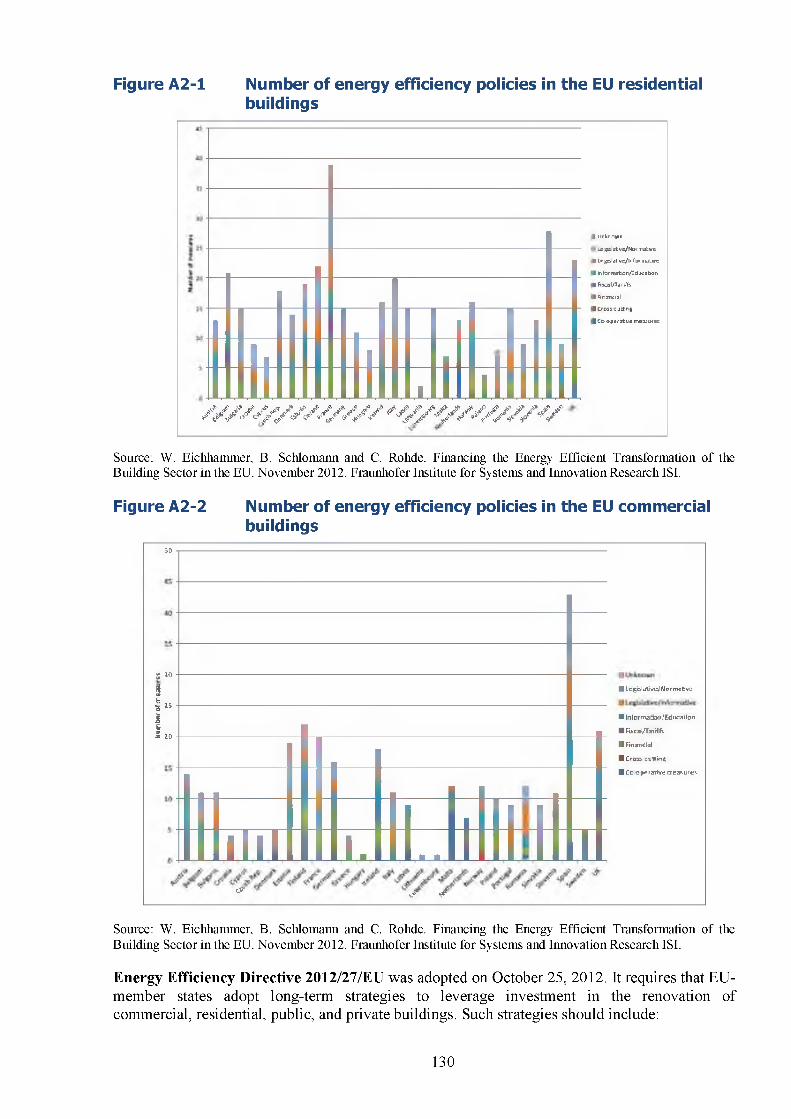
Figure A2-1 Number of energy efficiency policies in the EU residentialbuildings
1 a
1 1 1 1 ll/ / / / / / / / / / / / / / f s / / s / / / / / f / s /
il Jnkrown .cjftslati vc/Nor matftr*
■ Lcpslartiv c / l n fo rm ative
■ rformstion/Tducaoon
■ Hbcal/Tarrfs
■ financial
■ Cross cutting
I Co operative measures
Source: W. Eichhammer, B. Sclilomann and C. Rohde. Financing the Energy Efficient Transformation of the Building Sector in the EU. November 2012. Fraunhofer Institute for Systems and Innovation Research ISI.
Figure A2-2 Number of energy efficiency policies in the EU commercial buildings
50
S и •
I■В 25 -
■ Legislative/Nor (native
0 251 i| 20
■ InformatkMi/Ed jcation
IT t t c a lA a t i lh
■ Financial
И Crov. cutting
I Co operative measure*
g
l l l l 1 . ■ ■ ! 1
с ? <$■ ф
Source: W. Eichhammer, B. Sclilomann and C. Rohde. Financing the Energy Efficient Transformation of the Building Sector in the EU. November 2012. Fraunhofer Institute for Systems and Innovation Research ISI.
Energy Efficiency Directive 2012/27/EU was adopted on October 25, 2012. It requires that EU- member states adopt long-term strategies to leverage investment in the renovation of commercial, residential, public, and private buildings. Such strategies should include:
130
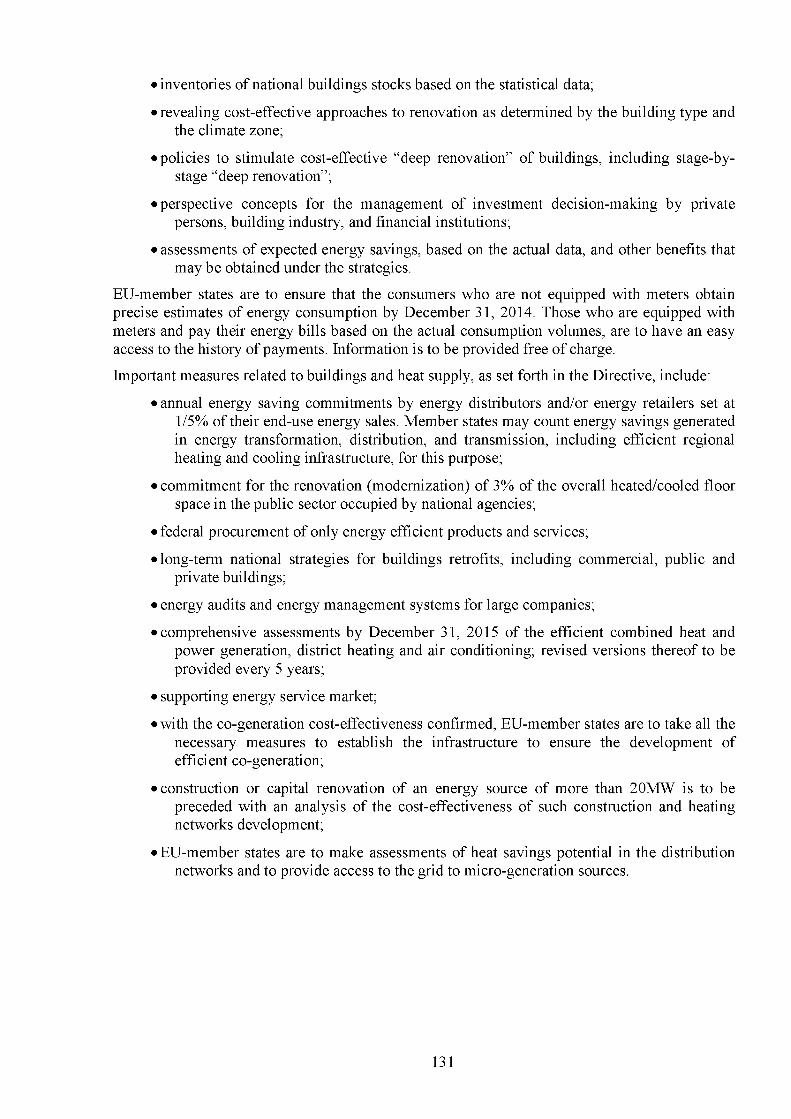
• inventories of national buildings stocks based on the statistical data;
• revealing cost-effective approaches to renovation as determined by the building type andthe climate zone;
• policies to stimulate cost-effective “deep renovation” of buildings, including stage-by-stage “deep renovation”;
• perspective concepts for the management of investment decision-making by privatepersons, building industry, and financial institutions;
• assessments of expected energy savings, based on the actual data, and other benefits thatmay be obtained under the strategies.
EU-member states are to ensure that the consumers who are not equipped with meters obtain precise estimates of energy consumption by December 31, 2014. Those who are equipped with meters and pay their energy bills based on the actual consumption volumes, are to have an easy access to the history of payments. Information is to be provided free of charge.
Important measures related to buildings and heat supply, as set forth in the Directive, include:
• annual energy saving commitments by energy distributors and/or energy retailers set at1/5% of their end-use energy sales. Member states may count energy savings generated in energy transformation, distribution, and transmission, including efficient regional heating and cooling infrastructure, for this purpose;
• commitment for the renovation (modernization) of 3% of the overall heated/cooled floorspace in the public sector occupied by national agencies;
• federal procurement of only energy efficient products and services;
• long-term national strategies for buildings retrofits, including commercial, public andprivate buildings;
• energy audits and energy management systems for large companies;
• comprehensive assessments by December 31, 2015 of the efficient combined heat andpower generation, district heating and air conditioning; revised versions thereof to be provided every 5 years;
• supporting energy service market;
• with the co-generation cost-effectiveness confirmed, EU-member states are to take all thenecessary measures to establish the infrastructure to ensure the development of efficient co-generation;
• construction or capital renovation of an energy source of more than 20MW is to bepreceded with an analysis of the cost-effectiveness of such construction and heating networks development;
• EU-member states are to make assessments of heat savings potential in the distributionnetworks and to provide access to the grid to micro-generation sources.
131
Related Documents