Climate Corps 2010: City of Raleigh Final Report Page 1 Energy Efficiency: City of Raleigh Environmental Defense Fund Climate Corps 2010 August 20th, 2010 Written by Deborah Breisblatt Duke University MEM/MBA Candidate, Class of 2012 847.691.6380 [email protected] Matt Jentgen Duke University MEM/MPP Candidate, Class of 2012 520.664.6541 [email protected]

Welcome message from author
This document is posted to help you gain knowledge. Please leave a comment to let me know what you think about it! Share it to your friends and learn new things together.
Transcript
Climate Corps 2010: City of Raleigh Final Report Page 1
Energy Efficiency: City of Raleigh Environmental Defense Fund
Climate Corps 2010 August 20th, 2010
Written by
Deborah Breisblatt Duke University MEM/MBA Candidate, Class of 2012
847.691.6380 [email protected]
Matt Jentgen Duke University MEM/MPP Candidate, Class of 2012
520.664.6541 [email protected]
Climate Corps 2010: City of Raleigh Final Report Page 2
EXECUTIVE SUMMARY
Overview
The Environmental Defense Fund Climate Corps Program places trained M.B.A., Master of Public Policy, and Master of Environmental Management fellows into businesses, universities, and local government offices across the country to identify and analyze energy efficient investments that can reduce costs and energy use. The Environmental Defense Fund (EDF) partnered with the City of Raleigh’s Office of Sustainability in North Carolina to place two Climate Corps Fellows in city departments to analyze energy efficiency projects. The City of Raleigh is the first city in the country to host EDF Climate Corps Fellows. For ten weeks, the fellows worked with city officials to identify and develop energy efficiency measures. The first six weeks were spent with the Raleigh Fire Department assessing the energy usage of all 27 firestation and the firefighter training center. The final four weeks were spent with the Facilities and Operations Division of the Raleigh Parks and Recreation Department analyzing energy efficiency investments for One Exchange Plaza, a 104,000 sq. ft. city-owned office building in downtown Raleigh.
Analysis and Results
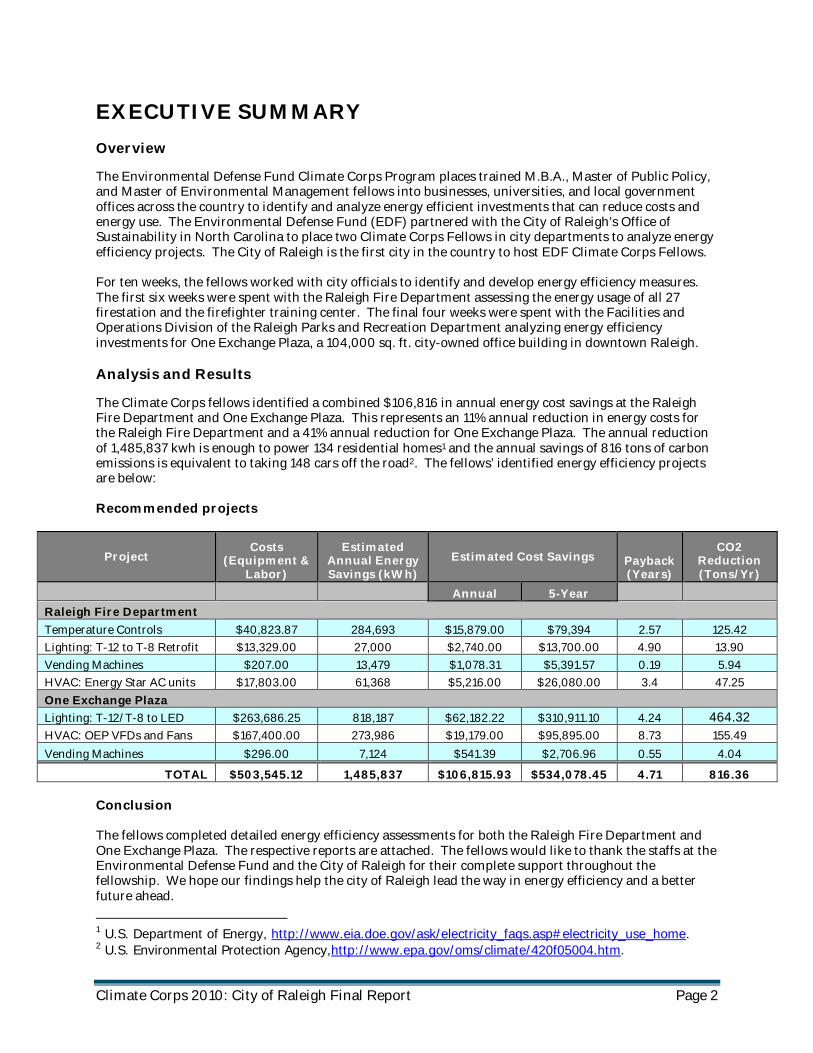
The Climate Corps fellows identified a combined $106,816 in annual energy cost savings at the Raleigh Fire Department and One Exchange Plaza. This represents an 11% annual reduction in energy costs for the Raleigh Fire Department and a 41% annual reduction for One Exchange Plaza. The annual reduction of 1,485,837 kwh is enough to power 134 residential homes1 and the annual savings of 816 tons of carbon emissions is equivalent to taking 148 cars off the road2. The fellows’ identified energy efficiency projects are below: Recommended projects
Project Costs
(Equipment & Labor)
Estimated Annual Energy Savings (kWh)
Estimated Cost Savings Payback (Years)
CO2 Reduction (Tons/Yr)
Annual 5-Year
Raleigh Fire Department
Temperature Controls $40,823.87 284,693 $15,879.00 $79,394 2.57 125.42
Lighting: T-12 to T-8 Retrofit $13,329.00 27,000 $2,740.00 $13,700.00 4.90 13.90
Vending Machines $207.00 13,479 $1,078.31 $5,391.57 0.19 5.94
HVAC: Energy Star AC units $17,803.00 61,368 $5,216.00 $26,080.00 3.4 47.25
One Exchange Plaza
Lighting: T-12/T-8 to LED $263,686.25 818,187 $62,182.22 $310,911.10 4.24 464.32 HVAC: OEP VFDs and Fans $167,400.00 273,986 $19,179.00 $95,895.00 8.73 155.49
Vending Machines $296.00 7,124 $541.39 $2,706.96 0.55 4.04
TOTAL $503,545.12 1,485,837 $106,815.93 $534,078.45 4.71 816.36 Conclusion The fellows completed detailed energy efficiency assessments for both the Raleigh Fire Department and One Exchange Plaza. The respective reports are attached. The fellows would like to thank the staffs at the Environmental Defense Fund and the City of Raleigh for their complete support throughout the fellowship. We hope our findings help the city of Raleigh lead the way in energy efficiency and a better future ahead.
1 U.S. Department of Energy, http://www.eia.doe.gov/ask/electricity_faqs.asp#electricity_use_home. 2 U.S. Environmental Protection Agency,http://www.epa.gov/oms/climate/420f05004.htm.

Climate Corps 2010: City of Raleigh Fire Department Final Report Page 1
Energy Efficiency: City of Raleigh Fire Department
Environmental Defense Fund Climate Corps 2010
August 3rd, 2010
Written by
Deborah Breisblatt Duke University MEM/MBA Candidate, Class of 2012
847.691.6380 [email protected]
Matt Jentgen Duke University MEM/MPP Candidate, Class of 2012
520.664.6541 [email protected]
Climate Corps 2010: City of Raleigh Fire Department Final Report Page 2
TABLE OF CONTENTS
EXECUTIVE SUMMARY ....................................................................................................................3 Overview........................................................................................................................................3 Analysis and Results .......................................................................................................................3 Barriers..........................................................................................................................................4 Recommendations and Action Plan..................................................................................................4
OVERVIEW AND BACKGROUND.......................................................................................................5 RECOMMENDED ENERGY EFFICIENCY PROJECTS AND ACTIONS ..................................................7 Project 1 – Temperature Controls ....................................................................................................7 Basic Project Information............................................................................................................7 Project Summary ........................................................................................................................7 Financial Analysis.......................................................................................................................8 Recommendations ....................................................................................................................10
Project 2 – Lighting Retrofit: T12 to T8 ..........................................................................................11 Basic Project Information..........................................................................................................11 Project Summary ......................................................................................................................12 Financial Analysis.....................................................................................................................12 Recommendations ....................................................................................................................13
Project 3 – Vending Machines .......................................................................................................13 Basic Project Information..........................................................................................................13 Project Summary ......................................................................................................................14 Financial Analysis.....................................................................................................................14 Recommendations ....................................................................................................................16
Project 4 – Energy Star AC Units ...................................................................................................16 Basic Project Information..........................................................................................................16 Project Summary ......................................................................................................................16 Financial Analysis.....................................................................................................................17 Recommendations ....................................................................................................................17
HVAC Maintenance Schedule ........................................................................................................17 Summary of Energy Efficiency Projects ..........................................................................................21 Action Plan & Timeline .................................................................................................................21
OVERCOMING BARRIERS TO ENERGY EFFICIENCY ......................................................................22 Barriers........................................................................................................................................22 Recommended Strategies for Overcoming Barriers .........................................................................23 Lessons from Overcoming Barriers ................................................................................................23
CONCLUSIONS AND RECOMMENDED NEXT STEPS.......................................................................24
Climate Corps 2010: City of Raleigh Fire Department Final Report Page 3
EXECUTIVE SUMMARY
Overview
The Environmental Defense Fund Climate Corps Program places trained M.B.A., Master of Public Policy, and Master of Environmental Management fellows into businesses, universities, and local government offices across the country to identify and analyze energy efficient investments that can reduce costs and energy use. The Environmental Defense Fund (EDF) partnered with the City of Raleigh in North Carolina to place two Climate Corps Fellows in the Raleigh Fire Department to analyze the energy consumption of the department’s fire stations and identify cost-effective energy efficiency improvements. The City of Raleigh is the first city in the country to host EDF Climate Corps Fellows. Efforts to reduce energy consumption will not only reduce the Fire Department’s operating expenses, but also provide positive recognition for the Fire Department and the City of Raleigh. Cities and Fire Departments around the state are already using the City of Raleigh and the Raleigh Fire Department as a template to initiate their own energy efficiency measures.
Analysis and Results
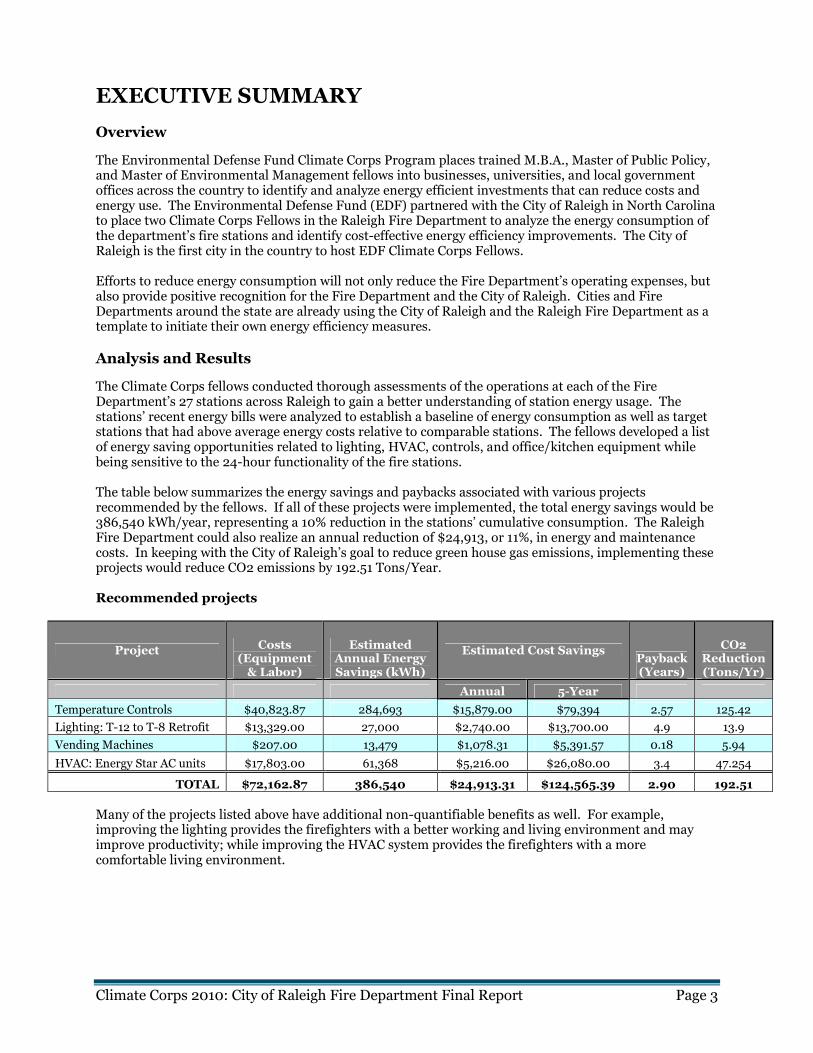
The Climate Corps fellows conducted thorough assessments of the operations at each of the Fire Department’s 27 stations across Raleigh to gain a better understanding of station energy usage. The stations’ recent energy bills were analyzed to establish a baseline of energy consumption as well as target stations that had above average energy costs relative to comparable stations. The fellows developed a list of energy saving opportunities related to lighting, HVAC, controls, and office/kitchen equipment while being sensitive to the 24-hour functionality of the fire stations. The table below summarizes the energy savings and paybacks associated with various projects recommended by the fellows. If all of these projects were implemented, the total energy savings would be 386,540 kWh/year, representing a 10% reduction in the stations’ cumulative consumption. The Raleigh Fire Department could also realize an annual reduction of $24,913, or 11%, in energy and maintenance costs. In keeping with the City of Raleigh’s goal to reduce green house gas emissions, implementing these projects would reduce CO2 emissions by 192.51 Tons/Year. Recommended projects
Project Costs (Equipment & Labor)
Estimated Annual Energy Savings (kWh)
Estimated Cost Savings Payback (Years)
CO2 Reduction (Tons/Yr)
Annual 5-Year
Temperature Controls $40,823.87 284,693 $15,879.00 $79,394 2.57 125.42
Lighting: T-12 to T-8 Retrofit $13,329.00 27,000 $2,740.00 $13,700.00 4.9 13.9
Vending Machines $207.00 13,479 $1,078.31 $5,391.57 0.18 5.94
HVAC: Energy Star AC units $17,803.00 61,368 $5,216.00 $26,080.00 3.4 47.254
TOTAL $72,162.87 386,540 $24,913.31 $124,565.39 2.90 192.51
Many of the projects listed above have additional non-quantifiable benefits as well. For example, improving the lighting provides the firefighters with a better working and living environment and may improve productivity; while improving the HVAC system provides the firefighters with a more comfortable living environment.
Climate Corps 2010: City of Raleigh Fire Department Final Report Page 4
Barriers
Financial The Raleigh Fire Department is a city-funded, public department. It is given a strict annual budget sanctioned by the City of Raleigh in which to operate, making it difficult to finance projects that are not in the current budget. In addition, any money not used or saved by the department during a given fiscal year must be returned to the city’s budget. This makes the consideration and approval of energy efficiency projects difficult because the department has little incentive to make the potential upfront investments for efficiency improvements if no savings can be kept. Furthermore, the department’s limited budget is justifiably prioritized for fire fighting and fire rescue related expenses, to better serve the department’s core mission. Department Structure Given its 24-hour functionality, the Fire Department is one of the only city departments where the buildings are managed by a services staff within the department and not by the city’s Facilities and Operations Division. While the services staff is knowledgeable about the stations’ operations, there is no dedicated trained staff member equipped to manage the electrical and mechanical systems or keep an inventory of the equipment for life-cycle analyses, resulting in old and inefficient systems. Workplace Culture The fire station is a residence that operates 24 hours a day, year-round. Firefighters eat, sleep, and bathe at the station, which substitutes for home. However, unlike home, the firefighters never see the energy bills and therefore are not incentivized to turn-off lights, adjust the thermostats, or turn down the temperature on the water heater. Even though there is a department policy to set the thermostats to certain set-points depending on the season, the policy is rarely followed, which leads to inefficiently run or broken HVAC equipment.
Recommendations and Action Plan
The recommended projects above, which are described in more detail in the rest of the report, will decrease energy use, reduce maintenance costs and improve the overall functionality at each fire station. The thermostat controls, lighting, and vending machine projects should be implemented as soon as possible to capture maximum savings and utilize available utility rebates. The Energy Star AC unit project, which also qualifies for utility rebates, should be implemented when the older units fail and need to be replaced. This report also identifies other actions that will improve the condition of the fire stations and the health and safety of the firefighters. A preventative HVAC maintenance plan will ensure that the AC units function efficiently at little cost. Weatherization of windows and doors will result in better insulated stations and more comfortable living environments. Reducing the water heater temperature settings will trim energy costs and prevent scalding temperatures. Replacing open-top cooking ranges that have exceeded their useful life will prevent natural gas leakages in living spaces and eliminate the energy cost of constantly burning pilot lights. The maintenance plan, weatherization of the stations, and reducing the water heater temperature settings should be implemented as soon as possible to achieve instant savings. Replacing the cooking ranges is a long-term project that will ensure a healthier and safer environment for the firefighters. We want to thank the Raleigh Fire Department for their openness and kindness. From Fire Chief John McGrath to each firefighter, we were granted total access to their facilities and personnel that allowed for a complete and thorough energy efficiency assessment. We hope this report will provide insight and guidance as the Raleigh Fire Department reaches new levels of sustainability.
Climate Corps 2010: City of Raleigh Fire Department Final Report Page 5
OVERVIEW AND BACKGROUND The City of Raleigh launched an Office of Sustainability in 2008 to responsibly address environmental and energy issues for a growing municipality. The Office of Sustainability has initiated projects that fund energy efficiency projects, inventory greenhouse gas emissions, develop an electric car program and create a green jobs training program. The Office has now partnered with the Raleigh Fire Department, in an unprecedented effort, to analyze and recommend energy efficiency projects for its fire stations. Raleigh Fire Chief, John McGrath, aspires to have the “greenest” fire department in the country. He believes that being environmentally responsible is not only the right thing to do, but is also a means to achieve financial savings in a tight budgetary economy. Already, under Chief McGrath’s leadership, the Raleigh Fire Department and the City of Raleigh have blazed the trail for energy and resource conservation at its fire stations. One station utilizes a solar thermal water heater to trim natural gas usage, while another station boasts a green roof that improves insulation and reduces storm water runoff. A number of stations have installed rainwater catchment systems that allow firefighters to wash their fire trucks with captured rainwater. This project focused on energy efficiency assessments of 27 Raleigh fire stations across the metro area. The buildings vary tremendously in scale and condition. The oldest station was built in 1949 while the newest station was completed in 2007. The smallest station is 3,564 sq. ft. while the largest is 11,200 sq. ft. Figure 1 is an energy profile of all the fire stations analyzed during this project.
Climate Corps 2010: City of Raleigh Fire Department Final Report Page 6
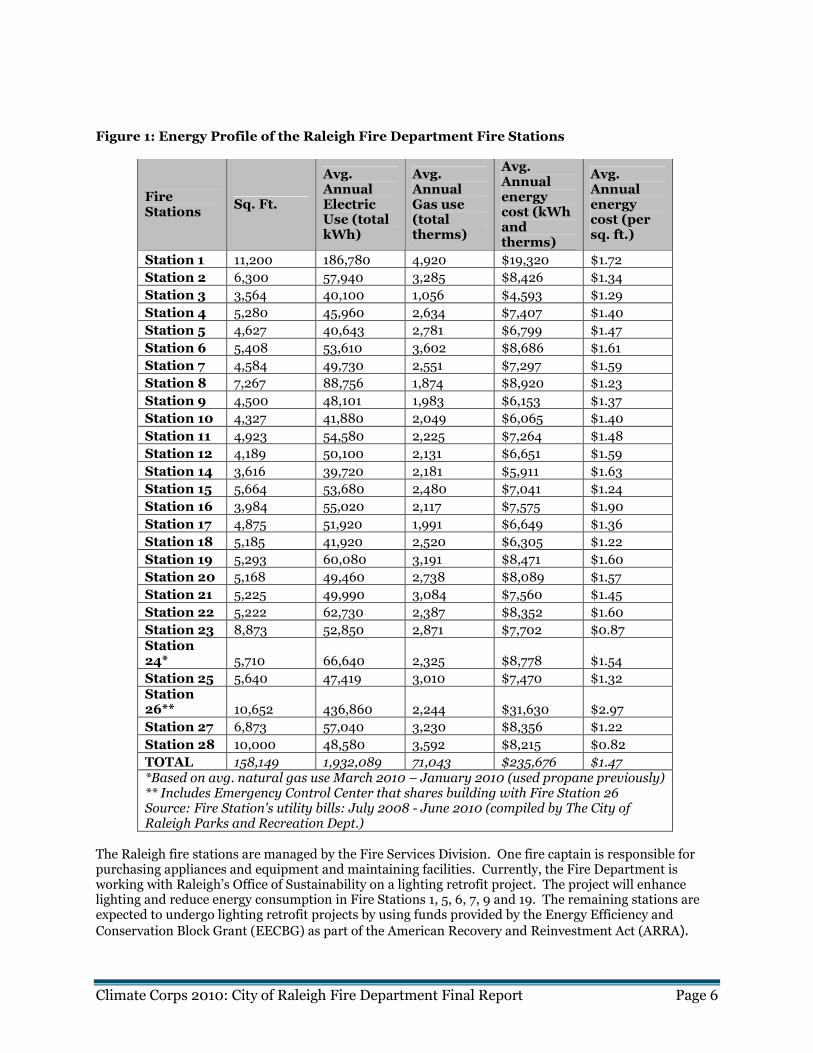
Figure 1: Energy Profile of the Raleigh Fire Department Fire Stations
Fire Stations
Sq. Ft.
Avg. Annual Electric Use (total kWh)
Avg. Annual Gas use (total therms)
Avg. Annual energy cost (kWh and therms)
Avg. Annual energy cost (per sq. ft.)
Station 1 11,200 186,780 4,920 $19,320 $1.72
Station 2 6,300 57,940 3,285 $8,426 $1.34
Station 3 3,564 40,100 1,056 $4,593 $1.29
Station 4 5,280 45,960 2,634 $7,407 $1.40
Station 5 4,627 40,643 2,781 $6,799 $1.47
Station 6 5,408 53,610 3,602 $8,686 $1.61
Station 7 4,584 49,730 2,551 $7,297 $1.59
Station 8 7,267 88,756 1,874 $8,920 $1.23
Station 9 4,500 48,101 1,983 $6,153 $1.37
Station 10 4,327 41,880 2,049 $6,065 $1.40
Station 11 4,923 54,580 2,225 $7,264 $1.48
Station 12 4,189 50,100 2,131 $6,651 $1.59
Station 14 3,616 39,720 2,181 $5,911 $1.63
Station 15 5,664 53,680 2,480 $7,041 $1.24
Station 16 3,984 55,020 2,117 $7,575 $1.90
Station 17 4,875 51,920 1,991 $6,649 $1.36
Station 18 5,185 41,920 2,520 $6,305 $1.22
Station 19 5,293 60,080 3,191 $8,471 $1.60
Station 20 5,168 49,460 2,738 $8,089 $1.57
Station 21 5,225 49,990 3,084 $7,560 $1.45
Station 22 5,222 62,730 2,387 $8,352 $1.60
Station 23 8,873 52,850 2,871 $7,702 $0.87 Station 24* 5,710 66,640 2,325 $8,778 $1.54
Station 25 5,640 47,419 3,010 $7,470 $1.32 Station 26** 10,652 436,860 2,244 $31,630 $2.97
Station 27 6,873 57,040 3,230 $8,356 $1.22
Station 28 10,000 48,580 3,592 $8,215 $0.82
TOTAL 158,149 1,932,089 71,043 $235,676 $1.47 *Based on avg. natural gas use March 2010 – January 2010 (used propane previously) ** Includes Emergency Control Center that shares building with Fire Station 26 Source: Fire Station's utility bills: July 2008 - June 2010 (compiled by The City of Raleigh Parks and Recreation Dept.)
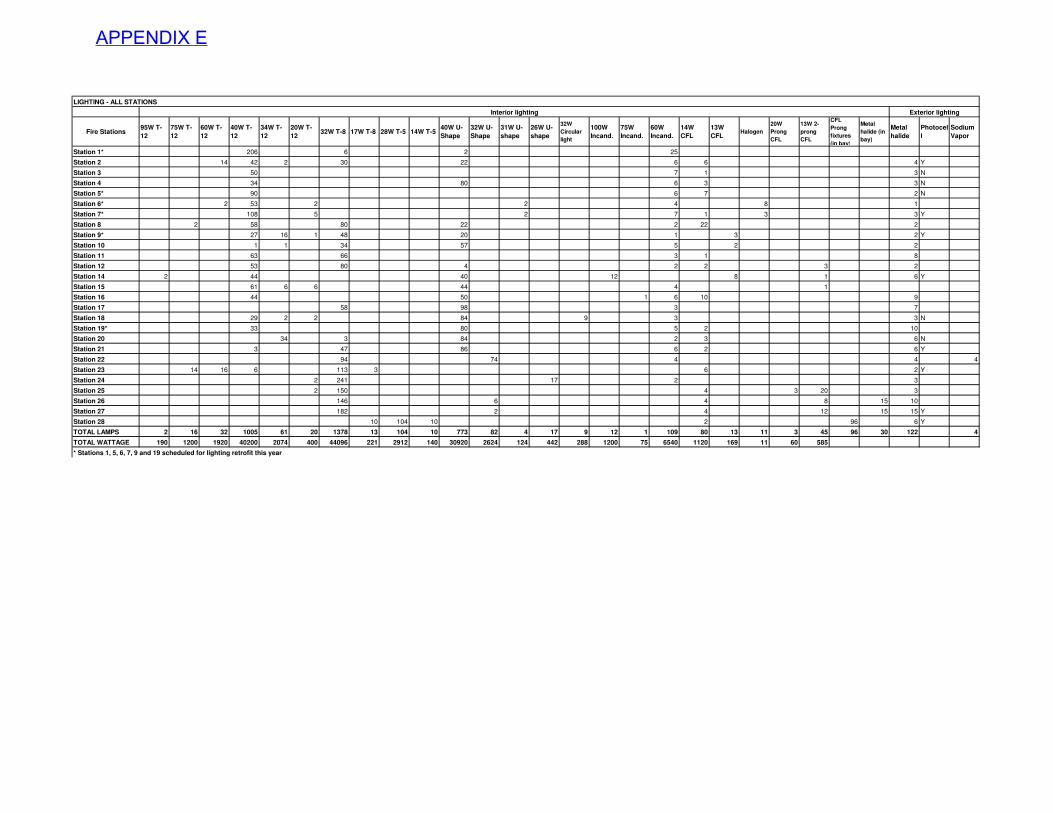
The Raleigh fire stations are managed by the Fire Services Division. One fire captain is responsible for purchasing appliances and equipment and maintaining facilities. Currently, the Fire Department is working with Raleigh’s Office of Sustainability on a lighting retrofit project. The project will enhance lighting and reduce energy consumption in Fire Stations 1, 5, 6, 7, 9 and 19. The remaining stations are expected to undergo lighting retrofit projects by using funds provided by the Energy Efficiency and
Conservation Block Grant (EECBG) as part of the American Recovery and Reinvestment Act (ARRA).
Climate Corps 2010: City of Raleigh Fire Department Final Report Page 7
RECOMMENDED ENERGY EFFICIENCY PROJECTS AND ACTIONS
Project 1 – Temperature Controls
Basic Project Information
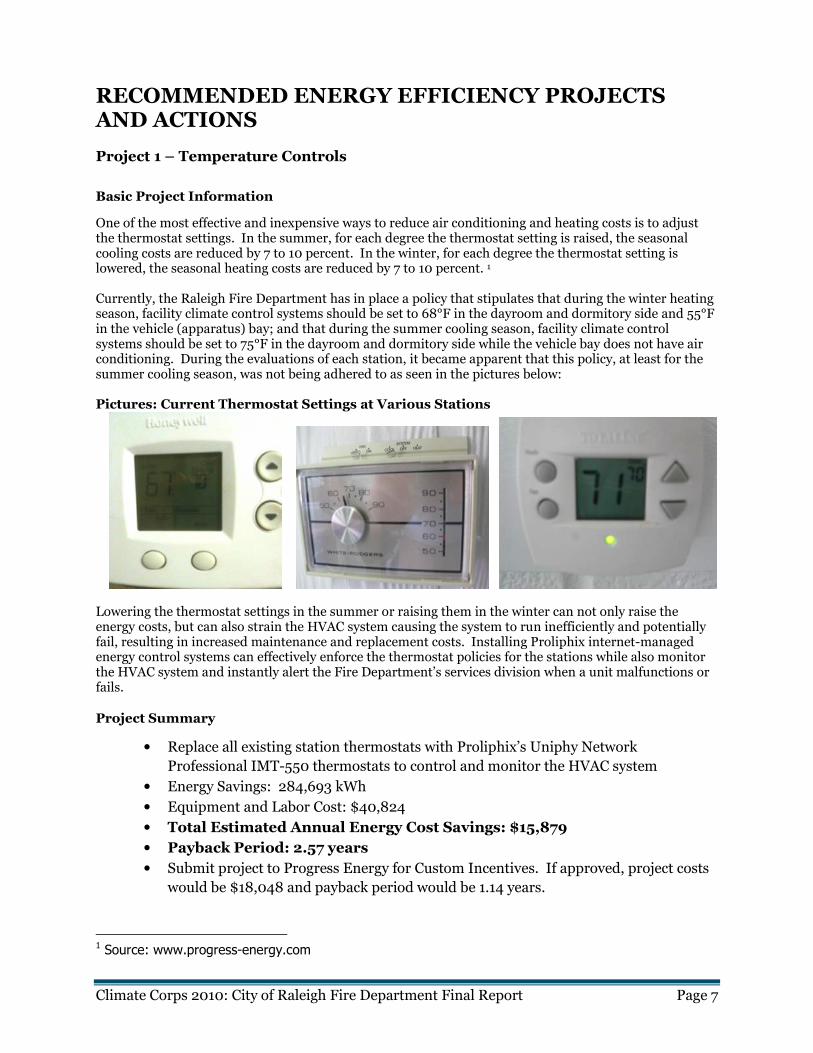
One of the most effective and inexpensive ways to reduce air conditioning and heating costs is to adjust the thermostat settings. In the summer, for each degree the thermostat setting is raised, the seasonal cooling costs are reduced by 7 to 10 percent. In the winter, for each degree the thermostat setting is lowered, the seasonal heating costs are reduced by 7 to 10 percent. 1 Currently, the Raleigh Fire Department has in place a policy that stipulates that during the winter heating season, facility climate control systems should be set to 68°F in the dayroom and dormitory side and 55°F in the vehicle (apparatus) bay; and that during the summer cooling season, facility climate control systems should be set to 75°F in the dayroom and dormitory side while the vehicle bay does not have air conditioning. During the evaluations of each station, it became apparent that this policy, at least for the summer cooling season, was not being adhered to as seen in the pictures below: Pictures: Current Thermostat Settings at Various Stations
Lowering the thermostat settings in the summer or raising them in the winter can not only raise the energy costs, but can also strain the HVAC system causing the system to run inefficiently and potentially fail, resulting in increased maintenance and replacement costs. Installing Proliphix internet-managed energy control systems can effectively enforce the thermostat policies for the stations while also monitor the HVAC system and instantly alert the Fire Department’s services division when a unit malfunctions or fails.
Project Summary
• Replace all existing station thermostats with Proliphix’s Uniphy Network
Professional IMT-550 thermostats to control and monitor the HVAC system
• Energy Savings: 284,693 kWh
• Equipment and Labor Cost: $40,824
• Total Estimated Annual Energy Cost Savings: $15,879
• Payback Period: 2.57 years
• Submit project to Progress Energy for Custom Incentives. If approved, project costs
would be $18,048 and payback period would be 1.14 years.
1 Source: www.progress-energy.com
Climate Corps 2010: City of Raleigh Fire Department Final Report Page 8
0
100,000
200,000
300,000
400,000
500,000
1 2 3 4 5 6 7 8 9 10 11 12 13 14 15 16 17 18 19 20 21 22 23 24 25 26 27
Station number
kW
h Current AnnualElectric + Heat(kWh)
Proposed AnnualElectric + Heat(kWh)
Financial Analysis
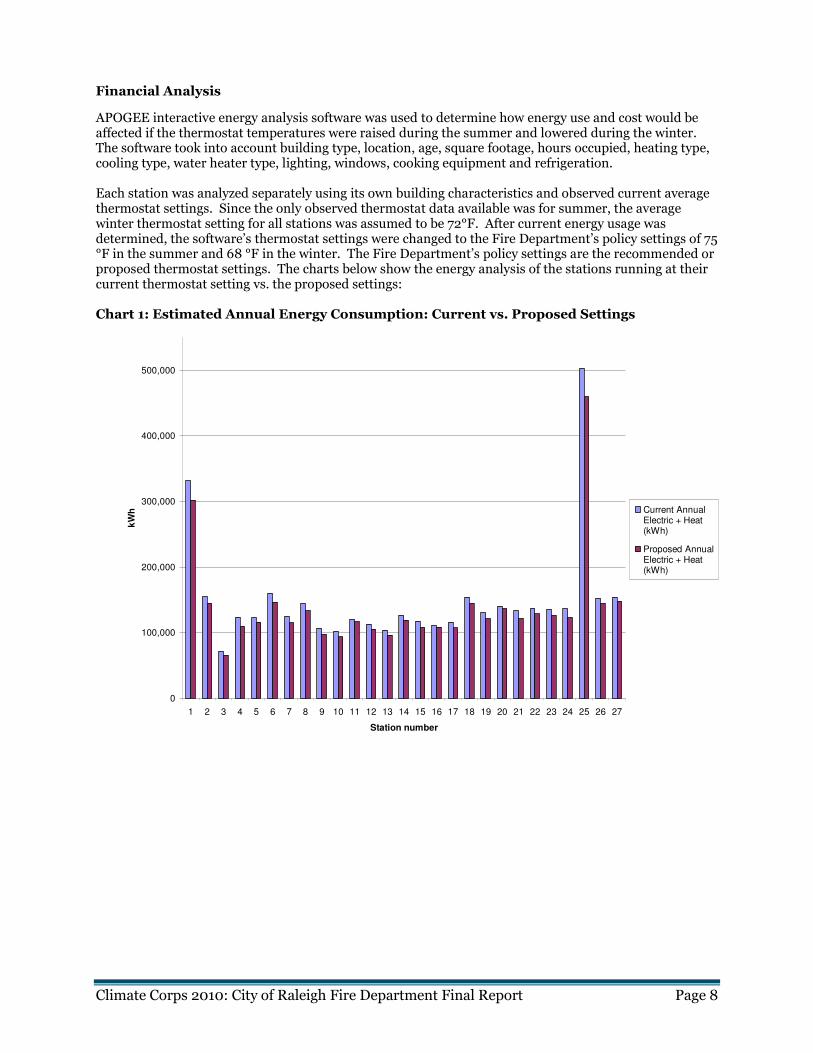
APOGEE interactive energy analysis software was used to determine how energy use and cost would be affected if the thermostat temperatures were raised during the summer and lowered during the winter. The software took into account building type, location, age, square footage, hours occupied, heating type, cooling type, water heater type, lighting, windows, cooking equipment and refrigeration. Each station was analyzed separately using its own building characteristics and observed current average thermostat settings. Since the only observed thermostat data available was for summer, the average winter thermostat setting for all stations was assumed to be 72°F. After current energy usage was determined, the software’s thermostat settings were changed to the Fire Department’s policy settings of 75 °F in the summer and 68 °F in the winter. The Fire Department’s policy settings are the recommended or proposed thermostat settings. The charts below show the energy analysis of the stations running at their current thermostat setting vs. the proposed settings: Chart 1: Estimated Annual Energy Consumption: Current vs. Proposed Settings
Climate Corps 2010: City of Raleigh Fire Department Final Report Page 9
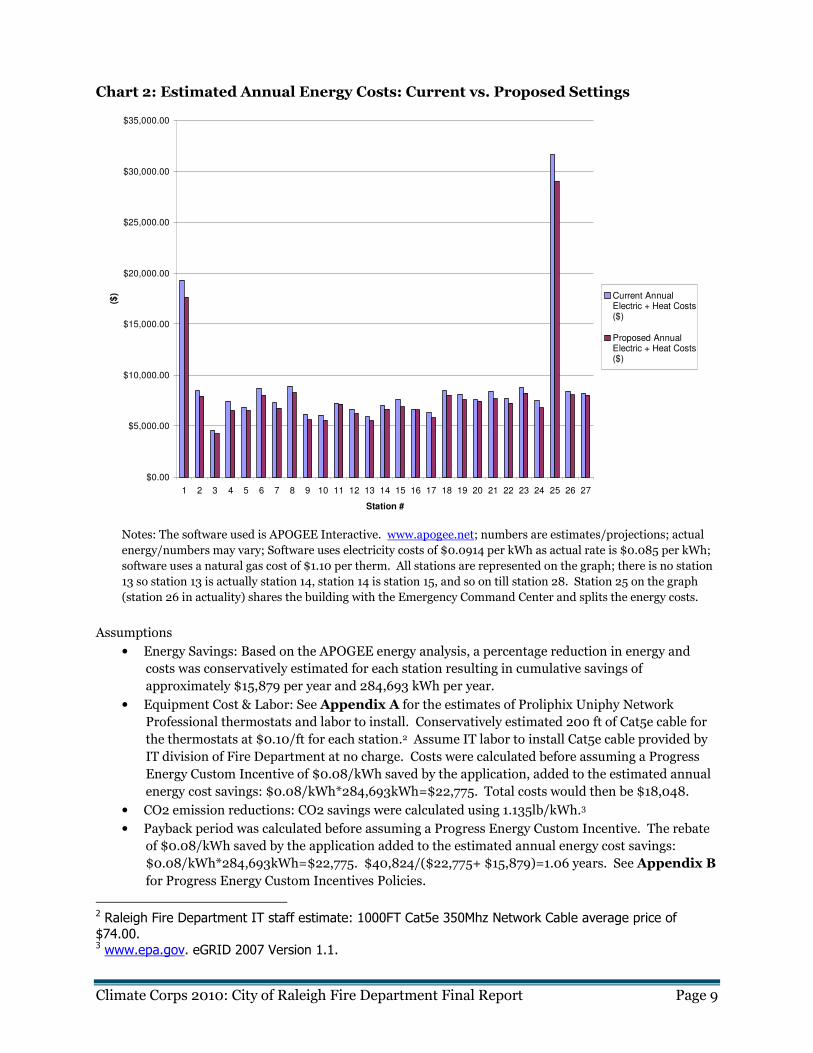
Chart 2: Estimated Annual Energy Costs: Current vs. Proposed Settings
$0.00
$5,000.00
$10,000.00
$15,000.00
$20,000.00
$25,000.00
$30,000.00
$35,000.00
1 2 3 4 5 6 7 8 9 10 11 12 13 14 15 16 17 18 19 20 21 22 23 24 25 26 27
Station #
($) Current Annual
Electric + Heat Costs($)
Proposed AnnualElectric + Heat Costs($)
Notes: The software used is APOGEE Interactive. www.apogee.net; numbers are estimates/projections; actual
energy/numbers may vary; Software uses electricity costs of $0.0914 per kWh as actual rate is $0.085 per kWh;
software uses a natural gas cost of $1.10 per therm. All stations are represented on the graph; there is no station
13 so station 13 is actually station 14, station 14 is station 15, and so on till station 28. Station 25 on the graph
(station 26 in actuality) shares the building with the Emergency Command Center and splits the energy costs.
Assumptions
• Energy Savings: Based on the APOGEE energy analysis, a percentage reduction in energy and
costs was conservatively estimated for each station resulting in cumulative savings of
approximately $15,879 per year and 284,693 kWh per year.
• Equipment Cost & Labor: See Appendix A for the estimates of Proliphix Uniphy Network
Professional thermostats and labor to install. Conservatively estimated 200 ft of Cat5e cable for
the thermostats at $0.10/ft for each station.2 Assume IT labor to install Cat5e cable provided by
IT division of Fire Department at no charge. Costs were calculated before assuming a Progress
Energy Custom Incentive of $0.08/kWh saved by the application, added to the estimated annual
energy cost savings: $0.08/kWh*284,693kWh=$22,775. Total costs would then be $18,048.
• CO2 emission reductions: CO2 savings were calculated using 1.135lb/kWh.3
• Payback period was calculated before assuming a Progress Energy Custom Incentive. The rebate
of $0.08/kWh saved by the application added to the estimated annual energy cost savings:
$0.08/kWh*284,693kWh=$22,775. $40,824/($22,775+ $15,879)=1.06 years. See Appendix B
for Progress Energy Custom Incentives Policies.
2 Raleigh Fire Department IT staff estimate: 1000FT Cat5e 350Mhz Network Cable average price of $74.00. 3 www.epa.gov. eGRID 2007 Version 1.1.
Climate Corps 2010: City of Raleigh Fire Department Final Report Page 10
Recommendations
As the energy analyses show, significant energy savings and costs can be achieved by raising the thermostats in the summer and lowering them in winter using thermostat controls. The fellows recommend replacing all the thermostats at each station with Proliphix’s Uniphy Network Professional thermostats to improve HVAC control and reduce energy costs. Other thermostat control ideas were evaluated, but none of them could offer the enforcement and monitoring capabilities of Proliphix’s Uniphy Network Professional thermostats. Easy Application Proliphix’s Uniphy Network Professional thermostats feature standard Internet browser-based configuration and control over a secure Ethernet connection. A member of the Fire Department services division can remotely control and monitor the HVAC systems of all the fire stations from one location. The thermostats deliver e-mail status and alerts to any personal computer or mobile text messaging device so the services staff can diagnose small problems before the firefighters even notice, saving valuable time and potential transportation costs. Proliphix thermostats do not require any proprietary software and the Fire Department’s IT staff can use basic Cat5e cable to connect the thermostats to the pre-existing wired LAN environment in each station, see Appendix C for more detail. The thermostat management interface on the Internet is configured to clearly display the current most important status and settings of the thermostats. A representative from Proliphix can provide set-up instructions to ensure the services staff uses the features to monitor the HVAC systems properly. Relevance to Fire Stations Climate controlled systems can unlock significant energy savings by taking advantage of the firefighters’ typical routine. The majority of a firefighter’s day, from 8am to 8pm, is spent on one side of the fire station, the dayroom; while the time from 8pm to 8am is spent on the dormitory side. By adjusting the temperature settings of the unoccupied areas, a Proliphix system can utilize the firefighters’ typical routine so that the dormitory is not cooled so much in the day; and conversely, the dayroom is not cooled so much at night. Capabilities One of the key capabilities of the Proliphix Network Professional thermostats is the keypad lockout with override buttons. The keypad lockout enables the services staff to remotely set the thermostats to the recommended/policy settings and remove the ability to change those settings. This lockout capability enforces the recommended/policy settings and prevents the firefighters from overworking the HVAC systems. The thermostats can also provide set-point override limits that allow for small increases and decreases in the recommended thermostat settings allowing firefighters to adjust the thermostats a limited number of degrees for a limited time before being automatically set-back to the original set-points. Being able to enforce the recommended/policy settings translates into reducing energy and maintenance costs while lengthening the lifespan of the current HVAC systems. Case Study The Raleigh Fire Department would not be the only first-responders to have implemented Proliphix internet managed energy control systems. Cataldo Ambulance Service, Inc. of Boston installed Proliphix Network thermostats in fourteen separate Boston area locations to monitor and control energy use and reduce green house gas emissions. Chris Coleman, Cataldo’s Director of Information, said that Proliphix has lowered Cataldo’s energy consumption and had a positive effect on the company’s energy bill. For a case study of Cataldo’s implementation of Proliphix thermostats, see Appendix D. Potential Rebates The fellows also recommend that this project be submitted as soon as possible to qualify for Progress Energy’s Custom Incentive of $0.08/kWh, applied to the energy saved. If the project is approved by
Climate Corps 2010: City of Raleigh Fire Department Final Report Page 11
Progress Energy, total costs would be reduced to $18,048 and payback period would be reduced to 1.14 years. Long Term Strategies In the long term, consider hiring a trained specialist to manage the stations energy usage and operations or consult with the City’s Facilities and Operations staff regarding equipment purchasing, maintenance, and system improvements. Additional Considerations In addition to controlling the thermostat settings at all the stations, the fellows recommend weatherizing the window and door frames of all the stations to ensure that cooled or heated air does not escape. This can be a cost-effective way to reduce the need to increase or decrease the thermostat settings as well as provide a more comfortable living environment.
Project 2 – Lighting Retrofit: T12 to T8
Basic Project Information
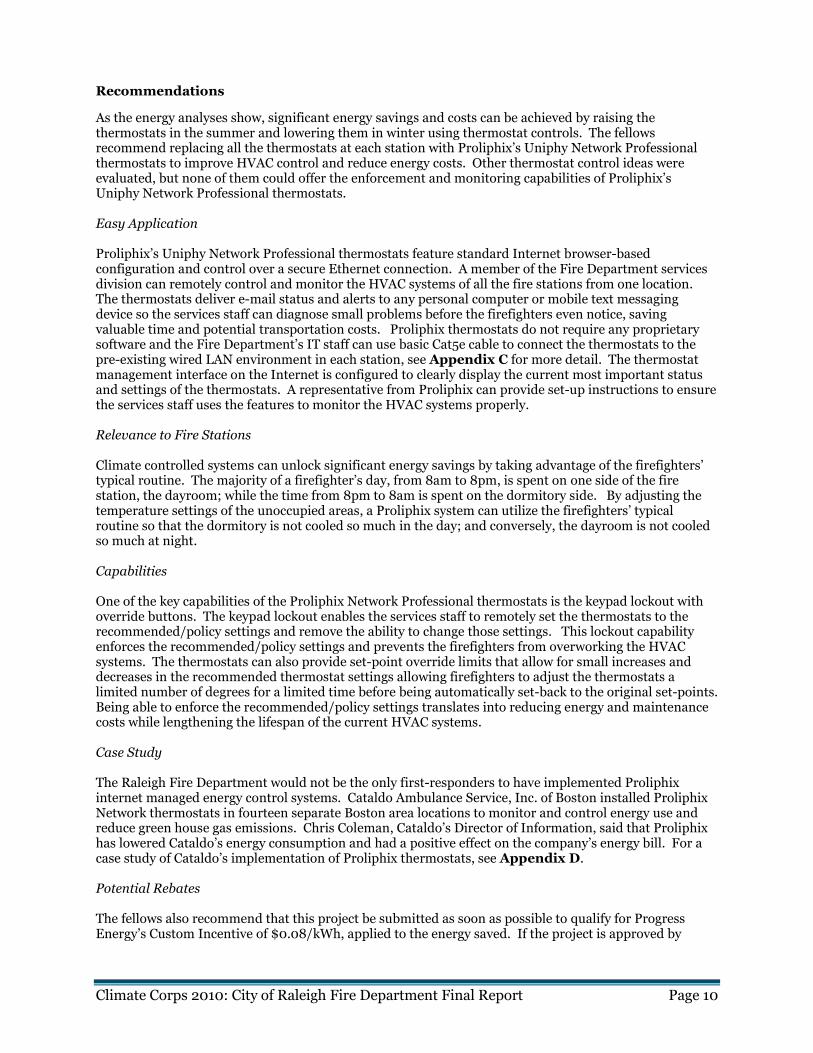
Currently, the Raleigh Fire Department utilizes approximately 1,778 T12 40-watt fluorescent lamps to provide the majority of lighting inside the stations; see Appendix E for Fire Station lighting inventory. The lamps are installed in three areas in the fire station: the dayroom (lounge and office, kitchen, dining area), the vehicle bay, and the dormitory (sleep area, shower, and bathroom). The lighting remains on most of the day in the dayroom side, intermittently day and night in the vehicle bays, and then is turned on during the evenings in the dormitory side. It is estimated these lights are operating about 8 hours per day. Replacing T12 lighting with T8 lighting will reduce energy, maintenance and replacement costs. T12 lighting is less durable and requires more electricity to function. The ballast, which controls the energy charge to the light, of a T12 lamp also requires more energy and is less durable than a T8 ballast. According to Reliant Energy, T8 lighting is 30% more efficient than T12 lighting. Below is a photo comparison of a T12 and T8 lamp: Pictures: Comparison of T-12 and T-8 Lighting
T12 lamp: Typically consumes 40 watts with a magnetic ballast that consumes 12 watts T8 lamp: Typically consumes 32 watts with an electronic ballast that consumes 8 watts

Climate Corps 2010: City of Raleigh Fire Department Final Report Page 12
Pictures: Comparison between T12 lighting at a fire station and a newer T8 light installation:
T12 lighting at Station 18 T8 lighting at Station 8 The T12 lamps emit a yellow, warmer light while the T8 lamps emit a brighter, cooler light. T8 lights will consume less energy and will also emit less heat, which will benefit the fire stations in the summertime. The brighter lighting will also improve the workplace environment for the firefighters.
Project Summary
The Raleigh Fire Department has already installed T8 lighting or better in the fire stations that were built since 1998 (Fire Stations 22-28). The Raleigh Office of Sustainability has also launched a lighting retrofit project that will replace existing T12 lamps with T8 lamps in six fire stations this year (Fire Stations 1, 5, 6, 7, 9 and 19). The lighting retrofit project will:
• Replace the remaining 1,159 T12 lamps and magnetic ballasts with T8 lamps and electronic ballasts.
• Energy Savings: 27,000 kWh
• Equipment and Labor Cost: $13, 329
• Total Estimated Annual Energy Cost Savings: $2,740
• Payback Period: 4.9 years
Financial Analysis
The project the fellows propose is based on very conservative assumptions. Firstly, given the higher efficiency and brighter lighting of a T8 lamp, the Fire Department could potentially “delamp” existing T12 lighting and fixtures. Therefore, the project costs would decrease because fewer T12 lamps would need to be replaced. Secondly, the electricity demand charge will vary for each station, so the lowest charge was selected (if the demand charge is higher, then switching to a more efficient light will increase savings). Assumptions
• Electricity rate chage: $0.085
• Electricity demand charge: $4. (Based on Progress Energy’s lowest estimate)
• Incremental cost per ballast and fixture: $15. (Based on prices from Lighting.com)
• Hours per week that lights are turned on (8 hrs per day): 56 hours
• Progress Energy Rebate (per 4 ft. lamp installed): $6 (see Appendix F for Progress Energy Lighting incentives)
Climate Corps 2010: City of Raleigh Fire Department Final Report Page 13
Recommendations
The fellows recommend retrofitting all existing T12 lamps and magnetic ballasts in the Raleigh fire stations with T8 lamps and electronic ballasts. The Raleigh Office of Sustainability has already begun lighting retrofit projects in six fire stations, and municipal officials plan to budget a portion of funding for other fire stations from the Energy Efficiency and Conservation Block Grant (EECBG) as part of the American Recovery and Reinvestment Act (ARRA). The new lighting will reduce energy use, reduce energy costs, reduce maintenance and replacement costs, and provide a better working environment for the firefighters. The City of Raleigh and the Fire Department should continue to retrofit all the fire stations with T8 installations so that the significant annual savings can be obtained.
Project 3 – Vending Machines
Basic Project Information
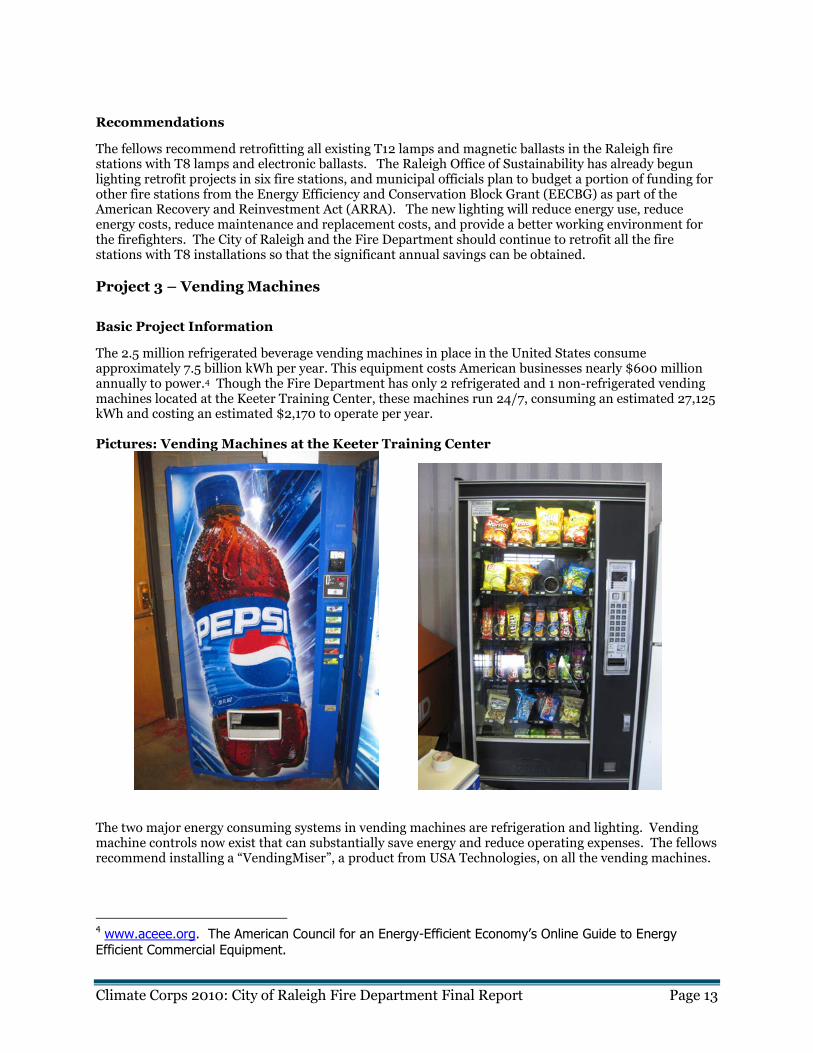
The 2.5 million refrigerated beverage vending machines in place in the United States consume approximately 7.5 billion kWh per year. This equipment costs American businesses nearly $600 million annually to power.4 Though the Fire Department has only 2 refrigerated and 1 non-refrigerated vending machines located at the Keeter Training Center, these machines run 24/7, consuming an estimated 27,125 kWh and costing an estimated $2,170 to operate per year. Pictures: Vending Machines at the Keeter Training Center
The two major energy consuming systems in vending machines are refrigeration and lighting. Vending machine controls now exist that can substantially save energy and reduce operating expenses. The fellows recommend installing a “VendingMiser”, a product from USA Technologies, on all the vending machines.
4 www.aceee.org. The American Council for an Energy-Efficient Economy’s Online Guide to Energy Efficient Commercial Equipment.
Climate Corps 2010: City of Raleigh Fire Department Final Report Page 14
The VendingMiser monitors the occupancy levels and ambient temperature changes in the area surrounding the vending machine and regulates the power usage of the machine. The device powers down the machine when the area is vacant and automatically re-powers the cooling system at one- to three-hour intervals, independent of sales, to ensure the product stays cold. The VendingMiser for non-refrigerated machines powers down the lighting and electrical systems. Maintenance savings can also be generated through the reduced run-time of vendor components.
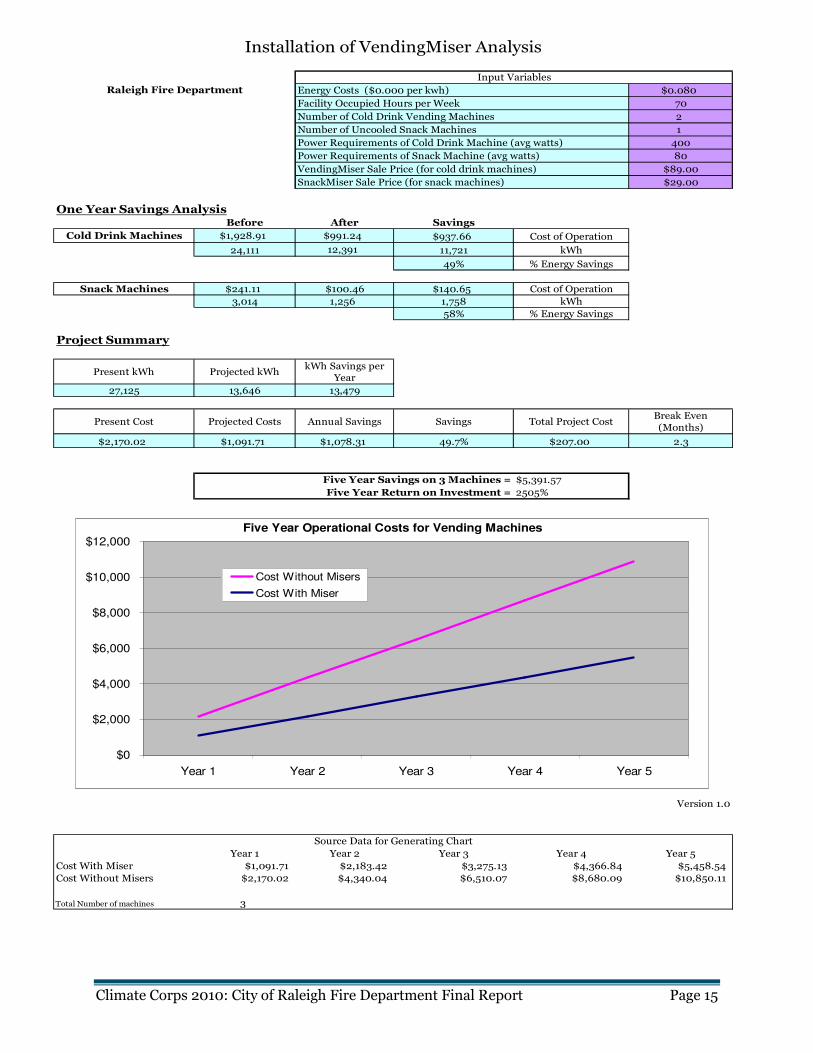
Project Summary
• Install VendingMisers on all Fire Department vending machines
• Energy Savings: 13,479 kWh
• Equipment and Labor Cost: $207.00 after Progress Energy Incentives.
• Total Estimated Annual Energy Cost Savings: $1078.31
• Payback Period: 0.19 years
Financial Analysis
Assumptions
• Energy Savings: Used the current wattage and conservative estimates of power-on hours for the
machines before and after VendingMiser installation. Duration of auto-repower estimated at 0.4
hours and time between auto-repower estimated at 2 hours.
• Equipment Cost & Labor: VendingMiser cost is listed at $179.00 and SnackMiser is listed at
79.00.5 Progress Energy has an incentive of $90.00 for beverage machine controls and an
incentive of $50.00 for snack machine controls making costs $89.00 and $29.00 respectively.
See Appendix G for Progress Energy Vending Machine Incentives Policies. Labor costs
assumed to be free since the VendingMisers are plug-in devices.
• CO2 emission reductions: CO2 savings were calculated using 1.135lb/kWh.6
5 www.usatech.com. 6 www.epa.gov. eGRID 2007 Version 1.1.
Climate Corps 2010: City of Raleigh Fire Department Final Report Page 15
Energy Costs ($0.000 per kwh) $0.080
Facility Occupied Hours per Week 70
Number of Cold Drink Vending Machines 2
Number of Uncooled Snack Machines 1
Power Requirements of Cold Drink Machine (avg watts) 400
Power Requirements of Snack Machine (avg watts) 80
VendingMiser Sale Price (for cold drink machines) $89.00
SnackMiser Sale Price (for snack machines) $29.00
One Year Savings AnalysisBefore After Savings
Cold Drink Machines $1,928.91 $991.24 $937.66 Cost of Operation
24,111 12,391 11,721 kWh
49% % Energy Savings
Snack Machines $241.11 $100.46 $140.65 Cost of Operation
3,014 1,256 1,758 kWh
58% % Energy Savings
Project Summary
Present kWh Projected kWhkWh Savings per
Year
27,125 13,646 13,479
Present Cost Projected Costs Annual Savings Savings Total Project CostBreak Even
(Months)
$2,170.02 $1,091.71 $1,078.31 49.7% $207.00 2.3
Five Year Savings on 3 Machines = $5,391.57
Five Year Return on Investment = 2505%
Version 1.0
Year 1 Year 2 Year 3 Year 4 Year 5
Cost With Miser $1,091.71 $2,183.42 $3,275.13 $4,366.84 $5,458.54
Cost Without Misers $2,170.02 $4,340.04 $6,510.07 $8,680.09 $10,850.11
Total Number of machines 3
Source Data for Generating Chart
Input Variables
Installation of VendingMiser Analysis
Raleigh Fire Department
Five Year Operational Costs for Vending Machines
$0
$2,000
$4,000
$6,000
$8,000
$10,000
$12,000
Year 1 Year 2 Year 3 Year 4 Year 5
Cost Without Misers
Cost With Miser

Climate Corps 2010: City of Raleigh Fire Department Final Report Page 16
Recommendations
The fellows recommend purchasing and installing VendingMisers on the 3 vending machines located at the Keeter Training Center as soon as possible. The devices will reduce energy consumption and costs. The Fire Department can also request the vending machine distributors/owners to remove the lighting in the vending machines to eliminate lighting costs altogether. Station 19 also has a vending machine that was brought in by one of the firefighters. While not owned by the Fire Department, this machine is still using energy and presumably costing the department money. It is recommended that the department purchase a VendingMiser for this machine as well. Although it is not owned by the department, and rather than have it removed from the station, the VendingMiser will decrease the energy consumption and costs associated with the machine.
Project 4 – Energy Star AC Units
Basic Project Information
Twenty-five Raleigh fire stations use residential-like split heating and cooling systems, while Stations 1 and 28 use commercial-grade HVAC systems to heat and cool each building; see Appendix H for the AC unit inventory across all Raleigh fire stations. The residential-like split heating and cooling systems require 63 AC units to function. These units cool the dayroom and dormitory of each fire station (the vehicle bays require some heating in the winter, but no air conditioning). The AC units are necessary to maintain comfortable climates for the firefighters throughout the day and night. However, 38 of these units have low efficiency ratings and therefore consume significant levels of energy. These models have a SEER (Seasonal Energy Efficiency Ratio) of 10 or less. Below are photos of selected 10 SEER units currently used at the fire stations:
York 3.5 ton 10 SEER unit at Station 21 Carrier 3.5 ton 10 SEER unit at Station 6 These units are typically older and are near or have exceeded their useful life. Generally, when these older units no longer function, they are replaced with 13 SEER models. Purchasing Energy Star 14.5 SEER air conditioners to replace the existing units will lead to even greater energy savings.
Project Summary
• Replace 10 SEER AC units when they fail, with Energy Star 14.5 SEER AC units
• Energy Savings: 61, 368 kWh
• Incremental cost of purchasing 38 Energy Star units: $17, 803
• Total Estimated Annual Energy Cost Savings: $5,216
• Payback Period: 3.4 years
Climate Corps 2010: City of Raleigh Fire Department Final Report Page 17
Financial Analysis
Assumptions
• The costs and savings are assumed to occur in one year, but might actually be spread across a number of years (depending on when the 10 SEER units fail).
• The incremental cost of an Energy Star unit is based on the cost of a standard 13 SEER unit, which we assume is currently purchased as a replacement.
• The AC units throughout the Raleigh fire stations range in size between 2 and 5 tons, so an average tonnage of 3.5 is used for the calculations.
• Energy Star qualified AC units are eligible for Progress Energy rebates of $25 per ton (see Appendix I for Progress Energy AC unit incentives).
Recommendations
The fellows recommend purchasing Energy Star qualified AC units when the existing 10 SEER units fail; see Appendix J for a list of Energy Star qualified units. This is an opportunity to drastically decrease energy consumption and maintenance costs at a fire station. According to the Environmental and Energy Study Institute, a one unit increase in a SEER rating leads to a 10% improvement in energy efficiency. Investing in an Energy Star 14.5 SEER AC unit rather than a standard 13 SEER unit will produce significant savings, and will improve the durability of an appliance that must work hard to meet the demands of a busy fire station.
OTHER GENERAL RECOMMENDATIONS
HVAC Maintenance Schedule
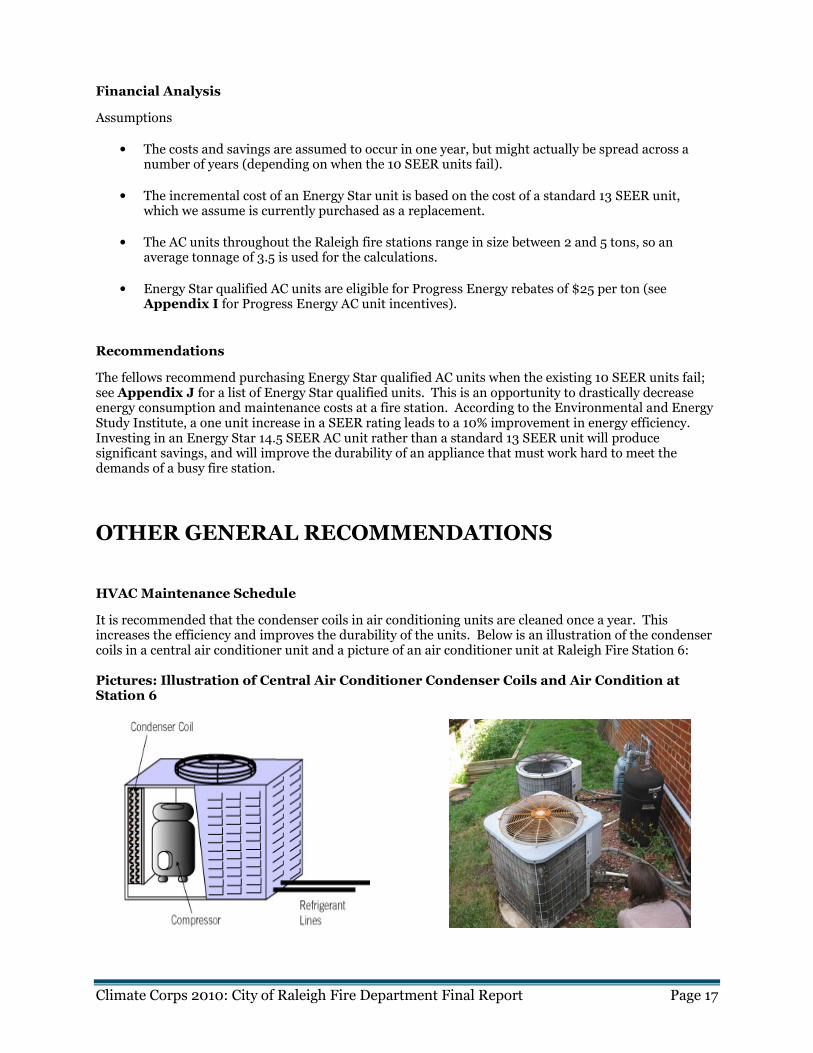
It is recommended that the condenser coils in air conditioning units are cleaned once a year. This increases the efficiency and improves the durability of the units. Below is an illustration of the condenser coils in a central air conditioner unit and a picture of an air conditioner unit at Raleigh Fire Station 6: Pictures: Illustration of Central Air Conditioner Condenser Coils and Air Condition at Station 6
Climate Corps 2010: City of Raleigh Fire Department Final Report Page 18
According to Goodway, Inc., an air conditioner cleaning company, equipment operating with dirty coils can use up to 37% more energy than a unit with clean coils. See Appendix K for instructions of coil cleaning. The Fire Department already instructs that the HVAC filters are cleaned monthly and the fellows recommend that the department also includes cleaning the coils, as part of a more comprehensive HVAC preventative maintenance schedule. This will ensure that the systems are functioning at the highest efficiency.
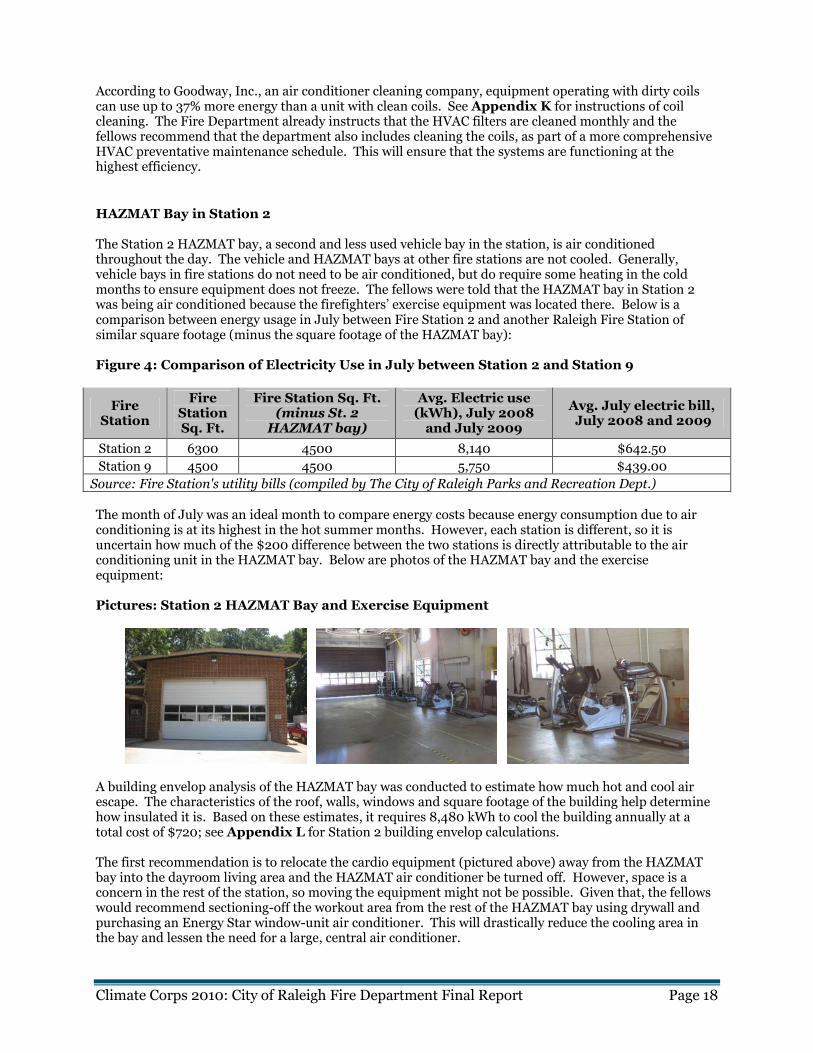
HAZMAT Bay in Station 2 The Station 2 HAZMAT bay, a second and less used vehicle bay in the station, is air conditioned throughout the day. The vehicle and HAZMAT bays at other fire stations are not cooled. Generally, vehicle bays in fire stations do not need to be air conditioned, but do require some heating in the cold months to ensure equipment does not freeze. The fellows were told that the HAZMAT bay in Station 2 was being air conditioned because the firefighters’ exercise equipment was located there. Below is a comparison between energy usage in July between Fire Station 2 and another Raleigh Fire Station of similar square footage (minus the square footage of the HAZMAT bay): Figure 4: Comparison of Electricity Use in July between Station 2 and Station 9
Fire Station
Fire Station Sq. Ft.
Fire Station Sq. Ft. (minus St. 2 HAZMAT bay)
Avg. Electric use (kWh), July 2008 and July 2009
Avg. July electric bill, July 2008 and 2009
Station 2 6300 4500 8,140 $642.50
Station 9 4500 4500 5,750 $439.00
Source: Fire Station's utility bills (compiled by The City of Raleigh Parks and Recreation Dept.) The month of July was an ideal month to compare energy costs because energy consumption due to air conditioning is at its highest in the hot summer months. However, each station is different, so it is uncertain how much of the $200 difference between the two stations is directly attributable to the air conditioning unit in the HAZMAT bay. Below are photos of the HAZMAT bay and the exercise equipment: Pictures: Station 2 HAZMAT Bay and Exercise Equipment
A building envelop analysis of the HAZMAT bay was conducted to estimate how much hot and cool air escape. The characteristics of the roof, walls, windows and square footage of the building help determine how insulated it is. Based on these estimates, it requires 8,480 kWh to cool the building annually at a total cost of $720; see Appendix L for Station 2 building envelop calculations. The first recommendation is to relocate the cardio equipment (pictured above) away from the HAZMAT bay into the dayroom living area and the HAZMAT air conditioner be turned off. However, space is a concern in the rest of the station, so moving the equipment might not be possible. Given that, the fellows would recommend sectioning-off the workout area from the rest of the HAZMAT bay using drywall and purchasing an Energy Star window-unit air conditioner. This will drastically reduce the cooling area in the bay and lessen the need for a large, central air conditioner.
Climate Corps 2010: City of Raleigh Fire Department Final Report Page 19
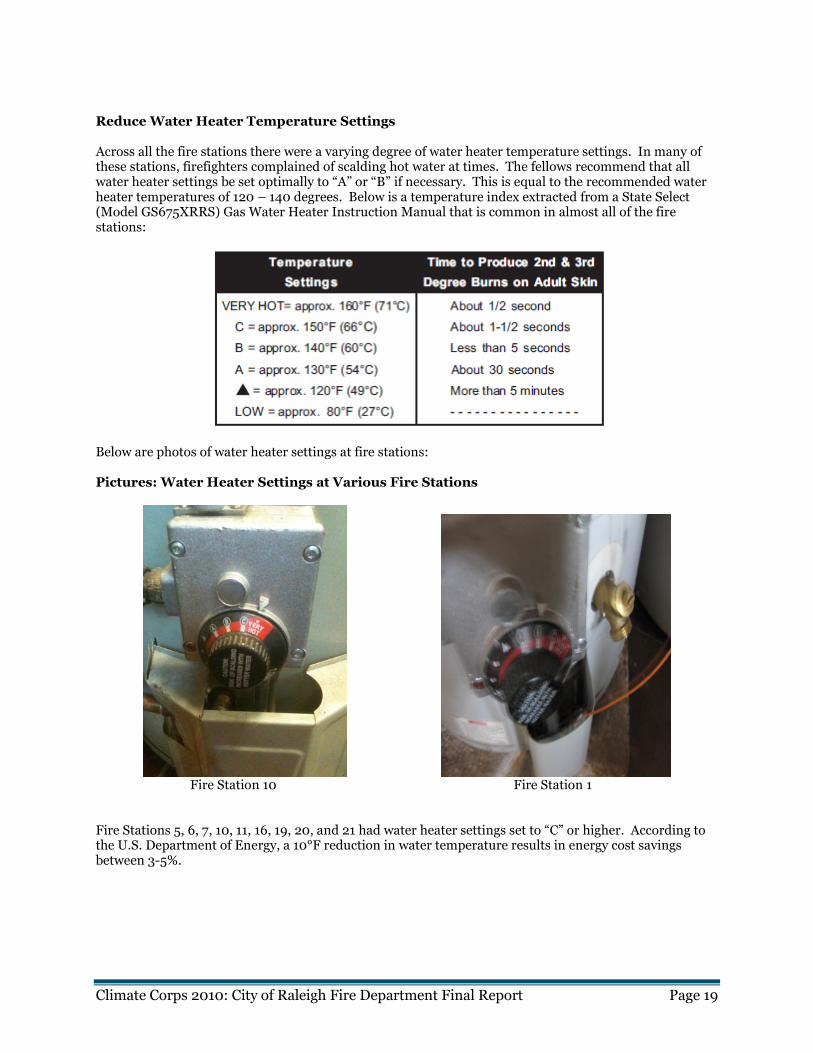
Reduce Water Heater Temperature Settings Across all the fire stations there were a varying degree of water heater temperature settings. In many of these stations, firefighters complained of scalding hot water at times. The fellows recommend that all water heater settings be set optimally to “A” or “B” if necessary. This is equal to the recommended water heater temperatures of 120 – 140 degrees. Below is a temperature index extracted from a State Select (Model GS675XRRS) Gas Water Heater Instruction Manual that is common in almost all of the fire stations:
Below are photos of water heater settings at fire stations: Pictures: Water Heater Settings at Various Fire Stations
Fire Station 10 Fire Station 1 Fire Stations 5, 6, 7, 10, 11, 16, 19, 20, and 21 had water heater settings set to “C” or higher. According to the U.S. Department of Energy, a 10°F reduction in water temperature results in energy cost savings between 3-5%.
Climate Corps 2010: City of Raleigh Fire Department Final Report Page 20
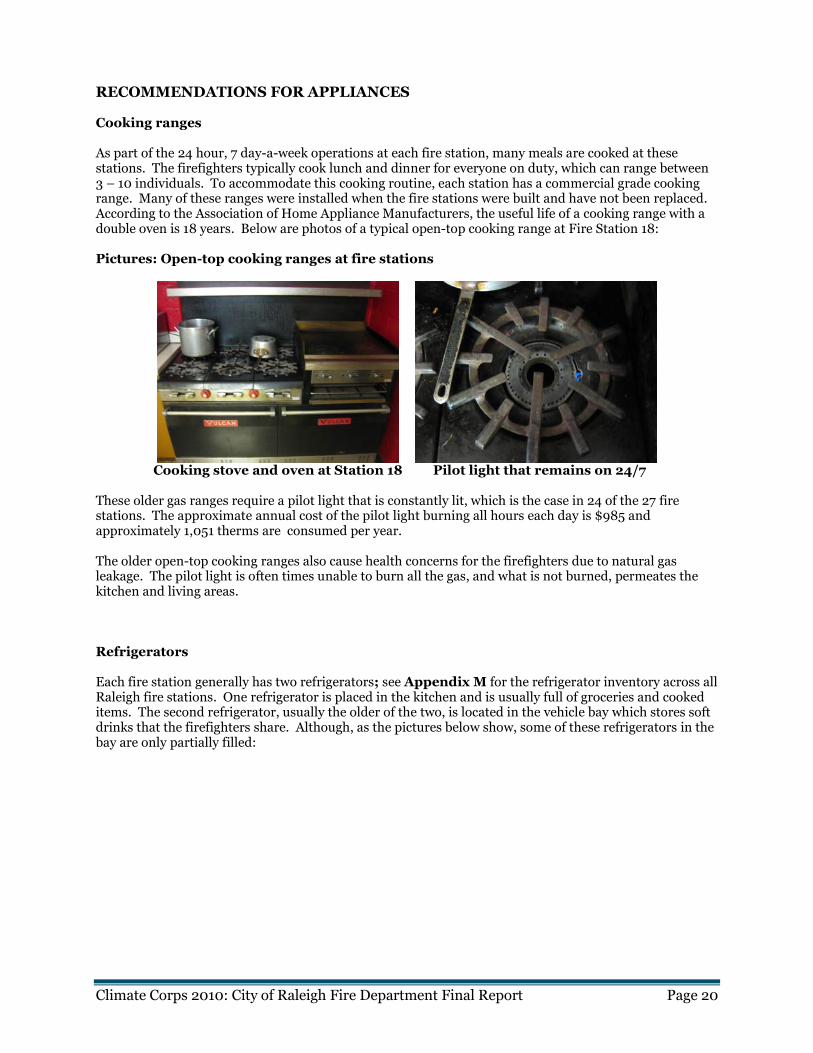
RECOMMENDATIONS FOR APPLIANCES Cooking ranges As part of the 24 hour, 7 day-a-week operations at each fire station, many meals are cooked at these stations. The firefighters typically cook lunch and dinner for everyone on duty, which can range between 3 – 10 individuals. To accommodate this cooking routine, each station has a commercial grade cooking range. Many of these ranges were installed when the fire stations were built and have not been replaced. According to the Association of Home Appliance Manufacturers, the useful life of a cooking range with a double oven is 18 years. Below are photos of a typical open-top cooking range at Fire Station 18: Pictures: Open-top cooking ranges at fire stations
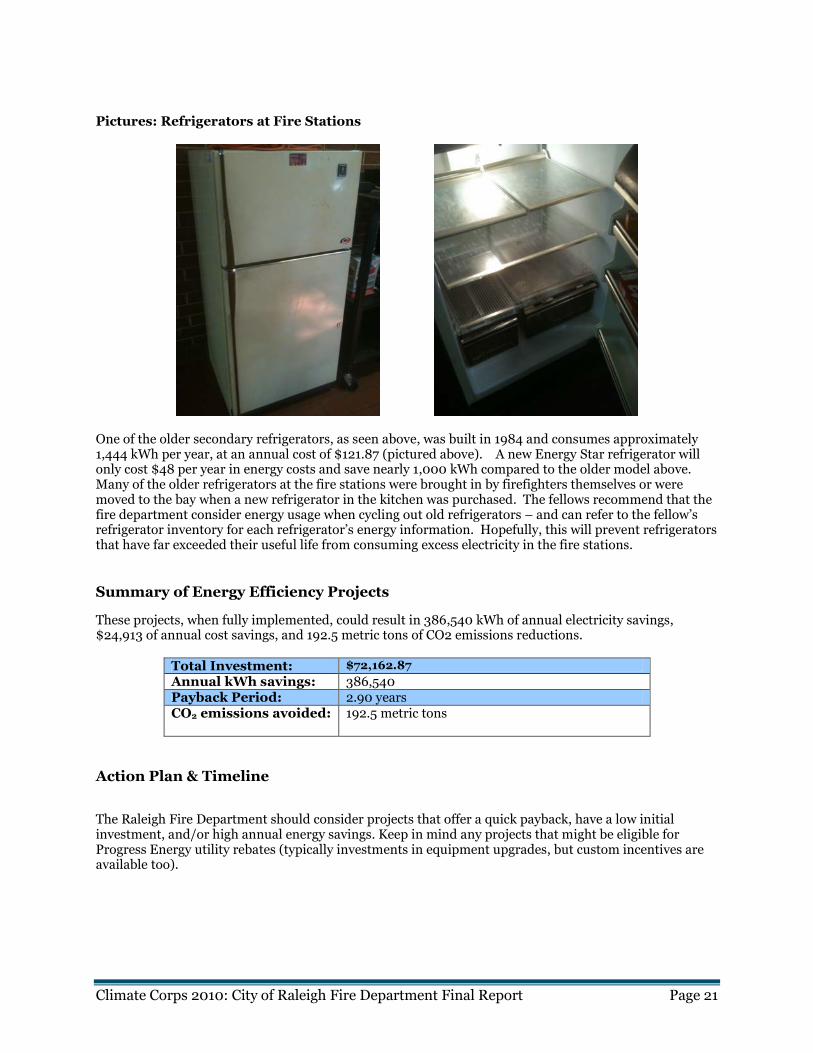
Cooking stove and oven at Station 18 Pilot light that remains on 24/7 These older gas ranges require a pilot light that is constantly lit, which is the case in 24 of the 27 fire stations. The approximate annual cost of the pilot light burning all hours each day is $985 and approximately 1,051 therms are consumed per year. The older open-top cooking ranges also cause health concerns for the firefighters due to natural gas leakage. The pilot light is often times unable to burn all the gas, and what is not burned, permeates the kitchen and living areas. Refrigerators Each fire station generally has two refrigerators; see Appendix M for the refrigerator inventory across all Raleigh fire stations. One refrigerator is placed in the kitchen and is usually full of groceries and cooked items. The second refrigerator, usually the older of the two, is located in the vehicle bay which stores soft drinks that the firefighters share. Although, as the pictures below show, some of these refrigerators in the bay are only partially filled:
Climate Corps 2010: City of Raleigh Fire Department Final Report Page 21
Pictures: Refrigerators at Fire Stations
One of the older secondary refrigerators, as seen above, was built in 1984 and consumes approximately 1,444 kWh per year, at an annual cost of $121.87 (pictured above). A new Energy Star refrigerator will only cost $48 per year in energy costs and save nearly 1,000 kWh compared to the older model above. Many of the older refrigerators at the fire stations were brought in by firefighters themselves or were moved to the bay when a new refrigerator in the kitchen was purchased. The fellows recommend that the fire department consider energy usage when cycling out old refrigerators – and can refer to the fellow’s refrigerator inventory for each refrigerator’s energy information. Hopefully, this will prevent refrigerators that have far exceeded their useful life from consuming excess electricity in the fire stations.
Summary of Energy Efficiency Projects
These projects, when fully implemented, could result in 386,540 kWh of annual electricity savings, $24,913 of annual cost savings, and 192.5 metric tons of CO2 emissions reductions.
Total Investment: $72,162.87
Annual kWh savings: 386,540 Payback Period: 2.90 years CO2 emissions avoided:
192.5 metric tons
Action Plan & Timeline
The Raleigh Fire Department should consider projects that offer a quick payback, have a low initial investment, and/or high annual energy savings. Keep in mind any projects that might be eligible for Progress Energy utility rebates (typically investments in equipment upgrades, but custom incentives are available too).
Climate Corps 2010: City of Raleigh Fire Department Final Report Page 22
Short Term Implementation (0 months – 1 year)
• Begin the T-8 to T-12 lighting retrofit that the City of Raleigh has already committed to, in limited implementation this year using funding from the City of Raleigh’s Sustainability Office and the Energy Efficiency and Conservation Block Grant.
• Put into place a Preventative Maintenance Plan for the HVAC systems that includes monthly condenser coil cleaning in addition to filter replacement to ensure that the air conditioning and heating units are running efficiently.
• Continue to update and revise the station equipment inventories created by the fellows (see Appendices E, H and M) in order to track and perform life-cycle analyses on existing units and future purchases.
• Relocate the exercise equipment in the HAZMAT bay at Station 2 and cut-off the air conditioning unit or consider building out a space for the exercise equipment in the bay and installing an Energy Star window unit.
• Submit the thermostat controls and vending machine projects to the City for evaluation and approval in order to qualify for Progress Energy utility rebates that expire in 2013.
• As air conditioning units fail, begin to replace them with Energy Star 14.5 SEER units that quality for utility rebates.
• Educate Fire Department employees about ways to improve the energy efficiency of the stations. Publicize the energy bills of the stations every month.
Medium Term Implementation (1 Year – 5 Years)
• Install the VendingMisers on all the vending machines in the Keeter Training Center and Station 19.
• Install the Proliphix Network thermostat controls at every fire station and remotely program the set-points to the recommended/policy settings for winter and summer.
Long Term Implementation (5 Years+)
• Replace the open-top burner stoves with electronic ignition stoves. The open-top burner stoves have pilot lights that burn 24/7 costing the stations approximately $985.60/yr, not including additional cooling and ventilation costs as a result of the pilot lights.
• Hire a trained specialist to manage the stations energy usage and operations or consult with the City’s Facilities and Operations staff regarding equipment purchasing, maintenance, and system improvements.
OVERCOMING BARRIERS TO ENERGY EFFICIENCY
Barriers
Financial The Raleigh Fire Department is a city-funded, public department. It is given a strict annual budget sanctioned by the City of Raleigh in which to operate, making it difficult to get projects financed that are not in the current budget. In addition, any money not used or saved by the department during the given fiscal year must be returned to the city. This makes the consideration and approval of energy efficiency projects difficult because the department has little incentive to make the potential upfront investments for efficiency improvements if no savings can be kept. Furthermore, the department’s limited budget is justifiably prioritized for fire fighting and fire rescue related expenses, to better serve the department’s core mission. Department Structure
Climate Corps 2010: City of Raleigh Fire Department Final Report Page 23
Given its 24-hour functionality, the Fire Department is one of the only city departments where the buildings are managed by a services staff within the department and not by the city’s Facilities and Operations Division. While the services staff is knowledgeable about the stations’ operations, there is no dedicated trained staff member equipped to manage the electrical and mechanical systems or keep an inventory of the equipment for life-cycle analyses resulting in old and inefficient systems. Workplace Culture The fire station is a residence that operates 24 hours a day, year-round. Firefighters eat, sleep, and bathe at the station, which substitutes for home. However, unlike home, the firefighters never see the energy bills and therefore are not incentivized to turn-off lights, adjust the thermostats, or turn down the temperature on the water heater. Even though there is a department policy to set the thermostats to certain set-points depending on the season, the policy is rarely followed, which leads to inefficiently run or broken HVAC equipment.
Recommended Strategies for Overcoming Barriers
Financial The Raleigh Fire Department should be given the opportunity to keep all or a portion of the savings it will earn through energy efficiency projects. As it stands, the savings that the department obtains must be returned to the city’s general fund. The incentives are not properly aligned. The City Council should consider a means to allow the Fire Department, or any other city entity, to keep some of the savings earned through efficient and sustainable projects that improve the quality of the city-owned buildings and reduce energy consumption. Department Structure The Office of Sustainability and the Raleigh Fire Department should continue to build upon their partnerships with lighting retrofits, energy conservation projects, and energy efficiency assessments. The Fire Services Division has unique knowledge about maintaining fire stations and the Office of Sustainability, along with the city’s Facilities and Operations Division, has important knowledge about maintaining buildings. The city entities should work together to implement life cycle analyses of the fire station’s infrastructure and appliances. In doing so, the fire department will be able to maximize energy efficiency savings within its tight budget. Workplace Culture On a number of site visits to the fire stations, the firefighters were curious about the energy costs of the stations. Educating the firefighters on energy use could have an incredible impact. Posting monthly energy bills at each station will provide a reminder, and some insight, about energy usage. Energy use can even be turned into a competition between fire stations. Creating incentives and increasing awareness will lead to more energy efficient behavior in the workplace.
Lessons from Overcoming Barriers
While conducting the energy efficiency assessment, it was important to visit every fire station - not only to obtain as much data as possible, but also to meet the firefighters themselves. This allowed us to converse with the men and women who use the stations everyday, and have them learn from us while we learned from them. With some, we discussed the importance of high-efficiency lighting and properly functioning HVAC units, while also discussing the daily routines of firefighters and how they use the station. This helped subtly introduce ideas of energy efficiency into a very traditional and proud workplace culture.
Climate Corps 2010: City of Raleigh Fire Department Final Report Page 24
CONCLUSIONS AND RECOMMENDED NEXT STEPS The respected community leaders that makeup the Raleigh Fire Department can take charge on yet another front. Energy efficiency is about responsibility and sustainability. If these men and women, who are perhaps the greatest symbols of public service, can also show they accept the responsibility of energy efficiency, then they will show the rest of Raleigh and fire departments across the country the importance and urgency of this issue. Once again we would like to thank the Raleigh Fire Department for their warm hospitality and eagerness to take on this project. We would especially like to thank Lieutenant Michael Furr, Captain John Fanning and Kathy Boone for giving us so much of their valuable time while we worked on this report. We recommend that the department begins the thermostat project, purchases and installs the vending misers, and retrofits its existing lighting as soon as possible, as the energy efficiency rebates from Progress Energy expire in 2013. We recommend that the Energy Star qualified AC units are purchased once the 10 SEER units no longer function. Lastly, we recommend adopting our general recommendations, when possible, that will also lead to energy savings.
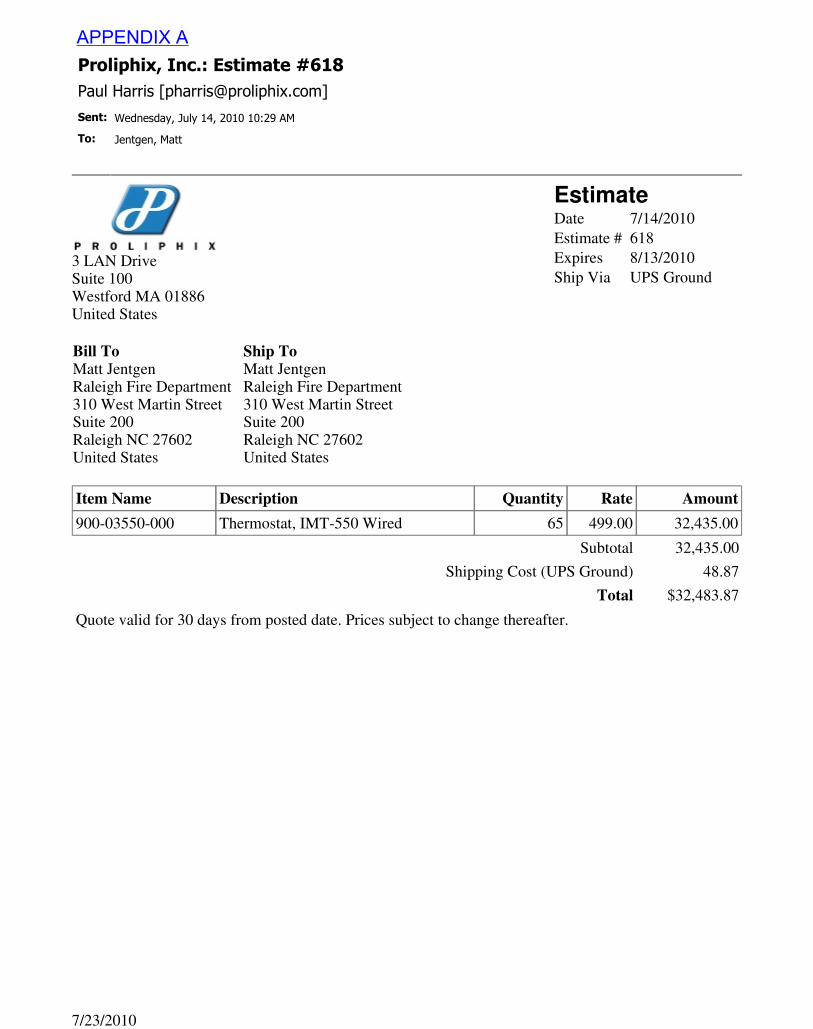
Proliphix, Inc.: Estimate #618
Paul Harris [[email protected]]
Sent: Wednesday, July 14, 2010 10:29 AM
To: Jentgen, Matt
3 LAN Drive Suite 100 Westford MA 01886 United States
Bill To Matt Jentgen Raleigh Fire Department 310 West Martin Street Suite 200 Raleigh NC 27602 United States
Ship To Matt Jentgen Raleigh Fire Department 310 West Martin Street Suite 200 Raleigh NC 27602 United States
Estimate Date 7/14/2010
Estimate # 618
Expires 8/13/2010
Ship Via UPS Ground
Item Name Description Quantity Rate Amount
900-03550-000 Thermostat, IMT-550 Wired 65 499.00 32,435.00
Subtotal 32,435.00
Shipping Cost (UPS Ground) 48.87
Total $32,483.87
Quote valid for 30 days from posted date. Prices subject to change thereafter.
Page 1 of 1Proliphix, Inc.: Estimate #618
7/23/2010
APPENDIX A
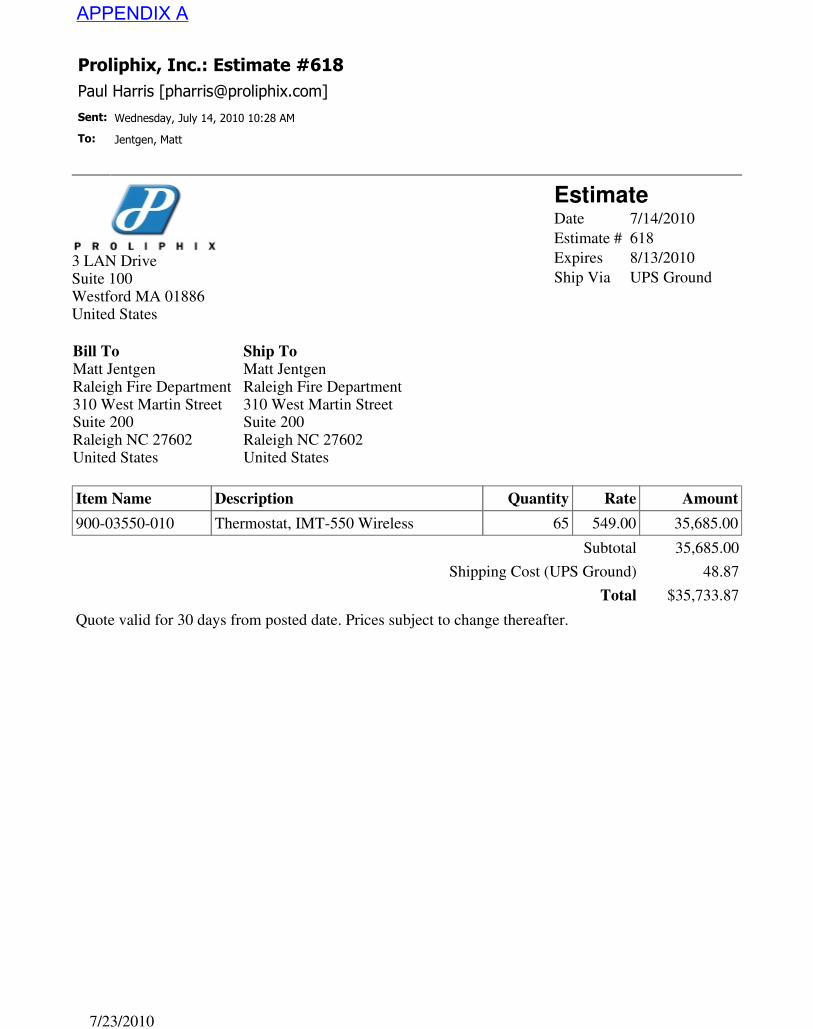
Proliphix, Inc.: Estimate #618
Paul Harris [[email protected]]
Sent: Wednesday, July 14, 2010 10:28 AM
To: Jentgen, Matt
3 LAN Drive Suite 100 Westford MA 01886 United States
Bill To Matt Jentgen Raleigh Fire Department 310 West Martin Street Suite 200 Raleigh NC 27602 United States
Ship To Matt Jentgen Raleigh Fire Department 310 West Martin Street Suite 200 Raleigh NC 27602 United States
Estimate Date 7/14/2010
Estimate # 618
Expires 8/13/2010
Ship Via UPS Ground
Item Name Description Quantity Rate Amount
900-03550-010 Thermostat, IMT-550 Wireless 65 549.00 35,685.00
Subtotal 35,685.00
Shipping Cost (UPS Ground) 48.87
Total $35,733.87
Quote valid for 30 days from posted date. Prices subject to change thereafter.
Page 1 of 1Proliphix, Inc.: Estimate #618
7/23/2010
APPENDIX A
ENERGY EFFICIENCY FOR BUSINESS PROGRAM POLICIES AND PROCEDURES
Ver. 2.0 Rev. 04.30.10 13 4/30/10
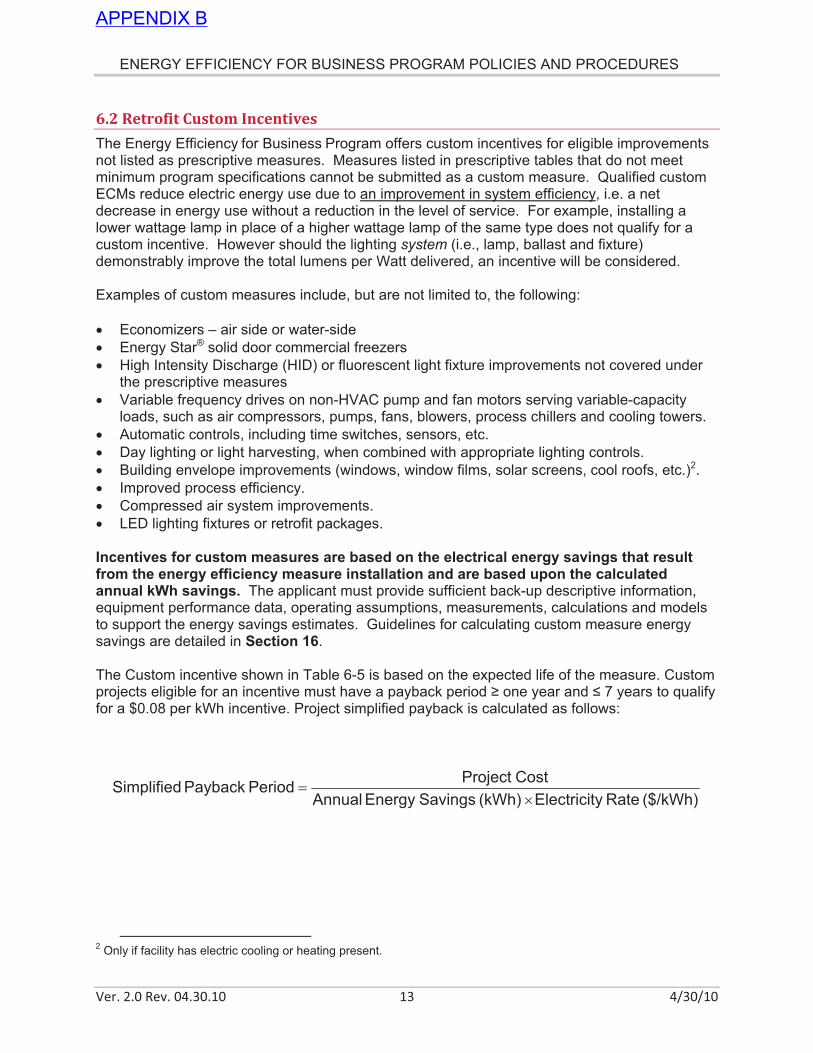
6.2 Retrofit Custom Incentives
The Energy Efficiency for Business Program offers custom incentives for eligible improvements not listed as prescriptive measures. Measures listed in prescriptive tables that do not meet minimum program specifications cannot be submitted as a custom measure. Qualified custom ECMs reduce electric energy use due to an improvement in system efficiency, i.e. a net decrease in energy use without a reduction in the level of service. For example, installing a lower wattage lamp in place of a higher wattage lamp of the same type does not qualify for a custom incentive. However should the lighting system (i.e., lamp, ballast and fixture) demonstrably improve the total lumens per Watt delivered, an incentive will be considered. Examples of custom measures include, but are not limited to, the following: Economizers – air side or water-side Energy Star® solid door commercial freezers High Intensity Discharge (HID) or fluorescent light fixture improvements not covered under
the prescriptive measures Variable frequency drives on non-HVAC pump and fan motors serving variable-capacity
loads, such as air compressors, pumps, fans, blowers, process chillers and cooling towers. Automatic controls, including time switches, sensors, etc. Day lighting or light harvesting, when combined with appropriate lighting controls. Building envelope improvements (windows, window films, solar screens, cool roofs, etc.)2. Improved process efficiency. Compressed air system improvements. LED lighting fixtures or retrofit packages.
Incentives for custom measures are based on the electrical energy savings that result from the energy efficiency measure installation and are based upon the calculated annual kWh savings. The applicant must provide sufficient back-up descriptive information, equipment performance data, operating assumptions, measurements, calculations and models to support the energy savings estimates. Guidelines for calculating custom measure energy savings are detailed in Section 16.
The Custom incentive shown in Table 6-5 is based on the expected life of the measure. Custom projects eligible for an incentive must have a payback period one year and ! 7 years to qualify for a $0.08 per kWh incentive. Project simplified payback is calculated as follows:
($/kWh) Ratey Electricit(kWh) SavingsEnergy Annual
Cost ProjectPeriod Payback Simplified
!"
2 Only if facility has electric cooling or heating present.
APPENDIX B
ENERGY EFFICIENCY FOR BUSINESS PROGRAM POLICIES AND PROCEDURES
Ver. 2.0 Rev. 04.30.10 14 4/30/10
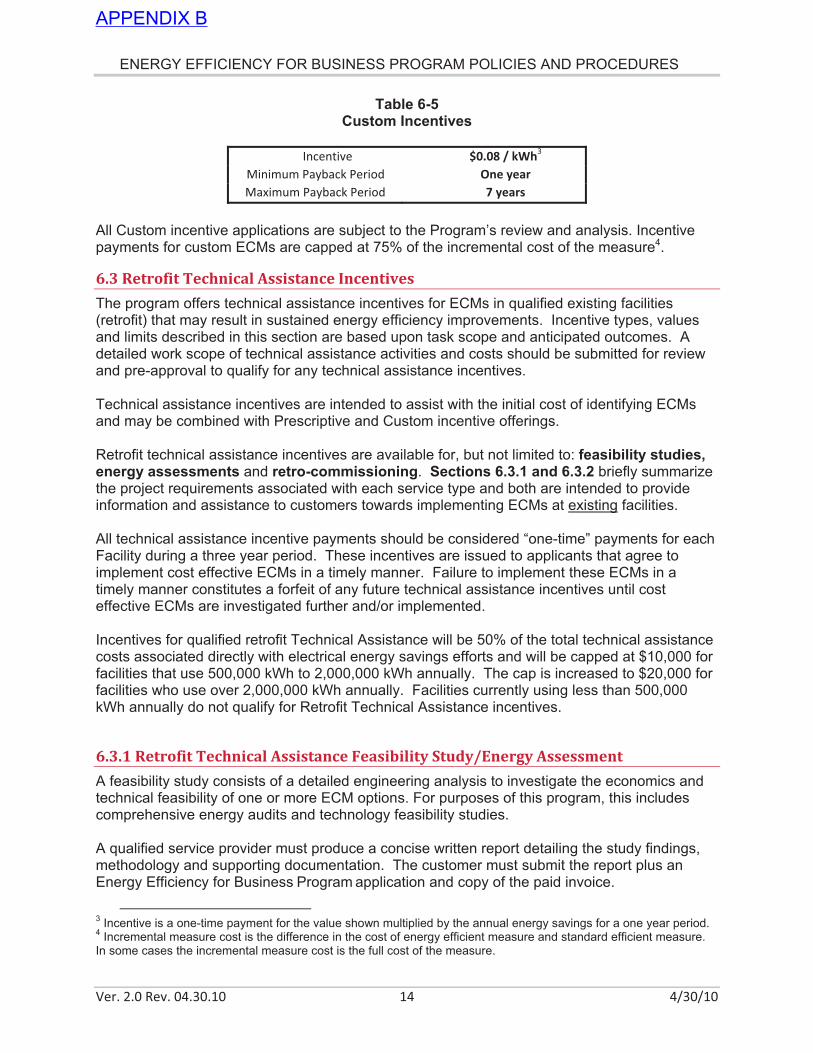
Table 6-5 Custom Incentives
Incentive $0.08 / kWh
3
Minimum Payback Period One year
Maximum Payback Period 7 years
All Custom incentive applications are subject to the Program’s review and analysis. Incentive payments for custom ECMs are capped at 75% of the incremental cost of the measure4.
6.3 Retrofit Technical Assistance Incentives
The program offers technical assistance incentives for ECMs in qualified existing facilities (retrofit) that may result in sustained energy efficiency improvements. Incentive types, values and limits described in this section are based upon task scope and anticipated outcomes. A detailed work scope of technical assistance activities and costs should be submitted for review and pre-approval to qualify for any technical assistance incentives. Technical assistance incentives are intended to assist with the initial cost of identifying ECMs and may be combined with Prescriptive and Custom incentive offerings. Retrofit technical assistance incentives are available for, but not limited to: feasibility studies, energy assessments and retro-commissioning. Sections 6.3.1 and 6.3.2 briefly summarize the project requirements associated with each service type and both are intended to provide information and assistance to customers towards implementing ECMs at existing facilities. All technical assistance incentive payments should be considered “one-time” payments for each Facility during a three year period. These incentives are issued to applicants that agree to implement cost effective ECMs in a timely manner. Failure to implement these ECMs in a timely manner constitutes a forfeit of any future technical assistance incentives until cost effective ECMs are investigated further and/or implemented. Incentives for qualified retrofit Technical Assistance will be 50% of the total technical assistance costs associated directly with electrical energy savings efforts and will be capped at $10,000 for facilities that use 500,000 kWh to 2,000,000 kWh annually. The cap is increased to $20,000 for facilities who use over 2,000,000 kWh annually. Facilities currently using less than 500,000 kWh annually do not qualify for Retrofit Technical Assistance incentives.
6.3.1 Retrofit Technical Assistance Feasibility Study/Energy Assessment
A feasibility study consists of a detailed engineering analysis to investigate the economics and technical feasibility of one or more ECM options. For purposes of this program, this includes comprehensive energy audits and technology feasibility studies. A qualified service provider must produce a concise written report detailing the study findings, methodology and supporting documentation. The customer must submit the report plus an Energy Efficiency for Business Program application and copy of the paid invoice.
3 Incentive is a one-time payment for the value shown multiplied by the annual energy savings for a one year period.
4 Incremental measure cost is the difference in the cost of energy efficient measure and standard efficient measure.
In some cases the incremental measure cost is the full cost of the measure.
APPENDIX B

August 09
3 Lan Drive
Suite 100 Westford, MA, 01886
978-692-3375 www.proliphix.com
Proliphix Uniphy Overview for IT professionals
By Aaron Smith, CTO
A Proliphix White Paper
APPENDIX C
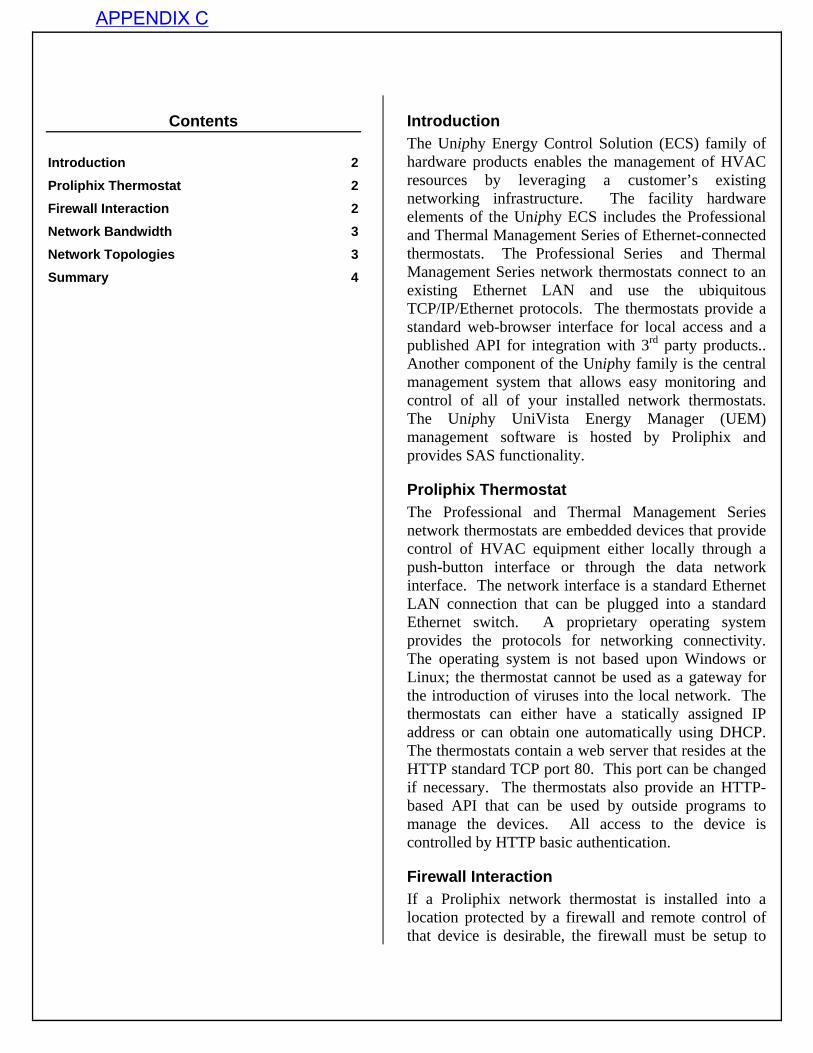
Contents Introduction 2 Proliphix Thermostat 2 Firewall Interaction 2 Network Bandwidth 3 Network Topologies 3 Summary 4
Introduction The Uniphy Energy Control Solution (ECS) family of hardware products enables the management of HVAC resources by leveraging a customer’s existing networking infrastructure. The facility hardware elements of the Uniphy ECS includes the Professional and Thermal Management Series of Ethernet-connected thermostats. The Professional Series and Thermal Management Series network thermostats connect to an existing Ethernet LAN and use the ubiquitous TCP/IP/Ethernet protocols. The thermostats provide a standard web-browser interface for local access and a published API for integration with 3rd party products.. Another component of the Uniphy family is the central management system that allows easy monitoring and control of all of your installed network thermostats. The Uniphy UniVista Energy Manager (UEM) management software is hosted by Proliphix and provides SAS functionality.
Proliphix Thermostat The Professional and Thermal Management Series network thermostats are embedded devices that provide control of HVAC equipment either locally through a push-button interface or through the data network interface. The network interface is a standard Ethernet LAN connection that can be plugged into a standard Ethernet switch. A proprietary operating system provides the protocols for networking connectivity. The operating system is not based upon Windows or Linux; the thermostat cannot be used as a gateway for the introduction of viruses into the local network. The thermostats can either have a statically assigned IP address or can obtain one automatically using DHCP. The thermostats contain a web server that resides at the HTTP standard TCP port 80. This port can be changed if necessary. The thermostats also provide an HTTP-based API that can be used by outside programs to manage the devices. All access to the device is controlled by HTTP basic authentication.
Firewall Interaction If a Proliphix network thermostat is installed into a location protected by a firewall and remote control of that device is desirable, the firewall must be setup to
APPENDIX C
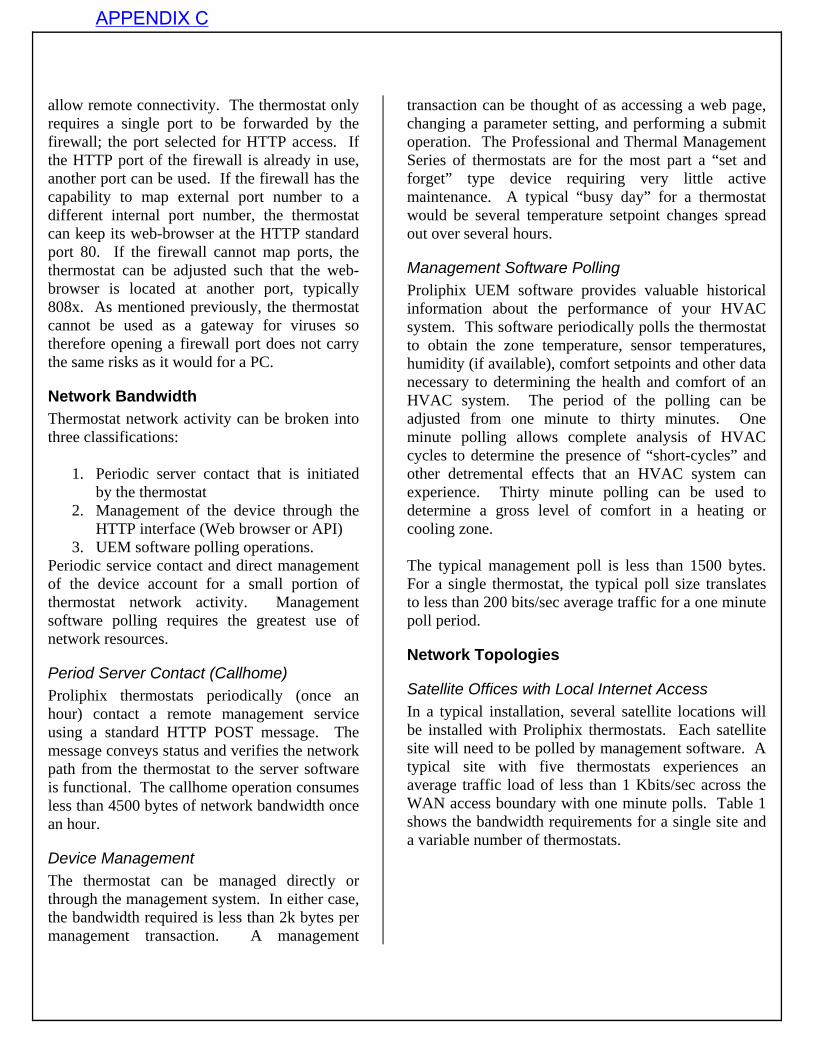
allow remote connectivity. The thermostat only requires a single port to be forwarded by the firewall; the port selected for HTTP access. If the HTTP port of the firewall is already in use, another port can be used. If the firewall has the capability to map external port number to a different internal port number, the thermostat can keep its web-browser at the HTTP standard port 80. If the firewall cannot map ports, the thermostat can be adjusted such that the web-browser is located at another port, typically 808x. As mentioned previously, the thermostat cannot be used as a gateway for viruses so therefore opening a firewall port does not carry the same risks as it would for a PC.
Network Bandwidth Thermostat network activity can be broken into three classifications:
1. Periodic server contact that is initiated by the thermostat
2. Management of the device through the HTTP interface (Web browser or API)
3. UEM software polling operations. Periodic service contact and direct management of the device account for a small portion of thermostat network activity. Management software polling requires the greatest use of network resources.
Period Server Contact (Callhome) Proliphix thermostats periodically (once an hour) contact a remote management service using a standard HTTP POST message. The message conveys status and verifies the network path from the thermostat to the server software is functional. The callhome operation consumes less than 4500 bytes of network bandwidth once an hour.
Device Management The thermostat can be managed directly or through the management system. In either case, the bandwidth required is less than 2k bytes per management transaction. A management
transaction can be thought of as accessing a web page, changing a parameter setting, and performing a submit operation. The Professional and Thermal Management Series of thermostats are for the most part a “set and forget” type device requiring very little active maintenance. A typical “busy day” for a thermostat would be several temperature setpoint changes spread out over several hours.
Management Software Polling Proliphix UEM software provides valuable historical information about the performance of your HVAC system. This software periodically polls the thermostat to obtain the zone temperature, sensor temperatures, humidity (if available), comfort setpoints and other data necessary to determining the health and comfort of an HVAC system. The period of the polling can be adjusted from one minute to thirty minutes. One minute polling allows complete analysis of HVAC cycles to determine the presence of “short-cycles” and other detremental effects that an HVAC system can experience. Thirty minute polling can be used to determine a gross level of comfort in a heating or cooling zone. The typical management poll is less than 1500 bytes. For a single thermostat, the typical poll size translates to less than 200 bits/sec average traffic for a one minute poll period.
Network Topologies
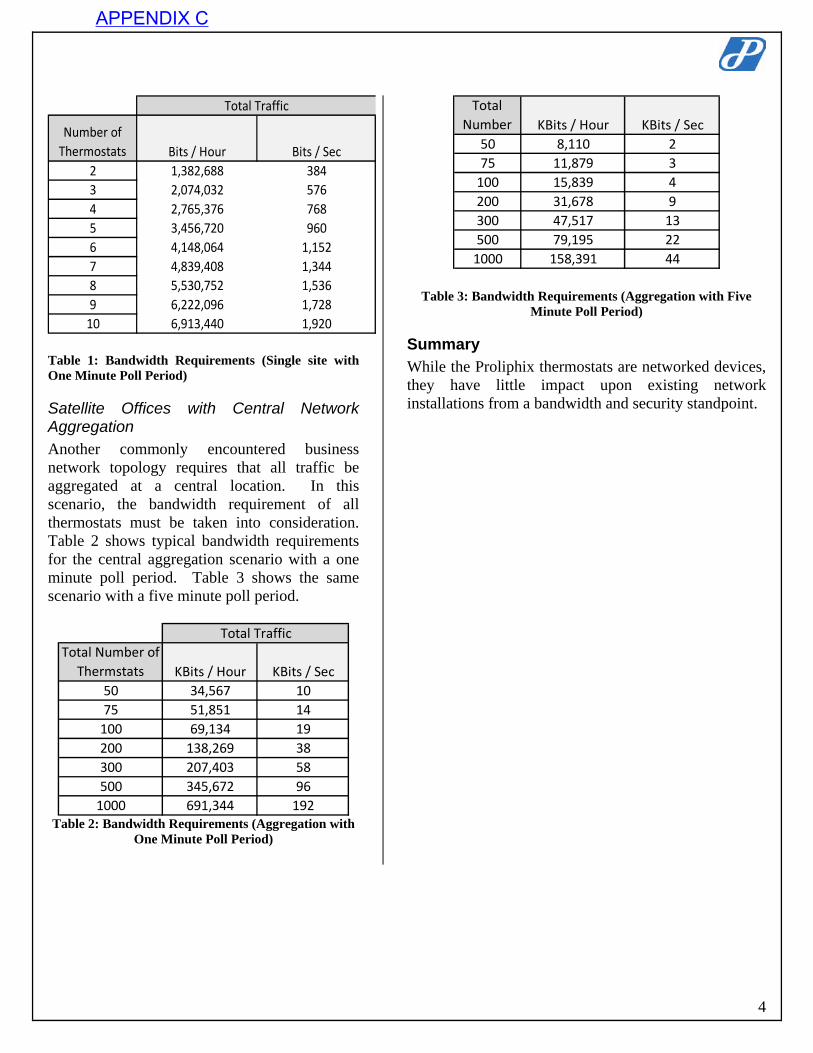
Satellite Offices with Local Internet Access In a typical installation, several satellite locations will be installed with Proliphix thermostats. Each satellite site will need to be polled by management software. A typical site with five thermostats experiences an average traffic load of less than 1 Kbits/sec across the WAN access boundary with one minute polls. Table 1 shows the bandwidth requirements for a single site and a variable number of thermostats.
APPENDIX C
4
Number of Thermostats Bits / Hour Bits / Sec
2 1,382,688 3843 2,074,032 5764 2,765,376 7685 3,456,720 9606 4,148,064 1,1527 4,839,408 1,3448 5,530,752 1,5369 6,222,096 1,72810 6,913,440 1,920
Total Traffic
Total Number KBits / Hour KBits / Sec
50 8,110 275 11,879 3100 15,839 4200 31,678 9300 47,517 13500 79,195 221000 158,391 44
Table 3: Bandwidth Requirements (Aggregation with Five
Minute Poll Period)
Summary Table 1: Bandwidth Requirements (Single site with One Minute Poll Period)
Satellite Offices with Central Network Aggregation Another commonly encountered business network topology requires that all traffic be aggregated at a central location. In this scenario, the bandwidth requirement of all thermostats must be taken into consideration. Table 2 shows typical bandwidth requirements for the central aggregation scenario with a one minute poll period. Table 3 shows the same scenario with a five minute poll period.
Total Number of Thermstats KBits / Hour KBits / Sec
50 34,567 1075 51,851 14100 69,134 19200 138,269 38300 207,403 58500 345,672 961000 691,344 192
Total Traffic
Table 2: Bandwidth Requirements (Aggregation with
One Minute Poll Period)
While the Proliphix thermostats are networked devices, they have little impact upon existing network installations from a bandwidth and security standpoint.
APPENDIX C

RESULTS
• Lower energy bills
Since 1977, Cataldo Ambulance Service, Inc., has distinguished itselfas a leader in providing routine and emergency medical services. Asthe needs of the community and the patient change, Cataldocontinues to introduce innovative programs to ensure the highest levelof care is available to everyone in their service areas. Cataldo iscommitted to giving back to the community and keeping services asaffordable as possible.
With energy costs on the rise and energy conservation garneringincreased public attention, Cataldo sought an innovative way tomonitor and control energy use and reduce greenhouse gasemissions. After extensive research Chris Coleman, Cataldo’sDirector of Information Technology, selected Proliphix Internet UniphyNetwork Thermostats.
AMBULANCE SERVICES CASE STUDY
Cataldo Ambulance Service Reduces Energy
Costs and Cuts Greenhouse Gases with Proliphix
PROBLEM
• Rising energy costs• Environmental concerns
SOLUTION
• Proliphix Uniphy Network Thermostats
• Internet-managed energy control
• Lower energy bills• Improved control – EMTs and
paramedics can no longer override thermostat settings
• Greater damage protection -real-time temperature alarms
• Less energy waste – time-of-day temperature scheduling
• More comfortable working and sleeping environment
• Less environmental impact
With Proliphix, Cataldo uses the Internet to oversee energy use atfourteen separate Boston area locations. “On a hot day, crews wouldstop into bases in between calls to cool off. After increasing the airconditioning for quick relief, crews would respond to emergency callswithout resetting the thermostat. Proliphix prevents crews fromoverriding thermostat settings and maintains a consistent, comfortablebase environment.” And by introducing multiple temperature zones,Cataldo was able to improve overall comfort in its larger facilities.
In addition to reducing energy costs, Proliphix helps avert facility andequipment damage. “Temperature alerts help prevent broken pipesand other problems that may result from extreme temperatures.”
In times of rising energy costs and increased environmentalawareness, innovators like Cataldo are turning to Proliphix toconserve energy and cut greenhouse gases.
3 LAN Drive, Suite #100 │Westford, MA 01886 │ph 866.475.4846 │ fx 978.692.3378 │ www.proliphix.com
“Proliphix has lowered Cataldo’s energy consumption
and had a positive effect on our energy bill."
Chris Coleman, Cataldo’s Director of Information
Technology
Cataldo Training and Education Center
APPENDIX D
Fire Stations95W T-
12
75W T-
12
60W T-
12
40W T-
12
34W T-
12
20W T-
1232W T-8 17W T-8 28W T-5 14W T-5
40W U-
Shape
32W U-
Shape
31W U-
shape
26W U-
shape
32W
Circular
light
100W
Incand.
75W
Incand.
60W
Incand.
14W
CFL
13W
CFLHalogen
20W
Prong
CFL
13W 2-
prong
CFL
CFL
Prong
fixtures
(in bay)
Metal
halide (in
bay)
Metal
halide
Photocel
l
Sodium
Vapor
Station 1* 206 6 2 25
Station 2 14 42 2 30 22 6 6 4 Y
Station 3 50 7 1 3 N
Station 4 34 80 6 3 3 N
Station 5* 90 6 7 2 N
Station 6* 2 53 2 2 4 8 1
Station 7* 108 5 2 7 1 3 3 Y
Station 8 2 58 80 22 2 22 2
Station 9* 27 16 1 48 20 1 3 2 Y
Station 10 1 1 34 57 5 2 2
Station 11 63 66 3 1 8
Station 12 53 80 4 2 2 3 2
Station 14 2 44 40 12 8 1 6 Y
Station 15 61 6 6 44 4 1
Station 16 44 50 1 6 10 9
Station 17 58 98 3 7
Station 18 29 2 2 84 9 3 3 N
Station 19* 33 80 5 2 10
Station 20 34 3 84 2 3 6 N
Station 21 3 47 86 6 2 6 Y
Station 22 94 74 4 4 4
Station 23 14 16 6 113 3 6 2 Y
Station 24 2 241 17 2 3
Station 25 2 150 4 3 20 3
Station 26 146 6 4 8 15 10
Station 27 182 2 4 12 15 15 Y
Station 28 10 104 10 2 96 6 Y
TOTAL LAMPS 2 16 32 1005 61 20 1378 13 104 10 773 82 4 17 9 12 1 109 80 13 11 3 45 96 30 122 4
TOTAL WATTAGE 190 1200 1920 40200 2074 400 44096 221 2912 140 30920 2624 124 442 288 1200 75 6540 1120 169 11 60 585
* Stations 1, 5, 6, 7, 9 and 19 scheduled for lighting retrofit this year
Interior lighting Exterior lighting
LIGHTING - ALL STATIONS
APPENDIX E
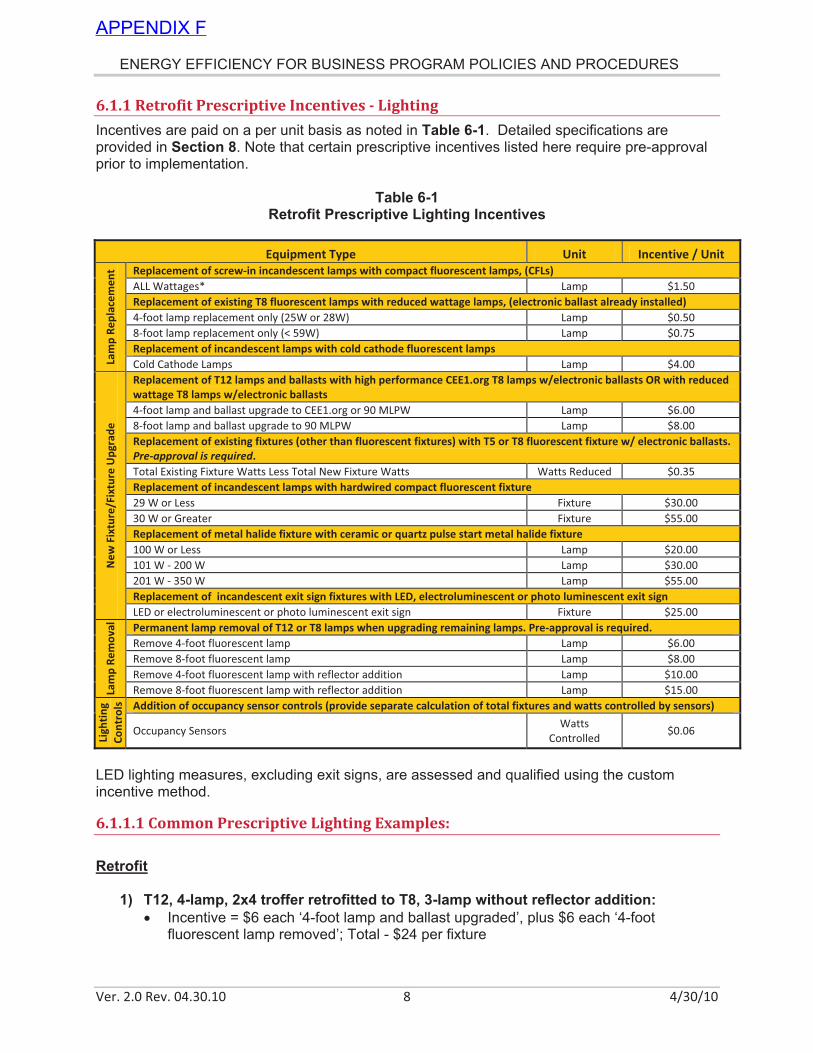
ENERGY EFFICIENCY FOR BUSINESS PROGRAM POLICIES AND PROCEDURES
Ver. 2.0 Rev. 04.30.10 8 4/30/10
6.1.1 Retrofit Prescriptive Incentives ! Lighting
Incentives are paid on a per unit basis as noted in Table 6-1. Detailed specifications are provided in Section 8. Note that certain prescriptive incentives listed here require pre-approval prior to implementation.
Table 6-1 Retrofit Prescriptive Lighting Incentives
Equipment Type Unit Incentive / Unit
Replacement of screw!in incandescent lamps with compact fluorescent lamps, (CFLs)
ALL Wattages* Lamp $1.50
Replacement of existing T8 fluorescent lamps with reduced wattage lamps, (electronic ballast already installed)
4!foot lamp replacement only (25W or 28W) Lamp $0.50
8!foot lamp replacement only (< 59W) Lamp $0.75
Replacement of incandescent lamps with cold cathode fluorescent lamps
Lamp
Replacement
Cold Cathode Lamps Lamp $4.00
Replacement of T12 lamps and ballasts with high performance CEE1.org T8 lamps w/electronic ballasts OR with reduced
wattage T8 lamps w/electronic ballasts
4!foot lamp and ballast upgrade to CEE1.org or 90 MLPW Lamp $6.00
8!foot lamp and ballast upgrade to 90 MLPW Lamp $8.00
Replacement of existing fixtures (other than fluorescent fixtures) with T5 or T8 fluorescent fixture w/ electronic ballasts.
Pre approval!is!required.
Total Existing Fixture Watts Less Total New Fixture Watts Watts Reduced $0.35
Replacement of incandescent lamps with hardwired compact fluorescent fixture
29 W or Less Fixture $30.00
30 W or Greater Fixture $55.00
Replacement of metal halide fixture with ceramic or quartz pulse start metal halide fixture
100 W or Less Lamp $20.00
101 W ! 200 W Lamp $30.00
201 W ! 350 W Lamp $55.00
Replacement of incandescent exit sign fixtures with LED, electroluminescent or photo luminescent exit sign
New
Fixture/Fixture
Upgrade
LED or electroluminescent or photo luminescent exit sign Fixture $25.00
Permanent lamp removal of T12 or T8 lamps when upgrading remaining lamps. Pre!approval is required.
Remove 4!foot fluorescent lamp Lamp $6.00
Remove 8!foot fluorescent lamp Lamp $8.00
Remove 4!foot fluorescent lamp with reflector addition Lamp $10.00
Lamp
Removal
Remove 8!foot fluorescent lamp with reflector addition Lamp $15.00
Addition of occupancy sensor controls (provide separate calculation of total fixtures and watts controlled by sensors)
Lighting
Controls
Occupancy Sensors Watts
Controlled $0.06
LED lighting measures, excluding exit signs, are assessed and qualified using the custom incentive method.
6.1.1.1 Common Prescriptive Lighting Examples:
Retrofit
1) T12, 4-lamp, 2x4 troffer retrofitted to T8, 3-lamp without reflector addition:
Incentive = $6 each ‘4-foot lamp and ballast upgraded’, plus $6 each ‘4-foot fluorescent lamp removed’; Total - $24 per fixture
APPENDIX F
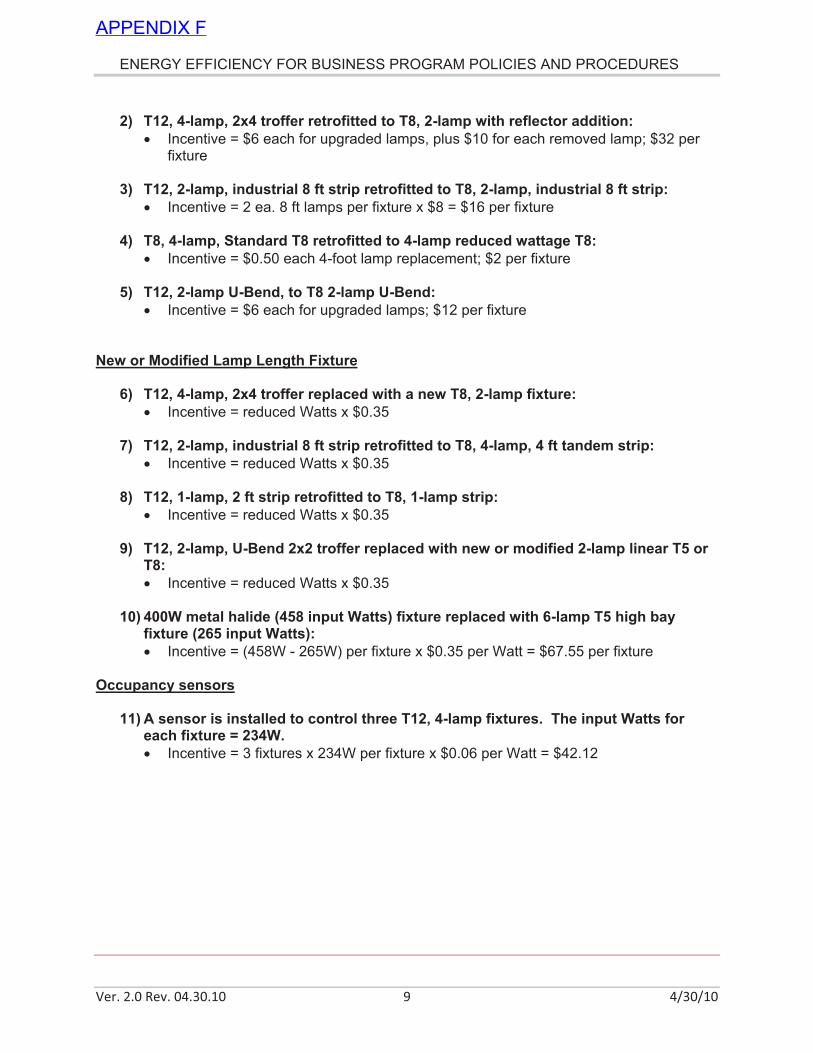
ENERGY EFFICIENCY FOR BUSINESS PROGRAM POLICIES AND PROCEDURES
Ver. 2.0 Rev. 04.30.10 9 4/30/10
2) T12, 4-lamp, 2x4 troffer retrofitted to T8, 2-lamp with reflector addition:
Incentive = $6 each for upgraded lamps, plus $10 for each removed lamp; $32 per fixture
3) T12, 2-lamp, industrial 8 ft strip retrofitted to T8, 2-lamp, industrial 8 ft strip:
Incentive = 2 ea. 8 ft lamps per fixture x $8 = $16 per fixture
4) T8, 4-lamp, Standard T8 retrofitted to 4-lamp reduced wattage T8:
Incentive = $0.50 each 4-foot lamp replacement; $2 per fixture
5) T12, 2-lamp U-Bend, to T8 2-lamp U-Bend:
Incentive = $6 each for upgraded lamps; $12 per fixture
New or Modified Lamp Length Fixture
6) T12, 4-lamp, 2x4 troffer replaced with a new T8, 2-lamp fixture:
Incentive = reduced Watts x $0.35
7) T12, 2-lamp, industrial 8 ft strip retrofitted to T8, 4-lamp, 4 ft tandem strip:
Incentive = reduced Watts x $0.35 8) T12, 1-lamp, 2 ft strip retrofitted to T8, 1-lamp strip:
Incentive = reduced Watts x $0.35 9) T12, 2-lamp, U-Bend 2x2 troffer replaced with new or modified 2-lamp linear T5 or
T8:
Incentive = reduced Watts x $0.35 10) 400W metal halide (458 input Watts) fixture replaced with 6-lamp T5 high bay
fixture (265 input Watts):
Incentive = (458W - 265W) per fixture x $0.35 per Watt = $67.55 per fixture Occupancy sensors
11) A sensor is installed to control three T12, 4-lamp fixtures. The input Watts for each fixture = 234W.
Incentive = 3 fixtures x 234W per fixture x $0.06 per Watt = $42.12
APPENDIX F
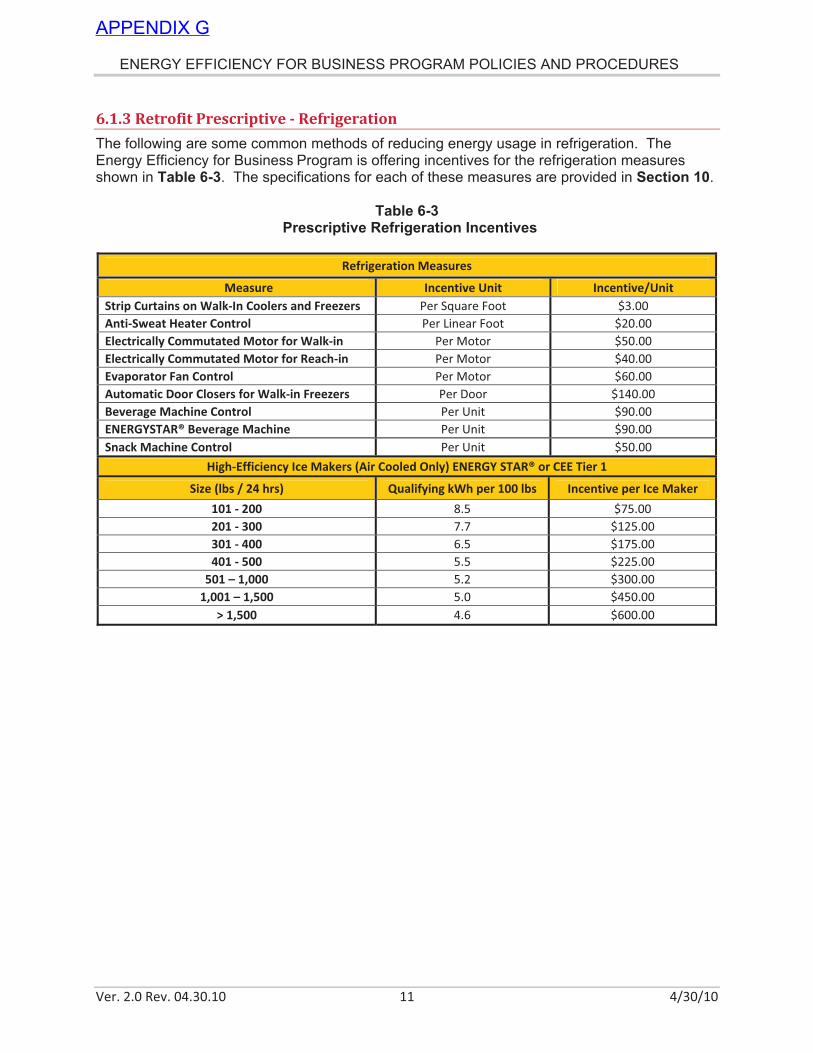
ENERGY EFFICIENCY FOR BUSINESS PROGRAM POLICIES AND PROCEDURES
Ver. 2.0 Rev. 04.30.10 11 4/30/10
6.1.3 Retrofit Prescriptive ! Refrigeration
The following are some common methods of reducing energy usage in refrigeration. The Energy Efficiency for Business Program is offering incentives for the refrigeration measures shown in Table 6-3. The specifications for each of these measures are provided in Section 10.
Table 6-3
Prescriptive Refrigeration Incentives
Refrigeration Measures
Measure Incentive Unit Incentive/Unit
Strip Curtains on Walk!In Coolers and Freezers Per Square Foot $3.00
Anti!Sweat Heater Control Per Linear Foot $20.00
Electrically Commutated Motor for Walk!in Per Motor $50.00
Electrically Commutated Motor for Reach!in Per Motor $40.00
Evaporator Fan Control Per Motor $60.00
Automatic Door Closers for Walk!in Freezers Per Door $140.00
Beverage Machine Control Per Unit $90.00
ENERGYSTAR® Beverage Machine Per Unit $90.00
Snack Machine Control Per Unit $50.00
High!Efficiency Ice Makers (Air Cooled Only) ENERGY STAR® or CEE Tier 1
Size (lbs / 24 hrs) Qualifying kWh per 100 lbs Incentive per Ice Maker
101 ! 200 8.5 $75.00
201 ! 300 7.7 $125.00
301 ! 400 6.5 $175.00
401 ! 500 5.5 $225.00
501 – 1,000 5.2 $300.00
1,001 – 1,500 5.0 $450.00
> 1,500 4.6 $600.00
APPENDIX G
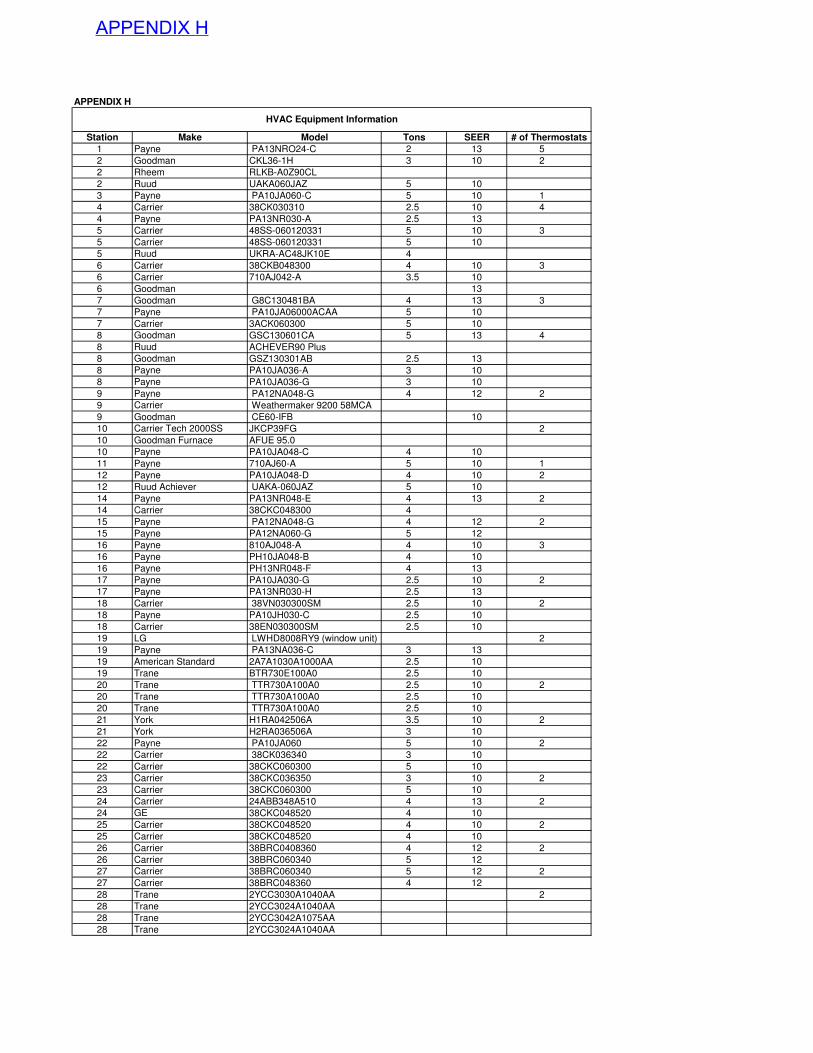
APPENDIX H
Station Make Model Tons SEER # of Thermostats
1 Payne PA13NRO24-C 2 13 5
2 Goodman CKL36-1H 3 10 2
2 Rheem RLKB-A0Z90CL
2 Ruud UAKA060JAZ 5 10
3 Payne PA10JA060-C 5 10 1
4 Carrier 38CK030310 2.5 10 4
4 Payne PA13NR030-A 2.5 13
5 Carrier 48SS-060120331 5 10 3
5 Carrier 48SS-060120331 5 10
5 Ruud UKRA-AC48JK10E 4
6 Carrier 38CKB048300 4 10 3
6 Carrier 710AJ042-A 3.5 10
6 Goodman 13
7 Goodman G8C130481BA 4 13 3
7 Payne PA10JA06000ACAA 5 10
7 Carrier 3ACK060300 5 10
8 Goodman GSC130601CA 5 13 4
8 Ruud ACHEVER90 Plus
8 Goodman GSZ130301AB 2.5 13
8 Payne PA10JA036-A 3 10
8 Payne PA10JA036-G 3 10
9 Payne PA12NA048-G 4 12 2
9 Carrier Weathermaker 9200 58MCA
9 Goodman CE60-IFB 10
10 Carrier Tech 2000SS JKCP39FG 2
10 Goodman Furnace AFUE 95.0
10 Payne PA10JA048-C 4 10
11 Payne 710AJ60-A 5 10 1
12 Payne PA10JA048-D 4 10 2
12 Ruud Achiever UAKA-060JAZ 5 10
14 Payne PA13NR048-E 4 13 2
14 Carrier 38CKC048300 4
15 Payne PA12NA048-G 4 12 2
15 Payne PA12NA060-G 5 12
16 Payne 810AJ048-A 4 10 3
16 Payne PH10JA048-B 4 10
16 Payne PH13NR048-F 4 13
17 Payne PA10JA030-G 2.5 10 2
17 Payne PA13NR030-H 2.5 13
18 Carrier 38VN030300SM 2.5 10 2
18 Payne PA10JH030-C 2.5 10
18 Carrier 38EN030300SM 2.5 10
19 LG LWHD8008RY9 (window unit) 2
19 Payne PA13NA036-C 3 13
19 American Standard 2A7A1030A1000AA 2.5 10
19 Trane BTR730E100A0 2.5 10
20 Trane TTR730A100A0 2.5 10 2
20 Trane TTR730A100A0 2.5 10
20 Trane TTR730A100A0 2.5 10
21 York H1RA042506A 3.5 10 2
21 York H2RA036506A 3 10
22 Payne PA10JA060 5 10 2
22 Carrier 38CK036340 3 10
22 Carrier 38CKC060300 5 10
23 Carrier 38CKC036350 3 10 2
23 Carrier 38CKC060300 5 10
24 Carrier 24ABB348A510 4 13 2
24 GE 38CKC048520 4 10
25 Carrier 38CKC048520 4 10 2
25 Carrier 38CKC048520 4 10
26 Carrier 38BRC0408360 4 12 2
26 Carrier 38BRC060340 5 12
27 Carrier 38BRC060340 5 12 2
27 Carrier 38BRC048360 4 12
28 Trane 2YCC3030A1040AA 2
28 Trane 2YCC3024A1040AA
28 Trane 2YCC3042A1075AA
28 Trane 2YCC3024A1040AA
HVAC Equipment Information
APPENDIX H
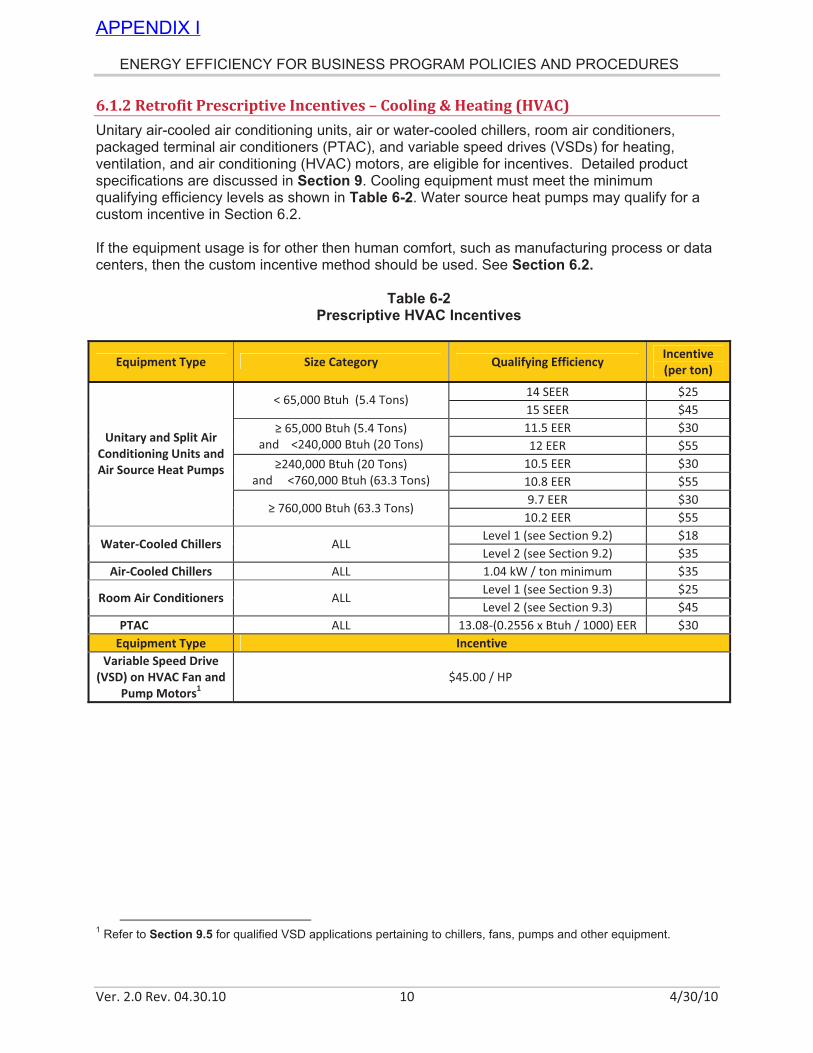
ENERGY EFFICIENCY FOR BUSINESS PROGRAM POLICIES AND PROCEDURES
Ver. 2.0 Rev. 04.30.10 10 4/30/10
6.1.2 Retrofit Prescriptive Incentives – Cooling & Heating (HVAC)
Unitary air-cooled air conditioning units, air or water-cooled chillers, room air conditioners, packaged terminal air conditioners (PTAC), and variable speed drives (VSDs) for heating, ventilation, and air conditioning (HVAC) motors, are eligible for incentives. Detailed product specifications are discussed in Section 9. Cooling equipment must meet the minimum qualifying efficiency levels as shown in Table 6-2. Water source heat pumps may qualify for a custom incentive in Section 6.2. If the equipment usage is for other then human comfort, such as manufacturing process or data centers, then the custom incentive method should be used. See Section 6.2.
Table 6-2 Prescriptive HVAC Incentives
Equipment Type Size Category Qualifying Efficiency Incentive
(per ton)
14 SEER $25 < 65,000 Btuh (5.4 Tons)
15 SEER $45
11.5 EER $30 ! 65,000 Btuh (5.4 Tons)
and <240,000 Btuh (20 Tons) 12 EER $55
10.5 EER $30 !240,000 Btuh (20 Tons)
and <760,000 Btuh (63.3 Tons) 10.8 EER $55
9.7 EER $30
Unitary and Split Air
Conditioning Units and
Air Source Heat Pumps
! 760,000 Btuh (63.3 Tons) 10.2 EER $55
Level 1 (see Section 9.2) $18 Water!Cooled Chillers ALL
Level 2 (see Section 9.2) $35
Air!Cooled Chillers ALL 1.04 kW / ton minimum $35
Level 1 (see Section 9.3) $25 Room Air Conditioners ALL
Level 2 (see Section 9.3) $45
PTAC ALL 13.08"(0.2556 x Btuh / 1000) EER $30
Equipment Type Incentive
Variable Speed Drive
(VSD) on HVAC Fan and
Pump Motors1
$45.00 / HP
1 Refer to Section 9.5 for qualified VSD applications pertaining to chillers, fans, pumps and other equipment.
APPENDIX I
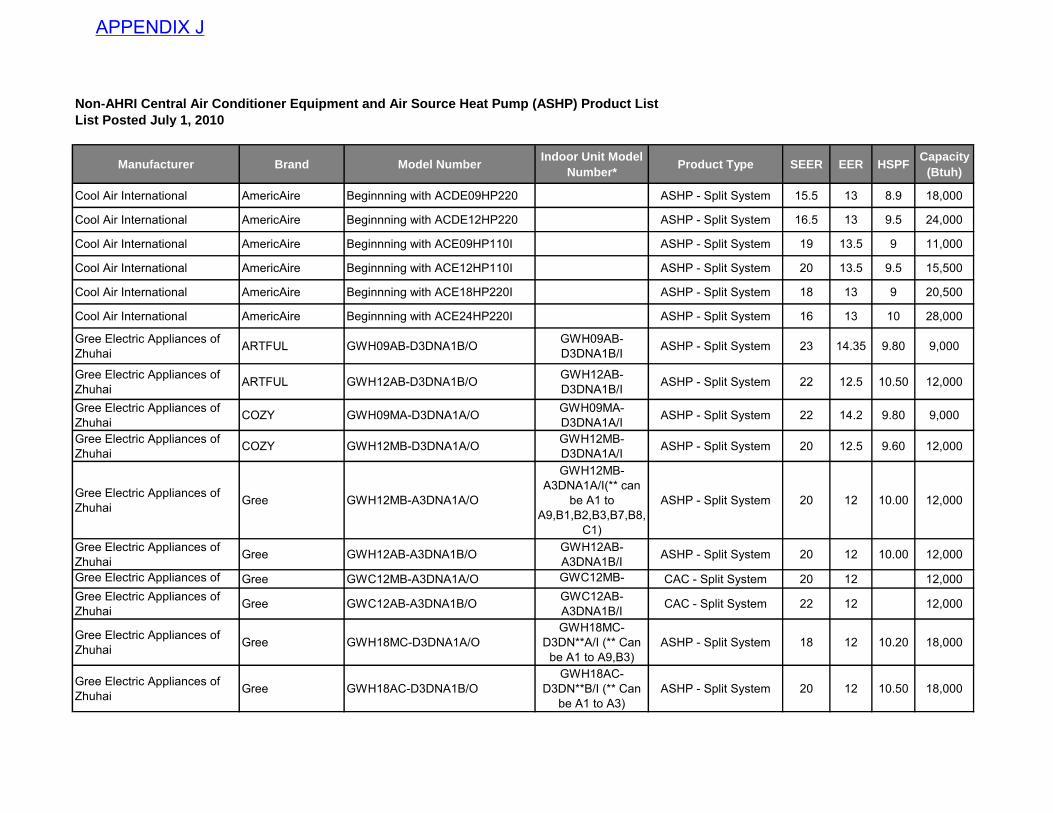
Non-AHRI Central Air Conditioner Equipment and Air Source Heat Pump (ASHP) Product List
List Posted July 1, 2010
Manufacturer Brand Model NumberIndoor Unit Model
Number*Product Type SEER EER HSPF
Capacity
(Btuh)
Cool Air International AmericAire Beginnning with ACDE09HP220 ASHP - Split System 15.5 13 8.9 18,000
Cool Air International AmericAire Beginnning with ACDE12HP220 ASHP - Split System 16.5 13 9.5 24,000
Cool Air International AmericAire Beginnning with ACE09HP110I ASHP - Split System 19 13.5 9 11,000
Cool Air International AmericAire Beginnning with ACE12HP110I ASHP - Split System 20 13.5 9.5 15,500
Cool Air International AmericAire Beginnning with ACE18HP220I ASHP - Split System 18 13 9 20,500
Cool Air International AmericAire Beginnning with ACE24HP220I ASHP - Split System 16 13 10 28,000
Gree Electric Appliances of Zhuhai ARTFUL GWH09AB-D3DNA1B/O GWH09AB-
D3DNA1B/I ASHP - Split System 23 14.35 9.80 9,000
Gree Electric Appliances of Zhuhai ARTFUL GWH12AB-D3DNA1B/O GWH12AB-
D3DNA1B/I ASHP - Split System 22 12.5 10.50 12,000
Gree Electric Appliances of Zhuhai COZY GWH09MA-D3DNA1A/O GWH09MA-
D3DNA1A/I ASHP - Split System 22 14.2 9.80 9,000
Gree Electric Appliances of Zhuhai COZY GWH12MB-D3DNA1A/O GWH12MB-
D3DNA1A/I ASHP - Split System 20 12.5 9.60 12,000
Gree Electric Appliances of Zhuhai Gree GWH12MB-A3DNA1A/O
GWH12MB-A3DNA1A/I(** can
be A1 to A9,B1,B2,B3,B7,B8,
C1)
ASHP - Split System 20 12 10.00 12,000
Gree Electric Appliances of Zhuhai Gree GWH12AB-A3DNA1B/O GWH12AB-
A3DNA1B/I ASHP - Split System 20 12 10.00 12,000
Gree Electric Appliances of Zhuhai
Gree GWC12MB-A3DNA1A/O GWC12MB-A3DNA1A/I(** can
CAC - Split System 20 12 12,000Gree Electric Appliances of Zhuhai Gree GWC12AB-A3DNA1B/O GWC12AB-
A3DNA1B/I CAC - Split System 22 12 12,000
Gree Electric Appliances of Zhuhai Gree GWH18MC-D3DNA1A/O
GWH18MC-D3DN**A/I (** Can
be A1 to A9,B3)ASHP - Split System 18 12 10.20 18,000
Gree Electric Appliances of Zhuhai Gree GWH18AC-D3DNA1B/O
GWH18AC-D3DN**B/I (** Can
be A1 to A3)ASHP - Split System 20 12 10.50 18,000
APPENDIX J
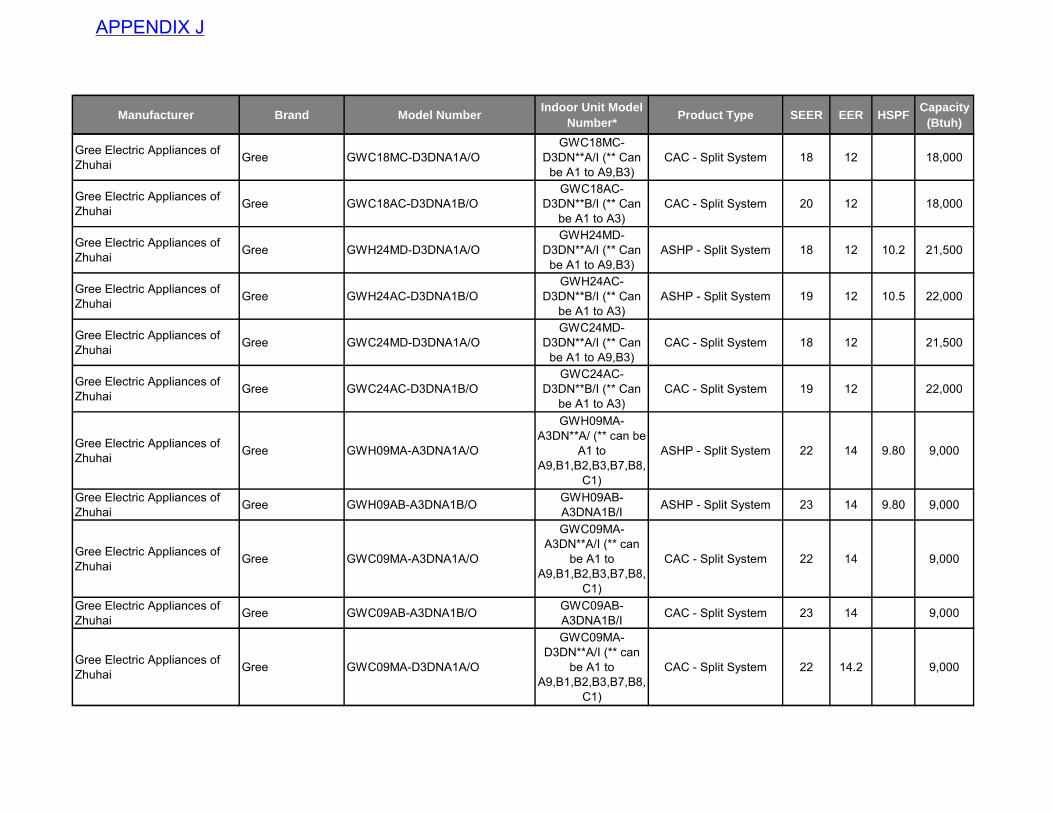
Manufacturer Brand Model NumberIndoor Unit Model
Number*Product Type SEER EER HSPF
Capacity
(Btuh)
Gree Electric Appliances of Zhuhai Gree GWC18MC-D3DNA1A/O
GWC18MC-D3DN**A/I (** Can
be A1 to A9,B3)CAC - Split System 18 12 18,000
Gree Electric Appliances of Zhuhai Gree GWC18AC-D3DNA1B/O
GWC18AC-D3DN**B/I (** Can
be A1 to A3)CAC - Split System 20 12 18,000
Gree Electric Appliances of Zhuhai Gree GWH24MD-D3DNA1A/O
GWH24MD-D3DN**A/I (** Can
be A1 to A9,B3)ASHP - Split System 18 12 10.2 21,500
Gree Electric Appliances of Zhuhai Gree GWH24AC-D3DNA1B/O
GWH24AC-D3DN**B/I (** Can
be A1 to A3)ASHP - Split System 19 12 10.5 22,000
Gree Electric Appliances of Zhuhai Gree GWC24MD-D3DNA1A/O
GWC24MD-D3DN**A/I (** Can
be A1 to A9,B3)CAC - Split System 18 12 21,500
Gree Electric Appliances of Zhuhai Gree GWC24AC-D3DNA1B/O
GWC24AC-D3DN**B/I (** Can
be A1 to A3)CAC - Split System 19 12 22,000
Gree Electric Appliances of Zhuhai Gree GWH09MA-A3DNA1A/O
GWH09MA-A3DN**A/ (** can be
A1 to A9,B1,B2,B3,B7,B8,
C1)
ASHP - Split System 22 14 9.80 9,000
Gree Electric Appliances of Zhuhai Gree GWH09AB-A3DNA1B/O GWH09AB-
A3DNA1B/I ASHP - Split System 23 14 9.80 9,000
Gree Electric Appliances of Zhuhai Gree GWC09MA-A3DNA1A/O
GWC09MA-A3DN**A/I (** can
be A1 to A9,B1,B2,B3,B7,B8,
C1)
CAC - Split System 22 14 9,000
Gree Electric Appliances of Zhuhai Gree GWC09AB-A3DNA1B/O GWC09AB-
A3DNA1B/I CAC - Split System 23 14 9,000
Gree Electric Appliances of Zhuhai Gree GWC09MA-D3DNA1A/O
GWC09MA-D3DN**A/I (** can
be A1 to A9,B1,B2,B3,B7,B8,
C1)
CAC - Split System 22 14.2 9,000
APPENDIX J
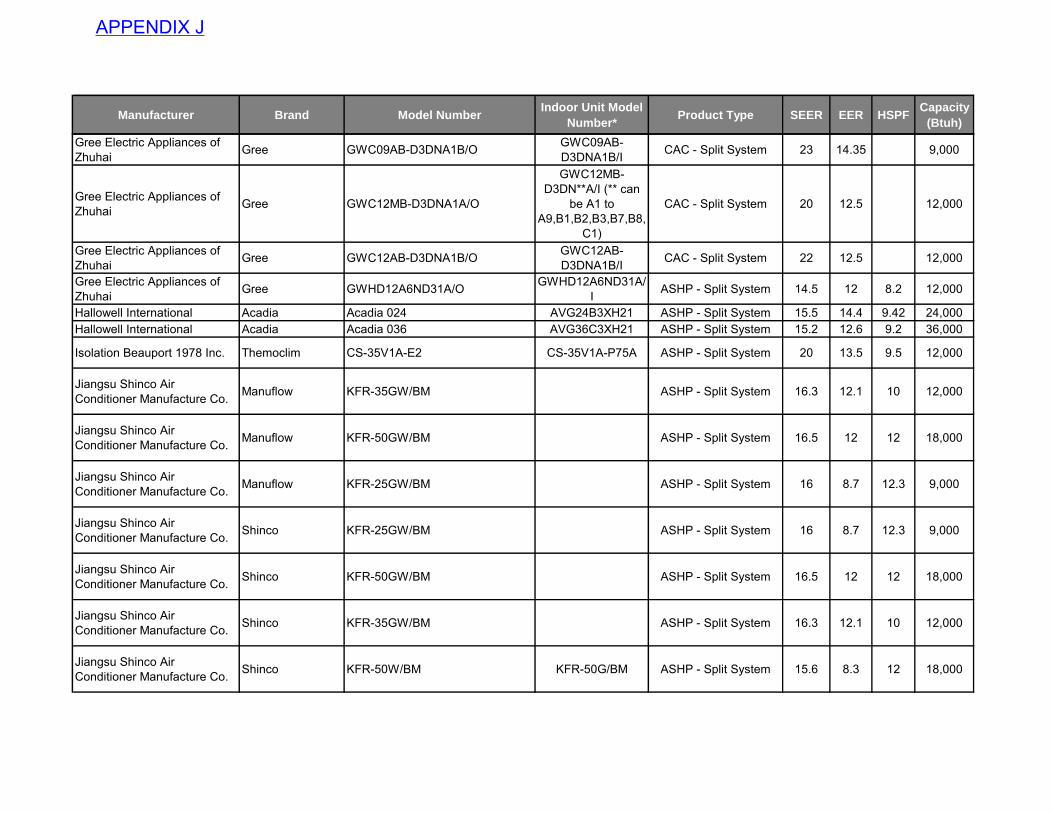
Manufacturer Brand Model NumberIndoor Unit Model
Number*Product Type SEER EER HSPF
Capacity
(Btuh)
Gree Electric Appliances of Zhuhai Gree GWC09AB-D3DNA1B/O GWC09AB-
D3DNA1B/I CAC - Split System 23 14.35 9,000
Gree Electric Appliances of Zhuhai Gree GWC12MB-D3DNA1A/O
GWC12MB-D3DN**A/I (** can
be A1 to A9,B1,B2,B3,B7,B8,
C1)
CAC - Split System 20 12.5 12,000
Gree Electric Appliances of Zhuhai Gree GWC12AB-D3DNA1B/O GWC12AB-
D3DNA1B/I CAC - Split System 22 12.5 12,000
Gree Electric Appliances of Zhuhai Gree GWHD12A6ND31A/O GWHD12A6ND31A/
I ASHP - Split System 14.5 12 8.2 12,000
Hallowell International Acadia Acadia 024 AVG24B3XH21 ASHP - Split System 15.5 14.4 9.42 24,000Hallowell International Acadia Acadia 036 AVG36C3XH21 ASHP - Split System 15.2 12.6 9.2 36,000
Isolation Beauport 1978 Inc. Themoclim CS-35V1A-E2 CS-35V1A-P75A ASHP - Split System 20 13.5 9.5 12,000
Jiangsu Shinco Air Conditioner Manufacture Co. Manuflow KFR-35GW/BM ASHP - Split System 16.3 12.1 10 12,000
Jiangsu Shinco Air Conditioner Manufacture Co. Manuflow KFR-50GW/BM ASHP - Split System 16.5 12 12 18,000
Jiangsu Shinco Air Conditioner Manufacture Co. Manuflow KFR-25GW/BM ASHP - Split System 16 8.7 12.3 9,000
Jiangsu Shinco Air Conditioner Manufacture Co. Shinco KFR-25GW/BM ASHP - Split System 16 8.7 12.3 9,000
Jiangsu Shinco Air Conditioner Manufacture Co. Shinco KFR-50GW/BM ASHP - Split System 16.5 12 12 18,000
Jiangsu Shinco Air Conditioner Manufacture Co. Shinco KFR-35GW/BM ASHP - Split System 16.3 12.1 10 12,000
Jiangsu Shinco Air Conditioner Manufacture Co. Shinco KFR-50W/BM KFR-50G/BM ASHP - Split System 15.6 8.3 12 18,000
APPENDIX J
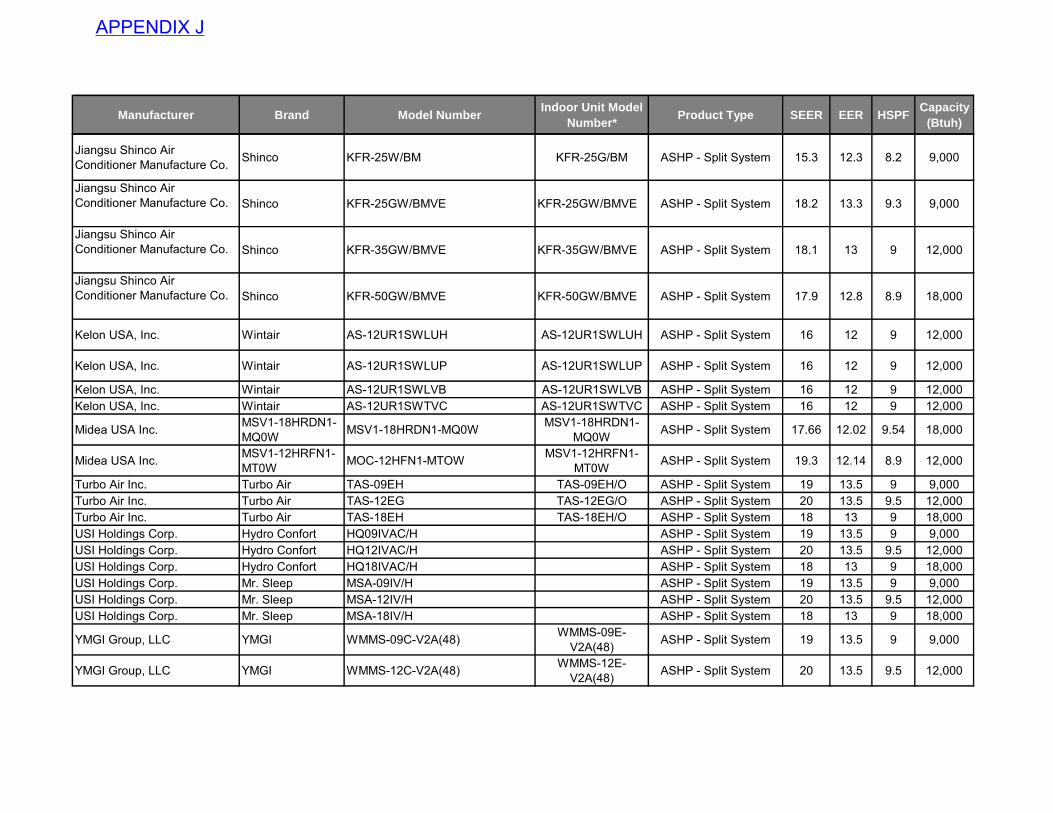
Manufacturer Brand Model NumberIndoor Unit Model
Number*Product Type SEER EER HSPF
Capacity
(Btuh)
Jiangsu Shinco Air Conditioner Manufacture Co. Shinco KFR-25W/BM KFR-25G/BM ASHP - Split System 15.3 12.3 8.2 9,000
Jiangsu Shinco Air Conditioner Manufacture Co. Shinco KFR-25GW/BMVE KFR-25GW/BMVE ASHP - Split System 18.2 13.3 9.3 9,000
Jiangsu Shinco Air Conditioner Manufacture Co. Shinco KFR-35GW/BMVE KFR-35GW/BMVE ASHP - Split System 18.1 13 9 12,000
Jiangsu Shinco Air Conditioner Manufacture Co. Shinco KFR-50GW/BMVE KFR-50GW/BMVE ASHP - Split System 17.9 12.8 8.9 18,000
Kelon USA, Inc. Wintair AS-12UR1SWLUH AS-12UR1SWLUH ASHP - Split System 16 12 9 12,000
Kelon USA, Inc. Wintair AS-12UR1SWLUP AS-12UR1SWLUP ASHP - Split System 16 12 9 12,000
Kelon USA, Inc. Wintair AS-12UR1SWLVB AS-12UR1SWLVB ASHP - Split System 16 12 9 12,000Kelon USA, Inc. Wintair AS-12UR1SWTVC AS-12UR1SWTVC ASHP - Split System 16 12 9 12,000
Midea USA Inc. MSV1-18HRDN1-MQ0W MSV1-18HRDN1-MQ0W MSV1-18HRDN1-
MQ0W ASHP - Split System 17.66 12.02 9.54 18,000
Midea USA Inc. MSV1-12HRFN1- MT0W MOC-12HFN1-MTOW MSV1-12HRFN1-
MT0W ASHP - Split System 19.3 12.14 8.9 12,000
Turbo Air Inc. Turbo Air TAS-09EH TAS-09EH/O ASHP - Split System 19 13.5 9 9,000Turbo Air Inc. Turbo Air TAS-12EG TAS-12EG/O ASHP - Split System 20 13.5 9.5 12,000Turbo Air Inc. Turbo Air TAS-18EH TAS-18EH/O ASHP - Split System 18 13 9 18,000USI Holdings Corp. Hydro Confort HQ09IVAC/H ASHP - Split System 19 13.5 9 9,000USI Holdings Corp. Hydro Confort HQ12IVAC/H ASHP - Split System 20 13.5 9.5 12,000USI Holdings Corp. Hydro Confort HQ18IVAC/H ASHP - Split System 18 13 9 18,000USI Holdings Corp. Mr. Sleep MSA-09IV/H ASHP - Split System 19 13.5 9 9,000USI Holdings Corp. Mr. Sleep MSA-12IV/H ASHP - Split System 20 13.5 9.5 12,000USI Holdings Corp. Mr. Sleep MSA-18IV/H ASHP - Split System 18 13 9 18,000
YMGI Group, LLC YMGI WMMS-09C-V2A(48) WMMS-09E-V2A(48) ASHP - Split System 19 13.5 9 9,000
YMGI Group, LLC YMGI WMMS-12C-V2A(48) WMMS-12E-V2A(48) ASHP - Split System 20 13.5 9.5 12,000
APPENDIX J
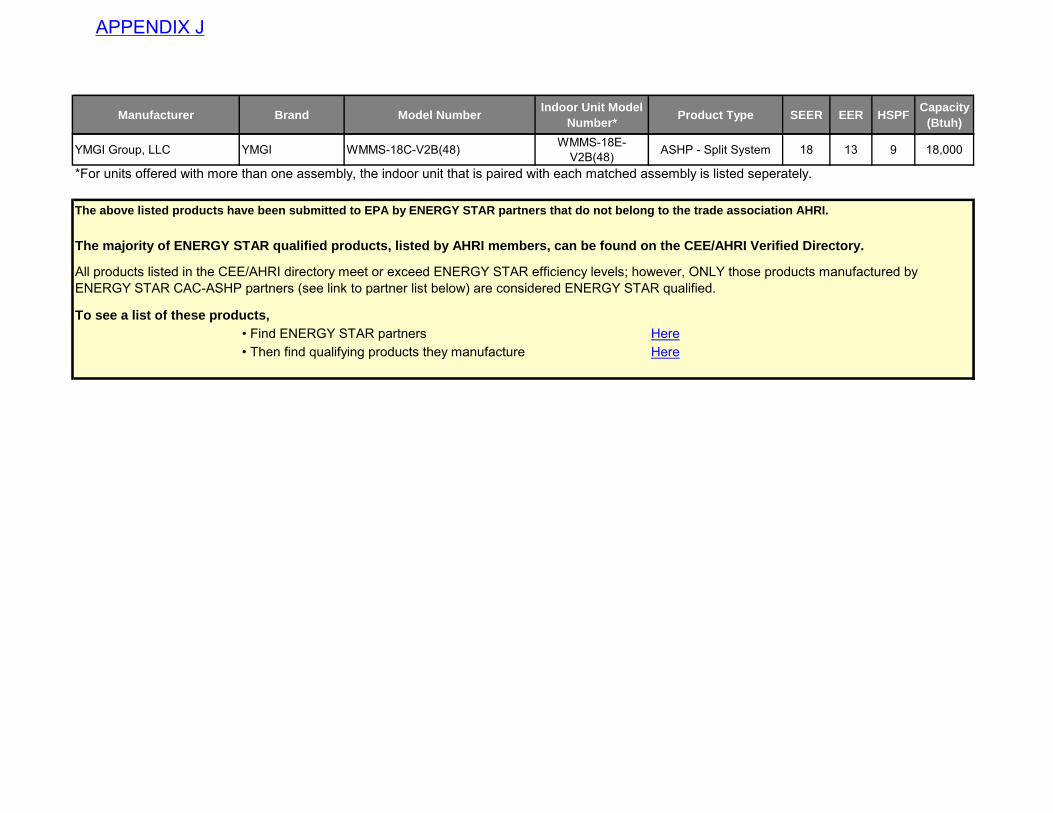
Manufacturer Brand Model NumberIndoor Unit Model
Number*Product Type SEER EER HSPF
Capacity
(Btuh)
YMGI Group, LLC YMGI WMMS-18C-V2B(48) WMMS-18E-V2B(48) ASHP - Split System 18 13 9 18,000
To see a list of these products,
HereHere
*For units offered with more than one assembly, the indoor unit that is paired with each matched assembly is listed seperately.
The above listed products have been submitted to EPA by ENERGY STAR partners that do not belong to the trade association AHRI.
The majority of ENERGY STAR qualified products, listed by AHRI members, can be found on the CEE/AHRI Verified Directory.
All products listed in the CEE/AHRI directory meet or exceed ENERGY STAR efficiency levels; however, ONLY those products manufactured by ENERGY STAR CAC-ASHP partners (see link to partner list below) are considered ENERGY STAR qualified.
• Find ENERGY STAR partners• Then find qualifying products they manufacture
APPENDIX J
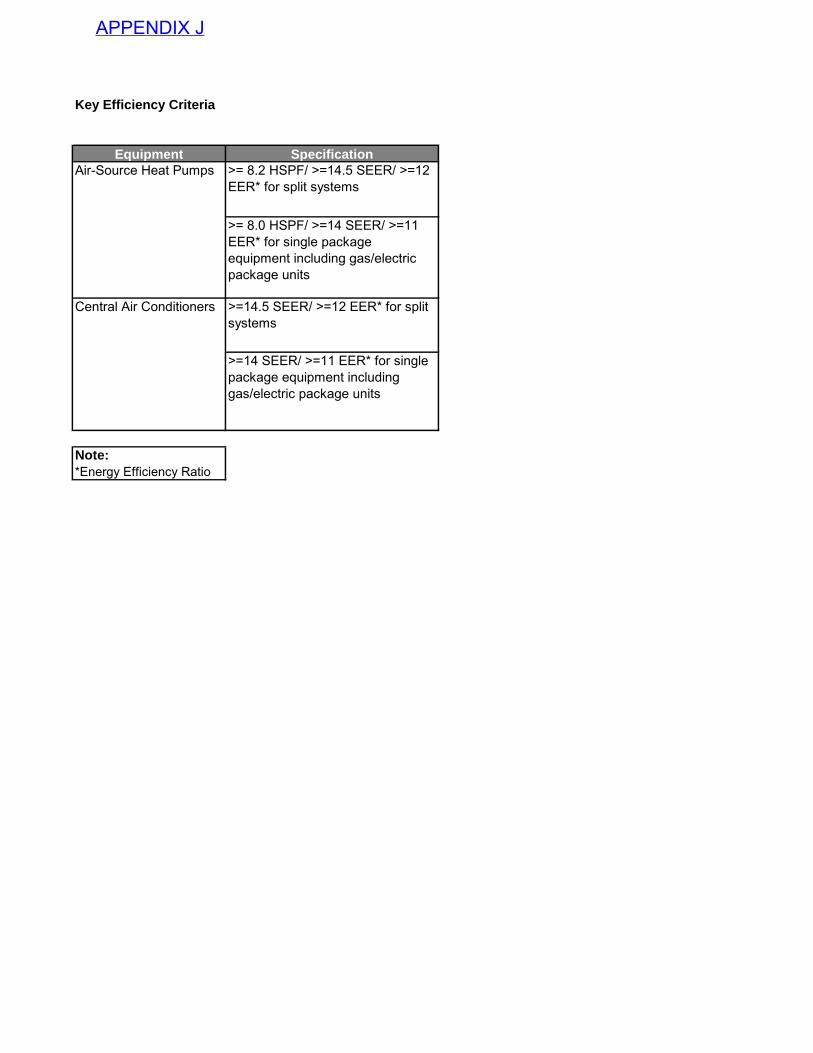
Key Efficiency Criteria
Equipment Specification
>= 8.2 HSPF/ >=14.5 SEER/ >=12 EER* for split systems
>= 8.0 HSPF/ >=14 SEER/ >=11 EER* for single package equipment including gas/electric package units
>=14.5 SEER/ >=12 EER* for split systems
>=14 SEER/ >=11 EER* for single package equipment including gas/electric package units
Note:
*Energy Efficiency Ratio
Air-Source Heat Pumps
Central Air Conditioners
APPENDIX J
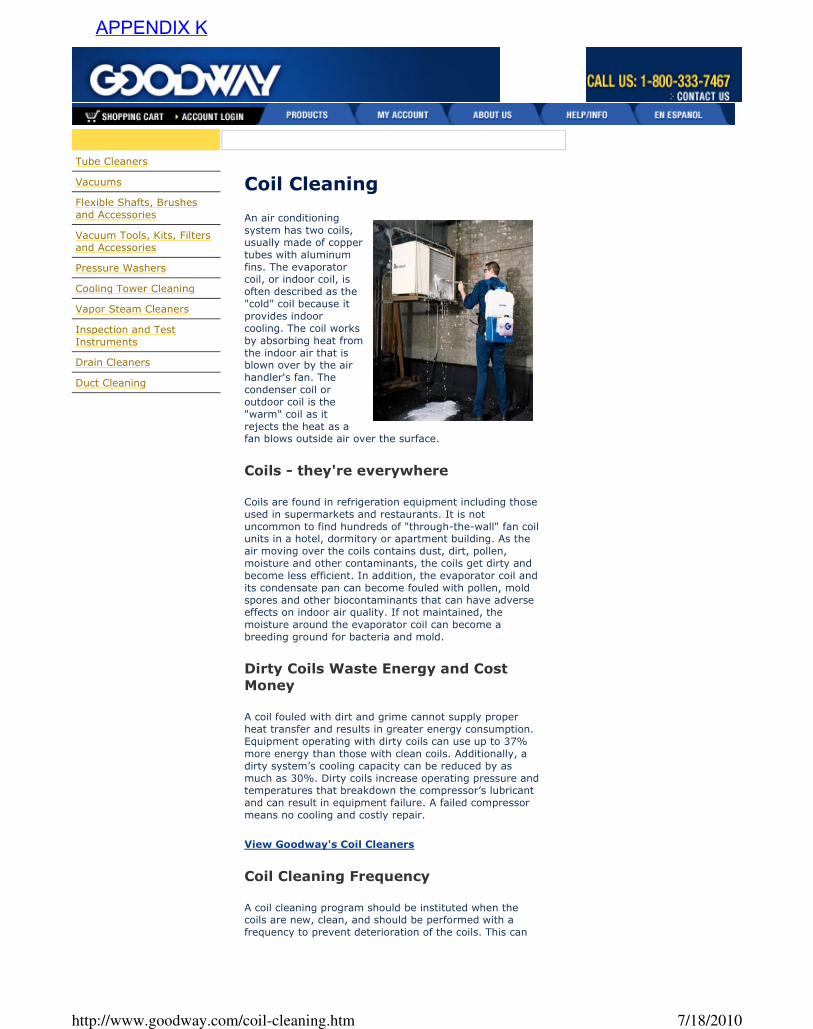
Tube Cleaners
Vacuums
Flexible Shafts, Brushes
and Accessories
Vacuum Tools, Kits, Filters
and Accessories
Pressure Washers
Cooling Tower Cleaning
Vapor Steam Cleaners
Inspection and Test
Instruments
Drain Cleaners
Duct Cleaning
Coil Cleaning
An air conditioning
system has two coils,
usually made of copper
tubes with aluminum
fins. The evaporator coil, or indoor coil, is
often described as the
"cold" coil because it
provides indoor
cooling. The coil works
by absorbing heat from
the indoor air that is blown over by the air
handler's fan. The
condenser coil or
outdoor coil is the
"warm" coil as it
rejects the heat as a fan blows outside air over the surface.
Coils - they're everywhere
Coils are found in refrigeration equipment including those
used in supermarkets and restaurants. It is not
uncommon to find hundreds of "through-the-wall" fan coil units in a hotel, dormitory or apartment building. As the
air moving over the coils contains dust, dirt, pollen,
moisture and other contaminants, the coils get dirty and
become less efficient. In addition, the evaporator coil and
its condensate pan can become fouled with pollen, mold
spores and other biocontaminants that can have adverse effects on indoor air quality. If not maintained, the
moisture around the evaporator coil can become a
breeding ground for bacteria and mold.
Dirty Coils Waste Energy and Cost
Money
A coil fouled with dirt and grime cannot supply proper
heat transfer and results in greater energy consumption.
Equipment operating with dirty coils can use up to 37%
more energy than those with clean coils. Additionally, a
dirty system’s cooling capacity can be reduced by as
much as 30%. Dirty coils increase operating pressure and temperatures that breakdown the compressor’s lubricant
and can result in equipment failure. A failed compressor
means no cooling and costly repair.
View Goodway's Coil Cleaners
Coil Cleaning Frequency
A coil cleaning program should be instituted when the coils are new, clean, and should be performed with a
frequency to prevent deterioration of the coils. This can
Page 1 of 7Coil Cleaning - CoilPro From Goodway
7/18/2010http://www.goodway.com/coil-cleaning.htm
APPENDIX K
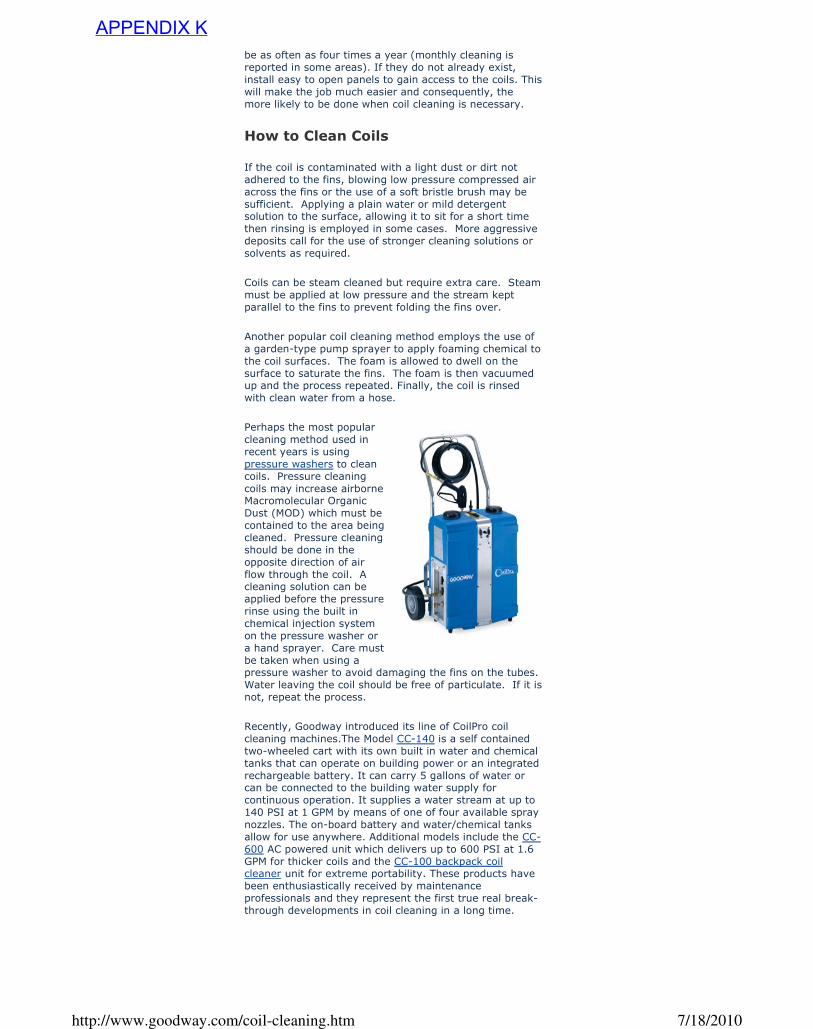
be as often as four times a year (monthly cleaning is
reported in some areas). If they do not already exist,
install easy to open panels to gain access to the coils. This
will make the job much easier and consequently, the
more likely to be done when coil cleaning is necessary.
How to Clean Coils
If the coil is contaminated with a light dust or dirt not
adhered to the fins, blowing low pressure compressed air
across the fins or the use of a soft bristle brush may be
sufficient. Applying a plain water or mild detergent solution to the surface, allowing it to sit for a short time
then rinsing is employed in some cases. More aggressive
deposits call for the use of stronger cleaning solutions or
solvents as required.
Coils can be steam cleaned but require extra care. Steam
must be applied at low pressure and the stream kept
parallel to the fins to prevent folding the fins over.
Another popular coil cleaning method employs the use of
a garden-type pump sprayer to apply foaming chemical to
the coil surfaces. The foam is allowed to dwell on the
surface to saturate the fins. The foam is then vacuumed up and the process repeated. Finally, the coil is rinsed
with clean water from a hose.
Perhaps the most popular
cleaning method used in
recent years is using
pressure washers to clean
coils. Pressure cleaning
coils may increase airborne Macromolecular Organic
Dust (MOD) which must be
contained to the area being
cleaned. Pressure cleaning
should be done in the
opposite direction of air
flow through the coil. A cleaning solution can be
applied before the pressure
rinse using the built in
chemical injection system
on the pressure washer or
a hand sprayer. Care must
be taken when using a pressure washer to avoid damaging the fins on the tubes.
Water leaving the coil should be free of particulate. If it is
not, repeat the process.
Recently, Goodway introduced its line of CoilPro coil
cleaning machines.The Model CC-140 is a self contained
two-wheeled cart with its own built in water and chemical
tanks that can operate on building power or an integrated
rechargeable battery. It can carry 5 gallons of water or can be connected to the building water supply for
continuous operation. It supplies a water stream at up to
140 PSI at 1 GPM by means of one of four available spray
nozzles. The on-board battery and water/chemical tanks
allow for use anywhere. Additional models include the CC-
600 AC powered unit which delivers up to 600 PSI at 1.6
GPM for thicker coils and the CC-100 backpack coil cleaner unit for extreme portability. These products have
been enthusiastically received by maintenance
professionals and they represent the first true real break-
through developments in coil cleaning in a long time.
Page 2 of 7Coil Cleaning - CoilPro From Goodway
7/18/2010http://www.goodway.com/coil-cleaning.htm
APPENDIX K
Coil Cleaning Chemicals
There are many acid and alkaline based cleaners available
to clean coils. These chemicals clean by creating a
chemical reaction between the cleaner and the metal that
harms the surface of the metal. This damages the coils by
causing metal loss over time. Acid and alkaline based
chemicals carry with them an inherent danger to
personnel and equipment.
The foaming properties of many coil cleaning formulations
is important to help float debris our of the coil body where it can be rinsed away.
While some chemicals are advertised as "no rinse", many believe that all cleaning chemicals should be thoroughly
rinsed from the surface to prevent coil damage.
To clean coils, Goodway offers CoilShine, a biodegradable,
expanding foam detergent specifically formulated for use
with the CoilPro. This is a non-acidic, non-fuming solution
that can be safely washed down drains. CoilShine-BC is a
commercial grade, ready-to-use mold inhibitor for HVAC
systems that helps prevent the growth of odor, stain and
damage causing organisms such as mold, mildew and fungi.
Don't Forget the Condensate Pan
The air drawn across a cooling coil contains water vapor
which condenses and collects in a pan under the coil called a condensate pan. The pan is connected to a drain
line to keep the pan from overflowing and causing
damage to the air handler or other building structures. As
it is generally wet, microorganisms can form colonies in
the condensate pan. Cleaning the condensate pan and
checking for proper drainage is an important part of the coil cleaning process.
To help prevent growth of these organisms, the pan
should be treated between cleanings with a biocide. Goodway's PanCare is one example. PanCare is
formulated to prevent the build-up of slime and harmful
bacteria in condensate pans. It kills 99% of Legionella
Pheumophilia and Salmonella Typhii Bacteria. It also
contains a ruse inhibitor and an acid rain neutralizer and
will work for up to 3 months on a 3 to 5 ton system.
Goodway's Line Of Coil Cleaning
Products
Backpack CoilPro Coil
Cleaner
Goodway’s CC-100
Backpack CoilPro makes your job easier. The
unique battery powered
coil cleaner is the solution
for all your mobile and
hard to reach coil cleaning
applications. Spray bottles
and pump sprayers are simply not effective in
penetrating most coil beds. In addition, many “coil
cleaner” chemicals can actually damage the coils or create
noxious fumes. After a lot of customer input, our
Page 3 of 7Coil Cleaning - CoilPro From Goodway
7/18/2010http://www.goodway.com/coil-cleaning.htm
APPENDIX K
engineers have redesigned our unique coil cleaning
system, containing all of the features needed in a truly
mobile package!
Features:
� Deep cycle 12 V rechargeable battery
� Integrated 5 gallon water tank
� Integrated 3 quart chemical tank
More Features
See Accessories For The CC-100
Backpack CoilPro with
Dolly
Goodway’s CC-100-D
Dolly mounted CoilPro
makes your job easier.
This unique battery powered coil cleaner is the
solution for all your mobile
and hard to reach coil
cleaning applications.
Spray bottles and pump
sprayers are simply not
effective in penetrating most coil beds. In
addition, many “coil
cleaner” chemicals can actually damage the coils or create
noxious fumes. After a lot of customer input, our
engineers have redesigned our unique coil cleaning
system, containing all of the features needed in a truly mobile package!
Features:
� Wheel and Dolly Assembly
� Deep cycle 12 V rechargeable battery
� Integrated 5 gallon water tank � Integrated 3 quart chemical tank
More Features See Accessories For The CC-100-D
CoilPro Self Contained Coil Cleaning System
Goodway’s CC-140 CoilPro Battery Powered Coil
Cleaner is the solution for
your coil cleaning
applications. Spray bottles
and pump sprayers are
simply not effective in penetrating most coil
beds. In addition, many
“coil cleaner” chemicals
can actually damage the
coils or create noxious
fumes. This unique coil
cleaning system is most efficient when used with our non-fuming CoilShine, environmentally friendly expanding
foam detergent.
Features:
Page 4 of 7Coil Cleaning - CoilPro From Goodway
7/18/2010http://www.goodway.com/coil-cleaning.htm
APPENDIX K
� Integrated water tank
� Integrated soap container
� 12 V rechargeable battery
More Features
See Accessories For The CC-140
CoilPro with CoilVac
The total coil cleaning
system! Sames as CC-140
but with CoilVac Dry HEPA
Vacuum mounted on dolly,
including filters,stainless steel tank, 6' vinyl crush
proof hose, two piece 36"
wand, 19" flexible
extension wand, 3" dual
bristle dusting brush, 3"
long bristle dusting brush,
5" blower/bulk pickup nozzle, four piece 29" flat
wand with crevice tool tip
and 6" flat brush, CoilVac mounting bracket and tool bin.
The CC-140 is designed to be flexible. The unit can be
used for just about any coil cleaning application. It can
operate on AC power, or on its integrated rechargeable battery.
Features:
� Integrated water tank
� Integrated soap container � 12 V rechargeable battery
More Features See Accessories For The CC-140-KIT
CoilPro Coil Cleaner
For washing those thick,
hard to reach coils, turn to the CC-600 High Flow
CoilPro Coil Cleaner. With
an output water pressure
of 300 or 600 PSI at 1.6
GPM, this unit delivers the
cleaning force necessary to penetrate thick coil
beds. When used with
CoilShine, our
environmentally friendly,
non-fuming, expanding
foam detergent, it will give
you the cleanest coils possible.The CC-600 is designed to be used on large
multiple-pass coil beds. It operates on AC power. The unit
can connect to a 3/4" water line for continuous operation,
or can draw from either of its own 5 gallon tanks.The
operator simply applies a thick layer of CoilShine,
Goodway's expanding foam detergent, using the custom
foaming nozzle.
Features:
� Integrated 5 gallon water tank
Page 5 of 7Coil Cleaning - CoilPro From Goodway
7/18/2010http://www.goodway.com/coil-cleaning.htm
APPENDIX K
� Integrated 5 gallon chemical tank
� Chemical control valve
More Features
See Accessories For The CC-600
CoilPro Cleaner with
CoilVac
The CC-600-KIT Same as
CC-600 CoilPro but also
includes a CoilVac Dry
HEPA Vacuum so the
operator can first vacuum heavy debris from the coil
before applying chemical
and spraying down with
the CoilPro. Both the
CoilPro CC-600 and
CoilVac operate on AC
power. The CC-600 can connect to a 3/4" water
line for continuous
operation, or can draw from either of its own 5 gallon
tanks.The operator simply applies a thick layer of
CoilShine, Goodway’s expanding foam detergent, using
the custom foaming nozzle.
Features:
� Integrated 5 gallon water tank
� Integrated 5 gallon chemical tank
� Chemical control valve
More Features
See Accessories For The CC-600-KIT
CoilPro Jr.
The CoilPro line of coil cleaners has become the industry
standard for HVAC maintenance professionals. In a
constant effort to provide our customers with products designed for their specific application, the CoilPro Jr. was
created.
What our Customers Say
Anthony Rizzica, Senior Engineer at Yeshiva University's In New York, NY
When asked about the performance of the CoilPro,
"We actually cleaned the coils so well that we gained
almost 50 to 60 tons worth of cooling last summer and
saved around $75,000.00 to $80,000.00. If I had to put a return on investment on it, I would say for every 25 to 50
coils that we clean, the machine pays for itself".
When asked what other savings does Anthony see using
the CoilPro,
"Well man-hours are a saving - it only takes one man to
operate. It's convenient. What used to take us a week, we now do in two or three days."
When asked to compare the CoilPro to conventional
pressure washers,
"It’s more portable, it’s definitely lighter in weight. I like
Page 6 of 7Coil Cleaning - CoilPro From Goodway
7/18/2010http://www.goodway.com/coil-cleaning.htm
APPENDIX K

the tanks that hold the chemical and water – there’s no
hose involved. The battery pack is a great saver, too. We
don’t have to worry about cords being plugged in, people
tripping, hazards and all. Safety is always a concern
around here."
View Goodway's Coil Cleaners
Goodway Technologies
Corporation
Goodway Technologies Corporation was founded in 1966
by Per K. Reichborn. Since its earliest days, the company
has built a reputation for manufacturing the highest
quality cleaning systems in the world. "This commitment"
says Reichborn, "not only extends to our manufacturing,
but to everything we do, every day, for every product and service. Achieving this high quality of performance is the
shared responsibility of each employee in every
department."
Today, Goodway cleaning machines span the globe. From
Afghanistan to Zimbabwe, Goodway equipment is used in
over 125 countries and on every continent, including
Antarctica.
To view a complete line of Goodway cleaning machines or
to receive more information about a Goodway cleaning
machine or to purchase a Goodway cleaning machine
please visit Goodway.com or contact Goodway Technologies Corporation at 1 800 333-7467.
Home | Shop Online | My Account | Company Info | Product Support | Contact Us | ©Copyright 2005 GoodWay, Inc. All Rights
Reserved
Page 7 of 7Coil Cleaning - CoilPro From Goodway
7/18/2010http://www.goodway.com/coil-cleaning.htm
APPENDIX K
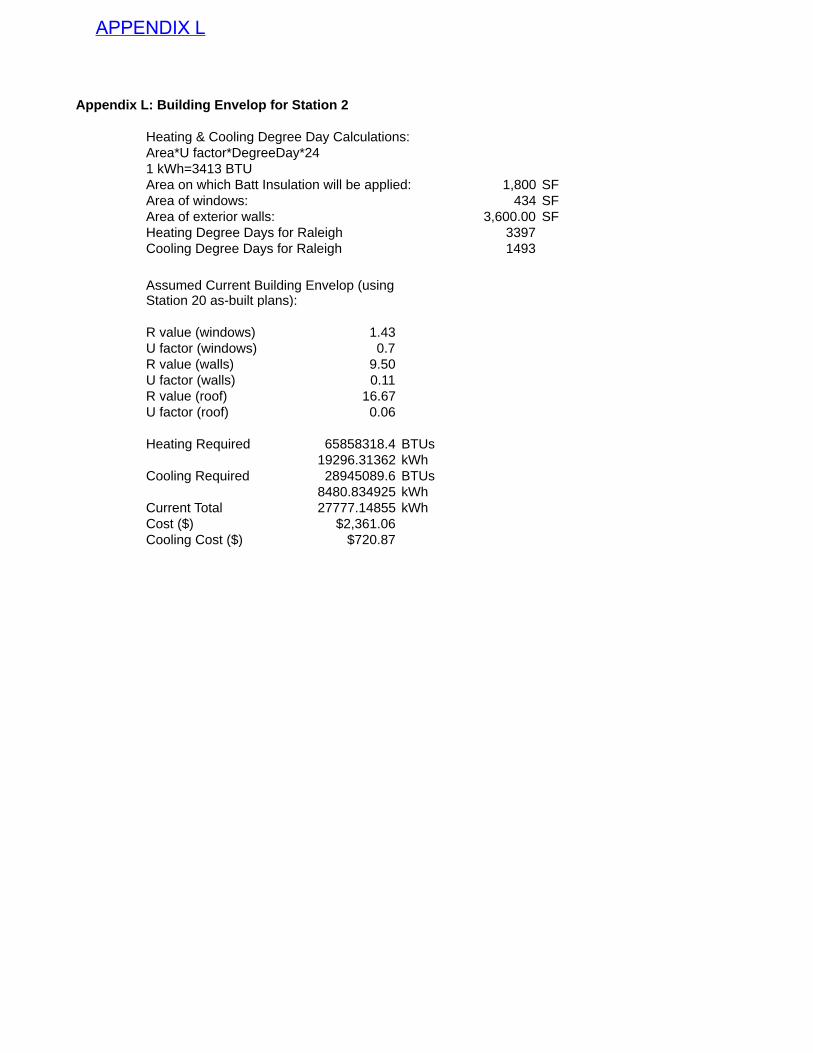
Appendix L: Building Envelop for Station 2
Heating & Cooling Degree Day Calculations:Area*U factor*DegreeDay*241 kWh=3413 BTUArea on which Batt Insulation will be applied: 1,800 SFArea of windows: 434 SFArea of exterior walls: 3,600.00 SFHeating Degree Days for Raleigh 3397Cooling Degree Days for Raleigh 1493
R value (windows) 1.43U factor (windows) 0.7R value (walls) 9.50U factor (walls) 0.11R value (roof) 16.67U factor (roof) 0.06
Heating Required 65858318.4 BTUs19296.31362 kWh
Cooling Required 28945089.6 BTUs8480.834925 kWh
Current Total 27777.14855 kWhCost ($) $2,361.06Cooling Cost ($) $720.87
Assumed Current Building Envelop (using Station 20 as-built plans):
APPENDIX L
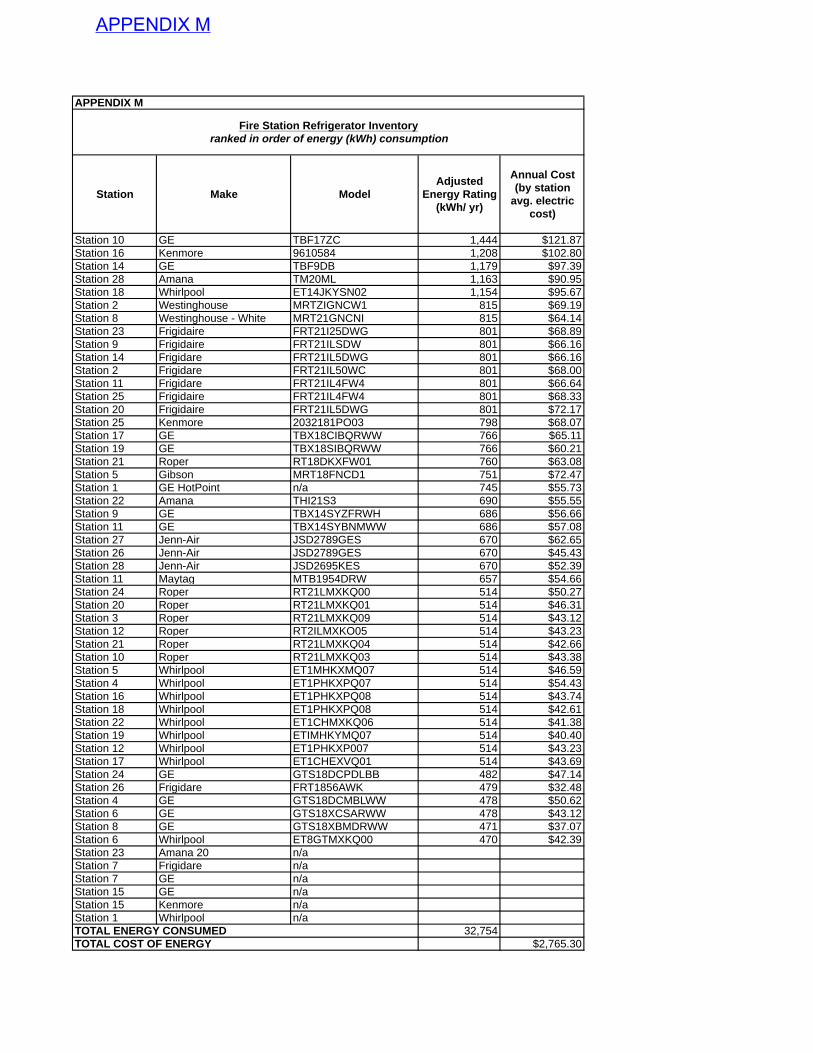
Station Make ModelAdjusted
Energy Rating (kWh/ yr)
Annual Cost (by station
avg. electric cost)
Station 10 GE TBF17ZC 1,444 $121.87Station 16 Kenmore 9610584 1,208 $102.80Station 14 GE TBF9DB 1,179 $97.39Station 28 Amana TM20ML 1,163 $90.95Station 18 Whirlpool ET14JKYSN02 1,154 $95.67Station 2 Westinghouse MRTZIGNCW1 815 $69.19Station 8 Westinghouse - White MRT21GNCNI 815 $64.14Station 23 Frigidaire FRT21I25DWG 801 $68.89Station 9 Frigidaire FRT21ILSDW 801 $66.16Station 14 Frigidare FRT21IL5DWG 801 $66.16Station 2 Frigidare FRT21IL50WC 801 $68.00Station 11 Frigidare FRT21IL4FW4 801 $66.64Station 25 Frigidaire FRT21IL4FW4 801 $68.33Station 20 Frigidaire FRT21IL5DWG 801 $72.17Station 25 Kenmore 2032181PO03 798 $68.07Station 17 GE TBX18CIBQRWW 766 $65.11Station 19 GE TBX18SIBQRWW 766 $60.21Station 21 Roper RT18DKXFW01 760 $63.08Station 5 Gibson MRT18FNCD1 751 $72.47Station 1 GE HotPoint n/a 745 $55.73Station 22 Amana THI21S3 690 $55.55Station 9 GE TBX14SYZFRWH 686 $56.66Station 11 GE TBX14SYBNMWW 686 $57.08Station 27 Jenn-Air JSD2789GES 670 $62.65Station 26 Jenn-Air JSD2789GES 670 $45.43Station 28 Jenn-Air JSD2695KES 670 $52.39Station 11 Maytag MTB1954DRW 657 $54.66Station 24 Roper RT21LMXKQ00 514 $50.27Station 20 Roper RT21LMXKQ01 514 $46.31Station 3 Roper RT21LMXKQ09 514 $43.12Station 12 Roper RT2ILMXKO05 514 $43.23Station 21 Roper RT21LMXKQ04 514 $42.66Station 10 Roper RT21LMXKQ03 514 $43.38Station 5 Whirlpool ET1MHKXMQ07 514 $46.59Station 4 Whirlpool ET1PHKXPQ07 514 $54.43Station 16 Whirlpool ET1PHKXPQ08 514 $43.74Station 18 Whirlpool ET1PHKXPQ08 514 $42.61Station 22 Whirlpool ET1CHMXKQ06 514 $41.38Station 19 Whirlpool ETIMHKYMQ07 514 $40.40Station 12 Whirlpool ET1PHKXP007 514 $43.23Station 17 Whirlpool ET1CHEXVQ01 514 $43.69Station 24 GE GTS18DCPDLBB 482 $47.14Station 26 Frigidare FRT1856AWK 479 $32.48Station 4 GE GTS18DCMBLWW 478 $50.62Station 6 GE GTS18XCSARWW 478 $43.12Station 8 GE GTS18XBMDRWW 471 $37.07Station 6 Whirlpool ET8GTMXKQ00 470 $42.39Station 23 Amana 20 n/aStation 7 Frigidare n/aStation 7 GE n/aStation 15 GE n/aStation 15 Kenmore n/aStation 1 Whirlpool n/a
32,754$2,765.30
Fire Station Refrigerator Inventoryranked in order of energy (kWh) consumption
TOTAL ENERGY CONSUMEDTOTAL COST OF ENERGY
APPENDIX M
APPENDIX M
Climate Corps 2010: City of Raleigh Final Report Page 1
Energy Efficiency: City of Raleigh One Exchange Plaza Environmental Defense Fund
Climate Corps 2010 August 20th, 2010
Written by
Deborah Breisblatt Duke University MEM/MBA Candidate, Class of 2012
847.691.6380 [email protected]
Matt Jentgen Duke University MEM/MPP Candidate, Class of 2012
520.664.6541 [email protected]
Climate Corps 2010: City of Raleigh Final Report Page 2
TABLE OF CONTENTS
EXECUTIVE SUMMARY ....................................................................................................................3
Overview........................................................................................................................................3
Analysis and Results .......................................................................................................................3
Barriers..........................................................................................................................................3
Recommendations and Action Plan..................................................................................................4
OVERVIEW AND BACKGROUND.......................................................................................................5
RECOMMENDED ENERGY EFFICIENCY PROJECTS AND ACTIONS ..................................................6
Project 1 – Lighting Retrofit: T12/T8 to LED ....................................................................................6
Basic Project Information............................................................................................................6
Project Summary ........................................................................................................................7
Financial Analysis.......................................................................................................................7
Recommendation .......................................................................................................................9
Project 2 – HVAC: Variable Frequency Drives and Air Circulation Fans..............................................9
Basic Project Information............................................................................................................9
Project Summary ......................................................................................................................10
Financial Analysis.....................................................................................................................10
Recommendation .....................................................................................................................11
Project 3 – Vending Machines .......................................................................................................12
Basic Project Information..........................................................................................................12
Project Summary ......................................................................................................................12
Financial Analysis.....................................................................................................................13
Recommendations ....................................................................................................................13
Other General Recommendations ..................................................................................................15
Upgrade HVAC controls: replace current pneumatic controls with DDC controls ..........................15
Replace dampers/diffusers ........................................................................................................15
Educate building occupants about energy efficiency ....................................................................16
Summary of Energy Efficiency Projects ..........................................................................................16
Action Plan & Timeline .................................................................................................................16
OVERCOMING BARRIERS TO ENERGY EFFICIENCY ......................................................................17
Barriers........................................................................................................................................17
Recommended Strategies for Overcoming Barriers .........................................................................17
Lessons from Overcoming Barriers ................................................................................................17
CONCLUSIONS AND RECOMMENDED NEXT STEPS.......................................................................18
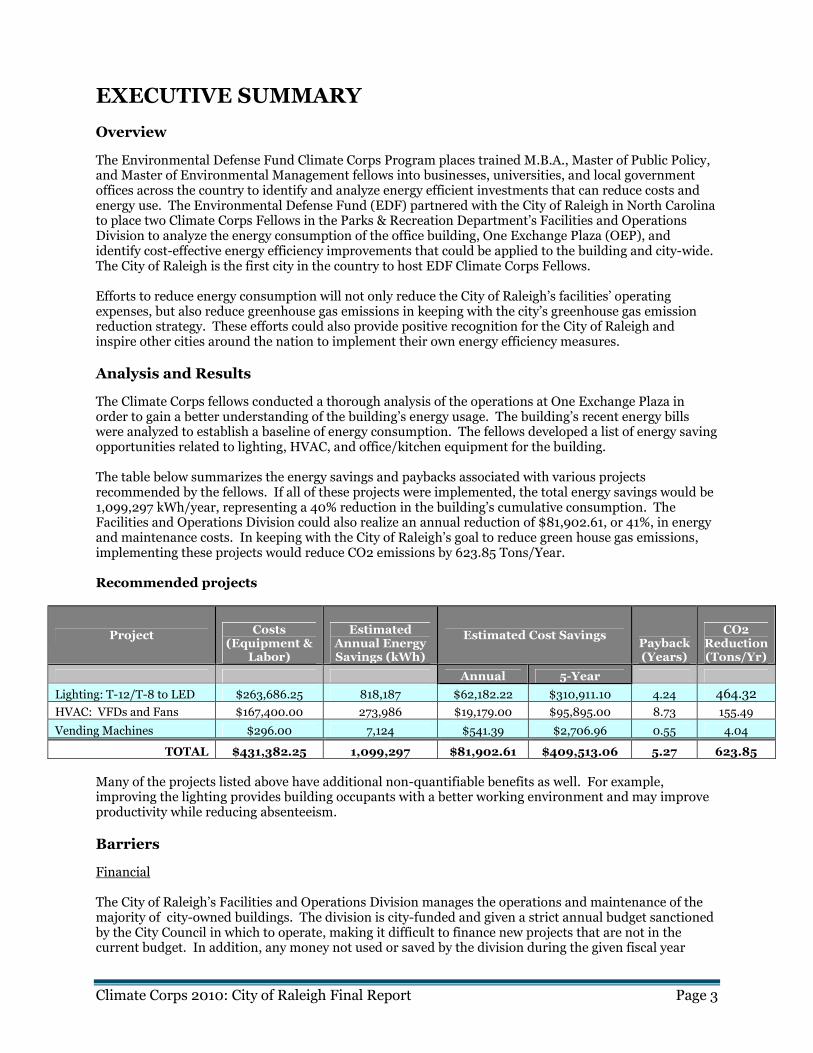
Climate Corps 2010: City of Raleigh Final Report Page 3
EXECUTIVE SUMMARY
Overview
The Environmental Defense Fund Climate Corps Program places trained M.B.A., Master of Public Policy, and Master of Environmental Management fellows into businesses, universities, and local government offices across the country to identify and analyze energy efficient investments that can reduce costs and energy use. The Environmental Defense Fund (EDF) partnered with the City of Raleigh in North Carolina to place two Climate Corps Fellows in the Parks & Recreation Department’s Facilities and Operations Division to analyze the energy consumption of the office building, One Exchange Plaza (OEP), and identify cost-effective energy efficiency improvements that could be applied to the building and city-wide. The City of Raleigh is the first city in the country to host EDF Climate Corps Fellows. Efforts to reduce energy consumption will not only reduce the City of Raleigh’s facilities’ operating expenses, but also reduce greenhouse gas emissions in keeping with the city’s greenhouse gas emission reduction strategy. These efforts could also provide positive recognition for the City of Raleigh and inspire other cities around the nation to implement their own energy efficiency measures.
Analysis and Results
The Climate Corps fellows conducted a thorough analysis of the operations at One Exchange Plaza in order to gain a better understanding of the building’s energy usage. The building’s recent energy bills were analyzed to establish a baseline of energy consumption. The fellows developed a list of energy saving opportunities related to lighting, HVAC, and office/kitchen equipment for the building. The table below summarizes the energy savings and paybacks associated with various projects recommended by the fellows. If all of these projects were implemented, the total energy savings would be 1,099,297 kWh/year, representing a 40% reduction in the building’s cumulative consumption. The Facilities and Operations Division could also realize an annual reduction of $81,902.61, or 41%, in energy and maintenance costs. In keeping with the City of Raleigh’s goal to reduce green house gas emissions, implementing these projects would reduce CO2 emissions by 623.85 Tons/Year. Recommended projects
Project Costs (Equipment &
Labor)
Estimated Annual Energy Savings (kWh)
Estimated Cost Savings Payback (Years)
CO2 Reduction (Tons/Yr)
Annual 5-Year
Lighting: T-12/T-8 to LED $263,686.25 818,187 $62,182.22 $310,911.10 4.24 464.32
HVAC: VFDs and Fans $167,400.00 273,986 $19,179.00 $95,895.00 8.73 155.49
Vending Machines $296.00 7,124 $541.39 $2,706.96 0.55 4.04
TOTAL $431,382.25 1,099,297 $81,902.61 $409,513.06 5.27 623.85
Many of the projects listed above have additional non-quantifiable benefits as well. For example, improving the lighting provides building occupants with a better working environment and may improve productivity while reducing absenteeism.
Barriers
Financial The City of Raleigh’s Facilities and Operations Division manages the operations and maintenance of the majority of city-owned buildings. The division is city-funded and given a strict annual budget sanctioned by the City Council in which to operate, making it difficult to finance new projects that are not in the current budget. In addition, any money not used or saved by the division during the given fiscal year
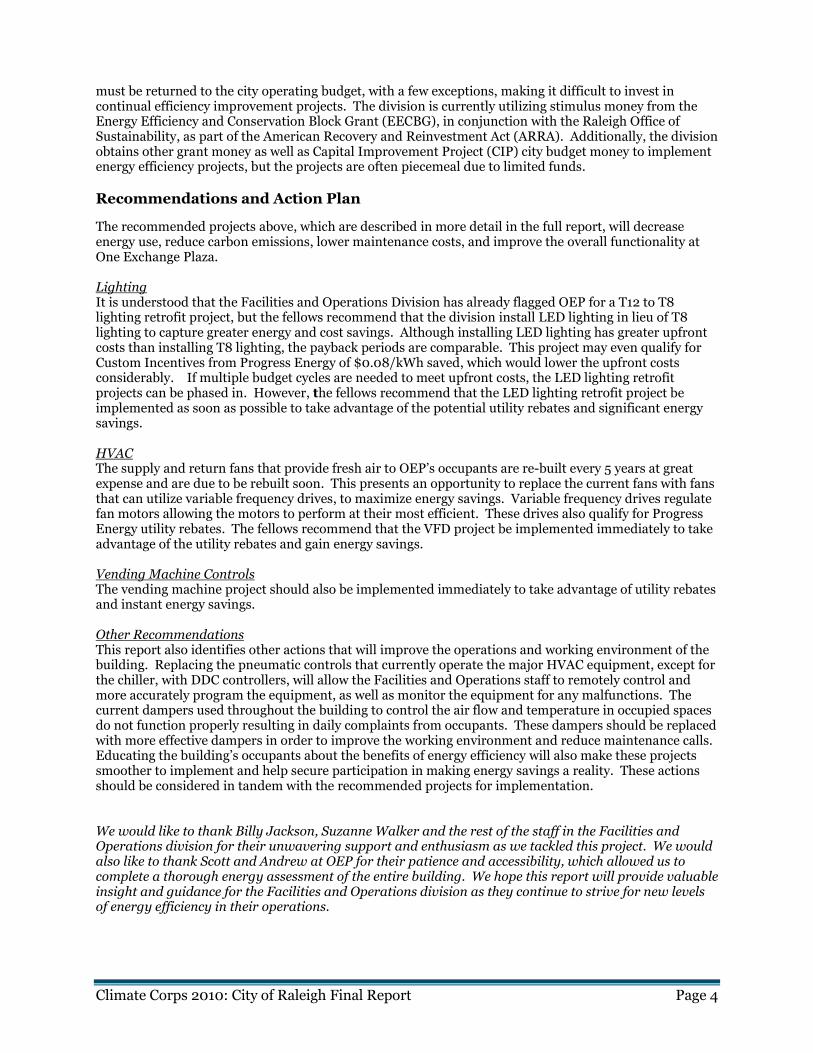
Climate Corps 2010: City of Raleigh Final Report Page 4
must be returned to the city operating budget, with a few exceptions, making it difficult to invest in continual efficiency improvement projects. The division is currently utilizing stimulus money from the Energy Efficiency and Conservation Block Grant (EECBG), in conjunction with the Raleigh Office of Sustainability, as part of the American Recovery and Reinvestment Act (ARRA). Additionally, the division obtains other grant money as well as Capital Improvement Project (CIP) city budget money to implement energy efficiency projects, but the projects are often piecemeal due to limited funds.
Recommendations and Action Plan
The recommended projects above, which are described in more detail in the full report, will decrease energy use, reduce carbon emissions, lower maintenance costs, and improve the overall functionality at One Exchange Plaza. Lighting It is understood that the Facilities and Operations Division has already flagged OEP for a T12 to T8 lighting retrofit project, but the fellows recommend that the division install LED lighting in lieu of T8 lighting to capture greater energy and cost savings. Although installing LED lighting has greater upfront costs than installing T8 lighting, the payback periods are comparable. This project may even qualify for Custom Incentives from Progress Energy of $0.08/kWh saved, which would lower the upfront costs considerably. If multiple budget cycles are needed to meet upfront costs, the LED lighting retrofit projects can be phased in. However, the fellows recommend that the LED lighting retrofit project be implemented as soon as possible to take advantage of the potential utility rebates and significant energy savings. HVAC The supply and return fans that provide fresh air to OEP’s occupants are re-built every 5 years at great expense and are due to be rebuilt soon. This presents an opportunity to replace the current fans with fans that can utilize variable frequency drives, to maximize energy savings. Variable frequency drives regulate fan motors allowing the motors to perform at their most efficient. These drives also qualify for Progress Energy utility rebates. The fellows recommend that the VFD project be implemented immediately to take advantage of the utility rebates and gain energy savings. Vending Machine Controls The vending machine project should also be implemented immediately to take advantage of utility rebates and instant energy savings. Other Recommendations This report also identifies other actions that will improve the operations and working environment of the building. Replacing the pneumatic controls that currently operate the major HVAC equipment, except for the chiller, with DDC controllers, will allow the Facilities and Operations staff to remotely control and more accurately program the equipment, as well as monitor the equipment for any malfunctions. The current dampers used throughout the building to control the air flow and temperature in occupied spaces do not function properly resulting in daily complaints from occupants. These dampers should be replaced with more effective dampers in order to improve the working environment and reduce maintenance calls. Educating the building’s occupants about the benefits of energy efficiency will also make these projects smoother to implement and help secure participation in making energy savings a reality. These actions should be considered in tandem with the recommended projects for implementation. We would like to thank Billy Jackson, Suzanne Walker and the rest of the staff in the Facilities and Operations division for their unwavering support and enthusiasm as we tackled this project. We would also like to thank Scott and Andrew at OEP for their patience and accessibility, which allowed us to complete a thorough energy assessment of the entire building. We hope this report will provide valuable insight and guidance for the Facilities and Operations division as they continue to strive for new levels of energy efficiency in their operations.
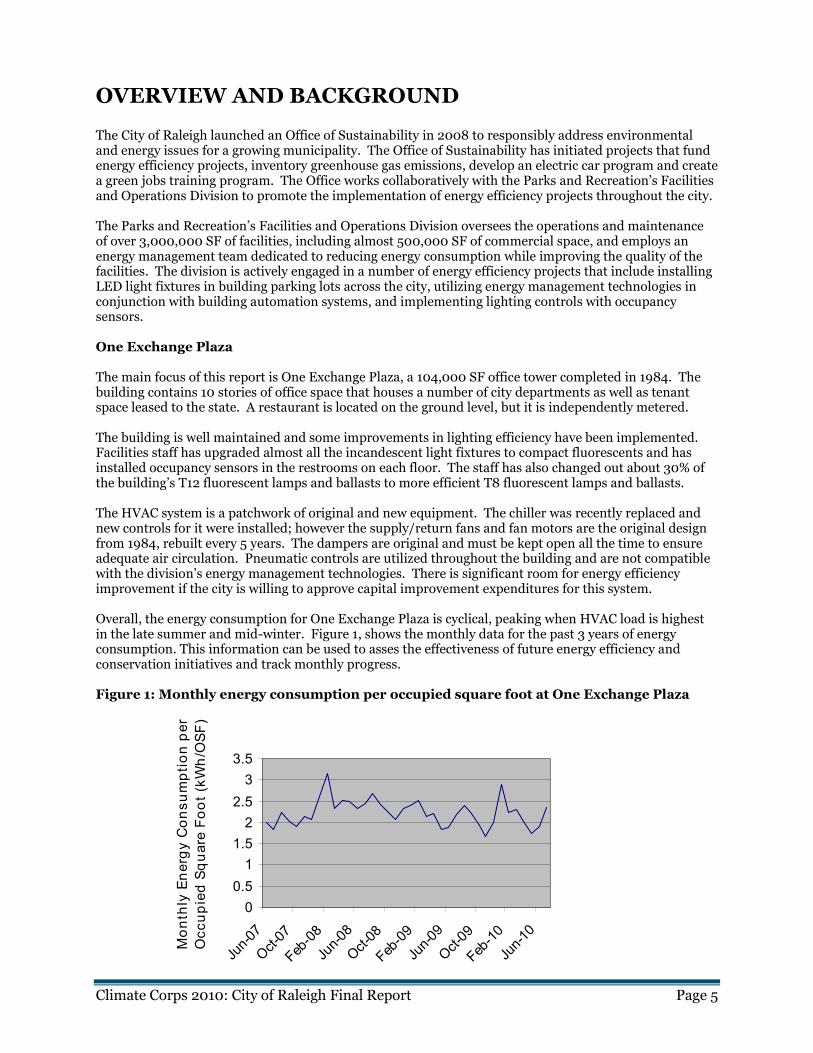
Climate Corps 2010: City of Raleigh Final Report Page 5
00.5
11.5
22.5
33.5
Jun-0
7
Oct-07
Feb-08
Jun-0
8
Oct-08
Feb-09
Jun-0
9
Oct-09
Feb-10
Jun-1
0
Mon
thly
Ene
rgy
Con
sum
ptio
n pe
r O
ccup
ied
Squa
re F
oot (
kWh/
OSF
)
OVERVIEW AND BACKGROUND The City of Raleigh launched an Office of Sustainability in 2008 to responsibly address environmental and energy issues for a growing municipality. The Office of Sustainability has initiated projects that fund energy efficiency projects, inventory greenhouse gas emissions, develop an electric car program and create a green jobs training program. The Office works collaboratively with the Parks and Recreation’s Facilities and Operations Division to promote the implementation of energy efficiency projects throughout the city. The Parks and Recreation’s Facilities and Operations Division oversees the operations and maintenance of over 3,000,000 SF of facilities, including almost 500,000 SF of commercial space, and employs an energy management team dedicated to reducing energy consumption while improving the quality of the facilities. The division is actively engaged in a number of energy efficiency projects that include installing LED light fixtures in building parking lots across the city, utilizing energy management technologies in conjunction with building automation systems, and implementing lighting controls with occupancy sensors. One Exchange Plaza The main focus of this report is One Exchange Plaza, a 104,000 SF office tower completed in 1984. The building contains 10 stories of office space that houses a number of city departments as well as tenant space leased to the state. A restaurant is located on the ground level, but it is independently metered. The building is well maintained and some improvements in lighting efficiency have been implemented. Facilities staff has upgraded almost all the incandescent light fixtures to compact fluorescents and has installed occupancy sensors in the restrooms on each floor. The staff has also changed out about 30% of the building’s T12 fluorescent lamps and ballasts to more efficient T8 fluorescent lamps and ballasts. The HVAC system is a patchwork of original and new equipment. The chiller was recently replaced and new controls for it were installed; however the supply/return fans and fan motors are the original design from 1984, rebuilt every 5 years. The dampers are original and must be kept open all the time to ensure adequate air circulation. Pneumatic controls are utilized throughout the building and are not compatible with the division’s energy management technologies. There is significant room for energy efficiency improvement if the city is willing to approve capital improvement expenditures for this system. Overall, the energy consumption for One Exchange Plaza is cyclical, peaking when HVAC load is highest in the late summer and mid-winter. Figure 1, shows the monthly data for the past 3 years of energy consumption. This information can be used to asses the effectiveness of future energy efficiency and conservation initiatives and track monthly progress. Figure 1: Monthly energy consumption per occupied square foot at One Exchange Plaza
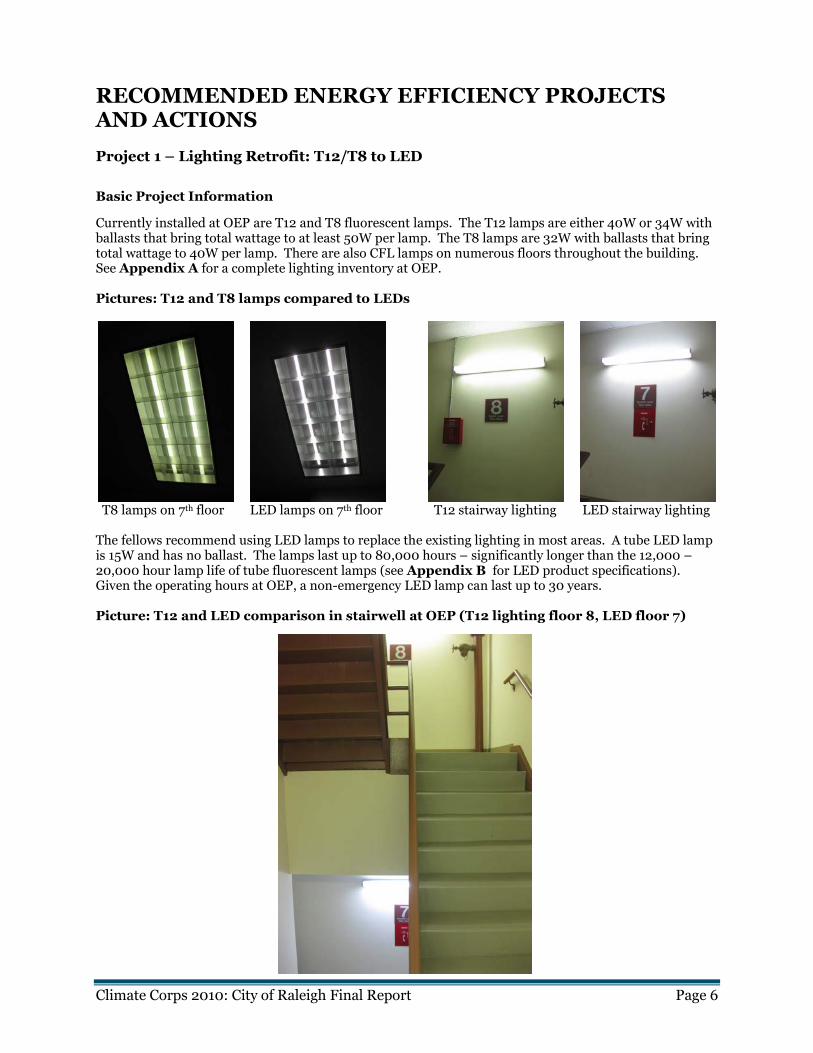
Climate Corps 2010: City of Raleigh Final Report Page 6
RECOMMENDED ENERGY EFFICIENCY PROJECTS AND ACTIONS
Project 1 – Lighting Retrofit: T12/T8 to LED
Basic Project Information
Currently installed at OEP are T12 and T8 fluorescent lamps. The T12 lamps are either 40W or 34W with ballasts that bring total wattage to at least 50W per lamp. The T8 lamps are 32W with ballasts that bring total wattage to 40W per lamp. There are also CFL lamps on numerous floors throughout the building. See Appendix A for a complete lighting inventory at OEP. Pictures: T12 and T8 lamps compared to LEDs
T8 lamps on 7th floor LED lamps on 7th floor T12 stairway lighting LED stairway lighting The fellows recommend using LED lamps to replace the existing lighting in most areas. A tube LED lamp is 15W and has no ballast. The lamps last up to 80,000 hours – significantly longer than the 12,000 – 20,000 hour lamp life of tube fluorescent lamps (see Appendix B for LED product specifications). Given the operating hours at OEP, a non-emergency LED lamp can last up to 30 years. Picture: T12 and LED comparison in stairwell at OEP (T12 lighting floor 8, LED floor 7)
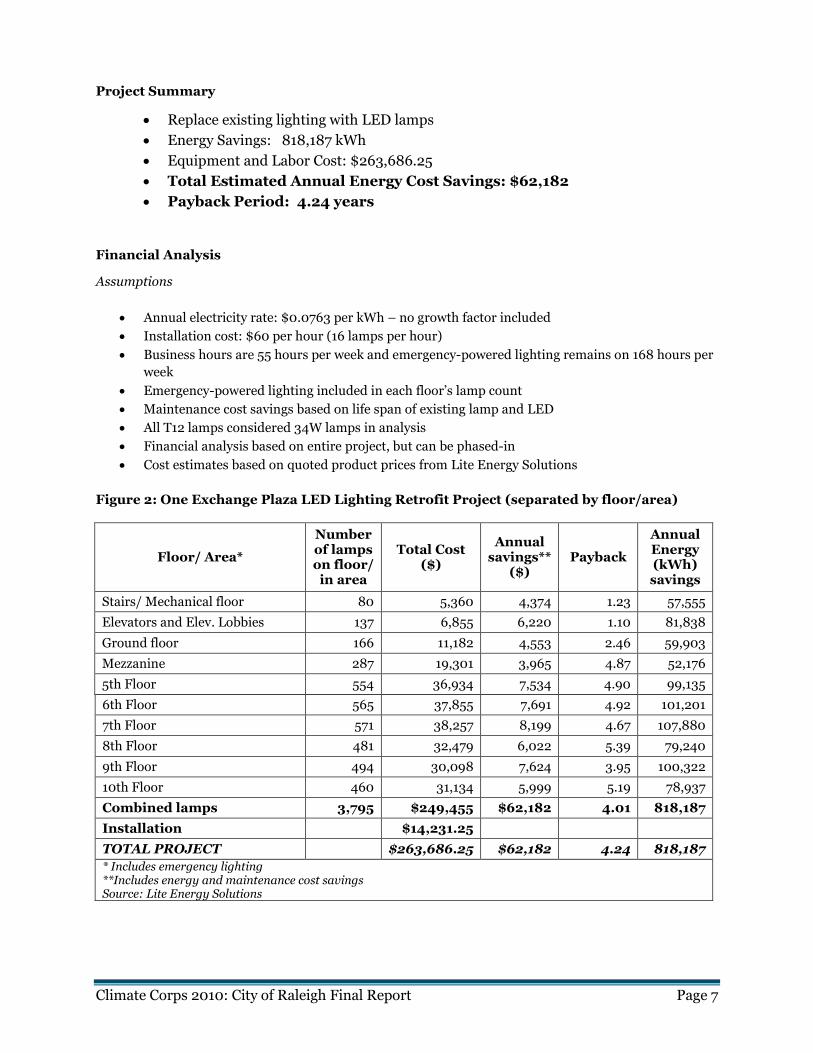
Climate Corps 2010: City of Raleigh Final Report Page 7
Project Summary
• Replace existing lighting with LED lamps
• Energy Savings: 818,187 kWh
• Equipment and Labor Cost: $263,686.25
• Total Estimated Annual Energy Cost Savings: $62,182
• Payback Period: 4.24 years
Financial Analysis
Assumptions
• Annual electricity rate: $0.0763 per kWh – no growth factor included
• Installation cost: $60 per hour (16 lamps per hour)
• Business hours are 55 hours per week and emergency-powered lighting remains on 168 hours per
week
• Emergency-powered lighting included in each floor’s lamp count
• Maintenance cost savings based on life span of existing lamp and LED
• All T12 lamps considered 34W lamps in analysis
• Financial analysis based on entire project, but can be phased-in
• Cost estimates based on quoted product prices from Lite Energy Solutions
Figure 2: One Exchange Plaza LED Lighting Retrofit Project (separated by floor/area)
Floor/ Area*
Number of lamps on floor/ in area
Total Cost ($)
Annual savings**
($) Payback
Annual Energy (kWh) savings
Stairs/ Mechanical floor 80 5,360 4,374 1.23 57,555
Elevators and Elev. Lobbies 137 6,855 6,220 1.10 81,838
Ground floor 166 11,182 4,553 2.46 59,903
Mezzanine 287 19,301 3,965 4.87 52,176
5th Floor 554 36,934 7,534 4.90 99,135
6th Floor 565 37,855 7,691 4.92 101,201
7th Floor 571 38,257 8,199 4.67 107,880
8th Floor 481 32,479 6,022 5.39 79,240
9th Floor 494 30,098 7,624 3.95 100,322
10th Floor 460 31,134 5,999 5.19 78,937
Combined lamps 3,795 $249,455 $62,182 4.01 818,187
Installation $14,231.25
TOTAL PROJECT $263,686.25 $62,182 4.24 818,187
* Includes emergency lighting **Includes energy and maintenance cost savings Source: Lite Energy Solutions

Climate Corps 2010: City of Raleigh Final Report Page 8
Progress Energy Rebate
LED retrofits are not specifically included under Progress Energy’s energy efficiency rebates for lighting. Given the substantial energy savings involved, the fellows recommend working with Progress Energy to establish possible rebates. * Were LED lighting retrofits to qualify for Progress Energy’s custom energy efficiency program, the $.08 per kWh hour incentive would generate $65,455 in rebates – lowering total project cost to $198,231 and payback to 3.19 years. See Appendix C for Progress Energy’s Custom Incentive rebates. Phased installation option If the project costs are better absorbed over a number of budget cycles, the fellows recommend a phasing in of LED lighting. See Appendix D for a financial and energy analysis for each floor/ area at OEP – emergency-powered lighting is separated in analysis. Emergency lighting (or any lighting that remains on 24/7) provides the quickest payback and should be implemented immediately. Then LEDs can be
installed floor by floor, based on cost and savings. Below is a recommended LED installation schedule:
• Phase 1: Stairs, emergency lighting on mechanical floor, elevators, and elevator lobbies
o Total lamps: 217
o Total cost: $12,215
o Total annual savings: $10,594 and 139,393 kWh
o Payback: 1.15 years
• Phase 2: Ground floor, 9th floor
o Total lamps: 660
o Total cost: $41,280
o Total annual savings: $12,177 and 160,225 kWh
o Payback: 3.39 years
• Phase 3: Mezzanine, 5th floor, 6th floor, and 7th floor
o Total lamps: 660
o Total cost: $132,347
o Total annual savings: $27,390 and 360,392 kWh
o Payback: 4.83 years
• Phase 4: 8th floor, 10th floor
o Total lamps: 941
o Total cost: $63,613
o Total annual savings: $12,021 and 158,177 kWh
o Payback: 5.29 years
Remaining areas at OEP
The basement level at OEP has 257 T12, T8, and CFL lamps. However, it is excluded from the financial analysis because estimating the lighting hours is difficult, as it is occupied sporadically throughout the day and night. The 3rd and 4th floors at OEP have recently received new T8 and CFL lighting upgrades, so the fellows do not recommend installing LEDs until the remaining building has been retrofitted.
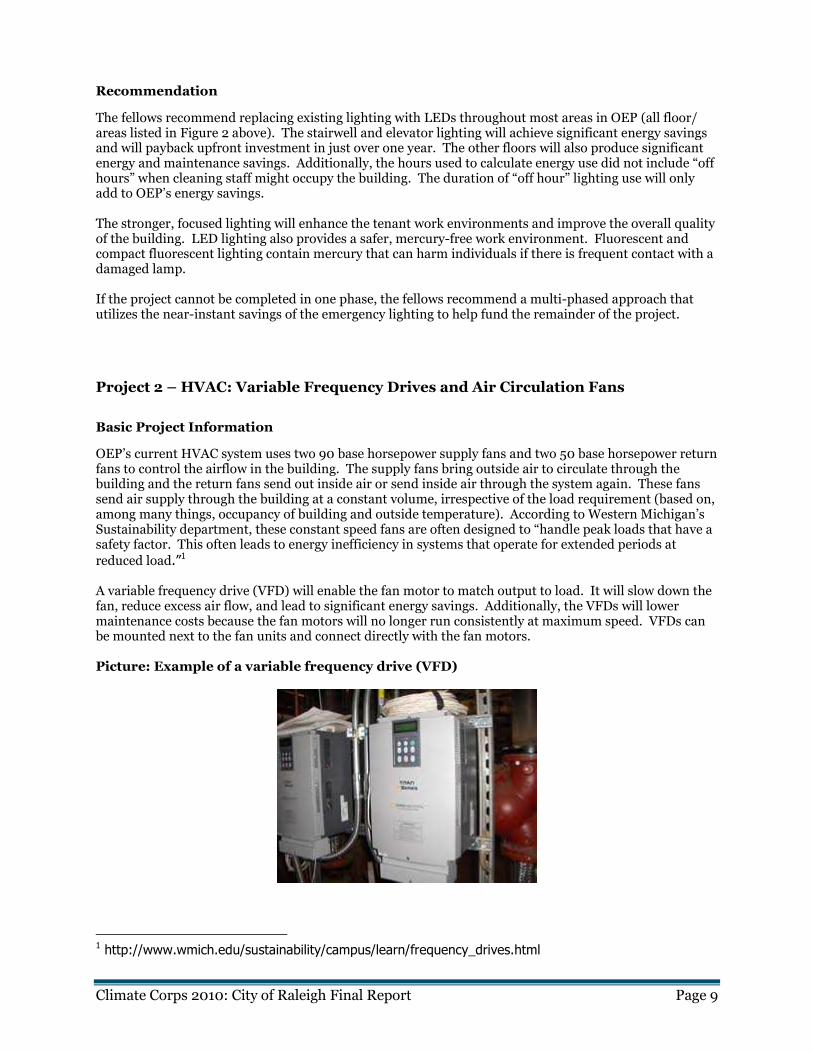
Climate Corps 2010: City of Raleigh Final Report Page 9
Recommendation
The fellows recommend replacing existing lighting with LEDs throughout most areas in OEP (all floor/ areas listed in Figure 2 above). The stairwell and elevator lighting will achieve significant energy savings and will payback upfront investment in just over one year. The other floors will also produce significant energy and maintenance savings. Additionally, the hours used to calculate energy use did not include “off hours” when cleaning staff might occupy the building. The duration of “off hour” lighting use will only add to OEP’s energy savings.
The stronger, focused lighting will enhance the tenant work environments and improve the overall quality of the building. LED lighting also provides a safer, mercury-free work environment. Fluorescent and compact fluorescent lighting contain mercury that can harm individuals if there is frequent contact with a damaged lamp.
If the project cannot be completed in one phase, the fellows recommend a multi-phased approach that utilizes the near-instant savings of the emergency lighting to help fund the remainder of the project.
Project 2 – HVAC: Variable Frequency Drives and Air Circulation Fans
Basic Project Information
OEP’s current HVAC system uses two 90 base horsepower supply fans and two 50 base horsepower return fans to control the airflow in the building. The supply fans bring outside air to circulate through the building and the return fans send out inside air or send inside air through the system again. These fans send air supply through the building at a constant volume, irrespective of the load requirement (based on, among many things, occupancy of building and outside temperature). According to Western Michigan’s Sustainability department, these constant speed fans are often designed to “handle peak loads that have a safety factor. This often leads to energy inefficiency in systems that operate for extended periods at
reduced load.”1
A variable frequency drive (VFD) will enable the fan motor to match output to load. It will slow down the fan, reduce excess air flow, and lead to significant energy savings. Additionally, the VFDs will lower maintenance costs because the fan motors will no longer run consistently at maximum speed. VFDs can be mounted next to the fan units and connect directly with the fan motors.
Picture: Example of a variable frequency drive (VFD)
1 http://www.wmich.edu/sustainability/campus/learn/frequency_drives.html
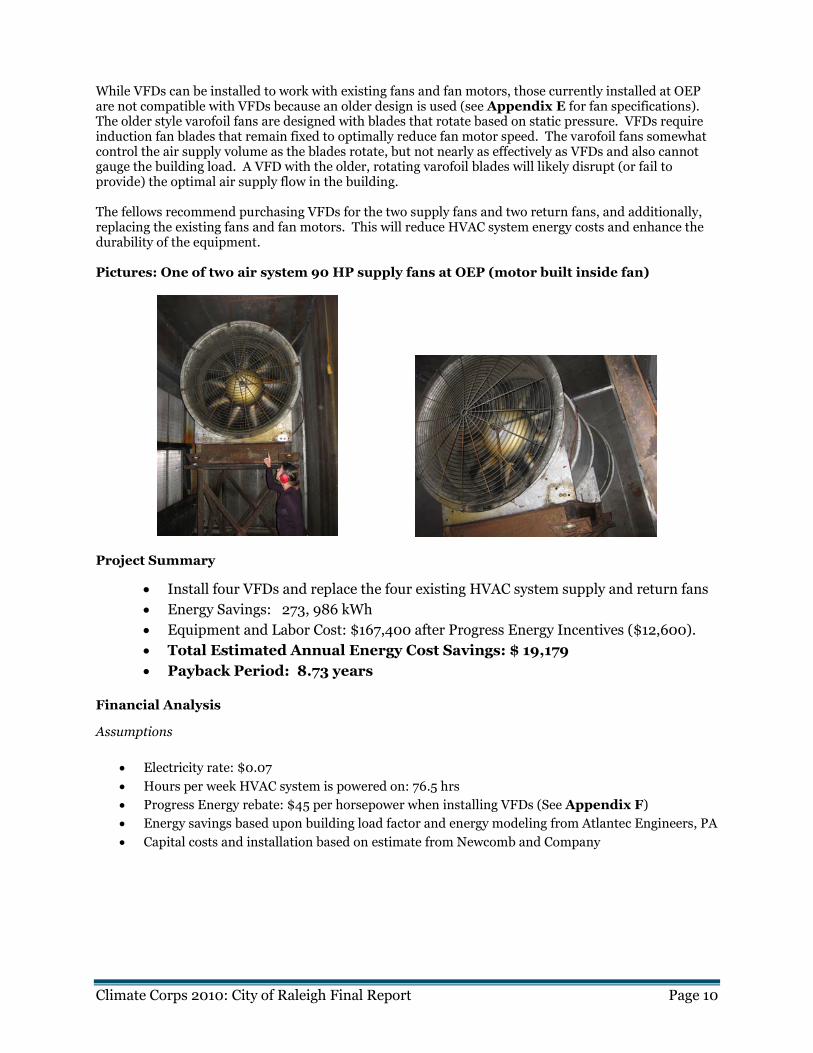
Climate Corps 2010: City of Raleigh Final Report Page 10
While VFDs can be installed to work with existing fans and fan motors, those currently installed at OEP are not compatible with VFDs because an older design is used (see Appendix E for fan specifications). The older style varofoil fans are designed with blades that rotate based on static pressure. VFDs require induction fan blades that remain fixed to optimally reduce fan motor speed. The varofoil fans somewhat control the air supply volume as the blades rotate, but not nearly as effectively as VFDs and also cannot gauge the building load. A VFD with the older, rotating varofoil blades will likely disrupt (or fail to provide) the optimal air supply flow in the building. The fellows recommend purchasing VFDs for the two supply fans and two return fans, and additionally, replacing the existing fans and fan motors. This will reduce HVAC system energy costs and enhance the durability of the equipment. Pictures: One of two air system 90 HP supply fans at OEP (motor built inside fan)
Project Summary
• Install four VFDs and replace the four existing HVAC system supply and return fans
• Energy Savings: 273, 986 kWh
• Equipment and Labor Cost: $167,400 after Progress Energy Incentives ($12,600).
• Total Estimated Annual Energy Cost Savings: $ 19,179
• Payback Period: 8.73 years
Financial Analysis
Assumptions
• Electricity rate: $0.07
• Hours per week HVAC system is powered on: 76.5 hrs
• Progress Energy rebate: $45 per horsepower when installing VFDs (See Appendix F)
• Energy savings based upon building load factor and energy modeling from Atlantec Engineers, PA
• Capital costs and installation based on estimate from Newcomb and Company
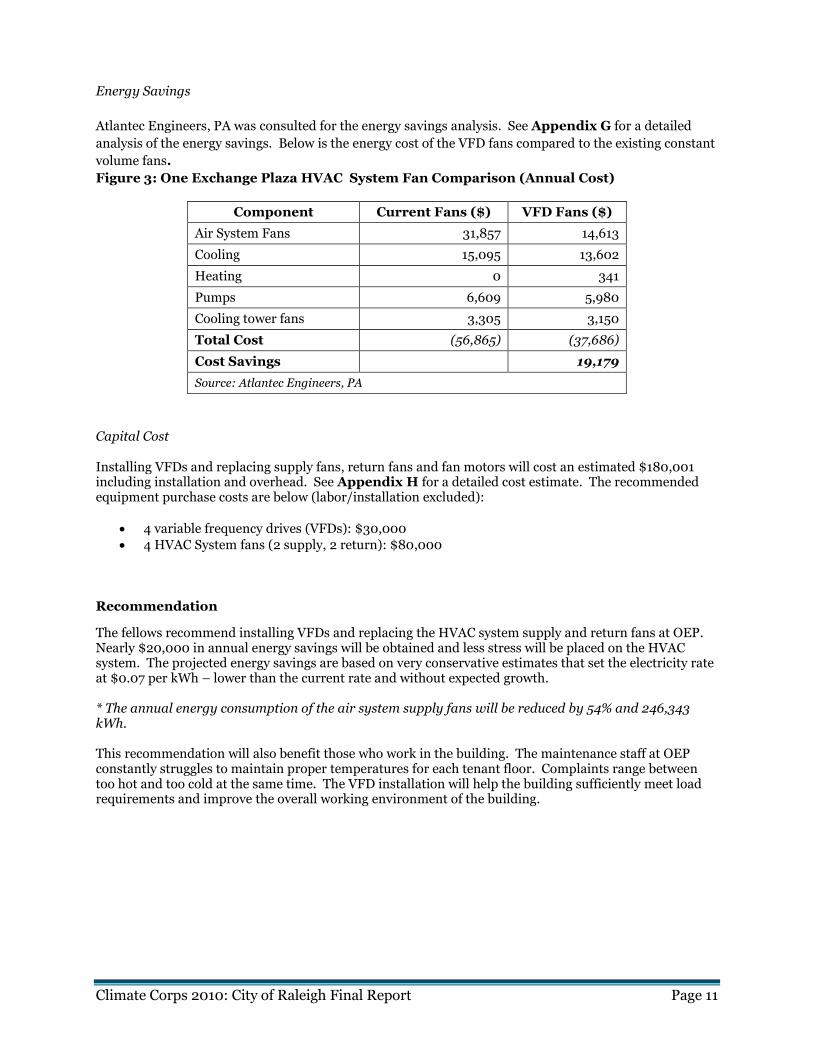
Climate Corps 2010: City of Raleigh Final Report Page 11
Energy Savings
Atlantec Engineers, PA was consulted for the energy savings analysis. See Appendix G for a detailed
analysis of the energy savings. Below is the energy cost of the VFD fans compared to the existing constant
volume fans.
Figure 3: One Exchange Plaza HVAC System Fan Comparison (Annual Cost)
Component Current Fans ($) VFD Fans ($)
Air System Fans 31,857 14,613
Cooling 15,095 13,602
Heating 0 341
Pumps 6,609 5,980
Cooling tower fans 3,305 3,150
Total Cost (56,865) (37,686)
Cost Savings 19,179
Source: Atlantec Engineers, PA
Capital Cost
Installing VFDs and replacing supply fans, return fans and fan motors will cost an estimated $180,001 including installation and overhead. See Appendix H for a detailed cost estimate. The recommended equipment purchase costs are below (labor/installation excluded):
• 4 variable frequency drives (VFDs): $30,000
• 4 HVAC System fans (2 supply, 2 return): $80,000
Recommendation
The fellows recommend installing VFDs and replacing the HVAC system supply and return fans at OEP. Nearly $20,000 in annual energy savings will be obtained and less stress will be placed on the HVAC system. The projected energy savings are based on very conservative estimates that set the electricity rate at $0.07 per kWh – lower than the current rate and without expected growth. * The annual energy consumption of the air system supply fans will be reduced by 54% and 246,343 kWh. This recommendation will also benefit those who work in the building. The maintenance staff at OEP constantly struggles to maintain proper temperatures for each tenant floor. Complaints range between too hot and too cold at the same time. The VFD installation will help the building sufficiently meet load requirements and improve the overall working environment of the building.
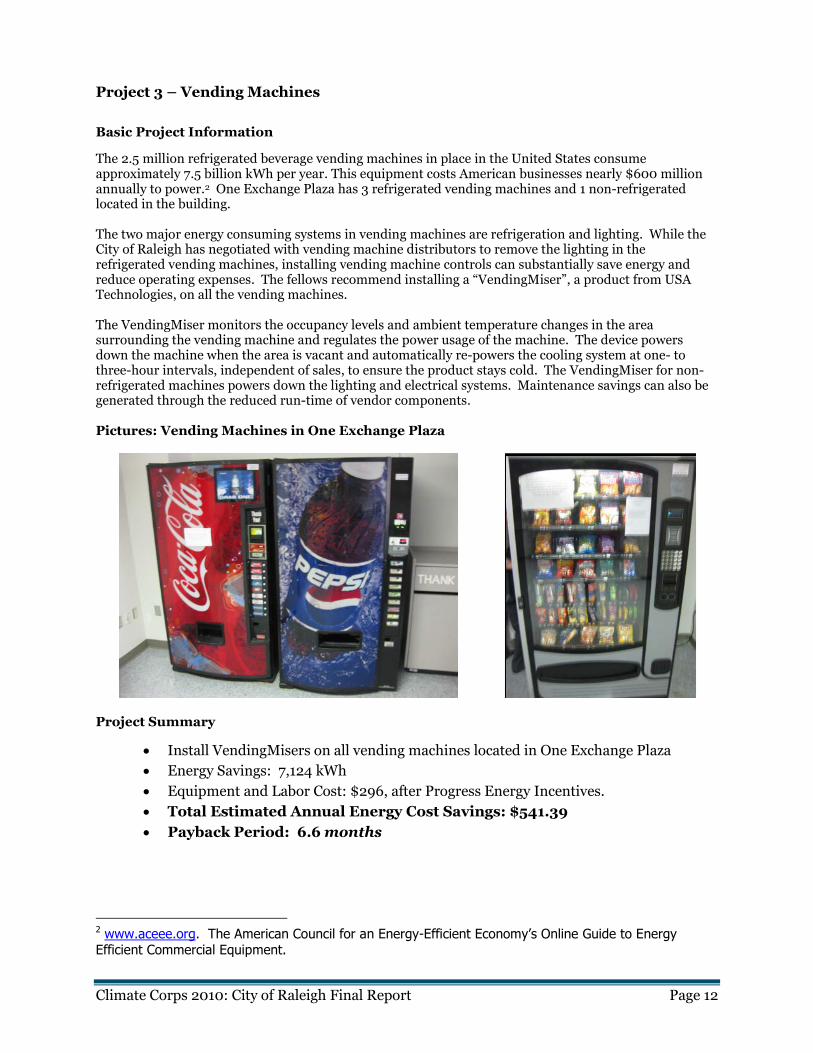
Climate Corps 2010: City of Raleigh Final Report Page 12
Project 3 – Vending Machines
Basic Project Information
The 2.5 million refrigerated beverage vending machines in place in the United States consume approximately 7.5 billion kWh per year. This equipment costs American businesses nearly $600 million annually to power.2 One Exchange Plaza has 3 refrigerated vending machines and 1 non-refrigerated located in the building. The two major energy consuming systems in vending machines are refrigeration and lighting. While the City of Raleigh has negotiated with vending machine distributors to remove the lighting in the refrigerated vending machines, installing vending machine controls can substantially save energy and reduce operating expenses. The fellows recommend installing a “VendingMiser”, a product from USA Technologies, on all the vending machines. The VendingMiser monitors the occupancy levels and ambient temperature changes in the area surrounding the vending machine and regulates the power usage of the machine. The device powers down the machine when the area is vacant and automatically re-powers the cooling system at one- to three-hour intervals, independent of sales, to ensure the product stays cold. The VendingMiser for non-refrigerated machines powers down the lighting and electrical systems. Maintenance savings can also be generated through the reduced run-time of vendor components. Pictures: Vending Machines in One Exchange Plaza
Project Summary
• Install VendingMisers on all vending machines located in One Exchange Plaza
• Energy Savings: 7,124 kWh
• Equipment and Labor Cost: $296, after Progress Energy Incentives.
• Total Estimated Annual Energy Cost Savings: $541.39
• Payback Period: 6.6 months
2 www.aceee.org. The American Council for an Energy-Efficient Economy’s Online Guide to Energy Efficient Commercial Equipment.
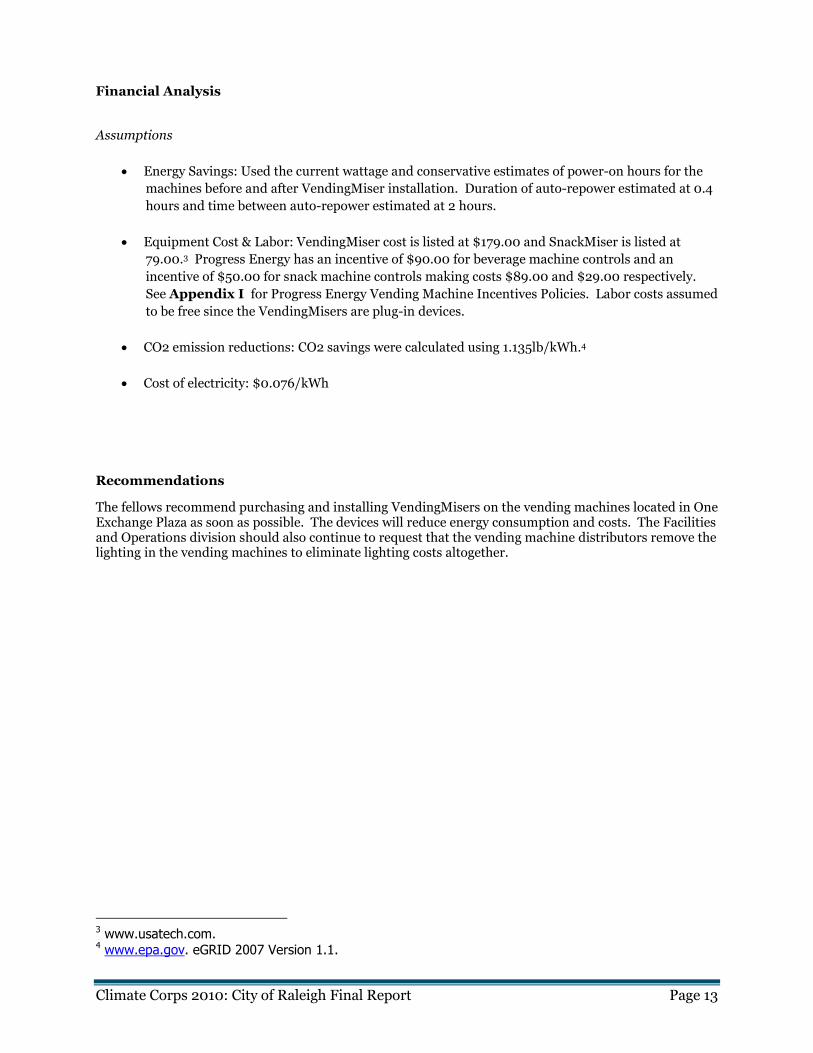
Climate Corps 2010: City of Raleigh Final Report Page 13
Financial Analysis
Assumptions
• Energy Savings: Used the current wattage and conservative estimates of power-on hours for the
machines before and after VendingMiser installation. Duration of auto-repower estimated at 0.4
hours and time between auto-repower estimated at 2 hours.
• Equipment Cost & Labor: VendingMiser cost is listed at $179.00 and SnackMiser is listed at
79.00.3 Progress Energy has an incentive of $90.00 for beverage machine controls and an
incentive of $50.00 for snack machine controls making costs $89.00 and $29.00 respectively.
See Appendix I for Progress Energy Vending Machine Incentives Policies. Labor costs assumed
to be free since the VendingMisers are plug-in devices.
• CO2 emission reductions: CO2 savings were calculated using 1.135lb/kWh.4
• Cost of electricity: $0.076/kWh
Recommendations
The fellows recommend purchasing and installing VendingMisers on the vending machines located in One Exchange Plaza as soon as possible. The devices will reduce energy consumption and costs. The Facilities and Operations division should also continue to request that the vending machine distributors remove the lighting in the vending machines to eliminate lighting costs altogether.
3 www.usatech.com. 4 www.epa.gov. eGRID 2007 Version 1.1.
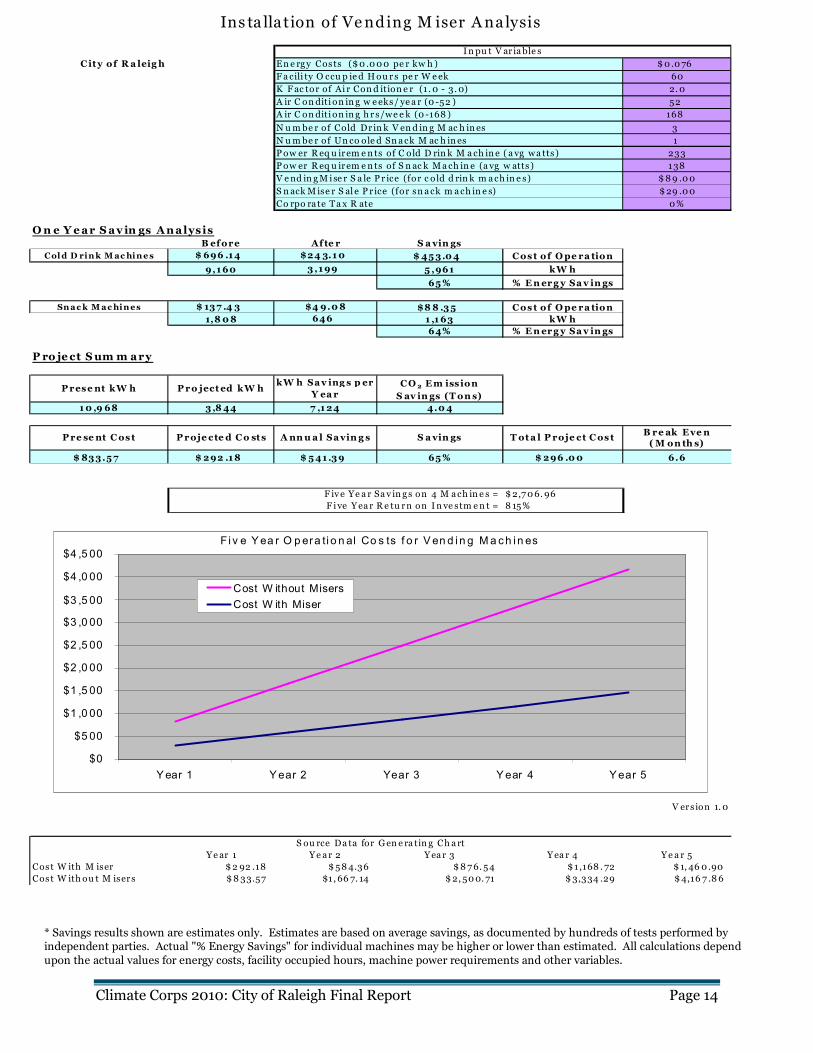
Climate Corps 2010: City of Raleigh Final Report Page 14
City of R a leig h En e rgy Costs ($0 .000 pe r kw h ) $0 .076
Fa cili ty O ccu p ie d Hou r s pe r W eek 60
K F ac tor of Ai r Cond ition e r (1 . 0 - 3. 0) 2. 0
A ir C onditi on ing w e eks/ ye a r (0 -52 ) 52
A ir C onditi on ing h r s/we e k (0 -168 ) 168
N umbe r of Cold Dr in k V end in g M ac h in es 3
N umbe r of Un co ole d Sn ack M ac h in es 1
Pow er R eq u irem en ts of C old D rin k M ach in e ( a vg wa tts) 233
Pow er R eq u irem en ts of S n ac k Mach in e (a vg w atts ) 138
V end in gM ise r S a le P r ice (for c o ld d rin k m ach in e s) $89 .00
S n ack Mise r S al e P r ice (for sn ack m ach in e s) $29 .00
Co rpo ra te Ta x R ate 0%
On e Y ear Sav in gs AnalysisB efore Af te r S avin gs
Cold D rink Machines $ 696 .14 $24 3.10 $ 453.04 Cost of Ope ra tion
9,160 3,199 5 ,961 kW h
65% % Energ y Sav ings
Snack Machines $ 137 .4 3 $4 9.08 $88 .35 Cost of Ope ra tion
1,808 646 1 ,163 kW h
64% % Energ y Sav ings
P ro ject Summ ary
Present kW h Pro jected kW hkW h Sav ing s p er
Y earCO 2 Em ission
S av ings (Tons)
10 ,9 68 3,8 44 7 ,124 4.04
Pre sent Cost Proje cte d Co sts A nnua l Saving s S avin gs T ota l P roje ct Cos tB re ak Even (M on th s)
$ 833.57 $ 292 .18 $ 541 .39 65% $ 296 .00 6.6
F ive Ye a r Sa v in gs on 4 M ach in e s = $2,706. 96
F ive Year R e tu rn on In ve stm en t = 8 15%
V ers ion 1. 0
Ye ar 1 Ye ar 2 Year 3 Yea r 4 Ye a r 5
Cost W ith M iser $2 92 .18 $584.36 $876. 54 $1 ,168 . 72 $ 1, 46 0 .90
Cost W ith ou t M isers $833.57 $1 , 66 7. 14 $2, 500. 71 $3,334 .29 $4,16 7 .8 6
S ou rce Da ta for Gen e ra tin g Ch art
In pu t V ar ia ble s
Ins ta lla tion of Vending M iser Analysis
Fi v e Y ea r O p era ti o n al Co s ts f o r V en d i n g M a c h i n es
$0
$5 00
$1 ,0 00
$1 ,5 00
$2 ,0 00
$2 ,5 00
$3 ,0 00
$3 ,5 00
$4 ,0 00
$4 ,5 00
Y ear 1 Y ear 2 Year 3 Y ear 4 Y ear 5
Cost W ithout MisersCost W ith Miser
* Savings results shown are estimates only. Estimates are based on average savings, as documented by hundreds of tests performed by independent parties. Actual "% Energy Savings" for individual machines may be higher or lower than estimated. All calculations depend
upon the actual values for energy costs, facility occupied hours, machine power requirements and other variables.
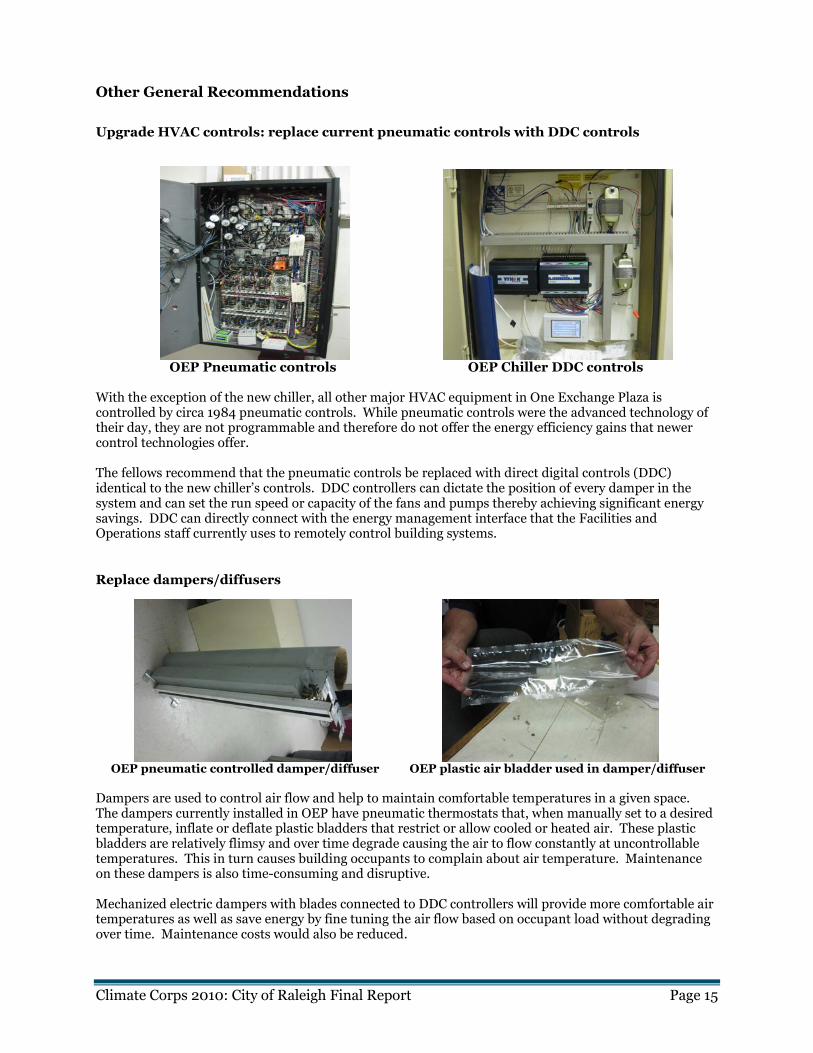
Climate Corps 2010: City of Raleigh Final Report Page 15
Other General Recommendations
Upgrade HVAC controls: replace current pneumatic controls with DDC controls
OEP Pneumatic controls OEP Chiller DDC controls With the exception of the new chiller, all other major HVAC equipment in One Exchange Plaza is controlled by circa 1984 pneumatic controls. While pneumatic controls were the advanced technology of their day, they are not programmable and therefore do not offer the energy efficiency gains that newer control technologies offer. The fellows recommend that the pneumatic controls be replaced with direct digital controls (DDC) identical to the new chiller’s controls. DDC controllers can dictate the position of every damper in the system and can set the run speed or capacity of the fans and pumps thereby achieving significant energy savings. DDC can directly connect with the energy management interface that the Facilities and Operations staff currently uses to remotely control building systems.
Replace dampers/diffusers
OEP pneumatic controlled damper/diffuser OEP plastic air bladder used in damper/diffuser
Dampers are used to control air flow and help to maintain comfortable temperatures in a given space. The dampers currently installed in OEP have pneumatic thermostats that, when manually set to a desired temperature, inflate or deflate plastic bladders that restrict or allow cooled or heated air. These plastic bladders are relatively flimsy and over time degrade causing the air to flow constantly at uncontrollable temperatures. This in turn causes building occupants to complain about air temperature. Maintenance on these dampers is also time-consuming and disruptive. Mechanized electric dampers with blades connected to DDC controllers will provide more comfortable air temperatures as well as save energy by fine tuning the air flow based on occupant load without degrading over time. Maintenance costs would also be reduced.
Climate Corps 2010: City of Raleigh Final Report Page 16
Educate building occupants about energy efficiency
Educating the building’s occupants about energy efficiency measures can be a powerful tool in ensuring that energy efficiency gains are realized. The lighting recommendation calls for the installation of LED tube lighting in a number of occupied areas in the building. LED lighting casts a slightly brighter light than typical fluorescent lighting and that may surprise some of the building’s occupants. The fellows recommend that the facilities staff inform the occupants of the new lighting retrofits and the benefits of the new lighting. While OEP has some signage in the building’s restrooms about turning the lights off when leaving a room and low flow water fixtures, there is no signage about the lighting occupancy sensors that are located in the restrooms. After surveying the restrooms, it was found that the majority of the sensors had been over-ridden or switched off, which meant that the lights stayed on when no one was in the restrooms and energy was not being saved. The fellows recommend signage in the restrooms informing the users about how the sensors work and ask that they not be switched off.
Summary of Energy Efficiency Projects
These projects, when fully implemented, could result in 1,099,297 kWh of annual electricity savings, $81,902 of annual cost savings, and 623.85 metric tons of CO2 emissions reductions.
Total Investment: $431,382.25
Annual kWh savings: 1,099,297
Payback Period: 5.27 years
CO2 emissions avoided:
623.85 metric tons
Action Plan & Timeline
The City of Raleigh should consider projects that offer a quick payback, have a low initial investment, and/or high annual energy savings. Keep in mind any projects that might be eligible for Progress Energy utility rebates (typically investments in equipment upgrades, but custom incentives are available too). Short Term Implementation (0 months – 1 year)
• Install VendingMisers on all the vending machines in OEP and apply for the Progress Energy utility rebates associated with vending machine controls
• Begin LED lighting retrofit in a phased approach beginning with stairwell emergency lighting and apply for Custom Incentive rebates from Progress Energy
• Begin installation of new fans/fan motors and VFDs with DDC controllers and apply for Progress Energy utility rebates associated with variable frequency/speed drive installations.
• Educate building occupants about energy efficiency improvements taking place at OEP and provide information on how to use occupancy sensors properly.
Medium Term Implementation (1 Year – 5 Years)
• Continue LED lighting retrofit on all floors of OEP, if not completed yet.
• Begin replacing pneumatic controls with DDC controllers and replace pneumatic dampers/diffusers with electric mechanized dampers with blades
Climate Corps 2010: City of Raleigh Final Report Page 17
OVERCOMING BARRIERS TO ENERGY EFFICIENCY
Barriers
Financial The City of Raleigh’s Facilities and Operations Division manages the operations and maintenance of all city-owned buildings, with the exception of the Fire Department’s fire stations and the Raleigh Convention Center. The division is city-funded and given a strict annual budget sanctioned by the City Council in which to operate, making it difficult to finance new projects that are not in the current budget. In addition, any money not used or saved by the department during the given fiscal year must be returned to the city operating budget, with a few exceptions, making it difficult to invest in continual efficiency improvement projects. The division is currently utilizing stimulus money from the Energy Efficiency and Conservation Block Grant (EECBG) as part of the American Recovery and Reinvestment Act (ARRA) and other grant money as well as Capital Improvement Project (CIP) city budget money to implement energy efficiency projects, but the projects are often piecemeal due to limited funds.
Recommended Strategies for Overcoming Barriers
Financial The Facility and Operations Division should be given the opportunity to keep all or a portion of the savings it will earn through energy efficiency projects. As it stands, the savings that the division obtains, with limited exceptions, must be returned to the city’s general fund. The incentives are not properly aligned. The City Council should consider a means to allow the Facilities and Operations Division, or any other city entity, to keep some of the savings earned through efficient and sustainable projects that improve the quality of the city-owned buildings and reduce energy consumption. In addition, City Council should restructure Capital Improvement Project funding to include a separate account for life-cycle analysis costs to ensure that the continual improvements, which are so vital to the overall operations of the city-buildings, are covered. This could also free up funds for energy efficiency projects that would save the city energy and money. Continue to seek grants and stimulus money to implement energy efficiency projects. Databases like the Database of State Incentives for Renewables and Efficiency (DSIRE) have a wealth of information on incentives and where to find incentives for energy efficiency projects. Also, continue to collaborate with other city departments to implement energy efficiency improvements.
Lessons from Overcoming Barriers
While conducting the energy efficiency assessment of One Exchange Plaza, it was important to keep in mind the financial situation of the city and the Facilities and Operations division. Therefore, the recommendations made in this report are sensitive to up-front costs, payback periods, overall cost savings, and the ability to secure utility rebates that will decrease those up-front costs.
Climate Corps 2010: City of Raleigh Final Report Page 18
CONCLUSIONS AND RECOMMENDED NEXT STEPS One Exchange Plaza is a well maintained building full of energy efficiency opportunities. The recommended projects in this report, if implemented, could generate significant savings for the City of Raleigh. Retrofitting the current fluorescent lighting to LED lighting, replacing the fans/fan motors and installing variable frequency drives, and installing vending machine controls are all projects that should be implemented immediately to capture efficiency gains and provide a better working environment for the building’s occupants. The general recommendations should also be adopted, when possible, to achieve energy savings. The recommended projects in this report are not entirely unique to One Exchange Plaza and could be applied city-wide. The City of Raleigh’s civic leaders should choose to continue to reinvest in energy efficiency projects that would further the city’s mission to become a sustainability leader. Once again, we would like to thank the Facilities and Operations staff for giving us so much of their valuable time while we were working on this report.
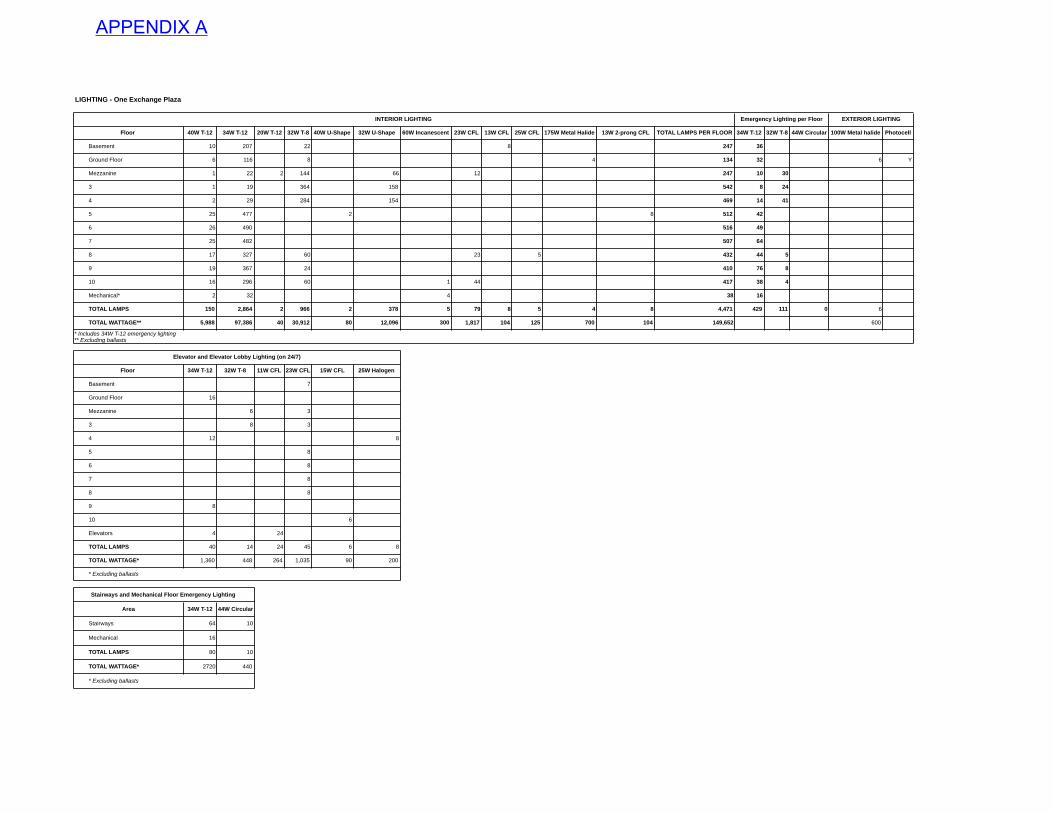
Floor 40W T-12 34W T-12 20W T-12 32W T-8 40W U-Shape 32W U-Shape 60W Incanescent 23W CFL 13W CFL 25W CFL 175W Metal Halide 13W 2-prong CFL TOTAL LAMPS PER FLOOR 34W T-12 32W T-8 44W Circular 100W Metal halide Photocell
Basement 10 207 22 8 247 36
Ground Floor 6 116 8 4 134 32 6 Y
Mezzanine 1 22 2 144 66 12 247 10 30
3 1 19 364 158 542 8 24
4 2 29 284 154 469 14 41
5 25 477 2 8 512 42
6 26 490 516 49
7 25 482 507 64
8 17 327 60 23 5 432 44 5
9 19 367 24 410 76 8
10 16 296 60 1 44 417 38 4
Mechanical* 2 32 4 38 16
TOTAL LAMPS 150 2,864 2 966 2 378 5 79 8 5 4 8 4,471 429 111 0 6
TOTAL WATTAGE** 5,988 97,386 40 30,912 80 12,096 300 1,817 104 125 700 104 149,652 600
Floor 34W T-12 32W T-8 11W CFL 23W CFL 15W CFL 25W Halogen
Basement 7
Ground Floor 16
Mezzanine 6 3
3 8 3
4 12 8
5 8
6 8
7 8
8 8
9 8
10 6
Elevators 4 24
TOTAL LAMPS 40 14 24 45 6 8
TOTAL WATTAGE* 1,360 448 264 1,035 90 200
Area 34W T-12 44W Circular
Stairways 64 10
Mechanical 16
TOTAL LAMPS 80 10
TOTAL WATTAGE* 2720 440
LIGHTING - One Exchange Plaza
* Excluding ballasts
* Excluding ballasts
Emergency Lighting per FloorINTERIOR LIGHTING EXTERIOR LIGHTING
* Includes 34W T-12 emergency lighting** Excluding ballasts
Elevator and Elevator Lobby Lighting (on 24/7)
Stairways and Mechanical Floor Emergency Lighting
APPENDIX A

www.LiteEnergySolutions.com
Lite Energy Solutions, Inc. 909 S Main St Ste 216 Salisbury, NC 28144 Office: (704) 932-0573 Fax: (704) 210-8012
Product Specifications
The T8/T12 LED Replacement Lamps by Lite Energy Solutions are the most advanced LED replacement solution for conventional fluorescent fixtures available today. Our LED lamps fit directly into your existing fixtures with minimal modification converting your current fixtures to state-of-the-art LED lighting technology. Compared to traditional Fluorescent lamps, our LED lamps will reduce current energy usage by 50% to 60%. LED technology does not require the use of ballast, therefore eliminating the associated energy and maintenance costs. LED lighting technology produces a higher quality of light that is better perceived and processed by our eyes. Therefore, lower lumens (or foot candles) are required to provide the same level of perceived light. Averaging 89 Lumens/Watt, our LED Replacement Lamps are the most powerful LED T8/T12 retrofit solution available in today’s market. The U.S. Department of Energy developed a standard for measuring a lamp’s end-of life, which is 70% of its original light output. In accordance with this rating standard, our LED Replacement Lamps are rated for 60,000 hours of maintenance free operation. LED products do not contain mercury, phosphorus, lead and other environmental contaminants that today’s fluorescent tubes contain. Expired fluorescent lamps are considered hazardous waste and it is illegal to dispose of with normal trash or place in a landfill. It only takes 1 gram of mercury to contaminate a 20-acre lake to the extent that fish living in the lake would be unfit for human consumption. Our LED products are 100% recyclable; eliminating EPA disposal requirements, costly compliance management processes, and liability exposure.
LED Retrofit Solutions for T8/T12 Fixtures
- Lengths Available 1, 2, 3, 4, 5, 6 & 8 feet - Power Consumption: 4 Watts/Linear Foot - Input Voltage: AC 100~277V - Luminous Flux: 400 Lumens/Linear Foot - Color Temperature: 2800 K (Warm) 4100 K (Natural) 5500 K (Day) - CRI: >80 - Lifespan: > 60,000 Hours - LED Beam Angle: 120° - LED Quantity: 75 LEDs/Linear Foot - Operating Temperature: -4°F to 113°F (-20~45ºC) - UL Listed to UL 1598, 1598B - ETL Listed to UL STD 1993 - Construction: Clear, impact resistant plastic lens and an integrated Aluminum heat sink - Physical Characteristics: Diameter – 1.0 Inches
Our LED lighting technology eliminates hidden issues of fluorescent lighting technology such as harmful ultraviolet rays and undetectable flickering, which causes eye-strain and headaches. Replacing fluorescent lamps is not only a way to save on your electric bill, but will also provide better light quality and reduce your environmental impact.
“Get More from LESS”
APPENDIX B
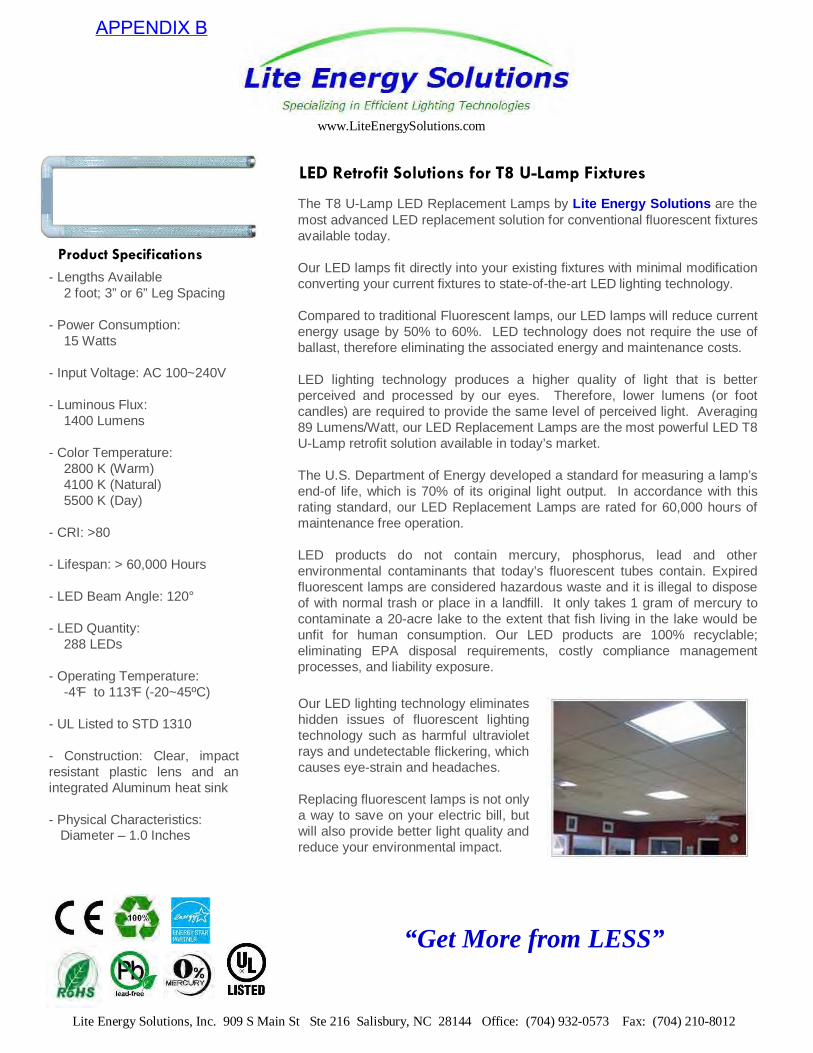
www.LiteEnergySolutions.com
Lite Energy Solutions, Inc. 909 S Main St Ste 216 Salisbury, NC 28144 Office: (704) 932-0573 Fax: (704) 210-8012
Product Specifications
The T8 U-Lamp LED Replacement Lamps by Lite Energy Solutions are the most advanced LED replacement solution for conventional fluorescent fixtures available today. Our LED lamps fit directly into your existing fixtures with minimal modification converting your current fixtures to state-of-the-art LED lighting technology. Compared to traditional Fluorescent lamps, our LED lamps will reduce current energy usage by 50% to 60%. LED technology does not require the use of ballast, therefore eliminating the associated energy and maintenance costs. LED lighting technology produces a higher quality of light that is better perceived and processed by our eyes. Therefore, lower lumens (or foot candles) are required to provide the same level of perceived light. Averaging 89 Lumens/Watt, our LED Replacement Lamps are the most powerful LED T8 U-Lamp retrofit solution available in today’s market. The U.S. Department of Energy developed a standard for measuring a lamp’s end-of life, which is 70% of its original light output. In accordance with this rating standard, our LED Replacement Lamps are rated for 60,000 hours of maintenance free operation. LED products do not contain mercury, phosphorus, lead and other environmental contaminants that today’s fluorescent tubes contain. Expired fluorescent lamps are considered hazardous waste and it is illegal to dispose of with normal trash or place in a landfill. It only takes 1 gram of mercury to contaminate a 20-acre lake to the extent that fish living in the lake would be unfit for human consumption. Our LED products are 100% recyclable; eliminating EPA disposal requirements, costly compliance management processes, and liability exposure.
LED Retrofit Solutions for T8 U-Lamp Fixtures
- Lengths Available 2 foot; 3” or 6” Leg Spacing - Power Consumption: 15 Watts - Input Voltage: AC 100~240V - Luminous Flux: 1400 Lumens - Color Temperature: 2800 K (Warm) 4100 K (Natural) 5500 K (Day) - CRI: >80 - Lifespan: > 60,000 Hours - LED Beam Angle: 120° - LED Quantity: 288 LEDs - Operating Temperature: -4°F to 113°F (-20~45ºC) - UL Listed to STD 1310 - Construction: Clear, impact resistant plastic lens and an integrated Aluminum heat sink - Physical Characteristics: Diameter – 1.0 Inches
Our LED lighting technology eliminates hidden issues of fluorescent lighting technology such as harmful ultraviolet rays and undetectable flickering, which causes eye-strain and headaches. Replacing fluorescent lamps is not only a way to save on your electric bill, but will also provide better light quality and reduce your environmental impact.
“Get More from LESS”
APPENDIX B

www.LiteEnergySolutions.com
Lite Energy Solutions, Inc. 909 S Main St Ste 216 Salisbury, NC 28144 Office: (704) 932-0573 Fax: (704) 210-8012
The LED Replacement Lamps by Lite Energy Solutions are the most advanced LED replacement solution for conventional PAR lamps available today. Our fully dimmable LED PAR lamps screw directly into the existing fixture allowing them to utilize the latest state-of-the-art LED lighting technology. Compared to traditional PAR lamps, our LED lamps will reduce current energy usage by 75% to 85%. We have LED PAR lamps available in all standard sizes in both spot/flood and dimmable/non-dimmable configurations. LED lighting technology produces a higher quality of light that is better perceived and processed by our eyes. Therefore, lower lumens (or foot candles) are required to provide the same level of perceived light. Averaging 58 Lumens/Watt, our LED Replacement Lamps are the most powerful LED PAR Lamp retrofit solution available in today’s market. The U.S. Department of Energy developed a standard for measuring a lamp’s end-of life, which is 70% of its original light output. In accordance with this rating standard, our LED Replacement Lamps are rated for 60,000 hours of maintenance free operation. LED products do not contain mercury, phosphorus, lead and other environmental contaminants that today’s fluorescent tubes contain. Expired fluorescent lamps are considered hazardous waste and it is illegal to dispose of with normal trash or place in a landfill. It only takes 1 gram of mercury to contaminate a 20-acre lake to the extent that fish living in the lake would be unfit for human consumption. Our LED products are 100% recyclable; eliminating EPA disposal requirements, costly compliance management processes, and liability exposure.
LED Retrofit Solutions for PAR Lamps
- Types Available PAR 16, 20, 30 & 38 - Power Consumption: 5 - 15 Watts - Input Voltage: AC 110~277V - Luminous Flux: Average 58lm/watt - Color Temperature: 2800 K (Warm) 4100 K (Natural) 5500 K (Day) - CRI: 80 - Lifespan: > 60,000 Hours - LED Beam Angle: 120° - LED Type: CREE - LED Quantity: 5 - 12 LEDs - Operating Temperature: -4°F to 113°F (-20~45ºC) - Listing Standards UL or ETL Listed - Construction: Extruded Aluminum Housing Open or Lens Options
Product Specifications
“Get More from LESS”
Our LED lighting technology eliminates hidden issues of traditional lighting technology such as harmful ultraviolet rays and undetectable flickering, which causes eye-strain and headaches. Replacing traditional lamps is not only a way to save on your electric bill, but will also provide better light quality and reduce your environmental impact.
APPENDIX B

ENERGY EFFICIENCY FOR BUSINESS PROGRAM POLICIES AND PROCEDURES
Ver. 2.0 Rev. 04.30.10 13 4/30/10
6.2 Retrofit Custom Incentives
The Energy Efficiency for Business Program offers custom incentives for eligible improvements not listed as prescriptive measures. Measures listed in prescriptive tables that do not meet minimum program specifications cannot be submitted as a custom measure. Qualified custom ECMs reduce electric energy use due to an improvement in system efficiency, i.e. a net decrease in energy use without a reduction in the level of service. For example, installing a lower wattage lamp in place of a higher wattage lamp of the same type does not qualify for a custom incentive. However should the lighting system (i.e., lamp, ballast and fixture) demonstrably improve the total lumens per Watt delivered, an incentive will be considered. Examples of custom measures include, but are not limited to, the following: Economizers – air side or water-side Energy Star® solid door commercial freezers High Intensity Discharge (HID) or fluorescent light fixture improvements not covered under
the prescriptive measures Variable frequency drives on non-HVAC pump and fan motors serving variable-capacity
loads, such as air compressors, pumps, fans, blowers, process chillers and cooling towers. Automatic controls, including time switches, sensors, etc. Day lighting or light harvesting, when combined with appropriate lighting controls. Building envelope improvements (windows, window films, solar screens, cool roofs, etc.)2. Improved process efficiency. Compressed air system improvements. LED lighting fixtures or retrofit packages.
Incentives for custom measures are based on the electrical energy savings that result from the energy efficiency measure installation and are based upon the calculated annual kWh savings. The applicant must provide sufficient back-up descriptive information, equipment performance data, operating assumptions, measurements, calculations and models to support the energy savings estimates. Guidelines for calculating custom measure energy savings are detailed in Section 16.
The Custom incentive shown in Table 6-5 is based on the expected life of the measure. Custom projects eligible for an incentive must have a payback period one year and ! 7 years to qualify for a $0.08 per kWh incentive. Project simplified payback is calculated as follows:
($/kWh) Ratey Electricit(kWh) SavingsEnergy Annual
Cost ProjectPeriod Payback Simplified
!"
2 Only if facility has electric cooling or heating present.
APPENDIX C
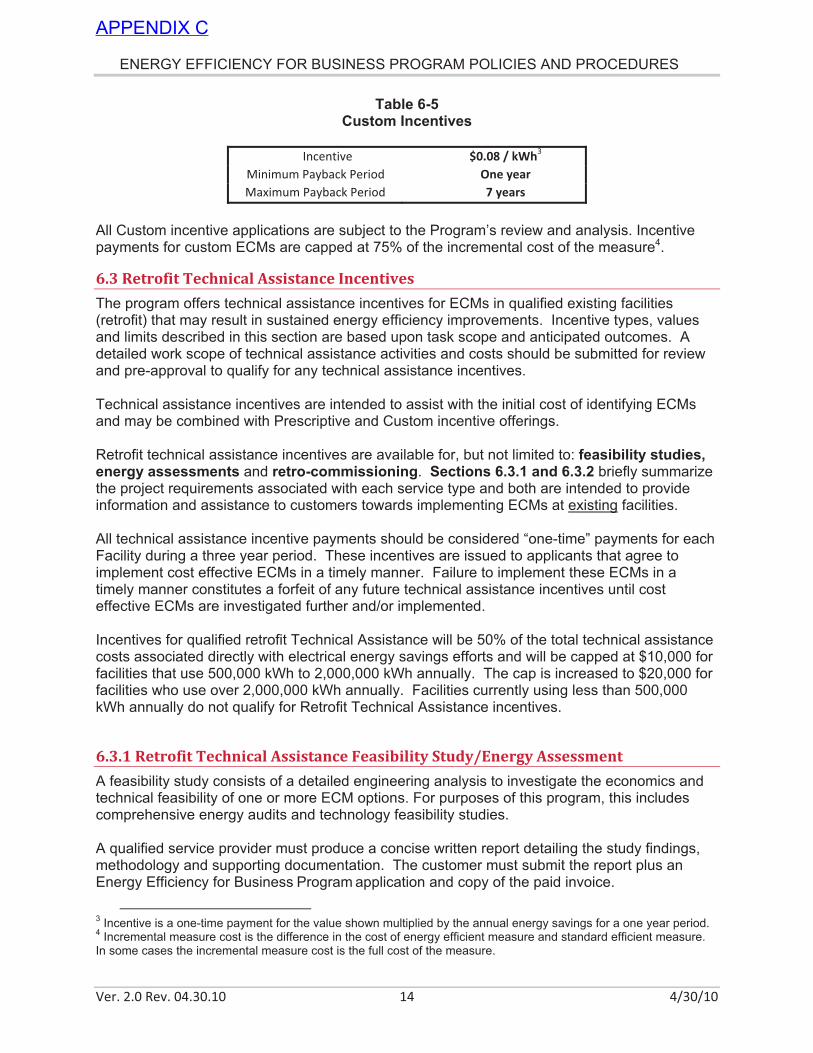
ENERGY EFFICIENCY FOR BUSINESS PROGRAM POLICIES AND PROCEDURES
Ver. 2.0 Rev. 04.30.10 14 4/30/10
Table 6-5 Custom Incentives
Incentive $0.08 / kWh
3
Minimum Payback Period One year
Maximum Payback Period 7 years
All Custom incentive applications are subject to the Program’s review and analysis. Incentive payments for custom ECMs are capped at 75% of the incremental cost of the measure4.
6.3 Retrofit Technical Assistance Incentives
The program offers technical assistance incentives for ECMs in qualified existing facilities (retrofit) that may result in sustained energy efficiency improvements. Incentive types, values and limits described in this section are based upon task scope and anticipated outcomes. A detailed work scope of technical assistance activities and costs should be submitted for review and pre-approval to qualify for any technical assistance incentives. Technical assistance incentives are intended to assist with the initial cost of identifying ECMs and may be combined with Prescriptive and Custom incentive offerings. Retrofit technical assistance incentives are available for, but not limited to: feasibility studies, energy assessments and retro-commissioning. Sections 6.3.1 and 6.3.2 briefly summarize the project requirements associated with each service type and both are intended to provide information and assistance to customers towards implementing ECMs at existing facilities. All technical assistance incentive payments should be considered “one-time” payments for each Facility during a three year period. These incentives are issued to applicants that agree to implement cost effective ECMs in a timely manner. Failure to implement these ECMs in a timely manner constitutes a forfeit of any future technical assistance incentives until cost effective ECMs are investigated further and/or implemented. Incentives for qualified retrofit Technical Assistance will be 50% of the total technical assistance costs associated directly with electrical energy savings efforts and will be capped at $10,000 for facilities that use 500,000 kWh to 2,000,000 kWh annually. The cap is increased to $20,000 for facilities who use over 2,000,000 kWh annually. Facilities currently using less than 500,000 kWh annually do not qualify for Retrofit Technical Assistance incentives.
6.3.1 Retrofit Technical Assistance Feasibility Study/Energy Assessment
A feasibility study consists of a detailed engineering analysis to investigate the economics and technical feasibility of one or more ECM options. For purposes of this program, this includes comprehensive energy audits and technology feasibility studies. A qualified service provider must produce a concise written report detailing the study findings, methodology and supporting documentation. The customer must submit the report plus an Energy Efficiency for Business Program application and copy of the paid invoice.
3 Incentive is a one-time payment for the value shown multiplied by the annual energy savings for a one year period.
4 Incremental measure cost is the difference in the cost of energy efficient measure and standard efficient measure.
In some cases the incremental measure cost is the full cost of the measure.
APPENDIX C
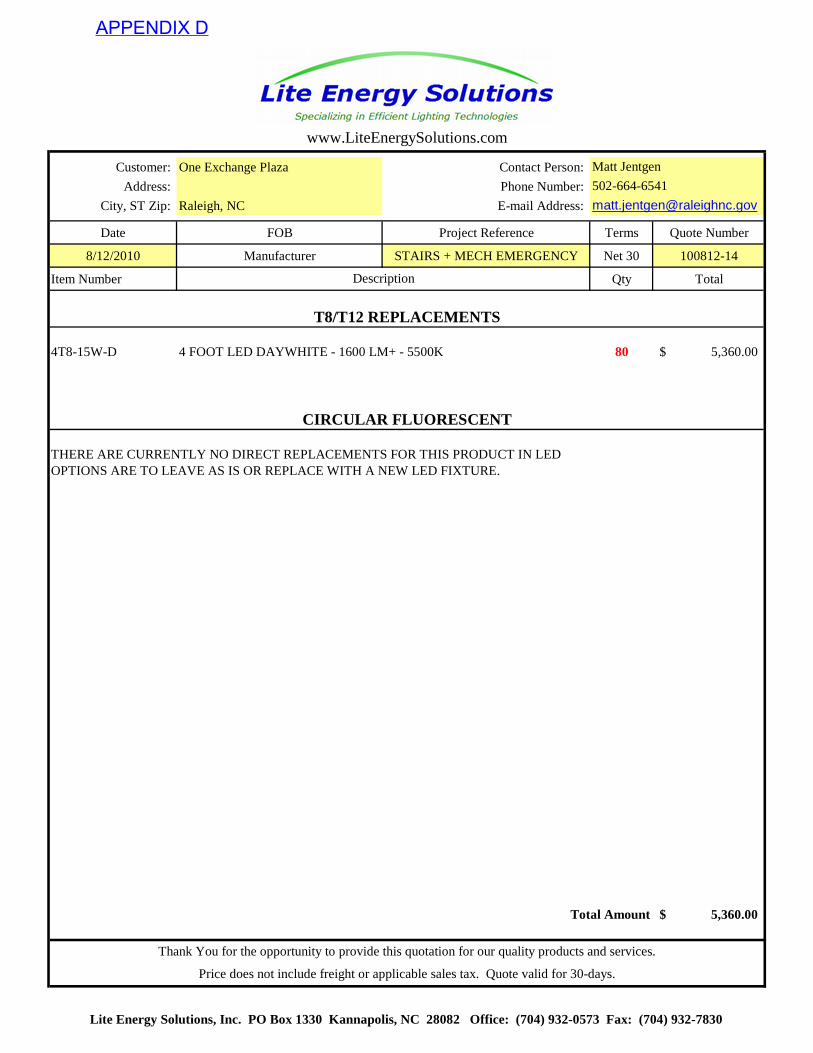
Customer: One Exchange Plaza Contact Person:
Address: Phone Number:
City, ST Zip: Raleigh, NC E-mail Address:
Date FOB Project Reference Terms Quote Number
8/12/2010 Manufacturer STAIRS + MECH EMERGENCY Net 30 100812-14
Item Number Qty Total
4T8-15W-D 4 FOOT LED DAYWHITE - 1600 LM+ - 5500K 80 5,360.00$
THERE ARE CURRENTLY NO DIRECT REPLACEMENTS FOR THIS PRODUCT IN LEDOPTIONS ARE TO LEAVE AS IS OR REPLACE WITH A NEW LED FIXTURE.
Total Amount 5,360.00$
www.LiteEnergySolutions.com
Description
Thank You for the opportunity to provide this quotation for our quality products and services.
Price does not include freight or applicable sales tax. Quote valid for 30-days.
Matt Jentgen
502-664-6541
T8/T12 REPLACEMENTS
CIRCULAR FLUORESCENT
Lite Energy Solutions, Inc. PO Box 1330 Kannapolis, NC 28082 Office: (704) 932-0573 Fax: (704) 932-7830
APPENDIX D
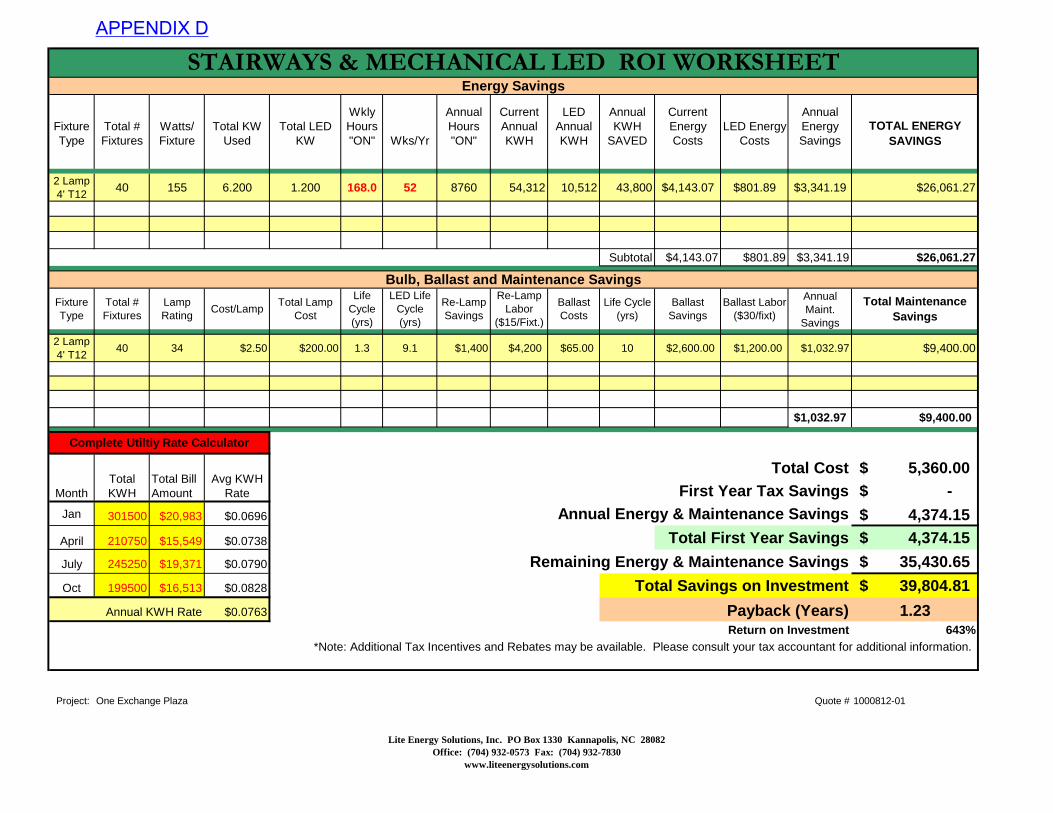
Fixture Type
Total # Fixtures
Watts/ Fixture
Total KW Used
Total LED KW
Wkly Hours "ON" Wks/Yr
Annual Hours "ON"
Current Annual KWH
LED Annual KWH
Annual KWH
SAVED
Current Energy Costs
LED Energy Costs
Annual Energy Savings
TOTAL ENERGY SAVINGS
2 Lamp 4' T12
40 155 6.200 1.200 168.0 52 8760 54,312 10,512 43,800 $4,143.07 $801.89 $3,341.19 $26,061.27
Subtotal $4,143.07 $801.89 $3,341.19 $26,061.27
Fixture Type
Total # Fixtures
Lamp Rating
Cost/LampTotal Lamp
Cost
Life Cycle (yrs)
LED Life Cycle (yrs)
Re-Lamp Savings
Re-Lamp Labor
($15/Fixt.)
Ballast Costs
Life Cycle (yrs)
Ballast Savings
Ballast Labor ($30/fixt)
Annual Maint.
Savings
Total Maintenance Savings
2 Lamp 4' T12
40 34 $2.50 $200.00 1.3 9.1 $1,400 $4,200 $65.00 10 $2,600.00 $1,200.00 $1,032.97 $9,400.00
$1,032.97 $9,400.00
Total Cost 5,360.00$ First Year Tax Savings -$
Jan 301500 $20,983 $0.0696 Annual Energy & Maintenance Savings 4,374.15$
April 210750 $15,549 $0.0738 Total First Year Savings 4,374.15$
July 245250 $19,371 $0.0790 Remaining Energy & Maintenance Savings 35,430.65$
Oct 199500 $16,513 $0.0828 Total Savings on Investment 39,804.81$
Annual KWH Rate $0.0763 Payback (Years) 1.23Return on Investment 643%
Project: Quote # 1000812-01
STAIRWAYS & MECHANICAL LED ROI WORKSHEET
Bulb, Ballast and Maintenance Savings
Energy Savings
*Note: Additional Tax Incentives and Rebates may be available. Please consult your tax accountant for additional information.
Complete Utiltiy Rate Calculator
One Exchange Plaza
Total KWH
Total Bill AmountMonth
Avg KWH Rate
Lite Energy Solutions, Inc. PO Box 1330 Kannapolis, NC 28082Office: (704) 932-0573 Fax: (704) 932-7830
www.liteenergysolutions.com
APPENDIX D
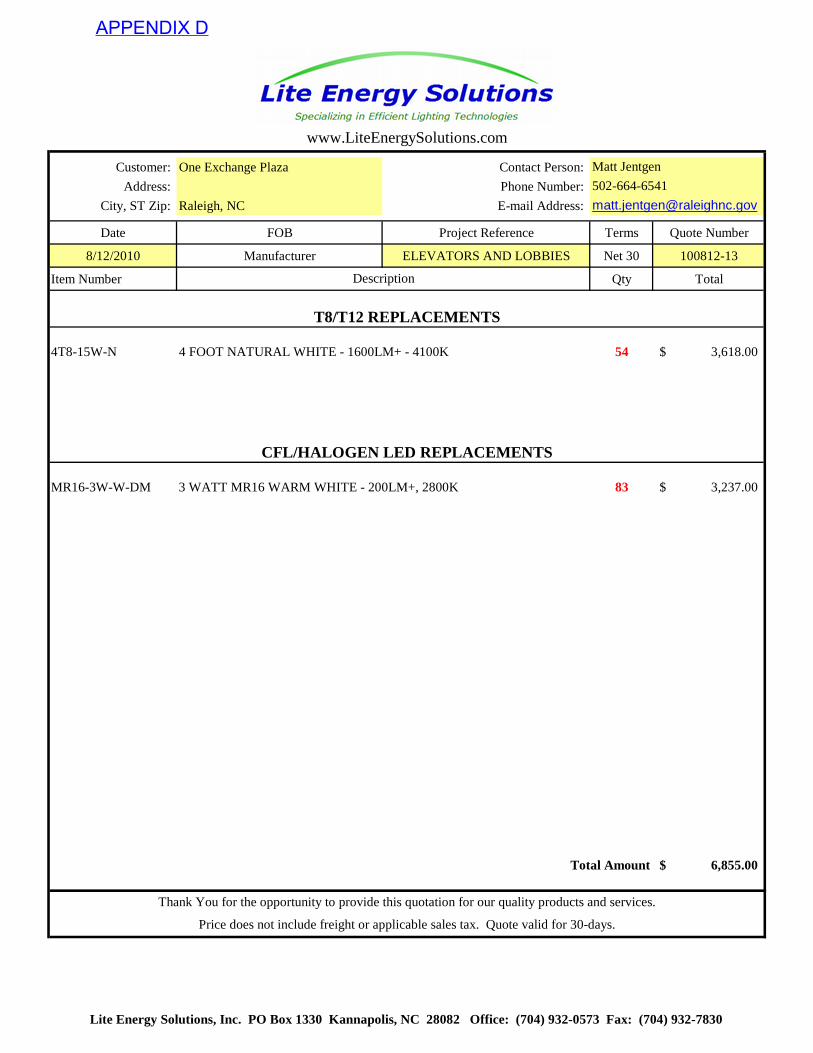
Customer: One Exchange Plaza Contact Person:
Address: Phone Number:
City, ST Zip: Raleigh, NC E-mail Address:
Date FOB Project Reference Terms Quote Number
8/12/2010 Manufacturer ELEVATORS AND LOBBIES Net 30 100812-13
Item Number Qty Total
4T8-15W-N 4 FOOT NATURAL WHITE - 1600LM+ - 4100K 54 3,618.00$
MR16-3W-W-DM 3 WATT MR16 WARM WHITE - 200LM+, 2800K 83 3,237.00$
Total Amount 6,855.00$
CFL/HALOGEN LED REPLACEMENTS
www.LiteEnergySolutions.com
Description
Thank You for the opportunity to provide this quotation for our quality products and services.
Price does not include freight or applicable sales tax. Quote valid for 30-days.
Matt Jentgen
502-664-6541
T8/T12 REPLACEMENTS
Lite Energy Solutions, Inc. PO Box 1330 Kannapolis, NC 28082 Office: (704) 932-0573 Fax: (704) 932-7830
APPENDIX D
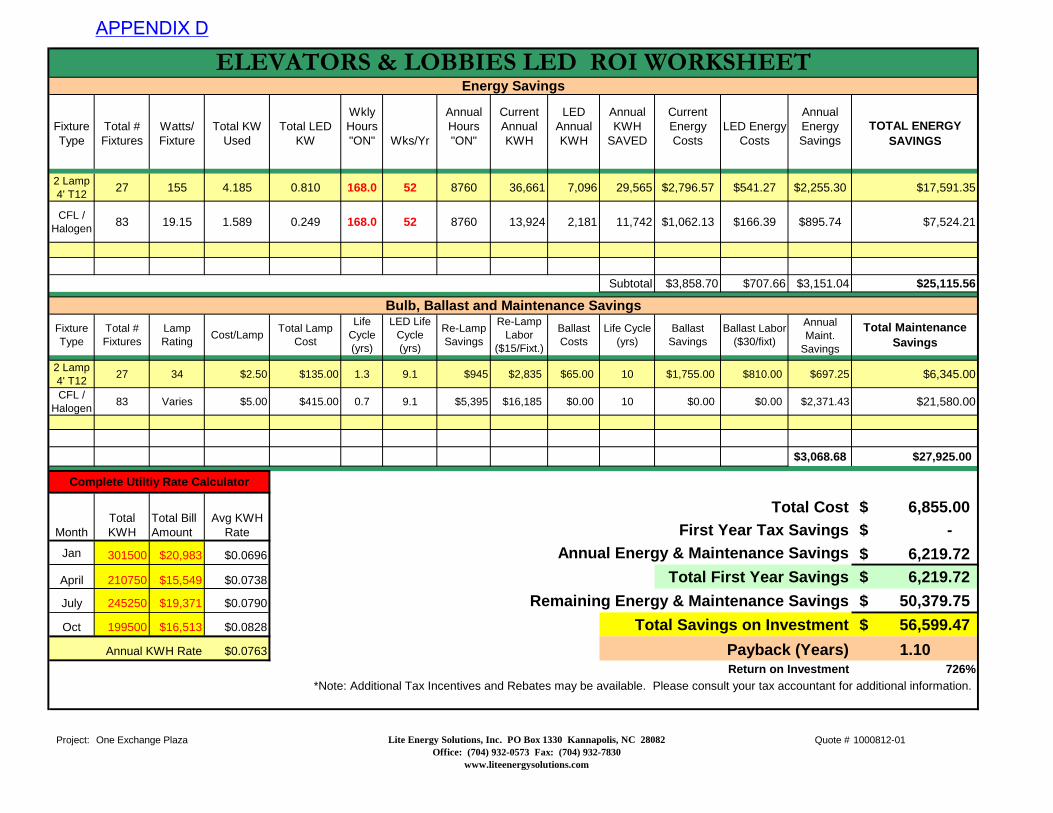
Fixture Type
Total # Fixtures
Watts/ Fixture
Total KW Used
Total LED KW
Wkly Hours "ON" Wks/Yr
Annual Hours "ON"
Current Annual KWH
LED Annual KWH
Annual KWH
SAVED
Current Energy Costs
LED Energy Costs
Annual Energy Savings
TOTAL ENERGY SAVINGS
2 Lamp 4' T12
27 155 4.185 0.810 168.0 52 8760 36,661 7,096 29,565 $2,796.57 $541.27 $2,255.30 $17,591.35
CFL / Halogen
83 19.15 1.589 0.249 168.0 52 8760 13,924 2,181 11,742 $1,062.13 $166.39 $895.74 $7,524.21
Subtotal $3,858.70 $707.66 $3,151.04 $25,115.56
Fixture Type
Total # Fixtures
Lamp Rating
Cost/LampTotal Lamp
Cost
Life Cycle (yrs)
LED Life Cycle (yrs)
Re-Lamp Savings
Re-Lamp Labor
($15/Fixt.)
Ballast Costs
Life Cycle (yrs)
Ballast Savings
Ballast Labor ($30/fixt)
Annual Maint.
Savings
Total Maintenance Savings
2 Lamp 4' T12
27 34 $2.50 $135.00 1.3 9.1 $945 $2,835 $65.00 10 $1,755.00 $810.00 $697.25 $6,345.00
CFL / Halogen
83 Varies $5.00 $415.00 0.7 9.1 $5,395 $16,185 $0.00 10 $0.00 $0.00 $2,371.43 $21,580.00
$3,068.68 $27,925.00
Total Cost 6,855.00$ First Year Tax Savings -$
Jan 301500 $20,983 $0.0696 Annual Energy & Maintenance Savings 6,219.72$
April 210750 $15,549 $0.0738 Total First Year Savings 6,219.72$
July 245250 $19,371 $0.0790 Remaining Energy & Maintenance Savings 50,379.75$
Oct 199500 $16,513 $0.0828 Total Savings on Investment 56,599.47$
Annual KWH Rate $0.0763 Payback (Years) 1.10Return on Investment 726%
Project: Quote # 1000812-01One Exchange Plaza
Total KWH
Total Bill AmountMonth
Avg KWH Rate
ELEVATORS & LOBBIES LED ROI WORKSHEET
Bulb, Ballast and Maintenance Savings
Energy Savings
*Note: Additional Tax Incentives and Rebates may be available. Please consult your tax accountant for additional information.
Complete Utiltiy Rate Calculator
Lite Energy Solutions, Inc. PO Box 1330 Kannapolis, NC 28082Office: (704) 932-0573 Fax: (704) 932-7830
www.liteenergysolutions.com
APPENDIX D
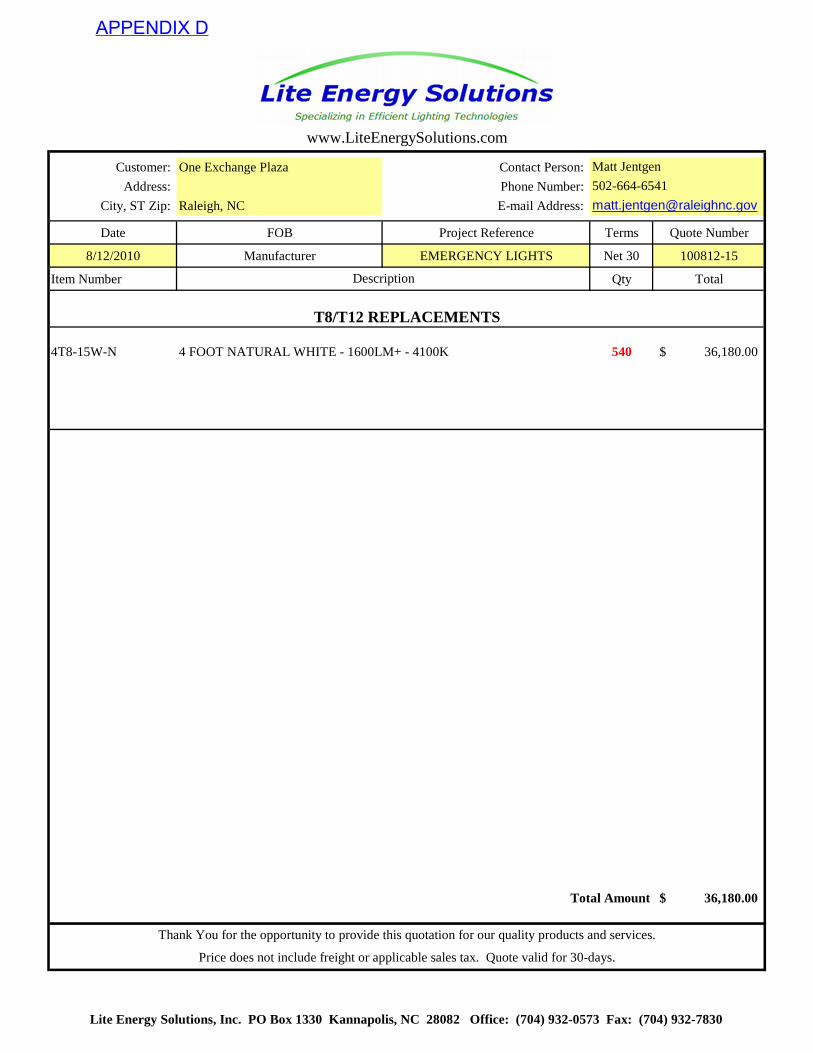
Customer: One Exchange Plaza Contact Person:
Address: Phone Number:
City, ST Zip: Raleigh, NC E-mail Address:
Date FOB Project Reference Terms Quote Number
8/12/2010 Manufacturer EMERGENCY LIGHTS Net 30 100812-15
Item Number Qty Total
4T8-15W-N 4 FOOT NATURAL WHITE - 1600LM+ - 4100K 540 36,180.00$
Total Amount 36,180.00$
www.LiteEnergySolutions.com
Description
Thank You for the opportunity to provide this quotation for our quality products and services.
Price does not include freight or applicable sales tax. Quote valid for 30-days.
Matt Jentgen
502-664-6541
T8/T12 REPLACEMENTS
Lite Energy Solutions, Inc. PO Box 1330 Kannapolis, NC 28082 Office: (704) 932-0573 Fax: (704) 932-7830
APPENDIX D
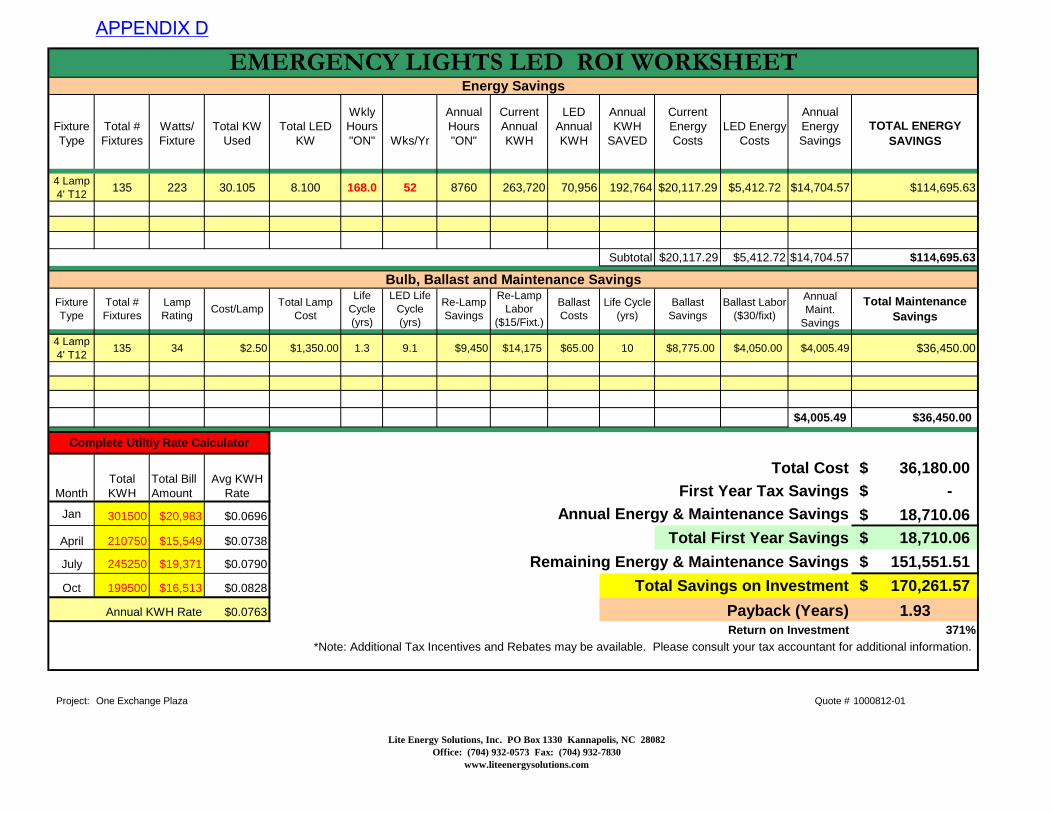
Fixture Type
Total # Fixtures
Watts/ Fixture
Total KW Used
Total LED KW
Wkly Hours "ON" Wks/Yr
Annual Hours "ON"
Current Annual KWH
LED Annual KWH
Annual KWH
SAVED
Current Energy Costs
LED Energy Costs
Annual Energy Savings
TOTAL ENERGY SAVINGS
4 Lamp 4' T12
135 223 30.105 8.100 168.0 52 8760 263,720 70,956 192,764 $20,117.29 $5,412.72 $14,704.57 $114,695.63
Subtotal $20,117.29 $5,412.72 $14,704.57 $114,695.63
Fixture Type
Total # Fixtures
Lamp Rating
Cost/LampTotal Lamp
Cost
Life Cycle (yrs)
LED Life Cycle (yrs)
Re-Lamp Savings
Re-Lamp Labor
($15/Fixt.)
Ballast Costs
Life Cycle (yrs)
Ballast Savings
Ballast Labor ($30/fixt)
Annual Maint.
Savings
Total Maintenance Savings
4 Lamp 4' T12
135 34 $2.50 $1,350.00 1.3 9.1 $9,450 $14,175 $65.00 10 $8,775.00 $4,050.00 $4,005.49 $36,450.00
$4,005.49 $36,450.00
Total Cost 36,180.00$ First Year Tax Savings -$
Jan 301500 $20,983 $0.0696 Annual Energy & Maintenance Savings 18,710.06$
April 210750 $15,549 $0.0738 Total First Year Savings 18,710.06$
July 245250 $19,371 $0.0790 Remaining Energy & Maintenance Savings 151,551.51$
Oct 199500 $16,513 $0.0828 Total Savings on Investment 170,261.57$
Annual KWH Rate $0.0763 Payback (Years) 1.93Return on Investment 371%
Project: Quote # 1000812-01One Exchange Plaza
Total KWH
Total Bill AmountMonth
Avg KWH Rate
EMERGENCY LIGHTS LED ROI WORKSHEET
Bulb, Ballast and Maintenance Savings
Energy Savings
*Note: Additional Tax Incentives and Rebates may be available. Please consult your tax accountant for additional information.
Complete Utiltiy Rate Calculator
Lite Energy Solutions, Inc. PO Box 1330 Kannapolis, NC 28082Office: (704) 932-0573 Fax: (704) 932-7830
www.liteenergysolutions.com
APPENDIX D
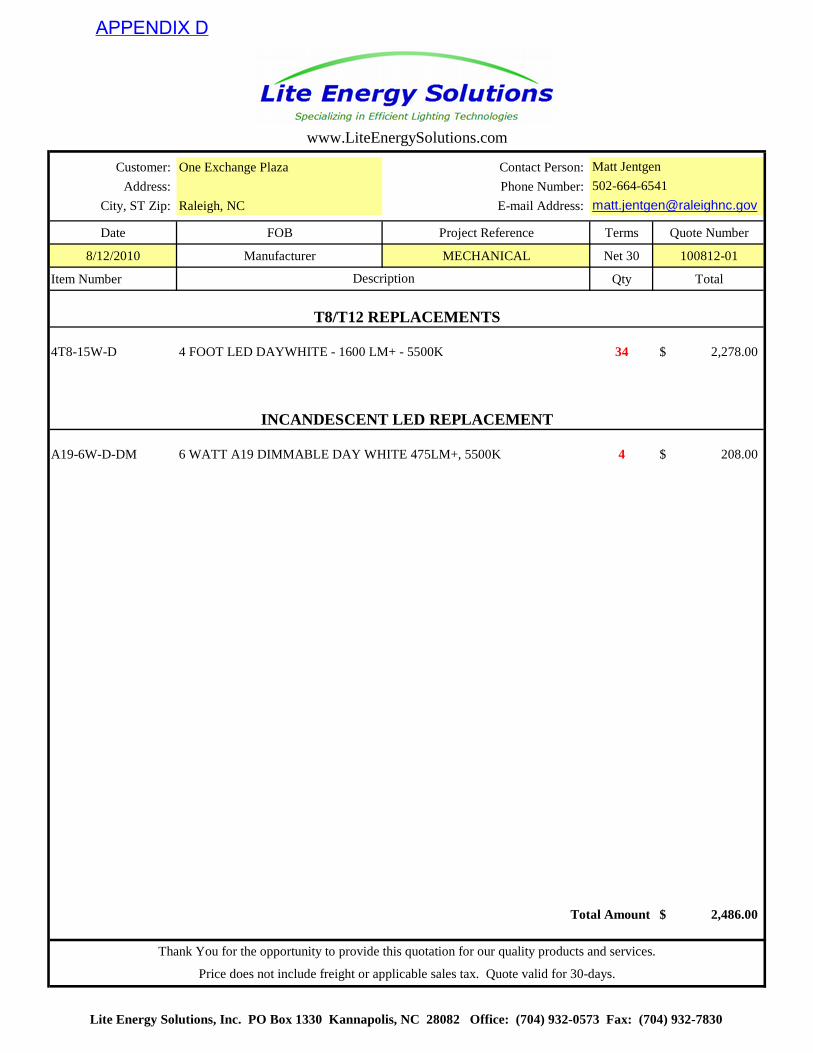
Customer: One Exchange Plaza Contact Person:
Address: Phone Number:
City, ST Zip: Raleigh, NC E-mail Address:
Date FOB Project Reference Terms Quote Number
8/12/2010 Manufacturer MECHANICAL Net 30 100812-01
Item Number Qty Total
4T8-15W-D 4 FOOT LED DAYWHITE - 1600 LM+ - 5500K 34 2,278.00$
A19-6W-D-DM 6 WATT A19 DIMMABLE DAY WHITE 475LM+, 5500K 4 208.00$
Total Amount 2,486.00$
www.LiteEnergySolutions.com
Description
Thank You for the opportunity to provide this quotation for our quality products and services.
Price does not include freight or applicable sales tax. Quote valid for 30-days.
Matt Jentgen
502-664-6541
T8/T12 REPLACEMENTS
INCANDESCENT LED REPLACEMENT
Lite Energy Solutions, Inc. PO Box 1330 Kannapolis, NC 28082 Office: (704) 932-0573 Fax: (704) 932-7830
APPENDIX D
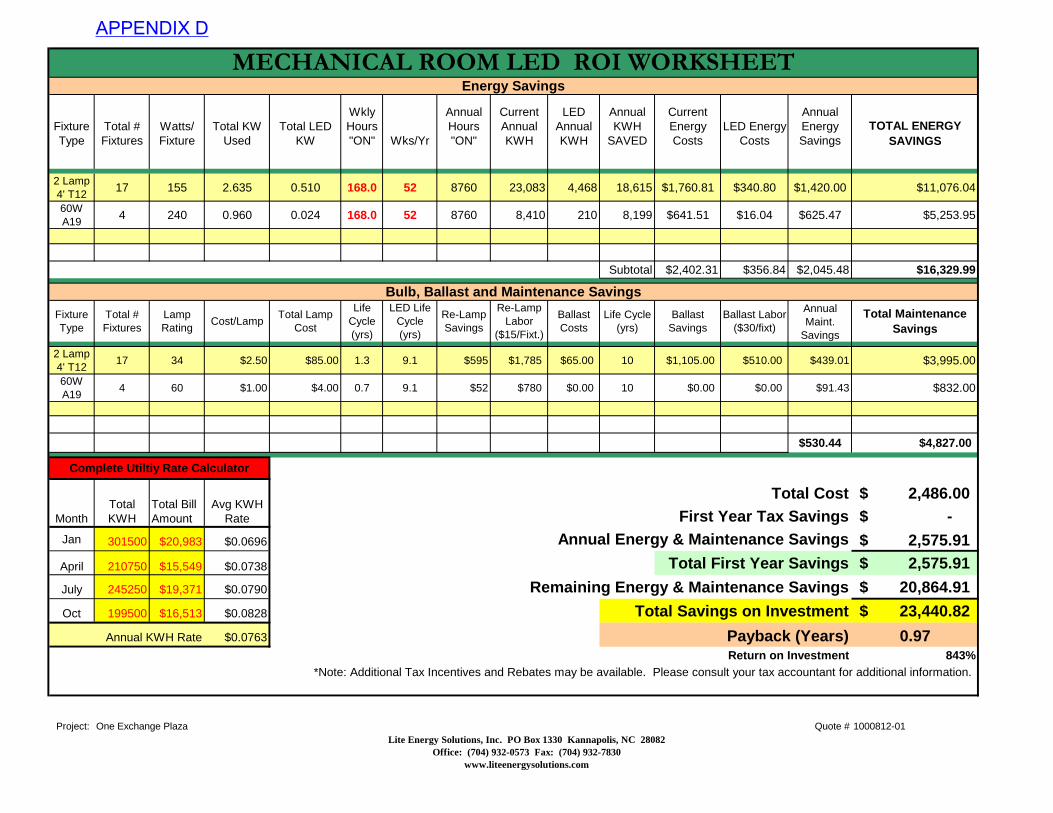
Fixture Type
Total # Fixtures
Watts/ Fixture
Total KW Used
Total LED KW
Wkly Hours "ON" Wks/Yr
Annual Hours "ON"
Current Annual KWH
LED Annual KWH
Annual KWH
SAVED
Current Energy Costs
LED Energy Costs
Annual Energy Savings
TOTAL ENERGY SAVINGS
2 Lamp 4' T12
17 155 2.635 0.510 168.0 52 8760 23,083 4,468 18,615 $1,760.81 $340.80 $1,420.00 $11,076.04
60W A19
4 240 0.960 0.024 168.0 52 8760 8,410 210 8,199 $641.51 $16.04 $625.47 $5,253.95
Subtotal $2,402.31 $356.84 $2,045.48 $16,329.99
Fixture Type
Total # Fixtures
Lamp Rating
Cost/LampTotal Lamp
Cost
Life Cycle (yrs)
LED Life Cycle (yrs)
Re-Lamp Savings
Re-Lamp Labor
($15/Fixt.)
Ballast Costs
Life Cycle (yrs)
Ballast Savings
Ballast Labor ($30/fixt)
Annual Maint.
Savings
Total Maintenance Savings
2 Lamp 4' T12
17 34 $2.50 $85.00 1.3 9.1 $595 $1,785 $65.00 10 $1,105.00 $510.00 $439.01 $3,995.00
60W A19
4 60 $1.00 $4.00 0.7 9.1 $52 $780 $0.00 10 $0.00 $0.00 $91.43 $832.00
$530.44 $4,827.00
Total Cost 2,486.00$ First Year Tax Savings -$
Jan 301500 $20,983 $0.0696 Annual Energy & Maintenance Savings 2,575.91$
April 210750 $15,549 $0.0738 Total First Year Savings 2,575.91$
July 245250 $19,371 $0.0790 Remaining Energy & Maintenance Savings 20,864.91$
Oct 199500 $16,513 $0.0828 Total Savings on Investment 23,440.82$
Annual KWH Rate $0.0763 Payback (Years) 0.97Return on Investment 843%
Project: Quote # 1000812-01
MECHANICAL ROOM LED ROI WORKSHEET
Bulb, Ballast and Maintenance Savings
Energy Savings
*Note: Additional Tax Incentives and Rebates may be available. Please consult your tax accountant for additional information.
Complete Utiltiy Rate Calculator
One Exchange Plaza
Total KWH
Total Bill AmountMonth
Avg KWH Rate
Lite Energy Solutions, Inc. PO Box 1330 Kannapolis, NC 28082Office: (704) 932-0573 Fax: (704) 932-7830
www.liteenergysolutions.com
APPENDIX D

Customer: One Exchange Plaza Contact Person:
Address: Phone Number:
City, ST Zip: Raleigh, NC E-mail Address:
Date FOB Project Reference Terms Quote Number
8/12/2010 Manufacturer GROUND FLOOR Net 30 100812-03
Item Number Qty Total
4T8-15W-N 4 FOOT NATURAL WHITE - 1600LM+ - 4100K 130 8,710.00$
PAR38-15-W 15 WATT PAR 38 WARM WHITE, NON-DIMMABLE 1000LM+ - 2800K 4 328.00$
Total Amount 9,038.00$
www.LiteEnergySolutions.com
Description
Thank You for the opportunity to provide this quotation for our quality products and services.
Price does not include freight or applicable sales tax. Quote valid for 30-days.
Matt Jentgen
502-664-6541
T8/T12 REPLACEMENTS
METAL HALIDE LEDREPLACEMENT
Lite Energy Solutions, Inc. PO Box 1330 Kannapolis, NC 28082 Office: (704) 932-0573 Fax: (704) 932-7830
APPENDIX D
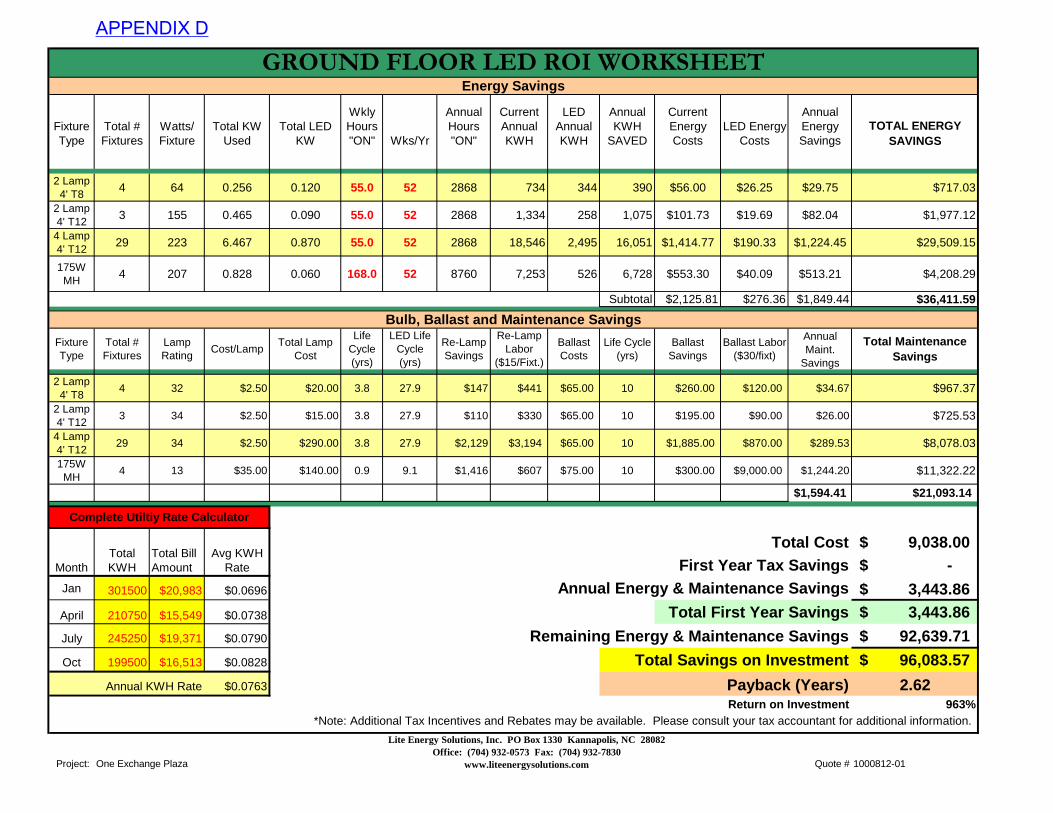
Fixture Type
Total # Fixtures
Watts/ Fixture
Total KW Used
Total LED KW
Wkly Hours "ON" Wks/Yr
Annual Hours "ON"
Current Annual KWH
LED Annual KWH
Annual KWH
SAVED
Current Energy Costs
LED Energy Costs
Annual Energy Savings
TOTAL ENERGY SAVINGS
2 Lamp 4' T8
4 64 0.256 0.120 55.0 52 2868 734 344 390 $56.00 $26.25 $29.75 $717.03
2 Lamp 4' T12
3 155 0.465 0.090 55.0 52 2868 1,334 258 1,075 $101.73 $19.69 $82.04 $1,977.12
4 Lamp 4' T12
29 223 6.467 0.870 55.0 52 2868 18,546 2,495 16,051 $1,414.77 $190.33 $1,224.45 $29,509.15
175W MH
4 207 0.828 0.060 168.0 52 8760 7,253 526 6,728 $553.30 $40.09 $513.21 $4,208.29
Subtotal $2,125.81 $276.36 $1,849.44 $36,411.59
Fixture Type
Total # Fixtures
Lamp Rating
Cost/LampTotal Lamp
Cost
Life Cycle (yrs)
LED Life Cycle (yrs)
Re-Lamp Savings
Re-Lamp Labor
($15/Fixt.)
Ballast Costs
Life Cycle (yrs)
Ballast Savings
Ballast Labor ($30/fixt)
Annual Maint.
Savings
Total Maintenance Savings
2 Lamp 4' T8
4 32 $2.50 $20.00 3.8 27.9 $147 $441 $65.00 10 $260.00 $120.00 $34.67 $967.37
2 Lamp 4' T12
3 34 $2.50 $15.00 3.8 27.9 $110 $330 $65.00 10 $195.00 $90.00 $26.00 $725.53
4 Lamp 4' T12
29 34 $2.50 $290.00 3.8 27.9 $2,129 $3,194 $65.00 10 $1,885.00 $870.00 $289.53 $8,078.03
175W MH
4 13 $35.00 $140.00 0.9 9.1 $1,416 $607 $75.00 10 $300.00 $9,000.00 $1,244.20 $11,322.22
$1,594.41 $21,093.14
Total Cost 9,038.00$ First Year Tax Savings -$
Jan 301500 $20,983 $0.0696 Annual Energy & Maintenance Savings 3,443.86$
April 210750 $15,549 $0.0738 Total First Year Savings 3,443.86$
July 245250 $19,371 $0.0790 Remaining Energy & Maintenance Savings 92,639.71$
Oct 199500 $16,513 $0.0828 Total Savings on Investment 96,083.57$
Annual KWH Rate $0.0763 Payback (Years) 2.62Return on Investment 963%
Project: Quote # 1000812-01
GROUND FLOOR LED ROI WORKSHEET
Bulb, Ballast and Maintenance Savings
Energy Savings
*Note: Additional Tax Incentives and Rebates may be available. Please consult your tax accountant for additional information.
Complete Utiltiy Rate Calculator
One Exchange Plaza
Total KWH
Total Bill AmountMonth
Avg KWH Rate
Lite Energy Solutions, Inc. PO Box 1330 Kannapolis, NC 28082Office: (704) 932-0573 Fax: (704) 932-7830
www.liteenergysolutions.com
APPENDIX D
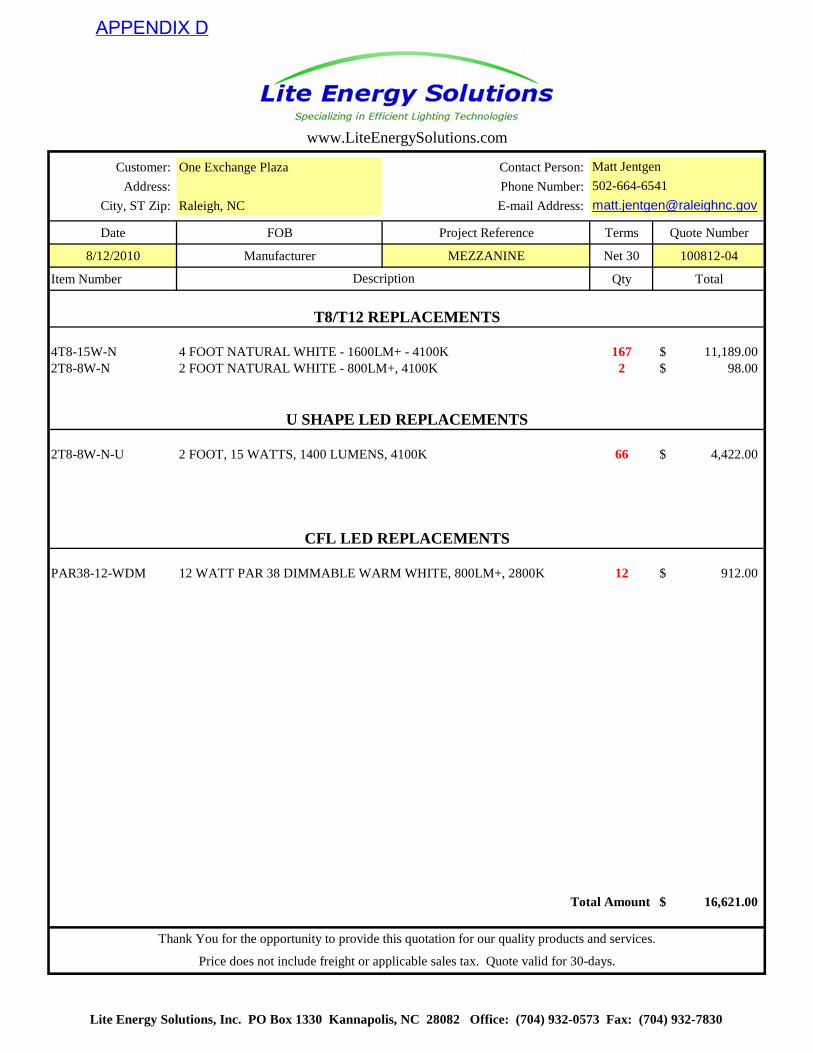
Customer: One Exchange Plaza Contact Person:
Address: Phone Number:
City, ST Zip: Raleigh, NC E-mail Address:
Date FOB Project Reference Terms Quote Number
8/12/2010 Manufacturer MEZZANINE Net 30 100812-04
Item Number Qty Total
4T8-15W-N 4 FOOT NATURAL WHITE - 1600LM+ - 4100K 167 11,189.00$ 2T8-8W-N 2 FOOT NATURAL WHITE - 800LM+, 4100K 2 98.00$
2T8-8W-N-U 2 FOOT, 15 WATTS, 1400 LUMENS, 4100K 66 4,422.00$
PAR38-12-WDM 12 WATT PAR 38 DIMMABLE WARM WHITE, 800LM+, 2800K 12 912.00$
Total Amount 16,621.00$
Price does not include freight or applicable sales tax. Quote valid for 30-days.
Matt Jentgen
502-664-6541
T8/T12 REPLACEMENTS
U SHAPE LED REPLACEMENTS
www.LiteEnergySolutions.com
Description
Thank You for the opportunity to provide this quotation for our quality products and services.
CFL LED REPLACEMENTS
Lite Energy Solutions, Inc. PO Box 1330 Kannapolis, NC 28082 Office: (704) 932-0573 Fax: (704) 932-7830
APPENDIX D
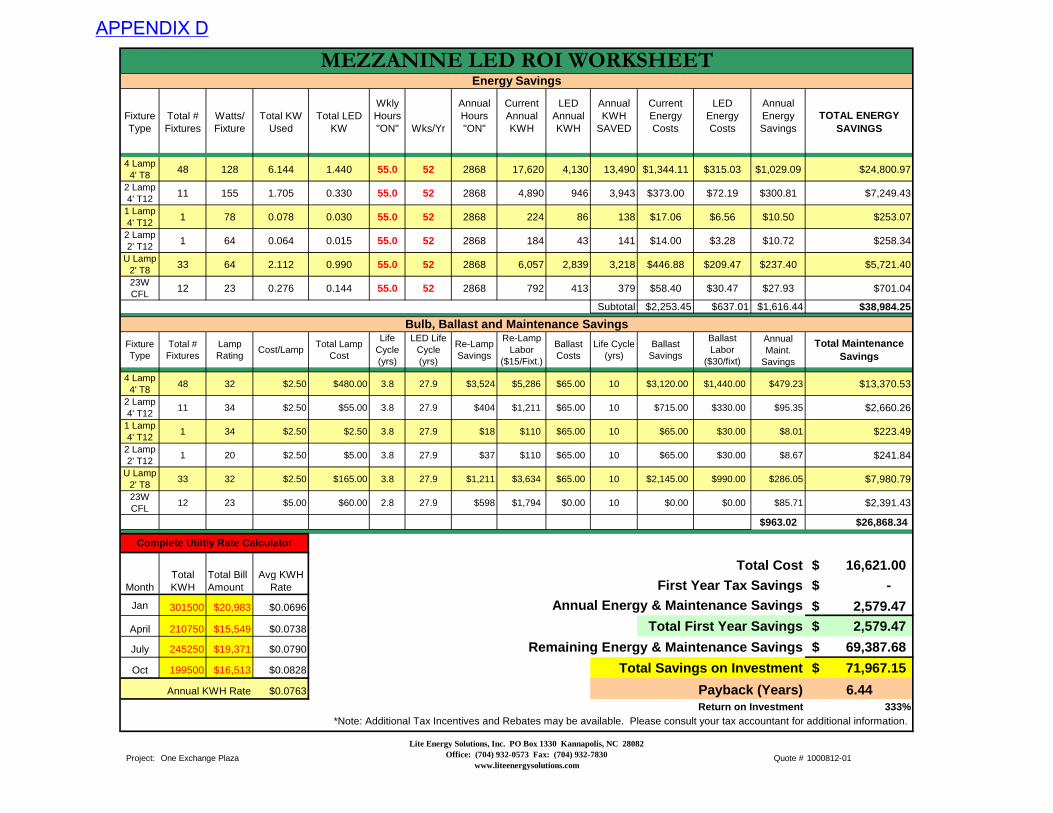
Fixture Type
Total # Fixtures
Watts/ Fixture
Total KW Used
Total LED KW
Wkly Hours "ON" Wks/Yr
Annual Hours "ON"
Current Annual KWH
LED Annual KWH
Annual KWH
SAVED
Current Energy Costs
LED Energy Costs
Annual Energy Savings
TOTAL ENERGY SAVINGS
4 Lamp 4' T8 48 128 6.144 1.440 55.0 52 2868 17,620 4,130 13,490 $1,344.11 $315.03 $1,029.09 $24,800.97
2 Lamp 4' T12 11 155 1.705 0.330 55.0 52 2868 4,890 946 3,943 $373.00 $72.19 $300.81 $7,249.43
1 Lamp 4' T12 1 78 0.078 0.030 55.0 52 2868 224 86 138 $17.06 $6.56 $10.50 $253.07
2 Lamp 2' T12 1 64 0.064 0.015 55.0 52 2868 184 43 141 $14.00 $3.28 $10.72 $258.34
U Lamp 2' T8 33 64 2.112 0.990 55.0 52 2868 6,057 2,839 3,218 $446.88 $209.47 $237.40 $5,721.40
23W CFL 12 23 0.276 0.144 55.0 52 2868 792 413 379 $58.40 $30.47 $27.93 $701.04
Subtotal $2,253.45 $637.01 $1,616.44 $38,984.25
Fixture Type
Total # Fixtures
Lamp Rating
Cost/LampTotal Lamp
Cost
Life Cycle (yrs)
LED Life Cycle (yrs)
Re-Lamp Savings
Re-Lamp Labor
($15/Fixt.)
Ballast Costs
Life Cycle (yrs)
Ballast Savings
Ballast Labor
($30/fixt)
Annual Maint.
Savings
Total Maintenance Savings
4 Lamp 4' T8
48 32 $2.50 $480.00 3.8 27.9 $3,524 $5,286 $65.00 10 $3,120.00 $1,440.00 $479.23 $13,370.53
2 Lamp 4' T12
11 34 $2.50 $55.00 3.8 27.9 $404 $1,211 $65.00 10 $715.00 $330.00 $95.35 $2,660.26
1 Lamp 4' T12
1 34 $2.50 $2.50 3.8 27.9 $18 $110 $65.00 10 $65.00 $30.00 $8.01 $223.49
2 Lamp 2' T12
1 20 $2.50 $5.00 3.8 27.9 $37 $110 $65.00 10 $65.00 $30.00 $8.67 $241.84
U Lamp 2' T8
33 32 $2.50 $165.00 3.8 27.9 $1,211 $3,634 $65.00 10 $2,145.00 $990.00 $286.05 $7,980.79
23W CFL
12 23 $5.00 $60.00 2.8 27.9 $598 $1,794 $0.00 10 $0.00 $0.00 $85.71 $2,391.43
$963.02 $26,868.34
Total Cost 16,621.00$ First Year Tax Savings -$
Jan 301500 $20,983 $0.0696 Annual Energy & Maintenance Savings 2,579.47$
April 210750 $15,549 $0.0738 Total First Year Savings 2,579.47$
July 245250 $19,371 $0.0790 Remaining Energy & Maintenance Savings 69,387.68$
Oct 199500 $16,513 $0.0828 Total Savings on Investment 71,967.15$
Annual KWH Rate $0.0763 Payback (Years) 6.44Return on Investment 333%
Project: Quote # 1000812-01One Exchange Plaza
Total KWH
Total Bill AmountMonth
Avg KWH Rate
MEZZANINE LED ROI WORKSHEET
Bulb, Ballast and Maintenance Savings
Energy Savings
*Note: Additional Tax Incentives and Rebates may be available. Please consult your tax accountant for additional information.
Complete Utiltiy Rate Calculator
Lite Energy Solutions, Inc. PO Box 1330 Kannapolis, NC 28082Office: (704) 932-0573 Fax: (704) 932-7830
www.liteenergysolutions.com
APPENDIX D
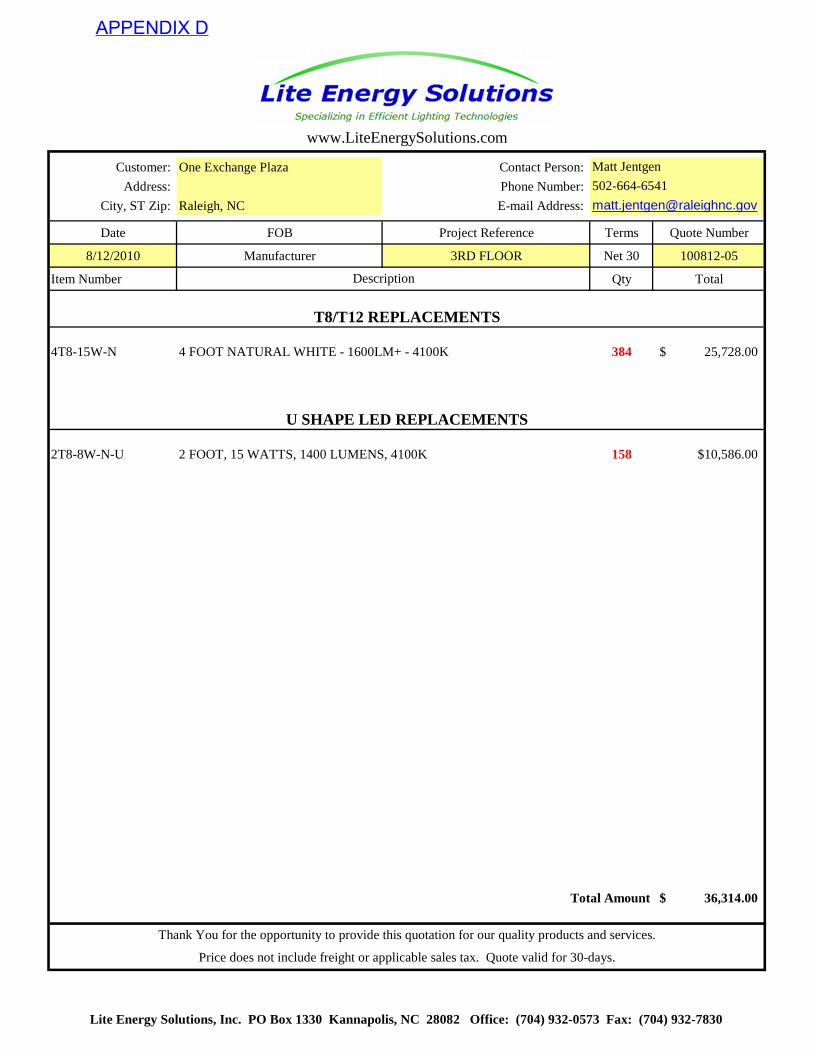
Customer: One Exchange Plaza Contact Person:
Address: Phone Number:
City, ST Zip: Raleigh, NC E-mail Address:
Date FOB Project Reference Terms Quote Number
8/12/2010 Manufacturer 3RD FLOOR Net 30 100812-05
Item Number Qty Total
4T8-15W-N 4 FOOT NATURAL WHITE - 1600LM+ - 4100K 384 25,728.00$
2T8-8W-N-U 2 FOOT, 15 WATTS, 1400 LUMENS, 4100K 158 $10,586.00
Total Amount 36,314.00$
www.LiteEnergySolutions.com
Description
Thank You for the opportunity to provide this quotation for our quality products and services.
Price does not include freight or applicable sales tax. Quote valid for 30-days.
Matt Jentgen
502-664-6541
T8/T12 REPLACEMENTS
U SHAPE LED REPLACEMENTS
Lite Energy Solutions, Inc. PO Box 1330 Kannapolis, NC 28082 Office: (704) 932-0573 Fax: (704) 932-7830
APPENDIX D
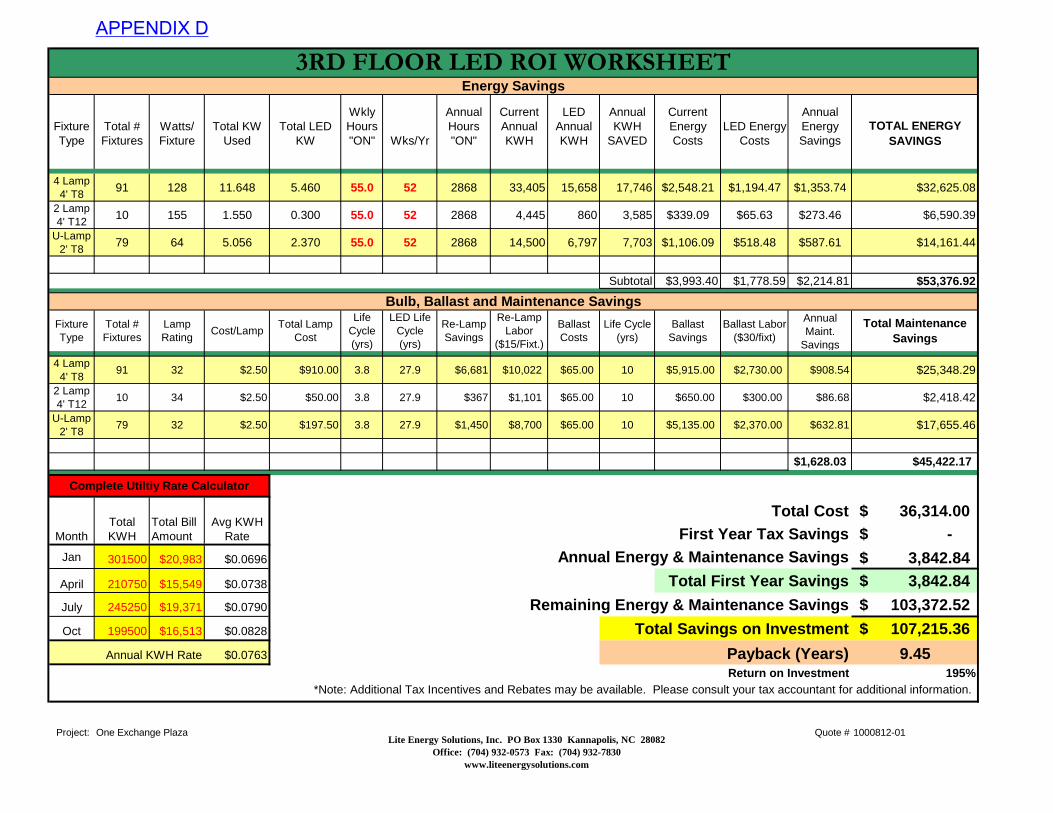
Fixture Type
Total # Fixtures
Watts/ Fixture
Total KW Used
Total LED KW
Wkly Hours "ON" Wks/Yr
Annual Hours "ON"
Current Annual KWH
LED Annual KWH
Annual KWH
SAVED
Current Energy Costs
LED Energy Costs
Annual Energy Savings
TOTAL ENERGY SAVINGS
4 Lamp 4' T8
91 128 11.648 5.460 55.0 52 2868 33,405 15,658 17,746 $2,548.21 $1,194.47 $1,353.74 $32,625.08
2 Lamp 4' T12
10 155 1.550 0.300 55.0 52 2868 4,445 860 3,585 $339.09 $65.63 $273.46 $6,590.39
U-Lamp 2' T8
79 64 5.056 2.370 55.0 52 2868 14,500 6,797 7,703 $1,106.09 $518.48 $587.61 $14,161.44
Subtotal $3,993.40 $1,778.59 $2,214.81 $53,376.92
Fixture Type
Total # Fixtures
Lamp Rating
Cost/LampTotal Lamp
Cost
Life Cycle (yrs)
LED Life Cycle (yrs)
Re-Lamp Savings
Re-Lamp Labor
($15/Fixt.)
Ballast Costs
Life Cycle (yrs)
Ballast Savings
Ballast Labor ($30/fixt)
Annual Maint.
Savings
Total Maintenance Savings
4 Lamp 4' T8
91 32 $2.50 $910.00 3.8 27.9 $6,681 $10,022 $65.00 10 $5,915.00 $2,730.00 $908.54 $25,348.29
2 Lamp 4' T12
10 34 $2.50 $50.00 3.8 27.9 $367 $1,101 $65.00 10 $650.00 $300.00 $86.68 $2,418.42
U-Lamp 2' T8
79 32 $2.50 $197.50 3.8 27.9 $1,450 $8,700 $65.00 10 $5,135.00 $2,370.00 $632.81 $17,655.46
$1,628.03 $45,422.17
Total Cost 36,314.00$ First Year Tax Savings -$
Jan 301500 $20,983 $0.0696 Annual Energy & Maintenance Savings 3,842.84$
April 210750 $15,549 $0.0738 Total First Year Savings 3,842.84$
July 245250 $19,371 $0.0790 Remaining Energy & Maintenance Savings 103,372.52$
Oct 199500 $16,513 $0.0828 Total Savings on Investment 107,215.36$
Annual KWH Rate $0.0763 Payback (Years) 9.45Return on Investment 195%
Project: Quote # 1000812-01
3RD FLOOR LED ROI WORKSHEET
Bulb, Ballast and Maintenance Savings
Energy Savings
*Note: Additional Tax Incentives and Rebates may be available. Please consult your tax accountant for additional information.
Complete Utiltiy Rate Calculator
One Exchange Plaza
Total KWH
Total Bill AmountMonth
Avg KWH Rate
Lite Energy Solutions, Inc. PO Box 1330 Kannapolis, NC 28082Office: (704) 932-0573 Fax: (704) 932-7830
www.liteenergysolutions.com
APPENDIX D

Customer: One Exchange Plaza Contact Person:
Address: Phone Number:
City, ST Zip: Raleigh, NC E-mail Address:
Date FOB Project Reference Terms Quote Number
8/12/2010 Manufacturer 4TH FLOOR Net 30 100812-06
Item Number Qty Total
4T8-15W-N 4 FOOT NATURAL WHITE - 1600LM+ - 4100K 315 21,105.00$
2T8-8W-N-U 2 FOOT, 15 WATTS, 1400 LUMENS, 4100K 154 $10,318.00
Total Amount 31,423.00$
www.LiteEnergySolutions.com
Description
Thank You for the opportunity to provide this quotation for our quality products and services.
Price does not include freight or applicable sales tax. Quote valid for 30-days.
Matt Jentgen
502-664-6541
T8/T12 REPLACEMENTS
U SHAPE LED REPLACEMENTS
Lite Energy Solutions, Inc. PO Box 1330 Kannapolis, NC 28082 Office: (704) 932-0573 Fax: (704) 932-7830
APPENDIX D

Fixture Type
Total # Fixtures
Watts/ Fixture
Total KW Used
Total LED KW
Wkly Hours "ON" Wks/Yr
Annual Hours "ON"
Current Annual KWH
LED Annual KWH
Annual KWH
SAVED
Current Energy Costs
LED Energy Costs
Annual Energy Savings
TOTAL ENERGY SAVINGS
4 Lamp 4' T8
71 128 9.088 4.260 55.0 52 2868 26,063 12,217 13,846 $1,988.17 $931.95 $1,056.21 $25,454.74
2 Lamp 4' T12
15 155 2.325 0.450 55.0 52 2868 6,668 1,291 5,377 $508.64 $98.45 $410.19 $9,885.59
U-Lamp 2' T8
77 64 4.928 2.310 55.0 52 2868 14,133 6,625 7,508 $1,078.09 $505.35 $572.74 $13,802.92
Subtotal $3,574.89 $1,535.75 $2,039.14 $49,143.25
Fixture Type
Total # Fixtures
Lamp Rating
Cost/LampTotal Lamp
Cost
Life Cycle (yrs)
LED Life Cycle (yrs)
Re-Lamp Savings
Re-Lamp Labor
($15/Fixt.)
Ballast Costs
Life Cycle (yrs)
Ballast Savings
Ballast Labor ($30/fixt)
Annual Maint.
Savings
Total Maintenance Savings
4 Lamp 4' T8
71 32 $2.50 $710.00 3.8 27.9 $5,213 $7,819 $65.00 10 $4,615.00 $2,130.00 $708.86 $19,777.24
2 Lamp 4' T12
15 34 $2.50 $75.00 3.8 27.9 $551 $1,652 $65.00 10 $975.00 $450.00 $130.02 $3,627.63
U-Lamp 2' T8
77 20 $2.50 $192.50 3.8 27.9 $1,413 $8,480 $65.00 10 $5,005.00 $2,310.00 $616.79 $17,208.49
$1,455.68 $40,613.36
Total Cost 31,423.00$ First Year Tax Savings -$
Jan 301500 $20,983 $0.0696 Annual Energy & Maintenance Savings 3,494.81$
April 210750 $15,549 $0.0738 Total First Year Savings 3,494.81$
July 245250 $19,371 $0.0790 Remaining Energy & Maintenance Savings 94,010.52$
Oct 199500 $16,513 $0.0828 Total Savings on Investment 97,505.33$
Annual KWH Rate $0.0763 Payback (Years) 8.99Return on Investment 210%
Project: Quote # 1000812-01One Exchange Plaza
Total KWH
Total Bill AmountMonth
Avg KWH Rate
4TH FLOOR LED ROI WORKSHEET
Bulb, Ballast and Maintenance Savings
Energy Savings
*Note: Additional Tax Incentives and Rebates may be available. Please consult your tax accountant for additional information.
Complete Utiltiy Rate Calculator
Lite Energy Solutions, Inc. PO Box 1330 Kannapolis, NC 28082Office: (704) 932-0573 Fax: (704) 932-7830
www.liteenergysolutions.com
APPENDIX D
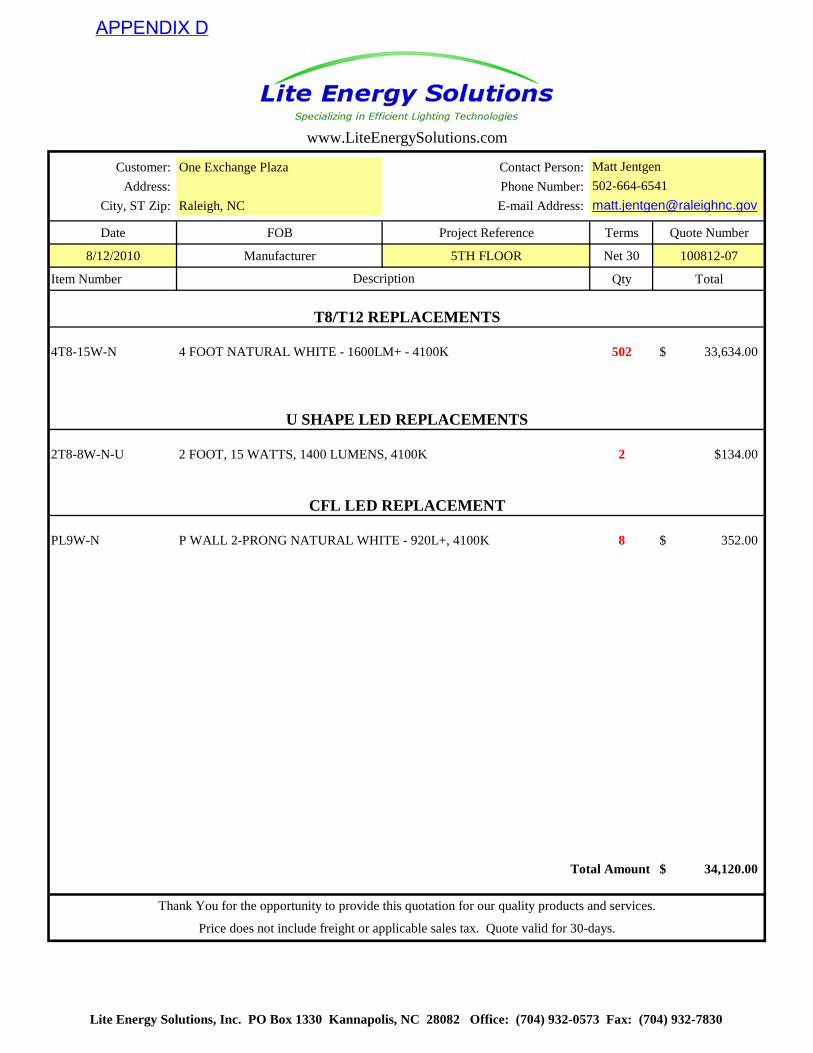
Customer: One Exchange Plaza Contact Person:
Address: Phone Number:
City, ST Zip: Raleigh, NC E-mail Address:
Date FOB Project Reference Terms Quote Number
8/12/2010 Manufacturer 5TH FLOOR Net 30 100812-07
Item Number Qty Total
4T8-15W-N 4 FOOT NATURAL WHITE - 1600LM+ - 4100K 502 33,634.00$
2T8-8W-N-U 2 FOOT, 15 WATTS, 1400 LUMENS, 4100K 2 $134.00
PL9W-N P WALL 2-PRONG NATURAL WHITE - 920L+, 4100K 8 352.00$
Total Amount 34,120.00$
CFL LED REPLACEMENT
www.LiteEnergySolutions.com
Description
Thank You for the opportunity to provide this quotation for our quality products and services.
Price does not include freight or applicable sales tax. Quote valid for 30-days.
Matt Jentgen
502-664-6541
T8/T12 REPLACEMENTS
U SHAPE LED REPLACEMENTS
Lite Energy Solutions, Inc. PO Box 1330 Kannapolis, NC 28082 Office: (704) 932-0573 Fax: (704) 932-7830
APPENDIX D
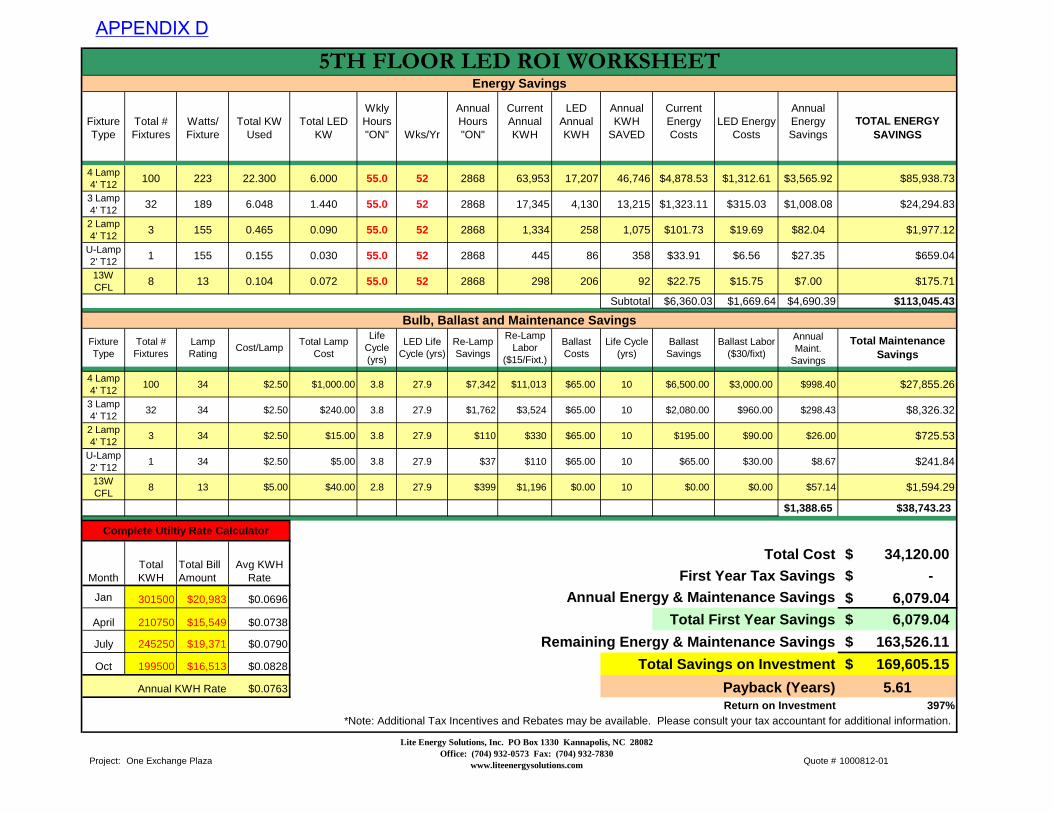
Fixture Type
Total # Fixtures
Watts/ Fixture
Total KW Used
Total LED KW
Wkly Hours "ON" Wks/Yr
Annual Hours "ON"
Current Annual KWH
LED Annual KWH
Annual KWH
SAVED
Current Energy Costs
LED Energy Costs
Annual Energy Savings
TOTAL ENERGY SAVINGS
4 Lamp 4' T12
100 223 22.300 6.000 55.0 52 2868 63,953 17,207 46,746 $4,878.53 $1,312.61 $3,565.92 $85,938.73
3 Lamp 4' T12
32 189 6.048 1.440 55.0 52 2868 17,345 4,130 13,215 $1,323.11 $315.03 $1,008.08 $24,294.83
2 Lamp 4' T12
3 155 0.465 0.090 55.0 52 2868 1,334 258 1,075 $101.73 $19.69 $82.04 $1,977.12
U-Lamp 2' T12
1 155 0.155 0.030 55.0 52 2868 445 86 358 $33.91 $6.56 $27.35 $659.04
13W CFL
8 13 0.104 0.072 55.0 52 2868 298 206 92 $22.75 $15.75 $7.00 $175.71
Subtotal $6,360.03 $1,669.64 $4,690.39 $113,045.43
Fixture Type
Total # Fixtures
Lamp Rating
Cost/LampTotal Lamp
Cost
Life Cycle (yrs)
LED Life Cycle (yrs)
Re-Lamp Savings
Re-Lamp Labor
($15/Fixt.)
Ballast Costs
Life Cycle (yrs)
Ballast Savings
Ballast Labor ($30/fixt)
Annual Maint.
Savings
Total Maintenance Savings
4 Lamp 4' T12
100 34 $2.50 $1,000.00 3.8 27.9 $7,342 $11,013 $65.00 10 $6,500.00 $3,000.00 $998.40 $27,855.26
3 Lamp 4' T12
32 34 $2.50 $240.00 3.8 27.9 $1,762 $3,524 $65.00 10 $2,080.00 $960.00 $298.43 $8,326.32
2 Lamp 4' T12
3 34 $2.50 $15.00 3.8 27.9 $110 $330 $65.00 10 $195.00 $90.00 $26.00 $725.53
U-Lamp 2' T12
1 34 $2.50 $5.00 3.8 27.9 $37 $110 $65.00 10 $65.00 $30.00 $8.67 $241.84
13W CFL
8 13 $5.00 $40.00 2.8 27.9 $399 $1,196 $0.00 10 $0.00 $0.00 $57.14 $1,594.29
$1,388.65 $38,743.23
Total Cost 34,120.00$ First Year Tax Savings -$
Jan 301500 $20,983 $0.0696 Annual Energy & Maintenance Savings 6,079.04$
April 210750 $15,549 $0.0738 Total First Year Savings 6,079.04$
July 245250 $19,371 $0.0790 Remaining Energy & Maintenance Savings 163,526.11$
Oct 199500 $16,513 $0.0828 Total Savings on Investment 169,605.15$
Annual KWH Rate $0.0763 Payback (Years) 5.61Return on Investment 397%
Project: Quote # 1000812-01
5TH FLOOR LED ROI WORKSHEET
Bulb, Ballast and Maintenance Savings
Energy Savings
*Note: Additional Tax Incentives and Rebates may be available. Please consult your tax accountant for additional information.
Complete Utiltiy Rate Calculator
One Exchange Plaza
Total KWH
Total Bill AmountMonth
Avg KWH Rate
Lite Energy Solutions, Inc. PO Box 1330 Kannapolis, NC 28082Office: (704) 932-0573 Fax: (704) 932-7830
www.liteenergysolutions.com
APPENDIX D

Customer: One Exchange Plaza Contact Person:
Address: Phone Number:
City, ST Zip: Raleigh, NC E-mail Address:
Date FOB Project Reference Terms Quote Number
8/12/2010 Manufacturer 6TH FLOOR Net 30 100812-08
Item Number Qty Total
4T8-15W-N 4 FOOT NATURAL WHITE - 1600LM+ - 4100K 516 34,572.00$
Total Amount 34,572.00$
www.LiteEnergySolutions.com
Description
Thank You for the opportunity to provide this quotation for our quality products and services.
Price does not include freight or applicable sales tax. Quote valid for 30-days.
Matt Jentgen
502-664-6541
T8/T12 REPLACEMENTS
Lite Energy Solutions, Inc. PO Box 1330 Kannapolis, NC 28082 Office: (704) 932-0573 Fax: (704) 932-7830
APPENDIX D

Fixture Type
Total # Fixtures
Watts/ Fixture
Total KW Used
Total LED KW
Wkly Hours "ON" Wks/Yr
Annual Hours "ON"
Current Annual KWH
LED Annual KWH
Annual KWH
SAVED
Current Energy Costs
LED Energy Costs
Annual Energy Savings
TOTAL ENERGY SAVINGS
4 Lamp 4' T12
125 223 27.875 7.500 55.0 52 2868 79,942 21,509 58,433 $6,098.17 $1,640.76 $4,457.40 $107,423.42
3 Lamp 4' T12
0 189 0.000 0.000 55.0 52 2868 0 0 0 $0.00 $0.00 $0.00 $0.00
2 Lamp 4' T12
8 155 1.240 0.240 55.0 52 2868 3,556 688 2,868 $271.27 $52.50 $218.77 $5,272.31
Subtotal $6,369.44 $1,693.27 $4,676.17 $112,695.73
Fixture Type
Total # Fixtures
Lamp Rating
Cost/LampTotal Lamp
Cost
Life Cycle (yrs)
LED Life Cycle (yrs)
Re-Lamp Savings
Re-Lamp Labor
($15/Fixt.)
Ballast Costs
Life Cycle (yrs)
Ballast Savings
Ballast Labor ($30/fixt)
Annual Maint.
Savings
Total Maintenance Savings
4 Lamp 4' T12
125 34 $2.50 $1,250.00 3.8 27.9 $9,178 $13,766 $65.00 10 $8,125.00 $3,750.00 $1,248.00 $34,819.08
3 Lamp 4' T12
0 34 $2.50 $0.00 3.8 27.9 $0 $0 $65.00 10 $0.00 $0.00 $0.00 $0.00
2 Lamp 4' T12
8 34 $2.50 $40.00 3.8 27.9 $294 $881 $65.00 10 $520.00 $240.00 $69.35 $1,934.74
$1,317.34 $36,753.82
Total Cost 34,572.00$ First Year Tax Savings -$
Jan 301500 $20,983 $0.0696 Annual Energy & Maintenance Savings 5,993.51$
April 210750 $15,549 $0.0738 Total First Year Savings 5,993.51$
July 245250 $19,371 $0.0790 Remaining Energy & Maintenance Savings 161,225.49$
Oct 199500 $16,513 $0.0828 Total Savings on Investment 167,219.00$
Annual KWH Rate $0.0763 Payback (Years) 5.77Return on Investment 384%
Project: Quote # 1000812-01One Exchange Plaza
Total KWH
Total Bill AmountMonth
Avg KWH Rate
6TH FLOOR LED ROI WORKSHEET
Bulb, Ballast and Maintenance Savings
Energy Savings
*Note: Additional Tax Incentives and Rebates may be available. Please consult your tax accountant for additional information.
Complete Utiltiy Rate Calculator
Lite Energy Solutions, Inc. PO Box 1330 Kannapolis, NC 28082Office: (704) 932-0573 Fax: (704) 932-7830
www.liteenergysolutions.com
APPENDIX D
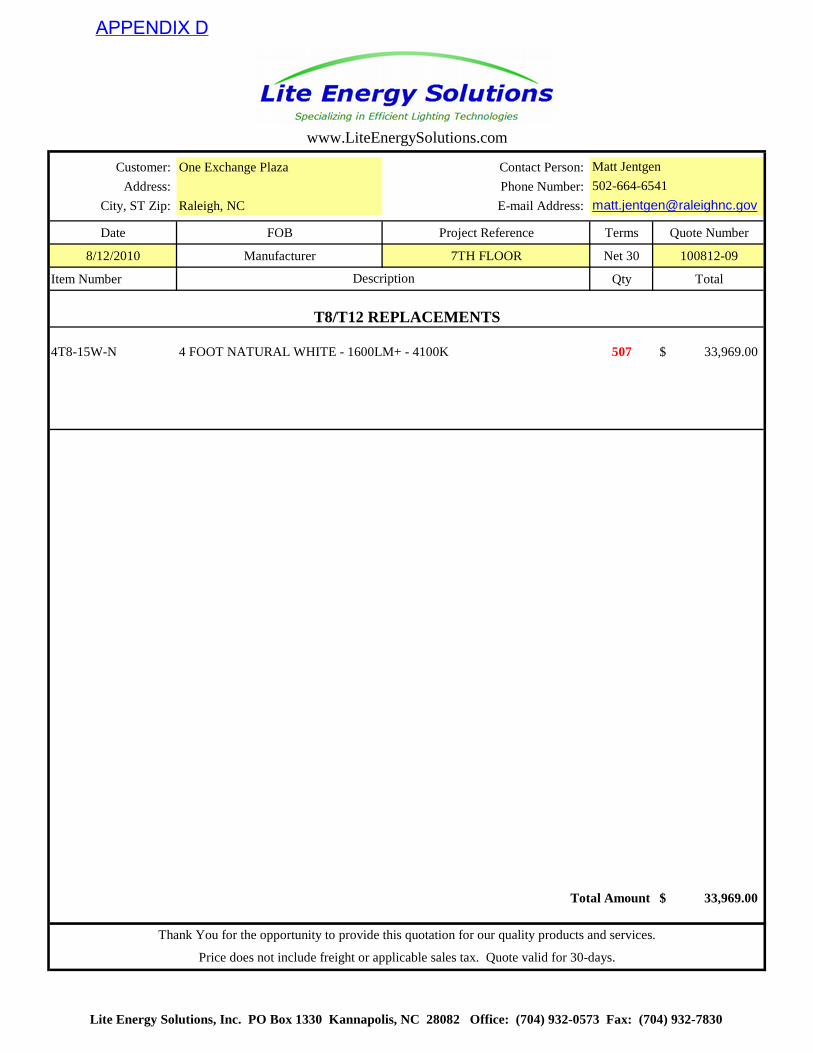
Customer: One Exchange Plaza Contact Person:
Address: Phone Number:
City, ST Zip: Raleigh, NC E-mail Address:
Date FOB Project Reference Terms Quote Number
8/12/2010 Manufacturer 7TH FLOOR Net 30 100812-09
Item Number Qty Total
4T8-15W-N 4 FOOT NATURAL WHITE - 1600LM+ - 4100K 507 33,969.00$
Total Amount 33,969.00$
www.LiteEnergySolutions.com
Description
Thank You for the opportunity to provide this quotation for our quality products and services.
Price does not include freight or applicable sales tax. Quote valid for 30-days.
Matt Jentgen
502-664-6541
T8/T12 REPLACEMENTS
Lite Energy Solutions, Inc. PO Box 1330 Kannapolis, NC 28082 Office: (704) 932-0573 Fax: (704) 932-7830
APPENDIX D
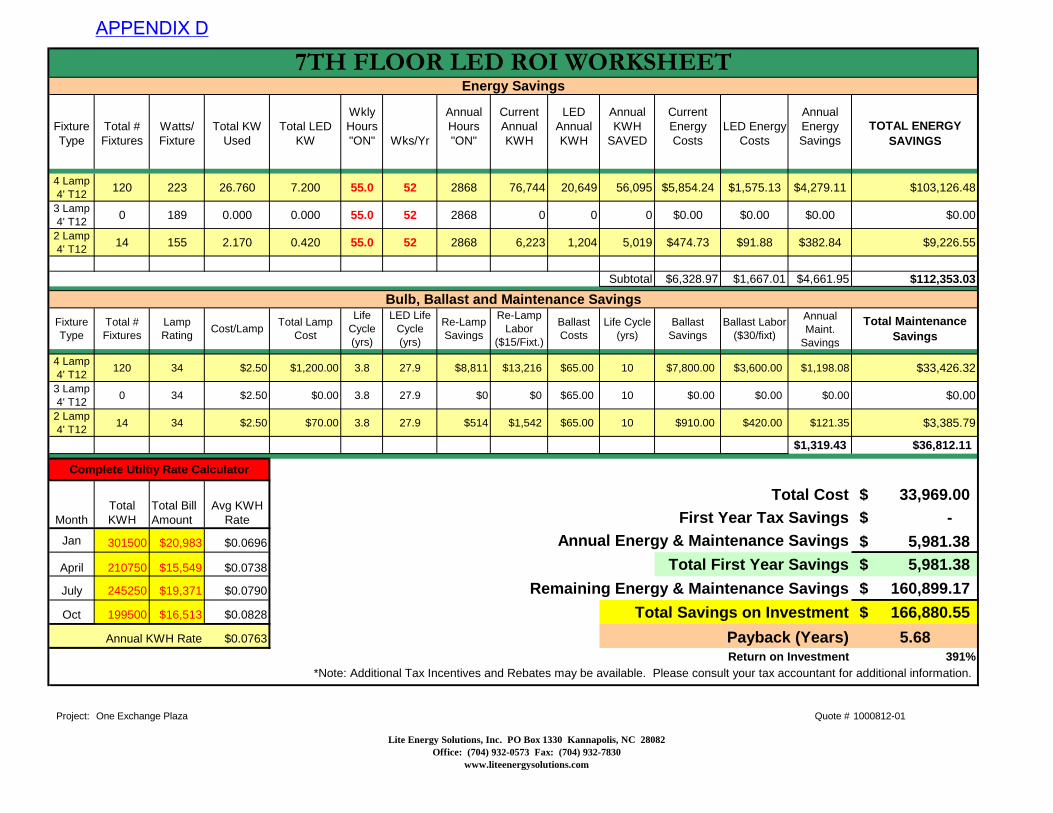
Fixture Type
Total # Fixtures
Watts/ Fixture
Total KW Used
Total LED KW
Wkly Hours "ON" Wks/Yr
Annual Hours "ON"
Current Annual KWH
LED Annual KWH
Annual KWH
SAVED
Current Energy Costs
LED Energy Costs
Annual Energy Savings
TOTAL ENERGY SAVINGS
4 Lamp 4' T12
120 223 26.760 7.200 55.0 52 2868 76,744 20,649 56,095 $5,854.24 $1,575.13 $4,279.11 $103,126.48
3 Lamp 4' T12
0 189 0.000 0.000 55.0 52 2868 0 0 0 $0.00 $0.00 $0.00 $0.00
2 Lamp 4' T12
14 155 2.170 0.420 55.0 52 2868 6,223 1,204 5,019 $474.73 $91.88 $382.84 $9,226.55
Subtotal $6,328.97 $1,667.01 $4,661.95 $112,353.03
Fixture Type
Total # Fixtures
Lamp Rating
Cost/LampTotal Lamp
Cost
Life Cycle (yrs)
LED Life Cycle (yrs)
Re-Lamp Savings
Re-Lamp Labor
($15/Fixt.)
Ballast Costs
Life Cycle (yrs)
Ballast Savings
Ballast Labor ($30/fixt)
Annual Maint.
Savings
Total Maintenance Savings
4 Lamp 4' T12
120 34 $2.50 $1,200.00 3.8 27.9 $8,811 $13,216 $65.00 10 $7,800.00 $3,600.00 $1,198.08 $33,426.32
3 Lamp 4' T12
0 34 $2.50 $0.00 3.8 27.9 $0 $0 $65.00 10 $0.00 $0.00 $0.00 $0.00
2 Lamp 4' T12
14 34 $2.50 $70.00 3.8 27.9 $514 $1,542 $65.00 10 $910.00 $420.00 $121.35 $3,385.79
$1,319.43 $36,812.11
Total Cost 33,969.00$ First Year Tax Savings -$
Jan 301500 $20,983 $0.0696 Annual Energy & Maintenance Savings 5,981.38$
April 210750 $15,549 $0.0738 Total First Year Savings 5,981.38$
July 245250 $19,371 $0.0790 Remaining Energy & Maintenance Savings 160,899.17$
Oct 199500 $16,513 $0.0828 Total Savings on Investment 166,880.55$
Annual KWH Rate $0.0763 Payback (Years) 5.68Return on Investment 391%
Project: Quote # 1000812-01
7TH FLOOR LED ROI WORKSHEET
Bulb, Ballast and Maintenance Savings
Energy Savings
*Note: Additional Tax Incentives and Rebates may be available. Please consult your tax accountant for additional information.
Complete Utiltiy Rate Calculator
One Exchange Plaza
Total KWH
Total Bill AmountMonth
Avg KWH Rate
Lite Energy Solutions, Inc. PO Box 1330 Kannapolis, NC 28082Office: (704) 932-0573 Fax: (704) 932-7830
www.liteenergysolutions.com
APPENDIX D
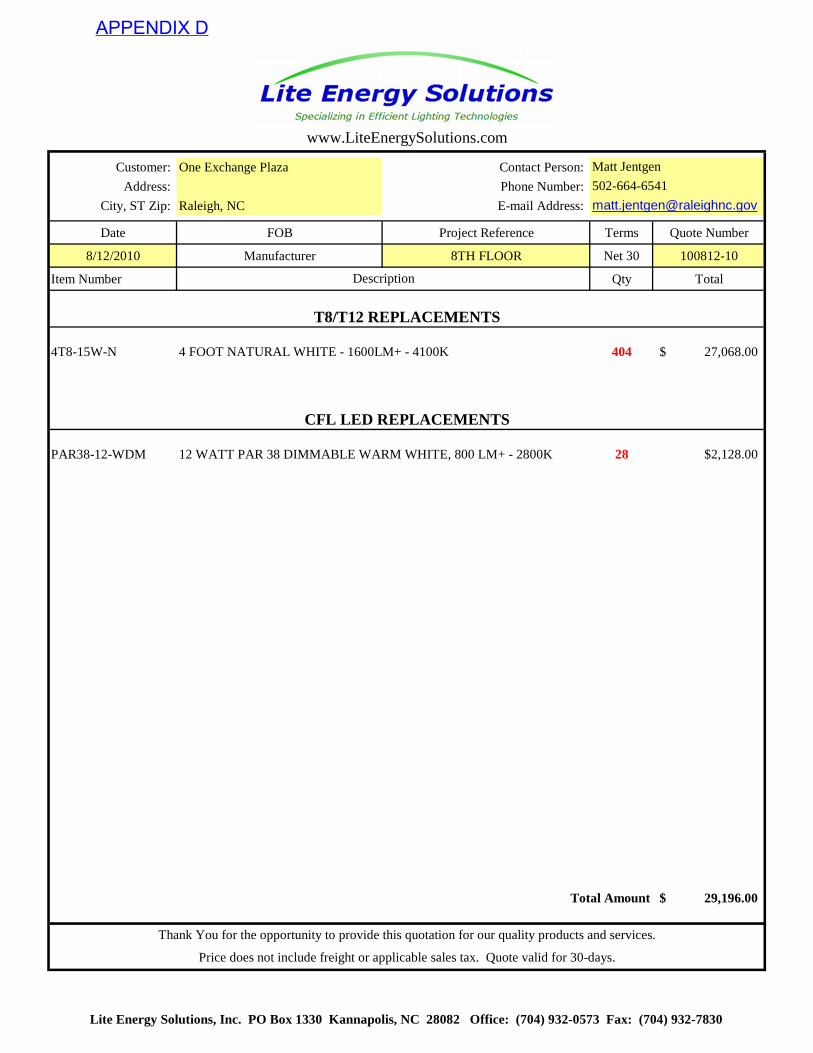
Customer: One Exchange Plaza Contact Person:
Address: Phone Number:
City, ST Zip: Raleigh, NC E-mail Address:
Date FOB Project Reference Terms Quote Number
8/12/2010 Manufacturer 8TH FLOOR Net 30 100812-10
Item Number Qty Total
4T8-15W-N 4 FOOT NATURAL WHITE - 1600LM+ - 4100K 404 27,068.00$
PAR38-12-WDM 12 WATT PAR 38 DIMMABLE WARM WHITE, 800 LM+ - 2800K 28 $2,128.00
Total Amount 29,196.00$
www.LiteEnergySolutions.com
Description
Thank You for the opportunity to provide this quotation for our quality products and services.
Price does not include freight or applicable sales tax. Quote valid for 30-days.
Matt Jentgen
502-664-6541
T8/T12 REPLACEMENTS
CFL LED REPLACEMENTS
Lite Energy Solutions, Inc. PO Box 1330 Kannapolis, NC 28082 Office: (704) 932-0573 Fax: (704) 932-7830
APPENDIX D

Fixture Type
Total # Fixtures
Watts/ Fixture
Total KW Used
Total LED KW
Wkly Hours "ON" Wks/Yr
Annual Hours "ON"
Current Annual KWH
LED Annual KWH
Annual KWH
SAVED
Current Energy Costs
LED Energy Costs
Annual Energy Savings
TOTAL ENERGY SAVINGS
4 Lamp 4' T8
15 128 1.920 0.900 55.0 52 2868 5,506 2,581 2,925 $420.04 $196.89 $223.14 $0.00
4 Lamp 4' T12
82 223 18.286 4.920 55.0 52 2868 52,442 14,110 38,332 $4,000.40 $1,076.34 $2,924.06 $70,469.76
2 Lamp 4' T12
8 155 1.240 0.240 55.0 52 2868 3,556 688 2,868 $294.35 $56.97 $237.38 $5,720.81
23W CFL
28 23 0.644 0.336 55.0 52 2868 1,847 964 883 $145.88 $76.11 $69.77 $0.00
Subtotal $4,440.62 $1,209.42 $3,231.20 $76,190.57
Fixture Type
Total # Fixtures
Lamp Rating
Cost/LampTotal Lamp
Cost
Life Cycle (yrs)
LED Life Cycle (yrs)
Re-Lamp Savings
Re-Lamp Labor
($15/Fixt.)
Ballast Costs
Life Cycle (yrs)
Ballast Savings
Ballast Labor ($30/fixt)
Annual Maint.
Savings
Total Maintenance Savings
4 Lamp 4' T8
15 32 $2.50 $150.00 3.8 27.9 $1,101 $1,652 $65.00 10 $975.00 $450.00 $149.76 $4,178.29
4 Lamp 4' T12
82 34 $2.50 $820.00 3.8 27.9 $6,021 $9,031 $65.00 10 $5,330.00 $2,460.00 $818.69 $22,841.32
2 Lamp 4' T12
8 34 $2.50 $60.00 3.8 27.9 $441 $881 $65.00 10 $520.00 $240.00 $74.61 $2,081.58
23W CFL
28 23 $5.00 $140.00 2.8 27.9 $1,395 $4,185 $0.00 10 $0.00 $0.00 $200.00 $5,580.00
$1,093.29 $30,502.89
Total Cost 29,196.00$ First Year Tax Savings -$
Jan 301500 $20,983 $0.0696 Annual Energy & Maintenance Savings 4,324.50$
April 210750 $15,549 $0.0738 Total First Year Savings 4,324.50$
July 245250 $19,371 $0.0790 Remaining Energy & Maintenance Savings 116,328.93$
Oct 199500 $16,513 $0.0828 Total Savings on Investment 120,653.42$
Annual KWH Rate $0.0763 Payback (Years) 6.75Return on Investment 313%
Project: Quote # 1000812-01One Exchange Plaza
Total KWH
Total Bill AmountMonth
Avg KWH Rate
8TH FLOOR LED ROI WORKSHEET
Bulb, Ballast and Maintenance Savings
Energy Savings
*Note: Additional Tax Incentives and Rebates may be available. Please consult your tax accountant for additional information.
Complete Utiltiy Rate Calculator
Lite Energy Solutions, Inc. PO Box 1330 Kannapolis, NC 28082Office: (704) 932-0573 Fax: (704) 932-7830
www.liteenergysolutions.com
APPENDIX D

Customer: One Exchange Plaza Contact Person:
Address: Phone Number:
City, ST Zip: Raleigh, NC E-mail Address:
Date FOB Project Reference Terms Quote Number
8/12/2010 Manufacturer 9TH FLOOR Net 30 100812-11
Item Number Qty Total
4T8-15W-N 4 FOOT NATURAL WHITE - 1600LM+ - 4100K 410 24,470.00$
Total Amount 24,470.00$
www.LiteEnergySolutions.com
Description
Thank You for the opportunity to provide this quotation for our quality products and services.
Price does not include freight or applicable sales tax. Quote valid for 30-days.
Matt Jentgen
502-664-6541
T8/T12 REPLACEMENTS
Lite Energy Solutions, Inc. PO Box 1330 Kannapolis, NC 28082 Office: (704) 932-0573 Fax: (704) 932-7830
APPENDIX D
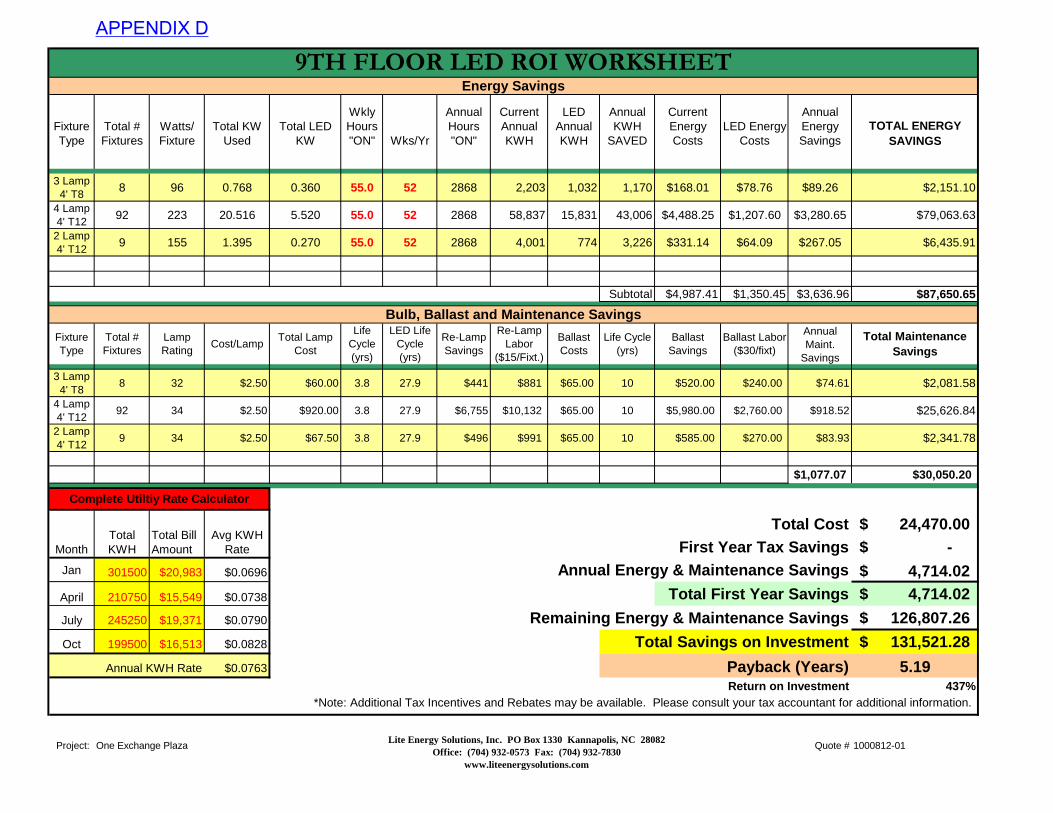
Fixture Type
Total # Fixtures
Watts/ Fixture
Total KW Used
Total LED KW
Wkly Hours "ON" Wks/Yr
Annual Hours "ON"
Current Annual KWH
LED Annual KWH
Annual KWH
SAVED
Current Energy Costs
LED Energy Costs
Annual Energy Savings
TOTAL ENERGY SAVINGS
3 Lamp 4' T8
8 96 0.768 0.360 55.0 52 2868 2,203 1,032 1,170 $168.01 $78.76 $89.26 $2,151.10
4 Lamp 4' T12
92 223 20.516 5.520 55.0 52 2868 58,837 15,831 43,006 $4,488.25 $1,207.60 $3,280.65 $79,063.63
2 Lamp 4' T12
9 155 1.395 0.270 55.0 52 2868 4,001 774 3,226 $331.14 $64.09 $267.05 $6,435.91
Subtotal $4,987.41 $1,350.45 $3,636.96 $87,650.65
Fixture Type
Total # Fixtures
Lamp Rating
Cost/LampTotal Lamp
Cost
Life Cycle (yrs)
LED Life Cycle (yrs)
Re-Lamp Savings
Re-Lamp Labor
($15/Fixt.)
Ballast Costs
Life Cycle (yrs)
Ballast Savings
Ballast Labor ($30/fixt)
Annual Maint.
Savings
Total Maintenance Savings
3 Lamp 4' T8
8 32 $2.50 $60.00 3.8 27.9 $441 $881 $65.00 10 $520.00 $240.00 $74.61 $2,081.58
4 Lamp 4' T12
92 34 $2.50 $920.00 3.8 27.9 $6,755 $10,132 $65.00 10 $5,980.00 $2,760.00 $918.52 $25,626.84
2 Lamp 4' T12
9 34 $2.50 $67.50 3.8 27.9 $496 $991 $65.00 10 $585.00 $270.00 $83.93 $2,341.78
$1,077.07 $30,050.20
Total Cost 24,470.00$ First Year Tax Savings -$
Jan 301500 $20,983 $0.0696 Annual Energy & Maintenance Savings 4,714.02$
April 210750 $15,549 $0.0738 Total First Year Savings 4,714.02$
July 245250 $19,371 $0.0790 Remaining Energy & Maintenance Savings 126,807.26$
Oct 199500 $16,513 $0.0828 Total Savings on Investment 131,521.28$
Annual KWH Rate $0.0763 Payback (Years) 5.19Return on Investment 437%
Project: Quote # 1000812-01
9TH FLOOR LED ROI WORKSHEET
Bulb, Ballast and Maintenance Savings
Energy Savings
*Note: Additional Tax Incentives and Rebates may be available. Please consult your tax accountant for additional information.
Complete Utiltiy Rate Calculator
One Exchange Plaza
Total KWH
Total Bill AmountMonth
Avg KWH Rate
Lite Energy Solutions, Inc. PO Box 1330 Kannapolis, NC 28082Office: (704) 932-0573 Fax: (704) 932-7830
www.liteenergysolutions.com
APPENDIX D
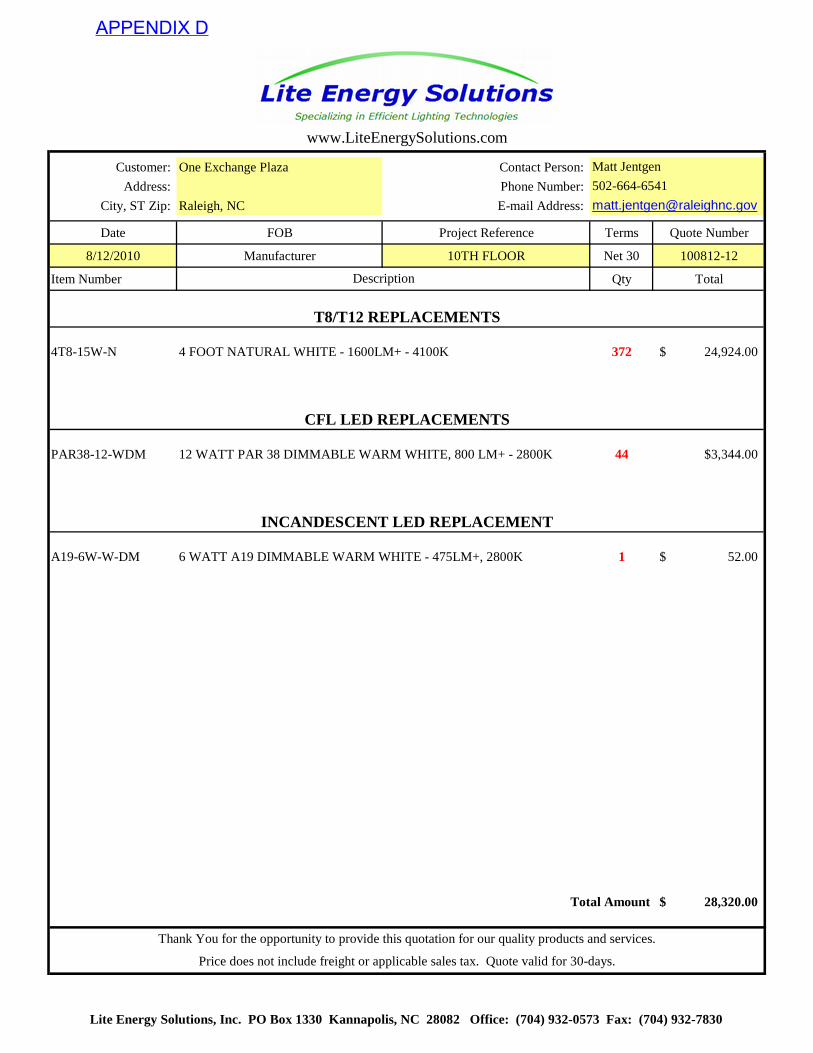
Customer: One Exchange Plaza Contact Person:
Address: Phone Number:
City, ST Zip: Raleigh, NC E-mail Address:
Date FOB Project Reference Terms Quote Number
8/12/2010 Manufacturer 10TH FLOOR Net 30 100812-12
Item Number Qty Total
4T8-15W-N 4 FOOT NATURAL WHITE - 1600LM+ - 4100K 372 24,924.00$
PAR38-12-WDM 12 WATT PAR 38 DIMMABLE WARM WHITE, 800 LM+ - 2800K 44 $3,344.00
A19-6W-W-DM 6 WATT A19 DIMMABLE WARM WHITE - 475LM+, 2800K 1 52.00$
Total Amount 28,320.00$
www.LiteEnergySolutions.com
Description
Thank You for the opportunity to provide this quotation for our quality products and services.
INCANDESCENT LED REPLACEMENT
Price does not include freight or applicable sales tax. Quote valid for 30-days.
Matt Jentgen
502-664-6541
T8/T12 REPLACEMENTS
CFL LED REPLACEMENTS
Lite Energy Solutions, Inc. PO Box 1330 Kannapolis, NC 28082 Office: (704) 932-0573 Fax: (704) 932-7830
APPENDIX D
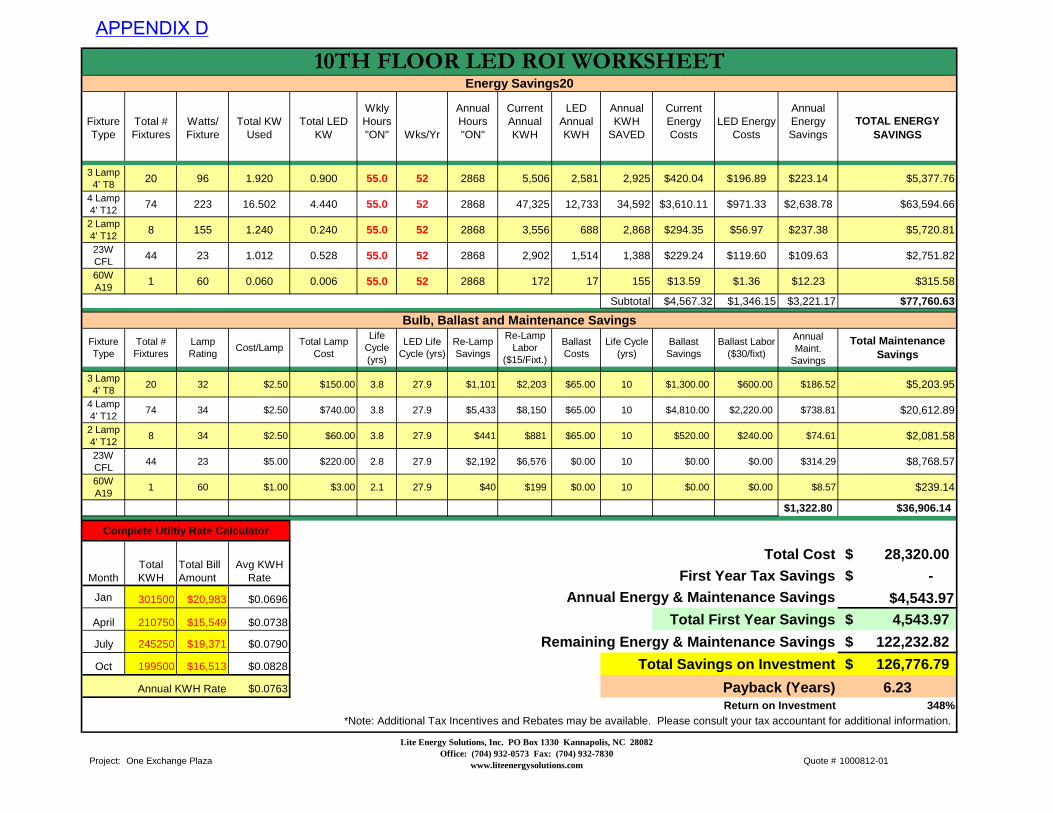
Fixture Type
Total # Fixtures
Watts/ Fixture
Total KW Used
Total LED KW
Wkly Hours "ON" Wks/Yr
Annual Hours "ON"
Current Annual KWH
LED Annual KWH
Annual KWH
SAVED
Current Energy Costs
LED Energy Costs
Annual Energy Savings
TOTAL ENERGY SAVINGS
3 Lamp 4' T8
20 96 1.920 0.900 55.0 52 2868 5,506 2,581 2,925 $420.04 $196.89 $223.14 $5,377.76
4 Lamp 4' T12
74 223 16.502 4.440 55.0 52 2868 47,325 12,733 34,592 $3,610.11 $971.33 $2,638.78 $63,594.66
2 Lamp 4' T12
8 155 1.240 0.240 55.0 52 2868 3,556 688 2,868 $294.35 $56.97 $237.38 $5,720.81
23W CFL
44 23 1.012 0.528 55.0 52 2868 2,902 1,514 1,388 $229.24 $119.60 $109.63 $2,751.82
60W A19
1 60 0.060 0.006 55.0 52 2868 172 17 155 $13.59 $1.36 $12.23 $315.58
Subtotal $4,567.32 $1,346.15 $3,221.17 $77,760.63
Fixture Type
Total # Fixtures
Lamp Rating
Cost/LampTotal Lamp
Cost
Life Cycle (yrs)
LED Life Cycle (yrs)
Re-Lamp Savings
Re-Lamp Labor
($15/Fixt.)
Ballast Costs
Life Cycle (yrs)
Ballast Savings
Ballast Labor ($30/fixt)
Annual Maint.
Savings
Total Maintenance Savings
3 Lamp 4' T8
20 32 $2.50 $150.00 3.8 27.9 $1,101 $2,203 $65.00 10 $1,300.00 $600.00 $186.52 $5,203.95
4 Lamp 4' T12
74 34 $2.50 $740.00 3.8 27.9 $5,433 $8,150 $65.00 10 $4,810.00 $2,220.00 $738.81 $20,612.89
2 Lamp 4' T12
8 34 $2.50 $60.00 3.8 27.9 $441 $881 $65.00 10 $520.00 $240.00 $74.61 $2,081.58
23W CFL
44 23 $5.00 $220.00 2.8 27.9 $2,192 $6,576 $0.00 10 $0.00 $0.00 $314.29 $8,768.57
60W A19
1 60 $1.00 $3.00 2.1 27.9 $40 $199 $0.00 10 $0.00 $0.00 $8.57 $239.14
$1,322.80 $36,906.14
Total Cost 28,320.00$ First Year Tax Savings -$
Jan 301500 $20,983 $0.0696 Annual Energy & Maintenance Savings $4,543.97
April 210750 $15,549 $0.0738 Total First Year Savings 4,543.97$
July 245250 $19,371 $0.0790 Remaining Energy & Maintenance Savings 122,232.82$
Oct 199500 $16,513 $0.0828 Total Savings on Investment 126,776.79$
Annual KWH Rate $0.0763 Payback (Years) 6.23Return on Investment 348%
Project: Quote # 1000812-01One Exchange Plaza
Total KWH
Total Bill AmountMonth
Avg KWH Rate
10TH FLOOR LED ROI WORKSHEET
Bulb, Ballast and Maintenance Savings
Energy Savings20
*Note: Additional Tax Incentives and Rebates may be available. Please consult your tax accountant for additional information.
Complete Utiltiy Rate Calculator
Lite Energy Solutions, Inc. PO Box 1330 Kannapolis, NC 28082Office: (704) 932-0573 Fax: (704) 932-7830
www.liteenergysolutions.com
APPENDIX D
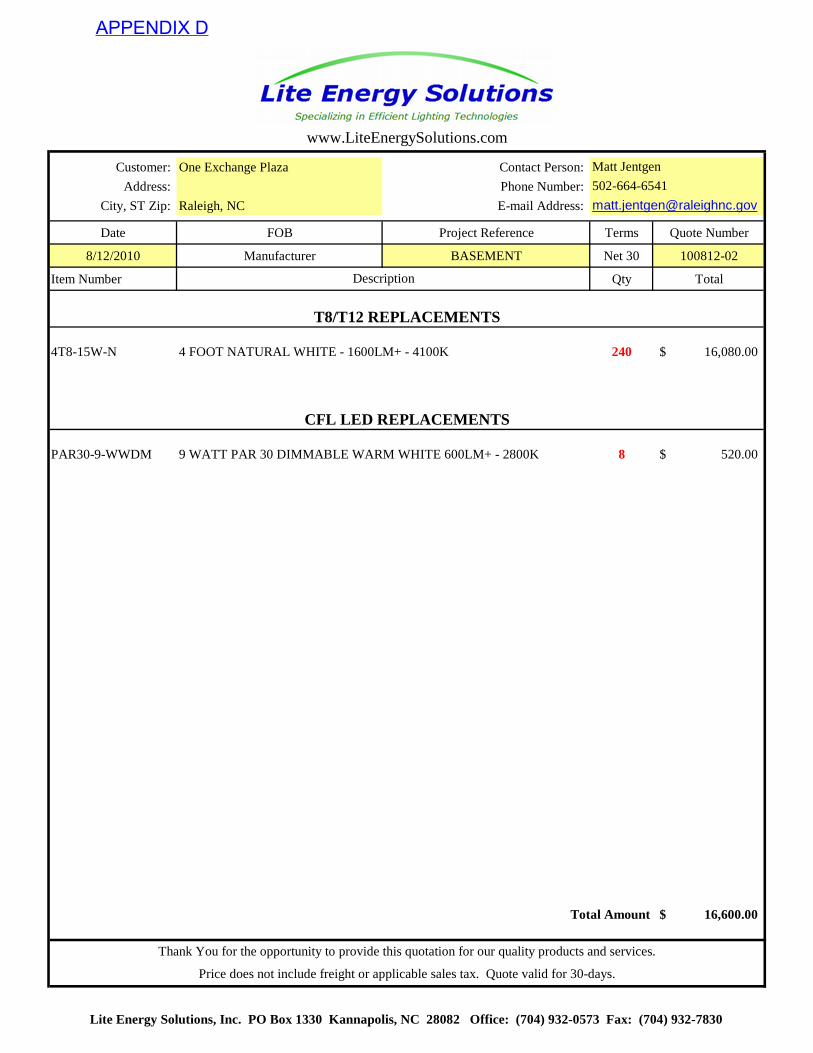
Customer: One Exchange Plaza Contact Person:
Address: Phone Number:
City, ST Zip: Raleigh, NC E-mail Address:
Date FOB Project Reference Terms Quote Number
8/12/2010 Manufacturer BASEMENT Net 30 100812-02
Item Number Qty Total
4T8-15W-N 4 FOOT NATURAL WHITE - 1600LM+ - 4100K 240 16,080.00$
PAR30-9-WWDM 9 WATT PAR 30 DIMMABLE WARM WHITE 600LM+ - 2800K 8 520.00$
Total Amount 16,600.00$
www.LiteEnergySolutions.com
Description
Thank You for the opportunity to provide this quotation for our quality products and services.
Price does not include freight or applicable sales tax. Quote valid for 30-days.
Matt Jentgen
502-664-6541
T8/T12 REPLACEMENTS
CFL LED REPLACEMENTS
Lite Energy Solutions, Inc. PO Box 1330 Kannapolis, NC 28082 Office: (704) 932-0573 Fax: (704) 932-7830
APPENDIX D
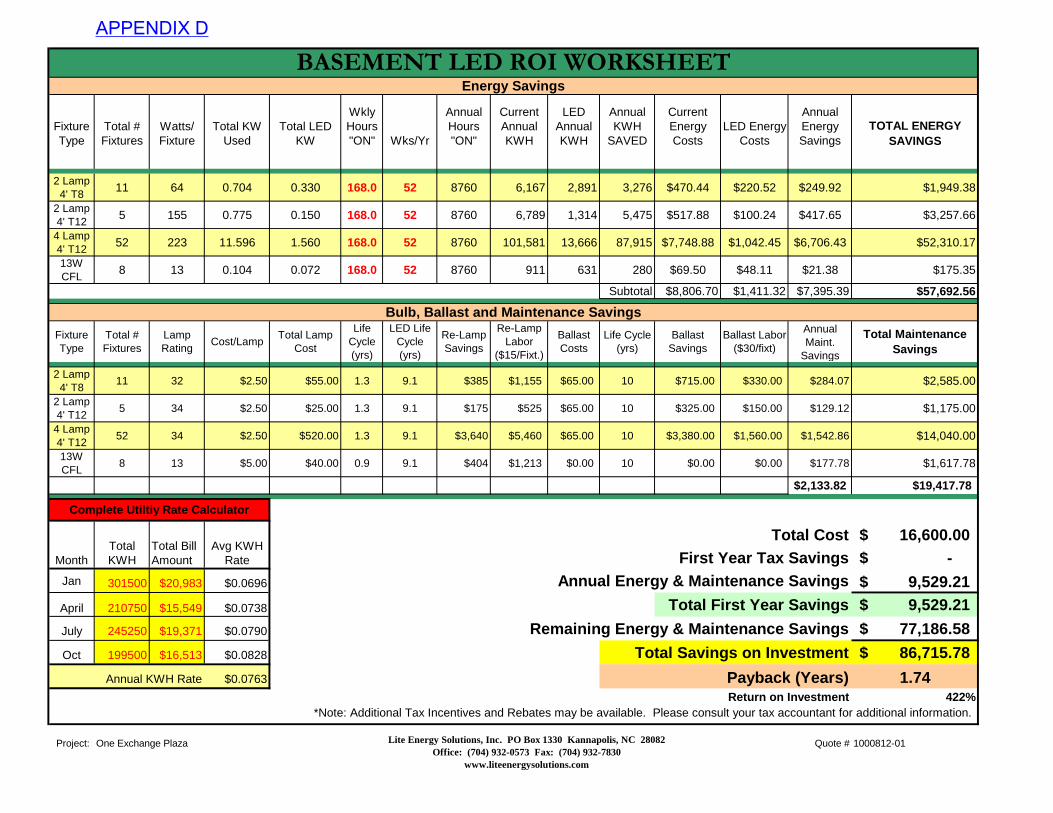
Fixture Type
Total # Fixtures
Watts/ Fixture
Total KW Used
Total LED KW
Wkly Hours "ON" Wks/Yr
Annual Hours "ON"
Current Annual KWH
LED Annual KWH
Annual KWH
SAVED
Current Energy Costs
LED Energy Costs
Annual Energy Savings
TOTAL ENERGY SAVINGS
2 Lamp 4' T8
11 64 0.704 0.330 168.0 52 8760 6,167 2,891 3,276 $470.44 $220.52 $249.92 $1,949.38
2 Lamp 4' T12
5 155 0.775 0.150 168.0 52 8760 6,789 1,314 5,475 $517.88 $100.24 $417.65 $3,257.66
4 Lamp 4' T12
52 223 11.596 1.560 168.0 52 8760 101,581 13,666 87,915 $7,748.88 $1,042.45 $6,706.43 $52,310.17
13W CFL
8 13 0.104 0.072 168.0 52 8760 911 631 280 $69.50 $48.11 $21.38 $175.35
Subtotal $8,806.70 $1,411.32 $7,395.39 $57,692.56
Fixture Type
Total # Fixtures
Lamp Rating
Cost/LampTotal Lamp
Cost
Life Cycle (yrs)
LED Life Cycle (yrs)
Re-Lamp Savings
Re-Lamp Labor
($15/Fixt.)
Ballast Costs
Life Cycle (yrs)
Ballast Savings
Ballast Labor ($30/fixt)
Annual Maint.
Savings
Total Maintenance Savings
2 Lamp 4' T8
11 32 $2.50 $55.00 1.3 9.1 $385 $1,155 $65.00 10 $715.00 $330.00 $284.07 $2,585.00
2 Lamp 4' T12
5 34 $2.50 $25.00 1.3 9.1 $175 $525 $65.00 10 $325.00 $150.00 $129.12 $1,175.00
4 Lamp 4' T12
52 34 $2.50 $520.00 1.3 9.1 $3,640 $5,460 $65.00 10 $3,380.00 $1,560.00 $1,542.86 $14,040.00
13W CFL
8 13 $5.00 $40.00 0.9 9.1 $404 $1,213 $0.00 10 $0.00 $0.00 $177.78 $1,617.78
$2,133.82 $19,417.78
Total Cost 16,600.00$ First Year Tax Savings -$
Jan 301500 $20,983 $0.0696 Annual Energy & Maintenance Savings 9,529.21$
April 210750 $15,549 $0.0738 Total First Year Savings 9,529.21$
July 245250 $19,371 $0.0790 Remaining Energy & Maintenance Savings 77,186.58$
Oct 199500 $16,513 $0.0828 Total Savings on Investment 86,715.78$
Annual KWH Rate $0.0763 Payback (Years) 1.74Return on Investment 422%
Project: Quote # 1000812-01One Exchange Plaza
Total KWH
Total Bill AmountMonth
Avg KWH Rate
BASEMENT LED ROI WORKSHEET
Bulb, Ballast and Maintenance Savings
Energy Savings
*Note: Additional Tax Incentives and Rebates may be available. Please consult your tax accountant for additional information.
Complete Utiltiy Rate Calculator
Lite Energy Solutions, Inc. PO Box 1330 Kannapolis, NC 28082Office: (704) 932-0573 Fax: (704) 932-7830
www.liteenergysolutions.com
APPENDIX D

APPENDIX E
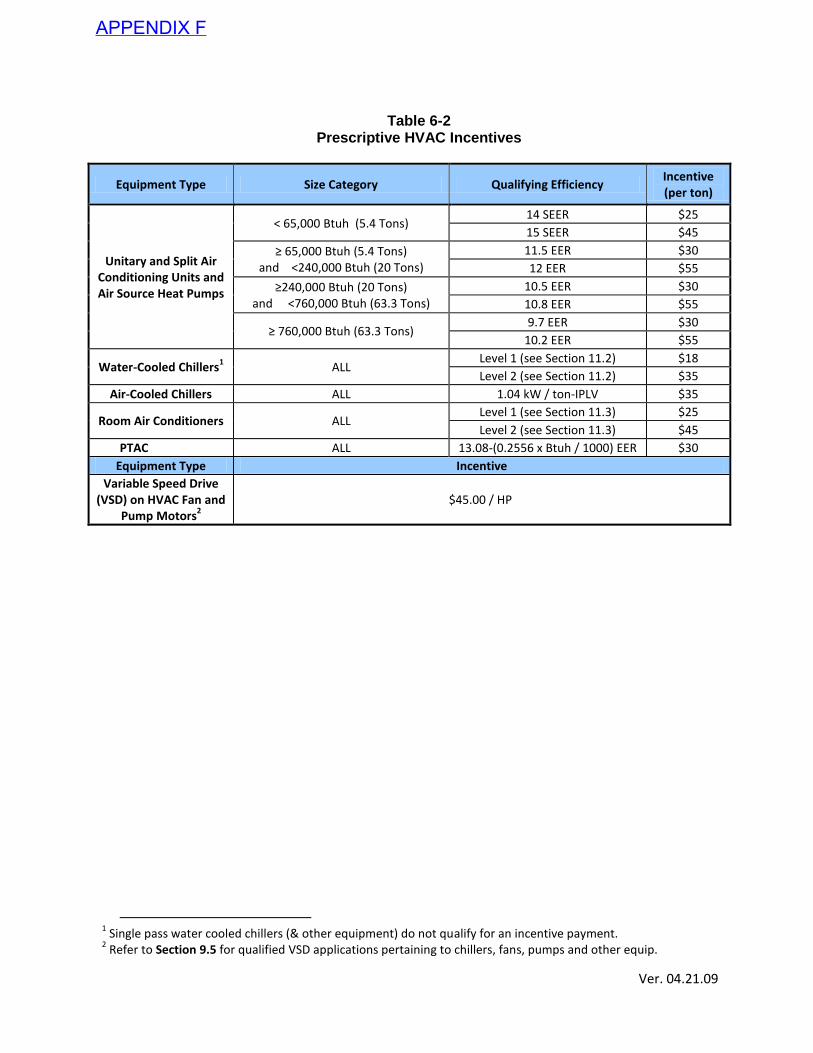
Ver. 04.21.09
Table 6-2
Prescriptive HVAC Incentives
Equipment Type Size Category Qualifying Efficiency Incentive (per ton)
Unitary and Split Air Conditioning Units and Air Source Heat Pumps
< 65,000 Btuh (5.4 Tons) 14 SEER $25
15 SEER $45
≥ 65,000 Btuh (5.4 Tons) and <240,000 Btuh (20 Tons)
11.5 EER $30
12 EER $55
≥240,000 Btuh (20 Tons) and <760,000 Btuh (63.3 Tons)
10.5 EER $30
10.8 EER $55
≥ 760,000 Btuh (63.3 Tons) 9.7 EER $30
10.2 EER $55
Water-Cooled Chillers1 ALL
Level 1 (see Section 11.2) $18
Level 2 (see Section 11.2) $35
Air-Cooled Chillers ALL 1.04 kW / ton-IPLV $35
Room Air Conditioners ALL Level 1 (see Section 11.3) $25
Level 2 (see Section 11.3) $45
PTAC ALL 13.08-(0.2556 x Btuh / 1000) EER $30
Equipment Type Incentive
Variable Speed Drive (VSD) on HVAC Fan and
Pump Motors2
$45.00 / HP
1 Single pass water cooled chillers (& other equipment) do not qualify for an incentive payment.
2 Refer to Section 9.5 for qualified VSD applications pertaining to chillers, fans, pumps and other equip.
APPENDIX F
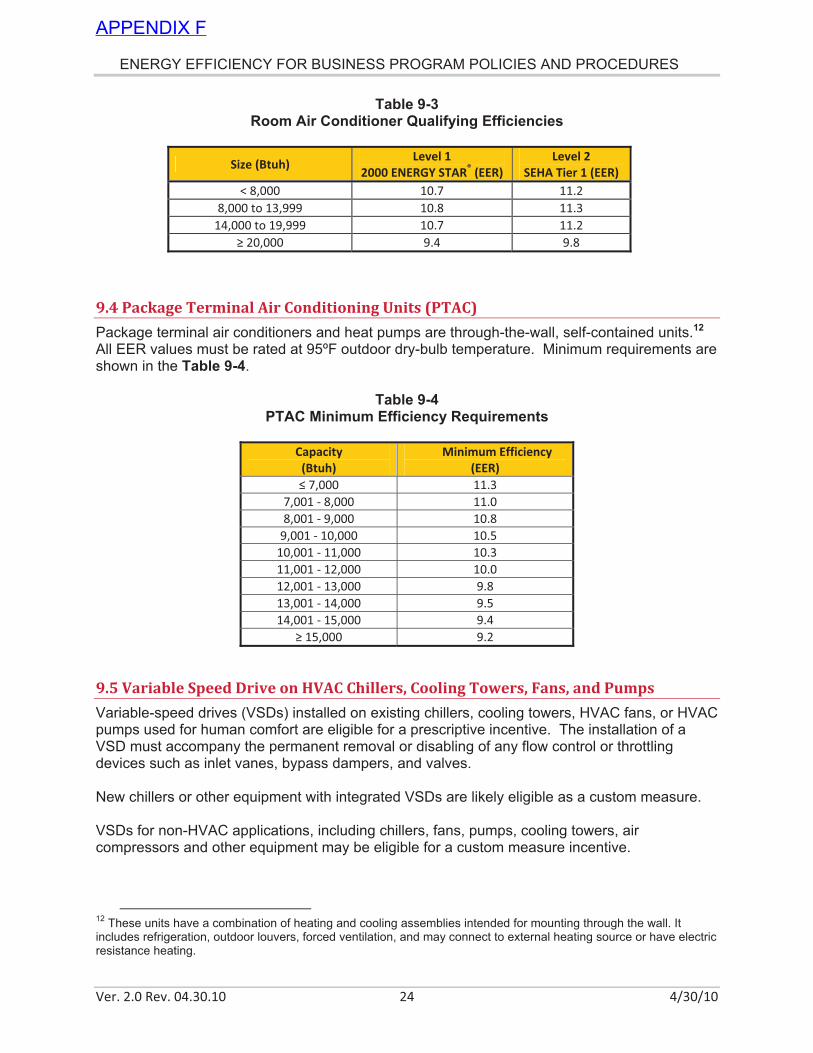
ENERGY EFFICIENCY FOR BUSINESS PROGRAM POLICIES AND PROCEDURES
Ver. 2.0 Rev. 04.30.10 24 4/30/10
Table 9-3 Room Air Conditioner Qualifying Efficiencies
Size (Btuh) Level 1
2000 ENERGY STAR® (EER)
Level 2
SEHA Tier 1 (EER)
< 8,000 10.7 11.2
8,000 to 13,999 10.8 11.3
14,000 to 19,999 10.7 11.2
! 20,000 9.4 9.8
9.4 Package Terminal Air Conditioning Units (PTAC)
Package terminal air conditioners and heat pumps are through-the-wall, self-contained units.12 All EER values must be rated at 95ºF outdoor dry-bulb temperature. Minimum requirements are shown in the Table 9-4.
Table 9-4 PTAC Minimum Efficiency Requirements
Capacity
(Btuh)
Minimum Efficiency
(EER)
" 7,000 11.3
7,001 # 8,000 11.0
8,001 # 9,000 10.8
9,001 # 10,000 10.5
10,001 # 11,000 10.3
11,001 # 12,000 10.0
12,001 # 13,000 9.8
13,001 # 14,000 9.5
14,001 # 15,000 9.4
! 15,000 9.2
9.5 Variable Speed Drive on HVAC Chillers, Cooling Towers, Fans, and Pumps
Variable-speed drives (VSDs) installed on existing chillers, cooling towers, HVAC fans, or HVAC pumps used for human comfort are eligible for a prescriptive incentive. The installation of a VSD must accompany the permanent removal or disabling of any flow control or throttling devices such as inlet vanes, bypass dampers, and valves. New chillers or other equipment with integrated VSDs are likely eligible as a custom measure. VSDs for non-HVAC applications, including chillers, fans, pumps, cooling towers, air compressors and other equipment may be eligible for a custom measure incentive.
12
These units have a combination of heating and cooling assemblies intended for mounting through the wall. It includes refrigeration, outdoor louvers, forced ventilation, and may connect to external heating source or have electric resistance heating.
APPENDIX F
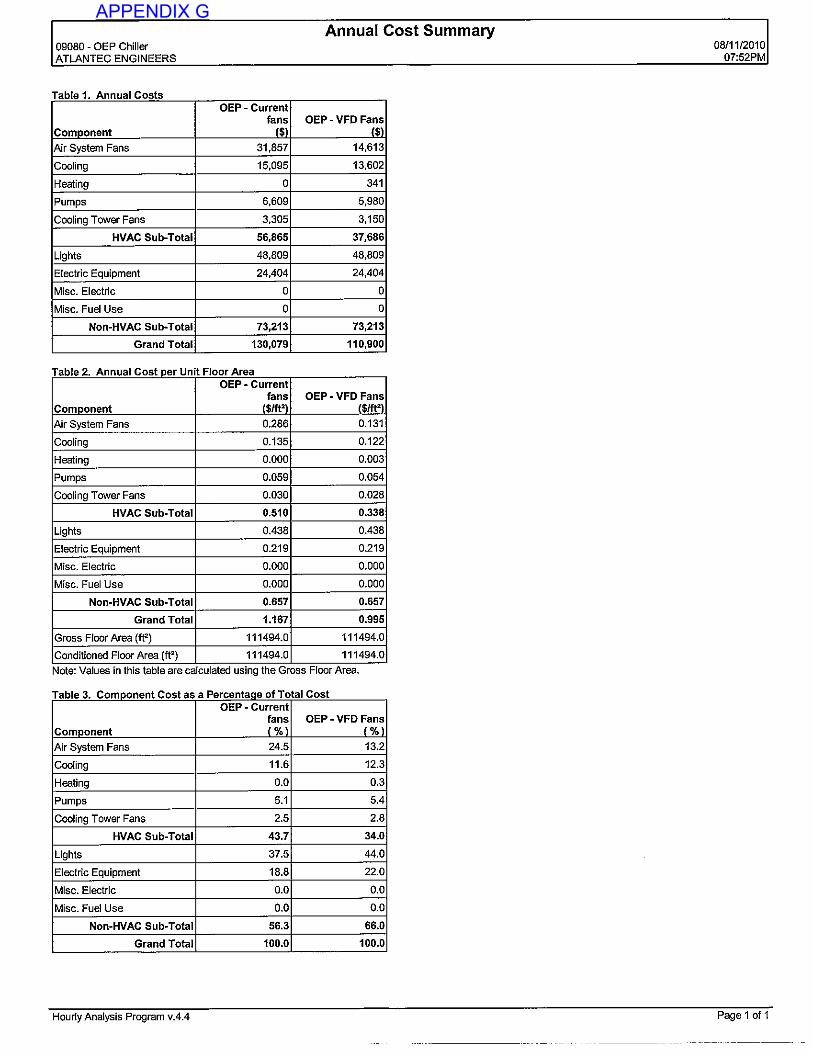
APPENDIX G
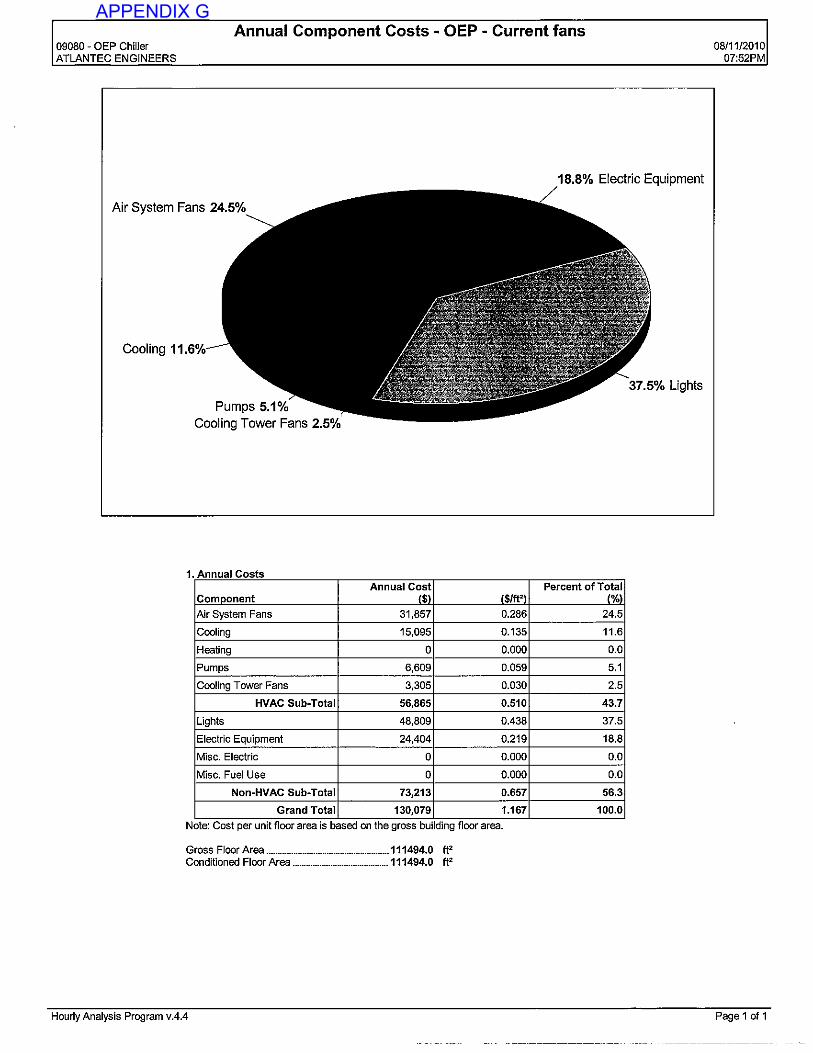
APPENDIX G
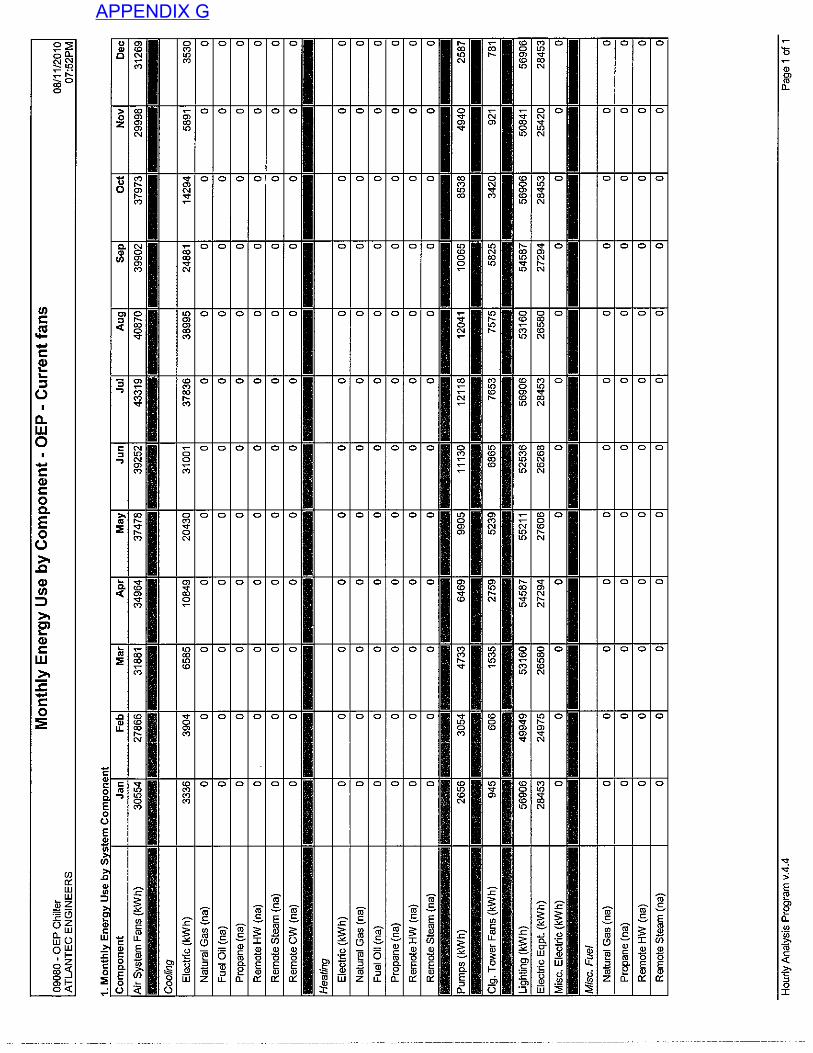
APPENDIX G
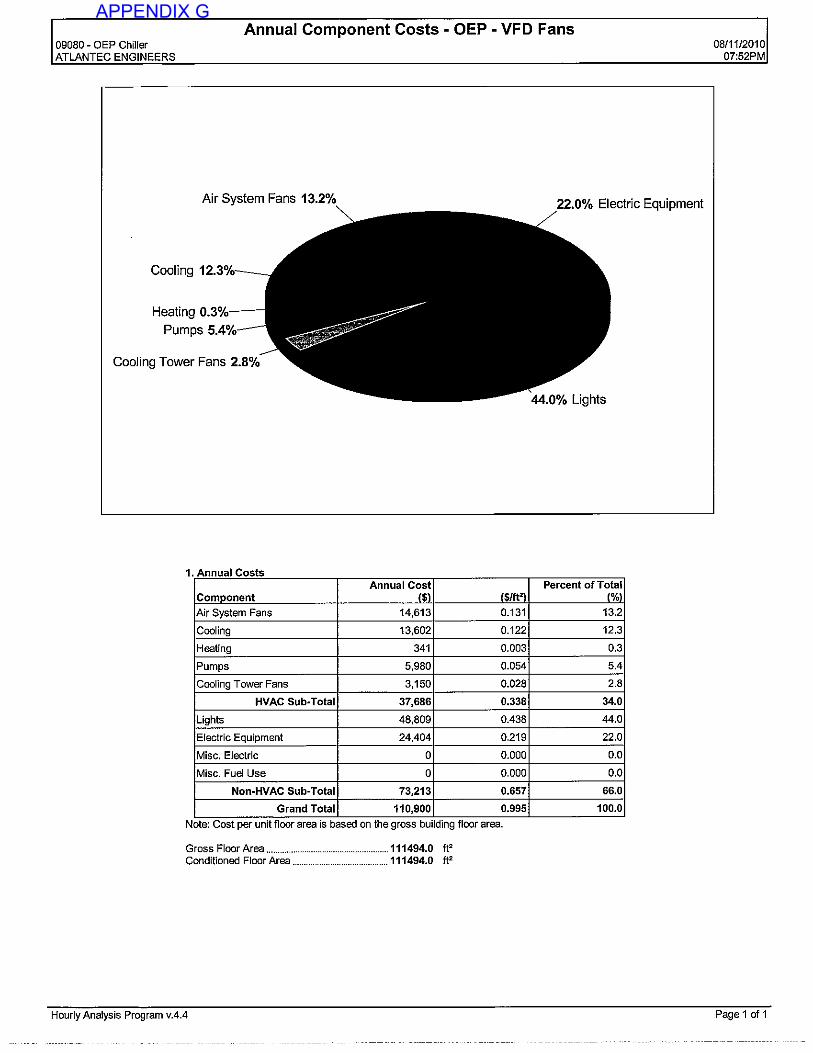
APPENDIX G
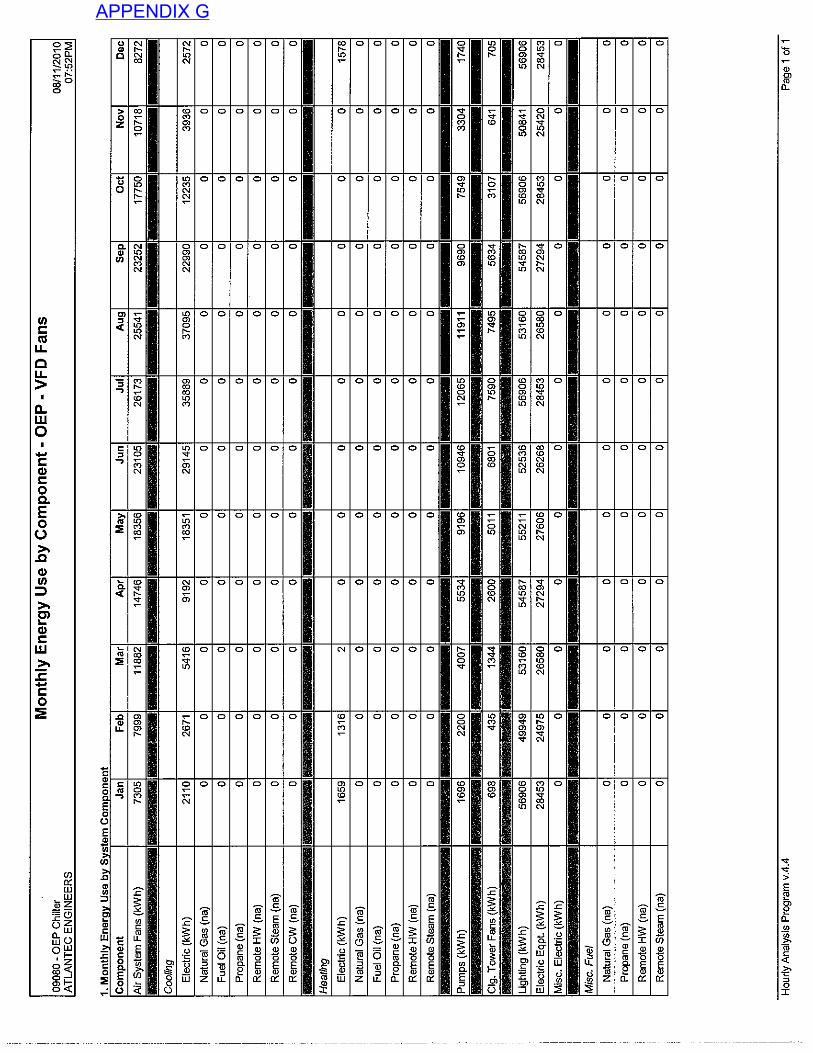
APPENDIX G
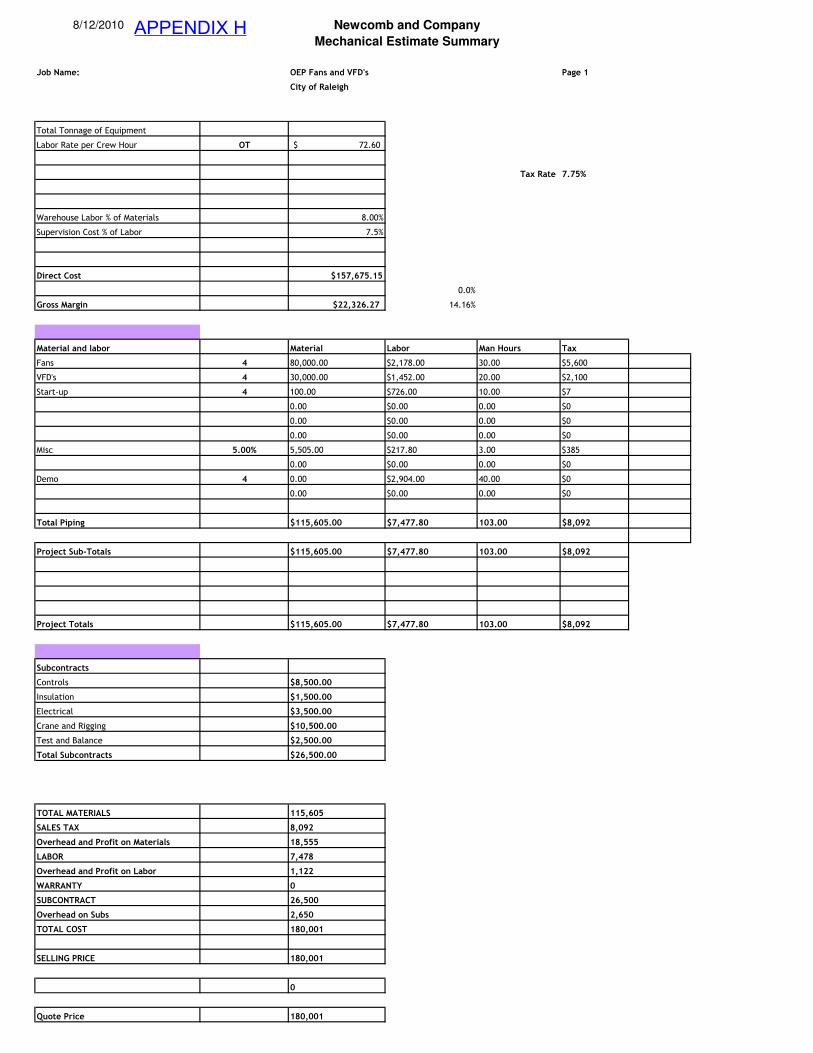
8/12/2010 Newcomb and Company
Mechanical Estimate Summary
Job Name: OEP Fans and VFD's Page 1
City of Raleigh
Total Tonnage of Equipment
Labor Rate per Crew Hour OT 72.60$
Tax Rate 7.75%
Warehouse Labor % of Materials 8.00%
Supervision Cost % of Labor 7.5%
Direct Cost $157,675.15
0.0%
Gross Margin $22,326.27 14.16%
Material and labor Material Labor Man Hours Tax
Fans 4 80,000.00 $2,178.00 30.00 $5,600
VFD's 4 30,000.00 $1,452.00 20.00 $2,100
Start-up 4 100.00 $726.00 10.00 $7
0.00 $0.00 0.00 $0
0.00 $0.00 0.00 $0
0.00 $0.00 0.00 $0
Misc 5.00% 5,505.00 $217.80 3.00 $385
0.00 $0.00 0.00 $0
Demo 4 0.00 $2,904.00 40.00 $0
0.00 $0.00 0.00 $0
Total Piping $115,605.00 $7,477.80 103.00 $8,092
Project Sub-Totals $115,605.00 $7,477.80 103.00 $8,092
Project Totals $115,605.00 $7,477.80 103.00 $8,092
Subcontracts
Controls $8,500.00
Insulation $1,500.00
Electrical $3,500.00
Crane and Rigging $10,500.00
Test and Balance $2,500.00
Total Subcontracts $26,500.00
TOTAL MATERIALS 115,605
SALES TAX 8,092
Overhead and Profit on Materials 18,555
LABOR 7,478
Overhead and Profit on Labor 1,122
WARRANTY 0
SUBCONTRACT 26,500
Overhead on Subs 2,650
TOTAL COST 180,001
SELLING PRICE 180,001
0
Quote Price 180,001
APPENDIX H

ENERGY EFFICIENCY FOR BUSINESS PROGRAM POLICIES AND PROCEDURES
Ver. 2.0 Rev. 04.30.10 11 4/30/10
6.1.3 Retrofit Prescriptive ! Refrigeration
The following are some common methods of reducing energy usage in refrigeration. The Energy Efficiency for Business Program is offering incentives for the refrigeration measures shown in Table 6-3. The specifications for each of these measures are provided in Section 10.
Table 6-3
Prescriptive Refrigeration Incentives
Refrigeration Measures
Measure Incentive Unit Incentive/Unit
Strip Curtains on Walk!In Coolers and Freezers Per Square Foot $3.00
Anti!Sweat Heater Control Per Linear Foot $20.00
Electrically Commutated Motor for Walk!in Per Motor $50.00
Electrically Commutated Motor for Reach!in Per Motor $40.00
Evaporator Fan Control Per Motor $60.00
Automatic Door Closers for Walk!in Freezers Per Door $140.00
Beverage Machine Control Per Unit $90.00
ENERGYSTAR® Beverage Machine Per Unit $90.00
Snack Machine Control Per Unit $50.00
High!Efficiency Ice Makers (Air Cooled Only) ENERGY STAR® or CEE Tier 1
Size (lbs / 24 hrs) Qualifying kWh per 100 lbs Incentive per Ice Maker
101 ! 200 8.5 $75.00
201 ! 300 7.7 $125.00
301 ! 400 6.5 $175.00
401 ! 500 5.5 $225.00
501 – 1,000 5.2 $300.00
1,001 – 1,500 5.0 $450.00
> 1,500 4.6 $600.00
APPENDIX I
Related Documents


