167 vol.38:2 summer 2014 Energy Efficiency and Working Conditions in Vietnamese Apparel Factories Rebecca Drejet and Ann Rappaport e apparel industry is often seen as a gateway industry for economic development, as the manufacturing of simple garments does not require highly sophisticated production equipment or highly educated human capital. However, it does require electricity. Delivery of reliable electricity poses a challenge, especially as demand increases with development. And despite the existence of the Clean Development Mechanism—designed to foster low carbon development pathways—primary energy production remains fossil-fuel intensive. ese conditions increase the importance of energy efficiency as a strategy for sustainable development. However, strategies to develop good working conditions—another component that is crucial to sustainable development, particularly in industries with global supply chains—risk competing with goals of energy efficiency. Ensuring that workers are healthy, safe, and fully and fairly compensated for the labor they perform means they can more effectively support their families, invest in education, and contribute to the human and economic develop- ment of the communities in which they live. Understanding the relation- ship between working conditions and energy efficiency is subsequently valuable for creating effective industry development programs. is analysis focuses on electricity use in the apparel industry in Vietnam, with attention to understanding the relationship between Rebecca Drejet is a consultant at Bain & Company in Chicago. She holds a MALD from e Fletcher School and a MBA from the Tuck School of Business at Dartmouth. Ann Rappaport is an environmental engineer whose research focuses on climate change, sustainability, and global supply chains. She is currently a professor at Tufts University’s School of Urban and Environmental Policy and Planning.

Welcome message from author
This document is posted to help you gain knowledge. Please leave a comment to let me know what you think about it! Share it to your friends and learn new things together.
Transcript

167
vol.38:2 summer 2014
Energy Efficiency and Working Conditions in
Vietnamese Apparel FactoriesRebecca Drejet and Ann Rappaport
The apparel industry is often seen as a gateway industry for economic development, as the manufacturing of simple garments does not require highly sophisticated production equipment or highly educated human capital. However, it does require electricity. Delivery of reliable electricity poses a challenge, especially as demand increases with development. And despite the existence of the Clean Development Mechanism—designed to foster low carbon development pathways—primary energy production remains fossil-fuel intensive. These conditions increase the importance of energy efficiency as a strategy for sustainable development. However, strategies to develop good working conditions—another component that is crucial to sustainable development, particularly in industries with global supply chains—risk competing with goals of energy efficiency. Ensuring that workers are healthy, safe, and fully and fairly compensated for the labor they perform means they can more effectively support their families, invest in education, and contribute to the human and economic develop-ment of the communities in which they live. Understanding the relation-ship between working conditions and energy efficiency is subsequently valuable for creating effective industry development programs.
This analysis focuses on electricity use in the apparel industry in Vietnam, with attention to understanding the relationship between
Rebecca Drejet is a consultant at Bain & Company in Chicago. She holds a MALD from The Fletcher School and a MBA from the Tuck School of Business at Dartmouth. Ann Rappaport is an environmental engineer whose research focuses on climate change, sustainability, and global supply chains. She is currently a professor at Tufts University’s School of Urban and Environmental Policy and Planning.

the fletcher forum of world affairs
vol.38:2 summer 2014
168
energy efficiency and working conditions—an important and under-studied dimension of sustainability. We use data from Better Work (BW), a program founded by the International Labor Organization (ILO) and
the International Finance Corporation (IFC) to improve factories’ working conditions and economic competi-tiveness.1 We first provide contextual information on the apparel industry in Vietnam, followed by an overview of energy markets in the country. Data collection and methods are described and results from the statistical analysis are presented. Based on data collected from apparel factories in Vietnam in 2010 and 2011, we find evidence that factories spending less on electricity per unit of output have better working conditions for employees, with the
exception of Freedom of Association and Collective Bargaining. Thus, we provide evidence that good working conditions and energy efficiency are complementary, rather than competing.
THE APPAREL INDUSTRY IN VIETNAM
Vietnam, with a population of almost 87 million people, has become a significant contributor to worldwide apparel production since its economic reform program, doi moi, in 1986. Based on estimates from the 2010 World Trade Organization’s international trade statistics, Vietnam is one of the world’s top ten apparel exporters. Then valued at approxi-mately USD 9 billion, Vietnam’s exports accounted for 2.7 percent of the world’s share of clothing transfers globally—a share which grew 19 percent between 2000 and 2009. The strength of the Vietnamese apparel industry is further indicated by the comparatively small decline in apparel produc-tion during the 2008-2009 global financial crisis. Vietnam experienced a 1 percent decrease in exports—second only to India, for which apparel exports did not decline during the crisis. And the Vietnamese apparel industry rebounded strongly after the crisis. According to Viet Nam News, garment and textile exports exceeded USD 17 billion in 2012.2
Of Vietnam’s total merchandise exports in 2009, clothing accounted for over 15 percent.3 In 2001, 45 percent of Vietnam’s manufacturing
Based on data collected from apparel factories in Vietnam in 2010 and 2011, we find evidence that factories spending less on electricity per unit of output have better working conditions for employees, with the exception of Freedom of Association and Collective Bargaining.
169
vol.38:2 summer 2014
energy efficiency and working conditions in vietnamese apparel factories
exports came from the apparel industry.4 Estimates from the General Statistics Office of Vietnam indicate that in 2009, the combined manu-facturing of textiles, apparel and leather products constituted roughly 13 percent of Vietnam’s gross output. The ILO estimates that in 2004 about 4.9 million people were employed in the manufacturing sector as a whole, and estimates as of 2003 indicate that there were roughly 1.6 million workers employed (mainly in clothing) in 1,034 clothing and textile enter-prises.5
Though the apparel industry has been heralded as an engine of economic growth, that growth is arguably achieved at the expense of workers employed in apparel factories. Recent attention has focused on Bangladesh, where, in two widely publicized incidents, there was signifi-cant loss of life. Over 100 people perished in a 2012 apparel factory fire6 and in 2013, over 1,000 people were killed in the collapse of a shoddily-constructed garment factory building.7 Prior to these tragic events, consid-erable attention was devoted to understanding8 and crafting remedies for inhumane working conditions, but these events have certainly raised public awareness of issues surrounding factory safety and working conditions.
Our purpose here is to consider the impact of energy costs on working conditions. A connection between energy costs and working conditions is not initially obvious. Energy costs, however, are widely regarded as one of the main production costs, and a main factor that investors consider when choosing locations for factories.9,10,11 Based on an analysis of Cambodian factories by Better Work (2009), energy costs ranged from 6 to 60 percent of total production costs, with an average of 16.7 percent (excluding material costs). Energy costs do not appear to correlate with factory size, machinery age, or factory age. However, there is a significant correlation between energy costs and the type of garment produced, production size, and the production floor size. A simple garment such as a t-shirt can be made very quickly and thus would likely require less electricity per unit than a more complex garment such as a ski jacket, which requires consider-ably more machine time. Production size is the total number of garments produced by the factory in a given period, and floor size is a physical
A connection between energy costs and working conditions is not initially obvious. Energy costs, however, are widely regarded as one of the main production costs, and a main factor that investors consider when choosing locations for factories.

the fletcher forum of world affairs
vol.38:2 summer 2014
170
measure of factory space. Energy intensity was not correlated with any of the above factors, and greenhouse gas emissions were only significantly correlated with production size.
Though Better Work does not investigate whether energy costs are in any material way related to other factory outcomes, it is plausible to think that such a relationship might exist. For example, to the extent that some aspects of Occupational Safety and Health (OSH)12 are energy inten-sive, firms facing higher energy costs might have worse OSH compliance scores. Examples of energy-intensive activities related to OSH include adequately heating, cooling, or ventilating the work environment. Further, firms facing a fixed market price in the input markets for materials, water, and energy, as well as in the output market for their goods, may attempt to limit investments in costly compliance such as paying wages as promised.
Below we report on findings relating energy costs and factory outcomes based on analysis of compliance and survey data from Better Work Vietnam. To better understand the balance between energy costs, compliance, and productivity in the apparel market, we will next present an overview of energy markets in Vietnam.
ENERGY MARKETS IN VIETNAM
From 1990 to 2005, Vietnam’s GDP grew on average at 7.5 percent per year, which resulted in 13 percent annual growth in demand for elec-tricity in the same period. The Institute of Energy forecasted that elec-tricity demand would increase at an average annual growth rate of 11 percent, and total power generation capacity based on anticipated invest-ments would grow at an average rate of about 11 percent between 2005 and 2025, however the average annual growth exceeded 14 percent from 2001 to 2010.13 The weighted average retail electricity tariff in 2012 was about USD 0.055/kWh (including the value added tax), which is gener-ally lower than most countries and also below the long run marginal cost (estimated at USD 0.075/kWh). To address the expected rapid increase in energy demand, the Vietnamese government had planned to increase electricity tariffs in order to attract investors.14 But when accounting for the rate of inflation (estimated at over 20 percent in mid-2011), the govern-ment was reportedly reluctant to increase electricity prices as a way of arti-ficially “managing” inflation costs.15,16 It is estimated that the state-owned Vietnam Electricity (EVN), which has been operating with losses to subsi-dize electricity costs, would need to increase prices by 62 percent in order to cover EVN’s losses.17

171
vol.38:2 summer 2014
energy efficiency and working conditions in vietnamese apparel factories
As a consequence of energy generation shortages, in the summer of 2009 the city of Hanoi reportedly experienced three-hour daily power outages.18 It is common for factories and business owners to address power interruptions by investing in their own power generation capabilities. Such alternate sources of power, however, are significantly more expensive than the government rate. For example, a small diesel generator can cost up to USD 0.30/kWh.19 Small generators may also be less efficient, and thus may produce more greenhouse gas per kWh than grid power.
At the end of 2005 the total installed power generation capacity connected to the grid comprised 61 percent of thermal power plants and 39 percent of hydropower plants. Gas was used to generate 38 percent of the total, coal plants generated 14 percent, oil 5 percent, and the remainder of electricity was generated with diesel fuel.20 According to its current energy master plan, Vietnam is encouraging the development of renewable sources (particularly hydroelectric, wind, solar and biomass).21 That investment, however, only remains attractive insofar as electricity rates increase while staying low enough to compete with neighboring countries.
DATA COLLECTION AND METHODOLOGY
The following data are compiled from two different sources: Better Work’s factory compliance data and evaluation data collected from surveys of factories participating in the Better Work program. All of the evaluation survey data were collected between March 2010 and August 2011. The Better Work compliance data were collected between December 2009 and December 2011.
The evaluation survey data on factory characteristics, factory perfor-mance, and workplace practices were collected using Computer Assisted Personal Interview (CAPI) methodology. Surveys for the general manager, financial officer, industrial/mechanical engineer, and human resource
According to its current energy master plan, Vietnam is encouraging the development of renewable sources (particularly hydroelectric, wind, solar and biomass). That investment, however, only remains attractive insofar as electricity rates increase while staying low enough to compete with neighboring countries.

the fletcher forum of world affairs
vol.38:2 summer 2014
172
manager were delivered on netbook computers while an audio recording narrated the question and response options.
At the time of this March 2012 analysis, eighty-eight general manager surveys and eighty-six financial manager surveys had been completed. Fifty-six of the eighty-eight surveys from general managers were from factories that had only been surveyed once. The remaining thirty-two surveys were from sixteen factories that had been surveyed twice as part of the longitudinal study.
The general manager (GM) survey contains a wide variety of ques-tions about the amount and type of clothing produced, factory ownership, factory sales, number of employees, concerns about various issues related to production, and any plans for changes in the management or operations of the factory. The financial manager (FM) survey is a much shorter survey that primarily asks about production costs and asset values.
After the GM and FM surveys were matched by factory, they were merged with their compliance data from Better Work. Better Work assesses factories on working conditions at regular intervals. The BW compliance survey consists of 245 questions, which have been grouped into nine clusters:
1. Child Labor – six questions2. Compensation – thirty-seven questions3. Contracts and Human Resources – twenty-three questions4. Discrimination – thirty-six questions5. Forced Labor – seventeen questions6. Freedom of Association and Collective Bargaining – twenty-nine
questions7. Occupational Safety and Health – sixty-three questions 8. Supplier Information – fifteen questions9. Working Time – nineteen questions
All of the questions in the above clusters are binary yes/no questions except for those concerning supplier information. A score of one indi-cates evidence of noncompliance on that measure. In order to link factory level compliance data with the GM and FM survey data, a noncompli-ance score was calculated for each cluster and overall. For example, in the Compensation cluster, if ten of the thirty questions were scored as one (evidence of noncompliance) then that factory on that cluster would have a noncompliance score of .33, meaning that there was evidence that the factory was noncompliant on 33 percent of the compensation-related metrics. The supplier information qualitative questions were not included in these analyses.
173
vol.38:2 summer 2014
energy efficiency and working conditions in vietnamese apparel factories
At the time of this analysis, ninety-eight compliance surveys had been collected and seventy-five were from factories that had been surveyed only once. The remaining surveys were from factories that had been surveyed two or three times. In instances where there were multiple compliance surveys for one factory, the date was matched as closely as possible to the date of the GM and FM surveys. In some cases, that meant that compli-ance data were recorded before the GM and FM data and in other cases data were recorded afterwards. In instances where there was only one set of compliance survey results, it was matched with the corresponding GM and FM survey results regardless of the date.
When all three datasets were merged (i.e. one factory observation includes the FM, GM and BW compliance survey), there were a total of thirteen of the eighty-six factories with GM and FM data that had no compliance data, or factories that had GM and compliance data but no FM data. These two factors reduced the usable sample size to seventy-three. However, from those seventy-three factories, there were eight FM surveys that had unusable information because the FM declined to answer more than two cost-related questions, or because the information they gave indi-cated that more than 90 percent of their costs fell into one category. Thus, the final sample size used for the present analysis was sixty-five from fifty-three unique factories. Twelve of those factories have two observations over time.
Because of the low number of factories with multiple observations, time series analysis would not yield valid or reliable results. Unfortunately, this means that we cannot control for factory specific effects. Therefore, all analyses were performed identically with three different data set versions: first, with all sixty-five observations; second, with all the factories that have one observation only and the first observation of the factories that have two observations; and third, with all the factories that have one observa-tion plus the second observation of the factories that have two observa-tions. Comparing the results in this manner allows us to remove the biased impact of having one factory with multiple observations being counted more than once, and also allows us to see whether there are any noticeable changes over time. The most recent data, however, are those of the last dataset version (all factories with one observation plus second observation of the factories that have two observations), and, unless otherwise noted, all of the data reported are from this dataset.
Additionally, in order to prepare the data for analysis, outliers—defined as values that were three or more standard deviations away from the mean—were removed from the data pertaining to production cost

the fletcher forum of world affairs
vol.38:2 summer 2014
174
questions because there was an unusual amount of variation in those ques-tions. In addition, all questions that were answered with “don’t want to answer” or “don’t know” were excluded from analysis, so as to not skew the mean or distribution of scores.
DESCRIPTIVE STATISTICS
The factories in the sample are extremely diverse in size, measured by number of employees, total annual sales, and output capacity, as shown in Table 1. Not surprisingly, given the relatively recent development of the garment industry in Vietnam, 84 percent of the respondents’ factory build-ings were ten years old or younger. The actual reported costs here reveal that on an average basis, electricity is one of the highest production costs a factory incurs. Note that cost of materials is excluded as there is consider-able variation in how that cost is allocated. Also, the cost of compensation has been excluded because there appeared to be discrepancies in how those data were recorded by interviewers. Without notes from interviewers, it is impossible to tell whether compensation related costs (which should have been reported as an aggregate number for all employees for one quarter in millions of VND) were reported as an aggregate, by person, by hourly or piece rate, in U.S. dollars, VND, or annual terms (e.g. thirty-five of the responses are less than nine, and ten of the responses exceed 2,000).
Table 1: General information (FM and GM survey) *Millions of VND
Mean Standard Deviation Number of responses
Full Employee Count 1,072 1,582 47Total Sales (USD) 3,714,458 8,275,272 38Full Capacity Monthly Output (pieces)
764,849 715,253 51
Oldest Building (years) 9 5 49Net Book Value Machinery * 32,431 34,709 49Cost Electricity* 788 821 53Cost Communication Services* 98 170 53Cost Fuel* 646 1,029 53Cost Transport* 707 1,356 51Cost Water* 103 141 51Cost Rental* 444 566 51
175
vol.38:2 summer 2014
energy efficiency and working conditions in vietnamese apparel factories
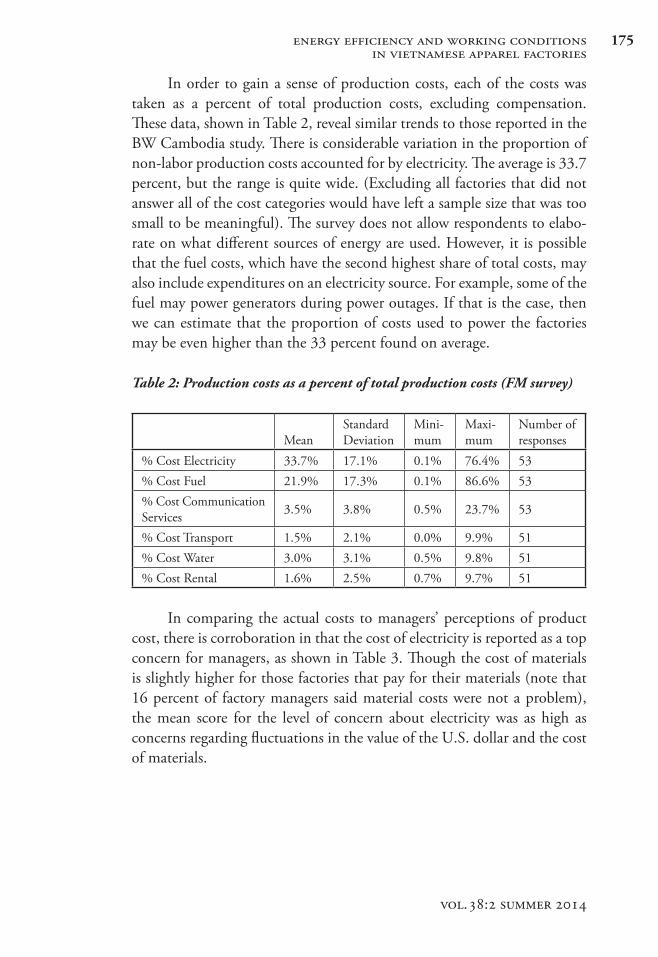
In order to gain a sense of production costs, each of the costs was taken as a percent of total production costs, excluding compensation. These data, shown in Table 2, reveal similar trends to those reported in the BW Cambodia study. There is considerable variation in the proportion of non-labor production costs accounted for by electricity. The average is 33.7 percent, but the range is quite wide. (Excluding all factories that did not answer all of the cost categories would have left a sample size that was too small to be meaningful). The survey does not allow respondents to elabo-rate on what different sources of energy are used. However, it is possible that the fuel costs, which have the second highest share of total costs, may also include expenditures on an electricity source. For example, some of the fuel may power generators during power outages. If that is the case, then we can estimate that the proportion of costs used to power the factories may be even higher than the 33 percent found on average.
Table 2: Production costs as a percent of total production costs (FM survey)
MeanStandard Deviation
Mini-mum
Maxi-mum
Number of responses
% Cost Electricity 33.7% 17.1% 0.1% 76.4% 53% Cost Fuel 21.9% 17.3% 0.1% 86.6% 53% Cost Communication Services 3.5% 3.8% 0.5% 23.7% 53
% Cost Transport 1.5% 2.1% 0.0% 9.9% 51% Cost Water 3.0% 3.1% 0.5% 9.8% 51% Cost Rental 1.6% 2.5% 0.7% 9.7% 51
In comparing the actual costs to managers’ perceptions of product cost, there is corroboration in that the cost of electricity is reported as a top concern for managers, as shown in Table 3. Though the cost of materials is slightly higher for those factories that pay for their materials (note that 16 percent of factory managers said material costs were not a problem), the mean score for the level of concern about electricity was as high as concerns regarding fluctuations in the value of the U.S. dollar and the cost of materials.

the fletcher forum of world affairs
vol.38:2 summer 2014
176
Table 3: Perception of production cost obstacles to business’ success (GM sur-vey, ordered by mean):
Serious problem (1)
Modest problem (2)
Minor problem (3)
Not a problem (4)
Mean score
Number of responses
Materials 50% 30% 4% 16% 1.86 50Dollar Fluctuation 43% 35% 16% 6% 1.86 49Electricity 32% 52% 12% 4% 1.88 50Transportation 28% 45% 22% 6% 2.06 51Water 13% 47% 23% 17% 2.45 47
(Percentages may not add to 100 due to rounding.)
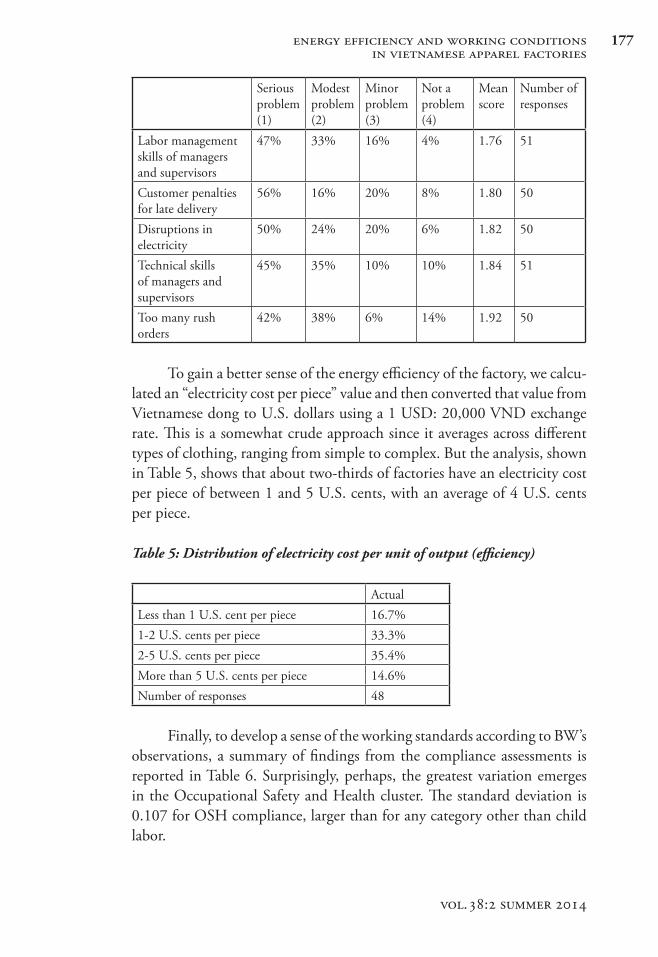
Similarly, if we review production management concerns as shown in Table 4, we see corroboration for claims that there is an emerging labor
shortage in the apparel industry,22 as workers are beginning to migrate toward higher paying jobs in the IT sector. The top four manage-ment concerns about production are the lack of workers (skilled and non-skilled), high turnover, and the low level of skill found in workers. Following closely behind is concern with the disruption in electricity, which is ranked seventh on the list of concerns (based on mean score).
Table 4: Perception of production management obstacles to business’ success (GM survey, ordered by mean)
Serious problem (1)
Modest problem (2)
Minor problem (3)
Not a problem (4)
Mean score
Number of responses
Shortage of skilled workers
67% 22% 8% 4% 1.49 51
Low efficiency rate 68% 18% 8% 6% 1.52 50High workforce turnover
65% 24% 2% 8% 1.53 49
Low skill of workers 63% 24% 10% 4% 1.55 51
The top four management concerns about production are the lack of workers (skilled and non-skilled), high turnover, and the low level of skill found in workers.
177
vol.38:2 summer 2014
energy efficiency and working conditions in vietnamese apparel factories
Serious problem (1)
Modest problem (2)
Minor problem (3)
Not a problem (4)
Mean score
Number of responses
Labor management skills of managers and supervisors
47% 33% 16% 4% 1.76 51
Customer penalties for late delivery
56% 16% 20% 8% 1.80 50
Disruptions in electricity
50% 24% 20% 6% 1.82 50
Technical skills of managers and supervisors
45% 35% 10% 10% 1.84 51
Too many rush orders
42% 38% 6% 14% 1.92 50
To gain a better sense of the energy efficiency of the factory, we calcu-lated an “electricity cost per piece” value and then converted that value from Vietnamese dong to U.S. dollars using a 1 USD: 20,000 VND exchange rate. This is a somewhat crude approach since it averages across different types of clothing, ranging from simple to complex. But the analysis, shown in Table 5, shows that about two-thirds of factories have an electricity cost per piece of between 1 and 5 U.S. cents, with an average of 4 U.S. cents per piece.
Table 5: Distribution of electricity cost per unit of output (efficiency)
ActualLess than 1 U.S. cent per piece 16.7%1-2 U.S. cents per piece 33.3%2-5 U.S. cents per piece 35.4%More than 5 U.S. cents per piece 14.6%Number of responses 48
Finally, to develop a sense of the working standards according to BW’s observations, a summary of findings from the compliance assessments is reported in Table 6. Surprisingly, perhaps, the greatest variation emerges in the Occupational Safety and Health cluster. The standard deviation is 0.107 for OSH compliance, larger than for any category other than child labor.

the fletcher forum of world affairs
vol.38:2 summer 2014
178
Table 6: Better Work noncompliance data:
Mean Standard Deviation
Mini-mum
Maxi-mum
Number of responses
Child Labor .034* .111 .000 .500 53Compensation .062 .057 .000 .278 53Contracts and Human Resources .077 .089 .000 .348 53Discrimination .035 .019 .000 .083 53Forced Labor .001 .008 .000 .059 53Freedom of Association and Collective Bargaining
.147 .052 .069 .345 53
Occupational Safety and Health .236 .107 .050 .517 53Working Time .120 .076 .000 .263 53Overall .116 .046 .048 .264 53
* This result should be interpreted: there was evidence of noncompliance on 3.4% of the child labor related measures.
CORRELATIONS
Standard two-tailed Pearson correlation tests were run with a threshold of p=.20 to cull statistically insignificant relationships, but still allow enough
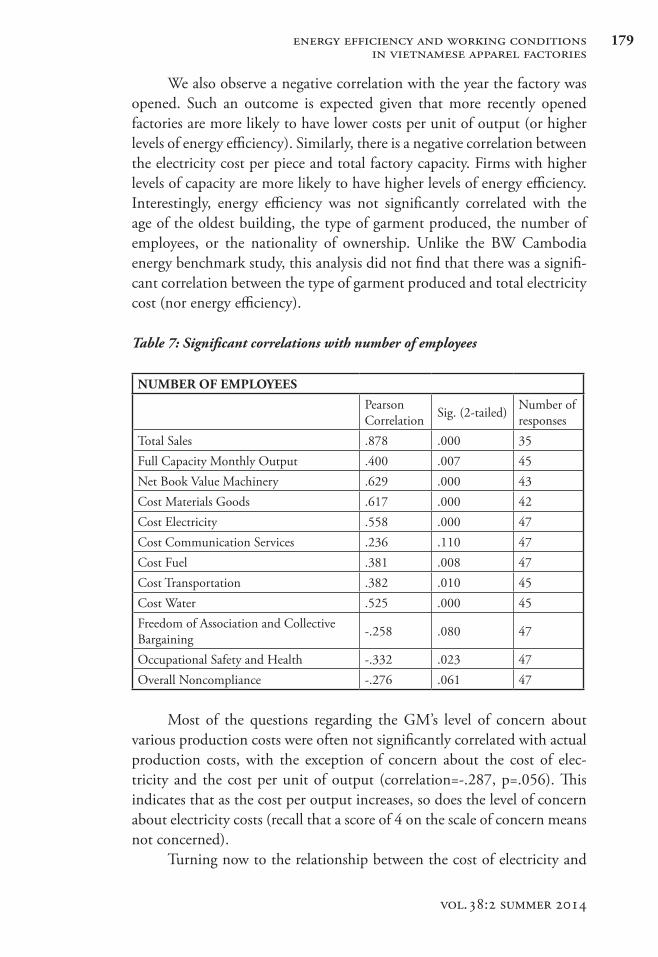
relationships through to identify trends. The correlations with the Number of Employees in a factory, shown in Table 7, are interesting for two reasons. First, they confirm that directionally, the rela-tionships that one would expect to exist in fact do. Namely, there is a statisti-cally significant and positive correlation between the number of employees and the factory’s output, machinery value, and most production costs. Second, they demonstrate that there is a signifi-cant and negative relationship between the number of employees and noncom-pliance, implying that larger facto-ries are likely to have higher levels of
compliance with Better Work standards. The variable Total Sales confirmed similar correlation directions and significance levels with production costs and noncompliance with Better Work standards.
Firms with higher levels of capacity are more likely to have higher levels of energy efficiency. Interestingly, energy efficiency was not significantly correlated with the age of the oldest building, the type of garment produced, the number of employees, or the nationality of ownership.
179
vol.38:2 summer 2014
energy efficiency and working conditions in vietnamese apparel factories
We also observe a negative correlation with the year the factory was opened. Such an outcome is expected given that more recently opened factories are more likely to have lower costs per unit of output (or higher levels of energy efficiency). Similarly, there is a negative correlation between the electricity cost per piece and total factory capacity. Firms with higher levels of capacity are more likely to have higher levels of energy efficiency. Interestingly, energy efficiency was not significantly correlated with the age of the oldest building, the type of garment produced, the number of employees, or the nationality of ownership. Unlike the BW Cambodia energy benchmark study, this analysis did not find that there was a signifi-cant correlation between the type of garment produced and total electricity cost (nor energy efficiency).
Table 7: Significant correlations with number of employees
NUMBER OF EMPLOYEES
Pearson Correlation Sig. (2-tailed) Number of
responsesTotal Sales .878 .000 35Full Capacity Monthly Output .400 .007 45Net Book Value Machinery .629 .000 43Cost Materials Goods .617 .000 42Cost Electricity .558 .000 47Cost Communication Services .236 .110 47Cost Fuel .381 .008 47Cost Transportation .382 .010 45Cost Water .525 .000 45Freedom of Association and Collective Bargaining -.258 .080 47
Occupational Safety and Health -.332 .023 47Overall Noncompliance -.276 .061 47
Most of the questions regarding the GM’s level of concern about various production costs were often not significantly correlated with actual production costs, with the exception of concern about the cost of elec-tricity and the cost per unit of output (correlation=-.287, p=.056). This indicates that as the cost per output increases, so does the level of concern about electricity costs (recall that a score of 4 on the scale of concern means not concerned).
Turning now to the relationship between the cost of electricity and

the fletcher forum of world affairs
vol.38:2 summer 2014
180
working conditions, there is a strong positive correlation, for example, between electricity cost per unit of output and noncompliance with occu-pational safety and health standards, as shown in Table 8. Such an outcome
is consistent with OSH compliance being energy intensive. By contrast, Freedom of Association and Collective Bargaining had a negative correlation between cost per unit of output and noncompliance. Such an outcome could occur if factories optimize by choosing a cost-minimizing minimum compliance configuration. Factories facing higher unit electricity costs may increase profits by substituting away
from energy-intensive points of compliance for less energy-intensive forms of compliance. Factories will engage in such substitution if they believe that they must achieve some minimum compliance index but have some ability to substitute one aspect of compliance for another.
Table 8: Significant correlations with electricity cost per unit of output (efficiency)
ELECTRICITY COST PER OUTPUT
Pearson Correlation
Sig. (2-tailed) Number of responses
Contracts and Human Resources .211 .150 48Forced Labor .835 .000 48Freedom of Association and Collective Bargaining
-.295 .042 48
Occupational Safety and Health .374 .009 48Working Time .192 .192 48Grand Total .264 .070 48Year Opened -.327 .025 47Full Capacity -.206 .160 48
CONCLUSION
In the current study, we have reported evidence that there is a link between energy efficiency and working conditions outcomes in apparel factories in Vietnam. Factories that have lower electricity costs, as measured
Factories facing higher unit electricity costs may increase profits by substituting away from energy-intensive points of compliance for less energy-intensive forms of compliance.
181
vol.38:2 summer 2014
energy efficiency and working conditions in vietnamese apparel factories
by the electricity cost per unit of output, also generally have higher compli-ance as measured by Better Work Enterprise Assessments. (The only excep-tion is the Freedom of Association and Collective Bargaining benchmark).
The relationship between the development of infrastructure and economic growth at the national level has been established in a number of studies.23,24,25 Empirical evidence indi-cates that infrastructure spending and energy efficiency have a positive and statistically significant effect on long-run economic growth.26 We present here, however, evidence that there is a relationship between more efficient, enterprise-level use of energy and posi-tive worker outcomes, suggesting that these sustainable development strategies are complementary. This finding is noteworthy in the context of Vietnam, where electricity costs were, at the time this analysis was conducted, very low and below the long-run marginal cost.
Determining whether the observed relationship between energy effi-ciency and worker outcomes is causal is outside the scope of this analysis. However, this finding of a relationship between better working conditions and energy efficiency is intriguing and invites a variety of future inqui-ries. For example, it is worth examining whether the observed relation-ships hold true in other countries, especially in countries where the cost of electricity to the apparel industry is higher than it is in Vietnam. It is also possible that this relationship may exist in other manufacturing sectors if energy efficiency is, in effect, a proxy for good management.
One way to begin understanding the nature of the relationship between working conditions and energy efficiency is to undertake experi-ments. Efficiency in factories can be increased by providing energy-related technical assistance; its implementation can be staged and monitored closely so that the effects of the intervention on working conditions can be assessed. This kind of experiment can provide tangible benefits to partici-pants and add to knowledge in the field. A comparable triple bottom line effort was undertaken by the United Nations Industrial Development Organization (UNIDO) in India, Pakistan, Sri Lanka, and Thailand and had measurable positive outcomes for environment and company profit-ability. The UNIDO project noted improvements in labor relations and communications within factories, but did not have instruments in place
Factories that have lower electricity costs, as measured by the electricity cost per unit of output, also generally have higher compliance as measured by Better Work Enterprise Assessments.

the fletcher forum of world affairs
vol.38:2 summer 2014
182
to quantify changes in working conditions.27 The Better Work factories (in Vietnam, Cambodia, Haiti, Lesotho, Jordan, Nicaragua, and Indonesia) all of which have quantitative assessments of working conditions in place, offer a venue for testing whether progress toward sustainable development can simultaneously benefit people working in factories, increase company profits and improve use of energy resources. f
The authors gratefully acknowledge Better Work and the Better Work Impact Assessment team at Tufts University. The interdisciplinary Tufts team provided assistance in data cleaning and analytical approaches.
Appendix: Production management obstacles to business’ success
Serious problem
(1)
Modest problem
(2)
Minor problem
(3)
Not a problem
(4)
Mean
Low skill of workers 63% 24% 10% 4% 1.55
Shortage of skilled workers 67% 22% 8% 4% 1.49
High workforce turnover 65% 24% 2% 8% 1.53
Low efficiency rate 68% 18% 8% 6% 1.52
Disruptions in electricity 50% 24% 20% 6% 1.82
Inadequate water supply 33% 24% 20% 22% 2.33
Stress level of supervisors 24% 55% 16% 4% 2.00
Technical skills of managers and supervisors
45% 35% 10% 10% 1.84
Labor management skills of managers and supervisors
47% 33% 16% 4% 1.76
Legal limits on overtime 26% 53% 9% 13% 2.09
Uncertain orders from customers 40% 38% 6% 16% 1.98
Change in technical requirements by the customer after production has begun
40% 38% 13% 10% 1.94
Customers lack knowledge of Vietnamese labor law
31% 29% 29% 12% 2.22
Each customer has its own technical requirements
10% 56% 20% 14% 2.38
Each customer has its own working conditions requirements
16% 53% 12% 18% 2.33
Too many rush orders 42% 38% 6% 14% 1.92

183
vol.38:2 summer 2014
energy efficiency and working conditions in vietnamese apparel factories
Serious problem
(1)
Modest problem
(2)
Minor problem
(3)
Not a problem
(4)
Mean
Customer penalties for late delivery 56% 16% 20% 8% 1.80
Customer penalties for production defects
46% 22% 22% 10% 1.96
Customer requirements for production machinery
10% 47% 20% 22% 2.55
Customer requirements for safety equipment
2% 46% 21% 31% 2.81
Customer requirements for other equipment (such as punch clock, computers, etc.)
4% 39% 18% 39% 2.92
ENDNOTES
1 See Better Work’s website: http://betterwork.org/global/.2 “Garment, textile industry hopeful about Pacific trade” Viet Nam News, August 3, 2013,
<http://vietnamnews.vn/economy/243000/garment-textile-industry-hopeful-about-pacific-trade.html> (accessed April, 2014).
3 World Trade Organization, International Trade Statistics 2010, p. 115, <http://www.wto.org/english/res_e/statis_e/its2010_e/its2010_e.pdf> (accessed May 29, 2014).
4 Khalid Nadvi, John Thoburn, Bui Tat Thang, Nguyen Thi Thanh Ha, Nguyen Thi Hoa, Dao Hong Le and Enrique Armas, “Vietnam in the global garment and textile value chain: impacts on firms and workers,” Journal of International Development 16 (2004): 111–123.
5 Lotte Thomsen, “Accessing global value chains? The role of business–state relations in the private clothing industry in Vietnam,” Journal of Economic Geography 7 (2007): 753–776.
6 Vikas Bajaj, “Fatal Fire in Bangladesh Highlights the Dangers Facing Garment Workers,” The New York Times, November 25, 2012, <http://www.nytimes.com/2012/11/26/world/asia/bangladesh-fire-kills-more-than-100-and-injures-many.html?_r=0> (accessed December 28, 2013).
7 Steven Greenhouse and Stephanie Clifford, “U.S. Retailers Offer Plan for Safety at Factories,” The New York Times, July 10, 2013, <http://www.nytimes.com/2013/07/11/business/global/us-retailers-offer-safety-plan-for-bangladeshi-facto-ries.html?pagewanted=all&_r=0> (accessed July 11, 2013).
8 See for example C. Warren and R. Robertson, Globalization, Wages, and Working Conditions: A Case Study of Cambodian Garment Factories, Center for Global Development Working Paper 257, June 2011, which examines the effect of wages and foreign ownership, and R. Locke and F. Qin, “What Leads to Better Working Conditions in Global Supply Chains: A Case Study of Apparel Factories in China,” Labor and Employment Relations Association Series. Proceedings of the 60th annual meeting January 4–6, 2008, in which the authors compared two factories in the same city working for the same buyer. Working conditions were less harsh in the factory with a more collaborative relationship between the buyer and the plant manager.

the fletcher forum of world affairs
vol.38:2 summer 2014
184
9 S. Bonner, “Utility deregulation begins to generate energy in the apparel industry,” Apparel Industry Magazine 58 (1997): 8.
10 Alexandra Harney, “Bye Bye Cheap Labor,” Far East Economic Review 171 (2) (2008): 29 – 32.
11 Harun Ozturk, “Energy usage and cost in textile industry: A case study for Turkey,” Energy 30 (2005): 2424–2446.
12 Occupational safety and health is both a concept and a set of standards. In the US, there is an enabling law, the Occupational Safety and Health Act, which created the Occupational Safety and Health Administration within the U.S. Department of Labor. National laws related to OSH are in place in all countries in which Better Work has programs.
13 Nguyen Anh Tuan, “A case study on power sector restructuring in Vietnam,” Pacific Energy Summit, 2012 Summit Papers. <http://www.nbr.org/downloads/pdfs/eta/PES_2012_summitpaper_Nguyen.pdf>.
14 Ibid.15 “Vietnam may delay higher power price amid Asia’s worst inflation,” Bloomberg News,
May 31, 2011, <http://www.bloomberg.com/news/2011-05-31/vietnam-may-delay-higher-power-price-amid-asia-s-worst-inflation.html> (accessed May 29, 2014).
16 David Dapice, “Case Study: Vietnam Electricity,” Harvard Kennedy School (2008). <http://userpage.fu-berlin.de/~ballou/fama/vietnam/vnelectricity.pdf>.
17 “Vietnam may delay higher power price amid Asia’s worst inflation,” Bloomberg News, <http://www.bloomberg.com/news/2011-05-31/vietnam-may-delay-higher-power-price-amid-asia-s-worst-inflation.html> (accessed May 29, 2014).
18 “Vietnam’s energy industry is luring foreign investment,” Datamonitor, November 9, 2010, <http://www.datamonitor.com/store/News/vietnams_energy_industry_is_luring_foreign_investment?productid=06A38221-76A8-4F81-87B3-92D6EB305767> (accessed May 29, 2014).
19 Dapice, 2008.20 “Vietnam and Energy,” The World Bank, <http://go.worldbank.org/J25FRKU830>
(accessed May 29, 2014).21 Prime Minister, Socialist Republic of Vietnam, “Approval of the national master
plan for power development for the 2011-2020 period with the vision to 2030,” No. 1208/QD-TTg, Hanoi, July 21, 2011, <http://www.nti.org/media/pdfs/VietnamPowerDevelopmentPlan2030.pdf?_=1333146022> (accessed May 29, 2014).
22 Joosung Lee and Vathana Duong, “Analysis of the Cambodia’s garment industry and catch‐up strategy,” Asian Journal of Technology Innovation 18 (1) (2010): 97-123.
23 Charles Hulten, Esra Bennathan, and Sylaja Srinivasan, “Infrastructure, Externalities, and Economic Development: A Study of the Indian Manufacturing Industry,” The World Bank Economic Review 20(2)(2006): 291–308.
24 Biswa Nath Bhattacharyay, “Infrastructure development for ASEAN economic inte-gration,” Asian Development Bank Institute, ADBI working paper series, no. 138 (2009) <http://hdl.handle.net/10419/53721>.
25 Arup Mitra, Aristomene Varoudakis and Marie-Ange Veganzones-Varoudakis, “Productivity and Technical Efficiency in Indian States’ Manufacturing: The Role of Infrastructure,” Economic Development and Cultural Change 50(2)(2002): 395-426.
26 Deepa Rayan, “Empowerment and Poverty Reduction: A Sourcebook,” The World Bank, 2002, <http://dx.doi.org/10.1596/0-8213-5166-4>.
27 Ralph Luken and Rodney Stares, “Small business responsibility in developing coun-tries: A threat or an opportunity?” Business Strategy and the Environment 14 (1) (2005): 38-53.
Related Documents