ENERGY EFFICIENCY AND RENEWABLE ENERGY RESOURCE DEVELOPMENT POTENTIAL IN NEW YORK STATE Final Report VOLUME SIX: RENEWABLE SUPPLY TECHNICAL APPENDICES Prepared for NEW YORK STATE ENERGY RESEARCH AND DEVELOPMENT AUTHORITY Lawrence J. Pakenas, Project Manager Prepared by OPTIMAL ENERGY, INC. BRISTOL, VT John Plunkett, Project Leader AMERICAN COUNCIL FOR AN ENERGY-EFFICIENT ECONOMY, WASHINGTON, D.C. Anna Shipley, Senior Analyst VERMONT ENERGY INVESTMENT CORPORATION, BURLINGTON, VT David Hill, Renewables Co-Leader CHRISTINE T. DONOVAN ASSOCIATES, STOWE, VT Christine Donovan, Renewables Co-Leader AUGUST 2003

Welcome message from author
This document is posted to help you gain knowledge. Please leave a comment to let me know what you think about it! Share it to your friends and learn new things together.
Transcript

ENERGY EFFICIENCY AND RENEWABLE ENERGY RESOURCE
DEVELOPMENT POTENTIAL IN NEW YORK STATE
Final Report
VOLUME SIX:
RENEWABLE SUPPLY TECHNICAL APPENDICES
Prepared for
NEW YORK STATE ENERGY RESEARCH AND DEVELOPMENT AUTHORITY Lawrence J. Pakenas, Project Manager
Prepared by
OPTIMAL ENERGY, INC. BRISTOL, VT
John Plunkett, Project Leader
AMERICAN COUNCIL FOR AN ENERGY-EFFICIENT ECONOMY, WASHINGTON, D.C.
Anna Shipley, Senior Analyst
VERMONT ENERGY INVESTMENT CORPORATION, BURLINGTON, VT
David Hill, Renewables Co-Leader
CHRISTINE T. DONOVAN ASSOCIATES, STOWE, VT
Christine Donovan, Renewables Co-Leader
AUGUST 2003

NOTICE
This report was prepared by Optimal Energy, Inc. in the course of performing work contracted for and sponsored by the New York State Energy Research and Development Authority (hereafter “NYSERDA”). The opinions expressed in this report do not necessarily reflect those of NYSERDA, or the State of New York, and reference to any specific product, service, process, or method does not constitute an implied or expressed recommendation or endorsement of it. Further, NYSERDA, the State of New York, and the contractor make no warranties or representations, expressed or implied, as to the fitness for particular purpose of merchantability of any product, apparatus, or service, or the usefulness, completeness, or accuracy of any processes, methods, or other information contained, described, disclosed, or referred to in this report. NYSERDA, the State of New York, and the contractor make no representation that the use of any product, apparatus, process, method, or other information will not infringe privately owned rights and will assume no liability for any loss, injury, or damage resulting from, or occurring in connection with, the use of information contained, described, disclosed, or referred to in this report.

Volume 6: Renewable Supply Technical Appendices
List Of Tables
6.1 Technology Selection Tables 6.1.1 Summary Table 6.1.2 Biopower Technology Selection 6.1.3 Fuel Cells Technologies Selection 6.1.4 Hydroelectric Technologies Selection 6.1.5 Landfill Gas (LFG) to Electricity Technologies Selection 6.1.6 Municipal Solid Waste (MSW) to Electricity Technologies Selection 6.1.7 Photovoltaics Technologies Selection 6.1.8 Solar Thermal Technologies Selection 6.1.9 Wind Energy Technologies Selection 6.1.10 Wind Energy Technologies Not Recommended for Analysis 6.2 Screening Tool Input Definitions 6.3 Screening Inputs and Documentation 6.3.1 Biopower Inputs Table 6.3.2 Fuel Cells Inputs Table 6.3.3 Hydropower Inputs Table 6.3.4 Landfill Gas Inputs Table 6.3.5 Municipal Solid Waste Inputs Table 6.3.6 Photovoltaics Inputs Table 6.3.7 Solar Thermal Inputs Table 6.3.8 Wind Inputs Table
6.4 Achievable market penetration and administrative costs 6.4.1 Renewable Base Case Penetrations 6.4.2 Reference Table for Currently Planned Initiatives (Word Document) 6.4.3 Reference Table for Greenhouse Gas Initiatives (Word Document) 6.4.4 Administrative Adders for CPI scenarios 6.4.5 Administrative Adders for GHG scenarios
6.5 Results 6.5.1 Renewable Technical Potential - New York Statewide by Resource and Technology 6.5.2 Renewable Technical Potential - New York Zone A by Resource and Technology 6.5.3 Renewable Technical Potential - New York Zone F by Resource and Technology 6.5.4 Renewable Technical Potential - New York Zone G by Resource and Technology 6.5.5 Renewable Technical Potential - New York Zone J by Resource and Technology 6.5.6 Renewable Technical Potential - New York Zone K by Resource and Technology 6.5.7 Renewable Economic Potential Savings Statewide High Avoided Costs by Resource and Technology 6.5.8 Renewable Economic Potential Savings Statewide Low Avoided Costs by Resource and Technology 6.5.9 Renewable Economic Potential Savings Zone A, Zone A Avoided Costs, by Resource and Technology 6.5.10 Renewable Economic Potential Savings Zone F, Zone F Avoided Costs, by Resource and Technology 6.5.11 Renewable Economic Potential Savings Zone G, Zone G Avoided Costs, by Resource and Technology 6.5.12 Renewable Economic Potential Savings Zone J, Zone J Avoided Costs, by Resource and Technology 6.5.13 Renewable Economic Potential Savings Zone K, Zone K Avoided Costs, by Resource and Technology

Section 1:
RENEWABLE ENERGY RESOURCE
TECHNOLOGY SELECTION TABLES
These tables provide information on the technology types and installation scales included in the
NYSERDA Renewable Energy Technology Assessment. The summary table presents the proposed
technology and scales to be included in the analysis for each renewable energy resource and is followed by
a detailed table for each technology. The detailed tables include the rationale for recommending each scale
and technology in the analysis, and also list the technologies and scales not recommended and the rationale
for their exclusion.
The following criteria were considered in developing the tables:
• The potential contribution of each technology type and installation scale to New York’s energy supply over the next 20 years;
• The extent to which each technology type and installation scale is commercially available in the
U.S. and abroad;
• The cost-effectiveness of each technology type and installation scale;
• Strategic advantages as they relate to technology advances and New York’s renewable resources and market segments;
• The relative degree of market acceptability of each technology type and installation scale; and
• The existing and potential regulatory and market barriers to increased renewable energy
technology development and use.
Table 6.1.1 Summary Table
Renewable Resource Technology Scale to be Analyzed
Biomass Cofiring w/ Coal 10 MW
Gasification / Advanced Gasification after 2010 15 MW
Customer-Sited Combined Heat and Power (CHP) 1-5 MW
Fuel Cells Proton Exchange Membrane (PEM) 5-10 kW Phosphoric Acid (PAFC) 200 kW Solid Oxide (SOFC) 200-250 kW Molten Carbonate (MCFC) 250-2000 kW Hydro Repowering/Efficiency
Improvements at Existing Sites
5 MW+
Volume 6 Renewable Supply Technical Appendices 6-1

Additional Capacity at Existing Hydroelectric Site
5 MW+
Creation of new hydroelectric
capacity at existing dams (w/out hydro in place)
Mini (10kW - 100kW) Small (100 kW-5000 kW) Medium (5MW - 50 MW)
Large (50 MW +) Construction of entirely new
dam sites
Mini (10kW - 100kW) Small (100 kW-5000 kW) Medium (5MW - 50 MW)
Large (50 MW +) Landfill Gas Combustion Turbines 3-15 MW Internal Combustion Engines 400 kW –5 MW Microturbines 30-800 kW Municipal Solid Waste
Large Mass Burn/RDF Steam Generators
> 250 TPD
Small Mass Burn/RDF Steam Generators
< 250 TPD
Anaerobic Digestion To be determined Photovoltaics Grid-connected residential PV retrofit and
new constructions 3 kW
Energy/Capacity-maximizing, grid-connected, user-sited commercial/industrial PV. Will include systems with solar load control.
200 kW
Envelope cost tradeoff-maximizing grid-connected, user-owned commercial/industrial PV.
50 kW
Solar Thermal Solar water heating residential 32 – 128 sq. ft. Solar water heating commercial 320 – 2,000 sq. ft. Solar pre-heating of ventilation air 10,000 – 50,000 sq. ft. Solar Absorption Cooling 4,000 – 50,000 sq. ft. Wind Horizontal axis, grid-connected wind
turbines designed for use in wind farm arrays.
10 – 50 wind turbines rated at 600kW – 1.5MW output per machine.
Horizontal axis, grid-connected wind turbines designed for use in small cluster installations.
2 – 10 wind turbines rated at 600kW – 1.5MW output per machine.
Small-scale wind turbines designed for use on residences, farms, villages, and remote sites. These systems can also serve small commercial and industrial facilities.
Stand-alone wind turbines rated at 1kW – 300kW output per machine.
Horizontal axis, grid-connected wind turbines designed for use in offshore installations
1-20 wind turbines rated at 1-3 MW output per machine
Volume 6 Renewable Supply Technical Appendices 6-2

Table 6.1.2 Biopower Technologies Selection Technology Type To be Analyzed
Scale
Rationale for Including
Customer-Sited CHP 1-5 MW Industrial fuel uses important today. Customer-sited CHP applications may play a more important role in the future.
Cofiring w/ Coal 10 MW
Cofiring represents a proven, low capital cost option for near-term introduction of Biopower. Cofiring directly displaces coal generation. Regulatory and market barriers are being overcome in some states.
Gasification / Advanced Gasification after 2010
15 MW
At the expense of high capital costs, offers the promise of high efficiencies and low emissions. In AEO projections, EIA bases all “new-build” direct-fired biopower capacity on gasification.
Technologies Not Selected for Analysis
Scale Rationale for Excluding
Direct Fire, Stand Alone Wood Fired Power Plants (similar to those built in 1980’s and early 1990’s)
20 MW
New power plants of this type and scale are not expected during the next 20 years. Co-firing and gasification more likely, due to a variety of market and environmental issues.
Co-firing Gasified Biomass with Natural Gas or Coal
10 MW
In early development stages. However, it is noted that this technology could offer two benefits: 1) Overall environmentally superior performance in comparison to co-firing solid biomass with coal, and 2) Natural gas prices are more volatile than coal prices; therefore, the option to co-fire is potentially more valuable at a natural gas facility. These benefits must be traded off against the high cost of gasification.
Small Modular Biopower
250 kW- 1 MW
Very low market penetration (in terms of MW) expected due to high unit costs and small application size. Technologies are still in developmental stages for applications that do not involve digesters.
Bioliquids to Power To be determined
Emerging technologies and emerging markets. A Technology Description will be prepared for this study, but bioliquids to power will not be included in the full analysis for this study.
Animal Manure Digesters
To be determined
Federal and state farm methane initiatives are underway. Mostly customer-sited, very small energy systems. A Technology Description will be prepared for this study, but animal manure digesters will not included in the full analysis for this study.
Volume 6 Renewable Supply Technical Appendices 6-3

Table 6.1.3 Fuel Cells Technologies Selection Technology Type to be Analyzed
Scale to be Analyzed Rationale for Including
Proton Exchange Membrane (PEM) 5-10 kW
This technology will most likely arise as the dominant technology for the residential and small commercial sectors. The operating temperatures for PEM cells are low, and can be used with or without heat recovery. The low temperatures would allow for residential-grade water heating, but are too low for producing high-quality steam. Several manufacturers have introduced demonstration and field trial units with this technology in this size.
Phosphoric Acid (PAFC) 200 kW
200 kW Phosphoric Acid is the technology that has been utilized in the only commercialized fuel cell product to date. The technology was first introduced into the commercial market by International Fuel Cells/ONSI (now called UTC Fuel Cells), and has over 200 installed units worldwide (including Times Square and Central Park Police Station). This technology lends itself to commercial and small industrial applications, and is a good candidate for combined heat and power (CHP). The technology remains expensive relative to other distributed generation technologies, but running the units with heat recovery makes the economics more favorable.
Solid Oxide (SOFC) 200-250 kW
Solid Oxide fuel cells in this size range will compete with the currently commercialized Phosphoric oxide fuel cells in the commercial and small industrial market. SOFC will be used only in facilities with high heating loads such as internet data centers and industrial manufacturing facilities. This technology can be operated at high enough temperatures (~600 F) to eliminate the use of a fuel reformer. This may eventually give this technology a competitive advantage over PAFCs.
Molten Carbonate (MCFC) 250-2000 kW
This technology is attractive because it does not require a fuel reformer. Direct fuel cells can be operated on many types of hydrogen-rich fuel. The direct fuel cell systems operate at higher temperatures than many technologies - this makes the technology an excellent candidate for heat recovery and steam generation in industrial applications. The industrial and large commercial building market will be where this technology will primarily take hold. This technology is currently in field trials and demonstrations.
Volume 6 Renewable Supply Technical Appendices 6-4

Technologies Not Selected for Analysis Scale Rationale for Excluding
Alkaline 10-100 kW
While this technology has been utilized successfully in aerospace applications, it does not seem to have great potential for stationary applications. Few manufacturers are exploring alkaline fuel cells.
Proton Exchange Membrane (PEM) 0.025-0.5 kW
This size range is most applicable to residential back-up applications. This market is very small, and the high costs of these systems would prohibit their penetration into all but the smallest high-end residential customer segment.
Proton Exchange Membrane (PEM) 100-250 kW
PEM fuel cells in this size range will be most attractive as power generation in commercial facilities with low or inconsistent heating loads. Commercial facilities requiring high-reliability power would be the market for this technology. Several manufacturers are demonstrating units. Units of this size will have to compete with existing commercialized PAFC's and will most likely have difficulty entering the marketplace.
Solid Oxide (SOFC) 5-10 kW
This size class is most suited to residential and small commercial customers. The high operating temperatures of these cells would require heat recovery to be viable. The majority of residential and small commercial customers do not have appropriate heat requirements to allow this technology to be operated optimally.
Volume 6 Renewable Supply Technical Appendices 6-5

Table 6.1.4 Hydroelectric Technologies Selection Technology Type To be Analyzed Scale Rationale for Including
Repowering/Efficiency Improvements at Existing Hydroelectric Dams
5 MW+
Major focus on repowering existing, older dams throughout the US. Such incremental improvements are very cost-effective. Substantially less opposition to improving existing sites than developing new ones.
Adding Capacity at Existing Hydroelectric Dams
5 MW+
Cost effective. Less opposition than developing new sites.
New Hydroelectric Capacity at Existing Dams (with no electric capacity)
10 -100
kW 100-5000
kW 5-50 MW
Resource data available, technology commercially available.
Construction of New Hydroelectric Sites at New Dams
10 – 100
kW 100-5000
kW 5-50 MW
Resource data available, technology commercially available.
Technologies Not Selected for Analysis Scale Rationale for Excluding
New Micro Hydroelectric Capacity at Existing Dams (with no electric capacity in place)
< 10 kW
Resource data not available, total impact on NY grid minimal.
Construction of New Micro Hydroelectric Sites at New Dams
< 10 kW
Resource date not available, total impact on NY grid minimal.
Pumped Storage at New Sites
50 MW+
Net electricity consumer.
Volume 6 Renewable Supply Technical Appendices 6-6

Table 6.1.5 Landfill Gas (LFG) to Electricity Technologies Selection Technology Type To be Analyzed Scale Rationale for Including
Combustion Turbines
3-15 MW
Proven, reliable, cost-effective. Captures high range of production.
Internal Combustion Engines
400 kW –
5 MW
Proven, reliable, cost-effective. Captures mid-range of production.
Microturbines
30-800 kW
Very promising technology. Commercially available. Captures low-range of production.
Technologies Not Selected for Analysis
Scale Rationale for Excluding
Steam-cycle or Combined Cycle Combustion/Steam Turbine
> 10 MW
Very large scale, with few if any possible sites in New York.
Fuel Cells
Variable
LFG clean-up technology not expected to be cost-effective over the next 20 years.
Volume 6 Renewable Supply Technical Appendices 6-7

Table 6.1.6 Municipal Solid Waste (MSW) to Electricity Technologies Selection Technology Type To be Analyzed Scale Rationale for Including
Large Mass Burn/RDF Steam Generators
> 250 TPD*
Proven, reliable, cost-effective. Captures high range of production. In U.S. EPA large facility emissions category.
Small Mass Burn/RDF Steam Generators
< 250 TPD
Proven, reliable, cost-effective. Captures small range of production. In U.S. EPA small facility emissions category.
anaerobic Digestion (Producing Methane for Electricity Production)
Variable
Economic viability not yet proven, but new facilities are being built and further progress is expected during the next 20 years.
Technologies Not Selected for Analysis
Scale Rationale for Excluding
Plasma Arc Processing
25 TPD
Economic viability not yet proven.
Pyrolysis
50 TPD
Technical, economic viability not proven. Considered by some to be a failed technology.
TPD: Tons Per Day of Fuel
Volume 6 Renewable Supply Technical Appendices 6-8

Table 6.1.7 Photovoltaics Technologies Selection Technology Type To be Analyzed Scale Rationale for Including
Grid-connected residential PV retrofit and new constructions
3-kW
Scale is moderately above the current tax credit ceiling and reflects trends observed with the LIPA program net-metering, buy down, tax credit, low interest financing, possible UPS functionality, plus mortgage financing and possible replacement value for new construction.
Energy/Capacity-maximizing, grid-connected, user-sited commercial/industrial PV. Two sub-categories will be considered: (1) PV-alone systems (2) systems equipped, or benefiting from solar load control.
200 kW
Scale is substantially above current buy-down ceiling from NYSERDA, but more reflective of national industry trends. Favorable user-side economics, possible demand reduction, enhanced UPS, plus, for new constructions, possible building envelope tradeoffs. Applicable in user-owned, retrofit and new construction markets. Considered deployments to include roofs, parking lots and other exclusion zones.
Envelope cost tradeoff-maximizing grid-connected, user-owned commercial/industrial PV.
50 kW
Sizeable envelope cost tradeoffs, user-side economics, possible future green power market opportunities Principally market new construction. Applications to include vertically mounted systems as replacement for glazing or cladding. Smaller scale than option 2 reflects the lower efficiencies associated with glazing systems.
Technologies Not Selected for Analysis Scale Rationale for Excluding
Dedicated utility/ESCO/investor-owned PV power plants
500 kW
Tough competition from wind for green power market in the immediate future. Although solar advantages (location, peak shaving, higher environmental value) may materialize in the future. For now, it was thought that these applications could be treated as part of Selection No.2
Remote residential 1-5 kW Little impact on NY's electric grid, as competing approach for this market is not likely to be line extension but another form of onsite generation
Load dedicated remote applications (e.g., communication, lighting, pumping, etc..)
0.05-5 kW As above, little impact on the electric grid
Remote micro-grid / village electrification 10-100 kW Few opportunities for this type of application in New
York State Load-specific grid-backed-up applications (e.g., DC lighting)
5-100 kW Specialized niche, linked to success of dc lighting (lighting load must exceed PV), a possible contender for the future
Volume 6 Renewable Supply Technical Appendices 6-9

Table 6.1.8 Solar Thermal Technologies Selection Technology Type To be Analyzed Scale Rationale for Including
Solar water heating residential
32 – 128 sq. ft. flat plate collectors
Good potential for reducing solar electric hot water loads
Solar water heating commercial
320 – 2,000 sq. ft. flat plate collectors
Good potential for reducing solar electric hot water loads
Solar pre-heating of ventilation air
1,000 – 50,000 sq. ft. transpired unglazed collector
Cost effective in applications with large pre-heat ventilation loads and appropriate exposures. Manufacturer located in NYS.
Solar Absorption Cooling
4,000 – 50,000 sq. ft. evacuated tube collectors
Commercialized systems available, potential for reduced peak coincident cooling loads.
Technologies Not Selected for Analysis Scale Rationale for Excluding
Solar Thermal Electric Generating Systems 10s MW Excluded at proposal stage.
Volume 6 Renewable Supply Technical Appendices 6-10

Table 6.1.9 Wind Energy Technologies Selection Technology Type to be Analyzed
Installation Scale to be Analyzed
Rationale for Including
1. Horizontal axis, grid-connected wind turbines designed for use in windfarm arrays.
10 – 50 wind turbines rated at 600kW – 1.5MW output per machine.
Economies of scale, ongoing design advances, increasing capacity factors, and extensive operating experience are major factors in making windfarm installations the most cost effective configuration for developing sites with suitable wind resources. The wind turbine systems applicable to this category are commercially available from a number of manufacturers in the U.S., Europe, and Japan. Installed costs in this category are in the range of $900/kW – $1200/kW depending on windfarm size and site factors.
2. Horizontal axis, grid-connected wind turbines designed for use in small cluster installations.
2 – 10 wind turbines rated at 600kW – 1.5MW output per machine.
Also known as distributed systems, cluster installations represent an emerging market and a level of cost effectiveness second only to windfarms. Falling in the range of $1200 – $1500/kW, installed capital costs are generally higher for cluster installations than those of windfarms, but interconnect costs can be significantly less costly due to lower interconnect voltages. Cluster installations require less geographic area than windfarms – an important advantage for regions of New York that have large wind resources but limited suitable land area (e.g., ridge locations). Cluster installations are also well suited to small, separately owned land parcels that may be difficult to aggregate into tracts large enough to support large windfarms. As with windfarm installations, wind turbine systems applicable to this category are commercially available from a number of manufacturers in the U.S., Europe, and Japan.
Volume 6 Renewable Supply Technical Appendices 6-11
Technology Type to be Analyzed
Installation Scale to be Analyzed
Rationale for Including
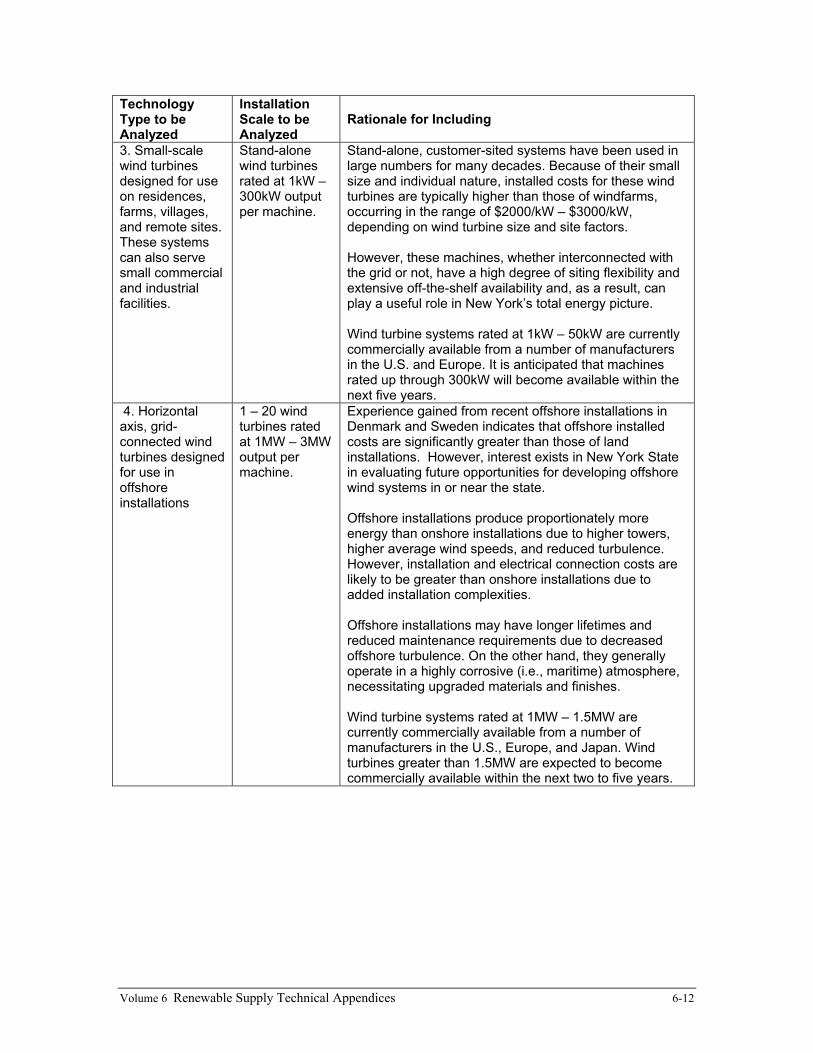
3. Small-scale wind turbines designed for use on residences, farms, villages, and remote sites. These systems can also serve small commercial and industrial facilities.
Stand-alone wind turbines rated at 1kW – 300kW output per machine.
Stand-alone, customer-sited systems have been used in large numbers for many decades. Because of their small size and individual nature, installed costs for these wind turbines are typically higher than those of windfarms, occurring in the range of $2000/kW – $3000/kW, depending on wind turbine size and site factors. However, these machines, whether interconnected with the grid or not, have a high degree of siting flexibility and extensive off-the-shelf availability and, as a result, can play a useful role in New York’s total energy picture. Wind turbine systems rated at 1kW – 50kW are currently commercially available from a number of manufacturers in the U.S. and Europe. It is anticipated that machines rated up through 300kW will become available within the next five years.
4. Horizontal axis, grid-connected wind turbines designed for use in offshore installations
1 – 20 wind turbines rated at 1MW – 3MW output per machine.
Experience gained from recent offshore installations in Denmark and Sweden indicates that offshore installed costs are significantly greater than those of land installations. However, interest exists in New York State in evaluating future opportunities for developing offshore wind systems in or near the state. Offshore installations produce proportionately more energy than onshore installations due to higher towers, higher average wind speeds, and reduced turbulence. However, installation and electrical connection costs are likely to be greater than onshore installations due to added installation complexities. Offshore installations may have longer lifetimes and reduced maintenance requirements due to decreased offshore turbulence. On the other hand, they generally operate in a highly corrosive (i.e., maritime) atmosphere, necessitating upgraded materials and finishes. Wind turbine systems rated at 1MW – 1.5MW are currently commercially available from a number of manufacturers in the U.S., Europe, and Japan. Wind turbines greater than 1.5MW are expected to become commercially available within the next two to five years.
Volume 6 Renewable Supply Technical Appendices 6-12

Table 6.1.10 Wind Energy Technologies Not Recommended for Analysis Technology Type Not to be Analyzed
Installation Scale to be Analyzed
Rationale for Not Including
1. Small-scale wind turbines combined with other energy generation sources to provide utility-grade power to residences, farms, villages, remote sites, and small commercial and industrial facilities.
Stand-alone wind turbines rated at 1kW – 300kW output per machine used in combination with other energy generation sources.
Often called “hybrid” systems, these systems combine wind turbine systems with one or more of the following energy generation sources: photovoltaic systems, micro-hydroelectric systems, fuel cells, or fossil fuel-based sources (e.g., diesel generators). These multi-source systems generally have a high degree of siting flexibility and possess the added capability of providing voltage support and reactive power to utility systems, particularly near termination points of long power distribution networks. Due to their combined power sources (and resultant enhanced power delivery reliability) and the fact that hybrid systems are optionally grid-connected, these systems are particularly well suited to remote locations. Hybrid systems are necessarily more complex than non-hybrid wind turbines and, as a result, are generally more costly to operate and maintain. Increased system complexity may also increase the likelihood of sub-system failures. Depending on system configuration, installed costs and maintenance costs of hybrid systems can exceed two times that of non-hybrid wind turbines. Wind/diesel and wind/PV hybrid systems have been in use for a number of years and are commercially available in the U.S. and abroad. Other hybrid combinations are still in development and anticipated to be commercially available within the next five to ten years.
Volume 6 Renewable Supply Technical Appendices 6-13

Volume 6 Renewable Supply Technical Appendices 6-14

Section 2:
DEFINITION OF RENEWABLE TECHNOLOGY SCREENING INPUTS
This section provides definitions used by the renewable energy experts in completing their analysis and
preparing Cost-effectiveness Screening Tool Inputs for the renewable potential assessments. The following
definitions are presented in order of the format used in the Appendix Tables 6.3.1 to 6.3.8 which document
the specific inputs for each renewable technology.
MEASURE NAME/ZONE SCENARIO
Measure Name (column A): Identifies the renewable resource measure under consideration. Already
completed.
Resource (column B): Code to identify renewable resource group. Already completed.
Zone (column C): Identifies the geographic scope for each line in the input template, options are statewide
or one of five discrete load control zones. Note that the five load zones selected for detailed analysis by
NYSERDA do not represent the whole state, and therefore the sum of five load zones is not necessarily
equal to the statewide number.
Scenario (column D): Each renewable expert/team is providing inputs for four scenarios. Partial inputs
for the technical potential scenario were already provided and are entered into this template. Additional
inputs are required to complete the technical potential scenario, the base case, the currently planned
initiatives (CPI), and the greenhouse gas reductions (GHG) scenarios. The input cells for each scenario are
color coded as follows: technical potential (light blue), base case (light green), CPI (yellow), and GHG
(pumpkin).
CURRENT TECHNOLOGY COSTS AND OUTPUTS:
Technology Life (column E): The expected mean productive field life (in years). Note that technology life
is not expected to vary by zone (blacked out cells), nor by scenario (gray cells) although if there is reason to
expect a change by scenario, values in the gray cells may be overwritten.
Total Installed Cost (column F): The turnkey cost for the system type and scale defined in column A.
These costs are to be reported in terms of 2003 $/kW of installed capacity. The total installed costs are to
include all costs associated with the project specific development, installation, and commissioning of a
system. Any recurring costs are to be accounted under O&M costs (column S). Financing costs are not to
be included in installed or O&M cost inputs.
Volume 6 Renewable Supply Technical Appendices 6-15

The components of installed costs vary by technology. Where applicable, the total installed cost estimate
shall include the initial capital costs for: permitting, land acquisition, site preparation and construction, all
capital equipment (including distribution, protection, and monitoring), and commissioning.
Annual kWh produced (column G): The expected mean annual kWh/kW output from the system. This
includes output available to meet the producer's non-system loads and output available to the point of
common coupling with the utility. The renewable experts are not required to distinguish between the share
of output consumed on the customer’s side of the meter and the share provided to the utility grid. Note that
energy output is reported in kWh/kW of installed capacity.
Energy Coincidence Factors (columns H – M): The percent of annual kWh output expected in each of
the six identified periods. Summer On-Peak (Jun - August, weekdays noon - 6 pm), Summer Off-Peak
(June - August - midnight to 8am weekdays, all weekend hours June - August, and May, Sept and Oct all
hours), Summer Shoulder (weekdays June - August - 8am to noon and 6pm to midnight.), Winter On-Peak
(Winter On-Peak is Dec-Feb weekdays noon to 8 pm.), and Winter Off-Peak (Dec-Feb - midnight to 8 am,
all weekend hours, and March April, and November all hours), and Winter Shoulder (weekdays Dec- Feb -
8 am - noon and 8pm – midnight). The sum of the percentages shall add to 100% (This is calculated, for a
check, in column N).
Energy coincidence factors will depend upon the renewable resource temporal and spatial distribution and
the dispatchability of the technology output. Note that Energy Coincidence Factors entered for at the
Statewide level are assumed to apply to each of the five zones, unless the gray cells are overwritten.
Capacity Coincidence Factors (columns O – P): The average percent of installed capacity output
expected to be available in the two identified periods Summer On-Peak (Jun - August, weekdays noon - 6
pm.) and Winter On-Peak (Weekdays Dec-Feb noon to 8 pm). Each of these values will be between 0 and
100%, the numbers are independent, and the sum does not need to add to 100%. Capacity coincidence
factors will depend upon the temporal and spatial distribution of the renewable resource and the
dispatchability of the technology.
Fossil Fuel Type and Fossil Fuel Usage (columns Q-R): Where applicable, the type and annual
consumption (MMBtu) of fossil fuel consumption for the system. Fuel types are: residential oil,
commercial oil, industrial oil, residential natural gas, commercial natural gas, industrial natural gas, and
Volume 6 Renewable Supply Technical Appendices 6-16

steam. Use the following codes for inputs in Column Q, 1 = Res Oil, 2 = Com Oil, 3 = Indust Oil, 4 = Res
Gas, 5 = Com Gas, and 6 = Ind Gas.
Real Levelized Operations and Maintenance (column S, and AA through AC): The inputs for these
cells will be calculated by using the “O&M Inputs Template” Worksheet. They represent the annual and
periodic costs associated with each technology.
The components of O&M costs will vary by technology. The renewable experts will provide a profile of
annual and periodic O&M costs. O&M costs should include: labor, fuel expenses, land or resource
acquisition costs, preventative maintenance, labor and capital for system component replacements. The
technology experts shall not be required to specify the line item cost for each component listed in the O&M
cost profile.
MARKET PENETRATIONS
Installed Capacity (columns T-W): The estimated potential for installed capacity (kW) in 2003, 2007,
2012, and 2022. These estimates shall be provided statewide, and for each of the five load control zones.
FUTURE COSTS AND TECHNOLOGY OUTPUTS
Future Installed Costs (columns X - Z): Projected turnkey installed costs (using 2003 $) in 2007, 2012,
and 2022. The same cost components used for estimating current installed costs (in column F) shall be
incorporated in estimates of future costs.
Future O&M Costs (columns AA-AC): Projected O&M costs (levelized 2003$) for systems that will be
installed in 2007, 2012, and 2022. The components used to estimate future O&M costs shall be consistent
with those used to estimate current O&M costs (column S). The “O&M Inputs Template” Worksheet shall
be used to calculate the inputs for AA-AC.
Future Technology Output (columns AD-AF): Projected annual output (kWh/kW installed) in 2007,
2012, and 2022. There is assumed to be no change from the value entered in column G, unless the gray
cells are overwritten. Two examples of how the technology output (kWh/kW installed) could increase over
time is wider operating ranges for wind turbines (lower cut-in and higher cut-out speeds) or repowering of
existing hydro facilities.
Volume 6 Renewable Supply Technical Appendices 6-17

Section 3:
SCREENING INPUT AND DOCUMENTATION TABLES
Table 6.3.1 Biopower Inputs Table 6.3.2 Fuel Cells Inputs Table 6.3.3 Hydropower Inputs Table 6.3.4 Landfill Gas Inputs Table 6.3.5 Municipal Solid Waster Inputs Table 6.3.6 Photovoltaics Inputs Table 6.3.7 Solar Thermal Inputs Table 6.3.8 Wind Inputs The Section 3 tables listed above are found at the end of Volume 6 in numerical order.
Volume Six Renewable Supply Technical Appendices 6-19

Section 4:
ACHIEVABLE MARKET PENETRATION AND ADMINISTRATIVE COSTS
Table 6.4.1 Technology Characteristics Table 6.4.4 Administrative Adders for CPI Scenarios Table 6.4.5 Administrative Adders for CHG Scenarios The Section 4 tables listed above are found at the end of Volume 6 in numerical order.
CURRENTLY PLANNED INITIATIVES & GREENHOUSE GAS REDUCTION TARGET
SCENARIOS
CURRENTLY PLANNED INITIATIVES SCENARIO
Table 6.4.2 summarizes the programs and policies that should be considered when providing renewable
electricity and cost estimates under the CPI scenario.
The policy and program supports include NYSERDA’s expected funding through June of 2006, and NYPA
and LIPA programs through June of 2004. NYSERDA funding for renewable energy is expected to be at
least $77 million.1 LIPA’s funding for renewable energy in currently planned initiatives is approximately
$14 million.2 NYPA plans include more than $560 million of renewable funding through 2013. The
majority of the NYPA funding will be used to extend the life and modernize the St. Lawrence and Niagara
hydropower projects, with additional plans to support fuel cells, landfill gas generation, photovoltaics and
wind. In addition to the direct funding to be provided by these agencies, Table 1 also identifies important
existing state and federal policies expected to influence the cost and deployment of renewable energy
resources. New York State Executive Order No. 111, the Green Buildings Tax Credit, the Federal 2002
Farm Bill, and Net Metering are examples of the policies listed.
Table 6.4.2 matches currently planned initiatives and policies with the renewable resources most likely to
be impacted, summarizes the level and duration of each initiative, and provides references (in many cases
in the form of an internet link).
1 “Table 3: 2001-2006 New York Systems Benefits Charge Funding for Renewable Energy”, New York State Energy Plan. Page 3-49. Note however, that many renewable technologies are eligible for support through other SBC initiatives (e.g. green buildings, secure generation, combined heat and power). Assuming that modest shares (ranging from 10% to 25%) of funding from other selected SBC programs will go to support renewable energy increases the total renewable funding to ~ $105 million, or an average of $21 million/year. 2 Including spending on the Solar Pioneer, and renewable R&D projects through June 2004.
Volume Six Renewable Supply Technical Appendices 6-21

Volume Six Renewable Supply Technical Appendices 6-22
Table 6.4.2 Currently Planned Policy and Program Initiatives
#
Renewable Resources Impacted
Level & Duration Notes References
Green Power Marketing 1 Green Power marketing
incentives and support for Renewable Energy Credit Accounting and Trading System Environmental Disclosure
Potential impacts on biopower, hydro, LFG, MSW, PV, and wind.
NYSERDA Program spending of ~$3.3 million over 4 years. Anticipated Industry matching funds of > $900,000
NYSERDA anticipates wind will be the dominant resource.
Marketing: PON 599 Track A & B, PON 731 PON 607 Disclosure: NYPSC Opinion 98-19
Wind Power Development 2
Incentives for large wind project development
Large Wind >50 MW project size
NYSERDA Program spending of ~$24 million through 2005. Anticipated industry matching funds of > $400 million
Market demand supported by EO 111, green power marketing and RPS compliance for neighboring states (not NY). NYSERDA 10 yr. Wind Development Scenario estimates 565 MW installed by 2005, and 1625 MW installed by 2010
NYSERDA Wind Development Scenario Spreadsheet, PON529, PON 672
3 Incentives and technical support for small wind
Small Wind, customer sited, and high value wind, technical support
NYSERDA Program spending of $7.2 million for Wind and PV combined. LIPA support for 250 kW of small turbines
Wind incentive expected to be at 40% to 50% of installed costs Market infrastructure support spending of $500,000 shared with PV LIPA and Long Island Farm Bureau
PON 716 PON 524 PON 717 PON 701-02
PV Development 4 Building Integrated
PV,
NYSERDA Program spending of $3 million for BIPV
NYSERDA estimate of 679 kW. 150 kW already installed
PON 449
5 PV on Buildings PV <10 kW
NYSERDA Program spending of $5 million for PV on buildings Peak Load Reduction Program $36 million total LIPA Solar Pioneer program Approx. $3 million for 2003 and first half of 2004
$5/Watt estimated maximum incentive. Marketing infrastructure development through coordination w new construction efficiency programs. Focus on capacity constrained (downstate) areas $5/Watt for 500kW, then $4/Watt. Systems up to 10kW eligible.
PON 691 EnergySMart Revised Operations Plan, p. 19. www.lipower.org/solar
6 PV on Schools
NYSERDA $1.8 million for PV on schools
$189,000external funding expected, NYSERDA estimates 100kW to be installed.
RFP 622
7
Incentives, technical support, infrastructure development support, schools program
Small and High Value PV
Additional $7.2 million of NYSERDA incentives to be shared with wind.
Estimated PV incentives of $3 to $5 per watt. Strategic Energy Reliability Program
PON 716 PON 524

Volume Six Renewable Supply Technical Appendices 6-23
#
Renewable Resources Impacted
Level & Duration Notes References
State Purchase Requirements: Executive Order 111 8 Targets for state
agencies and other affected entities to purchase or generate electricity from renewable resources
Cross Resource: To be determined by affected entities compliance plans. Potential impacts on wind, solar thermal, photovoltaics, sustainably managed biomass, methane waste and fuel cells. Tidal and geothermal also eligible but outside defined scope of this study. Note hydro and municipal solid waste are not eligible.
10% of electric energy requirements by 2005 20% of electric energy requirements by 2010
Estimated 1990 electricity consumption for affected entities ~= 2,046 gWh. Ten percent target statewide therefore ~204 gWh in 2005 and 400+ gWh by 2010.
Executive Order No. 111 “Green and Clean” State Buildings and Vehicles Guidelines
Regulatory Streamlining 9 Interconnection Potential impacts
on all renewable resources, except solar thermal, included in this study.
Standard Interconnection Requirements (SIR) for systems < 300 kVa
www.dps.state.ny.us/distgen.htm
10 Net Metering Solar electric up to 10kW, farm methane systems up to 400 kW
Solar cap of 0.1% of 1996 peak demand by IOU, Farm cap 0.4% of 1996 peak demand by IOU
www.dsireusa.org/library/includes/incentive2.cfm?Incentive_Code=NY05R&state=NY&CurrentPageID=1
Fuel Cell Development 11 Incentives, R&D support Fuel cells NYSERDA $7
million total for Strategic Energy Reliability and Secure Power, CHP/DG total $67 million. NYPA program supporting approx. 1.6 mW (8 *200 kW). LIPA plans to install 17 fuel 5 kW cells by end of 2002
Fuel cells only likely to receive some of this funding. ~$14 million LIPA new fuel cell funding $3.6 million
NYSERDA SBC revised Op Plan, p. 23 for Strategic. CHP/DG reference p. 58. State Energy Plan 3-55. www.nypa.gov/html/research.htm www.lipower.org/projects/fuelcell.html
Land Fill Gas and WTE Development 12
Power Project Development Program
Landfill/Digester gas
Anticipated solicitation funding level TBD
Table 2.4 Solicitations in NYSERDA Outlook 2002-05

Volume Six Renewable Supply Technical Appendices 6-24
#
Renewable Resources Impacted
Level & Duration Notes References
13 Incentives for digester gas co-generation, and commercial willow development
Digesters, Biomass co-firing
$3.1 million committed for digester projects ($5.7 co-funding). $1.4 million co-firing ($13.4 million co-funding)
State Energy Plan 3-52.
Corporate Tax Incentives 14 Green Building Tax
Credit PV, fuel cells $25 million total
credits available for green buildings.
Maximum credit for PV $3/watt or 100% of BIPV incremental cost over 5 years, 25% over 5 years for non BIPV modules, maximum credit for fuel cells $1/watt or 30% of capitalized cost over 5 years.
http://www.dec.state.ny.us/website/ppu/grnbldg/legis.html
Personal Tax Incentives 15 State Personal Income
Tax Credit Photovoltaics 25% credit up to
$3,750. Credit may be carried forward over 5 years
lipower.org/pdfs/tsb-m97(4)i.pdf
2002 Farm Bill 16 Biorefinery grants,
renewable energy development and grant/loan/loan guarantee program, hydrogen and fuel cell information
Biopower for electricity eligible under biorefinery grants. Wind, PV, solar thermal, biomass
Nationwide $23 million annually 2003-2007 for grant, loan/loan guarantee program.
Appropriations for biorefinery and other components “authorized as required” for 2003-2007.
Title IX 2002 Farm Bill http://www.usda.gov/farmbill/conference_report/title9.pdf
Emissions Credit Set Asides 17 3% of the annual 5
month NOx emissions allocations for NY are set aside for renewable and efficiency projects
wind energy, solar thermal energy, photovoltaics, methane waste, or sustainably managed biomass
Credits for 1,200 tons/yr set aside.
Value depends on future and current NOx credit prices. Mean price $191, median $35 per ton.
http://www.epa.gov/airmarkets/trading/noxmarket/pricetransfer.html
Hydro power Development 18 Re-licensing, and re-
powering of existing facilities
Hydro NYPA, > $500 million (through 2013) to upgrade and re-license existing NYPA projects
NYPA 2001 Annual Report
Production Tax Credit 19 Federal renewable
energy production tax credits
Wind, LFG, Biopower, PV, Fuel Cells
1.5 cents/kWh basis, adjusted for inflation
Wind production tax credit renewed through end of 2003
www.eren.doe.gov/power/repi/htm

Volume Six Renewable Supply Technical Appendices 6-25
#
Renewable Resources Impacted
Level & Duration Notes References
Bond Financing 20 Tax-exempt bond
financing Cross resource $3.9 Billion in
bonds currently outstanding
Certain gas and electric facilities and special energy projects are eligible.
NYSERDA Strategic outlook 2002-2005 p. 1.5
21 Fuel cells, Biopower, Solar thermal, BIPV
Economic Development program $2 million annual through 2004-2005. Building & Industry R&D program for $7.8 millionCHP $21 million Total
Supports acceleration of technology to market through product or business plan development CHP applications for biopower and fuel cells potentially eligible Advanced Heating & Cooling, Next Generation Technologies, and High Performance Building Solicitations anticipated in 2003.
NYSERDA Strategic Outlook 2002-2005, p. 2.1-2.7. SBC Revised Op Plan, p. 29.
Technical Support 22 PV, solar thermal,
biomass (including digesters), LFG, hydro, and wind
50% of costs up to $50,000 for studies, 100% up to $100,000 if proj. completed
Eligible renewable generation projects must be < 10 mW
PON 701-02, future round anticipated in 2003.
GREENHOUSE GAS REDUCTION TARGET SCENARIO
Table 6.4.3 provides a summary of the additional and incremental programs and policies that should be
considered when providing renewable electricity deployment and cost estimates for the greenhouse gas
(GHG) reduction scenario. The question you are being asked to answer for the GHG scenario is:
How much total electricity (in kW and kWh) could be generated from each technology type and scale
assessed for this study in 2003, 2007, 2012, and 2022 assuming the policy framework presented in Table
6.4.3 is in place and what are the costs associated with these levels of production? Please note that the
program and policies listed in Table 6.4.3 are incremental to those listed in Table 6.4.2, but that you are
being asked to report on the combined impact when reporting on costs and electricity generation for the
GHG scenario.
Information provided by you will then be used by Optimal Energy to identify the least cost combinations of
resources for reaching certain greenhouse gas reduction targets specified by NYSERDA.
At NYSERDA’s request, Table 6.4.3 is based on an incremental expansion of existing policies and
programs presented in Table 6.4.2. Therefore, it does not include a statewide Renewable Portfolio
Standard, nor does it consider the implementation of an emissions cap and trading strategy (although one or
more renewable energy expert in previous work for this study may have suggested such strategies).

Volume Six Renewable Supply Technical Appendices 6-26
The following criteria were considered when determining which policy and program support additions to
include in the greenhouse gas reduction scenario:
• Emissions from the generation of electricity being displaced by a renewable resource (for
example biomass co-firing directly reduces coal combustion, which has a higher emissions profile
than the average electric supply for the state);
• The potential to significantly increase renewable resource contributions to New York’s electricity
supply over the next 20 years;
• The potential to effect long-term market transformations that will last should public policy or
program support be decreased or removed in the future;
• Compatibility with existing programs and policies in New York and other jurisdictions;
• The ability to rely on market forces and to leverage private funds to help stimulate renewable
energy markets; and
• Administrative practicality and program cost efficiency.

Volume Six Renewable Supply Technical Appendices 6-27
Table 6.4.3 Policy and Program Initiatives for Renewable Resources in the Greenhouse Gas Reduction Scenario
Duration
#
Renewable Resource(s)
Impacted
Description of Additional Support beyond Currently Planned
Initiatives 2003 2007 2012 2022
Green Power Marketing 1 Biopower (including
co-firing), hydro, LFG, MSW, PV, and wind.
Require all electric service providers to develop and offer (by 2005) customers green power purchase options – consisting of 25%, 50%, and 100% green mix options. Starting in 2007 require that Green Power products consist of > 50% new and in-state renewable resources
X
X
X
X
Wind Power Development 2 Large Wind Project
development
Large Wind > 50 MW
LIPA power purchase agreement for Off-shore project size anticipated at 100- 140 mW, power purchase starting in 2005. LIPA RFI, 8/21/02 NYPA power purchase agreement for 5 or 10 years starting 2005. 50 mW installed capacity.www.state.ny.us/governor/press/year02/aug21_4_02.htm Auctioned & Standard contracts. Project aggregation for Wind Clusters
X
X
X
3
Small Wind Development
Net metering Make customer sited wind (annual energy production <= customer demand), up to 1 mW eligible for net metering
X X X
PV Development 4 Incentives
Building integrated and building applied PV
Continue incentive based programs, average expected buy-down of $3 per Watt in 2007, declining to $1 per Watt in 2012. Reauthorize/expand LIPA Solar Pioneer and NYSERDA programs. Approximately $8 million/year statewide up to 2012 for PV incentives. Starting in 2012, ongoing incentives available for PV used to produce hydrogen
X
X
X
State Purchase Requirements: Executive Order 111 5 Mandatory targets
for state agencies and other affected entities to purchase or generate electricity from renewable resources
Cross Resource: Mix determined by compliance plans.
Make renewable purchase requirements mandatory as opposed to targets. Make biomass co-firing and LFG eligible technologies Expand Order to require 30% of electric energy be renewable by 2022
X
X
X
X
Regulatory Streamlining 6 Interconnection Potential impacts
on all renewable resources, except solar thermal, included in this study.
Eliminate stand-by charges for distributed generation customers. Eliminate or reduce exit fees (paid to utility) when facility adds on-site generation. Adopt IEEE 1547 Standard for Interconnecting Distributed Resources with Electric Power Systems.
X
X
X
X

Volume Six Renewable Supply Technical Appendices 6-28
Duration #
Renewable Resource(s) Impacted
Description of Additional Support beyond Currently Planned Initiatives
2003 2007 2012 2022
7 Environmental Permitting
Hydropower, waste to energy, biopower
Facilitate regulatory approval for re-powering at existing dam sites. Apply power plant siting rules to WTE facilities. Establish fast track air permitting guidelines for biopower (based on list of approved fuels).
X
X
X
X
8 Net Metering
PV, farm methane, small wind
Expand net metering capacity caps as necessary, extend net metering to small wind
X
X
X
X Fuel Cell Development 9 Incentives and
infrastructure development
Fuel cells for buildings, residential and commercial scale Other renewable resources as fuels post 2007
Incentive and market development programs in 2003 to 2007 time frame with incentives of 50% of installed costs. Starting in 2007 require renewably based fuels for incentives. Average incentives of approximately $8 million statewide through 2012
X
X
X
Landfill gas and WTE Development 10 Federal tax
incentives Increased RD&D
LFG and WTE Support Section 29 renewal, or new Section 45 tax credits Continue/Expand RD&D support for LFG
X X X X
Biopower Development 11 Increased RD&D Biomass Continue/Expand RD&D for Advanced
gasification, digesters, and customer sited CHP 1-5 mW size
X X X X
Corporate Tax Incentives 12 Green Building
Tax Credit PV, Fuel Cells, Solar Thermal
Expand to include solar thermal. Increase max limit to 50% costs for fuel cells and non – integrated PV. Extend Green Building Tax Credit through 2012
X
X
X
Personal Tax Incentive 13 State Personal
Income Tax Credit
PV, small wind, solar thermal, fuel cells
Expand list of eligible technologies From 2003 to 2007 increase personal tax credit to 33% with a maximum of $10,000 From 2007 to 2012 25% credit up to $3,750
X
X
X
Emissions Credit Set Aside 14 NOx emissions
allocations. wind energy, solar thermal energy, photovoltaics, methane waste, sustainable biomass
Extend pilot and add fuel cells to eligible technologies. Increase annual set aside to reach 15% by 2012.
X
X
X
Production Tax Credit 15 Federal
renewable energy production tax credits
Wind, LFG, Biopower, PV, Fuel Cells
Extend 1.5 cent per kWh production tax credit through 2012. Expand eligibility to include 1-5 mW biopower CHP systems, and biopower co-firing. Energy crops eligible for 100% of PTC, other biomass resources for 33%.
X
X
X

Volume Six Renewable Supply Technical Appendices 6-29
Duration #
Renewable Resource(s) Impacted
Description of Additional Support beyond Currently Planned Initiatives
2003 2007 2012 2022
Bond Financing 16 Cross resource Continue / Expand tax exempt bond
financing for renewable energy projects
X
X
X
X RD&D 17 Cross resource Continue / Expand support for accelerating
the development and market deployment of advanced and improved renewable energy technologies
X
X
X
X

TECHNICAL APPENDIX 6 RENEWABLE RESOURCE POTENTIAL6.1 Technology Selection Tables (Word Document)6.2 Screening Tool Input Definitions (Word Document)6.3 Screening Inputs and Documentation
6.3.1 Biopower Inputs Table 6.3.2 Fuel Cells Inputs Table6.3.3 Hydropower Inputs Table6.3.4 Landfill Gas Inputs Table6.3.5 Municipal Solid Waste Inputs Table6.3.6 Photovoltaics Inputs Table6.3.7 Solar Thermal Inputs Table6.3.8 Wind Inputs Table
6.4 Achievable market penetration and administrative costs6.4.1 Renewable Base Case Penetrations6.4.2 Reference Table for Currently Planned Initiatives (Word Document)6.4.3 Reference Table for Greenhouse Gas Initiatives (Word Document)6.4.4 Administrative Adders for CPI scenarios6.4.5 Administrative Adders for GHG scenarios
6.5 Results6.5.1 Renewable Technical Potential - New York Statewide by Resource and Technology 6.5.2 Renewable Technical Potential - New York Zone A by Resource and Technology 6.5.3 Renewable Technical Potential - New York Zone F by Resource and Technology 6.5.4 Renewable Technical Potential - New York Zone G by Resource and Technology 6.5.5 Renewable Technical Potential - New York Zone J by Resource and Technology6.5.6 Renewable Technical Potential - New York Zone K by Resource and Technology 6.5.7 Renewable Economic Potential Savings Statewide High Avoided Costs byResource and Technology 6.5.8 Renewable Economic Potential Savings Statewide Low Avoided Costs byResource and Technology6.5.9 Renewable Economic Potential Savings Zone A, Zone A Avoided Costs, by Resource and Technology
6.5.10 Renewable Economic Potential Savings Zone F, Zone F Avoided Costs, by Resource and Technology6.5.11 Renewable Economic Potential Savings Zone G, Zone G Avoided Costs, by Resource and Technology6.5.12 Renewable Economic Potential Savings Zone J, Zone J Avoided Costs, by Resource and Technology6.5.13 Renewable Economic Potential Savings Zone K, Zone K Avoided Costs, by Resource and Technology
Renew Appendix Tables List 022703 final.xls

Table 6.3.1 BioPower Screening Inputs 8/19/2003
1
2
3
456789
10111213141516171819202122232425262728293031323334353637383940414243444546474849505152535455565758596061
A B C D E F G H I J K L M N O P Q R SA B C D E F G H I J K L M N O P Q R S
Measure Name Resource Zone Scenario Technology Life
Total Installed Cost ($/kW of rated max output)
Annual kWh/kW produced -2003
Summer On- Peak %
Summer Off - Peak %
Summer Shoulder %
Winter On - Peak %
Winter Off - Peak %
Winter Shoulder %
Energy Period Sum (Sum Col F -Col K) Should equal 100%
Summer Generation Capacity % of Max Output
Winter Generation Capacity % of Max Output
Fossil Fuel Type
Fossil Fuel Usage MMBTU/Yr
Real Levelized O&M $/yr
Biomass Direct-Fire Biomass Statewide Tech 25 $0 7,372 4.5% 38.4% 7.5% 5.9% 37.8% 5.9% 100% 98.2% 99.8% 0 0 $198Biomass Direct-Fire Biomass Zone A - West Tech 25 $0 7,372 4.5% 38.4% 7.5% 5.9% 37.8% 5.9% 100% 98.2% 99.8% $198Biomass Direct-Fire Biomass Zone F - Capital Tech 25 $0 7,372 4.5% 38.4% 7.5% 5.9% 37.8% 5.9% 100% 98.2% 99.8% $198Biomass Direct-Fire Biomass Zone G - Lower HV Tech 25 $0 7,372 4.5% 38.4% 7.5% 5.9% 37.8% 5.9% 100% 98.2% 99.8% $198Biomass Direct-Fire Biomass Zone J - NYC Tech 25 $0 7,372 4.5% 38.4% 7.5% 5.9% 37.8% 5.9% 100% 98.2% 99.8% $198Biomass Direct-Fire Biomass Zone K - Long Island Tech 25 $0 7,372 4.5% 38.4% 7.5% 5.9% 37.8% 5.9% 100% 98.2% 99.8% $198Biomass Cofiring w/ Coal Biomass Statewide Tech 10 $243 6,658 4.5% 38.4% 7.5% 5.9% 37.8% 5.9% 100% 98.2% 99.8% $174Biomass Cofiring w/ Coal Biomass Zone A - West Tech 10 $243 6,658 4.5% 38.4% 7.5% 5.9% 37.8% 5.9% 100% 98.2% 99.8% $174Biomass Cofiring w/ Coal Biomass Zone F - Capital Tech 10 $243 6,658 4.5% 38.4% 7.5% 5.9% 37.8% 5.9% 100% 98.2% 99.8% $174Biomass Cofiring w/ Coal Biomass Zone G - Lower HV Tech 10 $243 6,658 4.5% 38.4% 7.5% 5.9% 37.8% 5.9% 100% 98.2% 99.8% $174Biomass Cofiring w/ Coal Biomass Zone J - NYC Tech 10 $243 6,658 4.5% 38.4% 7.5% 5.9% 37.8% 5.9% 100% 98.2% 99.8% $174Biomass Cofiring w/ Coal Biomass Zone K - Long Island Tech 10 $243 6,658 4.5% 38.4% 7.5% 5.9% 37.8% 5.9% 100% 98.2% 99.8% $174Biomass Gasification Biomass Statewide Tech 20 $1,750 7,008 4.5% 38.4% 7.5% 5.9% 37.8% 5.9% 100% 98.2% 99.8% $29Biomass Gasification Biomass Zone A - West Tech 20 $1,750 7,008 4.5% 38.4% 7.5% 5.9% 37.8% 5.9% 100% 98.2% 99.8% $29Biomass Gasification Biomass Zone F - Capital Tech 20 $1,750 7,008 4.5% 38.4% 7.5% 5.9% 37.8% 5.9% 100% 98.2% 99.8% $29Biomass Gasification Biomass Zone G - Lower HV Tech 20 $1,750 7,008 4.5% 38.4% 7.5% 5.9% 37.8% 5.9% 100% 98.2% 99.8% $29Biomass Gasification Biomass Zone J - NYC Tech 20 $1,750 7,008 4.5% 38.4% 7.5% 5.9% 37.8% 5.9% 100% 98.2% 99.8% $29Biomass Gasification Biomass Zone K - Long Island Tech 20 $1,750 7,008 4.5% 38.4% 7.5% 5.9% 37.8% 5.9% 100% 98.2% 99.8% $29Biomass CHP Biomass Statewide Tech 20 $3,960 7,446 5.9% 36.9% 7.6% 7.4% 36.4% 5.8% 100% 98.2% 99.8% 6 -470 $198Biomass CHP Biomass Zone A - West Tech 20 $3,960 7,446 5.9% 36.9% 7.6% 7.4% 36.4% 5.8% 100% 98.2% 99.8% $198Biomass CHP Biomass Zone F - Capital Tech 20 $3,960 7,446 5.9% 36.9% 7.6% 7.4% 36.4% 5.8% 100% 98.2% 99.8% $198Biomass CHP Biomass Zone G - Lower HV Tech 20 $3,960 7,446 5.9% 36.9% 7.6% 7.4% 36.4% 5.8% 100% 98.2% 99.8% $198Biomass CHP Biomass Zone J - NYC Tech 20 $3,960 7,446 5.9% 36.9% 7.6% 7.4% 36.4% 5.8% 100% 98.2% 99.8% $198Biomass CHP Biomass Zone K - Long Island Tech 20 $3,960 7,446 5.9% 36.9% 7.6% 7.4% 36.4% 5.8% 100% 98.2% 99.8% $198Biomass Direct-Fire Biomass Statewide Base 25 $0 7,372 4.5% 38.4% 7.5% 5.9% 37.8% 5.9% 100% 98.2% 99.8% 0 0 $198Biomass Direct-Fire Biomass Zone A - West Base 25 $0 7,372 4.5% 38.4% 7.5% 5.9% 37.8% 5.9% 100% 98.2% 99.8% $198Biomass Direct-Fire Biomass Zone F - Capital Base 25 $0 7,372 4.5% 38.4% 7.5% 5.9% 37.8% 5.9% 100% 98.2% 99.8% $198Biomass Direct-Fire Biomass Zone G - Lower HV Base 25 $0 7,372 4.5% 38.4% 7.5% 5.9% 37.8% 5.9% 100% 98.2% 99.8% $198Biomass Direct-Fire Biomass Zone J - NYC Base 25 $0 7,372 4.5% 38.4% 7.5% 5.9% 37.8% 5.9% 100% 98.2% 99.8% $198Biomass Direct-Fire Biomass Zone K - Long Island Base 25 $0 7,372 4.5% 38.4% 7.5% 5.9% 37.8% 5.9% 100% 98.2% 99.8% $198Biomass Cofiring w/ Coal Biomass Statewide Base 10 $243 5,797 4.5% 38.4% 7.5% 5.9% 37.8% 5.9% 100% 98.2% 99.8% 0 0 $104Biomass Cofiring w/ Coal Biomass Zone A - West Base 10 $243 6,658 4.5% 38.4% 7.5% 5.9% 37.8% 5.9% 100% 98.2% 99.8% $113Biomass Cofiring w/ Coal Biomass Zone F - Capital Base 10 $243 6,658 4.5% 38.4% 7.5% 5.9% 37.8% 5.9% 100% 98.2% 99.8% $104Biomass Cofiring w/ Coal Biomass Zone G - Lower HV Base 10 $243 6,658 4.5% 38.4% 7.5% 5.9% 37.8% 5.9% 100% 98.2% 99.8% $104Biomass Cofiring w/ Coal Biomass Zone J - NYC Base 10 $243 6,658 4.5% 38.4% 7.5% 5.9% 37.8% 5.9% 100% 98.2% 99.8% $104Biomass Cofiring w/ Coal Biomass Zone K - Long Island Base 10 $243 6,658 4.5% 38.4% 7.5% 5.9% 37.8% 5.9% 100% 98.2% 99.8% $104Biomass Gasification Biomass Statewide Base 20 $1,750 7,008 4.5% 38.4% 7.5% 5.9% 37.8% 5.9% 100% 98.2% 99.8% 0 0 $0Biomass Gasification Biomass Zone A - West Base 20 $1,750 7,008 4.5% 38.4% 7.5% 5.9% 37.8% 5.9% 100% 98.2% 99.8% $0Biomass Gasification Biomass Zone F - Capital Base 20 $1,750 7,008 4.5% 38.4% 7.5% 5.9% 37.8% 5.9% 100% 98.2% 99.8% $0Biomass Gasification Biomass Zone G - Lower HV Base 20 $1,750 7,008 4.5% 38.4% 7.5% 5.9% 37.8% 5.9% 100% 98.2% 99.8% $0Biomass Gasification Biomass Zone J - NYC Base 20 $1,750 7,008 4.5% 38.4% 7.5% 5.9% 37.8% 5.9% 100% 98.2% 99.8% $0Biomass Gasification Biomass Zone K - Long Island Base 20 $1,750 7,008 4.5% 38.4% 7.5% 5.9% 37.8% 5.9% 100% 98.2% 99.8% $0Biomass CHP Biomass Statewide Base 20 $3,960 7,446 5.9% 36.9% 7.6% 7.4% 36.4% 5.8% 100% 98.2% 99.8% 6 -470 $198Biomass CHP Biomass Zone A - West Base 20 $3,960 7,446 5.9% 36.9% 7.6% 7.4% 36.4% 5.8% 100% 98.2% 99.8% $198Biomass CHP Biomass Zone F - Capital Base 20 $3,960 7,446 5.9% 36.9% 7.6% 7.4% 36.4% 5.8% 100% 98.2% 99.8% $198Biomass CHP Biomass Zone G - Lower HV Base 20 $3,960 7,446 5.9% 36.9% 7.6% 7.4% 36.4% 5.8% 100% 98.2% 99.8% $198Biomass CHP Biomass Zone J - NYC Base 20 $3,960 7,446 5.9% 36.9% 7.6% 7.4% 36.4% 5.8% 100% 98.2% 99.8% $198Biomass CHP Biomass Zone K - Long Island Base 20 $3,960 7,446 5.9% 36.9% 7.6% 7.4% 36.4% 5.8% 100% 98.2% 99.8% $198Biomass Direct-Fire Biomass Statewide CPI 25 $0 7,372 4.5% 38.4% 7.5% 5.9% 37.8% 5.9% 100% 98.2% 99.8% 0 0 $198Biomass Direct-Fire Biomass Zone A - West CPI 25 $0 7,372 4.5% 38.4% 7.5% 5.9% 37.8% 5.9% 100% 98.2% 99.8% $198Biomass Direct-Fire Biomass Zone F - Capital CPI 25 $0 7,372 4.5% 38.4% 7.5% 5.9% 37.8% 5.9% 100% 98.2% 99.8% $198Biomass Direct-Fire Biomass Zone G - Lower HV CPI 25 $0 7,372 4.5% 38.4% 7.5% 5.9% 37.8% 5.9% 100% 98.2% 99.8% $198Biomass Direct-Fire Biomass Zone J - NYC CPI 25 $0 7,372 4.5% 38.4% 7.5% 5.9% 37.8% 5.9% 100% 98.2% 99.8% $198Biomass Direct-Fire Biomass Zone K - Long Island CPI 25 $0 7,372 4.5% 38.4% 7.5% 5.9% 37.8% 5.9% 100% 98.2% 99.8% $198Biomass Cofiring w/ Coal Biomass Statewide CPI 10 $243 6,658 4.5% 38.4% 7.5% 5.9% 37.8% 5.9% 100% 98.2% 99.8% 0 0 $104Biomass Cofiring w/ Coal Biomass Zone A - West CPI 10 $243 6,658 4.5% 38.4% 7.5% 5.9% 37.8% 5.9% 100% 98.2% 99.8% $104Biomass Cofiring w/ Coal Biomass Zone F - Capital CPI 10 $243 6,658 4.5% 38.4% 7.5% 5.9% 37.8% 5.9% 100% 98.2% 99.8% $104
I. Measure Name/Zone Scenario
Energy Coincidence Factors Capacity Coincidence Factors
II. Current Technology Costs and Outputs

Table 6.3.1 BioPower Screening Inputs 8/19/2003
6263646566676869707172737475767778798081828384858687888990919293949596979899
100
A B C D E F G H I J K L M N O P Q R SBiomass Cofiring w/ Coal Biomass Zone G - Lower HV CPI 10 $243 6,658 4.5% 38.4% 7.5% 5.9% 37.8% 5.9% 100% 98.2% 99.8% $104Biomass Cofiring w/ Coal Biomass Zone J - NYC CPI 10 $243 6,658 4.5% 38.4% 7.5% 5.9% 37.8% 5.9% 100% 98.2% 99.8% $104Biomass Cofiring w/ Coal Biomass Zone K - Long Island CPI 10 $243 6,658 4.5% 38.4% 7.5% 5.9% 37.8% 5.9% 100% 98.2% 99.8% $104Biomass Gasification Biomass Statewide CPI 20 $1,750 7,008 4.5% 38.4% 7.5% 5.9% 37.8% 5.9% 100% 98.2% 99.8% 0 0 $0Biomass Gasification Biomass Zone A - West CPI 20 $1,750 7,008 4.5% 38.4% 7.5% 5.9% 37.8% 5.9% 100% 98.2% 99.8% $0Biomass Gasification Biomass Zone F - Capital CPI 20 $1,750 7,008 4.5% 38.4% 7.5% 5.9% 37.8% 5.9% 100% 98.2% 99.8% $0Biomass Gasification Biomass Zone G - Lower HV CPI 20 $1,750 7,008 4.5% 38.4% 7.5% 5.9% 37.8% 5.9% 100% 98.2% 99.8% $0Biomass Gasification Biomass Zone J - NYC CPI 20 $1,750 7,008 4.5% 38.4% 7.5% 5.9% 37.8% 5.9% 100% 98.2% 99.8% $0Biomass Gasification Biomass Zone K - Long Island CPI 20 $1,750 7,008 4.5% 38.4% 7.5% 5.9% 37.8% 5.9% 100% 98.2% 99.8% $0Biomass CHP Biomass Statewide CPI 20 $3,960 7,446 5.9% 36.9% 7.6% 7.4% 36.4% 5.8% 100% 98.2% 99.8% 6 -470 $198Biomass CHP Biomass Zone A - West CPI 20 $3,960 7,446 5.9% 36.9% 7.6% 7.4% 36.4% 5.8% 100% 98.2% 99.8% $198Biomass CHP Biomass Zone F - Capital CPI 20 $3,960 7,446 5.9% 36.9% 7.6% 7.4% 36.4% 5.8% 100% 98.2% 99.8% $198Biomass CHP Biomass Zone G - Lower HV CPI 20 $3,960 7,446 5.9% 36.9% 7.6% 7.4% 36.4% 5.8% 100% 98.2% 99.8% $198Biomass CHP Biomass Zone J - NYC CPI 20 $3,960 7,446 5.9% 36.9% 7.6% 7.4% 36.4% 5.8% 100% 98.2% 99.8% $198Biomass CHP Biomass Zone K - Long Island CPI 20 $3,960 7,446 5.9% 36.9% 7.6% 7.4% 36.4% 5.8% 100% 98.2% 99.8% $198Biomass Direct-Fire Biomass Statewide GHG 25 $0 7,372 4.5% 38.4% 7.5% 5.9% 37.8% 5.9% 100% 98.2% 99.8% 0 0 $198Biomass Direct-Fire Biomass Zone A - West GHG 25 $0 7,372 4.5% 38.4% 7.5% 5.9% 37.8% 5.9% 100% 98.2% 99.8% $198Biomass Direct-Fire Biomass Zone F - Capital GHG 25 $0 7,372 4.5% 38.4% 7.5% 5.9% 37.8% 5.9% 100% 98.2% 99.8% $198Biomass Direct-Fire Biomass Zone G - Lower HV GHG 25 $0 7,372 4.5% 38.4% 7.5% 5.9% 37.8% 5.9% 100% 98.2% 99.8% $198Biomass Direct-Fire Biomass Zone J - NYC GHG 25 $0 7,372 4.5% 38.4% 7.5% 5.9% 37.8% 5.9% 100% 98.2% 99.8% $198Biomass Direct-Fire Biomass Zone K - Long Island GHG 25 $0 7,372 4.5% 38.4% 7.5% 5.9% 37.8% 5.9% 100% 98.2% 99.8% $198Biomass Cofiring w/ Coal Biomass Statewide GHG 10 $243 6,658 4.5% 38.4% 7.5% 5.9% 37.8% 5.9% 100% 98.2% 99.8% 0 0 $104Biomass Cofiring w/ Coal Biomass Zone A - West GHG 10 $243 6,658 4.5% 38.4% 7.5% 5.9% 37.8% 5.9% 100% 98.2% 99.8% $104Biomass Cofiring w/ Coal Biomass Zone F - Capital GHG 10 $243 6,658 4.5% 38.4% 7.5% 5.9% 37.8% 5.9% 100% 98.2% 99.8% $104Biomass Cofiring w/ Coal Biomass Zone G - Lower HV GHG 10 $243 6,658 4.5% 38.4% 7.5% 5.9% 37.8% 5.9% 100% 98.2% 99.8% $104Biomass Cofiring w/ Coal Biomass Zone J - NYC GHG 10 $243 6,658 4.5% 38.4% 7.5% 5.9% 37.8% 5.9% 100% 98.2% 99.8% $104Biomass Cofiring w/ Coal Biomass Zone K - Long Island GHG 10 $243 6,658 4.5% 38.4% 7.5% 5.9% 37.8% 5.9% 100% 98.2% 99.8% $104Biomass Gasification Biomass Statewide GHG 20 $1,750 7,008 4.5% 38.4% 7.5% 5.9% 37.8% 5.9% 100% 98.2% 99.8% 0 0 $0Biomass Gasification Biomass Zone A - West GHG 20 $1,750 7,008 4.5% 38.4% 7.5% 5.9% 37.8% 5.9% 100% 98.2% 99.8% $0Biomass Gasification Biomass Zone F - Capital GHG 20 $1,750 7,008 4.5% 38.4% 7.5% 5.9% 37.8% 5.9% 100% 98.2% 99.8% $0Biomass Gasification Biomass Zone G - Lower HV GHG 20 $1,750 7,008 4.5% 38.4% 7.5% 5.9% 37.8% 5.9% 100% 98.2% 99.8% $0Biomass Gasification Biomass Zone J - NYC GHG 20 $1,750 7,008 4.5% 38.4% 7.5% 5.9% 37.8% 5.9% 100% 98.2% 99.8% $0Biomass Gasification Biomass Zone K - Long Island GHG 20 $1,750 7,008 4.5% 38.4% 7.5% 5.9% 37.8% 5.9% 100% 98.2% 99.8% $0Biomass CHP Biomass Statewide GHG 20 $3,960 7,446 5.9% 36.9% 7.6% 7.4% 36.4% 5.8% 100% 98.2% 99.8% 6 -470 $198Biomass CHP Biomass Zone A - West GHG 20 $3,960 7,446 5.9% 36.9% 7.6% 7.4% 36.4% 5.8% 100% 98.2% 99.8% $198Biomass CHP Biomass Zone F - Capital GHG 20 $3,960 7,446 5.9% 36.9% 7.6% 7.4% 36.4% 5.8% 100% 98.2% 99.8% $198Biomass CHP Biomass Zone G - Lower HV GHG 20 $3,960 7,446 5.9% 36.9% 7.6% 7.4% 36.4% 5.8% 100% 98.2% 99.8% $198Biomass CHP Biomass Zone J - NYC GHG 20 $3,960 7,446 5.9% 36.9% 7.6% 7.4% 36.4% 5.8% 100% 98.2% 99.8% $198Biomass CHP Biomass Zone K - Long Island GHG 20 $3,960 7,446 5.9% 36.9% 7.6% 7.4% 36.4% 5.8% 100% 98.2% 99.8% $198
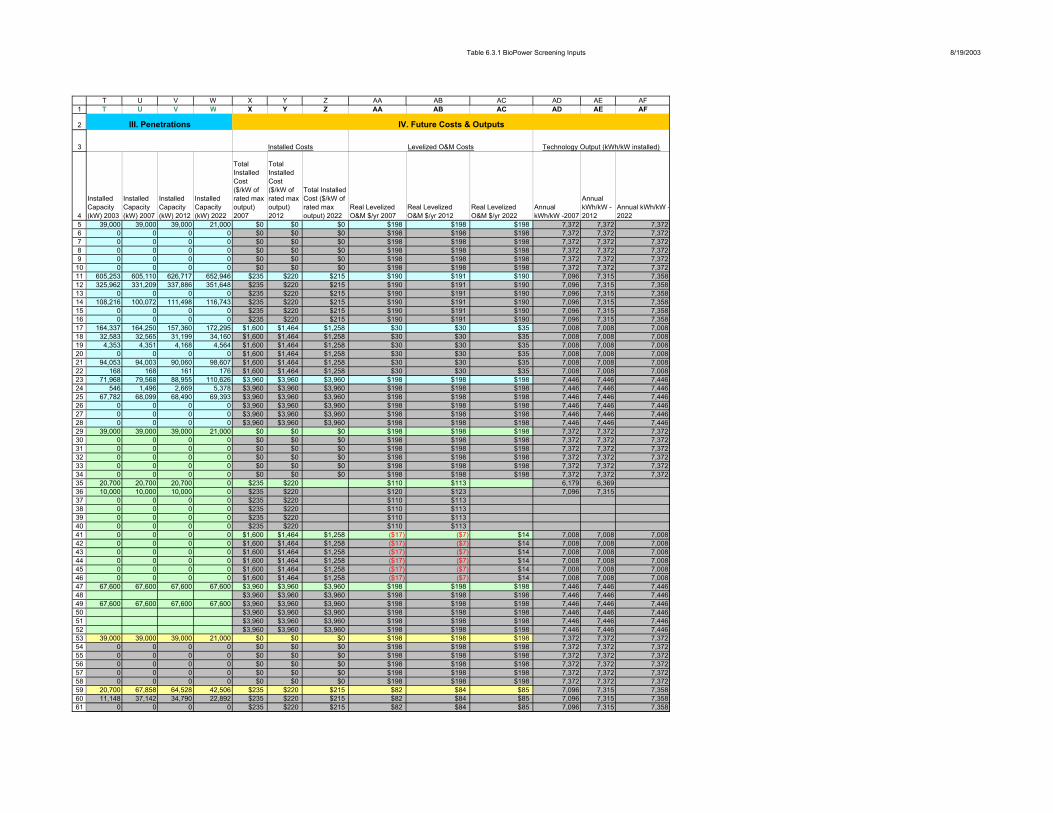
Table 6.3.1 BioPower Screening Inputs 8/19/2003
1
2
3
456789
10111213141516171819202122232425262728293031323334353637383940414243444546474849505152535455565758596061
T U V W X Y Z AA AB AC AD AE AFT U V W X Y Z AA AB AC AD AE AF
Installed Capacity (kW) 2003
Installed Capacity (kW) 2007
Installed Capacity (kW) 2012
Installed Capacity (kW) 2022
Total Installed Cost ($/kW of rated max output) 2007
Total Installed Cost ($/kW of rated max output) 2012
Total Installed Cost ($/kW of rated max output) 2022
Real Levelized O&M $/yr 2007
Real Levelized O&M $/yr 2012
Real Levelized O&M $/yr 2022
Annual kWh/kW -2007
Annual kWh/kW -2012
Annual kWh/kW -2022
39,000 39,000 39,000 21,000 $0 $0 $0 $198 $198 $198 7,372 7,372 7,3720 0 0 0 $0 $0 $0 $198 $198 $198 7,372 7,372 7,3720 0 0 0 $0 $0 $0 $198 $198 $198 7,372 7,372 7,3720 0 0 0 $0 $0 $0 $198 $198 $198 7,372 7,372 7,3720 0 0 0 $0 $0 $0 $198 $198 $198 7,372 7,372 7,3720 0 0 0 $0 $0 $0 $198 $198 $198 7,372 7,372 7,372
605,253 605,110 626,717 652,946 $235 $220 $215 $190 $191 $190 7,096 7,315 7,358325,962 331,209 337,886 351,648 $235 $220 $215 $190 $191 $190 7,096 7,315 7,358
0 0 0 0 $235 $220 $215 $190 $191 $190 7,096 7,315 7,358108,216 100,072 111,498 116,743 $235 $220 $215 $190 $191 $190 7,096 7,315 7,358
0 0 0 0 $235 $220 $215 $190 $191 $190 7,096 7,315 7,3580 0 0 0 $235 $220 $215 $190 $191 $190 7,096 7,315 7,358
164,337 164,250 157,360 172,295 $1,600 $1,464 $1,258 $30 $30 $35 7,008 7,008 7,00832,583 32,565 31,199 34,160 $1,600 $1,464 $1,258 $30 $30 $35 7,008 7,008 7,008
4,353 4,351 4,168 4,564 $1,600 $1,464 $1,258 $30 $30 $35 7,008 7,008 7,0080 0 0 0 $1,600 $1,464 $1,258 $30 $30 $35 7,008 7,008 7,008
94,053 94,003 90,060 98,607 $1,600 $1,464 $1,258 $30 $30 $35 7,008 7,008 7,008168 168 161 176 $1,600 $1,464 $1,258 $30 $30 $35 7,008 7,008 7,008
71,968 79,568 88,955 110,626 $3,960 $3,960 $3,960 $198 $198 $198 7,446 7,446 7,446546 1,496 2,669 5,378 $3,960 $3,960 $3,960 $198 $198 $198 7,446 7,446 7,446
67,782 68,099 68,490 69,393 $3,960 $3,960 $3,960 $198 $198 $198 7,446 7,446 7,4460 0 0 0 $3,960 $3,960 $3,960 $198 $198 $198 7,446 7,446 7,4460 0 0 0 $3,960 $3,960 $3,960 $198 $198 $198 7,446 7,446 7,4460 0 0 0 $3,960 $3,960 $3,960 $198 $198 $198 7,446 7,446 7,446
39,000 39,000 39,000 21,000 $0 $0 $0 $198 $198 $198 7,372 7,372 7,3720 0 0 0 $0 $0 $0 $198 $198 $198 7,372 7,372 7,3720 0 0 0 $0 $0 $0 $198 $198 $198 7,372 7,372 7,3720 0 0 0 $0 $0 $0 $198 $198 $198 7,372 7,372 7,3720 0 0 0 $0 $0 $0 $198 $198 $198 7,372 7,372 7,3720 0 0 0 $0 $0 $0 $198 $198 $198 7,372 7,372 7,372
20,700 20,700 20,700 0 $235 $220 $110 $113 6,179 6,369 10,000 10,000 10,000 0 $235 $220 $120 $123 7,096 7,315
0 0 0 0 $235 $220 $110 $113 0 0 0 0 $235 $220 $110 $113 0 0 0 0 $235 $220 $110 $113 0 0 0 0 $235 $220 $110 $113 0 0 0 0 $1,600 $1,464 $1,258 ($17) ($7) $14 7,008 7,008 7,0080 0 0 0 $1,600 $1,464 $1,258 ($17) ($7) $14 7,008 7,008 7,0080 0 0 0 $1,600 $1,464 $1,258 ($17) ($7) $14 7,008 7,008 7,0080 0 0 0 $1,600 $1,464 $1,258 ($17) ($7) $14 7,008 7,008 7,0080 0 0 0 $1,600 $1,464 $1,258 ($17) ($7) $14 7,008 7,008 7,0080 0 0 0 $1,600 $1,464 $1,258 ($17) ($7) $14 7,008 7,008 7,008
67,600 67,600 67,600 67,600 $3,960 $3,960 $3,960 $198 $198 $198 7,446 7,446 7,446$3,960 $3,960 $3,960 $198 $198 $198 7,446 7,446 7,446
67,600 67,600 67,600 67,600 $3,960 $3,960 $3,960 $198 $198 $198 7,446 7,446 7,446$3,960 $3,960 $3,960 $198 $198 $198 7,446 7,446 7,446$3,960 $3,960 $3,960 $198 $198 $198 7,446 7,446 7,446$3,960 $3,960 $3,960 $198 $198 $198 7,446 7,446 7,446
39,000 39,000 39,000 21,000 $0 $0 $0 $198 $198 $198 7,372 7,372 7,3720 0 0 0 $0 $0 $0 $198 $198 $198 7,372 7,372 7,3720 0 0 0 $0 $0 $0 $198 $198 $198 7,372 7,372 7,3720 0 0 0 $0 $0 $0 $198 $198 $198 7,372 7,372 7,3720 0 0 0 $0 $0 $0 $198 $198 $198 7,372 7,372 7,3720 0 0 0 $0 $0 $0 $198 $198 $198 7,372 7,372 7,372
20,700 67,858 64,528 42,506 $235 $220 $215 $82 $84 $85 7,096 7,315 7,35811,148 37,142 34,790 22,892 $235 $220 $215 $82 $84 $85 7,096 7,315 7,358
0 0 0 0 $235 $220 $215 $82 $84 $85 7,096 7,315 7,358
III. Penetrations IV. Future Costs & Outputs
Installed Costs Levelized O&M Costs Technology Output (kWh/kW installed)

Table 6.3.1 BioPower Screening Inputs 8/19/2003
6263646566676869707172737475767778798081828384858687888990919293949596979899
100
T U V W X Y Z AA AB AC AD AE AF3,701 11,222 11,480 7,600 $235 $220 $215 $82 $84 $85 7,096 7,315 7,358
0 0 0 0 $235 $220 $215 $82 $84 $85 7,096 7,315 7,3580 0 0 0 $235 $220 $215 $82 $84 $85 7,096 7,315 7,3580 41,123 49,471 96,992 $1,600 $1,464 $1,258 ($17) ($7) $14 7,008 7,008 7,0080 8,153 9,808 19,230 $1,600 $1,464 $1,258 ($17) ($7) $14 7,008 7,008 7,0080 1,089 1,310 2,569 $1,600 $1,464 $1,258 ($17) ($7) $14 7,008 7,008 7,0080 0 0 0 $1,600 $1,464 $1,258 ($17) ($7) $14 7,008 7,008 7,0080 23,535 28,313 55,510 $1,600 $1,464 $1,258 ($17) ($7) $14 7,008 7,008 7,0080 42 51 99 $1,600 $1,464 $1,258 ($17) ($7) $14 7,008 7,008 7,008
69,412 76,882 87,143 110,458 $3,960 $3,960 $3,960 $198 $198 $198 7,446 7,446 7,446527 1,445 2,615 5,370 $3,960 $3,960 $3,960 $198 $198 $198 7,446 7,446 7,446
65,375 65,800 67,095 69,288 $3,960 $3,960 $3,960 $198 $198 $198 7,446 7,446 7,4460 0 0 0 $3,960 $3,960 $3,960 $198 $198 $198 7,446 7,446 7,4460 0 0 0 $3,960 $3,960 $3,960 $198 $198 $198 7,446 7,446 7,4460 0 0 0 $3,960 $3,960 $3,960 $198 $198 $198 7,446 7,446 7,446
39,000 39,000 39,000 21,000 $0 $0 $0 $198 $198 $198 7,372 7,372 7,3720 0 0 0 $0 $0 $0 $198 $198 $198 7,372 7,372 7,3720 0 0 0 $0 $0 $0 $198 $198 $198 7,372 7,372 7,3720 0 0 0 $0 $0 $0 $198 $198 $198 7,372 7,372 7,3720 0 0 0 $0 $0 $0 $198 $198 $198 7,372 7,372 7,3720 0 0 0 $0 $0 $0 $198 $198 $198 7,372 7,372 7,372
20,700 134,309 217,230 71,996 $235 $220 $215 $94 $155 $85 7,096 7,315 7,35811,148 73,514 117,117 38,774 $235 $220 $215 $94 $155 $85 7,096 7,315 7,358
0 0 0 0 $235 $220 $215 $94 $155 $85 7,096 7,315 7,3583,701 22,212 38,647 12,872 $235 $220 $215 $94 $155 $85 7,096 7,315 7,358
0 0 0 0 $235 $220 $215 $94 $155 $85 7,096 7,315 7,3580 0 0 0 $235 $220 $215 $94 $155 $85 7,096 7,315 7,3580 95,851 119,041 119,041 $1,600 $1,464 $1,258 $8 $20 $14 7,008 7,008 7,0080 19,004 23,602 23,602 $1,600 $1,464 $1,258 $8 $20 $14 7,008 7,008 7,0080 2,539 3,153 3,153 $1,600 $1,464 $1,258 $8 $20 $14 7,008 7,008 7,0080 0 0 0 $1,600 $1,464 $1,258 $8 $20 $14 7,008 7,008 7,0080 54,857 68,129 68,129 $1,600 $1,464 $1,258 $8 $20 $14 7,008 7,008 7,0080 98 122 122 $1,600 $1,464 $1,258 $8 $20 $14 7,008 7,008 7,008
71,968 79,568 88,955 110,458 $3,960 $3,960 $3,960 $198 $198 $198 7,446 7,446 7,446546 1,496 2,669 5,370 $3,960 $3,960 $3,960 $198 $198 $198 7,446 7,446 7,446
67,782 68,099 68,490 69,288 $3,960 $3,960 $3,960 $198 $198 $198 7,446 7,446 7,4460 0 0 0 $3,960 $3,960 $3,960 $198 $198 $198 7,446 7,446 7,4460 0 0 0 $3,960 $3,960 $3,960 $198 $198 $198 7,446 7,446 7,4460 0 0 0 $3,960 $3,960 $3,960 $198 $198 $198 7,446 7,446 7,446
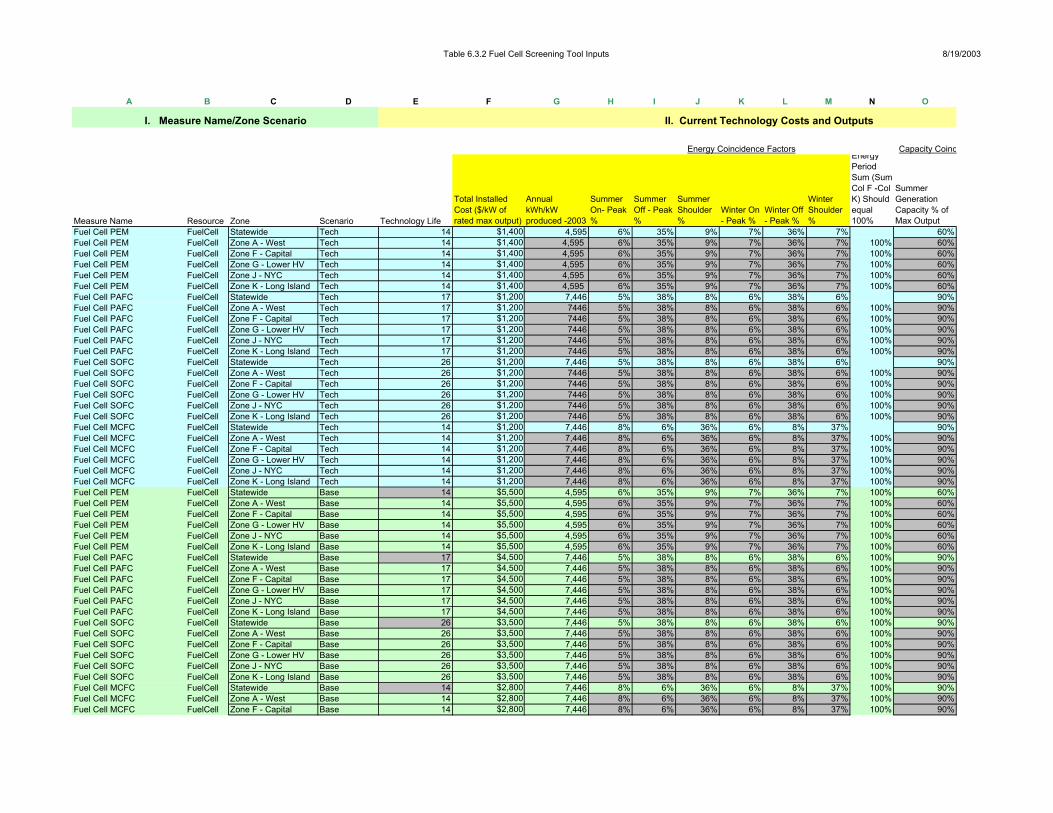
Table 6.3.2 Fuel Cell Screening Tool Inputs 8/19/2003
A B C D E F G H I J K L M N O
Measure Name Resource Zone Scenario Technology Life
Total Installed Cost ($/kW of rated max output)
Annual kWh/kW produced -2003
Summer On- Peak %
Summer Off - Peak %
Summer Shoulder %
Winter On - Peak %
Winter Off - Peak %
Winter Shoulder %
Energy Period Sum (Sum Col F -Col K) Should equal 100%
Summer Generation Capacity % of Max Output
Fuel Cell PEM FuelCell Statewide Tech 14 $1,400 4,595 6% 35% 9% 7% 36% 7% 60%Fuel Cell PEM FuelCell Zone A - West Tech 14 $1,400 4,595 6% 35% 9% 7% 36% 7% 100% 60%Fuel Cell PEM FuelCell Zone F - Capital Tech 14 $1,400 4,595 6% 35% 9% 7% 36% 7% 100% 60%Fuel Cell PEM FuelCell Zone G - Lower HV Tech 14 $1,400 4,595 6% 35% 9% 7% 36% 7% 100% 60%Fuel Cell PEM FuelCell Zone J - NYC Tech 14 $1,400 4,595 6% 35% 9% 7% 36% 7% 100% 60%Fuel Cell PEM FuelCell Zone K - Long Island Tech 14 $1,400 4,595 6% 35% 9% 7% 36% 7% 100% 60%Fuel Cell PAFC FuelCell Statewide Tech 17 $1,200 7,446 5% 38% 8% 6% 38% 6% 90%Fuel Cell PAFC FuelCell Zone A - West Tech 17 $1,200 7446 5% 38% 8% 6% 38% 6% 100% 90%Fuel Cell PAFC FuelCell Zone F - Capital Tech 17 $1,200 7446 5% 38% 8% 6% 38% 6% 100% 90%Fuel Cell PAFC FuelCell Zone G - Lower HV Tech 17 $1,200 7446 5% 38% 8% 6% 38% 6% 100% 90%Fuel Cell PAFC FuelCell Zone J - NYC Tech 17 $1,200 7446 5% 38% 8% 6% 38% 6% 100% 90%Fuel Cell PAFC FuelCell Zone K - Long Island Tech 17 $1,200 7446 5% 38% 8% 6% 38% 6% 100% 90%Fuel Cell SOFC FuelCell Statewide Tech 26 $1,200 7,446 5% 38% 8% 6% 38% 6% 90%Fuel Cell SOFC FuelCell Zone A - West Tech 26 $1,200 7446 5% 38% 8% 6% 38% 6% 100% 90%Fuel Cell SOFC FuelCell Zone F - Capital Tech 26 $1,200 7446 5% 38% 8% 6% 38% 6% 100% 90%Fuel Cell SOFC FuelCell Zone G - Lower HV Tech 26 $1,200 7446 5% 38% 8% 6% 38% 6% 100% 90%Fuel Cell SOFC FuelCell Zone J - NYC Tech 26 $1,200 7446 5% 38% 8% 6% 38% 6% 100% 90%Fuel Cell SOFC FuelCell Zone K - Long Island Tech 26 $1,200 7446 5% 38% 8% 6% 38% 6% 100% 90%Fuel Cell MCFC FuelCell Statewide Tech 14 $1,200 7,446 8% 6% 36% 6% 8% 37% 90%Fuel Cell MCFC FuelCell Zone A - West Tech 14 $1,200 7,446 8% 6% 36% 6% 8% 37% 100% 90%Fuel Cell MCFC FuelCell Zone F - Capital Tech 14 $1,200 7,446 8% 6% 36% 6% 8% 37% 100% 90%Fuel Cell MCFC FuelCell Zone G - Lower HV Tech 14 $1,200 7,446 8% 6% 36% 6% 8% 37% 100% 90%Fuel Cell MCFC FuelCell Zone J - NYC Tech 14 $1,200 7,446 8% 6% 36% 6% 8% 37% 100% 90%Fuel Cell MCFC FuelCell Zone K - Long Island Tech 14 $1,200 7,446 8% 6% 36% 6% 8% 37% 100% 90%Fuel Cell PEM FuelCell Statewide Base 14 $5,500 4,595 6% 35% 9% 7% 36% 7% 100% 60%Fuel Cell PEM FuelCell Zone A - West Base 14 $5,500 4,595 6% 35% 9% 7% 36% 7% 100% 60%Fuel Cell PEM FuelCell Zone F - Capital Base 14 $5,500 4,595 6% 35% 9% 7% 36% 7% 100% 60%Fuel Cell PEM FuelCell Zone G - Lower HV Base 14 $5,500 4,595 6% 35% 9% 7% 36% 7% 100% 60%Fuel Cell PEM FuelCell Zone J - NYC Base 14 $5,500 4,595 6% 35% 9% 7% 36% 7% 100% 60%Fuel Cell PEM FuelCell Zone K - Long Island Base 14 $5,500 4,595 6% 35% 9% 7% 36% 7% 100% 60%Fuel Cell PAFC FuelCell Statewide Base 17 $4,500 7,446 5% 38% 8% 6% 38% 6% 100% 90%Fuel Cell PAFC FuelCell Zone A - West Base 17 $4,500 7,446 5% 38% 8% 6% 38% 6% 100% 90%Fuel Cell PAFC FuelCell Zone F - Capital Base 17 $4,500 7,446 5% 38% 8% 6% 38% 6% 100% 90%Fuel Cell PAFC FuelCell Zone G - Lower HV Base 17 $4,500 7,446 5% 38% 8% 6% 38% 6% 100% 90%Fuel Cell PAFC FuelCell Zone J - NYC Base 17 $4,500 7,446 5% 38% 8% 6% 38% 6% 100% 90%Fuel Cell PAFC FuelCell Zone K - Long Island Base 17 $4,500 7,446 5% 38% 8% 6% 38% 6% 100% 90%Fuel Cell SOFC FuelCell Statewide Base 26 $3,500 7,446 5% 38% 8% 6% 38% 6% 100% 90%Fuel Cell SOFC FuelCell Zone A - West Base 26 $3,500 7,446 5% 38% 8% 6% 38% 6% 100% 90%Fuel Cell SOFC FuelCell Zone F - Capital Base 26 $3,500 7,446 5% 38% 8% 6% 38% 6% 100% 90%Fuel Cell SOFC FuelCell Zone G - Lower HV Base 26 $3,500 7,446 5% 38% 8% 6% 38% 6% 100% 90%Fuel Cell SOFC FuelCell Zone J - NYC Base 26 $3,500 7,446 5% 38% 8% 6% 38% 6% 100% 90%Fuel Cell SOFC FuelCell Zone K - Long Island Base 26 $3,500 7,446 5% 38% 8% 6% 38% 6% 100% 90%Fuel Cell MCFC FuelCell Statewide Base 14 $2,800 7,446 8% 6% 36% 6% 8% 37% 100% 90%Fuel Cell MCFC FuelCell Zone A - West Base 14 $2,800 7,446 8% 6% 36% 6% 8% 37% 100% 90%Fuel Cell MCFC FuelCell Zone F - Capital Base 14 $2,800 7,446 8% 6% 36% 6% 8% 37% 100% 90%
I. Measure Name/Zone Scenario II. Current Technology Costs and Outputs
Energy Coincidence Factors Capacity Coinc

Table 6.3.2 Fuel Cell Screening Tool Inputs 8/19/2003
Fuel Cell MCFC FuelCell Zone G - Lower HV Base 14 $2,800 7,446 8% 6% 36% 6% 8% 37% 100% 90%Fuel Cell MCFC FuelCell Zone J - NYC Base 14 $2,800 7,446 8% 6% 36% 6% 8% 37% 100% 90%Fuel Cell MCFC FuelCell Zone K - Long Island Base 14 $2,800 7,446 8% 6% 36% 6% 8% 37% 100% 90%Fuel Cell PEM FuelCell Statewide CPI 14 $5,500 4,595 6% 35% 9% 7% 36% 7% 100% 60%Fuel Cell PEM FuelCell Zone A - West CPI 14 $5,500 4,595 6% 35% 9% 7% 36% 7% 100% 60%Fuel Cell PEM FuelCell Zone F - Capital CPI 14 $5,500 4,595 6% 35% 9% 7% 36% 7% 100% 60%Fuel Cell PEM FuelCell Zone G - Lower HV CPI 14 $5,500 4,595 6% 35% 9% 7% 36% 7% 100% 60%Fuel Cell PEM FuelCell Zone J - NYC CPI 14 $5,500 4,595 6% 35% 9% 7% 36% 7% 100% 60%Fuel Cell PEM FuelCell Zone K - Long Island CPI 14 $5,500 4,595 6% 35% 9% 7% 36% 7% 100% 60%Fuel Cell PAFC FuelCell Statewide CPI 17 $4,500 7,446 5% 38% 8% 6% 38% 6% 100% 90%Fuel Cell PAFC FuelCell Zone A - West CPI 17 $4,500 7,446 5% 38% 8% 6% 38% 6% 100% 90%Fuel Cell PAFC FuelCell Zone F - Capital CPI 17 $4,500 7,446 5% 38% 8% 6% 38% 6% 100% 90%Fuel Cell PAFC FuelCell Zone G - Lower HV CPI 17 $4,500 7,446 5% 38% 8% 6% 38% 6% 100% 90%Fuel Cell PAFC FuelCell Zone J - NYC CPI 17 $4,500 7,446 5% 38% 8% 6% 38% 6% 100% 90%Fuel Cell PAFC FuelCell Zone K - Long Island CPI 17 $4,500 7,446 5% 38% 8% 6% 38% 6% 100% 90%Fuel Cell SOFC FuelCell Statewide CPI 26 $3,500 7,446 5% 38% 8% 6% 38% 6% 100% 90%Fuel Cell SOFC FuelCell Zone A - West CPI 26 $3,500 7,446 5% 38% 8% 6% 38% 6% 100% 90%Fuel Cell SOFC FuelCell Zone F - Capital CPI 26 $3,500 7,446 5% 38% 8% 6% 38% 6% 100% 90%Fuel Cell SOFC FuelCell Zone G - Lower HV CPI 26 $3,500 7,446 5% 38% 8% 6% 38% 6% 100% 90%Fuel Cell SOFC FuelCell Zone J - NYC CPI 26 $3,500 7,446 5% 38% 8% 6% 38% 6% 100% 90%Fuel Cell SOFC FuelCell Zone K - Long Island CPI 26 $3,500 7,446 5% 38% 8% 6% 38% 6% 100% 90%Fuel Cell MCFC FuelCell Statewide CPI 14 $2,800 7,446 8% 6% 36% 6% 8% 37% 100% 90%Fuel Cell MCFC FuelCell Zone A - West CPI 14 $2,800 7,446 8% 6% 36% 6% 8% 37% 100% 90%Fuel Cell MCFC FuelCell Zone F - Capital CPI 14 $2,800 7,446 8% 6% 36% 6% 8% 37% 100% 90%Fuel Cell MCFC FuelCell Zone G - Lower HV CPI 14 $2,800 7,446 8% 6% 36% 6% 8% 37% 100% 90%Fuel Cell MCFC FuelCell Zone J - NYC CPI 14 $2,800 7,446 8% 6% 36% 6% 8% 37% 100% 90%Fuel Cell MCFC FuelCell Zone K - Long Island CPI 14 $2,800 7,446 8% 6% 36% 6% 8% 37% 100% 90%Fuel Cell PEM FuelCell Statewide GHG 14 $5,500 4,595 6% 35% 9% 7% 36% 7% 100% 60%Fuel Cell PEM FuelCell Zone A - West GHG 14 $5,500 4,595 6% 35% 9% 7% 36% 7% 100% 60%Fuel Cell PEM FuelCell Zone F - Capital GHG 14 $5,500 4,595 6% 35% 9% 7% 36% 7% 100% 60%Fuel Cell PEM FuelCell Zone G - Lower HV GHG 14 $5,500 4,595 6% 35% 9% 7% 36% 7% 100% 60%Fuel Cell PEM FuelCell Zone J - NYC GHG 14 $5,500 4,595 6% 35% 9% 7% 36% 7% 100% 60%Fuel Cell PEM FuelCell Zone K - Long Island GHG 14 $5,500 4,595 6% 35% 9% 7% 36% 7% 100% 60%Fuel Cell PAFC FuelCell Statewide GHG 17 $4,500 7,446 5% 38% 8% 6% 38% 6% 100% 90%Fuel Cell PAFC FuelCell Zone A - West GHG 17 $4,500 7,446 5% 38% 8% 6% 38% 6% 100% 90%Fuel Cell PAFC FuelCell Zone F - Capital GHG 17 $4,500 7,446 5% 38% 8% 6% 38% 6% 100% 90%Fuel Cell PAFC FuelCell Zone G - Lower HV GHG 17 $4,500 7,446 5% 38% 8% 6% 38% 6% 100% 90%Fuel Cell PAFC FuelCell Zone J - NYC GHG 17 $4,500 7,446 5% 38% 8% 6% 38% 6% 100% 90%Fuel Cell PAFC FuelCell Zone K - Long Island GHG 17 $4,500 7,446 5% 38% 8% 6% 38% 6% 100% 90%Fuel Cell SOFC FuelCell Statewide GHG 26 $3,500 7,446 5% 38% 8% 6% 38% 6% 100% 90%Fuel Cell SOFC FuelCell Zone A - West GHG 26 $3,500 7,446 5% 38% 8% 6% 38% 6% 100% 90%Fuel Cell SOFC FuelCell Zone F - Capital GHG 26 $3,500 7,446 5% 38% 8% 6% 38% 6% 100% 90%Fuel Cell SOFC FuelCell Zone G - Lower HV GHG 26 $3,500 7,446 5% 38% 8% 6% 38% 6% 100% 90%Fuel Cell SOFC FuelCell Zone J - NYC GHG 26 $3,500 7,446 5% 38% 8% 6% 38% 6% 100% 90%Fuel Cell SOFC FuelCell Zone K - Long Island GHG 26 $3,500 7,446 5% 38% 8% 6% 38% 6% 100% 90%Fuel Cell MCFC FuelCell Statewide GHG 14 $2,800 7,446 8% 6% 36% 6% 8% 37% 100% 90%Fuel Cell MCFC FuelCell Zone A - West GHG 14 $2,800 7,446 8% 6% 36% 6% 8% 37% 100% 90%Fuel Cell MCFC FuelCell Zone F - Capital GHG 14 $2,800 7,446 8% 6% 36% 6% 8% 37% 100% 90%Fuel Cell MCFC FuelCell Zone G - Lower HV GHG 14 $2,800 7,446 8% 6% 36% 6% 8% 37% 100% 90%Fuel Cell MCFC FuelCell Zone J - NYC GHG 14 $2,800 7,446 8% 6% 36% 6% 8% 37% 100% 90%Fuel Cell MCFC FuelCell Zone K - Long Island GHG 14 $2,800 7,446 8% 6% 36% 6% 8% 37% 100% 90%

Table 6.3.2 Fuel Cell Screening Tool Inputs 8/19/2003
P Q R S T U V W X Y Z AA AB AC AD AE AF
Winter Generation Capacity % of Max Output
Fossil Fuel Type
Fossil Fuel Usage MMBTU/Yr
Real Levelized O&M $/yr
Installed Capacity (kW) 2003
Installed Capacity (kW) 2007
Installed Capacity (kW) 2012
Installed Capacity (kW) 2022
Total Installed Cost ($/kW of rated max output) 2007
Total Installed Cost ($/kW of rated max output) 2012
Total Installed Cost ($/kW of rated max output) 2022
Real Levelized O&M $/yr 2007
Real Levelized O&M $/yr 2012
Real Levelized O&M $/yr 2022
Annual kWh/kW -2007
Annual kWh/kW -2012
Annual kWh/kW -2022
65% 4 45.95 $18 1,144 1,912 67,007 649,418 1,000 800 600 13 15 14 4,595 4,595 4,59565% 4 45.95 $18 103 172 6,033 58,474 1,000 800 600 13 15 14 4,595 4,595 4,59565% 4 45.95 $18 70 117 4,098 39,717 1,000 800 600 13 15 14 4,595 4,595 4,59565% 4 45.95 $18 84 140 4,922 47,700 1,000 800 600 13 15 14 4,595 4,595 4,59565% 4 45.95 $18 321 537 18,822 182,418 1,000 800 600 13 15 14 4,595 4,595 4,59565% 4 45.95 $18 179 298 10,461 101,386 1,000 800 600 13 15 14 4,595 4,595 4,59590% 4 70.74 $21 13,300 27,579 209,427 783,500 1,000 600 400 18 13 14 7,446 7,446 7,44690% 4 70.74 $21 1,064 2,206 16,754 62,680 1,000 600 400 18 13 14 7,446 7,446 7,44690% 4 70.74 $21 732 1,517 11,518 43,093 1,000 600 400 18 13 14 7,446 7,446 7,44690% 4 70.74 $21 718 1,489 11,309 42,309 1,000 600 400 18 13 14 7,446 7,446 7,44690% 4 70.74 $21 5,985 12,411 94,242 352,575 1,000 600 400 18 13 14 7,446 7,446 7,44690% 4 70.74 $21 1,729 3,585 27,226 101,855 1,000 600 400 18 13 14 7,446 7,446 7,44690% 4 39.09 $29 3,320 19,529 148,230 928,704 1,000 600 400 24 17 19 7,446 7,446 7,44690% 4 39.09 $29 385 2,265 17,195 107,730 1,000 600 400 24 17 19 7,446 7,446 7,44690% 4 39.09 $29 262 1,543 11,710 73,368 1,000 600 400 24 17 19 7,446 7,446 7,44690% 4 39.09 $29 219 1,289 9,783 61,294 1,000 600 400 24 17 19 7,446 7,446 7,44690% 4 39.09 $29 1,106 6,503 49,361 309,258 1,000 600 400 24 17 19 7,446 7,446 7,44690% 4 39.09 $29 375 2,207 16,750 104,944 1,000 600 400 24 17 19 7,446 7,446 7,44690% 4 39.09 $41 8,300 32,005 243,042 2,494,750 1,000 600 400 34 25 27 7,446 7,446 7,44690% 4 39.09 $41 1,710 6,593 50,067 513,919 1,000 600 400 34 25 27 7,446 7,446 7,44690% 4 39.09 $41 1,162 4,481 34,026 349,265 1,000 600 400 34 25 27 7,446 7,446 7,44690% 4 39.09 $41 797 3,072 23,332 239,496 1,000 600 400 34 25 27 7,446 7,446 7,44690% 4 39.09 $41 332 1,280 9,722 99,790 1,000 600 400 34 25 27 7,446 7,446 7,44690% 4 39.09 $41 598 2,304 17,499 179,622 1,000 600 400 34 25 27 7,446 7,446 7,44665% 4 45.95 $71 770 770 770 770 4,750 3,650 2,000 62 55 39 4,595 4,595 4,59565% 4 45.95 $71 69 69 69 69 4,750 3,650 2,000 62 55 39 4,595 4,595 4,59565% 4 45.95 $71 47 47 47 47 4,750 3,650 2,000 62 55 39 4,595 4,595 4,59565% 4 45.95 $71 56 56 56 56 4,750 3,650 2,000 62 55 39 4,595 4,595 4,59565% 4 45.95 $71 216 216 216 216 4,750 3,650 2,000 62 55 39 4,595 4,595 4,59565% 4 45.95 $71 120 120 120 120 4,750 3,650 2,000 62 55 39 4,595 4,595 4,59590% 4 70.74 $81 5,600 5,600 5,600 5,600 4,000 3,370 2,270 72 68 54 7,446 7,446 7,44690% 4 70.74 $81 504 504 504 504 4,000 3,370 2,270 72 68 54 7,446 7,446 7,44690% 4 70.74 $81 342 342 342 342 4,000 3,370 2,270 72 68 54 7,446 7,446 7,44690% 4 70.74 $81 409 409 409 409 4,000 3,370 2,270 72 68 54 7,446 7,446 7,44690% 4 70.74 $81 1,574 1,574 1,574 1,574 4,000 3,370 2,270 72 68 54 7,446 7,446 7,44690% 4 70.74 $81 874 874 874 874 4,000 3,370 2,270 72 68 54 7,446 7,446 7,44690% 4 39.09 $84 0 0 0 0 3,050 2,440 1,660 73 67 57 7,446 7,446 7,44690% 4 39.09 $84 0 0 0 0 3,050 2,440 1,660 73 67 57 7,446 7,446 7,44690% 4 39.09 $84 0 0 0 0 3,050 2,440 1,660 73 67 57 7,446 7,446 7,44690% 4 39.09 $84 0 0 0 0 3,050 2,440 1,660 73 67 57 7,446 7,446 7,44690% 4 39.09 $84 0 0 0 0 3,050 2,440 1,660 73 67 57 7,446 7,446 7,44690% 4 39.09 $84 0 0 0 0 3,050 2,440 1,660 73 67 57 7,446 7,446 7,44690% 4 39.09 $96 0 0 0 0 2,324 1,756 885 79 72 48 7,446 7,446 7,44690% 4 39.09 $96 0 0 0 0 2,324 1,756 885 79 72 48 7,446 7,446 7,44690% 4 39.09 $96 0 0 0 0 2,324 1,756 885 79 72 48 7,446 7,446 7,446
III. Penetrations IV. Future Costs & Outputs
Levelized O&M Costs Technology Output (kWh/kW installed)cidence Factors Installed Costs

Table 6.3.2 Fuel Cell Screening Tool Inputs 8/19/2003
90% 4 39.09 $96 0 0 0 0 2,324 1,756 885 79 72 48 7,446 7,446 7,44690% 4 39.09 $96 0 0 0 0 2,324 1,756 885 79 72 48 7,446 7,446 7,44690% 4 39.09 $96 0 0 0 0 2,324 1,756 885 79 72 48 7,446 7,446 7,44665% 4 45.95 $71 770 1,544 5,707 9,771 4,750 3,650 2,000 62 55 39 4,595 4,595 4,59565% 4 45.95 $71 69 139 514 880 4,750 3,650 2,000 62 55 39 4,595 4,595 4,59565% 4 45.95 $71 47 94 349 598 4,750 3,650 2,000 62 55 39 4,595 4,595 4,59565% 4 45.95 $71 57 113 419 718 4,750 3,650 2,000 62 55 39 4,595 4,595 4,59565% 4 45.95 $71 216 434 1,603 2,745 4,750 3,650 2,000 62 55 39 4,595 4,595 4,59565% 4 45.95 $71 120 241 891 1,525 4,750 3,650 2,000 62 55 39 4,595 4,595 4,59590% 4 70.74 $81 5,600 8,630 17,120 29,309 4,000 3,370 2,270 72 68 54 7,446 7,446 7,44690% 4 70.74 $81 448 690 1,370 2,345 4,000 3,370 2,270 72 68 54 7,446 7,446 7,44690% 4 70.74 $81 308 475 942 1,612 4,000 3,370 2,270 72 68 54 7,446 7,446 7,44690% 4 70.74 $81 302 466 924 1,583 4,000 3,370 2,270 72 68 54 7,446 7,446 7,44690% 4 70.74 $81 2,520 3,884 7,704 13,189 4,000 3,370 2,270 72 68 54 7,446 7,446 7,44690% 4 70.74 $81 728 1,122 2,226 3,810 4,000 3,370 2,270 72 68 54 7,446 7,446 7,44690% 4 39.09 $84 0 1,216 5,179 8,866 3,050 2,440 1,660 73 67 57 7,446 7,446 7,44690% 4 39.09 $84 0 141 601 1,028 3,050 2,440 1,660 73 67 57 7,446 7,446 7,44690% 4 39.09 $84 0 96 409 700 3,050 2,440 1,660 73 67 57 7,446 7,446 7,44690% 4 39.09 $84 0 80 342 585 3,050 2,440 1,660 73 67 57 7,446 7,446 7,44690% 4 39.09 $84 0 405 1,724 2,952 3,050 2,440 1,660 73 67 57 7,446 7,446 7,44690% 4 39.09 $84 0 137 585 1,002 3,050 2,440 1,660 73 67 57 7,446 7,446 7,44690% 4 39.09 $96 0 2,431 10,357 17,731 2,324 1,756 885 79 72 48 7,446 7,446 7,44690% 4 39.09 $96 0 501 2,134 3,653 2,324 1,756 885 79 72 48 7,446 7,446 7,44690% 4 39.09 $96 0 340 1,450 2,482 2,324 1,756 885 79 72 48 7,446 7,446 7,44690% 4 39.09 $96 0 233 994 1,702 2,324 1,756 885 79 72 48 7,446 7,446 7,44690% 4 39.09 $96 0 97 414 709 2,324 1,756 885 79 72 48 7,446 7,446 7,44690% 4 39.09 $96 0 175 746 1,277 2,324 1,756 885 79 72 48 7,446 7,446 7,44665% 4 45.95 $71 770 1,859 9,603 43,590 4,750 3,650 2,000 62 55 39 4,595 4,595 4,59565% 4 45.95 $71 69 167 865 3,925 4,750 3,650 2,000 62 55 39 4,595 4,595 4,59565% 4 45.95 $71 47 114 587 2,666 4,750 3,650 2,000 62 55 39 4,595 4,595 4,59565% 4 45.95 $71 57 137 705 3,202 4,750 3,650 2,000 62 55 39 4,595 4,595 4,59565% 4 45.95 $71 216 522 2,698 12,244 4,750 3,650 2,000 62 55 39 4,595 4,595 4,59565% 4 45.95 $71 120 290 1,499 6,805 4,750 3,650 2,000 62 55 39 4,595 4,595 4,59590% 4 70.74 $81 5,600 10,395 30,843 139,998 4,000 3,370 2,270 72 68 54 7,446 7,446 7,44690% 4 70.74 $81 448 832 2,467 11,200 4,000 3,370 2,270 72 68 54 7,446 7,446 7,44690% 4 70.74 $81 308 572 1,696 7,700 4,000 3,370 2,270 72 68 54 7,446 7,446 7,44690% 4 70.74 $81 302 561 1,666 7,560 4,000 3,370 2,270 72 68 54 7,446 7,446 7,44690% 4 70.74 $81 2,520 4,678 13,879 62,999 4,000 3,370 2,270 72 68 54 7,446 7,446 7,44690% 4 70.74 $81 728 1,351 4,010 18,200 4,000 3,370 2,270 72 68 54 7,446 7,446 7,44690% 4 39.09 $84 0 1,464 8,620 39,126 3,050 2,440 1,660 73 67 57 7,446 7,446 7,44690% 4 39.09 $84 0 170 1,000 4,539 3,050 2,440 1,660 73 67 57 7,446 7,446 7,44690% 4 39.09 $84 0 116 681 3,091 3,050 2,440 1,660 73 67 57 7,446 7,446 7,44690% 4 39.09 $84 0 97 569 2,582 3,050 2,440 1,660 73 67 57 7,446 7,446 7,44690% 4 39.09 $84 0 488 2,870 13,029 3,050 2,440 1,660 73 67 57 7,446 7,446 7,44690% 4 39.09 $84 0 165 974 4,421 3,050 2,440 1,660 73 67 57 7,446 7,446 7,44690% 4 39.09 $96 0 2,928 17,240 78,251 2,324 1,756 885 79 72 48 7,446 7,446 7,44690% 4 39.09 $96 0 603 3,551 16,120 2,324 1,756 885 79 72 48 7,446 7,446 7,44690% 4 39.09 $96 0 410 2,414 10,955 2,324 1,756 885 79 72 48 7,446 7,446 7,44690% 4 39.09 $96 0 281 1,655 7,512 2,324 1,756 885 79 72 48 7,446 7,446 7,44690% 4 39.09 $96 0 117 690 3,130 2,324 1,756 885 79 72 48 7,446 7,446 7,44690% 4 39.09 $96 0 211 1,241 5,634 2,324 1,756 885 79 72 48 7,446 7,446 7,446

Table 6.3.3 Hydropower Screening Inputs 8/19/2003
1
2
3
4567891011121314151617181920212223242526272829303132333435363738394041424344454647484950515253545556575859
A B C D E F G H I J K L M N O P Q R SA B C D E F G H I J K L M N O P Q R S
Measure Name ResourcZone Scenario Technology Life
Total Installed Cost ($/kW of rated max output)
Annual kWh/kW produced -2003
Summer On- Peak %
Summer Off - Peak %
Summer Shoulder %
Winter On Peak %
Winter Off - Peak %
Winter Shoulder %
Energy Period Sum (Sum Col F -Col K) Should equal 100%
Summer Generation Capacity % of Max Output
Winter Generation Capacity % of Max Output
Fossil Fuel Type
Fossil Fuel Usage MMBTU/Yr
Real Levelized O&M $/yr
Hydro Relicense Hydro Statewide Tech 30 $ - 5726 4% 32% 6% 7% 44% 7% 100% 36% 47% $54.77Hydro Relicense Hydro Zone A - West Tech 30 $ - 5726 4% 32% 6% 7% 44% 7% 100% 36% 47% $54.77Hydro Relicense Hydro Zone F - Capital Tech 30 $ - 5726 4% 32% 6% 7% 44% 7% 100% 36% 47% $54.77Hydro Relicense Hydro Zone G - Lower HV Tech 30 $ - 5726 4% 32% 6% 7% 44% 7% 100% 36% 47% $54.77Hydro Relicense Hydro Zone J - NYC Tech 30 $ - 5726 4% 32% 6% 7% 44% 7% 100% 36% 47% $54.77Hydro Relicense Hydro Zone K - Long Island Tech 30 $ - 5726 4% 32% 6% 7% 44% 7% 100% 36% 47% $54.77Hydro Repower Hydro Statewide Tech 30 $1,000 1,314 4% 32% 6% 7% 44% 7% 100% 36% 47% $12.57Hydro Repower Hydro Zone A - West Tech 30 $1,600 1,314 4% 32% 6% 7% 44% 7% 100% 36% 47% $12.57Hydro Repower Hydro Zone F - Capital Tech 30 $1,000 1,314 4% 32% 6% 7% 44% 7% 100% 36% 47% $12.57Hydro Repower Hydro Zone G - Lower HV Tech 30 $1,000 1,314 4% 32% 6% 7% 44% 7% 100% 36% 47% $12.57Hydro Repower Hydro Zone J - NYC Tech 30 $1,000 1,314 4% 32% 6% 7% 44% 7% 100% 36% 47% $12.57Hydro Repower Hydro Zone K - Long Island Tech 30 $1,000 1,314 4% 32% 6% 7% 44% 7% 100% 36% 47% $12.57Hydro Ex Capacity Ex Dam Hydro Statewide Tech 50 $1,434 2,278 4% 32% 6% 7% 44% 7% 100% 36% 47% $31.70Hydro Ex Capacity Ex Dam Hydro Zone A - West Tech 50 $1,434 2,278 4% 32% 6% 7% 44% 7% 100% 36% 47% $31.70Hydro Ex Capacity Ex Dam Hydro Zone F - Capital Tech 50 $1,434 2,278 4% 32% 6% 7% 44% 7% 100% 36% 47% $31.70Hydro Ex Capacity Ex Dam Hydro Zone G - Lower HV Tech 50 $1,434 2,278 4% 32% 6% 7% 44% 7% 100% 36% 47% $31.70Hydro Ex Capacity Ex Dam Hydro Zone J - NYC Tech 50 $1,434 2,278 4% 32% 6% 7% 44% 7% 100% 36% 47% $31.70Hydro Ex Capacity Ex Dam Hydro Zone K - Long Island Tech 50 $1,434 2,278 4% 32% 6% 7% 44% 7% 100% 36% 47% $31.70Hydro New Capacity Ex Dam Hydro Statewide Tech 50 $1,526 3,285 4% 32% 6% 7% 44% 7% 100% 36% 47% $50.33Hydro New Capacity Ex Dam Hydro Zone A - West Tech 50 $1,526 3,285 4% 32% 6% 7% 44% 7% 100% 36% 47% $50.33Hydro New Capacity Ex Dam Hydro Zone F - Capital Tech 50 $1,526 3,285 4% 32% 6% 7% 44% 7% 100% 36% 47% $50.33Hydro New Capacity Ex Dam Hydro Zone G - Lower HV Tech 50 $1,526 3,285 4% 32% 6% 7% 44% 7% 100% 36% 47% $50.33Hydro New Capacity Ex Dam Hydro Zone J - NYC Tech 50 $1,526 3,285 4% 32% 6% 7% 44% 7% 100% 36% 47% $50.33Hydro New Capacity Ex Dam Hydro Zone K - Long Island Tech 50 $1,526 3,285 4% 32% 6% 7% 44% 7% 100% 36% 47% $50.33Hydro New Dam sites Hydro Statewide Tech 50 $1,975 5,098 4% 32% 6% 7% 44% 7% 100% 36% 47% $31.10Hydro New Dam sites Hydro Zone A - West Tech 50 $1,975 5,098 4% 32% 6% 7% 44% 7% 100% 36% 47% $31.10Hydro New Dam sites Hydro Zone F - Capital Tech 50 $1,975 5,098 4% 32% 6% 7% 44% 7% 100% 36% 47% $31.10Hydro New Dam sites Hydro Zone G - Lower HV Tech 50 $1,975 5,098 4% 32% 6% 7% 44% 7% 100% 36% 47% $31.10Hydro New Dam sites Hydro Zone J - NYC Tech 50 $1,975 5,098 4% 32% 6% 7% 44% 7% 100% 36% 47% $31.10Hydro New Dam sites Hydro Zone K - Long Island Tech 50 $1,975 5,098 4% 32% 6% 7% 44% 7% 100% 36% 47% $31.10Hydro Relicense Hydro Statewide Base 30 $0 5,726 4% 32% 6% 7% 44% 7% 100% 36% 47% $54.77Hydro Relicense Hydro Zone A - West Base 30 $0 5,726 4% 32% 6% 7% 44% 7% 100% 36% 47% $54.77Hydro Relicense Hydro Zone F - Capital Base 30 $0 5,726 4% 32% 6% 7% 44% 7% 100% 36% 47% $54.77Hydro Relicense Hydro Zone G - Lower HV Base 30 $0 5,726 4% 32% 6% 7% 44% 7% 100% 36% 47% $54.77Hydro Relicense Hydro Zone J - NYC Base 30 $0 5,726 4% 32% 6% 7% 44% 7% 100% 36% 47% $54.77Hydro Relicense Hydro Zone K - Long Island Base 30 $0 5,726 4% 32% 6% 7% 44% 7% 100% 36% 47% $54.77Hydro Repower Hydro Statewide Base 20 $1,000 1,314 4% 32% 6% 7% 44% 7% 100% 36% 47% $15.99Hydro Repower Hydro Zone A - West Base 20 $1,600 1,314 4% 32% 6% 7% 44% 7% 100% 36% 47% $12.57Hydro Repower Hydro Zone F - Capital Base 20 $100 1,314 4% 32% 6% 7% 44% 7% 100% 36% 47% $12.57Hydro Repower Hydro Zone G - Lower HV Base 20 $100 1,314 4% 32% 6% 7% 44% 7% 100% 36% 47% $12.57Hydro Repower Hydro Zone J - NYC Base 20 $100 1,314 4% 32% 6% 7% 44% 7% 100% 36% 47% $12.57Hydro Repower Hydro Zone K - Long Island Base 20 $100 1,314 4% 32% 6% 7% 44% 7% 100% 36% 47% $12.57Hydro Ex Capacity Ex Dam Hydro Statewide Base 50 $1,434 2,278 4% 32% 6% 7% 44% 7% 100% 36% 47% $31.66Hydro Ex Capacity Ex Dam Hydro Zone A - West Base 50 $1,434 2,278 4% 32% 6% 7% 44% 7% 100% 36% 47% $31.70Hydro Ex Capacity Ex Dam Hydro Zone F - Capital Base 50 $1,434 2,278 4% 32% 6% 7% 44% 7% 100% 36% 47% $31.70Hydro Ex Capacity Ex Dam Hydro Zone G - Lower HV Base 50 $1,434 2,278 4% 32% 6% 7% 44% 7% 100% 36% 47% $31.70Hydro Ex Capacity Ex Dam Hydro Zone J - NYC Base 50 $1,434 2,278 4% 32% 6% 7% 44% 7% 100% 36% 47% $31.70Hydro Ex Capacity Ex Dam Hydro Zone K - Long Island Base 50 $1,434 2,278 4% 32% 6% 7% 44% 7% 100% 36% 47% $31.70Hydro New Capacity Ex Dam Hydro Statewide Base 50 $1,526 3,285 4% 32% 6% 7% 44% 7% 100% 36% 47% $50.33Hydro New Capacity Ex Dam Hydro Zone A - West Base 50 $1,526 3,285 4% 32% 6% 7% 44% 7% 100% 36% 47% $50.33Hydro New Capacity Ex Dam Hydro Zone F - Capital Base 50 $1,526 3,285 4% 32% 6% 7% 44% 7% 100% 36% 47% $50.33Hydro New Capacity Ex Dam Hydro Zone G - Lower HV Base 50 $1,526 3,285 4% 32% 6% 7% 44% 7% 100% 36% 47% $50.33Hydro New Capacity Ex Dam Hydro Zone J - NYC Base 50 $1,526 3,285 4% 32% 6% 7% 44% 7% 100% 36% 47% $50.33Hydro New Capacity Ex Dam Hydro Zone K - Long Island Base 50 $1,526 3,285 4% 32% 6% 7% 44% 7% 100% 36% 47% $50.33Hydro New Dam Sites Hydro Statewide Base 50 $1,975 5,098 4% 32% 6% 7% 44% 7% 100% 36% 47% 0 $31.10
I. Measure Name/Zone Scenario
Energy Coincidence Factors Capacity Coincidence Factors
II. Current Technology Costs and Outputs

Table 6.3.3 Hydropower Screening Inputs 8/19/2003
60616263646566676869707172737475767778798081828384858687888990919293949596979899100101102103104105106107108109110111112113114115116117118119120121122123124
A B C D E F G H I J K L M N O P Q R SHydro New Dam Sites Hydro Zone A - West Base 50 $1,975 5,098 4% 32% 6% 7% 44% 7% 100% 36% 47% $31.10Hydro New Dam Sites Hydro Zone F - Capital Base 50 $1,975 5,098 4% 32% 6% 7% 44% 7% 100% 36% 47% $31.10Hydro New Dam Sites Hydro Zone G - Lower HV Base 50 $1,975 5,098 4% 32% 6% 7% 44% 7% 100% 36% 47% $31.10Hydro New Dam Sites Hydro Zone J - NYC Base 50 $1,975 5,098 4% 32% 6% 7% 44% 7% 100% 36% 47% $31.10Hydro New Dam Sites Hydro Zone K - Long Island Base 50 $1,975 5,098 4% 32% 6% 7% 44% 7% 100% 36% 47% $31.10Hydro Relicense Hydro Statewide CPI 30 $0 5,726 4% 32% 6% 7% 44% 7% 100% 36% 47% $54.77Hydro Relicense Hydro Zone A - West CPI 30 $0 5,726 4% 32% 6% 7% 44% 7% 100% 36% 47% $54.77Hydro Relicense Hydro Zone F - Capital CPI 30 $0 5,726 4% 32% 6% 7% 44% 7% 100% 36% 47% $54.77Hydro Relicense Hydro Zone G - Lower HV CPI 30 $0 5,726 4% 32% 6% 7% 44% 7% 100% 36% 47% $54.77Hydro Relicense Hydro Zone J - NYC CPI 30 $0 5,726 4% 32% 6% 7% 44% 7% 100% 36% 47% $54.77Hydro Relicense Hydro Zone K - Long Island CPI 30 $0 5,726 4% 32% 6% 7% 44% 7% 100% 36% 47% $54.77Hydro Repower Hydro Statewide CPI 20 $1,000 1,314 4% 32% 6% 7% 44% 7% 100% 36% 47% $15.99Hydro Repower Hydro Zone A - West CPI 20 $1,600 1,314 4% 32% 6% 7% 44% 7% 100% 36% 47% $15.99Hydro Repower Hydro Zone F - Capital CPI 20 $100 1,314 4% 32% 6% 7% 44% 7% 100% 36% 47% $15.99Hydro Repower Hydro Zone G - Lower HV CPI 20 $100 1,314 4% 32% 6% 7% 44% 7% 100% 36% 47% $15.99Hydro Repower Hydro Zone J - NYC CPI 20 $100 1,314 4% 32% 6% 7% 44% 7% 100% 36% 47% $15.99Hydro Repower Hydro Zone K - Long Island CPI 20 $100 1,314 4% 32% 6% 7% 44% 7% 100% 36% 47% $15.99Hydro Ex Capacity Ex Dam Hydro Statewide CPI 50 $1,434 2,278 4% 32% 6% 7% 44% 7% 100% 36% 47% $31.70Hydro Ex Capacity Ex Dam Hydro Zone A - West CPI 50 $1,434 2,278 4% 32% 6% 7% 44% 7% 100% 36% 47% $31.70Hydro Ex Capacity Ex Dam Hydro Zone F - Capital CPI 50 $1,434 2,278 4% 32% 6% 7% 44% 7% 100% 36% 47% $31.70Hydro Ex Capacity Ex Dam Hydro Zone G - Lower HV CPI 50 $1,434 2,278 4% 32% 6% 7% 44% 7% 100% 36% 47% $31.70Hydro Ex Capacity Ex Dam Hydro Zone J - NYC CPI 50 $1,434 2,278 4% 32% 6% 7% 44% 7% 100% 36% 47% $31.70Hydro Ex Capacity Ex Dam Hydro Zone K - Long Island CPI 50 $1,434 2,278 4% 32% 6% 7% 44% 7% 100% 36% 47% $31.70Hydro New Capacity Ex Dam Hydro Statewide CPI 50 $1,526 3,285 4% 32% 6% 7% 44% 7% 100% 36% 47% $50.33Hydro New Capacity Ex Dam Hydro Zone A - West CPI 50 $1,526 3,285 4% 32% 6% 7% 44% 7% 100% 36% 47% $50.33Hydro New Capacity Ex Dam Hydro Zone F - Capital CPI 50 $1,526 3,285 4% 32% 6% 7% 44% 7% 100% 36% 47% $50.33Hydro New Capacity Ex Dam Hydro Zone G - Lower HV CPI 50 $1,526 3,285 4% 32% 6% 7% 44% 7% 100% 36% 47% $50.33Hydro New Capacity Ex Dam Hydro Zone J - NYC CPI 50 $1,526 3,285 4% 32% 6% 7% 44% 7% 100% 36% 47% $50.33Hydro New Capacity Ex Dam Hydro Zone K - Long Island CPI 50 $1,526 3,285 4% 32% 6% 7% 44% 7% 100% 36% 47% $50.33Hydro New Dam Sites Hydro Statewide CPI 50 $1,975 5,098 4% 32% 6% 7% 44% 7% 100% 36% 47% $31.10Hydro New Dam Sites Hydro Zone A - West CPI 50 $1,975 5,098 4% 32% 6% 7% 44% 7% 100% 36% 47% $31.10Hydro New Dam Sites Hydro Zone F - Capital CPI 50 $1,975 5,098 4% 32% 6% 7% 44% 7% 100% 36% 47% $31.10Hydro New Dam Sites Hydro Zone G - Lower HV CPI 50 $1,975 5,098 4% 32% 6% 7% 44% 7% 100% 36% 47% $31.10Hydro New Dam Sites Hydro Zone J - NYC CPI 50 $1,975 5,098 4% 32% 6% 7% 44% 7% 100% 36% 47% $31.10Hydro New Dam Sites Hydro Zone K - Long Island CPI 50 $1,975 5,098 4% 32% 6% 7% 44% 7% 100% 36% 47% $31.10Hydro Relicense Hydro Statewide GHG 30 $0 5,726 4% 32% 6% 7% 44% 7% 100% 36% 47% $54.77Hydro Relicense Hydro Zone A - West GHG 30 $0 5,726 4% 32% 6% 7% 44% 7% 100% 36% 47% $54.77Hydro Relicense Hydro Zone F - Capital GHG 30 $0 5,726 4% 32% 6% 7% 44% 7% 100% 36% 47% $54.77Hydro Relicense Hydro Zone G - Lower HV GHG 30 $0 5,726 4% 32% 6% 7% 44% 7% 100% 36% 47% $54.77Hydro Relicense Hydro Zone J - NYC GHG 30 $0 5,726 4% 32% 6% 7% 44% 7% 100% 36% 47% $54.77Hydro Relicense Hydro Zone K - Long Island GHG 30 $0 5,726 4% 32% 6% 7% 44% 7% 100% 36% 47% $54.77Hydro Repower Hydro Statewide GHG 20 $1,000 1,314 4% 32% 6% 7% 44% 7% 100% 36% 47% $15.99Hydro Repower Hydro Zone A - West GHG 20 $1,600 1,314 4% 32% 6% 7% 44% 7% 100% 36% 47% $15.99Hydro Repower Hydro Zone F - Capital GHG 20 $100 1,314 4% 32% 6% 7% 44% 7% 100% 36% 47% $15.99Hydro Repower Hydro Zone G - Lower HV GHG 20 $100 1,314 4% 32% 6% 7% 44% 7% 100% 36% 47% $15.99Hydro Repower Hydro Zone J - NYC GHG 20 $100 1,314 4% 32% 6% 7% 44% 7% 100% 36% 47% $15.99Hydro Repower Hydro Zone K - Long Island GHG 20 $100 1,314 4% 32% 6% 7% 44% 7% 100% 36% 47% $15.99Hydro Ex Capacity Ex Dam Hydro Statewide GHG 50 $1,434 2,278 4% 32% 6% 7% 44% 7% 100% 36% 47% $31.66Hydro Ex Capacity Ex Dam Hydro Zone A - West GHG 50 $1,434 2,278 4% 32% 6% 7% 44% 7% 100% 36% 47% $31.66Hydro Ex Capacity Ex Dam Hydro Zone F - Capital GHG 50 $1,434 2,278 4% 32% 6% 7% 44% 7% 100% 36% 47% $31.66Hydro Ex Capacity Ex Dam Hydro Zone G - Lower HV GHG 50 $1,434 2,278 4% 32% 6% 7% 44% 7% 100% 36% 47% $31.66Hydro Ex Capacity Ex Dam Hydro Zone J - NYC GHG 50 $1,434 2,278 4% 32% 6% 7% 44% 7% 100% 36% 47% $31.66Hydro Ex Capacity Ex Dam Hydro Zone K - Long Island GHG 50 $1,434 2,278 4% 32% 6% 7% 44% 7% 100% 36% 47% $31.66Hydro New Capacity Ex Dam Hydro Statewide GHG 50 $1,526 3,285 4% 32% 6% 7% 44% 7% 100% 36% 47% $50.33Hydro New Capacity Ex Dam Hydro Zone A - West GHG 50 $1,526 3,285 4% 32% 6% 7% 44% 7% 100% 36% 47% $50.33Hydro New Capacity Ex Dam Hydro Zone F - Capital GHG 50 $1,526 3,285 4% 32% 6% 7% 44% 7% 100% 36% 47% $50.33Hydro New Capacity Ex Dam Hydro Zone G - Lower HV GHG 50 $1,526 3,285 4% 32% 6% 7% 44% 7% 100% 36% 47% $50.33Hydro New Capacity Ex Dam Hydro Zone J - NYC GHG 50 $1,526 3,285 4% 32% 6% 7% 44% 7% 100% 36% 47% $50.33Hydro New Capacity Ex Dam Hydro Zone K - Long Island GHG 50 $1,526 3,285 4% 32% 6% 7% 44% 7% 100% 36% 47% $50.33Hydro New Dam Sites Hydro Statewide GHG 50 $1,975 5,098 4% 32% 6% 7% 44% 7% 100% 36% 47% $31.10Hydro New Dam Sites Hydro Zone A - West GHG 50 $1,975 5,098 4% 32% 6% 7% 44% 7% 100% 36% 47% $31.10Hydro New Dam Sites Hydro Zone F - Capital GHG 50 $1,975 5,098 4% 32% 6% 7% 44% 7% 100% 36% 47% $31.10Hydro New Dam Sites Hydro Zone G - Lower HV GHG 50 $1,975 5,098 4% 32% 6% 7% 44% 7% 100% 36% 47% $31.10Hydro New Dam Sites Hydro Zone J - NYC GHG 50 $1,975 5,098 4% 32% 6% 7% 44% 7% 100% 36% 47% $31.10Hydro New Dam Sites Hydro Zone K - Long Island GHG 50 $1,975 5,098 4% 32% 6% 7% 44% 7% 100% 36% 47% $31.10

Table 6.3.3 Hydropower Screening Inputs 8/19/2003
1
2
3
4567891011121314151617181920212223242526272829303132333435363738394041424344454647484950515253545556575859
T U V W X Y Z AA AB AC AD AE AFT U V W X Y Z AA AB AC AD AE AF
Installed Capacity (kW) 2003
Installed Capacity (kW) 2007
Installed Capacity (kW) 2012
Installed Capacity (kW) 2022
Total Installed Cost ($/kW of rated max output) 2007
Total Installed Cost ($/kW of rated max output) 2012
Total Installed Cost ($/kW of rated max output) 2022
Real Levelized O&M $/yr 2007
Real Levelized O&M $/yr 2012
Real Levelized O&M $/yr 2022
Annual kWh/kW -2007
Annual kWh/kW -2012
Annual kWh/kW -2022
1,020,280 3,822,950 3,861,981 3,916,812 0 0 0 54.77$ 54.77$ 54.77$ 5726 5726 5726 - 2,755,000 2,755,000 2,755,000 0 0 0 54.77$ 54.77$ 54.77$ 5726 5726 5726 - - 6,000 6,000 0 0 0 54.77$ 54.77$ 54.77$ 5726 5726 5726 - 2,800 2,800 2,800 0 0 0 54.77$ 54.77$ 54.77$ 5726 5726 5726 - - - - 0 0 0 54.77$ 54.77$ 54.77$ 5726 5726 5726 - - - - 0 0 0 54.77$ 54.77$ 54.77$ 5726 5726 5726
0 300,000 335,970 408,353 1,000 1,000 1,000 12.57$ 12.57$ 12.57$ 1,314 1,314 1,3140 300,000 300,000 300,000 1,600 1,600 1,600 12.57$ 12.57$ 12.57$ 1,314 1,314 1,3140 0 6,500 20,000 1,000 1,000 1,000 12.57$ 12.57$ 12.57$ 1,314 1,314 1,3140 0 3,500 10,000 1,000 1,000 1,000 12.57$ 12.57$ 12.57$ 1,314 1,314 1,3140 0 0 0 1,000 1,000 1,000 12.57$ 12.57$ 12.57$ 1,314 1,314 1,3140 0 0 0 1,000 1,000 1,000 12.57$ 12.57$ 12.57$ 1,314 1,314 1,3140 19,063 114,376 285,939 1,434 1,434 1,434 31.70$ 31.70$ 31.70$ 2,278 2,278 2,2780 395 2,370 5,925 1,434 1,434 1,434 31.70$ 31.70$ 31.70$ 2,278 2,278 2,2780 4,888 29,326 73,315 1,434 1,434 1,434 31.70$ 31.70$ 31.70$ 2,278 2,278 2,2780 0 0 0 1,434 1,434 1,434 31.70$ 31.70$ 31.70$ 2,278 2,278 2,2780 0 0 0 1,434 1,434 1,434 31.70$ 31.70$ 31.70$ 2,278 2,278 2,2780 0 0 0 1,434 1,434 1,434 31.70$ 31.70$ 31.70$ 2,278 2,278 2,2780 50,260 301,563 753,908 1,526 1,526 1,526 50.33$ 50.33$ 50.33$ 3,285 3,285 3,2850 83 83 83 1,526 1,526 1,526 50.33$ 50.33$ 50.33$ 3,285 3,285 3,2850 13,356 80,138 200,346 1,526 1,526 1,526 50.33$ 50.33$ 50.33$ 3,285 3,285 3,2850 1,801 10,808 27,020 1,526 1,526 1,526 50.33$ 50.33$ 50.33$ 3,285 3,285 3,2850 0 0 0 1,526 1,526 1,526 50.33$ 50.33$ 50.33$ 3,285 3,285 3,2850 0 0 0 1,526 1,526 1,526 50.33$ 50.33$ 50.33$ 3,285 3,285 3,2850 71,931 431,588 1,078,970 1,975 1,975 1,975 31.10$ 31.10$ 31.10$ 5,098 5,098 5,0980 31,432 188,592 471,480 1,975 1,975 1,975 31.10$ 31.10$ 31.10$ 5,098 5,098 5,0980 8,725 52,352 130,880 1,975 1,975 1,975 31.10$ 31.10$ 31.10$ 5,098 5,098 5,0980 3,448 38,686 96,715 1,975 1,975 1,975 31.10$ 31.10$ 31.10$ 5,098 5,098 5,0980 140 840 2,100 1,975 1,975 1,975 31.10$ 31.10$ 31.10$ 5,098 5,098 5,0980 0 0 0 1,975 1,975 1,975 31.10$ 31.10$ 31.10$ 5,098 5,098 5,098
920,280 3,722,950 3,761,981 3,816,812 0 0 0 54.77$ 54.77$ 54.77$ 5,726 5,726 5,726 - 2,755,000 2,755,000 2,755,000 0 0 0 54.77$ 54.77$ 54.77$ 5,726 5,726 5,726 - - 6,000 6,000 0 0 0 54.77$ 54.77$ 54.77$ 5,726 5,726 5,726 - 2,800 2,800 2,800 0 0 0 54.77$ 54.77$ 54.77$ 5,726 5,726 5,726 - - 0 0 0 0 0 54.77$ 54.77$ 54.77$ 5,726 5,726 5,726 - - 0 0 0 0 0 54.77$ 54.77$ 54.77$ 5,726 5,726 5,726
0 300,000 335,970 408,353 1,000 1,000 1,000 15.99$ 15.99$ 15.99$ 1,314 1,314 1,3140 300,000 300,000 300,000 1,600 1,600 1,600 12.57$ 12.57$ 12.57$ 1,314 1,314 1,3140 0 6,500 20,000 1,000 1,000 1,000 12.57$ 12.57$ 12.57$ 1,314 1,314 1,3140 0 3,500 10,000 1,000 1,000 1,000 12.57$ 12.57$ 12.57$ 1,314 1,314 1,3140 0 0 0 1,000 1,000 1,000 12.57$ 12.57$ 12.57$ 1,314 1,314 1,3140 0 0 0 1,000 1,000 1,000 12.57$ 12.57$ 12.57$ 1,314 1,314 1,3140 0 0 0 1,434 1,434 1,434 31.66$ 31.66$ 31.66$ 2,278 2,278 2,2780 0 0 0 1,434 1,434 1,434 31.70$ 31.70$ 31.70$ 2,278 2,278 2,2780 0 0 0 1,434 1,434 1,434 31.70$ 31.70$ 31.70$ 2,278 2,278 2,2780 0 0 0 1,434 1,434 1,434 31.70$ 31.70$ 31.70$ 2,278 2,278 2,2780 0 0 0 1,434 1,434 1,434 31.70$ 31.70$ 31.70$ 2,278 2,278 2,2780 0 0 0 1,434 1,434 1,434 31.70$ 31.70$ 31.70$ 2,278 2,278 2,2780 0 0 0 1,526 1,526 1,526 50.33$ 50.33$ 50.33$ 3,285 3,285 3,2850 0 0 0 1,526 1,526 1,526 50.33$ 50.33$ 50.33$ 3,285 3,285 3,2850 0 0 0 1,526 1,526 1,526 50.33$ 50.33$ 50.33$ 3,285 3,285 3,2850 0 0 0 1,526 1,526 1,526 50.33$ 50.33$ 50.33$ 3,285 3,285 3,2850 0 0 0 1,526 1,526 1,526 50.33$ 50.33$ 50.33$ 3,285 3,285 3,2850 0 0 0 1,526 1,526 1,526 50.33$ 50.33$ 50.33$ 3,285 3,285 3,2850 0 0 0 1,975 1,975 1,975 31.10$ 31.10$ 31.10$ 5,098 5,098 5,098
III. Penetrations IV. Future Costs & Outputs
Installed Costs Levelized O&M Costs Technology Output (kWh/kW installed)

Table 6.3.3 Hydropower Screening Inputs 8/19/2003
60616263646566676869707172737475767778798081828384858687888990919293949596979899100101102103104105106107108109110111112113114115116117118119120121122123124
T U V W X Y Z AA AB AC AD AE AF0 0 0 0 1,975 1,975 1,975 31.10$ 31.10$ 31.10$ 5,098 5,098 5,0980 0 0 0 1,975 1,975 1,975 31.10$ 31.10$ 31.10$ 5,098 5,098 5,0980 0 0 0 1,975 1,975 1,975 31.10$ 31.10$ 31.10$ 5,098 5,098 5,0980 0 0 0 1,975 1,975 1,975 31.10$ 31.10$ 31.10$ 5,098 5,098 5,0980 0 0 0 1,975 1,975 1,975 31.10$ 31.10$ 31.10$ 5,098 5,098 5,098
920,280 3,722,950 3,761,981 3,816,812 0 0 0 54.77$ 54.77$ 54.77$ 5,726 5,726 5,726 - 2,755,000 2,755,000 2,755,000 0 0 0 54.77$ 54.77$ 54.77$ 5,726 5,726 5,726 - - 6,000 6,000 0 0 0 54.77$ 54.77$ 54.77$ 5,726 5,726 5,726 - 2,800 2,800 2,800 0 0 0 54.77$ 54.77$ 54.77$ 5,726 5,726 5,726 - - 0 0 0 0 0 54.77$ 54.77$ 54.77$ 5,726 5,726 5,726 - - 0 0 0 0 0 54.77$ 54.77$ 54.77$ 5,726 5,726 5,726
0 300,000 335,970 408,353 1,000 1,000 1,000 15.99$ 15.99$ 15.99$ 1,314 1,314 1,3140 300,000 300,000 300,000 1,600 1,600 1,600 15.99$ 15.99$ 15.99$ 1,314 1,314 1,3140 0 6,500 20,000 1,000 1,000 1,000 15.99$ 15.99$ 15.99$ 1,314 1,314 1,3140 0 3,500 10,000 1,000 1,000 1,000 15.99$ 15.99$ 15.99$ 1,314 1,314 1,3140 0 0 0 1,000 1,000 1,000 15.99$ 15.99$ 15.99$ 1,314 1,314 1,3140 0 0 0 1,000 1,000 1,000 15.99$ 15.99$ 15.99$ 1,314 1,314 1,3140 0 0 0 1,434 1,434 1,434 31.70$ 31.70$ 31.70$ 2,278 2,278 2,2780 0 0 0 1,434 1,434 1,434 31.70$ 31.70$ 31.70$ 2,278 2,278 2,2780 0 0 0 1,434 1,434 1,434 31.70$ 31.70$ 31.70$ 2,278 2,278 2,2780 0 0 0 1,434 1,434 1,434 31.70$ 31.70$ 31.70$ 2,278 2,278 2,2780 0 0 0 1,434 1,434 1,434 31.70$ 31.70$ 31.70$ 2,278 2,278 2,2780 0 0 0 1,434 1,434 1,434 31.70$ 31.70$ 31.70$ 2,278 2,278 2,2780 0 0 0 1,526 1,526 1,526 50.33$ 50.33$ 50.33$ 3,285 3,285 3,2850 0 0 0 1,526 1,526 1,526 50.33$ 50.33$ 50.33$ 3,285 3,285 3,2850 0 0 0 1,526 1,526 1,526 50.33$ 50.33$ 50.33$ 3,285 3,285 3,2850 0 0 0 1,526 1,526 1,526 50.33$ 50.33$ 50.33$ 3,285 3,285 3,2850 0 0 0 1,526 1,526 1,526 50.33$ 50.33$ 50.33$ 3,285 3,285 3,2850 0 0 0 1,526 1,526 1,526 50.33$ 50.33$ 50.33$ 3,285 3,285 3,2850 0 0 0 1,975 1,975 1,975 31.10$ 31.10$ 31.10$ 5,098 5,098 5,0980 0 0 0 1,975 1,975 1,975 31.10$ 31.10$ 31.10$ 5,098 5,098 5,0980 0 0 0 1,975 1,975 1,975 31.10$ 31.10$ 31.10$ 5,098 5,098 5,0980 0 0 0 1,975 1,975 1,975 31.10$ 31.10$ 31.10$ 5,098 5,098 5,0980 0 0 0 1,975 1,975 1,975 31.10$ 31.10$ 31.10$ 5,098 5,098 5,0980 0 0 0 1,975 1,975 1,975 31.10$ 31.10$ 31.10$ 5,098 5,098 5,098
970,280 3,772,950 3,811,981 3,866,812 0 0 0 54.77$ 54.77$ 54.77$ 5,726 5,726 5,726 - 2,755,000 2,755,000 2,755,000 0 0 0 54.77$ 54.77$ 54.77$ 5,726 5,726 5,726 - - 6,000 6,000 0 0 0 54.77$ 54.77$ 54.77$ 5,726 5,726 5,726 - 2,800 2,800 2,800 0 0 0 54.77$ 54.77$ 54.77$ 5,726 5,726 5,726 - - 0 0 0 0 0 54.77$ 54.77$ 54.77$ 5,726 5,726 5,726 - - 0 0 0 0 0 54.77$ 54.77$ 54.77$ 5,726 5,726 5,726
0 300,000 335,970 408,353 1,000 1,000 1,000 15.99$ 15.99$ 15.99$ 1,314 1,314 1,3140 300,000 300,000 300,000 1,600 1,600 1,600 15.99$ 15.99$ 15.99$ 1,314 1,314 1,3140 0 6,500 20,000 1,000 1,000 1,000 15.99$ 15.99$ 15.99$ 1,314 1,314 1,3140 0 3,500 10,000 1,000 1,000 1,000 15.99$ 15.99$ 15.99$ 1,314 1,314 1,3140 0 0 0 1,000 1,000 1,000 15.99$ 15.99$ 15.99$ 1,314 1,314 1,3140 0 0 0 1,000 1,000 1,000 15.99$ 15.99$ 15.99$ 1,314 1,314 1,3140 0 0 0 1,434 1,434 1,434 31.66$ 31.66$ 31.66$ 2,278 2,278 2,2780 0 0 0 1,434 1,434 1,434 31.66$ 31.66$ 31.66$ 2,278 2,278 2,2780 0 0 0 1,434 1,434 1,434 31.66$ 31.66$ 31.66$ 2,278 2,278 2,2780 0 0 0 1,434 1,434 1,434 31.66$ 31.66$ 31.66$ 2,278 2,278 2,2780 0 0 0 1,434 1,434 1,434 31.66$ 31.66$ 31.66$ 2,278 2,278 2,2780 0 0 0 1,434 1,434 1,434 31.66$ 31.66$ 31.66$ 2,278 2,278 2,2780 0 0 0 1,526 1,526 1,526 50.33$ 50.33$ 50.33$ 3,285 3,285 3,2850 0 0 0 1,526 1,526 1,526 50.33$ 50.33$ 50.33$ 3,285 3,285 3,2850 0 0 0 1,526 1,526 1,526 50.33$ 50.33$ 50.33$ 3,285 3,285 3,2850 0 0 0 1,526 1,526 1,526 50.33$ 50.33$ 50.33$ 3,285 3,285 3,2850 0 0 0 1,526 1,526 1,526 50.33$ 50.33$ 50.33$ 3,285 3,285 3,2850 0 0 0 1,526 1,526 1,526 50.33$ 50.33$ 50.33$ 3,285 3,285 3,2850 0 0 0 1,975 1,975 1,975 31.10$ 31.10$ 31.10$ 5,098 5,098 5,0980 0 0 0 1,975 1,975 1,975 31.10$ 31.10$ 31.10$ 5,098 5,098 5,0980 0 0 0 1,975 1,975 1,975 31.10$ 31.10$ 31.10$ 5,098 5,098 5,0980 0 0 0 1,975 1,975 1,975 31.10$ 31.10$ 31.10$ 5,098 5,098 5,0980 0 0 0 1,975 1,975 1,975 31.10$ 31.10$ 31.10$ 5,098 5,098 5,0980 0 0 0 1,975 1,975 1,975 31.10$ 31.10$ 31.10$ 5,098 5,098 5,098

Table 6.3.4 Landfill Gas Screening Inputs 8/19/2003
A B C D E F G H I J K L M N O
from 4/24 sheet
ResourcZone Scenario Technology Life
Total Installed Cost ($/kW of rated max output)
Annual kWh/kW produced -2003
Summer On- Peak %
Summer Off - Peak %
Summer Shoulder %
Winter On - Peak %
Winter Off - Peak %
Winter Shoulder %
Energy Period Sum (Sum Col F -Col K) Should equal 100%
Summer Generation Capacity % of Max Output
LFG Large Systems LFG Statewide Tech 20 $2,850 8,322 4% 39% 7% 6% 38% 6% 100% 100%LFG Large Systems LFG Zone A - West Tech 20 $2,600 8,322 4% 39% 7% 6% 38% 6% 100% 100%LFG Large Systems LFG Zone F - Capital Tech 20 $2,700 8,322 4% 39% 7% 6% 38% 6% 100% 100%LFG Large Systems LFG Zone G - Lower HV Tech 20 $2,850 8,322 4% 39% 7% 6% 38% 6% 100% 100%LFG Large Systems LFG Zone J - NYC Tech 20 $3,500 8,322 4% 39% 7% 6% 38% 6% 100% 100%LFG Large Systems LFG Zone K - Long Island Tech 20 $3,150 8,322 4% 39% 7% 6% 38% 6% 100% 100%LFG Engines LFG Statewide Tech 20 $2,300 8,322 4% 39% 7% 6% 38% 6% 100% 100%LFG Engines LFG Zone A - West Tech 20 $2,100 8,322 4% 39% 7% 6% 38% 6% 100% 100%LFG Engines LFG Zone F - Capital Tech 20 $2,200 8,322 4% 39% 7% 6% 38% 6% 100% 100%LFG Engines LFG Zone G - Lower HV Tech 20 $2,300 8,322 4% 39% 7% 6% 38% 6% 100% 100%LFG Engines LFG Zone J - NYC Tech 20 $3,100 8,322 4% 39% 7% 6% 38% 6% 100% 100%LFG Engines LFG Zone K - Long Island Tech 20 $2,500 8,322 4% 39% 7% 6% 38% 6% 100% 100%LFG Microturbines LFG Statewide Tech 20 $3,550 8,322 4% 39% 7% 6% 38% 6% 100% 100%LFG Microturbines LFG Zone A - West Tech 20 $3,350 8,322 4% 39% 7% 6% 38% 6% 100% 100%LFG Microturbines LFG Zone F - Capital Tech 20 $3,350 8,322 4% 39% 7% 6% 38% 6% 100% 100%LFG Microturbines LFG Zone G - Lower HV Tech 20 $3,550 8,322 4% 39% 7% 6% 38% 6% 100% 100%LFG Microturbines LFG Zone J - NYC Tech 20 $3,850 8,322 4% 39% 7% 6% 38% 6% 100% 100%LFG Microturbines LFG Zone K - Long Island Tech 20 $3,650 8,322 4% 39% 7% 6% 38% 6% 100% 100%LFG Large Systems LFG Statewide Base 20 $2,850 8,322 4% 39% 7% 6% 38% 6% 100%LFG Large Systems LFG Zone A - West Base 20 $2,600 8,322 4% 39% 7% 6% 38% 6% 100% 0%LFG Large Systems LFG Zone F - Capital Base 20 $2,700 8,322 4% 39% 7% 6% 38% 6% 100% 0%LFG Large Systems LFG Zone G - Lower HV Base 20 $2,850 8,322 4% 39% 7% 6% 38% 6% 100% 0%LFG Large Systems LFG Zone J - NYC Base 20 $3,500 8,322 4% 39% 7% 6% 38% 6% 100% 0%LFG Large Systems LFG Zone K - Long Island Base 20 $3,150 8,322 4% 39% 7% 6% 38% 6% 100% 0%LFG Engines LFG Statewide Base 20 $2,300 8,322 4% 39% 7% 6% 38% 6% 100%LFG Engines LFG Zone A - West Base 20 $2,100 8,322 4% 39% 7% 6% 38% 6% 100% 0%LFG Engines LFG Zone F - Capital Base 20 $2,200 8,322 4% 39% 7% 6% 38% 6% 100% 0%LFG Engines LFG Zone G - Lower HV Base 20 $2,300 8,322 4% 39% 7% 6% 38% 6% 100% 0%LFG Engines LFG Zone J - NYC Base 20 $3,100 8,322 4% 39% 7% 6% 38% 6% 100% 0%LFG Engines LFG Zone K - Long Island Base 20 $2,500 8,322 4% 39% 7% 6% 38% 6% 100% 0%LFG Microturbines LFG Statewide Base 20 $3,550 8,322 4% 39% 7% 6% 38% 6% 100%LFG Microturbines LFG Zone A - West Base 20 $3,350 8,322 4% 39% 7% 6% 38% 6% 100% 0%LFG Microturbines LFG Zone F - Capital Base 20 $3,350 8,322 4% 39% 7% 6% 38% 6% 100% 0%LFG Microturbines LFG Zone G - Lower HV Base 20 $3,550 8,322 4% 39% 7% 6% 38% 6% 100% 0%LFG Microturbines LFG Zone J - NYC Base 20 $3,850 8,322 4% 39% 7% 6% 38% 6% 100% 0%LFG Microturbines LFG Zone K - Long Island Base 20 $3,650 8,322 4% 39% 7% 6% 38% 6% 100% 0%LFG Large Systems LFG Statewide CPI 20 $2,850 8,322 4% 39% 7% 6% 38% 6% 100%LFG Large Systems LFG Zone A - West CPI 20 $2,600 8,322 4% 39% 7% 6% 38% 6% 100% 0%LFG Large Systems LFG Zone F - Capital CPI 20 $2,700 8,322 4% 39% 7% 6% 38% 6% 100% 0%LFG Large Systems LFG Zone G - Lower HV CPI 20 $2,850 8,322 4% 39% 7% 6% 38% 6% 100% 0%LFG Large Systems LFG Zone J - NYC CPI 20 $3,500 8,322 4% 39% 7% 6% 38% 6% 100% 0%LFG Large Systems LFG Zone K - Long Island CPI 20 $3,150 8,322 4% 39% 7% 6% 38% 6% 100% 0%
Current Technology Costs and Outputs
Energy Coincidence Factors Capacity Coinci

Table 6.3.4 Landfill Gas Screening Inputs 8/19/2003
LFG Engines LFG Statewide CPI 20 $2,300 8,322 4% 39% 7% 6% 38% 6% 100%LFG Engines LFG Zone A - West CPI 20 $2,100 8,322 4% 39% 7% 6% 38% 6% 100% 0%LFG Engines LFG Zone F - Capital CPI 20 $2,200 8,322 4% 39% 7% 6% 38% 6% 100% 0%LFG Engines LFG Zone G - Lower HV CPI 20 $2,300 8,322 4% 39% 7% 6% 38% 6% 100% 0%LFG Engines LFG Zone J - NYC CPI 20 $3,100 8,322 4% 39% 7% 6% 38% 6% 100% 0%LFG Engines LFG Zone K - Long Island CPI 20 $2,500 8,322 4% 39% 7% 6% 38% 6% 100% 0%LFG Microturbines LFG Statewide CPI 20 $3,550 8,322 4% 39% 7% 6% 38% 6% 100%LFG Microturbines LFG Zone A - West CPI 20 $3,350 8,322 4% 39% 7% 6% 38% 6% 100% 0%LFG Microturbines LFG Zone F - Capital CPI 20 $3,350 8,322 4% 39% 7% 6% 38% 6% 100% 0%LFG Microturbines LFG Zone G - Lower HV CPI 20 $3,550 8,322 4% 39% 7% 6% 38% 6% 100% 0%LFG Microturbines LFG Zone J - NYC CPI 20 $3,850 8,322 4% 39% 7% 6% 38% 6% 100% 0%LFG Microturbines LFG Zone K - Long Island CPI 20 $3,650 8,322 4% 39% 7% 6% 38% 6% 100% 0%LFG Large Systems LFG Statewide GHG 20 $2,850 8,322 4% 39% 7% 6% 38% 6% 100%LFG Large Systems LFG Zone A - West GHG 20 $2,600 8,322 4% 39% 7% 6% 38% 6% 100% 0%LFG Large Systems LFG Zone F - Capital GHG 20 $2,700 8,322 4% 39% 7% 6% 38% 6% 100% 0%LFG Large Systems LFG Zone G - Lower HV GHG 20 $2,850 8,322 4% 39% 7% 6% 38% 6% 100% 0%LFG Large Systems LFG Zone J - NYC GHG 20 $3,500 8,322 4% 39% 7% 6% 38% 6% 100% 0%LFG Large Systems LFG Zone K - Long Island GHG 20 $3,150 8,322 4% 39% 7% 6% 38% 6% 100% 0%LFG Engines LFG Statewide GHG 20 $2,300 8,322 4% 39% 7% 6% 38% 6% 100%LFG Engines LFG Zone A - West GHG 20 $2,100 8,322 4% 39% 7% 6% 38% 6% 100% 0%LFG Engines LFG Zone F - Capital GHG 20 $2,200 8,322 4% 39% 7% 6% 38% 6% 100% 0%LFG Engines LFG Zone G - Lower HV GHG 20 $2,300 8,322 4% 39% 7% 6% 38% 6% 100% 0%LFG Engines LFG Zone J - NYC GHG 20 $3,100 8,322 4% 39% 7% 6% 38% 6% 100% 0%LFG Engines LFG Zone K - Long Island GHG 20 $2,500 8,322 4% 39% 7% 6% 38% 6% 100% 0%LFG Microturbines LFG Statewide GHG 20 $3,550 8,322 4% 39% 7% 6% 38% 6% 100%LFG Microturbines LFG Zone A - West GHG 20 $3,350 8,322 4% 39% 7% 6% 38% 6% 100% 0%LFG Microturbines LFG Zone F - Capital GHG 20 $3,350 8,322 4% 39% 7% 6% 38% 6% 100% 0%LFG Microturbines LFG Zone G - Lower HV GHG 20 $3,550 8,322 4% 39% 7% 6% 38% 6% 100% 0%LFG Microturbines LFG Zone J - NYC GHG 20 $3,850 8,322 4% 39% 7% 6% 38% 6% 100% 0%LFG Microturbines LFG Zone K - Long Island GHG 20 $3,650 8,322 4% 39% 7% 6% 38% 6% 100% 0%

Table 6.3.4 Landfill Gas Screening Inputs 8/19/2003
P Q R S T U V W X Y Z AA AB AC AD AE AF
Winter Generation Capacity % of Max Output
Fossil Fuel Type
Fossil Fuel Usage MMBTU/Yr
Real Levelized O&M $/yr
Installed Capacity (kW) 2003
Installed Capacity (kW) 2007
Installed Capacity (kW) 2012
Installed Capacity (kW) 2022
Total Installed Cost ($/kW of rated max output) 2007
Total Installed Cost ($/kW of rated max output) 2012
Total Installed Cost ($/kW of rated max output) 2022
Real Levelized O&M $/yr 2007
Real Levelized O&M $/yr 2012
Real Levelized O&M $/yr 2022
Annual kWh/kW -2007
Annual kWh/kW -2012
Annual kWh/kW -2022
100% $270 1,051 3,608 4,764 6,660 2,850 2,850 2,850 270 270 270 8,322 8,322 8,322100% $270 132 1,152 1,750 3,157 2,600 2,600 2,600 270 270 270 8,322 8,322 8,322100% $270 103 269 328 445 2,700 2,700 2,700 270 270 270 8,322 8,322 8,322100% $270 105 188 176 73 2,850 2,850 2,850 270 270 270 8,322 8,322 8,322100% $270 0 94 26 7 3,500 3,500 3,500 270 270 270 8,322 8,322 8,322100% $270 187 236 169 59 3,150 3,150 3,150 270 270 270 8,322 8,322 8,322100% $250 54,818 137,029 140,497 158,076 2,300 2,300 2,300 250 250 250 8,322 8,322 8,322100% $250 6,875 43,750 51,602 74,930 2,100 2,100 2,100 250 250 250 8,322 8,322 8,322100% $250 5,384 10,199 9,685 10,558 2,200 2,200 2,200 250 250 250 8,322 8,322 8,322100% $250 5,494 7,132 5,192 1,737 2,300 2,300 2,300 250 250 250 8,322 8,322 8,322100% $250 0 1,414 769 162 3,100 3,100 3,100 250 250 250 8,322 8,322 8,322100% $250 9,752 8,962 4,980 1,396 2,500 2,500 2,500 250 250 250 8,322 8,322 8,322100% $240 728 2,819 3,967 5,772 3,350 3,150 2,950 240 240 240 8,322 8,322 8,322100% $240 91 900 1,457 2,736 3,150 2,950 2,750 240 240 240 8,322 8,322 8,322100% $240 71 210 273 386 3,150 2,950 2,750 240 240 240 8,322 8,322 8,322100% $240 73 147 147 63 3,350 3,150 2,950 240 240 240 8,322 8,322 8,322100% $240 129 29 22 6 3,650 3,450 3,250 240 240 240 8,322 8,322 8,322100% $240 224 184 141 51 3,450 3,250 3,050 240 240 240 8,322 8,322 8,322
0 0 $270 889 2,218 3,107 4,539 2,850 2,850 2,850 270 270 270 8,322 8,322 8,3220% $270 125 983 1,495 2,691 2,850 2,850 2,850 270 270 270 8,322 8,322 8,3220% $270 87 150 189 277 2,850 2,850 2,850 270 270 270 8,322 8,322 8,3220% $270 100 125 130 56 2,850 2,850 2,850 270 270 270 8,322 8,322 8,3220% $270 0 0 0 0 2,850 2,850 2,850 270 270 270 8,322 8,322 8,3220% $270 93 97 80 34 2,850 2,850 2,850 270 270 270 8,322 8,322 8,322
0 0 $250 46,373 84,287 91,643 107,732 2,300 2,300 2,300 250 250 250 8,322 8,322 8,3220% $250 6,532 37,343 44,080 63,872 2,300 2,300 2,300 250 250 250 8,322 8,322 8,3220% $250 4,513 5,690 5,576 6,565 2,300 2,300 2,300 250 250 250 8,322 8,322 8,3220% $250 5,219 4,735 3,832 1,321 2,300 2,300 2,300 250 250 250 8,322 8,322 8,3220% $250 0 0 0 0 2,300 2,300 2,300 250 250 250 8,322 8,322 8,3220% $250 4,856 3,683 2,371 812 2,300 2,300 2,300 250 250 250 8,322 8,322 8,322
0 0 $240 616 1,733 2,587 3,934 3,350 3,150 2,950 240 240 240 8,322 8,322 8,3220% $240 87 768 1,245 2,332 3,350 3,150 2,950 240 240 240 8,322 8,322 8,3220% $240 60 117 157 240 3,350 3,150 2,950 240 240 240 8,322 8,322 8,3220% $240 69 97 108 48 3,350 3,150 2,950 240 240 240 8,322 8,322 8,3220% $240 0 0 0 0 3,350 3,150 2,950 240 240 240 8,322 8,322 8,3220% $240 64 76 67 30 3,350 3,150 2,950 240 240 240 8,322 8,322 8,322
0 0 $270 915 2,576 3,632 5,335 2,850 2,850 2,850 270 270 270 8,322 8,322 8,3220% $270 125 1,030 1,573 2,845 2,850 2,850 2,850 270 270 270 8,322 8,322 8,3220% $270 87 150 190 288 2,850 2,850 2,850 270 270 270 8,322 8,322 8,3220% $270 100 125 130 56 2,850 2,850 2,850 270 270 270 8,322 8,322 8,3220% $270 0 0 0 0 2,850 2,850 2,850 270 270 270 8,322 8,322 8,3220% $270 93 97 80 43 2,850 2,850 2,850 270 270 270 8,322 8,322 8,322
Penetrations Future Costs & Outputs
Installed Costs Levelized O&M Costs Technology Output (kWh/kW installed)idence Factors

Table 6.3.4 Landfill Gas Screening Inputs 8/19/2003
0 0 $250 47,702 97,826 107,107 126,622 2,300 2,300 2,300 250 250 250 8,322 8,322 8,3220% $250 6,532 39,131 46,376 67,527 2,300 2,300 2,300 250 250 250 8,322 8,322 8,3220% $250 4,513 5,690 5,594 6,840 2,300 2,300 2,300 250 250 250 8,322 8,322 8,3220% $250 5,219 4,735 3,822 1,321 2,300 2,300 2,300 250 250 250 8,322 8,322 8,3220% $250 0 0 0 0 2,300 2,300 2,300 250 250 250 8,322 8,322 8,3220% $250 4,856 3,683 2,371 812 2,300 2,300 2,300 250 250 250 8,322 8,322 8,322
0 0 $240 633 2,013 3,024 4,624 3,350 3,150 2,950 240 240 240 8,322 8,322 8,3220% $240 87 805 1,309 2,466 3,350 3,150 2,950 240 240 240 8,322 8,322 8,3220% $240 60 117 158 250 3,350 3,150 2,950 240 240 240 8,322 8,322 8,3220% $240 69 97 108 48 3,350 3,150 2,950 240 240 240 8,322 8,322 8,3220% $240 0 0 0 0 3,350 3,150 2,950 240 240 240 8,322 8,322 8,3220% $240 64 76 67 30 3,350 3,150 2,950 240 240 240 8,322 8,322 8,322
0 0 $270 889 3,027 4,184 6,105 2,850 2,850 2,850 270 270 270 8,322 8,322 8,3220% $270 125 1,078 1,650 2,999 2,850 2,850 2,850 270 270 270 8,322 8,322 8,3220% $270 87 187 250 373 2,850 2,850 2,850 270 270 270 8,322 8,322 8,3220% $270 100 153 149 63 2,850 2,850 2,850 270 270 270 8,322 8,322 8,3220% $270 0 0 0 0 2,850 2,850 2,850 270 270 270 8,322 8,322 8,3220% $270 93 168 130 52 2,850 2,850 2,850 270 270 270 8,322 8,322 8,322
0 0 $250 46,373 114,940 123,397 144,895 2,300 2,300 2,300 250 250 250 8,322 8,322 8,3220% $250 6,532 40,919 48,672 71,182 2,300 2,300 2,300 250 250 250 8,322 8,322 8,3220% $250 4,513 7,115 7,361 8,844 2,300 2,300 2,300 250 250 250 8,322 8,322 8,3220% $250 5,219 5,806 4,405 1,493 2,300 2,300 2,300 250 250 250 8,322 8,322 8,3220% $250 0 0 0 0 2,300 2,300 2,300 250 250 250 8,322 8,322 8,3220% $250 4,856 6,362 3,828 1,244 2,300 2,300 2,300 250 250 250 8,322 8,322 8,322
0 0 $240 616 2,365 3,484 5,291 3,350 3,150 2,950 240 240 240 8,322 8,322 8,3220% $240 87 842 1,374 2,599 3,350 3,150 2,950 240 240 240 8,322 8,322 8,3220% $240 60 146 208 323 3,350 3,150 2,950 240 240 240 8,322 8,322 8,3220% $240 69 119 124 55 3,350 3,150 2,950 240 240 240 8,322 8,322 8,3220% $240 0 0 0 0 3,350 3,150 2,950 240 240 240 8,322 8,322 8,3220% $240 64 131 108 45 3,350 3,150 2,950 240 240 240 8,322 8,322 8,322

Table 6.3.5 Municipal Solid Waste Screening Inputs 8/19/2003
1
2
3
456789101112131415161718192021222324252627282930313233343536373839
A B C D E F G H I J K L M N OA B C D E F G H I J K L M N O
from 4/24 sh
Measure Name ResourcZone Scenario Technology Life
Total Installed Cost ($/kW of rated max output)
Annual kWh/kW produced -2003
Summer On- Peak %
Summer Off - Peak %
Summer Shoulder %
Winter On - Peak %
Winter Off - Peak %
Winter Shoulder %
Energy Period Sum (Sum Col F -Col K) Should equal 100%
Summer Generation Capacity % of Max Output
WTE Large WTE Statewide Tech 35 8,500$ 8,322 4% 39% 7% 6% 38% 6% 100% 100%WTE Large WTE Zone A - West Tech 35 7,500$ 8,322 4% 39% 7% 6% 38% 6% 100% 100%WTE Large WTE Zone F - Capital Tech 35 7,500$ 8,322 4% 39% 7% 6% 38% 6% 100% 100%WTE Large WTE Zone G - Lower HV Tech 35 8,500$ 8,322 4% 39% 7% 6% 38% 6% 100% 100%WTE Large WTE Zone J - NYC Tech 35 11,500$ 8,322 4% 39% 7% 6% 38% 6% 100% 100%WTE Large WTE Zone K - Long Island Tech 35 9,500$ 8,322 4% 39% 7% 6% 38% 6% 100% 100%WTE Small WTE Statewide Tech 35 10,500$ 8,322 4% 39% 7% 6% 38% 6% 100% 100%WTE Small WTE Zone A - West Tech 35 9,500$ 8,322 4% 39% 7% 6% 38% 6% 100% 100%WTE Small WTE Zone F - Capital Tech 35 9,500$ 8,322 4% 39% 7% 6% 38% 6% 100% 100%WTE Small WTE Zone G - Lower HV Tech 35 10,500$ 8,322 4% 39% 7% 6% 38% 6% 100% 100%WTE Small WTE Zone J - NYC Tech 35 13,500$ 8,322 4% 39% 7% 6% 38% 6% 100% 100%WTE Small WTE Zone K - Long Island Tech 35 11,500$ 8,322 4% 39% 7% 6% 38% 6% 100% 100%Solid Waste Digestion WTE Statewide Tech 35 10,500$ 8,322 4% 39% 7% 6% 38% 6% 100% 100%Solid Waste Digestion WTE Zone A - West Tech 35 10,000$ 8,322 4% 39% 7% 6% 38% 6% 100% 100%Solid Waste Digestion WTE Zone F - Capital Tech 35 10,000$ 8,322 4% 39% 7% 6% 38% 6% 100% 100%Solid Waste Digestion WTE Zone G - Lower HV Tech 35 10,500$ 8,322 4% 39% 7% 6% 38% 6% 100% 100%Solid Waste Digestion WTE Zone J - NYC Tech 35 13,500$ 8,333 4% 39% 7% 6% 38% 6% 100% 100%Solid Waste Digestion WTE Zone K - Long Island Tech 35 11,500$ 8,322 4% 39% 7% 6% 38% 6% 100% 100%WTE Large WTE Statewide Base 35 $8,500 8,322 4% 39% 7% 6% 38% 6% 100% 100%WTE Large WTE Zone A - West Base 35 $7,500 8,322 4% 39% 7% 6% 38% 6% 100% 100%WTE Large WTE Zone F - Capital Base 35 $7,500 8,322 4% 39% 7% 6% 38% 6% 100% 100%WTE Large WTE Zone G - Lower HV Base 35 $8,500 8,322 4% 39% 7% 6% 38% 6% 100% 100%WTE Large WTE Zone J - NYC Base 35 $11,500 8,322 4% 39% 7% 6% 38% 6% 100% 100%WTE Large WTE Zone K - Long Island Base 35 $9,500 8,322 4% 39% 7% 6% 38% 6% 100% 100%WTE Small WTE Statewide Base 35 $10,500 8,322 4% 39% 7% 6% 38% 6% 100% 100%WTE Small WTE Zone A - West Base 35 $9,500 8,322 4% 39% 7% 6% 38% 6% 100% 100%WTE Small WTE Zone F - Capital Base 35 $9,500 8,322 4% 39% 7% 6% 38% 6% 100% 100%WTE Small WTE Zone G - Lower HV Base 35 $10,500 8,322 4% 39% 7% 6% 38% 6% 100% 100%WTE Small WTE Zone J - NYC Base 35 $13,500 8,322 4% 39% 7% 6% 38% 6% 100% 100%WTE Small WTE Zone K - Long Island Base 35 $11,500 8,322 4% 39% 7% 6% 38% 6% 100% 100%Solid Waste Digestion WTE Statewide Base 35 $10,500 8,322 4% 39% 7% 6% 38% 6% 100% 100%Solid Waste Digestion WTE Zone A - West Base 35 $10,000 8,322 4% 39% 7% 6% 38% 6% 100% 100%Solid Waste Digestion WTE Zone F - Capital Base 35 $10,000 8,322 4% 39% 7% 6% 38% 6% 100% 100%Solid Waste Digestion WTE Zone G - Lower HV Base 35 $10,500 8,322 4% 39% 7% 6% 38% 6% 100% 100%Solid Waste Digestion WTE Zone J - NYC Base 35 $13,500 8,333 4% 39% 7% 6% 38% 6% 100% 100%
I. Measure Name/Zone Scenario
Energy Coincidence Factors Capacity Coin
II. Current Technology Costs and Outputs
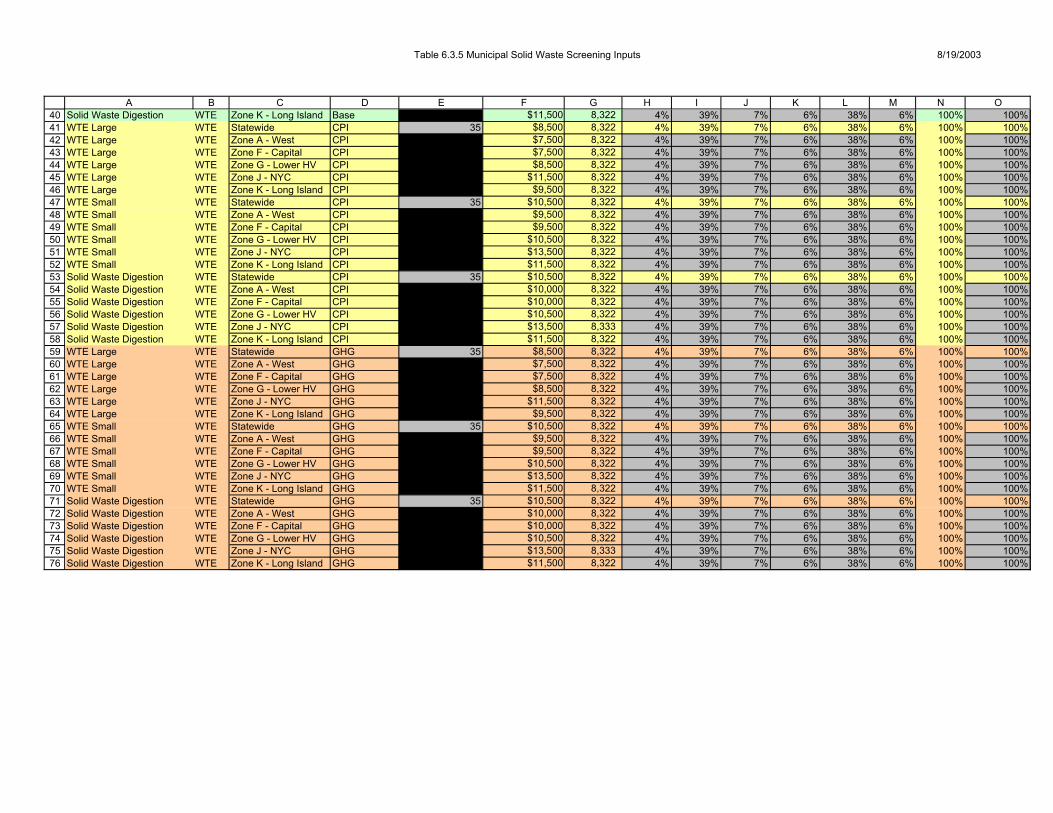
Table 6.3.5 Municipal Solid Waste Screening Inputs 8/19/2003
40414243444546474849505152535455565758596061626364656667686970717273747576
A B C D E F G H I J K L M N OSolid Waste Digestion WTE Zone K - Long Island Base 35 $11,500 8,322 4% 39% 7% 6% 38% 6% 100% 100%WTE Large WTE Statewide CPI 35 $8,500 8,322 4% 39% 7% 6% 38% 6% 100% 100%WTE Large WTE Zone A - West CPI 35 $7,500 8,322 4% 39% 7% 6% 38% 6% 100% 100%WTE Large WTE Zone F - Capital CPI 35 $7,500 8,322 4% 39% 7% 6% 38% 6% 100% 100%WTE Large WTE Zone G - Lower HV CPI 35 $8,500 8,322 4% 39% 7% 6% 38% 6% 100% 100%WTE Large WTE Zone J - NYC CPI 35 $11,500 8,322 4% 39% 7% 6% 38% 6% 100% 100%WTE Large WTE Zone K - Long Island CPI 35 $9,500 8,322 4% 39% 7% 6% 38% 6% 100% 100%WTE Small WTE Statewide CPI 35 $10,500 8,322 4% 39% 7% 6% 38% 6% 100% 100%WTE Small WTE Zone A - West CPI 35 $9,500 8,322 4% 39% 7% 6% 38% 6% 100% 100%WTE Small WTE Zone F - Capital CPI 35 $9,500 8,322 4% 39% 7% 6% 38% 6% 100% 100%WTE Small WTE Zone G - Lower HV CPI 35 $10,500 8,322 4% 39% 7% 6% 38% 6% 100% 100%WTE Small WTE Zone J - NYC CPI 35 $13,500 8,322 4% 39% 7% 6% 38% 6% 100% 100%WTE Small WTE Zone K - Long Island CPI 35 $11,500 8,322 4% 39% 7% 6% 38% 6% 100% 100%Solid Waste Digestion WTE Statewide CPI 35 $10,500 8,322 4% 39% 7% 6% 38% 6% 100% 100%Solid Waste Digestion WTE Zone A - West CPI 35 $10,000 8,322 4% 39% 7% 6% 38% 6% 100% 100%Solid Waste Digestion WTE Zone F - Capital CPI 35 $10,000 8,322 4% 39% 7% 6% 38% 6% 100% 100%Solid Waste Digestion WTE Zone G - Lower HV CPI 35 $10,500 8,322 4% 39% 7% 6% 38% 6% 100% 100%Solid Waste Digestion WTE Zone J - NYC CPI 35 $13,500 8,333 4% 39% 7% 6% 38% 6% 100% 100%Solid Waste Digestion WTE Zone K - Long Island CPI 35 $11,500 8,322 4% 39% 7% 6% 38% 6% 100% 100%WTE Large WTE Statewide GHG 35 $8,500 8,322 4% 39% 7% 6% 38% 6% 100% 100%WTE Large WTE Zone A - West GHG 35 $7,500 8,322 4% 39% 7% 6% 38% 6% 100% 100%WTE Large WTE Zone F - Capital GHG 35 $7,500 8,322 4% 39% 7% 6% 38% 6% 100% 100%WTE Large WTE Zone G - Lower HV GHG 35 $8,500 8,322 4% 39% 7% 6% 38% 6% 100% 100%WTE Large WTE Zone J - NYC GHG 35 $11,500 8,322 4% 39% 7% 6% 38% 6% 100% 100%WTE Large WTE Zone K - Long Island GHG 35 $9,500 8,322 4% 39% 7% 6% 38% 6% 100% 100%WTE Small WTE Statewide GHG 35 $10,500 8,322 4% 39% 7% 6% 38% 6% 100% 100%WTE Small WTE Zone A - West GHG 35 $9,500 8,322 4% 39% 7% 6% 38% 6% 100% 100%WTE Small WTE Zone F - Capital GHG 35 $9,500 8,322 4% 39% 7% 6% 38% 6% 100% 100%WTE Small WTE Zone G - Lower HV GHG 35 $10,500 8,322 4% 39% 7% 6% 38% 6% 100% 100%WTE Small WTE Zone J - NYC GHG 35 $13,500 8,322 4% 39% 7% 6% 38% 6% 100% 100%WTE Small WTE Zone K - Long Island GHG 35 $11,500 8,322 4% 39% 7% 6% 38% 6% 100% 100%Solid Waste Digestion WTE Statewide GHG 35 $10,500 8,322 4% 39% 7% 6% 38% 6% 100% 100%Solid Waste Digestion WTE Zone A - West GHG 35 $10,000 8,322 4% 39% 7% 6% 38% 6% 100% 100%Solid Waste Digestion WTE Zone F - Capital GHG 35 $10,000 8,322 4% 39% 7% 6% 38% 6% 100% 100%Solid Waste Digestion WTE Zone G - Lower HV GHG 35 $10,500 8,322 4% 39% 7% 6% 38% 6% 100% 100%Solid Waste Digestion WTE Zone J - NYC GHG 35 $13,500 8,333 4% 39% 7% 6% 38% 6% 100% 100%Solid Waste Digestion WTE Zone K - Long Island GHG 35 $11,500 8,322 4% 39% 7% 6% 38% 6% 100% 100%

Table 6.3.5 Municipal Solid Waste Screening Inputs 8/19/2003
1
2
3
456789101112131415161718192021222324252627282930313233343536373839
P Q R S T U V W X Y Z AA AB AC AD AE AFP Q R S T U V W X Y Z AA AB AC AD AE AF
Winter Generation Capacity % of Max Output
Fossil Fuel Type
Fossil Fuel Usage MMBTU/Yr
Real Levelized O&M $/yr
Installed Capacity (kW) 2003
Installed Capacity (kW) 2007
Installed Capacity (kW) 2012
Installed Capacity (kW) 2022
Total Installed Cost ($/kW of rated max output) 2007
Total Installed Cost ($/kW of rated max output) 2012
Total Installed Cost ($/kW of rated max output) 2022
Real Levelized O&M $/yr 2007
Real Levelized O&M $/yr 2012
Real Levelized O&M $/yr 2022
Annual kWh/kW -2007
Annual kWh/kW -2012
Annual kWh/kW -2022
100% -$530 211,700 211,700 287,800 370,900 8,500 8,500 8,500 -530 -530 -530 8,322 8,322 8,322100% -$352 38,300 38,300 38,300 38,300 7,500 7,500 7,500 -352 -352 -352 8,322 8,322 8,322100% -$555 0 0 0 0 7,500 7,500 7,500 -555 -555 -555 8,322 8,322 8,322100% -$530 0 0 0 0 8,500 8,500 8,500 -530 -530 -530 8,322 8,322 8,322100% -$507 0 0 76,100 159,200 11,500 11,500 11,500 -507 -507 -507 8,322 8,322 8,322100% -$455 101,100 101,100 101,100 101,100 9,500 9,500 9,500 -455 -455 -455 8,322 8,322 8,322100% -$330 23,600 23,600 23,600 23,600 10,500 10,500 10,500 -330 -330 -330 8,322 8,322 8,322100% -$152 0 0 0 0 9,500 9,500 9,500 -152 -152 -152 8,322 8,322 8,322100% -$355 10,500 10,500 10,500 10,500 9,500 9,500 9,500 -355 -355 -355 8,322 8,322 8,322100% -$330 5,900 5,900 5,900 5,900 10,500 10,500 10,500 -330 -330 -330 8,322 8,322 8,322100% -$307 0 0 0 0 13,500 13,500 13,500 -307 -307 -307 8,322 8,322 8,322100% -$255 6,800 6,800 6,800 6,800 11,500 11,500 11,500 -255 -255 -255 8,322 8,322 8,322100% -$330 0 0 5,800 11,500 10,500 10,500 10,500 -330 -330 -330 8,322 8,322 8,322100% -$152 0 0 0 0 10,000 10,000 10,000 -152 -152 -152 8,322 8,322 8,322100% -$355 0 0 0 0 10,000 10,000 10,000 -355 -355 -355 8,322 8,322 8,322100% -$330 0 0 0 0 10,500 10,500 10,500 -330 -330 -330 8,322 8,322 8,322100% -$307 0 0 5,800 11,500 13,500 13,500 13,500 -307 -307 -307 8,333 8,333 8,333100% -$255 0 0 0 0 11,500 11,500 11,500 -255 -255 -255 8,322 8,322 8,322100% 0 0 -$530 211,700 211,700 211,700 211,700 8,500 8,500 8,500 -530 -530 -530 8,322 8,322 8,322100% -$352 38,300 38,300 38,300 38,300 7,500 7,500 7,500 -352 -352 -352 8,322 8,322 8,322100% -$555 0 0 0 0 7,500 7,500 7,500 -555 -555 -555 8,322 8,322 8,322100% -$530 0 0 0 0 8,500 8,500 8,500 -530 -530 -530 8,322 8,322 8,322100% -$507 0 0 0 0 11,500 11,500 11,500 -507 -507 -507 8,322 8,322 8,322100% -$455 101,100 101,100 101,100 101,100 9,500 9,500 9,500 -455 -455 -455 8,322 8,322 8,322100% 0 0 -$330 23,600 23,600 23,600 23,600 10,500 10,500 10,500 -330 -330 -330 8,322 8,322 8,322100% -$152 0 0 0 0 9,500 9,500 9,500 -152 -152 -152 8,322 8,322 8,322100% -$355 10,500 10,500 10,500 10,500 9,500 9,500 9,500 -355 -355 -355 8,322 8,322 8,322100% -$330 5,900 5,900 5,900 5,900 10,500 10,500 10,500 -330 -330 -330 8,322 8,322 8,322100% -$307 0 0 0 0 13,500 13,500 13,500 -307 -307 -307 8,322 8,322 8,322100% -$255 6,800 6,800 6,800 6,800 11,500 11,500 11,500 -255 -255 -255 8,322 8,322 8,322100% 0 0 -$330 0 0 0 0 10,500 10,500 10,500 -330 -330 -330 8,322 8,322 8,322100% -$152 0 0 0 0 10,000 10,000 10,000 -152 -152 -152 8,322 8,322 8,322100% -$355 0 0 0 0 10,000 10,000 10,000 -355 -355 -355 8,322 8,322 8,322100% -$330 0 0 0 0 10,500 10,500 10,500 -330 -330 -330 8,322 8,322 8,322100% -$307 0 0 0 0 13,500 13,500 13,500 -307 -307 -307 8,333 8,333 8,333
III. Penetrations IV. Future Costs & Outputs
Installed Costs Levelized O&M CostsTechnology Output (kWh/kW
installed)cidence Factors

Table 6.3.5 Municipal Solid Waste Screening Inputs 8/19/2003
40414243444546474849505152535455565758596061626364656667686970717273747576
P Q R S T U V W X Y Z AA AB AC AD AE AF100% -$255 0 0 0 0 11,500 11,500 11,500 -255 -255 -255 8,322 8,322 8,322100% 0 0 -$530 211,700 211,700 211,700 211,700 8,500 8,500 8,500 -530 -530 -530 8,322 8,322 8,322100% -$352 38,300 38,300 28,173 21,861 7,500 7,500 7,500 -352 -352 -352 8,322 8,322 8,322100% -$555 0 0 0 0 7,500 7,500 7,500 -555 -555 -555 8,322 8,322 8,322100% -$530 0 0 0 0 8,500 8,500 8,500 -530 -530 -530 8,322 8,322 8,322100% -$507 0 0 55,978 90,867 11,500 11,500 11,500 -507 -507 -507 8,322 8,322 8,322100% -$455 101,100 101,100 74,367 57,705 9,500 9,500 9,500 -455 -455 -455 8,322 8,322 8,322100% 0 0 -$330 23,600 23,600 23,600 23,600 10,500 10,500 10,500 -330 -330 -330 8,322 8,322 8,322100% -$152 0 0 0 0 9,500 9,500 9,500 -152 -152 -152 8,322 8,322 8,322100% -$355 10,500 10,500 10,500 10,500 9,500 9,500 9,500 -355 -355 -355 8,322 8,322 8,322100% -$330 5,900 5,900 5,900 5,900 10,500 10,500 10,500 -330 -330 -330 8,322 8,322 8,322100% -$307 0 0 0 0 13,500 13,500 13,500 -307 -307 -307 8,322 8,322 8,322100% -$255 6,800 6,800 6,800 6,800 11,500 11,500 11,500 -255 -255 -255 8,322 8,322 8,322100% 0 0 -$330 0 0 0 0 10,500 10,500 10,500 -330 -330 -330 8,322 8,322 8,322100% -$152 0 0 0 0 10,000 10,000 10,000 -152 -152 -152 8,322 8,322 8,322100% -$355 0 0 0 0 10,000 10,000 10,000 -355 -355 -355 8,322 8,322 8,322100% -$330 0 0 0 0 10,500 10,500 10,500 -330 -330 -330 8,322 8,322 8,322100% -$307 0 0 0 0 13,500 13,500 13,500 -307 -307 -307 8,333 8,333 8,333100% -$255 0 0 0 0 11,500 11,500 11,500 -255 -255 -255 8,322 8,322 8,322100% 0 0 -$530 211,700 211,700 287,800 370,900 8,500 8,500 8,500 -530 -530 -530 8,322 8,322 8,322100% -$352 38,300 38,300 38,300 38,300 7,500 7,500 7,500 -352 -352 -352 8,322 8,322 8,322100% -$555 0 0 0 0 7,500 7,500 7,500 -555 -555 -555 8,322 8,322 8,322100% -$530 0 0 0 0 8,500 8,500 8,500 -530 -530 -530 8,322 8,322 8,322100% -$507 0 0 76,100 159,200 11,500 11,500 11,500 -507 -507 -507 8,322 8,322 8,322100% -$455 101,100 101,100 101,100 101,100 9,500 9,500 9,500 -455 -455 -455 8,322 8,322 8,322100% 0 0 -$330 23,600 23,600 23,600 23,600 10,500 10,500 10,500 -330 -330 -330 8,322 8,322 8,322100% -$152 0 0 0 0 9,500 9,500 9,500 -152 -152 -152 8,322 8,322 8,322100% -$355 10,500 10,500 10,500 10,500 9,500 9,500 9,500 -355 -355 -355 8,322 8,322 8,322100% -$330 5,900 5,900 5,900 5,900 10,500 10,500 10,500 -330 -330 -330 8,322 8,322 8,322100% -$307 0 0 0 0 13,500 13,500 13,500 -307 -307 -307 8,322 8,322 8,322100% -$255 6,800 6,800 6,800 6,800 11,500 11,500 11,500 -255 -255 -255 8,322 8,322 8,322100% 0 0 -$330 0 0 5,800 11,500 10,500 10,500 10,500 -330 -330 -330 8,322 8,322 8,322100% -$152 0 0 0 0 10,000 10,000 10,000 -152 -152 -152 8,322 8,322 8,322100% -$355 0 0 0 0 10,000 10,000 10,000 -355 -355 -355 8,322 8,322 8,322100% -$330 0 0 0 0 10,500 10,500 10,500 -330 -330 -330 8,322 8,322 8,322100% -$307 0 0 5,800 11,500 13,500 13,500 13,500 -307 -307 -307 8,333 8,333 8,333100% -$255 0 0 0 0 11,500 11,500 11,500 -255 -255 -255 8,322 8,322 8,322

Table 6.3.6 PV Screening Inputs 8/19/2003
1
2
3
45678910111213141516171819202122232425262728293031323334353637383940414243444546
A B C D E F G H I J K L M N O PA B C D E F G H I J K L M N O P
Measure Name ResourcZone Scenario Technology Life
Total Installed Cost ($/kW of rated max output)
Annual kWh/kW produced -2003
Summer On- Peak %
Summer Off - Peak %
Summer Shoulder %
Winter On - Peak %
Winter Off - Peak %
Winter Shoulder %
Energy Period Sum (Sum Col F -Col K) Should equal 100%
Summer Generation Capacity % of Max Output
Winter Generation Capacity % of Max Output
PV Residential PV Statewide Tech 25 $8,500 1,417 14% 37% 9% 6% 28% 6% 100% 41% 10%PV Residential PV Zone A - West Tech 25 $8,500 1,320 16% 37% 9% 6% 28% 5% 100% 34% 9%PV Residential PV Zone F - Capital Tech 25 $8,500 1,414 14% 37% 9% 6% 28% 6% 100% 31% 9%PV Residential PV Zone G - Lower HV Tech 25 $8,500 1,449 14% 37% 9% 6% 28% 6% 100% 38% 7%PV Residential PV Zone J - NYC Tech 25 $8,500 1,483 14% 37% 8% 6% 28% 6% 100% 46% 15%PV Residential PV Zone K - Long Island Tech 25 $8,500 1,482 14% 37% 8% 6% 28% 6% 100% 45% 6%PV C&I with solar load controPV Statewide Tech 25 $7,500 1,488 15% 38% 9% 6% 27% 5% 100% 90% 12%PV C&I with solar load controPV Zone A - West Tech 25 $7,500 1,403 16% 38% 10% 5% 27% 4% 100% 90% 12%PV C&I with solar load controPV Zone F - Capital Tech 25 $7,500 1,482 14% 38% 9% 6% 27% 6% 100% 90% 12%PV C&I with solar load controPV Zone G - Lower HV Tech 25 $7,500 1,517 14% 38% 9% 6% 27% 6% 100% 90% 9%PV C&I with solar load controPV Zone J - NYC Tech 25 $7,500 1,551 14% 38% 9% 6% 27% 6% 100% 90% 20%PV C&I with solar load controPV Zone K - Long Island Tech 25 $7,500 1,551 14% 38% 9% 6% 27% 6% 100% 90% 8%PV C&I no load control PV Statewide Tech 25 $7,000 1,488 15% 38% 9% 6% 27% 5% 100% 43% 8%PV C&I no load control PV Zone A - West Tech 25 $7,000 1,403 16% 38% 10% 5% 27% 4% 100% 36% 8%PV C&I no load control PV Zone F - Capital Tech 25 $7,000 1,482 14% 38% 9% 6% 27% 6% 100% 33% 8%PV C&I no load control PV Zone G - Lower HV Tech 25 $7,000 1,517 14% 38% 9% 6% 27% 6% 100% 41% 6%PV C&I no load control PV Zone J - NYC Tech 25 $7,000 1,551 14% 38% 9% 6% 27% 6% 100% 49% 13%PV C&I no load control PV Zone K - Long Island Tech 25 $7,000 1,551 14% 38% 9% 6% 27% 6% 100% 47% 5%PV BIPV PV Statewide Tech 25 $8,500 966 11% 38% 8% 7% 29% 7% 100% 14% 12%PV BIPV PV Zone A - West Tech 25 $8,500 899 12% 38% 8% 6% 29% 6% 100% 13% 12%PV BIPV PV Zone F - Capital Tech 25 $8,500 977 10% 38% 8% 7% 29% 7% 100% 16% 11%PV BIPV PV Zone G - Lower HV Tech 25 $8,500 978 10% 38% 8% 7% 29% 7% 100% 20% 18%PV BIPV PV Zone J - NYC Tech 25 $8,500 1,007 10% 38% 8% 7% 30% 7% 100% 20% 8%PV BIPV PV Zone K - Long Island Tech 25 $8,500 998 10% 38% 8% 7% 30% 7% 100% 16% 12%PV Residential PV Statewide Base 25 $8,500 1,417 14% 37% 9% 6% 28% 6% 100% 41% 10%PV Residential PV Zone A - West Base 25 $8,500 1,320 16% 37% 9% 6% 28% 5% 100% 34% 9%PV Residential PV Zone F - Capital Base 25 $8,500 1,414 14% 37% 9% 6% 28% 6% 100% 31% 9%PV Residential PV Zone G - Lower HV Base 25 $8,500 1,449 14% 37% 9% 6% 28% 6% 100% 38% 7%PV Residential PV Zone J - NYC Base 25 $8,500 1,483 14% 37% 8% 6% 28% 6% 100% 46% 15%PV Residential PV Zone K - Long Island Base 25 $8,500 1,482 14% 37% 8% 6% 28% 6% 100% 45% 6%PV C&I with solar load controPV Statewide Base 25 $7,500 1,488 15% 38% 9% 6% 27% 5% 100% 90% 12%PV C&I with solar load controPV Zone A - West Base 25 $7,500 1,403 16% 38% 10% 5% 27% 4% 100% 90% 12%PV C&I with solar load controPV Zone F - Capital Base 25 $7,500 1,482 14% 38% 9% 6% 27% 6% 100% 90% 12%PV C&I with solar load controPV Zone G - Lower HV Base 25 $7,500 1,517 14% 38% 9% 6% 27% 6% 100% 90% 9%PV C&I with solar load controPV Zone J - NYC Base 25 $7,500 1,551 14% 38% 9% 6% 27% 6% 100% 90% 20%PV C&I with solar load controPV Zone K - Long Island Base 25 $7,500 1,551 14% 38% 9% 6% 27% 6% 100% 90% 8%PV C&I no load control PV Statewide Base 25 $7,000 1,488 15% 38% 9% 6% 27% 5% 100% 43% 8%PV C&I no load control PV Zone A - West Base 25 $7,000 1,403 16% 38% 10% 5% 27% 4% 100% 36% 8%PV C&I no load control PV Zone F - Capital Base 25 $7,000 1,482 14% 38% 9% 6% 27% 6% 100% 33% 8%PV C&I no load control PV Zone G - Lower HV Base 25 $7,000 1,517 14% 38% 9% 6% 27% 6% 100% 41% 6%PV C&I no load control PV Zone J - NYC Base 25 $7,000 1,551 14% 38% 9% 6% 27% 6% 100% 49% 13%PV C&I no load control PV Zone K - Long Island Base 25 $7,000 1,551 14% 38% 9% 6% 27% 6% 100% 47% 5%
I. Measure Name/Zone Scenario
Energy Coincidence Factors Capacity Coincidence Factors
II. Current Technology Costs and Outputs

Table 6.3.6 PV Screening Inputs 8/19/2003
4748495051525354555657585960616263646566676869707172737475767778798081828384858687888990919293949596979899100
A B C D E F G H I J K L M N O PPV BIPV PV Statewide Base 25 $8,500 966 11% 38% 8% 7% 29% 7% 100% 14% 12%PV BIPV PV Zone A - West Base 25 $8,500 899 12% 38% 8% 6% 29% 6% 100% 13% 12%PV BIPV PV Zone F - Capital Base 25 $8,500 977 10% 38% 8% 7% 29% 7% 100% 16% 11%PV BIPV PV Zone G - Lower HV Base 25 $8,500 978 10% 38% 8% 7% 29% 7% 100% 20% 18%PV BIPV PV Zone J - NYC Base 25 $8,500 1,007 10% 38% 8% 7% 30% 7% 100% 20% 8%PV BIPV PV Zone K - Long Island Base 25 $8,500 998 10% 38% 8% 7% 30% 7% 100% 16% 12%PV Residential PV Statewide CPI 25 $8,500 1,417 14% 37% 9% 6% 28% 6% 100% 41% 10%PV Residential PV Zone A - West CPI 25 $8,500 1,320 16% 37% 9% 6% 28% 5% 100% 34% 9%PV Residential PV Zone F - Capital CPI 25 $8,500 1,414 14% 37% 9% 6% 28% 6% 100% 31% 9%PV Residential PV Zone G - Lower HV CPI 25 $8,500 1,449 14% 37% 9% 6% 28% 6% 100% 38% 7%PV Residential PV Zone J - NYC CPI 25 $8,500 1,483 14% 37% 8% 6% 28% 6% 100% 46% 15%PV Residential PV Zone K - Long Island CPI 25 $8,500 1,482 14% 37% 8% 6% 28% 6% 100% 45% 6%PV C&I with solar load controPV Statewide CPI 25 $7,500 1,488 15% 38% 9% 6% 27% 5% 100% 90% 12%PV C&I with solar load controPV Zone A - West CPI 25 $7,500 1,403 16% 38% 10% 5% 27% 4% 100% 90% 12%PV C&I with solar load controPV Zone F - Capital CPI 25 $7,500 1,482 14% 38% 9% 6% 27% 6% 100% 90% 12%PV C&I with solar load controPV Zone G - Lower HV CPI 25 $7,500 1,517 14% 38% 9% 6% 27% 6% 100% 90% 9%PV C&I with solar load controPV Zone J - NYC CPI 25 $7,500 1,551 14% 38% 9% 6% 27% 6% 100% 90% 20%PV C&I with solar load controPV Zone K - Long Island CPI 25 $7,500 1,551 14% 38% 9% 6% 27% 6% 100% 90% 8%PV C&I no load control PV Statewide CPI 25 $7,000 1,488 15% 38% 9% 6% 27% 5% 100% 43% 8%PV C&I no load control PV Zone A - West CPI 25 $7,000 1,403 16% 38% 10% 5% 27% 4% 100% 36% 8%PV C&I no load control PV Zone F - Capital CPI 25 $7,000 1,482 14% 38% 9% 6% 27% 6% 100% 33% 8%PV C&I no load control PV Zone G - Lower HV CPI 25 $7,000 1,517 14% 38% 9% 6% 27% 6% 100% 41% 6%PV C&I no load control PV Zone J - NYC CPI 25 $7,000 1,551 14% 38% 9% 6% 27% 6% 100% 49% 13%PV C&I no load control PV Zone K - Long Island CPI 25 $7,000 1,551 14% 38% 9% 6% 27% 6% 100% 47% 5%PV BIPV PV Statewide CPI 25 $8,500 966 11% 38% 8% 7% 29% 7% 100% 14% 12%PV BIPV PV Zone A - West CPI 25 $8,500 899 12% 38% 8% 6% 29% 6% 100% 13% 12%PV BIPV PV Zone F - Capital CPI 25 $8,500 977 10% 38% 8% 7% 29% 7% 100% 16% 11%PV BIPV PV Zone G - Lower HV CPI 25 $8,500 978 10% 38% 8% 7% 29% 7% 100% 20% 18%PV BIPV PV Zone J - NYC CPI 25 $8,500 1,007 10% 38% 8% 7% 30% 7% 100% 20% 8%PV BIPV PV Zone K - Long Island CPI 25 $8,500 998 10% 38% 8% 7% 30% 7% 100% 16% 12%PV Residential PV Statewide GHG 25 $8,500 1,417 14% 37% 9% 6% 28% 6% 100% 41% 10%PV Residential PV Zone A - West GHG 25 $8,500 1,320 16% 37% 9% 6% 28% 5% 100% 34% 9%PV Residential PV Zone F - Capital GHG 25 $8,500 1,414 14% 37% 9% 6% 28% 6% 100% 31% 9%PV Residential PV Zone G - Lower HV GHG 25 $8,500 1,449 14% 37% 9% 6% 28% 6% 100% 38% 7%PV Residential PV Zone J - NYC GHG 25 $8,500 1,483 14% 37% 8% 6% 28% 6% 100% 46% 15%PV Residential PV Zone K - Long Island GHG 25 $8,500 1,482 14% 37% 8% 6% 28% 6% 100% 45% 6%PV C&I with solar load controPV Statewide GHG 25 $7,500 1,488 15% 38% 9% 6% 27% 5% 100% 90% 12%PV C&I with solar load controPV Zone A - West GHG 25 $7,500 1,403 16% 38% 10% 5% 27% 4% 100% 90% 12%PV C&I with solar load controPV Zone F - Capital GHG 25 $7,500 1,482 14% 38% 9% 6% 27% 6% 100% 90% 12%PV C&I with solar load controPV Zone G - Lower HV GHG 25 $7,500 1,517 14% 38% 9% 6% 27% 6% 100% 90% 9%PV C&I with solar load controPV Zone J - NYC GHG 25 $7,500 1,551 14% 38% 9% 6% 27% 6% 100% 90% 20%PV C&I with solar load controPV Zone K - Long Island GHG 25 $7,500 1,551 14% 38% 9% 6% 27% 6% 100% 90% 8%PV C&I no load control PV Statewide GHG 25 $7,000 1,488 15% 38% 9% 6% 27% 5% 100% 43% 8%PV C&I no load control PV Zone A - West GHG 25 $7,000 1,403 16% 38% 10% 5% 27% 4% 100% 36% 8%PV C&I no load control PV Zone F - Capital GHG 25 $7,000 1,482 14% 38% 9% 6% 27% 6% 100% 33% 8%PV C&I no load control PV Zone G - Lower HV GHG 25 $7,000 1,517 14% 38% 9% 6% 27% 6% 100% 41% 6%PV C&I no load control PV Zone J - NYC GHG 25 $7,000 1,551 14% 38% 9% 6% 27% 6% 100% 49% 13%PV C&I no load control PV Zone K - Long Island GHG 25 $7,000 1,551 14% 38% 9% 6% 27% 6% 100% 47% 5%PV BIPV PV Statewide GHG 25 $8,500 966 11% 38% 8% 7% 29% 7% 100% 14% 12%PV BIPV PV Zone A - West GHG 25 $8,500 899 12% 38% 8% 6% 29% 6% 100% 13% 12%PV BIPV PV Zone F - Capital GHG 25 $8,500 977 10% 38% 8% 7% 29% 7% 100% 16% 11%PV BIPV PV Zone G - Lower HV GHG 25 $8,500 978 10% 38% 8% 7% 29% 7% 100% 20% 18%PV BIPV PV Zone J - NYC GHG 25 $8,500 1,007 10% 38% 8% 7% 30% 7% 100% 20% 8%PV BIPV PV Zone K - Long Island GHG 25 $8,500 998 10% 38% 8% 7% 30% 7% 100% 16% 12%

Table 6.3.6 PV Screening Inputs 8/19/2003
1
2
3
45678910111213141516171819202122232425262728293031323334353637383940414243444546
Q R S T U V W X Y Z AA AB AC AD AE AFQ R S T U V W X Y Z AA AB AC AD AE AF
Fossil Fuel Type
Fossil Fuel Usage MMBTU/Yr
Real Levelized O&M $/yr
Installed Capacity (kW) 2003
Installed Capacity (kW) 2007
Installed Capacity (kW) 2012
Installed Capacity (kW) 2022
Total Installed Cost ($/kW of rated max output) 2007
Total Installed Cost ($/kW of rated max output) 2012
Total Installed Cost ($/kW of rated max output) 2022
Real Levelized O&M $/yr 2007
Real Levelized O&M $/yr 2012
Real Levelized O&M $/yr 2022
Annual kWh/kW -2007
Annual kWh/kW -2012
Annual kWh/kW -2022
$22 4,024 44,000 354,000 15,080,000 6,000$ 4,750$ 3,500$ 13.33$ 3.55$ 3.55$ 1,417 1,417 1,417$22 462 5,000 41,000 1,732,000 6,000$ 4,750$ 3,500$ 13.33$ 3.55$ 3.55$ 1,320 1,320 1,320$22 324 4,000 29,000 1,214,000 6,000$ 4,750$ 3,500$ 13.33$ 3.55$ 3.55$ 1,414 1,414 1,414$22 354 4,000 31,000 1,327,000 6,000$ 4,750$ 3,500$ 13.33$ 3.55$ 3.55$ 1,449 1,449 1,449$22 943 10,000 83,000 3,535,000 6,000$ 4,750$ 3,500$ 13.33$ 3.55$ 3.55$ 1,483 1,483 1,483$22 793 9,000 70,000 2,971,000 6,000$ 4,750$ 3,500$ 13.33$ 3.55$ 3.55$ 1,482 1,482 1,482$22 2,285 25,000 201,000 10,275,000 5,700$ 4,700$ 3,500$ 13.33$ 3.55$ 3.55$ 1,488 1,488 1,488$22 263 3,000 23,000 1,180,200 5,700$ 4,700$ 3,500$ 13.33$ 3.55$ 3.55$ 1,403 1,403 1,403$22 184 2,000 16,000 826,800 5,700$ 4,700$ 3,500$ 13.33$ 3.55$ 3.55$ 1,482 1,482 1,482$22 201 2,000 17,500 904,200 5,700$ 4,700$ 3,500$ 13.33$ 3.55$ 3.55$ 1,517 1,517 1,517$22 536 6,000 47,000 2,408,400 5,700$ 4,700$ 3,500$ 13.33$ 3.55$ 3.55$ 1,551 1,551 1,551$22 450 5,000 39,500 2,023,800 5,700$ 4,700$ 3,500$ 13.33$ 3.55$ 3.55$ 1,551 1,551 1,551$22 2,285 25,000 201,000 6,850,000 5,200$ 4,200$ 3,000$ 13.33$ 3.55$ 3.55$ 1,488 1,488 1,488$22 263 3,000 23,000 786,800 5,200$ 4,200$ 3,000$ 13.33$ 3.55$ 3.55$ 1,403 1,403 1,403$22 184 2,000 16,000 551,200 5,200$ 4,200$ 3,000$ 13.33$ 3.55$ 3.55$ 1,482 1,482 1,482$22 201 2,000 17,500 602,800 5,200$ 4,200$ 3,000$ 13.33$ 3.55$ 3.55$ 1,517 1,517 1,517$22 536 6,000 47,000 1,605,600 5,200$ 4,200$ 3,000$ 13.33$ 3.55$ 3.55$ 1,551 1,551 1,551$22 450 5,000 39,500 1,349,200 5,200$ 4,200$ 3,000$ 13.33$ 3.55$ 3.55$ 1,551 1,551 1,551$22 407 4,046 27,995 796,000 6,000$ 4,750$ 3,500$ 13.33$ 3.55$ 3.55$ 966 966 966$22 47 465 3,215 91,000 6,000$ 4,750$ 3,500$ 13.33$ 3.55$ 3.55$ 899 899 899$22 33 326 2,253 64,000 6,000$ 4,750$ 3,500$ 13.33$ 3.55$ 3.55$ 977 977 977$22 36 356 2,464 70,000 6,000$ 4,750$ 3,500$ 13.33$ 3.55$ 3.55$ 978 978 978$22 95 948 6,562 187,000 6,000$ 4,750$ 3,500$ 13.33$ 3.55$ 3.55$ 1,007 1,007 1,007$22 80 797 5,515 157,000 6,000$ 4,750$ 3,500$ 13.33$ 3.55$ 3.55$ 998 998 998
0 0 $22 10 440 3,540 150,800 6,000$ 4,750$ 3,500$ 13.33$ 3.55$ 3.55$ 1,417 1,417 1,417$22 1 50 410 17,320 6,000$ 4,750$ 3,500$ 13.33$ 3.55$ 3.55$ 1,320 1,320 1,320$22 1 40 290 12,140 6,000$ 4,750$ 3,500$ 13.33$ 3.55$ 3.55$ 1,414 1,414 1,414$22 1 40 310 13,270 6,000$ 4,750$ 3,500$ 13.33$ 3.55$ 3.55$ 1,449 1,449 1,449$22 2 100 830 35,350 6,000$ 4,750$ 3,500$ 13.33$ 3.55$ 3.55$ 1,483 1,483 1,483$22 2 90 700 29,710 6,000$ 4,750$ 3,500$ 13.33$ 3.55$ 3.55$ 1,482 1,482 1,482
0 0 $22 6 250 2,010 102,750 5,700$ 4,700$ 3,500$ 13.33$ 3.55$ 3.55$ 1,488 1,488 1,488$22 1 30 230 11,802 5,700$ 4,700$ 3,500$ 13.33$ 3.55$ 3.55$ 1,403 1,403 1,403$22 0 20 160 8,268 5,700$ 4,700$ 3,500$ 13.33$ 3.55$ 3.55$ 1,482 1,482 1,482$22 1 20 175 9,042 5,700$ 4,700$ 3,500$ 13.33$ 3.55$ 3.55$ 1,517 1,517 1,517$22 1 60 470 24,084 5,700$ 4,700$ 3,500$ 13.33$ 3.55$ 3.55$ 1,551 1,551 1,551$22 1 50 395 20,238 5,700$ 4,700$ 3,500$ 13.33$ 3.55$ 3.55$ 1,551 1,551 1,551
0 0 $22 6 250 2,010 68,500 5,200$ 4,200$ 3,000$ 13.33$ 3.55$ 3.55$ 1,488 1,488 1,488$22 1 30 230 7,868 5,200$ 4,200$ 3,000$ 13.33$ 3.55$ 3.55$ 1,403 1,403 1,403$22 0 20 160 5,512 5,200$ 4,200$ 3,000$ 13.33$ 3.55$ 3.55$ 1,482 1,482 1,482$22 1 20 175 6,028 5,200$ 4,200$ 3,000$ 13.33$ 3.55$ 3.55$ 1,517 1,517 1,517$22 1 60 470 16,056 5,200$ 4,200$ 3,000$ 13.33$ 3.55$ 3.55$ 1,551 1,551 1,551$22 1 50 395 13,492 5,200$ 4,200$ 3,000$ 13.33$ 3.55$ 3.55$ 1,551 1,551 1,551
III. Penetrations IV. Future Costs & Outputs
Installed Costs Levelized O&M Costs Technology Output (kWh/kW installed)

Table 6.3.6 PV Screening Inputs 8/19/2003
4748495051525354555657585960616263646566676869707172737475767778798081828384858687888990919293949596979899100
Q R S T U V W X Y Z AA AB AC AD AE AF0 0 $22 1 40 280 7,960 6,000$ 4,750$ 3,500$ 13.33$ 3.55$ 3.55$ 966 966 966
$22 0 5 32 910 6,000$ 4,750$ 3,500$ 13.33$ 3.55$ 3.55$ 899 899 899$22 0 3 23 640 6,000$ 4,750$ 3,500$ 13.33$ 3.55$ 3.55$ 977 977 977$22 0 4 25 700 6,000$ 4,750$ 3,500$ 13.33$ 3.55$ 3.55$ 978 978 978$22 0 9 66 1,870 6,000$ 4,750$ 3,500$ 13.33$ 3.55$ 3.55$ 1,007 1,007 1,007$22 0 8 55 1,570 6,000$ 4,750$ 3,500$ 13.33$ 3.55$ 3.55$ 998 998 998
0 0 $22 765 4,400 10,620 180,960 6,000$ 4,750$ 3,500$ 13.33$ 3.55$ 3.55$ 1,417 1,417 1,417$22 88 500 1,230 20,784 6,000$ 4,750$ 3,500$ 13.33$ 3.55$ 3.55$ 1,320 1,320 1,320$22 62 400 870 14,568 6,000$ 4,750$ 3,500$ 13.33$ 3.55$ 3.55$ 1,414 1,414 1,414$22 67 400 930 15,924 6,000$ 4,750$ 3,500$ 13.33$ 3.55$ 3.55$ 1,449 1,449 1,449$22 179 1,000 2,490 42,420 6,000$ 4,750$ 3,500$ 13.33$ 3.55$ 3.55$ 1,483 1,483 1,483$22 151 900 2,100 35,652 6,000$ 4,750$ 3,500$ 13.33$ 3.55$ 3.55$ 1,482 1,482 1,482
0 0 $22 434 2,500 6,030 123,300 5,700$ 4,700$ 3,500$ 13.33$ 3.55$ 3.55$ 1,488 1,488 1,488$22 50 300 690 14,162 5,700$ 4,700$ 3,500$ 13.33$ 3.55$ 3.55$ 1,403 1,403 1,403$22 35 200 480 9,922 5,700$ 4,700$ 3,500$ 13.33$ 3.55$ 3.55$ 1,482 1,482 1,482$22 38 200 525 10,850 5,700$ 4,700$ 3,500$ 13.33$ 3.55$ 3.55$ 1,517 1,517 1,517$22 102 600 1,410 28,901 5,700$ 4,700$ 3,500$ 13.33$ 3.55$ 3.55$ 1,551 1,551 1,551$22 86 500 1,185 24,286 5,700$ 4,700$ 3,500$ 13.33$ 3.55$ 3.55$ 1,551 1,551 1,551
0 0 $22 434 2,500 6,030 82,200 5,200$ 4,200$ 3,000$ 13.33$ 3.55$ 3.55$ 1,488 1,488 1,488$22 50 300 690 9,442 5,200$ 4,200$ 3,000$ 13.33$ 3.55$ 3.55$ 1,403 1,403 1,403$22 35 200 480 6,614 5,200$ 4,200$ 3,000$ 13.33$ 3.55$ 3.55$ 1,482 1,482 1,482$22 38 200 525 7,234 5,200$ 4,200$ 3,000$ 13.33$ 3.55$ 3.55$ 1,517 1,517 1,517$22 102 600 1,410 19,267 5,200$ 4,200$ 3,000$ 13.33$ 3.55$ 3.55$ 1,551 1,551 1,551$22 86 500 1,185 16,190 5,200$ 4,200$ 3,000$ 13.33$ 3.55$ 3.55$ 1,551 1,551 1,551
0 0 $22 77 405 840 9,552 6,000$ 4,750$ 3,500$ 13.33$ 3.55$ 3.55$ 966 966 966$22 9 47 96 1,092 6,000$ 4,750$ 3,500$ 13.33$ 3.55$ 3.55$ 899 899 899$22 6 33 68 768 6,000$ 4,750$ 3,500$ 13.33$ 3.55$ 3.55$ 977 977 977$22 7 36 74 840 6,000$ 4,750$ 3,500$ 13.33$ 3.55$ 3.55$ 978 978 978$22 18 95 197 2,244 6,000$ 4,750$ 3,500$ 13.33$ 3.55$ 3.55$ 1,007 1,007 1,007$22 15 80 165 1,884 6,000$ 4,750$ 3,500$ 13.33$ 3.55$ 3.55$ 998 998 998
0 0 $22 765 4,400 15,930 904,800 6,000$ 4,750$ 3,500$ 13.33$ 3.55$ 3.55$ 1,417 1,417 1,417$22 88 500 1,845 103,920 6,000$ 4,750$ 3,500$ 13.33$ 3.55$ 3.55$ 1,320 1,320 1,320$22 62 400 1,305 72,840 6,000$ 4,750$ 3,500$ 13.33$ 3.55$ 3.55$ 1,414 1,414 1,414$22 67 400 1,395 79,620 6,000$ 4,750$ 3,500$ 13.33$ 3.55$ 3.55$ 1,449 1,449 1,449$22 179 1,000 3,735 212,100 6,000$ 4,750$ 3,500$ 13.33$ 3.55$ 3.55$ 1,483 1,483 1,483$22 151 900 3,150 178,260 6,000$ 4,750$ 3,500$ 13.33$ 3.55$ 3.55$ 1,482 1,482 1,482
0 0 $22 434 2,500 9,045 616,500 5,700$ 4,700$ 3,500$ 13.33$ 3.55$ 3.55$ 1,488 1,488 1,488$22 50 300 1,035 70,812 5,700$ 4,700$ 3,500$ 13.33$ 3.55$ 3.55$ 1,403 1,403 1,403$22 35 200 720 49,608 5,700$ 4,700$ 3,500$ 13.33$ 3.55$ 3.55$ 1,482 1,482 1,482$22 38 200 788 54,252 5,700$ 4,700$ 3,500$ 13.33$ 3.55$ 3.55$ 1,517 1,517 1,517$22 102 600 2,115 144,504 5,700$ 4,700$ 3,500$ 13.33$ 3.55$ 3.55$ 1,551 1,551 1,551$22 86 500 1,778 121,428 5,700$ 4,700$ 3,500$ 13.33$ 3.55$ 3.55$ 1,551 1,551 1,551
0 0 $22 434 2,500 9,045 411,000 5,200$ 4,200$ 3,000$ 13.33$ 3.55$ 3.55$ 1,488 1,488 1,488$22 50 300 1,035 47,208 5,200$ 4,200$ 3,000$ 13.33$ 3.55$ 3.55$ 1,403 1,403 1,403$22 35 200 720 33,072 5,200$ 4,200$ 3,000$ 13.33$ 3.55$ 3.55$ 1,482 1,482 1,482$22 38 200 788 36,168 5,200$ 4,200$ 3,000$ 13.33$ 3.55$ 3.55$ 1,517 1,517 1,517$22 102 600 2,115 96,336 5,200$ 4,200$ 3,000$ 13.33$ 3.55$ 3.55$ 1,551 1,551 1,551$22 86 500 1,778 80,952 5,200$ 4,200$ 3,000$ 13.33$ 3.55$ 3.55$ 1,551 1,551 1,551
0 0 $22 77 405 1,260 47,760 6,000$ 4,750$ 3,500$ 13.33$ 3.55$ 3.55$ 966 966 966$22 9 47 145 5,460 6,000$ 4,750$ 3,500$ 13.33$ 3.55$ 3.55$ 899 899 899$22 6 33 101 3,840 6,000$ 4,750$ 3,500$ 13.33$ 3.55$ 3.55$ 977 977 977$22 7 36 111 4,200 6,000$ 4,750$ 3,500$ 13.33$ 3.55$ 3.55$ 978 978 978$22 18 95 295 11,220 6,000$ 4,750$ 3,500$ 13.33$ 3.55$ 3.55$ 1,007 1,007 1,007$22 15 80 248 9,420 6,000$ 4,750$ 3,500$ 13.33$ 3.55$ 3.55$ 998 998 998

Table 6.3.7 Solar Thermal Screening Inputs 8/19/2003
1
2
3
456789
10111213141516171819202122232425262728293031323334353637383940414243444546
A B C D E F G H I J K L M N OA B C D E F G H I J K L M N O
Measure Name ResourcZone Scenario Technology Life
Total Installed Cost ($/kW of rated max output)
Annual kWh/kW produced -2003
Summer On- Peak %
Summer Off - Peak %
Summer Shoulder %
Winter On - Peak %
Winter Off - Peak %
Winter Shoulder %
Energy Period Sum (Sum Col F -Col K) Should equal 100%
Summer Generation Capacity % of Max Output
Res DHW Stherm Statewide Tech 20 $1,000 541 15% 40% 10% 5% 25% 5% 100% 23%Res DHW Stherm Zone A - West Tech 20 $1,000 504 17% 40% 10% 4% 24% 3% 100% 23%Res DHW Stherm Zone F - Capital Tech 20 $1,000 541 16% 40% 10% 5% 25% 5% 100% 23%Res DHW Stherm Zone G - Lower HV Tech 20 $1,000 554 16% 40% 10% 5% 25% 5% 100% 23%Res DHW Stherm Zone J - NYC Tech 20 $1,200 566 15% 39% 10% 5% 26% 5% 100% 23%Res DHW Stherm Zone K - Long Island Tech 20 $1,200 566 15% 39% 10% 5% 26% 5% 100% 23%Com DHW Stherm Statewide Tech 20 $1,125 871 15% 40% 10% 5% 25% 5% 100% 23%Com DHW Stherm Zone A - West Tech 20 $1,125 811 17% 40% 10% 4% 24% 3% 100% 23%Com DHW Stherm Zone F - Capital Tech 20 $1,125 870 16% 40% 10% 5% 25% 5% 100% 23%Com DHW Stherm Zone G - Lower HV Tech 20 $1,125 891 16% 40% 10% 5% 25% 5% 100% 23%Com DHW Stherm Zone J - NYC Tech 20 $1,350 911 15% 39% 10% 5% 26% 5% 100% 23%Com DHW Stherm Zone K - Long Island Tech 20 $1,350 911 15% 39% 10% 5% 26% 5% 100% 23%C&I Vent Pre Heat Stherm Statewide Tech 25 $500 833 0% 0% 0% 18% 64% 18% 0%C&I Vent Pre Heat Stherm Zone A - West Tech 25 $500 833 0% 0% 0% 18% 67% 15% 100% 0%C&I Vent Pre Heat Stherm Zone F - Capital Tech 25 $500 833 0% 0% 0% 18% 64% 18% 100% 0%C&I Vent Pre Heat Stherm Zone G - Lower HV Tech 25 $500 833 0% 0% 0% 18% 63% 18% 100% 0%C&I Vent Pre Heat Stherm Zone J - NYC Tech 25 $500 833 0% 0% 0% 18% 64% 18% 100% 0%C&I Vent Pre Heat Stherm Zone K - Long Island Tech 25 $500 833 0% 0% 0% 18% 64% 18% 100% 0%Solar Absorp Cool Stherm Statewide Tech 20 $8,309 518 30% 51% 19% 0% 0% 0% 100% 43%Solar Absorp Cool Stherm Zone A - West Tech 20 $8,309 518 30% 52% 19% 0% 0% 0% 101% 36%Solar Absorp Cool Stherm Zone F - Capital Tech 20 $8,309 518 29% 52% 19% 0% 0% 0% 100% 33%Solar Absorp Cool Stherm Zone G - Lower HV Tech 20 $8,309 518 29% 52% 19% 0% 0% 0% 100% 41%Solar Absorp Cool Stherm Zone J - NYC Tech 20 $8,309 518 29% 52% 18% 0% 0% 0% 100% 49%Solar Absorp Cool Stherm Zone K - Long Island Tech 20 $8,309 518 29% 52% 18% 0% 0% 0% 100% 47%Res DHW Stherm Statewide Base 20 $1,333 541 15% 40% 10% 5% 25% 5% 100% 23%Res DHW Stherm Zone A - West Base 20 $1,333 504 15% 40% 10% 5% 25% 5% 100% 23%Res DHW Stherm Zone F - Capital Base 20 $1,333 541 15% 40% 10% 5% 25% 5% 100% 23%Res DHW Stherm Zone G - Lower HV Base 20 $1,333 554 15% 40% 10% 5% 25% 5% 100% 23%Res DHW Stherm Zone J - NYC Base 20 $1,600 566 15% 40% 10% 5% 25% 5% 100% 23%Res DHW Stherm Zone K - Long Island Base 20 $1,600 566 15% 40% 10% 5% 25% 5% 100% 23%Com DHW Stherm Statewide Base 20 $1,500 871 15% 40% 10% 5% 25% 5% 100% 23%Com DHW Stherm Zone A - West Base 20 $1,500 811 15% 40% 10% 5% 25% 5% 100% 23%Com DHW Stherm Zone F - Capital Base 20 $1,500 870 15% 40% 10% 5% 25% 5% 100% 23%Com DHW Stherm Zone G - Lower HV Base 20 $1,500 891 15% 40% 10% 5% 25% 5% 100% 23%Com DHW Stherm Zone J - NYC Base 20 $1,800 911 15% 40% 10% 5% 25% 5% 100% 23%Com DHW Stherm Zone K - Long Island Base 20 $1,800 911 15% 40% 10% 5% 25% 5% 100% 23%C&I Vent Pre Heat Stherm Statewide Base 25 $500 833 0% 0% 0% 18% 64% 18% 100% 0%C&I Vent Pre Heat Stherm Zone A - West Base 25 $500 833 0% 0% 0% 18% 64% 18% 100% 0%C&I Vent Pre Heat Stherm Zone F - Capital Base 25 $500 833 0% 0% 0% 18% 64% 18% 100% 0%C&I Vent Pre Heat Stherm Zone G - Lower HV Base 25 $500 833 0% 0% 0% 18% 64% 18% 100% 0%C&I Vent Pre Heat Stherm Zone J - NYC Base 25 $500 833 0% 0% 0% 18% 64% 18% 100% 0%C&I Vent Pre Heat Stherm Zone K - Long Island Base 25 $500 833 0% 0% 0% 18% 64% 18% 100% 0%
I. Measure Name/Zone Scenario
Energy Coincidence Factors Capacity Coinc
II. Current Technology Costs and Outputs

Table 6.3.7 Solar Thermal Screening Inputs 8/19/2003
4748495051525354555657585960616263646566676869707172737475767778798081828384858687888990919293949596979899100
A B C D E F G H I J K L M N OSolar Absorp Cool Stherm Statewide Base 20 $8,309 518 30% 51% 19% 0% 0% 0% 100% 43%Solar Absorp Cool Stherm Zone A - West Base 20 $8,309 518 30% 51% 19% 0% 0% 0% 100% 36%Solar Absorp Cool Stherm Zone F - Capital Base 20 $8,309 518 30% 51% 19% 0% 0% 0% 100% 33%Solar Absorp Cool Stherm Zone G - Lower HV Base 20 $8,309 518 30% 51% 19% 0% 0% 0% 100% 41%Solar Absorp Cool Stherm Zone J - NYC Base 20 $8,309 518 30% 51% 19% 0% 0% 0% 100% 49%Solar Absorp Cool Stherm Zone K - Long Island Base 20 $8,309 518 30% 51% 19% 0% 0% 0% 100% 47%Res DHW Stherm Statewide CPI 20 $1,333 541 15% 40% 10% 5% 25% 5% 100% 23%Res DHW Stherm Zone A - West CPI 20 $1,333 504 15% 40% 10% 5% 25% 5% 100% 23%Res DHW Stherm Zone F - Capital CPI 20 $1,333 541 15% 40% 10% 5% 25% 5% 100% 23%Res DHW Stherm Zone G - Lower HV CPI 20 $1,333 554 15% 40% 10% 5% 25% 5% 100% 23%Res DHW Stherm Zone J - NYC CPI 20 $1,600 566 15% 40% 10% 5% 25% 5% 100% 23%Res DHW Stherm Zone K - Long Island CPI 20 $1,600 566 15% 40% 10% 5% 25% 5% 100% 23%Com DHW Stherm Statewide CPI 20 $1,500 871 15% 40% 10% 5% 25% 5% 100% 23%Com DHW Stherm Zone A - West CPI 20 $1,500 811 15% 40% 10% 5% 25% 5% 100% 23%Com DHW Stherm Zone F - Capital CPI 20 $1,500 870 15% 40% 10% 5% 25% 5% 100% 23%Com DHW Stherm Zone G - Lower HV CPI 20 $1,500 891 15% 40% 10% 5% 25% 5% 100% 23%Com DHW Stherm Zone J - NYC CPI 20 $1,800 911 15% 40% 10% 5% 25% 5% 100% 23%Com DHW Stherm Zone K - Long Island CPI 20 $1,800 911 15% 40% 10% 5% 25% 5% 100% 23%C&I Vent Pre Heat Stherm Statewide CPI 25 $500 833 0% 0% 0% 18% 64% 18% 100% 0%C&I Vent Pre Heat Stherm Zone A - West CPI 25 $500 833 0% 0% 0% 18% 64% 18% 100% 0%C&I Vent Pre Heat Stherm Zone F - Capital CPI 25 $500 833 0% 0% 0% 18% 64% 18% 100% 0%C&I Vent Pre Heat Stherm Zone G - Lower HV CPI 25 $500 833 0% 0% 0% 18% 64% 18% 100% 0%C&I Vent Pre Heat Stherm Zone J - NYC CPI 25 $500 833 0% 0% 0% 18% 64% 18% 100% 0%C&I Vent Pre Heat Stherm Zone K - Long Island CPI 25 $500 833 0% 0% 0% 18% 64% 18% 100% 0%Solar Absorp Cool Stherm Statewide CPI 20 $8,309 518 30% 51% 19% 0% 0% 0% 100% 43%Solar Absorp Cool Stherm Zone A - West CPI 20 $8,309 518 30% 51% 19% 0% 0% 0% 100% 36%Solar Absorp Cool Stherm Zone F - Capital CPI 20 $8,309 518 30% 51% 19% 0% 0% 0% 100% 33%Solar Absorp Cool Stherm Zone G - Lower HV CPI 20 $8,309 518 30% 51% 19% 0% 0% 0% 100% 41%Solar Absorp Cool Stherm Zone J - NYC CPI 20 $8,309 518 30% 51% 19% 0% 0% 0% 100% 49%Solar Absorp Cool Stherm Zone K - Long Island CPI 20 $8,309 518 30% 51% 19% 0% 0% 0% 100% 47%Res DHW Stherm Statewide GHG 20 $1,200 541 15% 40% 10% 5% 25% 5% 100% 23%Res DHW Stherm Zone A - West GHG 20 $1,200 504 15% 40% 10% 5% 25% 5% 100% 23%Res DHW Stherm Zone F - Capital GHG 20 $1,200 541 15% 40% 10% 5% 25% 5% 100% 23%Res DHW Stherm Zone G - Lower HV GHG 20 $1,200 554 15% 40% 10% 5% 25% 5% 100% 23%Res DHW Stherm Zone J - NYC GHG 20 $1,440 566 15% 40% 10% 5% 25% 5% 100% 23%Res DHW Stherm Zone K - Long Island GHG 20 $1,440 566 15% 40% 10% 5% 25% 5% 100% 23%Com DHW Stherm Statewide GHG 20 $1,500 871 15% 40% 10% 5% 25% 5% 100% 23%Com DHW Stherm Zone A - West GHG 20 $1,500 811 15% 40% 10% 5% 25% 5% 100% 23%Com DHW Stherm Zone F - Capital GHG 20 $1,500 870 15% 40% 10% 5% 25% 5% 100% 23%Com DHW Stherm Zone G - Lower HV GHG 20 $1,500 891 15% 40% 10% 5% 25% 5% 100% 23%Com DHW Stherm Zone J - NYC GHG 20 $1,800 911 15% 40% 10% 5% 25% 5% 100% 23%Com DHW Stherm Zone K - Long Island GHG 20 $1,800 911 15% 40% 10% 5% 25% 5% 100% 23%C&I Vent Pre Heat Stherm Statewide GHG 25 $500 833 0% 0% 0% 18% 64% 18% 100% 0%C&I Vent Pre Heat Stherm Zone A - West GHG 25 $500 833 0% 0% 0% 18% 64% 18% 100% 0%C&I Vent Pre Heat Stherm Zone F - Capital GHG 25 $500 833 0% 0% 0% 18% 64% 18% 100% 0%C&I Vent Pre Heat Stherm Zone G - Lower HV GHG 25 $500 833 0% 0% 0% 18% 64% 18% 100% 0%C&I Vent Pre Heat Stherm Zone J - NYC GHG 25 $500 833 0% 0% 0% 18% 64% 18% 100% 0%C&I Vent Pre Heat Stherm Zone K - Long Island GHG 25 $500 833 0% 0% 0% 18% 64% 18% 100% 0%Solar Absorp Cool Stherm Statewide GHG 20 $8,309 518 30% 51% 19% 0% 0% 0% 100% 43%Solar Absorp Cool Stherm Zone A - West GHG 20 $8,309 518 30% 51% 19% 0% 0% 0% 100% 36%Solar Absorp Cool Stherm Zone F - Capital GHG 20 $8,309 518 30% 51% 19% 0% 0% 0% 100% 33%Solar Absorp Cool Stherm Zone G - Lower HV GHG 20 $8,309 518 30% 51% 19% 0% 0% 0% 100% 41%Solar Absorp Cool Stherm Zone J - NYC GHG 20 $8,309 518 30% 51% 19% 0% 0% 0% 100% 49%Solar Absorp Cool Stherm Zone K - Long Island GHG 20 $8,309 518 30% 51% 19% 0% 0% 0% 100% 47%

Table 6.3.7 Solar Thermal Screening Inputs 8/19/2003
1
2
3
456789
10111213141516171819202122232425262728293031323334353637383940414243444546
P Q R S T U V W X Y Z AA AB AC AD AE AFP Q R S T U V W X Y Z AA AB AC AD AE AF
Winter Generation Capacity % of Max Output
Fossil Fuel Type
Fossil Fuel Usage MMBTU/Yr/kW
Real Levelized O&M $/yr
Installed Capacity (kW) 2003
Installed Capacity (kW) 2007
Installed Capacity (kW) 2012
Installed Capacity (kW) 2022
Total Installed Cost ($/kW of rated max output) 2007
Total Installed Cost ($/kW of rated max output) 2012
Total Installed Cost ($/kW of rated max output) 2022
Real Levelized O&M $/yr 2007
Real Levelized O&M $/yr 2012
Real Levelized O&M $/yr 2022
Annual kWh/kW -2007
Annual kWh/kW -2012
Annual kWh/kW -2022
11% $17 ####### 2,242,909 2,464,477 2,690,888 778 667 667 16 15 14 541 541 54111% $17 228,477 232,144 255,077 278,511 778 667 667 16 15 14 504 504 50411% $17 139,193 141,427 155,398 169,674 778 667 667 16 15 14 541 541 54111% $17 185,791 188,773 207,421 226,477 778 667 667 16 15 14 554 554 55411% $17 220,631 224,172 246,317 268,946 933 800 800 16 15 14 566 566 56611% $17 444,783 451,922 496,566 542,185 933 800 800 16 15 14 566 566 56611% $5 675,952 709,837 734,345 769,620 870 750 750 5 4 4 871 871 87111% $5 37,670 38,710 39,054 37,341 870 750 750 5 4 4 811 811 81111% $5 25,700 26,541 27,032 25,898 870 750 750 5 4 4 870 870 87011% $5 22,988 24,438 25,862 27,767 870 750 750 5 4 4 891 891 89111% $5 16,843 18,106 19,581 21,989 1,044 900 900 5 4 4 911 911 91111% $5 66,904 71,125 75,268 80,812 1,044 900 900 5 4 4 911 911 91114% 3 -4.2 $0 179,180 188,162 194,690 204,044 475 451 429 0 0 0 833 833 83314% $0 41,150 43,213 44,712 46,861 475 451 429 0 0 0 833 833 83313% $0 28,284 29,702 30,732 32,209 475 451 429 0 0 0 833 833 83322% $0 13,588 14,269 14,764 15,474 475 451 429 0 0 0 833 833 83310% $0 30,568 32,100 33,214 34,809 475 451 429 0 0 0 833 833 83314% $0 40,736 42,778 44,262 46,389 475 451 429 0 0 0 833 833 8330% 5 -14 $0 - 1,386,804 3,120,309 6,587,318 5,691 3,897 1,828 518 518 5180% $0 0 60,974 137,193 289,629 5,691 3,897 1,828 0 0 0 518 518 5180% $0 0 42,246 95,055 200,671 5,691 3,897 1,828 0 0 0 518 518 5180% $0 0 65,859 148,182 312,829 5,691 3,897 1,828 0 0 0 518 518 5180% $0 0 898,480 2,021,579 4,267,778 5,691 3,897 1,828 0 0 0 518 518 5180% $0 0 191,584 431,064 910,024 5,691 3,897 1,828 0 0 0 518 518 518
11% 0 0 $24 630 3,150 6,300 12,600 1,200 1,000 889 23 22 20 541 541 54111% $24 65 326 652 1,304 1,200 1,000 889 23 22 20 504 504 50411% $24 40 199 397 794 1,200 1,000 889 23 22 20 541 541 54111% $24 53 265 530 1,060 1,200 1,000 889 23 22 20 554 554 55411% $24 63 315 630 1,259 1,440 1,200 1,067 23 22 20 566 566 56611% $24 127 635 1,269 2,539 1,440 1,200 1,067 23 22 20 566 566 56611% 0 0 $5 800 4,000 8,000 16,000 1,500 1,500 1,350 5 4 4 871 871 87111% $5 45 218 425 776 1,500 1,500 1,350 5 4 4 811 811 81111% $5 30 150 294 538 1,500 1,500 1,350 5 4 4 870 870 87011% $5 27 138 282 577 1,500 1,500 1,350 5 4 4 891 891 89111% $5 20 102 213 457 1,800 1,800 1,620 5 4 4 911 911 91111% $5 79 401 820 1,680 1,800 1,800 1,620 5 4 4 911 911 91114% 3 -4.2 $0 183 212 245 330 475 451 429 0 0 0 833 833 83314% $0 42 49 56 76 475 451 429 0 0 0 833 833 83313% $0 29 33 39 52 475 451 429 0 0 0 833 833 83322% $0 14 16 19 25 475 451 429 0 0 0 833 833 83310% $0 31 36 42 56 475 451 429 0 0 0 833 833 83314% $0 42 48 56 75 475 451 429 0 0 0 833 833 833
III. Penetrations IV. Future Costs & Outputs
Installed Costs Levelized O&M CostsTechnology Output (kWh/kW
installed)idence Factors

Table 6.3.7 Solar Thermal Screening Inputs 8/19/2003
4748495051525354555657585960616263646566676869707172737475767778798081828384858687888990919293949596979899100
P Q R S T U V W X Y Z AA AB AC AD AE AF0% 5 -14 $0 0 0 0 0 5,691 3,897 1,828 0 0 0 518 518 5180% $0 0 0 0 0 5,691 3,897 1,828 0 0 0 518 518 5180% $0 0 0 0 0 5,691 3,897 1,828 0 0 0 518 518 5180% $0 0 0 0 0 5,691 3,897 1,828 0 0 0 518 518 5180% $0 0 0 0 0 5,691 3,897 1,828 0 0 0 518 518 5180% $0 0 0 0 0 5,691 3,897 1,828 0 0 0 518 518 518
11% 0 0 $24 649 3,410 7,168 15,836 1,200 1,000 889 23 22 20 541 541 54111% $24 67 353 742 1,639 1,200 1,000 889 23 22 20 504 504 50411% $24 41 215 452 999 1,200 1,000 889 23 22 20 541 541 54111% $24 55 287 603 1,333 1,200 1,000 889 23 22 20 554 554 55411% $24 65 341 716 1,583 1,440 1,200 1,067 23 22 20 566 566 56611% $24 131 687 1,444 3,191 1,440 1,200 1,067 23 22 20 566 566 56611% 0 0 $5 3,731 9,570 44,687 79,805 1,500 1,350 1,350 5 4 4 871 871 87111% $5 208 522 2,377 3,872 1,500 1,500 1,350 5 4 4 811 811 81111% $5 142 358 1,645 2,685 1,500 1,500 1,350 5 4 4 870 870 87011% $5 127 329 1,574 2,879 1,500 1,500 1,350 5 4 4 891 891 89111% $5 93 244 1,192 2,280 1,800 1,800 1,620 5 4 4 911 911 91111% $5 369 959 4,580 8,380 1,800 1,800 1,620 5 4 4 911 911 91114% 3 -4.2 $0 247 1,235 2,422 3,254 475 451 429 0 0 0 833 833 83314% $0 57 284 556 747 475 451 429 0 0 0 833 833 83313% $0 39 195 382 514 475 451 429 0 0 0 833 833 83322% $0 19 94 184 247 475 451 429 0 0 0 833 833 83310% $0 42 211 413 555 475 451 429 0 0 0 833 833 83314% $0 56 281 551 740 475 451 429 0 0 0 833 833 8330% 5 -14 $0 0 395 790 1,185 5,691 3,897 1,828 0 0 0 518 518 5180% $0 0 17 35 52 5,691 3,897 1,828 0 0 0 518 518 5180% $0 0 12 24 36 5,691 3,897 1,828 0 0 0 518 518 5180% $0 0 19 38 56 5,691 3,897 1,828 0 0 0 518 518 5180% $0 0 256 512 768 5,691 3,897 1,828 0 0 0 518 518 5180% $0 0 55 109 164 5,691 3,897 1,828 0 0 0 518 518 518
11% 0 0 $24 3,245 17,050 35,839 79,178 889 778 667 23 22 20 541 541 54111% $24 336 1,765 3,709 8,195 889 778 667 23 22 20 504 504 50411% $24 205 1,075 2,260 4,993 889 778 667 23 22 20 541 541 54111% $24 273 1,435 3,016 6,664 889 778 667 23 22 20 554 554 55411% $24 324 1,704 3,582 7,914 1,067 933 800 23 22 20 566 566 56611% $24 654 3,435 7,221 15,954 1,067 933 800 23 22 20 566 566 56611% 0 0 $5 9,597 29,087 88,594 123,261 1,500 1,350 1,125 5 4 4 871 871 87111% $5 535 1,586 4,712 5,980 1,500 1,500 1,125 5 4 4 811 811 81111% $5 365 1,088 3,261 4,148 1,500 1,500 1,125 5 4 4 870 870 87011% $5 326 1,001 3,120 4,447 1,500 1,500 1,125 5 4 4 891 891 89111% $5 239 742 2,362 3,522 1,800 1,800 1,350 5 4 4 911 911 91111% $5 950 2,914 9,081 12,943 1,800 1,800 1,350 5 4 4 911 911 91114% 3 -4.2 $0 741 3,705 7,265 10,271 475 451 429 0 0 0 833 833 83314% $0 170 851 1,668 2,359 475 451 429 0 0 0 833 833 83313% $0 117 585 1,147 1,621 475 451 429 0 0 0 833 833 83322% $0 56 281 551 779 475 451 429 0 0 0 833 833 83310% $0 126 632 1,239 1,752 475 451 429 0 0 0 833 833 83314% $0 168 842 1,652 2,335 475 451 429 0 0 0 833 833 8330% 5 -14 $0 0 987 1,975 3,949 5,691 3,897 1,828 0 0 0 518 518 5180% $0 0 43 87 174 5,691 3,897 1,828 0 0 0 518 518 5180% $0 0 30 60 120 5,691 3,897 1,828 0 0 0 518 518 5180% $0 0 47 94 188 5,691 3,897 1,828 0 0 0 518 518 5180% $0 0 640 1,279 2,559 5,691 3,897 1,828 0 0 0 518 518 5180% $0 0 136 273 546 5,691 3,897 1,828 0 0 0 518 518 518

Table 6.3.8 Wind Screening Inputs 8/19/2003
A B C D E F G H I J K L M N O
from 4/24 sheet
ResourcZone Scenario Technology Life
Total Installed Cost ($/kW of rated max output)
Annual kWh/kW produced -2003
Summer On- Peak %
Summer Off - Peak %
Summer Shoulder %
Winter On - Peak %
Winter Off - Peak %
Winter Shoulder %
Energy Period Sum (Sum Col F -Col K) Should equal 100%
Summer Generation Capacity % of Max Output
Wind Farm Installations Wind Statewide Tech 20 $935 2,635 7% 12% 9% 21% 27% 24% 100% 19%Wind Farm Installations Wind Zone A - West Tech 20 $935 2,635 7% 12% 9% 21% 27% 24% 100% 19%Wind Farm Installations Wind Zone F - Capital Tech 20 $935 2,635 7% 12% 9% 21% 27% 24% 100% 19%Wind Farm Installations Wind Zone G - Lower HV Tech 20 $935 0 7% 12% 9% 21% 27% 24% 100% 19%Wind Farm Installations Wind Zone J - NYC Tech 20 $935 0 7% 12% 9% 21% 27% 24% 100% 19%Wind Farm Installations Wind Zone K - Long Island Tech 20 $935 2,635 7% 12% 9% 21% 27% 24% 100% 19%Cluster Installations Wind Statewide Tech 20 $1,190 2,608 7% 12% 9% 21% 27% 24% 100% 19%Cluster Installations Wind Zone A - West Tech 20 $1,190 2,608 7% 12% 9% 21% 27% 24% 100% 19%Cluster Installations Wind Zone F - Capital Tech 20 $1,190 2,608 7% 12% 9% 21% 27% 24% 100% 19%Cluster Installations Wind Zone G - Lower HV Tech 20 $1,190 0 7% 12% 9% 21% 27% 24% 100% 19%Cluster Installations Wind Zone J - NYC Tech 20 $1,190 0 7% 12% 9% 21% 27% 24% 100% 19%Cluster Installations Wind Zone K - Long Island Tech 20 $1,190 2,608 7% 12% 9% 21% 27% 24% 100% 19%Small Wind Installations Wind Statewide Tech 20 $2,350 1,236 13% 5% 11% 26% 20% 25% 100% 10%Small Wind Installations Wind Zone A - West Tech 20 $2,350 1,236 13% 5% 11% 26% 20% 25% 100% 10%Small Wind Installations Wind Zone F - Capital Tech 20 $2,350 1,235 13% 5% 11% 26% 20% 25% 100% 10%Small Wind Installations Wind Zone G - Lower HV Tech 20 $2,350 1,239 13% 5% 11% 26% 20% 25% 100% 10%Small Wind Installations Wind Zone J - NYC Tech 20 $2,350 1,234 13% 5% 11% 26% 20% 25% 100% 10%Small Wind Installations Wind Zone K - Long Island Tech 20 $2,350 1,235 13% 5% 11% 26% 20% 25% 100% 10%Offshore Wind Installations Wind Statewide Tech 25 $1,403 2,776 15% 7% 13% 24% 18% 23% 100% 19%Offshore Wind Installations Wind Zone A - West Tech 25 $1,403 2,776 15% 7% 13% 24% 18% 23% 100% 19%Offshore Wind Installations Wind Zone F - Capital Tech 25 $1,403 0 15% 7% 13% 24% 18% 23% 100% 19%Offshore Wind Installations Wind Zone G - Lower HV Tech 25 $1,403 0 15% 7% 13% 24% 18% 23% 100% 19%Offshore Wind Installations Wind Zone J - NYC Tech 25 $1,403 0 15% 7% 13% 24% 18% 23% 100% 19%Offshore Wind Installations Wind Zone K - Long Island Tech 25 $1,403 2,776 15% 7% 13% 24% 18% 23% 100% 19%Wind Farm Installations Wind Statewide Base 20 $1,100 2,635 7% 12% 9% 21% 27% 24% 100% 19%Wind Farm Installations Wind Zone A - West Base 20 $1,100 2,635 12% 7% 9% 27% 21% 24% 100% 19%Wind Farm Installations Wind Zone F - Capital Base 20 $1,100 2,635 12% 7% 9% 27% 21% 24% 100% 19%Wind Farm Installations Wind Zone G - Lower HV Base 20 $1,100 0 12% 7% 9% 27% 21% 24% 100% 19%Wind Farm Installations Wind Zone J - NYC Base 20 $1,100 0 12% 7% 9% 27% 21% 24% 100% 19%Wind Farm Installations Wind Zone K - Long Island Base 20 $1,100 2,635 12% 7% 9% 27% 21% 24% 100% 19%Cluster Installations Wind Statewide Base 20 $1,400 2,608 7% 12% 9% 21% 27% 24% 100% 19%Cluster Installations Wind Zone A - West Base 20 $1,400 2,608 12% 7% 9% 27% 21% 24% 100% 19%Cluster Installations Wind Zone F - Capital Base 20 $1,400 2,608 12% 7% 9% 27% 21% 24% 100% 19%Cluster Installations Wind Zone G - Lower HV Base 20 $1,400 0 12% 7% 9% 27% 21% 24% 100% 19%Cluster Installations Wind Zone J - NYC Base 20 $1,400 0 12% 7% 9% 27% 21% 24% 100% 19%Cluster Installations Wind Zone K - Long Island Base 20 $1,400 2,608 12% 7% 9% 27% 21% 24% 100% 19%Small Wind Installations Wind Statewide Base 20 $2,500 1,236 13% 5% 11% 26% 20% 25% 100% 10%Small Wind Installations Wind Zone A - West Base 20 $2,500 1,236 13% 5% 11% 26% 20% 25% 100% 10%Small Wind Installations Wind Zone F - Capital Base 20 $2,500 1,235 13% 5% 11% 26% 20% 25% 100% 10%Small Wind Installations Wind Zone G - Lower HV Base 20 $2,500 1,239 13% 5% 11% 26% 20% 25% 100% 10%Small Wind Installations Wind Zone J - NYC Base 20 $2,500 1,234 13% 5% 11% 26% 20% 25% 100% 10%Small Wind Installations Wind Zone K - Long Island Base 20 $2,500 1,235 13% 5% 11% 26% 20% 25% 100% 10%
Current Technology Costs and Outputs
Energy Coincidence Factors Capacity Coinci

Table 6.3.8 Wind Screening Inputs 8/19/2003
Offshore Wind Installations Wind Statewide Base 25 $1,650 2,776 15% 7% 13% 24% 18% 23% 100% 19%Offshore Wind Installations Wind Zone A - West Base 25 $1,650 2,776 8% 6% 7% 28% 24% 27% 100% 19%Offshore Wind Installations Wind Zone F - Capital Base 25 $1,650 0 8% 6% 7% 28% 24% 27% 100% 19%Offshore Wind Installations Wind Zone G - Lower HV Base 25 $1,650 0 8% 6% 7% 28% 24% 27% 100% 19%Offshore Wind Installations Wind Zone J - NYC Base 25 $1,650 0 8% 6% 7% 28% 24% 27% 100% 19%Offshore Wind Installations Wind Zone K - Long Island Base 25 $1,650 2,776 8% 6% 7% 28% 24% 27% 100% 19%Wind Farm Installations Wind Statewide CPI 20 $1,045 2,635 7% 12% 9% 21% 27% 24% 100% 19%Wind Farm Installations Wind Zone A - West CPI 20 $1,045 2,635 12% 7% 9% 27% 21% 24% 100% 19%Wind Farm Installations Wind Zone F - Capital CPI 20 $1,045 2,635 12% 7% 9% 27% 21% 24% 100% 19%Wind Farm Installations Wind Zone G - Lower HV CPI 20 $1,045 0 12% 7% 9% 27% 21% 24% 100% 19%Wind Farm Installations Wind Zone J - NYC CPI 20 $1,045 0 12% 7% 9% 27% 21% 24% 100% 19%Wind Farm Installations Wind Zone K - Long Island CPI 20 $1,045 2,635 12% 7% 9% 27% 21% 24% 100% 19%Cluster Installations Wind Statewide CPI 20 $1,330 2,608 7% 12% 9% 21% 27% 24% 100% 19%Cluster Installations Wind Zone A - West CPI 20 $1,330 2,608 12% 7% 9% 27% 21% 24% 100% 19%Cluster Installations Wind Zone F - Capital CPI 20 $1,330 2,608 12% 7% 9% 27% 21% 24% 100% 19%Cluster Installations Wind Zone G - Lower HV CPI 20 $1,330 0 12% 7% 9% 27% 21% 24% 100% 19%Cluster Installations Wind Zone J - NYC CPI 20 $1,330 0 12% 7% 9% 27% 21% 24% 100% 19%Cluster Installations Wind Zone K - Long Island CPI 20 $1,330 2,608 12% 7% 9% 27% 21% 24% 100% 19%Small Wind Installations Wind Statewide CPI 20 $2,450 1,236 13% 5% 11% 26% 20% 25% 100% 10%Small Wind Installations Wind Zone A - West CPI 20 $2,450 1,236 13% 5% 11% 26% 20% 25% 100% 10%Small Wind Installations Wind Zone F - Capital CPI 20 $2,450 1,235 13% 5% 11% 26% 20% 25% 100% 10%Small Wind Installations Wind Zone G - Lower HV CPI 20 $2,450 1,239 13% 5% 11% 26% 20% 25% 100% 10%Small Wind Installations Wind Zone J - NYC CPI 20 $2,450 1,234 13% 5% 11% 26% 20% 25% 100% 10%Small Wind Installations Wind Zone K - Long Island CPI 20 $2,450 1,235 13% 5% 11% 26% 20% 25% 100% 10%Offshore Wind Installations Wind Statewide CPI 25 $1,568 2,776 15% 7% 13% 24% 18% 23% 100% 19%Offshore Wind Installations Wind Zone A - West CPI 25 $1,568 2,776 8% 6% 7% 28% 24% 27% 100% 19%Offshore Wind Installations Wind Zone F - Capital CPI 25 $1,568 0 8% 6% 7% 28% 24% 27% 100% 19%Offshore Wind Installations Wind Zone G - Lower HV CPI 25 $1,568 0 8% 6% 7% 28% 24% 27% 100% 19%Offshore Wind Installations Wind Zone J - NYC CPI 25 $1,568 0 8% 6% 7% 28% 24% 27% 100% 19%Offshore Wind Installations Wind Zone K - Long Island CPI 25 $1,568 2,776 8% 6% 7% 28% 24% 27% 100% 19%Wind Farm Installations Wind Statewide GHG 20 $990 2,635 7% 12% 9% 21% 27% 24% 100% 19%Wind Farm Installations Wind Zone A - West GHG 20 $990 2,635 12% 7% 9% 27% 21% 24% 100% 19%Wind Farm Installations Wind Zone F - Capital GHG 20 $990 2,635 12% 7% 9% 27% 21% 24% 100% 19%Wind Farm Installations Wind Zone G - Lower HV GHG 20 $990 0 12% 7% 9% 27% 21% 24% 100% 19%Wind Farm Installations Wind Zone J - NYC GHG 20 $990 0 12% 7% 9% 27% 21% 24% 100% 19%Wind Farm Installations Wind Zone K - Long Island GHG 20 $990 2,635 12% 7% 9% 27% 21% 24% 100% 19%Cluster Installations Wind Statewide GHG 20 $1,260 2,608 7% 12% 9% 21% 27% 24% 100% 19%Cluster Installations Wind Zone A - West GHG 20 $1,260 2,608 12% 7% 9% 27% 21% 24% 100% 19%Cluster Installations Wind Zone F - Capital GHG 20 $1,260 2,608 12% 7% 9% 27% 21% 24% 100% 19%Cluster Installations Wind Zone G - Lower HV GHG 20 $1,260 0 12% 7% 9% 27% 21% 24% 100% 19%Cluster Installations Wind Zone J - NYC GHG 20 $1,260 0 12% 7% 9% 27% 21% 24% 100% 19%Cluster Installations Wind Zone K - Long Island GHG 20 $1,260 2,608 12% 7% 9% 27% 21% 24% 100% 19%Small Wind Installations Wind Statewide GHG 20 $2,400 1,236 13% 5% 11% 26% 20% 25% 100% 10%Small Wind Installations Wind Zone A - West GHG 20 $2,400 1,236 13% 5% 11% 26% 20% 25% 100% 10%Small Wind Installations Wind Zone F - Capital GHG 20 $2,400 1,235 13% 5% 11% 26% 20% 25% 100% 10%Small Wind Installations Wind Zone G - Lower HV GHG 20 $2,400 1,239 13% 5% 11% 26% 20% 25% 100% 10%Small Wind Installations Wind Zone J - NYC GHG 20 $2,400 1,234 13% 5% 11% 26% 20% 25% 100% 10%Small Wind Installations Wind Zone K - Long Island GHG 20 $2,400 1,235 13% 5% 11% 26% 20% 25% 100% 10%Offshore Wind Installations Wind Statewide GHG 25 $1,485 2,776 15% 7% 13% 24% 18% 23% 100% 19%Offshore Wind Installations Wind Zone A - West GHG 25 $1,485 2,776 8% 6% 7% 28% 24% 27% 100% 19%Offshore Wind Installations Wind Zone F - Capital GHG 25 $1,485 0 8% 6% 7% 28% 24% 27% 100% 19%Offshore Wind Installations Wind Zone G - Lower HV GHG 25 $1,485 0 8% 6% 7% 28% 24% 27% 100% 19%Offshore Wind Installations Wind Zone J - NYC GHG 25 $1,485 0 8% 6% 7% 28% 24% 27% 100% 19%Offshore Wind Installations Wind Zone K - Long Island GHG 25 $1,485 2,776 8% 6% 7% 28% 24% 27% 100% 19%

Table 6.3.8 Wind Screening Inputs 8/19/2003
P Q R S T U V W X Y Z AA AB AC AD AE AF
Winter Generation Capacity % of Max Output
Fossil Fuel Type
Fossil Fuel Usage MMBTU/Yr
Real Levelized O&M $/yr
Installed Capacity (kW) 2003
Installed Capacity (kW) 2007
Installed Capacity (kW) 2012
Installed Capacity (kW) 2022
Total Installed Cost ($/kW of rated max output) 2007
Total Installed Cost ($/kW of rated max output) 2012
Total Installed Cost ($/kW of rated max output) 2022
Real Levelized O&M $/yr 2007
Real Levelized O&M $/yr 2012
Real Levelized O&M $/yr 2022
Annual kWh/kW -2007
Annual kWh/kW -2012
Annual kWh/kW -2022
45% 0 0 $22 114,000 523,000 1,050,000 4,225,000 839 744 553 20 18 13 2,701 2,766 2,89845% $22 49,020 224,890 451,500 1,816,750 839 744 553 20 18 13 2,701 2,766 2,89845% $22 570 2,615 5,250 21,125 839 744 553 20 18 13 2,701 2,766 2,89845% $22 0 0 0 839 744 553 20 18 13 0 0 045% $22 0 0 0 839 744 553 20 18 13 0 0 045% $22 8,778 40,271 80,850 325,325 839 744 553 20 18 13 2,701 2,766 2,89845% 0 0 $33 22,000 60,000 208,000 2,535,000 1,084 978 765 30 27 20 2,673 2,738 2,86945% $33 9,460 25,800 89,440 1,090,050 1,084 978 765 30 27 20 2,673 2,738 2,86945% $33 110 300 1,040 12,675 1,084 978 765 30 27 20 2,673 2,738 2,86945% $33 0 0 0 1,084 978 765 30 27 20 0 0 045% $33 0 0 0 1,084 978 765 30 27 20 0 0 045% $33 1,694 4,620 16,016 195,195 1,084 978 765 30 27 20 2,673 2,738 2,86919% 0 0 $47 3,000 43,000 93,000 225,400 2,233 2,115 1,880 45 42 38 1,267 1,298 1,35919% $47 913 13,084 28,299 68,586 2,233 2,115 1,880 45 42 38 1,267 1,298 1,35919% $47 274 3,924 8,488 20,571 2,233 2,115 1,880 45 42 38 1,267 1,298 1,35919% $47 148 2,126 4,598 11,144 2,233 2,115 1,880 45 42 38 1,267 1,298 1,35919% $47 161 2,304 4,983 12,078 2,233 2,115 1,880 45 42 38 1,267 1,298 1,35919% $47 574 8,220 17,779 43,090 2,233 2,115 1,880 45 42 38 1,267 1,298 1,35945% 0 0 $35 100,000 264,000 890,000 10,100,000 1,292 1,181 850 33 31 24 2,845 2,914 3,05345% $35 35,000 92,400 311,500 3,500,000 1,292 1,181 850 33 31 24 2,845 2,914 3,05345% $35 0 0 0 0 1,292 1,181 850 33 31 24 0 0 045% $35 0 0 0 0 1,292 1,181 850 33 31 24 0 0 045% $35 0 0 0 0 1,292 1,181 850 33 31 24 0 0 045% $35 65,000 171,600 578,500 6,600,000 1,292 1,181 850 33 31 24 2,845 2,914 3,05345% 0 0 $26 91,500 165,700 348,000 1,535,000 988 875 650 24 21 16 2,701 2,766 2,89845% $26 39,345 71,251 149,640 660,050 988 875 650 24 21 16 2,701 2,766 2,89845% $26 458 829 1,741 7,675 988 875 650 24 21 16 2,701 2,766 2,89845% $26 0 0 0 0 988 875 650 24 21 16 0 0 045% $26 0 0 0 0 988 875 650 24 21 16 0 0 045% $26 7,046 12,759 26,797 118,195 988 875 650 24 21 16 2,701 2,766 2,89845% 0 0 $39 6,600 11,500 23,200 93,900 1,275 1,150 900 35 31 23 2,673 2,738 2,86945% $39 2,838 4,945 9,976 40,377 1,275 1,150 900 35 31 23 2,673 2,738 2,86945% $39 33 58 116 469 1,275 1,150 900 35 31 23 2,673 2,738 2,86945% $39 0 0 0 0 1,275 1,150 900 35 31 23 0 0 045% $39 0 0 0 0 1,275 1,150 900 35 31 23 0 0 045% $39 508 885 1,786 7,230 1,275 1,150 900 35 31 23 2,673 2,738 2,86919% 0 0 $50 596 972 1,790 6,078 2,375 2,250 2,000 47 45 40 1,267 1,298 1,35919% $50 181 296 545 1,849 2,375 2,250 2,000 47 45 40 1,267 1,298 1,35919% $50 54 89 163 555 2,375 2,250 2,000 47 45 40 1,267 1,298 1,35919% $50 29 48 88 301 2,375 2,250 2,000 47 45 40 1,267 1,298 1,35919% $50 32 52 96 326 2,375 2,250 2,000 47 45 40 1,267 1,298 1,35919% $50 114 186 342 1,162 2,375 2,250 2,000 47 45 40 1,267 1,298 1,359
Penetrations Future Costs & Outputs
Installed Costs Levelized O&M Costs Technology Output (kWh/kW installed)idence Factors

Table 6.3.8 Wind Screening Inputs 8/19/2003
45% 0 0 $42 0 100,000 184,000 625,000 1,520 1,390 1,000 39 36 28 2,845 2,914 3,05345% $42 0 35,000 64,400 216,584 1,520 1,390 1,000 39 36 28 2,845 2,914 3,05345% $42 0 0 0 0 1,520 1,390 1,000 39 36 28 0 0 045% $42 0 0 0 0 1,520 1,390 1,000 39 36 28 0 0 045% $42 0 0 0 0 1,520 1,390 1,000 39 36 28 0 0 045% $42 0 65,000 119,600 408,416 1,520 1,390 1,000 39 36 28 2,845 2,914 3,05345% 0 0 $25 91,500 458,000 807,200 1,995,500 938 831 618 23 20 15 2,701 2,766 2,89845% $25 39,345 196,940 347,096 858,065 938 831 618 23 20 15 2,701 2,766 2,89845% $25 458 2,290 4,036 9,978 938 831 618 23 20 15 2,701 2,766 2,89845% $25 0 0 0 0 938 831 618 23 20 15 0 0 045% $25 0 0 0 0 938 831 618 23 20 15 0 0 045% $25 7,046 35,266 62,154 153,654 938 831 618 23 20 15 2,701 2,766 2,89845% 0 0 $37 6,600 18,300 65,300 150,240 1,211 1,093 855 33 30 22 2,673 2,738 2,86945% $37 2,838 7,869 28,079 64,603 1,211 1,093 855 33 30 22 2,673 2,738 2,86945% $37 33 92 327 751 1,211 1,093 855 33 30 22 2,673 2,738 2,86945% $37 0 0 0 0 1,211 1,093 855 33 30 22 0 0 045% $37 0 0 0 0 1,211 1,093 855 33 30 22 0 0 045% $37 508 1,409 5,028 11,568 1,211 1,093 855 33 30 22 2,673 2,738 2,86919% 0 0 $49 596 1,235 3,075 7,901 2,328 2,205 1,960 47 44 39 1,267 1,298 1,35919% $49 181 376 936 2,404 2,328 2,205 1,960 47 44 39 1,267 1,298 1,35919% $49 54 113 281 721 2,328 2,205 1,960 47 44 39 1,267 1,298 1,35919% $49 29 61 152 391 2,328 2,205 1,960 47 44 39 1,267 1,298 1,35919% $49 32 66 165 423 2,328 2,205 1,960 47 44 39 1,267 1,298 1,35919% $49 114 236 588 1,511 2,328 2,205 1,960 47 44 39 1,267 1,298 1,35945% 0 0 $40 0 100,000 259,400 812,500 1,444 1,321 950 37 34 26 2,845 2,914 3,05345% $40 0 35,000 90,790 281,559 1,444 1,321 950 37 34 26 2,845 2,914 3,05345% $40 0 0 0 0 1,444 1,321 950 37 34 26 0 0 045% $40 0 0 0 0 1,444 1,321 950 37 34 26 0 0 045% $40 0 0 0 0 1,444 1,321 950 37 34 26 0 0 045% $40 0 65,000 168,610 530,941 1,444 1,321 950 37 34 26 2,845 2,914 3,05345% 0 0 $24 91,500 458,000 901,000 3,491,000 889 788 585 21 19 14 2,701 2,766 2,89845% $24 39,345 196,940 387,430 1,501,130 889 788 585 21 19 14 2,701 2,766 2,89845% $24 458 2,290 4,505 17,455 889 788 585 21 19 14 2,701 2,766 2,89845% $24 0 0 0 0 889 788 585 21 19 14 0 0 045% $24 0 0 0 0 889 788 585 21 19 14 0 0 045% $24 7,046 35,266 69,377 268,807 889 788 585 21 19 14 2,701 2,766 2,89845% 0 0 $35 6,600 18,300 91,500 1,840,000 1,147 1,035 810 32 28 21 2,673 2,738 2,86945% $35 2,838 7,869 39,345 791,200 1,147 1,035 810 32 28 21 2,673 2,738 2,86945% $35 33 92 458 9,200 1,147 1,035 810 32 28 21 2,673 2,738 2,86945% $35 0 0 0 0 1,147 1,035 810 32 28 21 0 0 045% $35 0 0 0 0 1,147 1,035 810 32 28 21 0 0 045% $35 508 1,409 7,046 141,680 1,147 1,035 810 32 28 21 2,673 2,738 2,86919% 0 0 $48 596 1,235 4,246 50,130 2,280 2,160 1,920 46 43 38 1,267 1,298 1,35919% $48 181 376 1,292 15,254 2,280 2,160 1,920 46 43 38 1,267 1,298 1,35919% $48 54 113 388 4,575 2,280 2,160 1,920 46 43 38 1,267 1,298 1,35919% $48 29 61 210 2,478 2,280 2,160 1,920 46 43 38 1,267 1,298 1,35919% $48 32 66 228 2,686 2,280 2,160 1,920 46 43 38 1,267 1,298 1,35919% $48 114 236 812 9,583 2,280 2,160 1,920 46 43 38 1,267 1,298 1,35945% 0 0 $37 0 100,000 385,800 5,742,000 1,368 1,251 900 35 32 25 2,845 2,914 3,05345% $37 0 35,000 135,030 1,989,802 1,368 1,251 900 35 32 25 2,845 2,914 3,05345% $37 0 0 0 0 1,368 1,251 900 35 32 25 0 0 045% $37 0 0 0 0 1,368 1,251 900 35 32 25 0 0 045% $37 0 0 0 0 1,368 1,251 900 35 32 25 0 0 045% $37 0 65,000 250,770 3,752,198 1,368 1,251 900 35 32 25 2,845 2,914 3,053

Table 6.4.1 Technology Characteristics 8/19/2003,Renewable Technical Appendix Draft Final.xls
A B C D T U V W X Y Z AA AB AC AD AE AF
Measure Name Resource Zone Scenario
Installed Capacity (kW) 2003
Installed Capacity (kW) 2007
Installed Capacity (kW) 2012
Installed Capacity (kW) 2022
Total Installed Cost ($/kW of rated max output) 2007
Total Installed Cost ($/kW of rated max output) 2012
Total Installed Cost ($/kW of rated max output) 2022
Real Levelized O&M $/yr 2007
Real Levelized O&M $/yr 2012
Real Levelized O&M $/yr 2022
Annual kWh/kW -2007
Annual kWh/kW -2012
Annual kWh/kW -2022
Biomass Direct-Fire Biomass Statewide Base 39,000 39,000 39,000 21,000 -$ -$ -$ 198$ 198$ 198$ 7,372 7,372 7,372 Biomass Cofiring w/ Coal Biomass Statewide Base 20,700 20,700 20,700 - 235$ 220$ 220$ 110$ 113$ 113$ 6,179 6,369 Biomass Gasification Biomass Statewide Base - - - - 1,600$ 1,464$ 1,258$ (17)$ (7)$ 14$ 7,008 7,008 7,008 Biomass CHP Biomass Statewide Base 67,600 67,600 67,600 67,600 3,960$ 3,960$ 3,960$ 198$ 198$ 198$ 7,446 7,446 7,446 Fuel Cell PEM FuelCell Statewide Base 770 770 770 - 4,750$ 3,650$ 2,000$ 62$ 55$ 39$ 4,595 4,595 4,595 Fuel Cell PAFC FuelCell Statewide Base 5,600 5,600 5,600 - 4,000$ 3,370$ 2,270$ 72$ 68$ 54$ 7,446 7,446 7,446 Fuel Cell SOFC FuelCell Statewide Base - - - - 3,050$ 2,440$ 1,660$ 73$ 67$ 57$ 7,446 7,446 7,446 Fuel Cell MCFC FuelCell Statewide Base - - - - 2,324$ 1,756$ 885$ 79$ 72$ 48$ 7,446 7,446 7,446 Hydro Relicense Hydro Statewide Base 920,280 3,722,950 3,761,981 3,816,812 34$ 34$ 34$ 55$ 55$ 55$ 5,726 5,726 5,726 Hydro Repower Hydro Statewide Base - 300,000 335,970 408,353 1,000$ 1,000$ 1,000$ 16$ 16$ 16$ 1,314 1,314 1,314 Hydro Ex Capacity Ex DamHydro Statewide Base - - - - 1,434$ 1,434$ 1,434$ 32$ 32$ 32$ 2,278 2,278 2,278 Hydro New Capacity Ex DHydro Statewide Base - - - - 1,526$ 1,526$ 1,526$ 50$ 50$ 50$ 3,285 3,285 3,285 Hydro New Dam Sites Hydro Statewide Base - - - - 1,975$ 1,975$ 1,975$ 31$ 31$ 31$ 5,098 5,098 5,098 LFG Large Systems LFG Statewide Base 889 2,218 3,107 4,539 2,850$ 2,850$ 2,850$ 270$ 270$ 270$ 8,322 8,322 8,322 LFG Engines LFG Statewide Base 46,373 84,287 91,643 107,732 2,300$ 2,300$ 2,300$ 250$ 250$ 250$ 8,322 8,322 8,322 LFG Microturbines LFG Statewide Base 616 1,733 2,587 3,934 3,350$ 3,150$ 2,950$ 240$ 240$ 240$ 8,322 8,322 8,322 PV Residential PV Statewide Base 10 440 3,540 150,800 6,000$ 4,750$ 3,500$ 13$ 4$ 4$ 1,417 1,417 1,417 PV C&I with solar load conPV Statewide Base 6 250 2,010 102,750 5,700$ 4,700$ 3,500$ 13$ 4$ 4$ 1,488 1,488 1,488 PV C&I no load control PV Statewide Base 6 250 2,010 68,500 5,200$ 4,200$ 3,000$ 13$ 4$ 4$ 1,488 1,488 1,488 PV BIPV PV Statewide Base 1 40 280 7,960 6,000$ 4,750$ 3,500$ 13$ 4$ 4$ 966 966 966 Res DHW Stherm Statewide Base 630 3,150 6,300 12,600 1,200$ 1,000$ 889$ 23$ 22$ 20$ 541 541 541 Com DHW Stherm Statewide Base 800 4,000 8,000 16,000 1,500$ 1,500$ 1,350$ 5$ 4$ 4$ 871 871 871 C&I Vent Pre Heat Stherm Statewide Base 183 212 245 330 475$ 451$ 429$ -$ -$ -$ 833 833 833 Solar Absorp Cool Stherm Statewide Base - - - - 5,691$ 3,897$ 1,828$ -$ -$ -$ 518 518 518 Wind Farm Installations Wind Statewide Base 91,500 165,700 348,000 1,535,000 988$ 875$ 650$ 24$ 21$ 16$ 2,701 2,766 2,898 Cluster Installations Wind Statewide Base 6,600 11,500 23,200 93,900 1,275$ 1,150$ 900$ 35$ 31$ 23$ 2,673 2,738 2,869 Small Wind Installations Wind Statewide Base 596 972 1,790 6,078 2,375$ 2,250$ 2,000$ 47$ 45$ 40$ 1,267 1,298 1,359 Offshore Wind Installation Wind Statewide Base - 100,000 184,000 625,000 1,520$ 1,390$ 1,000$ 39$ 36$ 28$ 2,845 2,914 3,053 WTE Large WTE Statewide Base 211,700 211,700 211,700 211,700 8,500$ 8,500$ 8,500$ (530)$ (530)$ (530)$ 8,322 8,322 8,322 WTE Small WTE Statewide Base 23,600 23,600 23,600 23,600 10,500$ 10,500$ 10,500$ (330)$ (330)$ (330)$ 8,322 8,322 8,322 Solid Waste Digestion WTE Statewide Base - - - - 10,500$ 10,500$ 10,500$ (330)$ (330)$ (330)$ 8,322 8,322 8,322
4,097,951 4,225,165
Installed Capacity (kW) 2003
Installed Capacity (kW) 2007
Installed Capacity (kW) 2012
Installed Capacity (kW) 2022
Installed Capacity (kW) 2003
Installed Capacity (kW) 2007
Installed Capacity (kW) 2012
Installed Capacity (kW) 2022
Biomass Direct-Fire 39,000 - - (18,000) Biomass Direct-Fire 39000 0 0 -1800Biomass Cofiring w/ C 20,700 - - - Biomass Cofiring w/ Coal 20700 - - - Biomass Gasification - - - - Biomass Gasification 0 - - - Biomass CHP 67,600 - - - Biomass CHP 67600 - - - Fuel Cell PEM 770 - - - Fuel Cell PEM 770 - - - Fuel Cell PAFC 5,600 - - - Fuel Cell PAFC 5600 - - - Fuel Cell SOFC - - - - Fuel Cell SOFC 0 - - - Fuel Cell MCFC - - - - Fuel Cell MCFC 0 - - - Hydro Relicense 920,280 2,702,670 39,031 54,831 Hydro Relicense 920280 675,668 7,806 5,483 Hydro Repower - 300,000 35,970 72,383 Hydro Repower 0 75,000 7,194 7,238 Hydro Ex Capacity Ex - - - - Hydro Ex Capacity Ex Dam 0 - - - Hydro New Capacity E - - - - Hydro New Capacity Ex Dam 0 - - - Hydro New Dam Sites - - - - Hydro New Dam Sites 0 - - - LFG Large Systems 889 1,329 889 1,432 LFG Large Systems 889 332 178 143 LFG Engines 46,373 37,914 7,356 16,089 LFG Engines 46373 9,479 1,471 1,609 LFG Microturbines 616 1,117 854 1,347 LFG Microturbines 616 279 171 135 PV Residential 10 430 3,100 147,260 PV Residential 10 107 620 14,726 PV C&I with solar load 6 244 1,760 100,740 PV C&I with solar load contr 6 61 352 10,074 PV C&I no load contro 6 244 1,760 66,490 PV C&I no load control 6 61 352 6,649 PV BIPV 1 39 239 7,680 PV BIPV 1 10 48 768 Res DHW 630 2,520 3,150 6,300 Res DHW 630 630 630 630 Com DHW 800 3,200 4,000 8,000 Com DHW 800 800 800 800 C&I Vent Pre Heat 183 29 34 84 C&I Vent Pre Heat 182.6 7 7 8 Solar Absorp Cool - - - - Solar Absorp Cool 0 - - - Wind Farm Installation 91,500 74,200 182,300 1,187,000 Wind Farm Installations 91500 18,550 36,460 118,700 Cluster Installations 6,600 4,900 11,700 70,700 Cluster Installations 6600 1,225 2,340 7,070 Small Wind Installation 596 376 818 4,288 Small Wind Installations 596 94 164 429 Offshore Wind Installa - 100,000 84,000 441,000 Offshore Wind Installations 0 25,000 16,800 44,100 WTE Large 211,700 - - - WTE Large 211700 - - - WTE Small 23,600 - - - WTE Small 23600 - - - Solid Waste Digestion - - - - Solid Waste Digestion 0 - - -
Incremental Installed Capacity Average annual incremental
Levelized O&M CostsTechnology Output (kWh/kW
installed)
III. Penetrations IV. Future Costs & Outputs
Installed Costs
I. Measure Name/Zone Scenario

Table 6.4.4 Administrative Adders - Currently Planned Initiative Scenario 8/19/2003,Renewable Technical Appendix Draft Final.xls
Renewables Administrative Adders: Currently Planned Initiatives ScenarioRenewables Administrative Adders CPI Aggregate NYSERDA 105$ Present Value 4 year admin adder Note: allocated known existing program expenditures to a
LIPA + NYP 14$ $4.48 millionTotal 119$
Cluster, Wind Farm and Offshore Wind Admin 16.28$ Program Total Incentive Non-Incentive % of totalGreen Power Mktg 2.475 0 100% Note 75% assigned to wind expected by NYSERDA to be dominant resourceLarge Wind Incentives 24 23.04 4%Leveraged Wind funds 400 400 0%Total 426.475 423.04 1% Weighted average
Biomass Cofiring & GasificationProgram Total Incentive Non-Incentive % of totalGreen Power Mktg 0.33 0 100% 10% assigned to cofiriing& gasificationBiopower cofiring incentiv 1.4 1.344 4%Leveraged Biopower $ 13.4 13.4 0%R&D #19 0.8 0.76 5%Leveraged R&D 2.4 2.4 0% assumes 3:1 leveraging of NYSERDA fundsTotal 18.33 17.904 2% Weighted average
Biomass CHPProgram Total Incentive Non-Incentive % of totalR&D #19 1.95 1.755 10%Leveraged R&D 5.85 5.85 0% assumes 3:1 leveraging of NYSERDA fundsTotal 7.8 7.605 3% Weighted average
Fuel Cells Program Total Incentive Non-Incentive % of totalFuel Cell Development #9 18.475 16.6275 10% 12.5% of Strategic Energy Storage & Secure Power, 90% of total assigned to incentivesLeveraged FC Dev 36.95 36.95 0% assumes 2:1 leveraging of Fuel cell development fundsGreen Bldg Tax Credit, # 12.5 12 4% assigns 50% of total avail to fuel cells, 96% to incentiveGBTC leverage 50 50 0% max fuel cell incentive $1 per Watt, ~ 25% of installedTotal 117.925 115.5775 2% Weighted average
HydroProgram Total Incentive Non-Incentive % of totalGreen Power Mktg 0.21 0 100% Note 5% assigned to hydroRelicense 500 500 NYPA relicense expenditures are part of base caseTotal 500.21 500 0.04% Weighted average
LFGProgram Total Incentive Non-Incentive % of totalGreen Power Mktg 0.21 0 100% Note 5% assigned to LFGLFG Develoment, #10 2 1.92 4% Anticipated funding through NYSERDA, Table 2.4 2002- 2005 OutlookLFG leverage 6 6 0% Assumes 3:1 leverage for LFG development fundsTotal 8.21 7.92 3.53% Weighted average
PV, also applied to small windProgram Total Incentive Non-Incentive % of totalPV Development 20 14 30% Initiatives 4-7, average incentive share of budget 70% based on other market trans program designsPV Leverage 40 40 0% Assumes 2:1 leverage for PV development fundsGreen Bldg Tax Credit, # 12.5 12 4% assigns 50% of total avail toPV, 96% to incentiveGBTC leverage 25 25 0%Total 97.5 91 6.67% Weighted average
Solar Thermal Program Total Incentive Non-Incentive % of totalR&D 2.1 1.785 15% Initiatives 4-7, average incentive share of budget 85% assumes some mkt development (certification) activity R&D Leverage 4.2 4.2 0% Assumes 2:1 leverage for Solar thermal development fundsTechnical support 0.5 0.48 4% 25% of 2 million for renew generation projects assigned to solar thermalTech support leverage 1 1 0.00% Assumes 2:1 leverage for Solar thermal development fundsTotal 7.8 7.465 4.29% Weighted average
Solid WasteProgram Total Incentive Non-Incentive % of totalGreen Power Mktg 0.21 0 100% Note 5% assigned to WTEDigester development 3.1 2.945 5% State Energy Plan 3-52Digester leverage 5.7 5.7 0%Technical support 0.5 0.48 4% 25% of 2 million for renew generation projects assigned to WTE/digestersTech support leverage 1.5 1.5 0.00% Assumes 2:1 leverage for WTE digester development fundsTotal 11.01 10.625 3.50% Weighted average
Total Program expenditur 103.26 89.1365 86%Leverage total 1092 1092Total 1195.26 1181.137 1.18% Weighted average

Table 6.4.4 Administrative Adders - Currently Planned Initiative Scenario 8/19/2003,Renewable Technical Appendix Draft Final.xls
admin/incentive categories.

Table 6.4.5 Administrative Adders for Greenhouse Gas Scenario 8/19/2003,Renewable Technical Appendix Draft Final.xls
Renewables Administrative Adders for GHG Scenario
Cluster, Wind Farm and Offshore Wind
Program Total MillionPresent worth $
Resource Share of Program Incentive Admin Adder Amount Sum Present Worth Total Resource Costs
GHG awareness prog 40 $58.87 62% 0 $36.50 8364Green Power Mktg 10 $14.57 75% 0 $10.93Ex Order 111 30 $44.15 33% 0 $14.57Large Wind Incentives 24 $35.32 100% 31.78731614 $3.53Power Purchase 10 $14.72 100% 13.24471506 $1.47Total $67.00 0.80% admin adder
Biomass
Program Total MillionPresent worth $
Resource Share of Program Incentive Admin Adder Amount Sum Present Worth Total Resource Costs
GHG awareness prog 40 $58.87 7% 0 $4.20 862Green Power Mktg 10 $14.57 6% 0 $0.91Ex Order 111 30 $44.15 9% 0 $4.16RD&D Gasification Incen 12 $17.66 100% 15.89365807 $1.77Total $11.04 1.3%
Fuel Cells
Program Total MillionPresent worth $
Resource Share of Program Incentive Admin Adder Amount Sum Present Worth Total Resource Costs
GHG awareness prog 40 $58.87 7% 0 $4.20 2007Green Power Mktg 10 $14.57 0% 0 $0.00Ex Order 111 30 $44.15 9% 0 $4.16Fuel Cell Development # 80 $117.73 100% $82.41 $35.32Green Bldg Tax Credit, # 12 $17.66 33% $15.89 $0.58Total $44.27 2.2%
Hydro
Program Total MillionPresent worth $
Resource Share of Program Incentive Admin Adder Amount Sum Present Worth Total Resource Costs
GHG awareness prog 40 $58.87 13% 0 $7.65 877Green Power Mktg 10 $14.57 6% 0 $0.91Ex Order 111 30 $44.15 9% 0 $4.16Total $12.73 1.5%
LFG
Program Total MillionPresent worth $
Resource Share of Program Incentive Admin Adder Amount Sum Present Worth Total Resource Costs
GHG awareness prog 40 $58.87 1% 0 $0.59 190Green Power Mktg 10 $14.57 6% 0 $0.91Ex Order 111 30 $44.15 9% 0 $4.16LFG RD&D , #11 12 $17.66 100% 15.89365807 $1.77Total $7.43 3.9%
PV
Program Total MillionPresent worth $
Resource Share of Program Incentive Admin Adder Amount Sum Present Worth Total Resource Costs
GHG awareness prog 40 $58.87 7% 0 $4.20 5229Green Power Mktg 10 $14.57 0% 0 $0.00Ex Order 111 30 $44.15 9% 0 $4.16PV Development #4 160 $235.46 100% $200 $35.32Green Bldg Tax Credit, # 12 $17.66 33% $15.89 $0.58Total $44.27 1%
Solar Thermal, also applied to small wind
Program Total MillionPresent worth $
Resource Share of Program Incentive Admin Adder Amount Sum Present Worth Total Resource Costs
GHG awareness prog 40 $58.87 1% 0 $0.59 275Green Power Mktg 10 $14.57 0% 0 $0.00Ex Order 111 30 $44.15 9% 0 $4.16Solar Thermal Dev 0 $0.00 100% $0 $0.00Green Bldg Tax Credit, # 12 $17.66 33% $15.89 $0.58Total $5.33 2%
Solid Waste
Program Total MillionPresent worth $
Resource Share of Program Incentive Admin Adder Amount Sum Present Worth Total Resource Costs
GHG awareness prog 40 $58.87 1% 0 $0.59 33Green Power Mktg 10 $14.57 4% 0 $0.61Ex Order 111 30 $44.15 0% 0 $0.00Digester Development 8 $11.77 100% $11 $0.59
Total $1.78 5%
Total Program expenditures $586Admin Total $194Average Admin Share 33%

Table 6.5.1
NEW YORK STATE ENERGY RESEARCH AND DEVELOPMENT AUTHORITYSTATEWIDE ENERGY-EFFICIENCY AND RENEWABLE POTENTIAL ANALYSIS
TECHNICAL POTENTIAL SUMMARY 2007 2012 2022
Annual MWhSummer Peak MW
Winter Peak MW Annual MWh
Summer Peak MW
Winter Peak MW Annual MWh
Summer Peak MW
Winter Peak MW
Biopower Biomass Direct-Fire - - - - - - - - - Biomass Cofiring w/ Coal 3,890,752 640 650 4,045,013 665 676 4,778,899 786 799 Biomass Gasification 1,151,067 180 183 1,102,782 172 175 1,207,447 189 192 Biomass CHP 99,362 13 13 177,296 23 24 357,216 47 48 Biomass Sub Total 5,141,182 833 846 5,325,091 861 875 6,343,561 1,022 1,038
Fuel CellsFuel Cell PEM 41,264 5 6 339,362 44 48 3,267,627 424 461 Fuel Cell PAFC 182,474 22 22 1,692,213 205 205 6,445,504 779 779 Fuel Cell SOFC 162,134 20 20 1,230,636 149 149 7,710,290 932 932 Fuel Cell MCFC 265,608 32 32 2,016,996 244 244 20,353,551 2,461 2,461 Fuel Cell Sub Total 651,480 79 80 5,279,206 641 645 37,776,971 4,596 4,633
Hydro PowerHydro Relicense 1,145,200 80 105 1,145,200 80 105 1,145,200 80 105 Hydro Repower 394,200 120 157 441,465 135 176 536,576 164 214 Hydro Ex Capacity Ex Dam 43,418 8 10 260,503 46 60 651,255 115 150 Hydro New Capacity Ex Dam 165,104 20 26 990,634 121 158 2,476,588 303 395 Hydro New Dam sites 366,727 29 38 2,200,374 173 226 5,500,934 433 565 Hydro Sub Total 2,114,649 257 336 5,038,176 555 725 10,310,553 1,095 1,429
Landfill GasLFG Large Systems 11,568 2 2 13,790 2 2 17,651 2 2 LFG Engines 438,919 59 59 406,563 54 54 418,963 56 56 LFG Microturbines 9,038 1 1 11,484 2 2 15,296 2 2 LFG Sub Total 459,524 62 62 431,837 58 58 451,910 61 61
Municipal Solid WasteWTE Large - - - 633,304 85 85 1,324,862 178 178 WTE Small - - - - - - - - - Solid Waste Digestion - - - 48,268 6 6 95,703 13 13 WTE Sub Total - - - 681,572 91 91 1,420,565 190 190
PhotovoltaicsPV Residential 68,806 20 5 553,577 160 39 23,581,759 6,806 1,660 PV C&I no load control 82,119 24 4 660,236 191 35 28,125,745 8,123 1,511 PV BIPV 4,313 1 1 29,846 4 4 848,618 123 105 PV Sub Total 155,239 44 10 1,243,659 355 78 52,556,122 15,052 3,277
Solar ThermalRes DHW 1,352,479 576 275 1,484,371 632 302 1,617,285 688 329 Com DHW 685,646 181 87 705,567 187 89 732,061 194 93 C&I Vent Pre Heat 174,567 - 30 180,599 - 31 189,209 - 33 Solar Absorp Cool 800,981 665 - 1,802,206 1,496 - 3,804,658 3,158 - Solar Thermal Sub Total 3,013,672 1,422 392 4,172,743 2,315 423 6,343,213 4,041 455
WindWind Farm Installations 309,790 25 59 1,245,306 100 237 7,437,364 598 1,416 Cluster Installations 127,017 10 24 493,119 40 95 6,700,426 544 1,289 Small Wind Installations 58,256 5 9 128,076 10 20 314,360 25 48 Offshore Wind Installations 456,374 35 82 2,005,844 153 363 27,680,599 2,112 5,003 Wind Sub Total 951,438 75 175 3,872,345 304 714 42,132,748 3,280 7,757
TOTAL 12,487,184 2,772 1,901 26,044,629 5,180 3,609 157,335,643 29,336 18,839
NYSERDA Renewable Resource Potential Study Summary Results Renewable Technical Appendix Draft Final.xls, 8/19/2003

Table 6.5.1
NEW YORK STATE ENERGY RESEARCH AND DEVELOPMENT AUTHORITYSTATEWIDE ENERGY-EFFICIENCY AND RENEWABLE POTENTIAL ANALYSISCumulative Annual Savings at Generation
ZONE A TECHNICAL POTENTIAL 2007 2012 2022
Measure Name
Measure ID1
(e.g., Bldg type)
Measure ID2
(e.g., End Use)
Measure ID3
(e.g., Market:
Retrofit, NC, ROB) Annual MWh
Summer Peak MW
Winter Peak MW Annual MWh
Summer Peak MW
Winter Peak MW Annual MWh
Summer Peak MW
Winter Peak MW
Biomass Direct-Fire Biomass Zone A - WTech - - - - 0.00 0.00 - 0.00 0.00Biomass Cofiring w/ Coal Biomass Zone A - WTech 2,139,056 351.80 357.53 2,186,725 359.64 365.50 2,573,705 423.28 430.18Biomass Gasification Biomass Zone A - WTech 228,213 35.66 36.24 218,640 34.16 34.72 239,391 37.40 38.01Biomass CHP Biomass Zone A - WTech 12,421 1.64 1.66 22,159 2.92 2.97 44,650 5.89 5.98
Biomass Sub Total 2,379,690 389 395 2,427,525 397 403 2,857,746 467 474
Fuel Cell PEM FuelCell Zone A - WTech 527 0.07 0.07 30,556 3.96 4.31 293,580 38.07 41.38Fuel Cell PAFC FuelCell Zone A - WTech 14,133 1.71 1.71 134,912 16.31 16.31 515,640 62.32 62.32Fuel Cell SOFC FuelCell Zone A - WTech 18,808 2.27 2.27 142,754 17.25 17.25 894,394 108.10 108.10Fuel Cell MCFC FuelCell Zone A - WTech 54,737 6.62 6.62 415,667 50.24 50.24 4,194,510 506.99 506.99
Fuel Cell Sub Total 88,205 11 11 723,890 88 88 5,898,124 715 719
Hydro Relicense Hydro Zone A - WTech 572,600 40.14 52.41 572,600 40.14 52.41 572,600 40.14 52.41Hydro Repower Hydro Zone A - WTech - - - - 0.00 0.00 - 0.00 0.00Hydro Ex Capacity Ex Dam Hydro Zone A - WTech 720 0.13 0.17 5,218 0.92 1.20 13,315 2.35 3.06Hydro New Capacity Ex Dam Hydro Zone A - WTech 218 0.03 0.03 218 0.03 0.03 218 0.03 0.03Hydro New Dam sites Hydro Zone A - WTech 128,200 10.09 13.18 929,452 73.18 95.54 2,371,706 186.73 243.78
Hydro Sub Total 701,738 50 66 1,507,488 114 149 2,957,839 229 299
LFG Large Systems LFG Zone A - WTech 1,406 0.19 0.19 2,122 0.28 0.28 3,878 0.52 0.52LFG Engines LFG Zone A - WTech 53,319 7.14 7.14 62,598 8.39 8.39 92,025 12.33 12.33LFG Microturbines LFG Zone A - WTech 1,099 0.15 0.15 1,764 0.24 0.24 3,362 0.45 0.45
LFG Sub Total 55,824 7 7 66,484 9 9 99,265 13 13
PV Residential PV Zone A - WTech 7,407 1.91 0.51 63,719 16.41 4.34 2,708,805 697.68 184.68PV C&I with solar load control PV Zone A - WTech - - - - 0.00 0.00 - 0.00 0.00PV C&I no load control PV Zone A - WTech 9,418 2.42 0.54 75,118 19.28 4.28 3,230,331 829.12 184.25PV BIPV PV Zone A - WTech 469 0.07 0.06 3,400 0.49 0.45 96,977 13.98 12.91
PV Sub Total 17,294 4 1 142,237 36 9 6,036,112 1,541 382
Res DHW Stherm Zone A - WTech 130,416 59.60 28.50 144,067 65.84 31.49 157,824 72.13 34.49Com DHW Stherm Zone A - WTech 34,840 9.90 4.73 34,973 9.94 4.75 32,968 9.37 4.48C&I Vent Pre Heat Stherm Zone A - WTech 40,091 - 6.93 41,476 0.00 7.17 43,454 0.00 7.51Solar Absorp Cool Stherm Zone A - WTech 35,217 24.48 - 79,239 55.07 0.00 167,282 116.26 0.00
Solar Thermal Sub Total 240,564 94 40 299,755 131 43 401,527 198 46
Wind Farm Installations Wind Zone A - WTech 407,176 32.74 77.54 809,448 65.09 154.15 3,185,219 256.12 606.60Cluster Installations Wind Zone A - WTech 54,618 4.44 10.51 212,041 17.23 40.80 2,881,183 234.06 554.35Small Wind Installations Wind Zone A - WTech 17,724 1.43 2.73 38,970 3.15 5.99 95,653 7.74 14.71Offshore Wind Installations Wind Zone A - WTech 159,731 12.19 28.87 702,045 53.58 126.89 9,592,074 732.01 1,733.70
Wind Sub Total 639,248 51 120 1,762,504 139 328 15,754,129 1,230 2,909
WTE Large WTE Zone A - WTech - - - - 0.00 0.00 - 0.00 0.00WTE Small WTE Zone A - WTech - - - - 0.00 0.00 - 0.00 0.00Solid Waste Digestion WTE Zone A - WTech - - - - 0.00 0.00 - 0.00 0.00
WTE Sub Total - - - - - - - - -
TOTAL 4,122,563 607 640 6,929,884 914 1,030 34,004,742 4,393 4,843
NYSERDA Renewable Resource Potential Study Summary Results Renewable Technical Appendix Draft Final.xls, 8/19/2003

Table 6.5.1
NEW YORK STATE ENERGY RESEARCH AND DEVELOPMENT AUTHORITYSTATEWIDE ENERGY-EFFICIENCY AND RENEWABLE POTENTIAL ANALYSISCumulative Annual Savings at Generation
ZONE F TECHNICAL POTENTIAL 2007 2012 2022
Measure Name
Measure ID1
(e.g., Bldg type)
Measure ID2
(e.g., End Use)
Measure ID3
(e.g., Market:
Retrofit, NC, ROB) Annual MWh
Summer Peak MW
Winter Peak MW Annual MWh
Summer Peak MW
Winter Peak MW Annual MWh
Summer Peak MW
Winter Peak MW
Biomass Direct-Fire Biomass Zone F - CTech - - - - 0.00 0.00 - 0.00 0.00Biomass Cofiring w/ Coal Biomass Zone F - CTech - - - - 0.00 0.00 - 0.00 0.00Biomass Gasification Biomass Zone F - CTech 30,494 4.76 4.84 29,211 4.56 4.64 31,987 5.00 5.08Biomass CHP Biomass Zone F - CTech 4,143 0.55 0.56 7,389 0.97 0.99 14,886 1.96 2.00
Biomass Sub Total 34,637 5 5 36,600 6 6 46,873 7 7
Fuel Cell PEM FuelCell Zone F - CTech 358 0.05 0.05 20,755 2.69 2.93 199,410 25.86 28.11Fuel Cell PAFC FuelCell Zone F - CTech 9,757 1.18 1.18 92,793 11.21 11.21 354,503 42.84 42.84Fuel Cell SOFC FuelCell Zone F - CTech 12,809 1.55 1.55 97,220 11.75 11.75 609,113 73.62 73.62Fuel Cell MCFC FuelCell Zone F - CTech 37,200 4.50 4.50 282,492 34.14 34.14 2,850,638 344.55 344.55
Fuel Cell Sub Total 60,124 7 7 493,261 60 60 4,013,663 487 489
Hydro Relicense Hydro Zone F - CTech 572,600 40.14 52.41 572,600 40.14 52.41 572,600 40.14 52.41Hydro Repower Hydro Zone F - CTech - - - - 0.00 0.00 - 0.00 0.00Hydro Ex Capacity Ex Dam Hydro Zone F - CTech 8,906 1.57 2.05 64,566 11.38 14.86 164,756 29.04 37.91Hydro New Capacity Ex Dam Hydro Zone F - CTech 35,100 4.29 5.60 254,478 31.10 40.60 649,362 79.35 103.59Hydro New Dam sites Hydro Zone F - CTech 35,586 2.80 3.66 258,011 20.31 26.52 658,372 51.83 67.67
Hydro Sub Total 652,192 49 64 1,149,655 103 134 2,045,089 200 262
LFG Large Systems LFG Zone F - CTech 990 0.13 0.13 1,157 0.15 0.15 1,398 0.19 0.19LFG Engines LFG Zone F - CTech 37,524 5.03 5.03 34,195 4.58 4.58 33,230 4.45 4.45LFG Microturbines LFG Zone F - CTech 774 0.10 0.10 965 0.13 0.13 1,215 0.16 0.16
LFG Sub Total 39,288 5 5 36,317 5 5 35,843 5 5
PV Residential PV Zone F - CTech 6,242 1.37 0.40 45,253 9.90 2.87 1,894,385 414.40 120.31PV C&I with solar load control PV Zone F - CTech - - - - 0.00 0.00 - 0.00 0.00PV C&I no load control PV Zone F - CTech 6,542 1.46 0.35 52,334 11.65 2.82 2,253,642 501.49 121.57PV BIPV PV Zone F - CTech 351 0.06 0.04 2,429 0.40 0.27 69,003 11.26 7.74
PV Sub Total 13,135 3 1 100,016 22 6 4,217,030 927 250
Res DHW Stherm Zone F - CTech 85,119 36.10 17.26 93,420 39.62 18.95 101,785 43.17 20.64Com DHW Stherm Zone F - CTech 25,588 6.75 3.23 25,924 6.83 3.27 24,587 6.48 3.10C&I Vent Pre Heat Stherm Zone F - CTech 27,556 - 4.37 28,508 0.00 4.52 29,867 0.00 4.73Solar Absorp Cool Stherm Zone F - CTech 24,400 15.55 - 54,901 34.98 0.00 115,902 73.84 0.00
Solar Thermal Sub Total 162,664 58 25 202,753 81 27 272,142 123 28
Wind Farm Installations Wind Zone F - CTech 4,735 0.38 0.90 9,410 0.76 1.79 37,037 2.98 7.05Cluster Installations Wind Zone F - CTech 635 0.05 0.12 2,465 0.20 0.47 33,502 2.72 6.45Small Wind Installations Wind Zone F - CTech 5,313 0.43 0.82 11,686 0.95 1.80 28,687 2.32 4.41Offshore Wind Installations Wind Zone F - CTech - - - - 0.00 0.00 - 0.00 0.00
Wind Sub Total 10,683 1 2 23,562 2 4 99,226 8 18
WTE Large WTE Zone F - CTech - - - - 0.00 0.00 - 0.00 0.00WTE Small WTE Zone F - CTech - - - - 0.00 0.00 - 0.00 0.00Solid Waste Digestion WTE Zone F - CTech - - - - 0.00 0.00 - 0.00 0.00
WTE Sub Total - - - - - - - - -
TOTAL 972,723 129 109 2,042,165 278 242 10,729,865 1,758 1,059
NYSERDA Renewable Resource Potential Study Summary Results Renewable Technical Appendix Draft Final.xls, 8/19/2003

Table 6.5.1
NEW YORK STATE ENERGY RESEARCH AND DEVELOPMENT AUTHORITYSTATEWIDE ENERGY-EFFICIENCY AND RENEWABLE POTENTIAL ANALYSISCumulative Annual Savings at Generation
ZONE G TECHNICAL POTENTIAL 2007 2012 2022
Measure Name
Measure ID1
(e.g., Bldg type)
Measure ID2
(e.g., End Use)
Measure ID3
(e.g., Market:
Retrofit, NC, ROB) Annual MWh
Summer Peak MW
Winter Peak MW Annual MWh
Summer Peak MW
Winter Peak MW Annual MWh
Summer Peak MW
Winter Peak MW
Biomass Direct-Fire Biomass Zone G - LTech - - - - 0.00 0.00 - 0.00 0.00Biomass Cofiring w/ Coal Biomass Zone G - LTech 665,348 109.43 111.21 746,922 122.84 124.84 854,440 140.52 142.81Biomass Gasification Biomass Zone G - LTech - - - - 0.00 0.00 - 0.00 0.00Biomass CHP Biomass Zone G - LTech - - - - 0.00 0.00 - 0.00 0.00
Biomass Sub Total 665,348 109 111 746,922 123 125 854,440 141 143
Fuel Cell PEM FuelCell Zone G - LTech 432 0.06 0.06 24,928 3.23 3.51 239,486 31.05 33.76Fuel Cell PAFC FuelCell Zone G - LTech 8,970 1.08 1.08 90,496 10.94 10.94 348,057 42.07 42.07Fuel Cell SOFC FuelCell Zone G - LTech 10,701 1.29 1.29 81,222 9.82 9.82 508,879 61.50 61.50Fuel Cell MCFC FuelCell Zone G - LTech 25,509 3.08 3.08 193,709 23.41 23.41 1,954,723 236.27 236.27
Fuel Cell Sub Total 45,611 6 6 390,355 47 48 3,051,145 371 374
Hydro Relicense Hydro Zone G - LTech - - - - 0.00 0.00 - 0.00 0.00Hydro Repower Hydro Zone G - LTech - - - - 0.00 0.00 - 0.00 0.00Hydro Ex Capacity Ex Dam Hydro Zone G - LTech - - - - 0.00 0.00 - 0.00 0.00Hydro New Capacity Ex Dam Hydro Zone G - LTech 4,733 0.58 0.76 34,321 4.19 5.48 87,577 10.70 13.97Hydro New Dam sites Hydro Zone G - LTech 14,063 1.11 1.45 193,718 15.25 19.91 489,568 38.54 50.32
Hydro Sub Total 18,796 2 2 228,039 19 25 577,146 49 64
LFG Large Systems LFG Zone G - LTech 524 0.07 0.07 383 0.05 0.05 141 0.02 0.02LFG Engines LFG Zone G - LTech 19,948 2.67 2.67 11,318 1.52 1.52 3,462 0.46 0.46LFG Microturbines LFG Zone G - LTech 416 0.06 0.06 325 0.04 0.04 125 0.02 0.02
LFG Sub Total 20,888 3 3 12,025 2 2 3,728 0 0
PV Residential PV Zone G - LTech 6,395 1.67 0.31 49,559 12.97 2.39 2,121,444 555.40 102.31PV C&I with solar load control PV Zone G - LTech - - - - 0.00 0.00 - 0.00 0.00PV C&I no load control PV Zone G - LTech 6,697 1.81 0.26 58,601 15.83 2.32 2,523,190 681.70 99.76PV BIPV PV Zone G - LTech 384 0.08 0.07 2,658 0.54 0.49 75,509 15.40 13.86
PV Sub Total 13,476 4 1 110,818 29 5 4,720,143 1,253 216
Res DHW Stherm Zone G - LTech 116,318 48.19 23.05 127,661 52.89 25.29 139,092 57.62 27.56Com DHW Stherm Zone G - LTech 24,121 6.21 2.97 25,391 6.54 3.13 26,989 6.95 3.32C&I Vent Pre Heat Stherm Zone G - LTech 13,238 - 3.43 13,696 0.00 3.55 14,349 0.00 3.72Solar Absorp Cool Stherm Zone G - LTech 38,020 29.97 - 85,545 67.43 0.00 180,595 142.36 0.00
Solar Thermal Sub Total 191,697 84 29 252,293 127 32 361,025 207 35
Wind Farm Installations Wind Zone G - LTech - - - - 0.00 0.00 - 0.00 0.00Cluster Installations Wind Zone G - LTech - - - - 0.00 0.00 - 0.00 0.00Small Wind Installations Wind Zone G - LTech 2,885 0.23 0.44 6,337 0.51 0.97 15,547 1.26 2.39Offshore Wind Installations Wind Zone G - LTech - - - - 0.00 0.00 - 0.00 0.00
Wind Sub Total 2,885 0 0 6,337 1 1 15,547 1 2
WTE Large WTE Zone G - LTech - - - - 0.00 0.00 - 0.00 0.00WTE Small WTE Zone G - LTech - - - - 0.00 0.00 - 0.00 0.00Solid Waste Digestion WTE Zone G - LTech - - - - 0.00 0.00 - 0.00 0.00
WTE Sub Total - - - - - - - - -
TOTAL 958,701 208 152 1,746,789 348 238 9,583,173 2,022 834
NYSERDA Renewable Resource Potential Study Summary Results Renewable Technical Appendix Draft Final.xls, 8/19/2003

Table 6.5.1
NEW YORK STATE ENERGY RESEARCH AND DEVELOPMENT AUTHORITYSTATEWIDE ENERGY-EFFICIENCY AND RENEWABLE POTENTIAL ANALYSISCumulative Annual Savings at Generation
ZONE J TECHNICAL POTENTIAL 2007 2012 2022
Measure Name
Measure ID1
(e.g., Bldg type)
Measure ID2
(e.g., End Use)
Measure ID3
(e.g., Market:
Retrofit, NC, ROB) Annual MWh
Summer Peak MW
Winter Peak MW Annual MWh
Summer Peak MW
Winter Peak MW Annual MWh
Summer Peak MW
Winter Peak MW
Biomass Direct-Fire Biomass Zone J - N Tech - - - - 0.00 0.00 - 0.00 0.00Biomass Cofiring w/ Coal Biomass Zone J - N Tech - - - - 0.00 0.00 - 0.00 0.00Biomass Gasification Biomass Zone J - N Tech 658,773 102.93 104.60 631,141 98.61 100.22 691,038 107.97 109.73Biomass CHP Biomass Zone J - N Tech - - - - 0.00 0.00 - 0.00 0.00
Biomass Sub Total 658,773 103 105 631,141 99 100 691,038 108 110
Fuel Cell PEM FuelCell Zone J - N Tech 1,643 0.21 0.23 95,324 12.36 13.44 915,870 118.76 129.09Fuel Cell PAFC FuelCell Zone J - N Tech 89,971 10.87 10.87 769,353 92.98 92.98 2,900,477 350.55 350.55Fuel Cell SOFC FuelCell Zone J - N Tech 53,991 6.53 6.53 409,802 49.53 49.53 2,567,527 310.31 310.31Fuel Cell MCFC FuelCell Zone J - N Tech 10,629 1.28 1.28 80,712 9.76 9.76 814,468 98.44 98.44
Fuel Cell Sub Total 156,233 19 19 1,355,191 165 166 7,198,342 878 888
Hydro Relicense Hydro Zone J - N Tech - - - - 0.00 0.00 - 0.00 0.00Hydro Repower Hydro Zone J - N Tech - - - - 0.00 0.00 - 0.00 0.00Hydro Ex Capacity Ex Dam Hydro Zone J - N Tech - - - - 0.00 0.00 - 0.00 0.00Hydro New Capacity Ex Dam Hydro Zone J - N Tech - - - - 0.00 0.00 - 0.00 0.00Hydro New Dam sites Hydro Zone J - N Tech 571 0.04 0.06 4,140 0.33 0.43 10,564 0.83 1.09
Hydro Sub Total 571 0 0 4,140 0 0 10,564 1 1
LFG Large Systems LFG Zone J - N Tech 782 0.10 0.10 216 0.03 0.03 58 0.01 0.01LFG Engines LFG Zone J - N Tech 11,767 1.58 1.58 6,400 0.86 0.86 1,348 0.18 0.18LFG Microturbines LFG Zone J - N Tech 241 0.03 0.03 183 0.02 0.02 50 0.01 0.01
LFG Sub Total 12,791 2 2 6,799 1 1 1,456 0 0
PV Residential PV Zone J - N Tech 16,369 5.07 1.65 135,866 42.06 13.72 5,786,600 1,791.50 584.18PV C&I with solar load control PV Zone J - N Tech - - - - 0.00 0.00 - 0.00 0.00PV C&I no load control PV Zone J - N Tech 20,542 6.49 1.72 160,911 50.84 13.49 6,871,241 2,171.03 575.99PV BIPV PV Zone J - N Tech 1,053 0.21 0.08 7,290 1.45 0.58 207,757 41.20 16.48
PV Sub Total 37,965 12 3 304,068 94 28 12,865,598 4,004 1,177
Res DHW Stherm Zone J - N Tech 141,352 57.28 27.39 155,137 62.86 30.07 169,028 68.49 32.76Com DHW Stherm Zone J - N Tech 18,288 4.61 2.20 19,674 4.96 2.37 21,871 5.51 2.63C&I Vent Pre Heat Stherm Zone J - N Tech 29,781 - 3.43 30,810 0.00 3.55 32,278 0.00 3.72Solar Absorp Cool Stherm Zone J - N Tech 519,043 491.88 - 1,167,848 1,106.73 0.00 2,465,456 2,336.43 0.00
Solar Thermal Sub Total 708,464 554 33 1,373,467 1,175 36 2,688,634 2,410 39
Wind Farm Installations Wind Zone J - N Tech - - - - 0.00 0.00 - 0.00 0.00Cluster Installations Wind Zone J - N Tech - - - - 0.00 0.00 - 0.00 0.00Small Wind Installations Wind Zone J - N Tech 3,118 0.25 0.48 6,859 0.56 1.06 16,841 1.36 2.59Offshore Wind Installations Wind Zone J - N Tech - - - - 0.00 0.00 - 0.00 0.00
Wind Sub Total 3,118 0 0 6,859 1 1 16,841 1 3
WTE Large WTE Zone J - N Tech - - - 633,304 84.85 84.85 1,324,862 177.51 177.51WTE Small WTE Zone J - N Tech - - - - 0.00 0.00 - 0.00 0.00Solid Waste Digestion WTE Zone J - N Tech - - - 48,331 6.47 6.47 95,830 12.82 12.82
WTE Sub Total - - - 681,636 91 91 1,420,692 190 190
TOTAL 1,577,914 689 162 4,363,300 1,625 423 24,893,164 7,593 2,408
NYSERDA Renewable Resource Potential Study Summary Results Renewable Technical Appendix Draft Final.xls, 8/19/2003

Table 6.5.1
NEW YORK STATE ENERGY RESEARCH AND DEVELOPMENT AUTHORITYSTATEWIDE ENERGY-EFFICIENCY AND RENEWABLE POTENTIAL ANALYSISCumulative Annual Savings at Generation
ZONE K TECHNICAL POTENTIAL 2007 2012 2022
Measure Name
Measure ID1
(e.g., Bldg type)
Measure ID2
(e.g., End Use)
Measure ID3
(e.g., Market:
Retrofit, NC, ROB) Annual MWh
Summer Peak MW
Winter Peak MW Annual MWh
Summer Peak MW
Winter Peak MW Annual MWh
Summer Peak MW
Winter Peak MW
Biomass Direct-Fire Biomass Zone K - L Base - - - - 0.00 0.00 - 0.00 0.00Biomass Cofiring w/ Coal Biomass Zone K - L Base - - - - 0.00 0.00 - 0.00 0.00Biomass Gasification Biomass Zone K - L Base 1,177 0.18 0.19 1,128 0.18 0.18 1,233 0.19 0.20Biomass CHP Biomass Zone K - L Base - - - - 0.00 0.00 - 0.00 0.00
Biomass Sub Total 1,177 0 0 1,128 0 0 1,233 0 0
Fuel Cell PEM FuelCell Zone K - L Base 914 0.12 0.13 52,981 6.87 7.47 509,028 66.01 71.75Fuel Cell PAFC FuelCell Zone K - L Base 22,513 2.72 2.72 218,779 26.44 26.44 837,915 101.27 101.27Fuel Cell SOFC FuelCell Zone K - L Base 18,321 2.21 2.21 139,062 16.81 16.81 871,263 105.30 105.30Fuel Cell MCFC FuelCell Zone K - L Base 19,131 2.31 2.31 145,282 17.56 17.56 1,466,042 177.20 177.20
Fuel Cell Sub Total 60,879 7 7 556,103 68 68 3,684,248 450 456
Hydro Relicense Hydro Zone K - L Base - - - - 0.00 0.00 - 0.00 0.00Hydro Repower Hydro Zone K - L Base - - - - 0.00 0.00 - 0.00 0.00Hydro Ex Capacity Ex Dam Hydro Zone K - L Base - - - - 0.00 0.00 - 0.00 0.00Hydro New Capacity Ex Dam Hydro Zone K - L Base - - - - 0.00 0.00 - 0.00 0.00Hydro New Dam Sites Hydro Zone K - L Base - - - - 0.00 0.00 - 0.00 0.00
Hydro Sub Total - - - - - - - - -
LFG Large Systems LFG Zone K - L Base 1,157 - - 741 0.00 0.00 208 0.00 0.00LFG Engines LFG Zone K - L Base 43,932 - - 21,712 0.00 0.00 4,860 0.00 0.00LFG Microturbines LFG Zone K - L Base 899 - - 616 0.00 0.00 175 0.00 0.00
LFG Sub Total 45,987 - - 23,069 - - 5,243 - -
PV Residential PV Zone K - L Base 14,724 4.46 0.59 114,522 34.70 4.63 4,860,652 1,472.94 196.39PV C&I with solar load control PV Zone K - L Base - - - - 0.00 0.00 - 0.00 0.00PV C&I no load control PV Zone K - L Base 17,120 5.19 0.55 135,250 40.98 4.36 5,774,676 1,749.87 186.16PV BIPV PV Zone K - L Base 878 0.14 0.11 6,076 0.97 0.73 172,970 27.67 20.75
PV Sub Total 32,723 10 1 255,849 77 10 10,808,298 3,250 403
Res DHW Stherm Zone K - L Base 285,093 115.99 55.48 312,895 127.31 60.89 340,912 138.70 66.34Com DHW Stherm Zone K - L Base 71,873 18.18 8.69 75,657 19.14 9.15 80,418 20.34 9.73C&I Vent Pre Heat Stherm Zone K - L Base 39,687 - 6.86 41,059 0.00 7.10 43,016 0.00 7.44Solar Absorp Cool Stherm Zone K - L Base 110,654 100.40 - 248,971 225.91 0.00 525,605 476.92 0.00
Solar Thermal Sub Total 507,307 235 71 678,582 372 77 989,952 636 84
Wind Farm Installations Wind Zone K - L Base 72,913 5.86 13.89 144,946 11.65 27.60 570,376 45.86 108.62Cluster Installations Wind Zone K - L Base 9,781 0.79 1.88 37,970 3.08 7.31 515,933 41.91 99.27Small Wind Installations Wind Zone K - L Base 11,129 0.90 1.71 24,477 1.98 3.77 60,089 4.87 9.25Offshore Wind Installations Wind Zone K - L Base 296,643 22.64 53.62 1,303,798 99.50 235.65 18,088,524 1,380.40 3,269.38
Wind Sub Total 390,466 30 71 1,511,191 116 274 19,234,923 1,473 3,487
WTE Large WTE Zone K - L Base - - - - 0.00 0.00 - 0.00 0.00WTE Small WTE Zone K - L Base - - - - 0.00 0.00 - 0.00 0.00Solid Waste Digestion WTE Zone K - L Base - - - - 0.00 0.00 - 0.00 0.00
WTE Sub Total - - - - - - - - -
TOTAL 1,038,540 282 151 3,025,922 633 430 34,723,897 5,809 4,429
NYSERDA Renewable Resource Potential Study Summary Results Renewable Technical Appendix Draft Final.xls, 8/19/2003

Table 6.5.1
NEW YORK STATE ENERGY RESEARCH AND DEVELOPMENT AUTHORITYSTATEWIDE ENERGY-EFFICIENCY AND RENEWABLE POTENTIAL ANALYSIS
ECONOMIC POTENTIAL SUMMARY - (HI Avoided Costs) 2007 2012 2022
Annual MWhSummer Peak MW Winter Peak MW Annual MWh
Summer Peak MW Winter Peak MW Annual MWh
Summer Peak MW Winter Peak MW
Biopower Biomass Direct-Fire - - - - - - - - - Biomass Cofiring w/ Coal 3,890,752 640 650 4,045,013 665 676 4,778,899 786 799 Biomass Gasification 1,151,067 180 183 1,102,782 172 175 1,207,447 189 192 Biomass CHP 99,362 13 13 177,296 23 24 357,216 47 48 Biomass Sub Total 5,141,182 833 846 5,325,091 861 875 6,343,561 1,022 1,038
Fuel CellsFuel Cell PEM - - - - - - - - - Fuel Cell PAFC - - - - - - - - - Fuel Cell SOFC - - - - - - - - - Fuel Cell MCFC - - - - - - - - - Fuel Cell Sub Total - - - - - - - - -
Hydro PowerHydro Relicense 1,145,200 80 105 1,145,200 80 105 1,145,200 80 105 Hydro Repower 394,200 120 157 441,465 135 176 536,576 164 214 Hydro Ex Capacity Ex Dam 43,418 8 10 260,503 46 60 651,255 115 150 Hydro New Capacity Ex Dam 165,104 20 26 990,634 121 158 2,476,588 303 395 Hydro New Dam sites 366,727 29 38 2,200,374 173 226 5,500,934 433 565 Hydro Sub Total 2,114,649 257 336 5,038,176 555 725 10,310,553 1,095 1,429
Landfill GasLFG Large Systems - - - - - - - - - LFG Engines 438,919 59 59 406,563 54 54 418,963 56 56 LFG Microturbines - - - - - - - - - LFG Sub Total 438,919 59 59 406,563 54 54 418,963 56 56
Municipal Solid WasteWTE Large - - - 633,304 85 85 1,324,862 178 178 WTE Small - - - - - - - - - Solid Waste Digestion - - - 48,268 6 6 95,703 13 13 WTE Sub Total - - - 681,572 91 91 1,420,565 190 190
PhotovoltaicsPV Residential - - - - - - - - - PV C&I no load control - - - - - - - - - PV BIPV - - - - - - - - - PV Sub Total - - - - - - - - -
Solar ThermalRes DHW - - - - - - - - - Com DHW - - - - - - - - - C&I Vent Pre Heat 174,567 - 30 180,599 - 31 189,209 - 33 Solar Absorp Cool - - - - - - - - - Solar Thermal Sub Total 174,567 - 30 180,599 - 31 189,209 - 33
WindWind Farm Installations 309,790 25 59 1,245,306 100 237 7,437,364 598 1,416 Cluster Installations 127,017 10 24 493,119 40 95 6,700,426 544 1,289 Small Wind Installations - - - - - - - - - Offshore Wind Installations 456,374 35 82 2,005,844 153 363 27,680,599 2,112 5,003 Wind Sub Total 893,182 70 166 3,744,269 293 695 41,818,388 3,255 7,709
TOTAL 8,762,499 1,219 1,437 15,376,270 1,855 2,472 60,501,239 5,618 10,455 Percent of Technical Potential 70% 44% 76% 59% 36% 68% 38% 19% 55%
NYSERDA Renewable Resource Potential Study Summary Results Renewable Technical Appendix Draft Final.xls, 8/19/2003

Table 6.5.1
NEW YORK STATE ENERGY RESEARCH AND DEVELOPMENT AUTHORITYSTATEWIDE ENERGY-EFFICIENCY AND RENEWABLE POTENTIAL ANALYSIS
ECONOMIC POTENTIAL SUMMARY - (Lo Avoided Costs) 2007 2012 2022
Annual MWhSummer Peak MW Winter Peak MW Annual MWh
Summer Peak MW
Winter Peak MW Annual MWh
Summer Peak MW Winter Peak MW
Biopower Biomass D - - - - - - - - - Biomass C 3,890,752 640 650 4,045,013 665 676 4,778,899 786 799 Biomass G 1,151,067 180 183 1,102,782 172 175 1,207,447 189 192 Biomass C 99,362 13 13 177,296 23 24 357,216 47 48 Biomass S 5,141,182 833 846 5,325,091 861 875 6,343,561 1,022 1,038
Fuel CellsFuel Cell P - - - - - - - - - Fuel Cell P - - - - - - - - - Fuel Cell S - - - - - - - - - Fuel Cell M - - - - - - - - - Fuel Cell S - - - - - - - - -
Hydro PowerHydro Relic 1,145,200 80 105 1,145,200 80 105 1,145,200 80 105 Hydro Rep - - - - - - - - - Hydro Ex C - - - - - - - - - Hydro New - - - 990,634 121 158 2,476,588 303 395 Hydro New 366,727 29 38 2,200,374 173 226 5,500,934 433 565 Hydro Sub 1,511,927 109 143 4,336,208 375 489 9,122,722 816 1,065
Landfill GasLFG Large - - - - - - - - - LFG Engin - - - - - - - - - LFG Microt - - - - - - - - - LFG Sub T - - - - - - - - -
Municipal Solid WasteWTE Large - - - 633,304 85 85 1,324,862 178 178 WTE Smal - - - - - - - - - Solid Wast - - - 48,268 6 6 95,703 13 13 WTE Sub T - - - 681,572 91 91 1,420,565 190 190
PhotovoltaicsPV Reside - - - - - - - - - PV C&I wit - - - - - - - - - PV C&I no - - - - - - - - - PV BIPV - - - - - - - - - PV Sub To - - - - - - - - -
Solar ThermalRes DHW - - - - - - - - - Com DHW - - - - - - - - - C&I Vent P 174,567 - 30 180,599 - 31 189,209 - 33 Solar Abso - - - - - - - - - Solar Ther 174,567 - 30 180,599 - 31 189,209 - 33
WindWind Farm - - - 1,245,306 100 237 7,437,364 598 1,416 Cluster Ins - - - - - - 6,700,426 544 1,289 Small Wind - - - - - - - - - Offshore W - - - - - - 27,680,599 2,112 5,003 Wind Sub - - - 1,245,306 100 237 41,818,388 3,255 7,709
TOTAL 6,827,676 942 1,019 11,768,777 1,427 1,724 58,894,446 5,283 10,035 Percent of Technical Potential 55% 34% 54% 45% 28% 48% 37% 18% 53%
NYSERDA Renewable Resource Potential Study Summary Results Renewable Technical Appendix Draft Final.xls, 8/19/2003

Table 6.5.1
NEW YORK STATE ENERGY RESEARCH AND DEVELOPMENT AUTHORITYSTATEWIDE ENERGY-EFFICIENCY AND RENEWABLE POTENTIAL ANALYSISCumulative Annual Savings at GenerationECONOMIC POTENTIAL ZONE A
2007 2012 2022
Measure Name
Measure ID1
(e.g., Bldg type)
Measure ID2
(e.g., End Use)
Measure ID3
(e.g., Market:
Retrofit, NC, ROB) Annual MWh
Summer Peak MW
Winter Peak MW Annual MWh
Summer Peak MW
Winter Peak MW Annual MWh
Summer Peak MW
Winter Peak MW
Biomass Direct-Fire Biomass Zone A - WBase - - - - - - - - - Biomass Cofiring w/ Coal Biomass Zone A - WBase 2,139,056 352 358 2,186,725 360 365 2,573,705 423 430 Biomass Gasification Biomass Zone A - WBase 228,213 36 36 218,640 34 35 239,391 37 38 Biomass CHP Biomass Zone A - WBase 12,421 2 2 22,159 3 3 44,650 6 6
Biomass Sub Total 2,379,690 389 395 2,427,525 397 403 2,857,746 467 474
Fuel Cell PEM FuelCell Zone A - WBase - - - - - - - - - Fuel Cell PAFC FuelCell Zone A - WBase - - - - - - - - - Fuel Cell SOFC FuelCell Zone A - WBase - - - - - - - - - Fuel Cell MCFC FuelCell Zone A - WBase - - - - - - - - -
Fuel Cell Sub Total - - - - - - - - -
Hydro Relicense Hydro Zone A - WBase 572,600 40 52 572,600 40 52 572,600 40 52 Hydro Repower Hydro Zone A - WBase - - - - - - - - - Hydro Ex Capacity Ex DamHydro Zone A - WBase - - - - - - - - - Hydro New Capacity Ex DaHydro Zone A - WBase - - - - - - - - - Hydro New Dam Sites Hydro Zone A - WBase 128,200 10 13 929,452 73 96 2,371,706 187 244
Hydro Sub Total 700,800 50 66 1,502,052 113 148 2,944,306 227 296
LFG Large Systems LFG Zone A - WBase - - - - - - - - - LFG Engines LFG Zone A - WBase - - - - - - - - - LFG Microturbines LFG Zone A - WBase - - - - - - - - -
LFG Sub Total - - - - - - - - -
PV Residential PV Zone A - WBase - - - - - - - - - PV C&I with solar load con PV Zone A - WBase - - - - - - - - - PV C&I no load control PV Zone A - WBase - - - - - - - - - PV BIPV PV Zone A - WBase - - - - - - - - -
PV Sub Total - - - - - - - - -
Res DHW Stherm Zone A - WBase - - - - - - - - - Com DHW Stherm Zone A - WBase - - - - - - - - - C&I Vent Pre Heat Stherm Zone A - WBase - - - - - - - - - Solar Absorp Cool Stherm Zone A - WBase - - - - - - - - -
Solar Thermal Sub Total - - - - - - - - -
Wind Farm Installations Wind Zone A - WBase - - - - - - 3,185,219 256 607 Cluster Installations Wind Zone A - WBase - - - - - - - - - Small Wind Installations Wind Zone A - WBase - - - - - - - - - Offshore Wind Installations Wind Zone A - WBase - - - - - - - - -
Wind Sub Total - - - - - - 3,185,219 256 607
WTE Large WTE Zone A - WBase - - - - - - - - - WTE Small WTE Zone A - WBase - - - - - - - - - Solid Waste Digestion WTE Zone A - WBase - - - - - - - - -
WTE Sub Total - - - - - - - - -
TOTAL 3,080,490 439 461 3,929,577 510 551 8,987,270 950 1,377
NYSERDA Renewable Resource Potential Study Summary Results Renewable Technical Appendix Draft Final.xls, 8/19/2003

Table 6.5.1
NEW YORK STATE ENERGY RESEARCH AND DEVELOPMENT AUTHORITYSTATEWIDE ENERGY-EFFICIENCY AND RENEWABLE POTENTIAL ANALYSISCumulative Annual Savings at GenerationECONOMIC POTENTIAL ZONE G
2007 2012 2022
Measure Name
Measure ID1(e.g., Bldg
type)
Measure ID2 (e.g., End
Use)
Measure ID3(e.g.,
Market: Retrofit, NC,
ROB) Annual MWhSummer Peak MW
Winter Peak MW Annual MWh
Summer Peak MW
Winter Peak MW Annual MWh
Summer Peak MW
Winter Peak MW
Biomass Direct-Fire Biomass Zone G - L Tech - - - - - - - - - Biomass Cofiring w/ Coal Biomass Zone G - L Tech 665,348 109 111 746,922 123 125 854,440 141 143 Biomass Gasification Biomass Zone G - L Tech - - - - - - - - - Biomass CHP Biomass Zone G - L Tech - - - - - - - - -
Biomass Sub Total 665,348 109 111 746,922 123 125 854,440 141 143
Fuel Cell PEM FuelCell Zone G - L Tech - - - - - - - - - Fuel Cell PAFC FuelCell Zone G - L Tech - - - - - - - - - Fuel Cell SOFC FuelCell Zone G - L Tech - - - - - - - - - Fuel Cell MCFC FuelCell Zone G - L Tech - - - - - - - - -
Fuel Cell Sub Total - - - - - - - - -
Hydro Relicense Hydro Zone G - L Tech - - - - - - - - - Hydro Repower Hydro Zone G - L Tech - - - - - - - - - Hydro Ex Capacity Ex Dam Hydro Zone G - L Tech - - - - - - - - - Hydro New Capacity Ex Dam Hydro Zone G - L Tech 4,733 1 1 34,321 4 5 87,577 11 14 Hydro New Dam sites Hydro Zone G - L Tech 14,063 1 1 193,718 15 20 489,568 39 50
Hydro Sub Total 18,796 2 2 228,039 19 25 577,146 49 64
LFG Large Systems LFG Zone G - L Tech - - - - - - - - - LFG Engines LFG Zone G - L Tech - - - - - - - - - LFG Microturbines LFG Zone G - L Tech - - - - - - - - -
LFG Sub Total - - - - - - - - -
PV Residential PV Zone G - L Tech - - - - - - - - - PV C&I with solar load control PV Zone G - L Tech - - - - - - - - - PV C&I no load control PV Zone G - L Tech - - - - - - - - - PV BIPV PV Zone G - L Tech - - - - - - - - -
PV Sub Total - - - - - - - - -
Res DHW Stherm Zone G - L Tech - - - - - - - - - Com DHW Stherm Zone G - L Tech - - - - - - - - - C&I Vent Pre Heat Stherm Zone G - L Tech - - - - - - - - - Solar Absorp Cool Stherm Zone G - L Tech - - - - - - - - -
Solar Thermal Sub Total - - - - - - - - -
Wind Farm Installations Wind Zone G - L Tech - - - - - - - - - Cluster Installations Wind Zone G - L Tech - - - - - - - - - Small Wind Installations Wind Zone G - L Tech - - - - - - - - - Offshore Wind Installations Wind Zone G - L Tech - - - - - - - - -
Wind Sub Total - - - - - - - - -
WTE Large WTE Zone G - L Tech - - - - - - - - - WTE Small WTE Zone G - L Tech - - - - - - - - - Solid Waste Digestion WTE Zone G - L Tech - - - - - - - - -
WTE Sub Total - - - - - - - - -
TOTAL 684,144 111 113 974,961 142 150 1,431,585 190 207
NYSERDA Renewable Resource Potential Study Summary Results Renewable Technical Appendix Draft Final.xls, 8/19/2003

Table 6.5.1
NEW YORK STATE ENERGY RESEARCH AND DEVELOPMENT AUTHORITYSTATEWIDE ENERGY-EFFICIENCY AND RENEWABLE POTENTIAL ANALYSISCumulative Annual Savings at GenerationECONOMIC POTENTIAL ZONE J
2007 2012 2022
Measure Name
Measure ID1(e.g., Bldg
type)
Measure ID2 (e.g., End
Use)
Measure ID3(e.g.,
Market: Retrofit, NC,
ROB) Annual MWhSummer Peak MW
Winter Peak MW Annual MWh
Summer Peak MW
Winter Peak MW Annual MWh
Summer Peak MW
Winter Peak MW
Biomass Direct-Fire Biomass Zone J - NYTech - - - - - - - - - Biomass Cofiring w/ Coal Biomass Zone J - NYTech - - - - - - - - - Biomass Gasification Biomass Zone J - NYTech 658,773 103 105 631,141 99 100 691,038 108 110 Biomass CHP Biomass Zone J - NYTech - - - - - - - - -
Biomass Sub Total 658,773 103 105 631,141 99 100 691,038 108 110
Fuel Cell PEM FuelCell Zone J - NYTech - - - - - - - - - Fuel Cell PAFC FuelCell Zone J - NYTech - - - - - - - - - Fuel Cell SOFC FuelCell Zone J - NYTech - - - - - - - - - Fuel Cell MCFC FuelCell Zone J - NYTech - - - - - - - - -
Fuel Cell Sub Total - - - - - - - - -
Hydro Relicense Hydro Zone J - NYTech - - - - - - - - - Hydro Repower Hydro Zone J - NYTech - - - - - - - - - Hydro Ex Capacity Ex Dam Hydro Zone J - NYTech - - - - - - - - - Hydro New Capacity Ex Dam Hydro Zone J - NYTech - - - - - - - - - Hydro New Dam sites Hydro Zone J - NYTech 571 0 0 4,140 0 0 10,564 1 1
Hydro Sub Total 571 0 0 4,140 0 0 10,564 1 1
LFG Large Systems LFG Zone J - NYTech - - - - - - - - - LFG Engines LFG Zone J - NYTech - - - - - - - - - LFG Microturbines LFG Zone J - NYTech - - - - - - - - -
LFG Sub Total - - - - - - - - -
PV Residential PV Zone J - NYTech - - - - - - - - - PV C&I with solar load control PV Zone J - NYTech - - - - - - - - - PV C&I no load control PV Zone J - NYTech - - - - - - - - - PV BIPV PV Zone J - NYTech - - - - - - - - -
PV Sub Total - - - - - - - - -
Res DHW Stherm Zone J - NYTech - - - - - - - - - Com DHW Stherm Zone J - NYTech - - - - - - - - - C&I Vent Pre Heat Stherm Zone J - NYTech 29,781 - 3 30,810 - 4 32,278 - 4 Solar Absorp Cool Stherm Zone J - NYTech - - - - - - - - -
Solar Thermal Sub Total 29,781 - 3 30,810 - 4 32,278 - 4
Wind Farm Installations Wind Zone J - NYTech - - - - - - - - - Cluster Installations Wind Zone J - NYTech - - - - - - - - - Small Wind Installations Wind Zone J - NYTech - - - - - - - - - Offshore Wind Installations Wind Zone J - NYTech - - - - - - - - -
Wind Sub Total - - - - - - - - -
WTE Large WTE Zone J - NYTech - - - 633,304 85 85 1,324,862 178 178 WTE Small WTE Zone J - NYTech - - - - - - - - - Solid Waste Digestion WTE Zone J - NYTech - - - - - - 95,830 13 13
WTE Sub Total - - - 633,304 85 85 1,420,692 190 190
TOTAL 689,125 103 108 1,299,394 184 189 2,154,572 299 305
NYSERDA Renewable Resource Potential Study Summary Results Renewable Technical Appendix Draft Final.xls, 8/19/2003

Table 6.5.1
NEW YORK STATE ENERGY RESEARCH AND DEVELOPMENT AUTHORITYSTATEWIDE ENERGY-EFFICIENCY AND RENEWABLE POTENTIAL ANALYSISCumulative Annual Savings at GenerationECONOMIC POTENTIAL ZONE K
2007 2012 2022
Measure Name
Measure ID1(e.g., Bldg
type)
Measure ID2 (e.g., End
Use)
Measure ID3(e.g.,
Market: Retrofit, NC,
ROB) Annual MWhSummer Peak MW
Winter Peak MW Annual MWh
Summer Peak MW
Winter Peak MW Annual MWh
Summer Peak MW
Winter Peak MW
Biomass Direct-Fire Biomass Zone K - LoTech - - - - - - - - - Biomass Cofiring w/ Coal Biomass Zone K - LoTech - - - - - - - - - Biomass Gasification Biomass Zone K - LoTech 1,177 0 0 1,128 0 0 1,233 0 0 Biomass CHP Biomass Zone K - LoTech - - - - - - - - -
Biomass Sub Total 1,177 0 0 1,128 0 0 1,233 0 0
Fuel Cell PEM FuelCell Zone K - LoTech - - - - - - - - - Fuel Cell PAFC FuelCell Zone K - LoTech - - - - - - - - - Fuel Cell SOFC FuelCell Zone K - LoTech - - - - - - - - - Fuel Cell MCFC FuelCell Zone K - LoTech - - - - - - - - -
Fuel Cell Sub Total - - - - - - - - -
Hydro Relicense Hydro Zone K - LoTech - - - - - - - - - Hydro Repower Hydro Zone K - LoTech - - - - - - - - - Hydro Ex Capacity Ex Dam Hydro Zone K - LoTech - - - - - - - - - Hydro New Capacity Ex Dam Hydro Zone K - LoTech - - - - - - - - - Hydro New Dam Sites Hydro Zone K - LoTech - - - - - - - - -
Hydro Sub Total - - - - - - - - -
LFG Large Systems LFG Zone K - LoTech - - - - - - - - - LFG Engines LFG Zone K - LoTech - - - - - - - - - LFG Microturbines LFG Zone K - LoTech - - - - - - - - -
LFG Sub Total - - - - - - - - -
PV Residential PV Zone K - LoTech - - - - - - - - - PV C&I with solar load control PV Zone K - LoTech - - - - - - - - - PV C&I no load control PV Zone K - LoTech - - - - - - - - - PV BIPV PV Zone K - LoTech - - - - - - - - -
PV Sub Total - - - - - - - - -
Res DHW Stherm Zone K - LoTech - - - - - - - - - Com DHW Stherm Zone K - LoTech - - - - - - - - - C&I Vent Pre Heat Stherm Zone K - LoTech 39,687 - 7 41,059 - 7 43,016 - 7 Solar Absorp Cool Stherm Zone K - LoTech - - - - - - - - -
Solar Thermal Sub Total 39,687 - 7 41,059 - 7 43,016 - 7
Wind Farm Installations Wind Zone K - LoTech 72,913 6 14 144,946 12 28 570,376 46 109 Cluster Installations Wind Zone K - LoTech 9,781 1 2 37,970 3 7 515,933 42 99 Small Wind Installations Wind Zone K - LoTech - - - - - - - - - Offshore Wind Installations Wind Zone K - LoTech 296,643 23 54 1,303,798 99 236 18,088,524 1,380 3,269
Wind Sub Total 379,337 29 69 1,486,714 114 271 19,174,833 1,468 3,477
WTE Large WTE Zone K - LoTech - - - - - - - - - WTE Small WTE Zone K - LoTech - - - - - - - - - Solid Waste Digestion WTE Zone K - LoTech - - - - - - - - -
WTE Sub Total - - - - - - - - -
TOTAL 420,201 29 76 1,528,901 114 278 19,219,083 1,468 3,485
NYSERDA Renewable Resource Potential Study Summary Results Renewable Technical Appendix Draft Final.xls, 8/19/2003

Table 6.5.2
NEW YORK STATE ENERGY RESEARCH AND DEVELOPMENT AUTHORITYSTATEWIDE ENERGY-EFFICIENCY AND RENEWABLE POTENTIAL ANALYSISCumulative Annual Savings at Generation
ZONE A TECHNICAL POTENTIAL 2007 2012 2022
Measure Name
Measure ID1
(e.g., Bldg type)
Measure ID2
(e.g., End Use)
Measure ID3
(e.g., Market:
Retrofit, NC, ROB) Annual MWh
Summer Peak MW
Winter Peak MW Annual MWh
Summer Peak MW
Winter Peak MW Annual MWh
Summer Peak MW
Winter Peak MW
Biomass Direct-Fire Biomass Zone A - WTech - - - - 0.00 0.00 - 0.00 0.00Biomass Cofiring w/ Coal Biomass Zone A - WTech 2,139,056 351.80 357.53 2,186,725 359.64 365.50 2,573,705 423.28 430.18Biomass Gasification Biomass Zone A - WTech 228,213 35.66 36.24 218,640 34.16 34.72 239,391 37.40 38.01Biomass CHP Biomass Zone A - WTech 12,421 1.64 1.66 22,159 2.92 2.97 44,650 5.89 5.98
Biomass Sub Total 2,379,690 389 395 2,427,525 397 403 2,857,746 467 474
Fuel Cell PEM FuelCell Zone A - WTech 527 0.07 0.07 30,556 3.96 4.31 293,580 38.07 41.38Fuel Cell PAFC FuelCell Zone A - WTech 14,133 1.71 1.71 134,912 16.31 16.31 515,640 62.32 62.32Fuel Cell SOFC FuelCell Zone A - WTech 18,808 2.27 2.27 142,754 17.25 17.25 894,394 108.10 108.10Fuel Cell MCFC FuelCell Zone A - WTech 54,737 6.62 6.62 415,667 50.24 50.24 4,194,510 506.99 506.99
Fuel Cell Sub Total 88,205 11 11 723,890 88 88 5,898,124 715 719
Hydro Relicense Hydro Zone A - WTech 572,600 40.14 52.41 572,600 40.14 52.41 572,600 40.14 52.41Hydro Repower Hydro Zone A - WTech - - - - 0.00 0.00 - 0.00 0.00Hydro Ex Capacity Ex Dam Hydro Zone A - WTech 720 0.13 0.17 5,218 0.92 1.20 13,315 2.35 3.06Hydro New Capacity Ex Dam Hydro Zone A - WTech 218 0.03 0.03 218 0.03 0.03 218 0.03 0.03Hydro New Dam sites Hydro Zone A - WTech 128,200 10.09 13.18 929,452 73.18 95.54 2,371,706 186.73 243.78
Hydro Sub Total 701,738 50 66 1,507,488 114 149 2,957,839 229 299
LFG Large Systems LFG Zone A - WTech 1,406 0.19 0.19 2,122 0.28 0.28 3,878 0.52 0.52LFG Engines LFG Zone A - WTech 53,319 7.14 7.14 62,598 8.39 8.39 92,025 12.33 12.33LFG Microturbines LFG Zone A - WTech 1,099 0.15 0.15 1,764 0.24 0.24 3,362 0.45 0.45
LFG Sub Total 55,824 7 7 66,484 9 9 99,265 13 13
PV Residential PV Zone A - WTech 7,407 1.91 0.51 63,719 16.41 4.34 2,708,805 697.68 184.68PV C&I with solar load control PV Zone A - WTech - - - - 0.00 0.00 - 0.00 0.00PV C&I no load control PV Zone A - WTech 9,418 2.42 0.54 75,118 19.28 4.28 3,230,331 829.12 184.25PV BIPV PV Zone A - WTech 469 0.07 0.06 3,400 0.49 0.45 96,977 13.98 12.91
PV Sub Total 17,294 4 1 142,237 36 9 6,036,112 1,541 382
Res DHW Stherm Zone A - WTech 130,416 59.60 28.50 144,067 65.84 31.49 157,824 72.13 34.49Com DHW Stherm Zone A - WTech 34,840 9.90 4.73 34,973 9.94 4.75 32,968 9.37 4.48C&I Vent Pre Heat Stherm Zone A - WTech 40,091 - 6.93 41,476 0.00 7.17 43,454 0.00 7.51Solar Absorp Cool Stherm Zone A - WTech 35,217 24.48 - 79,239 55.07 0.00 167,282 116.26 0.00
Solar Thermal Sub Total 240,564 94 40 299,755 131 43 401,527 198 46
Wind Farm Installations Wind Zone A - WTech 407,176 32.74 77.54 809,448 65.09 154.15 3,185,219 256.12 606.60Cluster Installations Wind Zone A - WTech 54,618 4.44 10.51 212,041 17.23 40.80 2,881,183 234.06 554.35Small Wind Installations Wind Zone A - WTech 17,724 1.43 2.73 38,970 3.15 5.99 95,653 7.74 14.71Offshore Wind Installations Wind Zone A - WTech 159,731 12.19 28.87 702,045 53.58 126.89 9,592,074 732.01 1,733.70
Wind Sub Total 639,248 51 120 1,762,504 139 328 15,754,129 1,230 2,909
WTE Large WTE Zone A - WTech - - - - 0.00 0.00 - 0.00 0.00WTE Small WTE Zone A - WTech - - - - 0.00 0.00 - 0.00 0.00Solid Waste Digestion WTE Zone A - WTech - - - - 0.00 0.00 - 0.00 0.00
WTE Sub Total - - - - - - - - -
TOTAL 4,122,563 607 640 6,929,884 914 1,030 34,004,742 4,393 4,843
NYSERDA Renewable Resource Potential Study Summary Results Renewable Technical Appendix Draft Final.xls, 8/19/2003

Table 6.5.3
NEW YORK STATE ENERGY RESEARCH AND DEVELOPMENT AUTHORITYSTATEWIDE ENERGY-EFFICIENCY AND RENEWABLE POTENTIAL ANALYSISCumulative Annual Savings at Generation
ZONE F TECHNICAL POTENTIAL 2007 2012 2022
Measure Name
Measure ID1
(e.g., Bldg type)
Measure ID2
(e.g., End Use)
Measure ID3
(e.g., Market:
Retrofit, NC, ROB) Annual MWh
Summer Peak MW
Winter Peak MW Annual MWh
Summer Peak MW
Winter Peak MW Annual MWh
Summer Peak MW
Winter Peak MW
Biomass Direct-Fire Biomass Zone F - CTech - - - - 0.00 0.00 - 0.00 0.00Biomass Cofiring w/ Coal Biomass Zone F - CTech - - - - 0.00 0.00 - 0.00 0.00Biomass Gasification Biomass Zone F - CTech 30,494 4.76 4.84 29,211 4.56 4.64 31,987 5.00 5.08Biomass CHP Biomass Zone F - CTech 4,143 0.55 0.56 7,389 0.97 0.99 14,886 1.96 2.00
Biomass Sub Total 34,637 5 5 36,600 6 6 46,873 7 7
Fuel Cell PEM FuelCell Zone F - CTech 358 0.05 0.05 20,755 2.69 2.93 199,410 25.86 28.11Fuel Cell PAFC FuelCell Zone F - CTech 9,757 1.18 1.18 92,793 11.21 11.21 354,503 42.84 42.84Fuel Cell SOFC FuelCell Zone F - CTech 12,809 1.55 1.55 97,220 11.75 11.75 609,113 73.62 73.62Fuel Cell MCFC FuelCell Zone F - CTech 37,200 4.50 4.50 282,492 34.14 34.14 2,850,638 344.55 344.55
Fuel Cell Sub Total 60,124 7 7 493,261 60 60 4,013,663 487 489
Hydro Relicense Hydro Zone F - CTech 572,600 40.14 52.41 572,600 40.14 52.41 572,600 40.14 52.41Hydro Repower Hydro Zone F - CTech - - - - 0.00 0.00 - 0.00 0.00Hydro Ex Capacity Ex Dam Hydro Zone F - CTech 8,906 1.57 2.05 64,566 11.38 14.86 164,756 29.04 37.91Hydro New Capacity Ex Dam Hydro Zone F - CTech 35,100 4.29 5.60 254,478 31.10 40.60 649,362 79.35 103.59Hydro New Dam sites Hydro Zone F - CTech 35,586 2.80 3.66 258,011 20.31 26.52 658,372 51.83 67.67
Hydro Sub Total 652,192 49 64 1,149,655 103 134 2,045,089 200 262
LFG Large Systems LFG Zone F - CTech 990 0.13 0.13 1,157 0.15 0.15 1,398 0.19 0.19LFG Engines LFG Zone F - CTech 37,524 5.03 5.03 34,195 4.58 4.58 33,230 4.45 4.45LFG Microturbines LFG Zone F - CTech 774 0.10 0.10 965 0.13 0.13 1,215 0.16 0.16
LFG Sub Total 39,288 5 5 36,317 5 5 35,843 5 5
PV Residential PV Zone F - CTech 6,242 1.37 0.40 45,253 9.90 2.87 1,894,385 414.40 120.31PV C&I with solar load control PV Zone F - CTech - - - - 0.00 0.00 - 0.00 0.00PV C&I no load control PV Zone F - CTech 6,542 1.46 0.35 52,334 11.65 2.82 2,253,642 501.49 121.57PV BIPV PV Zone F - CTech 351 0.06 0.04 2,429 0.40 0.27 69,003 11.26 7.74
PV Sub Total 13,135 3 1 100,016 22 6 4,217,030 927 250
Res DHW Stherm Zone F - CTech 85,119 36.10 17.26 93,420 39.62 18.95 101,785 43.17 20.64Com DHW Stherm Zone F - CTech 25,588 6.75 3.23 25,924 6.83 3.27 24,587 6.48 3.10C&I Vent Pre Heat Stherm Zone F - CTech 27,556 - 4.37 28,508 0.00 4.52 29,867 0.00 4.73Solar Absorp Cool Stherm Zone F - CTech 24,400 15.55 - 54,901 34.98 0.00 115,902 73.84 0.00
Solar Thermal Sub Total 162,664 58 25 202,753 81 27 272,142 123 28
Wind Farm Installations Wind Zone F - CTech 4,735 0.38 0.90 9,410 0.76 1.79 37,037 2.98 7.05Cluster Installations Wind Zone F - CTech 635 0.05 0.12 2,465 0.20 0.47 33,502 2.72 6.45Small Wind Installations Wind Zone F - CTech 5,313 0.43 0.82 11,686 0.95 1.80 28,687 2.32 4.41Offshore Wind Installations Wind Zone F - CTech - - - - 0.00 0.00 - 0.00 0.00
Wind Sub Total 10,683 1 2 23,562 2 4 99,226 8 18
WTE Large WTE Zone F - CTech - - - - 0.00 0.00 - 0.00 0.00WTE Small WTE Zone F - CTech - - - - 0.00 0.00 - 0.00 0.00Solid Waste Digestion WTE Zone F - CTech - - - - 0.00 0.00 - 0.00 0.00
WTE Sub Total - - - - - - - - -
TOTAL 972,723 129 109 2,042,165 278 242 10,729,865 1,758 1,059
NYSERDA Renewable Resource Potential Study Summary Results Renewable Technical Appendix Draft Final.xls, 8/19/2003

Table 6.5.4
NEW YORK STATE ENERGY RESEARCH AND DEVELOPMENT AUTHORITYSTATEWIDE ENERGY-EFFICIENCY AND RENEWABLE POTENTIAL ANALYSISCumulative Annual Savings at Generation
ZONE G TECHNICAL POTENTIAL 2007 2012 2022
Measure Name
Measure ID1
(e.g., Bldg type)
Measure ID2
(e.g., End Use)
Measure ID3
(e.g., Market:
Retrofit, NC, ROB) Annual MWh
Summer Peak MW
Winter Peak MW Annual MWh
Summer Peak MW
Winter Peak MW Annual MWh
Summer Peak MW
Winter Peak MW
Biomass Direct-Fire Biomass Zone G - LTech - - - - 0.00 0.00 - 0.00 0.00Biomass Cofiring w/ Coal Biomass Zone G - LTech 665,348 109.43 111.21 746,922 122.84 124.84 854,440 140.52 142.81Biomass Gasification Biomass Zone G - LTech - - - - 0.00 0.00 - 0.00 0.00Biomass CHP Biomass Zone G - LTech - - - - 0.00 0.00 - 0.00 0.00
Biomass Sub Total 665,348 109 111 746,922 123 125 854,440 141 143
Fuel Cell PEM FuelCell Zone G - LTech 432 0.06 0.06 24,928 3.23 3.51 239,486 31.05 33.76Fuel Cell PAFC FuelCell Zone G - LTech 8,970 1.08 1.08 90,496 10.94 10.94 348,057 42.07 42.07Fuel Cell SOFC FuelCell Zone G - LTech 10,701 1.29 1.29 81,222 9.82 9.82 508,879 61.50 61.50Fuel Cell MCFC FuelCell Zone G - LTech 25,509 3.08 3.08 193,709 23.41 23.41 1,954,723 236.27 236.27
Fuel Cell Sub Total 45,611 6 6 390,355 47 48 3,051,145 371 374
Hydro Relicense Hydro Zone G - LTech - - - - 0.00 0.00 - 0.00 0.00Hydro Repower Hydro Zone G - LTech - - - - 0.00 0.00 - 0.00 0.00Hydro Ex Capacity Ex Dam Hydro Zone G - LTech - - - - 0.00 0.00 - 0.00 0.00Hydro New Capacity Ex Dam Hydro Zone G - LTech 4,733 0.58 0.76 34,321 4.19 5.48 87,577 10.70 13.97Hydro New Dam sites Hydro Zone G - LTech 14,063 1.11 1.45 193,718 15.25 19.91 489,568 38.54 50.32
Hydro Sub Total 18,796 2 2 228,039 19 25 577,146 49 64
LFG Large Systems LFG Zone G - LTech 524 0.07 0.07 383 0.05 0.05 141 0.02 0.02LFG Engines LFG Zone G - LTech 19,948 2.67 2.67 11,318 1.52 1.52 3,462 0.46 0.46LFG Microturbines LFG Zone G - LTech 416 0.06 0.06 325 0.04 0.04 125 0.02 0.02
LFG Sub Total 20,888 3 3 12,025 2 2 3,728 0 0
PV Residential PV Zone G - LTech 6,395 1.67 0.31 49,559 12.97 2.39 2,121,444 555.40 102.31PV C&I with solar load control PV Zone G - LTech - - - - 0.00 0.00 - 0.00 0.00PV C&I no load control PV Zone G - LTech 6,697 1.81 0.26 58,601 15.83 2.32 2,523,190 681.70 99.76PV BIPV PV Zone G - LTech 384 0.08 0.07 2,658 0.54 0.49 75,509 15.40 13.86
PV Sub Total 13,476 4 1 110,818 29 5 4,720,143 1,253 216
Res DHW Stherm Zone G - LTech 116,318 48.19 23.05 127,661 52.89 25.29 139,092 57.62 27.56Com DHW Stherm Zone G - LTech 24,121 6.21 2.97 25,391 6.54 3.13 26,989 6.95 3.32C&I Vent Pre Heat Stherm Zone G - LTech 13,238 - 3.43 13,696 0.00 3.55 14,349 0.00 3.72Solar Absorp Cool Stherm Zone G - LTech 38,020 29.97 - 85,545 67.43 0.00 180,595 142.36 0.00
Solar Thermal Sub Total 191,697 84 29 252,293 127 32 361,025 207 35
Wind Farm Installations Wind Zone G - LTech - - - - 0.00 0.00 - 0.00 0.00Cluster Installations Wind Zone G - LTech - - - - 0.00 0.00 - 0.00 0.00Small Wind Installations Wind Zone G - LTech 2,885 0.23 0.44 6,337 0.51 0.97 15,547 1.26 2.39Offshore Wind Installations Wind Zone G - LTech - - - - 0.00 0.00 - 0.00 0.00
Wind Sub Total 2,885 0 0 6,337 1 1 15,547 1 2
WTE Large WTE Zone G - LTech - - - - 0.00 0.00 - 0.00 0.00WTE Small WTE Zone G - LTech - - - - 0.00 0.00 - 0.00 0.00Solid Waste Digestion WTE Zone G - LTech - - - - 0.00 0.00 - 0.00 0.00
WTE Sub Total - - - - - - - - -
TOTAL 958,701 208 152 1,746,789 348 238 9,583,173 2,022 834
NYSERDA Renewable Resource Potential Study Summary Results Renewable Technical Appendix Draft Final.xls, 8/19/2003

Table 6.5.5
NEW YORK STATE ENERGY RESEARCH AND DEVELOPMENT AUTHORITYSTATEWIDE ENERGY-EFFICIENCY AND RENEWABLE POTENTIAL ANALYSISCumulative Annual Savings at Generation
ZONE J TECHNICAL POTENTIAL 2007 2012 2022
Measure Name
Measure ID1
(e.g., Bldg type)
Measure ID2
(e.g., End Use)
Measure ID3
(e.g., Market:
Retrofit, NC, ROB) Annual MWh
Summer Peak MW
Winter Peak MW Annual MWh
Summer Peak MW
Winter Peak MW Annual MWh
Summer Peak MW
Winter Peak MW
Biomass Direct-Fire Biomass Zone J - N Tech - - - - 0.00 0.00 - 0.00 0.00Biomass Cofiring w/ Coal Biomass Zone J - N Tech - - - - 0.00 0.00 - 0.00 0.00Biomass Gasification Biomass Zone J - N Tech 658,773 102.93 104.60 631,141 98.61 100.22 691,038 107.97 109.73Biomass CHP Biomass Zone J - N Tech - - - - 0.00 0.00 - 0.00 0.00
Biomass Sub Total 658,773 103 105 631,141 99 100 691,038 108 110
Fuel Cell PEM FuelCell Zone J - N Tech 1,643 0.21 0.23 95,324 12.36 13.44 915,870 118.76 129.09Fuel Cell PAFC FuelCell Zone J - N Tech 89,971 10.87 10.87 769,353 92.98 92.98 2,900,477 350.55 350.55Fuel Cell SOFC FuelCell Zone J - N Tech 53,991 6.53 6.53 409,802 49.53 49.53 2,567,527 310.31 310.31Fuel Cell MCFC FuelCell Zone J - N Tech 10,629 1.28 1.28 80,712 9.76 9.76 814,468 98.44 98.44
Fuel Cell Sub Total 156,233 19 19 1,355,191 165 166 7,198,342 878 888
Hydro Relicense Hydro Zone J - N Tech - - - - 0.00 0.00 - 0.00 0.00Hydro Repower Hydro Zone J - N Tech - - - - 0.00 0.00 - 0.00 0.00Hydro Ex Capacity Ex Dam Hydro Zone J - N Tech - - - - 0.00 0.00 - 0.00 0.00Hydro New Capacity Ex Dam Hydro Zone J - N Tech - - - - 0.00 0.00 - 0.00 0.00Hydro New Dam sites Hydro Zone J - N Tech 571 0.04 0.06 4,140 0.33 0.43 10,564 0.83 1.09
Hydro Sub Total 571 0 0 4,140 0 0 10,564 1 1
LFG Large Systems LFG Zone J - N Tech 782 0.10 0.10 216 0.03 0.03 58 0.01 0.01LFG Engines LFG Zone J - N Tech 11,767 1.58 1.58 6,400 0.86 0.86 1,348 0.18 0.18LFG Microturbines LFG Zone J - N Tech 241 0.03 0.03 183 0.02 0.02 50 0.01 0.01
LFG Sub Total 12,791 2 2 6,799 1 1 1,456 0 0
PV Residential PV Zone J - N Tech 16,369 5.07 1.65 135,866 42.06 13.72 5,786,600 1,791.50 584.18PV C&I with solar load control PV Zone J - N Tech - - - - 0.00 0.00 - 0.00 0.00PV C&I no load control PV Zone J - N Tech 20,542 6.49 1.72 160,911 50.84 13.49 6,871,241 2,171.03 575.99PV BIPV PV Zone J - N Tech 1,053 0.21 0.08 7,290 1.45 0.58 207,757 41.20 16.48
PV Sub Total 37,965 12 3 304,068 94 28 12,865,598 4,004 1,177
Res DHW Stherm Zone J - N Tech 141,352 57.28 27.39 155,137 62.86 30.07 169,028 68.49 32.76Com DHW Stherm Zone J - N Tech 18,288 4.61 2.20 19,674 4.96 2.37 21,871 5.51 2.63C&I Vent Pre Heat Stherm Zone J - N Tech 29,781 - 3.43 30,810 0.00 3.55 32,278 0.00 3.72Solar Absorp Cool Stherm Zone J - N Tech 519,043 491.88 - 1,167,848 1,106.73 0.00 2,465,456 2,336.43 0.00
Solar Thermal Sub Total 708,464 554 33 1,373,467 1,175 36 2,688,634 2,410 39
Wind Farm Installations Wind Zone J - N Tech - - - - 0.00 0.00 - 0.00 0.00Cluster Installations Wind Zone J - N Tech - - - - 0.00 0.00 - 0.00 0.00Small Wind Installations Wind Zone J - N Tech 3,118 0.25 0.48 6,859 0.56 1.06 16,841 1.36 2.59Offshore Wind Installations Wind Zone J - N Tech - - - - 0.00 0.00 - 0.00 0.00
Wind Sub Total 3,118 0 0 6,859 1 1 16,841 1 3
WTE Large WTE Zone J - N Tech - - - 633,304 84.85 84.85 1,324,862 177.51 177.51WTE Small WTE Zone J - N Tech - - - - 0.00 0.00 - 0.00 0.00Solid Waste Digestion WTE Zone J - N Tech - - - 48,331 6.47 6.47 95,830 12.82 12.82
WTE Sub Total - - - 681,636 91 91 1,420,692 190 190
TOTAL 1,577,914 689 162 4,363,300 1,625 423 24,893,164 7,593 2,408
NYSERDA Renewable Resource Potential Study Summary Results Renewable Technical Appendix Draft Final.xls, 8/19/2003

Table 6.5.6
NEW YORK STATE ENERGY RESEARCH AND DEVELOPMENT AUTHORITYSTATEWIDE ENERGY-EFFICIENCY AND RENEWABLE POTENTIAL ANALYSISCumulative Annual Savings at Generation
ZONE K TECHNICAL POTENTIAL 2007 2012 2022
Measure Name
Measure ID1
(e.g., Bldg type)
Measure ID2
(e.g., End Use)
Measure ID3
(e.g., Market:
Retrofit, NC, ROB) Annual MWh
Summer Peak MW
Winter Peak MW Annual MWh
Summer Peak MW
Winter Peak MW Annual MWh
Summer Peak MW
Winter Peak MW
Biomass Direct-Fire Biomass Zone K - L Base - - - - 0.00 0.00 - 0.00 0.00Biomass Cofiring w/ Coal Biomass Zone K - L Base - - - - 0.00 0.00 - 0.00 0.00Biomass Gasification Biomass Zone K - L Base 1,177 0.18 0.19 1,128 0.18 0.18 1,233 0.19 0.20Biomass CHP Biomass Zone K - L Base - - - - 0.00 0.00 - 0.00 0.00
Biomass Sub Total 1,177 0 0 1,128 0 0 1,233 0 0
Fuel Cell PEM FuelCell Zone K - L Base 914 0.12 0.13 52,981 6.87 7.47 509,028 66.01 71.75Fuel Cell PAFC FuelCell Zone K - L Base 22,513 2.72 2.72 218,779 26.44 26.44 837,915 101.27 101.27Fuel Cell SOFC FuelCell Zone K - L Base 18,321 2.21 2.21 139,062 16.81 16.81 871,263 105.30 105.30Fuel Cell MCFC FuelCell Zone K - L Base 19,131 2.31 2.31 145,282 17.56 17.56 1,466,042 177.20 177.20
Fuel Cell Sub Total 60,879 7 7 556,103 68 68 3,684,248 450 456
Hydro Relicense Hydro Zone K - L Base - - - - 0.00 0.00 - 0.00 0.00Hydro Repower Hydro Zone K - L Base - - - - 0.00 0.00 - 0.00 0.00Hydro Ex Capacity Ex Dam Hydro Zone K - L Base - - - - 0.00 0.00 - 0.00 0.00Hydro New Capacity Ex Dam Hydro Zone K - L Base - - - - 0.00 0.00 - 0.00 0.00Hydro New Dam Sites Hydro Zone K - L Base - - - - 0.00 0.00 - 0.00 0.00
Hydro Sub Total - - - - - - - - -
LFG Large Systems LFG Zone K - L Base 1,157 - - 741 0.00 0.00 208 0.00 0.00LFG Engines LFG Zone K - L Base 43,932 - - 21,712 0.00 0.00 4,860 0.00 0.00LFG Microturbines LFG Zone K - L Base 899 - - 616 0.00 0.00 175 0.00 0.00
LFG Sub Total 45,987 - - 23,069 - - 5,243 - -
PV Residential PV Zone K - L Base 14,724 4.46 0.59 114,522 34.70 4.63 4,860,652 1,472.94 196.39PV C&I with solar load control PV Zone K - L Base - - - - 0.00 0.00 - 0.00 0.00PV C&I no load control PV Zone K - L Base 17,120 5.19 0.55 135,250 40.98 4.36 5,774,676 1,749.87 186.16PV BIPV PV Zone K - L Base 878 0.14 0.11 6,076 0.97 0.73 172,970 27.67 20.75
PV Sub Total 32,723 10 1 255,849 77 10 10,808,298 3,250 403
Res DHW Stherm Zone K - L Base 285,093 115.99 55.48 312,895 127.31 60.89 340,912 138.70 66.34Com DHW Stherm Zone K - L Base 71,873 18.18 8.69 75,657 19.14 9.15 80,418 20.34 9.73C&I Vent Pre Heat Stherm Zone K - L Base 39,687 - 6.86 41,059 0.00 7.10 43,016 0.00 7.44Solar Absorp Cool Stherm Zone K - L Base 110,654 100.40 - 248,971 225.91 0.00 525,605 476.92 0.00
Solar Thermal Sub Total 507,307 235 71 678,582 372 77 989,952 636 84
Wind Farm Installations Wind Zone K - L Base 72,913 5.86 13.89 144,946 11.65 27.60 570,376 45.86 108.62Cluster Installations Wind Zone K - L Base 9,781 0.79 1.88 37,970 3.08 7.31 515,933 41.91 99.27Small Wind Installations Wind Zone K - L Base 11,129 0.90 1.71 24,477 1.98 3.77 60,089 4.87 9.25Offshore Wind Installations Wind Zone K - L Base 296,643 22.64 53.62 1,303,798 99.50 235.65 18,088,524 1,380.40 3,269.38
Wind Sub Total 390,466 30 71 1,511,191 116 274 19,234,923 1,473 3,487
WTE Large WTE Zone K - L Base - - - - 0.00 0.00 - 0.00 0.00WTE Small WTE Zone K - L Base - - - - 0.00 0.00 - 0.00 0.00Solid Waste Digestion WTE Zone K - L Base - - - - 0.00 0.00 - 0.00 0.00
WTE Sub Total - - - - - - - - -
TOTAL 1,038,540 282 151 3,025,922 633 430 34,723,897 5,809 4,429
NYSERDA Renewable Resource Potential Study Summary Results Renewable Technical Appendix Draft Final.xls, 8/19/2003

Table 6.5.7
NEW YORK STATE ENERGY RESEARCH AND DEVELOPMENT AUTHORITYSTATEWIDE ENERGY-EFFICIENCY AND RENEWABLE POTENTIAL ANALYSIS
ECONOMIC POTENTIAL SUMMARY - (HI Avoided Costs) 2007 2012 2022
Annual MWhSummer Peak MW Winter Peak MW Annual MWh
Summer Peak MW Winter Peak MW Annual MWh
Summer Peak MW Winter Peak MW
Biopower Biomass Direct-Fire - - - - - - - - - Biomass Cofiring w/ Coal 3,890,752 640 650 4,045,013 665 676 4,778,899 786 799 Biomass Gasification 1,151,067 180 183 1,102,782 172 175 1,207,447 189 192 Biomass CHP 99,362 13 13 177,296 23 24 357,216 47 48 Biomass Sub Total 5,141,182 833 846 5,325,091 861 875 6,343,561 1,022 1,038
Fuel CellsFuel Cell PEM - - - - - - - - - Fuel Cell PAFC - - - - - - - - - Fuel Cell SOFC - - - - - - - - - Fuel Cell MCFC - - - - - - - - - Fuel Cell Sub Total - - - - - - - - -
Hydro PowerHydro Relicense 1,145,200 80 105 1,145,200 80 105 1,145,200 80 105 Hydro Repower 394,200 120 157 441,465 135 176 536,576 164 214 Hydro Ex Capacity Ex Dam 43,418 8 10 260,503 46 60 651,255 115 150 Hydro New Capacity Ex Dam 165,104 20 26 990,634 121 158 2,476,588 303 395 Hydro New Dam sites 366,727 29 38 2,200,374 173 226 5,500,934 433 565 Hydro Sub Total 2,114,649 257 336 5,038,176 555 725 10,310,553 1,095 1,429
Landfill GasLFG Large Systems - - - - - - - - - LFG Engines 438,919 59 59 406,563 54 54 418,963 56 56 LFG Microturbines - - - - - - - - - LFG Sub Total 438,919 59 59 406,563 54 54 418,963 56 56
Municipal Solid WasteWTE Large - - - 633,304 85 85 1,324,862 178 178 WTE Small - - - - - - - - - Solid Waste Digestion - - - 48,268 6 6 95,703 13 13 WTE Sub Total - - - 681,572 91 91 1,420,565 190 190
PhotovoltaicsPV Residential - - - - - - - - - PV C&I no load control - - - - - - - - - PV BIPV - - - - - - - - - PV Sub Total - - - - - - - - -
Solar ThermalRes DHW - - - - - - - - - Com DHW - - - - - - - - - C&I Vent Pre Heat 174,567 - 30 180,599 - 31 189,209 - 33 Solar Absorp Cool - - - - - - - - - Solar Thermal Sub Total 174,567 - 30 180,599 - 31 189,209 - 33
WindWind Farm Installations 309,790 25 59 1,245,306 100 237 7,437,364 598 1,416 Cluster Installations 127,017 10 24 493,119 40 95 6,700,426 544 1,289 Small Wind Installations - - - - - - - - - Offshore Wind Installations 456,374 35 82 2,005,844 153 363 27,680,599 2,112 5,003 Wind Sub Total 893,182 70 166 3,744,269 293 695 41,818,388 3,255 7,709
TOTAL 8,762,499 1,219 1,437 15,376,270 1,855 2,472 60,501,239 5,618 10,455 Percent of Technical Potential 70% 44% 76% 59% 36% 68% 38% 19% 55%
NYSERDA Renewable Resource Potential Study Summary Results Renewable Technical Appendix Draft Final.xls, 8/19/2003

Table 6.5.8
NEW YORK STATE ENERGY RESEARCH AND DEVELOPMENT AUTHORITYSTATEWIDE ENERGY-EFFICIENCY AND RENEWABLE POTENTIAL ANALYSIS
ECONOMIC POTENTIAL SUMMARY - (Lo Avoided Costs) 2007 2012 2022
Annual MWhSummer Peak MW Winter Peak MW Annual MWh
Summer Peak MW
Winter Peak MW Annual MWh
Summer Peak MW Winter Peak MW
Biopower Biomass D - - - - - - - - - Biomass C 3,890,752 640 650 4,045,013 665 676 4,778,899 786 799 Biomass G 1,151,067 180 183 1,102,782 172 175 1,207,447 189 192 Biomass C 99,362 13 13 177,296 23 24 357,216 47 48 Biomass S 5,141,182 833 846 5,325,091 861 875 6,343,561 1,022 1,038
Fuel CellsFuel Cell P - - - - - - - - - Fuel Cell P - - - - - - - - - Fuel Cell S - - - - - - - - - Fuel Cell M - - - - - - - - - Fuel Cell S - - - - - - - - -
Hydro PowerHydro Relic 1,145,200 80 105 1,145,200 80 105 1,145,200 80 105 Hydro Rep - - - - - - - - - Hydro Ex C - - - - - - - - - Hydro New - - - 990,634 121 158 2,476,588 303 395 Hydro New 366,727 29 38 2,200,374 173 226 5,500,934 433 565 Hydro Sub 1,511,927 109 143 4,336,208 375 489 9,122,722 816 1,065
Landfill GasLFG Large - - - - - - - - - LFG Engin - - - - - - - - - LFG Microt - - - - - - - - - LFG Sub T - - - - - - - - -
Municipal Solid WasteWTE Large - - - 633,304 85 85 1,324,862 178 178 WTE Smal - - - - - - - - - Solid Wast - - - 48,268 6 6 95,703 13 13 WTE Sub T - - - 681,572 91 91 1,420,565 190 190
PhotovoltaicsPV Reside - - - - - - - - - PV C&I wit - - - - - - - - - PV C&I no - - - - - - - - - PV BIPV - - - - - - - - - PV Sub To - - - - - - - - -
Solar ThermalRes DHW - - - - - - - - - Com DHW - - - - - - - - - C&I Vent P 174,567 - 30 180,599 - 31 189,209 - 33 Solar Abso - - - - - - - - - Solar Ther 174,567 - 30 180,599 - 31 189,209 - 33
WindWind Farm - - - 1,245,306 100 237 7,437,364 598 1,416 Cluster Ins - - - - - - 6,700,426 544 1,289 Small Wind - - - - - - - - - Offshore W - - - - - - 27,680,599 2,112 5,003 Wind Sub - - - 1,245,306 100 237 41,818,388 3,255 7,709
TOTAL 6,827,676 942 1,019 11,768,777 1,427 1,724 58,894,446 5,283 10,035 Percent of Technical Potential 55% 34% 54% 45% 28% 48% 37% 18% 53%
NYSERDA Renewable Resource Potential Study Summary Results Renewable Technical Appendix Draft Final.xls, 8/19/2003

Table 6.5.9
NEW YORK STATE ENERGY RESEARCH AND DEVELOPMENT AUTHORITYSTATEWIDE ENERGY-EFFICIENCY AND RENEWABLE POTENTIAL ANALYSISCumulative Annual Savings at GenerationECONOMIC POTENTIAL ZONE A
2007 2012 2022
Measure Name
Measure ID1
(e.g., Bldg type)
Measure ID2
(e.g., End Use)
Measure ID3
(e.g., Market:
Retrofit, NC, ROB) Annual MWh
Summer Peak MW
Winter Peak MW Annual MWh
Summer Peak MW
Winter Peak MW Annual MWh
Summer Peak MW
Winter Peak MW
Biomass Direct-Fire Biomass Zone A - WBase - - - - - - - - - Biomass Cofiring w/ Coal Biomass Zone A - WBase 2,139,056 352 358 2,186,725 360 365 2,573,705 423 430 Biomass Gasification Biomass Zone A - WBase 228,213 36 36 218,640 34 35 239,391 37 38 Biomass CHP Biomass Zone A - WBase 12,421 2 2 22,159 3 3 44,650 6 6
Biomass Sub Total 2,379,690 389 395 2,427,525 397 403 2,857,746 467 474
Fuel Cell PEM FuelCell Zone A - WBase - - - - - - - - - Fuel Cell PAFC FuelCell Zone A - WBase - - - - - - - - - Fuel Cell SOFC FuelCell Zone A - WBase - - - - - - - - - Fuel Cell MCFC FuelCell Zone A - WBase - - - - - - - - -
Fuel Cell Sub Total - - - - - - - - -
Hydro Relicense Hydro Zone A - WBase 572,600 40 52 572,600 40 52 572,600 40 52 Hydro Repower Hydro Zone A - WBase - - - - - - - - - Hydro Ex Capacity Ex DamHydro Zone A - WBase - - - - - - - - - Hydro New Capacity Ex DaHydro Zone A - WBase - - - - - - - - - Hydro New Dam Sites Hydro Zone A - WBase 128,200 10 13 929,452 73 96 2,371,706 187 244
Hydro Sub Total 700,800 50 66 1,502,052 113 148 2,944,306 227 296
LFG Large Systems LFG Zone A - WBase - - - - - - - - - LFG Engines LFG Zone A - WBase - - - - - - - - - LFG Microturbines LFG Zone A - WBase - - - - - - - - -
LFG Sub Total - - - - - - - - -
PV Residential PV Zone A - WBase - - - - - - - - - PV C&I with solar load con PV Zone A - WBase - - - - - - - - - PV C&I no load control PV Zone A - WBase - - - - - - - - - PV BIPV PV Zone A - WBase - - - - - - - - -
PV Sub Total - - - - - - - - -
Res DHW Stherm Zone A - WBase - - - - - - - - - Com DHW Stherm Zone A - WBase - - - - - - - - - C&I Vent Pre Heat Stherm Zone A - WBase - - - - - - - - - Solar Absorp Cool Stherm Zone A - WBase - - - - - - - - -
Solar Thermal Sub Total - - - - - - - - -
Wind Farm Installations Wind Zone A - WBase - - - - - - 3,185,219 256 607 Cluster Installations Wind Zone A - WBase - - - - - - - - - Small Wind Installations Wind Zone A - WBase - - - - - - - - - Offshore Wind Installations Wind Zone A - WBase - - - - - - - - -
Wind Sub Total - - - - - - 3,185,219 256 607
WTE Large WTE Zone A - WBase - - - - - - - - - WTE Small WTE Zone A - WBase - - - - - - - - - Solid Waste Digestion WTE Zone A - WBase - - - - - - - - -
WTE Sub Total - - - - - - - - -
TOTAL 3,080,490 439 461 3,929,577 510 551 8,987,270 950 1,377
NYSERDA Renewable Resource Potential Study Summary Results Renewable Technical Appendix Draft Final.xls, 8/19/2003
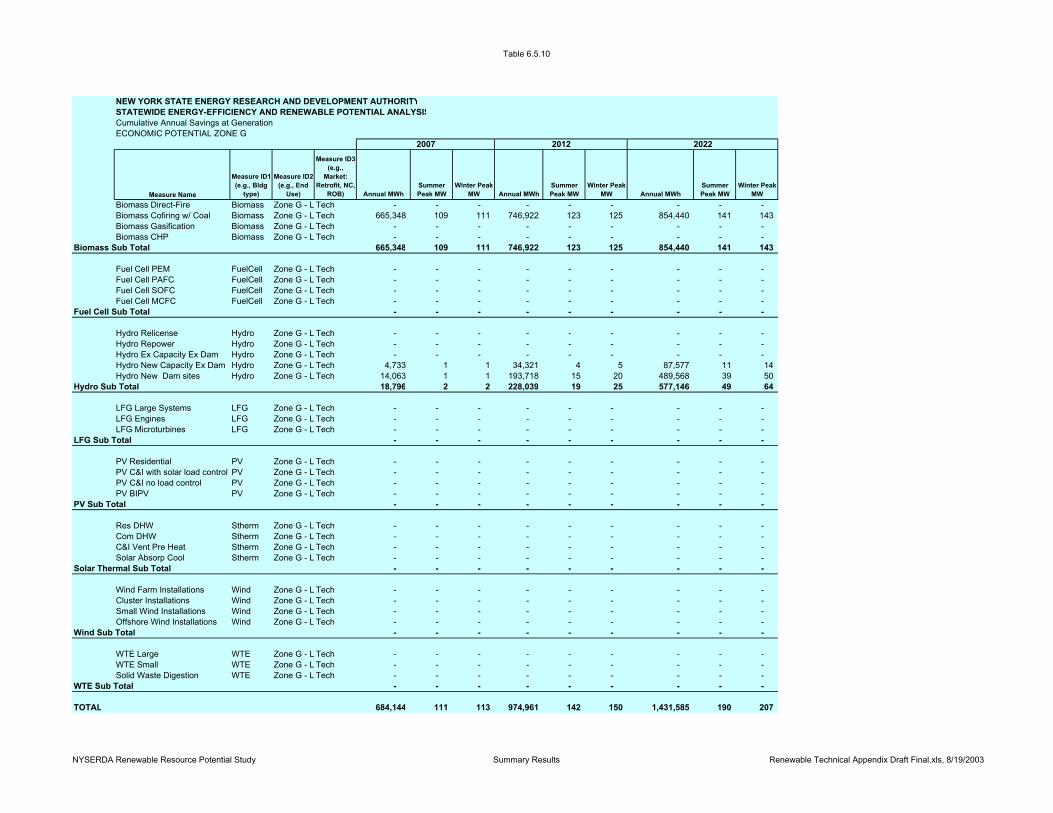
Table 6.5.10
NEW YORK STATE ENERGY RESEARCH AND DEVELOPMENT AUTHORITYSTATEWIDE ENERGY-EFFICIENCY AND RENEWABLE POTENTIAL ANALYSISCumulative Annual Savings at GenerationECONOMIC POTENTIAL ZONE G
2007 2012 2022
Measure Name
Measure ID1(e.g., Bldg
type)
Measure ID2 (e.g., End
Use)
Measure ID3(e.g.,
Market: Retrofit, NC,
ROB) Annual MWhSummer Peak MW
Winter Peak MW Annual MWh
Summer Peak MW
Winter Peak MW Annual MWh
Summer Peak MW
Winter Peak MW
Biomass Direct-Fire Biomass Zone G - L Tech - - - - - - - - - Biomass Cofiring w/ Coal Biomass Zone G - L Tech 665,348 109 111 746,922 123 125 854,440 141 143 Biomass Gasification Biomass Zone G - L Tech - - - - - - - - - Biomass CHP Biomass Zone G - L Tech - - - - - - - - -
Biomass Sub Total 665,348 109 111 746,922 123 125 854,440 141 143
Fuel Cell PEM FuelCell Zone G - L Tech - - - - - - - - - Fuel Cell PAFC FuelCell Zone G - L Tech - - - - - - - - - Fuel Cell SOFC FuelCell Zone G - L Tech - - - - - - - - - Fuel Cell MCFC FuelCell Zone G - L Tech - - - - - - - - -
Fuel Cell Sub Total - - - - - - - - -
Hydro Relicense Hydro Zone G - L Tech - - - - - - - - - Hydro Repower Hydro Zone G - L Tech - - - - - - - - - Hydro Ex Capacity Ex Dam Hydro Zone G - L Tech - - - - - - - - - Hydro New Capacity Ex Dam Hydro Zone G - L Tech 4,733 1 1 34,321 4 5 87,577 11 14 Hydro New Dam sites Hydro Zone G - L Tech 14,063 1 1 193,718 15 20 489,568 39 50
Hydro Sub Total 18,796 2 2 228,039 19 25 577,146 49 64
LFG Large Systems LFG Zone G - L Tech - - - - - - - - - LFG Engines LFG Zone G - L Tech - - - - - - - - - LFG Microturbines LFG Zone G - L Tech - - - - - - - - -
LFG Sub Total - - - - - - - - -
PV Residential PV Zone G - L Tech - - - - - - - - - PV C&I with solar load control PV Zone G - L Tech - - - - - - - - - PV C&I no load control PV Zone G - L Tech - - - - - - - - - PV BIPV PV Zone G - L Tech - - - - - - - - -
PV Sub Total - - - - - - - - -
Res DHW Stherm Zone G - L Tech - - - - - - - - - Com DHW Stherm Zone G - L Tech - - - - - - - - - C&I Vent Pre Heat Stherm Zone G - L Tech - - - - - - - - - Solar Absorp Cool Stherm Zone G - L Tech - - - - - - - - -
Solar Thermal Sub Total - - - - - - - - -
Wind Farm Installations Wind Zone G - L Tech - - - - - - - - - Cluster Installations Wind Zone G - L Tech - - - - - - - - - Small Wind Installations Wind Zone G - L Tech - - - - - - - - - Offshore Wind Installations Wind Zone G - L Tech - - - - - - - - -
Wind Sub Total - - - - - - - - -
WTE Large WTE Zone G - L Tech - - - - - - - - - WTE Small WTE Zone G - L Tech - - - - - - - - - Solid Waste Digestion WTE Zone G - L Tech - - - - - - - - -
WTE Sub Total - - - - - - - - -
TOTAL 684,144 111 113 974,961 142 150 1,431,585 190 207
NYSERDA Renewable Resource Potential Study Summary Results Renewable Technical Appendix Draft Final.xls, 8/19/2003

Table 6.5.11
NEW YORK STATE ENERGY RESEARCH AND DEVELOPMENT AUTHORITYSTATEWIDE ENERGY-EFFICIENCY AND RENEWABLE POTENTIAL ANALYSISCumulative Annual Savings at GenerationECONOMIC POTENTIAL ZONE G
2007 2012 2022
Measure Name
Measure ID1(e.g., Bldg
type)
Measure ID2 (e.g., End
Use)
Measure ID3(e.g.,
Market: Retrofit, NC,
ROB) Annual MWhSummer Peak MW
Winter Peak MW Annual MWh
Summer Peak MW
Winter Peak MW Annual MWh
Summer Peak MW
Winter Peak MW
Biomass Direct-Fire Biomass Zone G - L Tech - - - - - - - - - Biomass Cofiring w/ Coal Biomass Zone G - L Tech 665,348 109 111 746,922 123 125 854,440 141 143 Biomass Gasification Biomass Zone G - L Tech - - - - - - - - - Biomass CHP Biomass Zone G - L Tech - - - - - - - - -
Biomass Sub Total 665,348 109 111 746,922 123 125 854,440 141 143
Fuel Cell PEM FuelCell Zone G - L Tech - - - - - - - - - Fuel Cell PAFC FuelCell Zone G - L Tech - - - - - - - - - Fuel Cell SOFC FuelCell Zone G - L Tech - - - - - - - - - Fuel Cell MCFC FuelCell Zone G - L Tech - - - - - - - - -
Fuel Cell Sub Total - - - - - - - - -
Hydro Relicense Hydro Zone G - L Tech - - - - - - - - - Hydro Repower Hydro Zone G - L Tech - - - - - - - - - Hydro Ex Capacity Ex Dam Hydro Zone G - L Tech - - - - - - - - - Hydro New Capacity Ex Dam Hydro Zone G - L Tech 4,733 1 1 34,321 4 5 87,577 11 14 Hydro New Dam sites Hydro Zone G - L Tech 14,063 1 1 193,718 15 20 489,568 39 50
Hydro Sub Total 18,796 2 2 228,039 19 25 577,146 49 64
LFG Large Systems LFG Zone G - L Tech - - - - - - - - - LFG Engines LFG Zone G - L Tech - - - - - - - - - LFG Microturbines LFG Zone G - L Tech - - - - - - - - -
LFG Sub Total - - - - - - - - -
PV Residential PV Zone G - L Tech - - - - - - - - - PV C&I with solar load control PV Zone G - L Tech - - - - - - - - - PV C&I no load control PV Zone G - L Tech - - - - - - - - - PV BIPV PV Zone G - L Tech - - - - - - - - -
PV Sub Total - - - - - - - - -
Res DHW Stherm Zone G - L Tech - - - - - - - - - Com DHW Stherm Zone G - L Tech - - - - - - - - - C&I Vent Pre Heat Stherm Zone G - L Tech - - - - - - - - - Solar Absorp Cool Stherm Zone G - L Tech - - - - - - - - -
Solar Thermal Sub Total - - - - - - - - -
Wind Farm Installations Wind Zone G - L Tech - - - - - - - - - Cluster Installations Wind Zone G - L Tech - - - - - - - - - Small Wind Installations Wind Zone G - L Tech - - - - - - - - - Offshore Wind Installations Wind Zone G - L Tech - - - - - - - - -
Wind Sub Total - - - - - - - - -
WTE Large WTE Zone G - L Tech - - - - - - - - - WTE Small WTE Zone G - L Tech - - - - - - - - - Solid Waste Digestion WTE Zone G - L Tech - - - - - - - - -
WTE Sub Total - - - - - - - - -
TOTAL 684,144 111 113 974,961 142 150 1,431,585 190 207
NYSERDA Renewable Resource Potential Study Summary Results Renewable Technical Appendix Draft Final.xls, 8/19/2003

Table 6.5.12
NEW YORK STATE ENERGY RESEARCH AND DEVELOPMENT AUTHORITYSTATEWIDE ENERGY-EFFICIENCY AND RENEWABLE POTENTIAL ANALYSISCumulative Annual Savings at GenerationECONOMIC POTENTIAL ZONE J
2007 2012 2022
Measure Name
Measure ID1(e.g., Bldg
type)
Measure ID2 (e.g., End
Use)
Measure ID3(e.g.,
Market: Retrofit, NC,
ROB) Annual MWhSummer Peak MW
Winter Peak MW Annual MWh
Summer Peak MW
Winter Peak MW Annual MWh
Summer Peak MW
Winter Peak MW
Biomass Direct-Fire Biomass Zone J - NYTech - - - - - - - - - Biomass Cofiring w/ Coal Biomass Zone J - NYTech - - - - - - - - - Biomass Gasification Biomass Zone J - NYTech 658,773 103 105 631,141 99 100 691,038 108 110 Biomass CHP Biomass Zone J - NYTech - - - - - - - - -
Biomass Sub Total 658,773 103 105 631,141 99 100 691,038 108 110
Fuel Cell PEM FuelCell Zone J - NYTech - - - - - - - - - Fuel Cell PAFC FuelCell Zone J - NYTech - - - - - - - - - Fuel Cell SOFC FuelCell Zone J - NYTech - - - - - - - - - Fuel Cell MCFC FuelCell Zone J - NYTech - - - - - - - - -
Fuel Cell Sub Total - - - - - - - - -
Hydro Relicense Hydro Zone J - NYTech - - - - - - - - - Hydro Repower Hydro Zone J - NYTech - - - - - - - - - Hydro Ex Capacity Ex Dam Hydro Zone J - NYTech - - - - - - - - - Hydro New Capacity Ex Dam Hydro Zone J - NYTech - - - - - - - - - Hydro New Dam sites Hydro Zone J - NYTech 571 0 0 4,140 0 0 10,564 1 1
Hydro Sub Total 571 0 0 4,140 0 0 10,564 1 1
LFG Large Systems LFG Zone J - NYTech - - - - - - - - - LFG Engines LFG Zone J - NYTech - - - - - - - - - LFG Microturbines LFG Zone J - NYTech - - - - - - - - -
LFG Sub Total - - - - - - - - -
PV Residential PV Zone J - NYTech - - - - - - - - - PV C&I with solar load control PV Zone J - NYTech - - - - - - - - - PV C&I no load control PV Zone J - NYTech - - - - - - - - - PV BIPV PV Zone J - NYTech - - - - - - - - -
PV Sub Total - - - - - - - - -
Res DHW Stherm Zone J - NYTech - - - - - - - - - Com DHW Stherm Zone J - NYTech - - - - - - - - - C&I Vent Pre Heat Stherm Zone J - NYTech 29,781 - 3 30,810 - 4 32,278 - 4 Solar Absorp Cool Stherm Zone J - NYTech - - - - - - - - -
Solar Thermal Sub Total 29,781 - 3 30,810 - 4 32,278 - 4
Wind Farm Installations Wind Zone J - NYTech - - - - - - - - - Cluster Installations Wind Zone J - NYTech - - - - - - - - - Small Wind Installations Wind Zone J - NYTech - - - - - - - - - Offshore Wind Installations Wind Zone J - NYTech - - - - - - - - -
Wind Sub Total - - - - - - - - -
WTE Large WTE Zone J - NYTech - - - 633,304 85 85 1,324,862 178 178 WTE Small WTE Zone J - NYTech - - - - - - - - - Solid Waste Digestion WTE Zone J - NYTech - - - - - - 95,830 13 13
WTE Sub Total - - - 633,304 85 85 1,420,692 190 190
TOTAL 689,125 103 108 1,299,394 184 189 2,154,572 299 305
NYSERDA Renewable Resource Potential Study Summary Results Renewable Technical Appendix Draft Final.xls, 8/19/2003
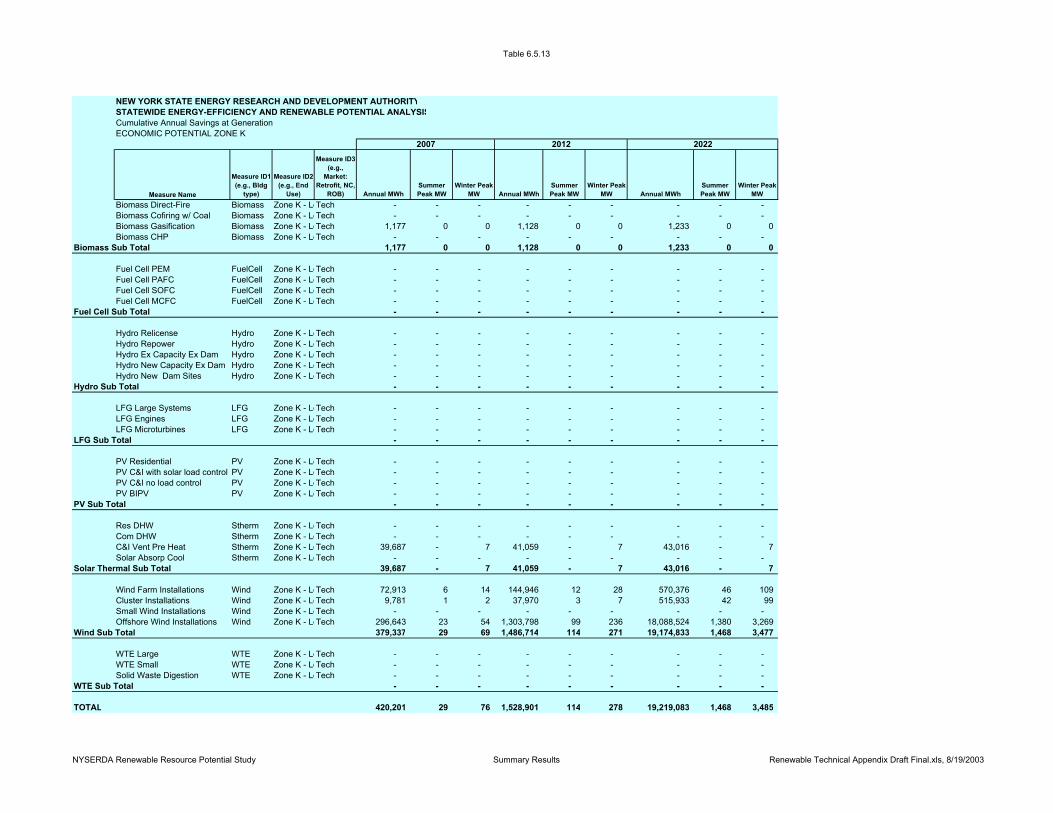
Table 6.5.13
NEW YORK STATE ENERGY RESEARCH AND DEVELOPMENT AUTHORITYSTATEWIDE ENERGY-EFFICIENCY AND RENEWABLE POTENTIAL ANALYSISCumulative Annual Savings at GenerationECONOMIC POTENTIAL ZONE K
2007 2012 2022
Measure Name
Measure ID1(e.g., Bldg
type)
Measure ID2 (e.g., End
Use)
Measure ID3(e.g.,
Market: Retrofit, NC,
ROB) Annual MWhSummer Peak MW
Winter Peak MW Annual MWh
Summer Peak MW
Winter Peak MW Annual MWh
Summer Peak MW
Winter Peak MW
Biomass Direct-Fire Biomass Zone K - LoTech - - - - - - - - - Biomass Cofiring w/ Coal Biomass Zone K - LoTech - - - - - - - - - Biomass Gasification Biomass Zone K - LoTech 1,177 0 0 1,128 0 0 1,233 0 0 Biomass CHP Biomass Zone K - LoTech - - - - - - - - -
Biomass Sub Total 1,177 0 0 1,128 0 0 1,233 0 0
Fuel Cell PEM FuelCell Zone K - LoTech - - - - - - - - - Fuel Cell PAFC FuelCell Zone K - LoTech - - - - - - - - - Fuel Cell SOFC FuelCell Zone K - LoTech - - - - - - - - - Fuel Cell MCFC FuelCell Zone K - LoTech - - - - - - - - -
Fuel Cell Sub Total - - - - - - - - -
Hydro Relicense Hydro Zone K - LoTech - - - - - - - - - Hydro Repower Hydro Zone K - LoTech - - - - - - - - - Hydro Ex Capacity Ex Dam Hydro Zone K - LoTech - - - - - - - - - Hydro New Capacity Ex Dam Hydro Zone K - LoTech - - - - - - - - - Hydro New Dam Sites Hydro Zone K - LoTech - - - - - - - - -
Hydro Sub Total - - - - - - - - -
LFG Large Systems LFG Zone K - LoTech - - - - - - - - - LFG Engines LFG Zone K - LoTech - - - - - - - - - LFG Microturbines LFG Zone K - LoTech - - - - - - - - -
LFG Sub Total - - - - - - - - -
PV Residential PV Zone K - LoTech - - - - - - - - - PV C&I with solar load control PV Zone K - LoTech - - - - - - - - - PV C&I no load control PV Zone K - LoTech - - - - - - - - - PV BIPV PV Zone K - LoTech - - - - - - - - -
PV Sub Total - - - - - - - - -
Res DHW Stherm Zone K - LoTech - - - - - - - - - Com DHW Stherm Zone K - LoTech - - - - - - - - - C&I Vent Pre Heat Stherm Zone K - LoTech 39,687 - 7 41,059 - 7 43,016 - 7 Solar Absorp Cool Stherm Zone K - LoTech - - - - - - - - -
Solar Thermal Sub Total 39,687 - 7 41,059 - 7 43,016 - 7
Wind Farm Installations Wind Zone K - LoTech 72,913 6 14 144,946 12 28 570,376 46 109 Cluster Installations Wind Zone K - LoTech 9,781 1 2 37,970 3 7 515,933 42 99 Small Wind Installations Wind Zone K - LoTech - - - - - - - - - Offshore Wind Installations Wind Zone K - LoTech 296,643 23 54 1,303,798 99 236 18,088,524 1,380 3,269
Wind Sub Total 379,337 29 69 1,486,714 114 271 19,174,833 1,468 3,477
WTE Large WTE Zone K - LoTech - - - - - - - - - WTE Small WTE Zone K - LoTech - - - - - - - - - Solid Waste Digestion WTE Zone K - LoTech - - - - - - - - -
WTE Sub Total - - - - - - - - -
TOTAL 420,201 29 76 1,528,901 114 278 19,219,083 1,468 3,485
NYSERDA Renewable Resource Potential Study Summary Results Renewable Technical Appendix Draft Final.xls, 8/19/2003
Related Documents