IOSR Journal of Environmental Science, Toxicology and Food Technology (IOSR-JESTFT) e-ISSN: 2319-2402,p- ISSN: 2319-2399.Volume 12, Issue 4 Ver. I (April. 2018), PP 51-70 www.iosrjournals.org DOI: 10.9790/2402-1204015170 www.iosrjournals.org 51 | Page Energy Dispersive X-Ray Fluorescence Elemental Analysis of Roasted and Non- Roasted Ethiopian Coffee Specialty H. Masresha Feleke 1,* , A. Srinivasulu 1 , K. Surendra 1 , B. Aruna 1 , Jaganmoy Biswas 2 , M. Sudershan 2 , A. D. P. Rao 1 , P. V. Lakshmi Narayana 1 1. Department of Nuclear Physics, Andhra University, Visakhapatnam 530003, Andhra Paradesh, India 2. UGC-DAE Consortium for Scientific Research, Trace element lab, Salt Lake, Kolkata 700 098, India Corresponding Author: H. Masresha Feleke1,*, Abstract: The aim of the present Investigation was to study the elemental concentration of coffee beans specialty in Ethiopia using energy dispersive x-ray florescence (EDXRF). It was found that the concentration of four major elements (P, K, Ca, S) and eight minor elements (Mn, Fe, Cu, Zn, Se, Sr, Rb, Br) from roasted and non-roasted coffee bean specialty. These samples was carried out at trace element laboratory UGC-DAE Consortium for Scientific Research, Kolkata Centre by using a Xenemetrix (erstwhile Jordan Valley) EX 3600 EDXRF spectrometer which consists of an X-ray tube with a Rh anode as the source of x-ray with a 50V, 1mA power supply, Si (Li) detector with a resolution of 143 ev at 5.9 kev and 10 sample pellets analyzing at a time. The quantitative analysis is carried out by the in- built software nEXT. The system detection calibration and accuracy check was performed through different countries reported values and analysis of certified reference materials NIST (SRM 1515) Apple leaves. The order of elements concentration from highest to lowest was K > Ca > P > S > Fe > Rb, > Mn > Cu > Zn, Sr > Br > Se for roasted and K > Ca > S > P > Fe > Rb, Mn > Cu > Zn, Sr > Br >Se for non-roasted. In addition to this researchers discussed the elemental concentration of both roasted and non- roasted coffee beans and their biological effects on human physiology. Keywords: Roasted and Non-roasted, Coffee specialty, EDXRF, Elemental Analysis, Addis Ababa. --------------------------------------------------------------------------------------------------------------------------------------- Date of Submission: 09-04-2018 Date of acceptance: 23-04-2018 --------------------------------------------------------------------------------------------------------------------------------------- I. Introduction Coffee is the fruit and dried seed of the coffee plant regardless of whether it has been toasted or ground of the plant of the genus Coffea, generally of the cultivated species, and the products of these in their different stages of the process and use intended for human consumption. It is one of the most consumed infusion drinks in the world and contains a large variety of chemical compounds responsible for their sensory qualities and their effects on the body [1]. Coffee is grown as two species: Cofea Arabica and Cofea Canephor. They are commonly known as Arabica and Robusta. These two major species are known in commerce. Some authors suggest that Arabica coffees originated in the mountain forests of Ethiopia. [2] Coffee is one of the most an important trade commodity in the Ethiopian economy as it contributes subsistence earnings of about 25% of the population, 30% of government direct revenue, and over 60% of the national foreign exchange earnings [3].The part of the coffee which is important for household consumption and commercial purposes is the bean, which naturally contains proteins, carbohydrates, vitamins and mineral substances [4]. Its active substance is the alkaloid caffeine. Effects of coffee on human health are still under strong debate. Some authors suggest that drinking two to four cups of coffee per day benefit health, reducing the risk of colon cancer, gallstones, liver cirrhosis and Parkinson’s disease, lower risk of diabetes type 2, decreased prevalence of some types of cancer [5, 6]. However, the chemical content of the coffee varies with coffee types and environment in which they are cultivated and also in raw and roasted coffee beans of the same coffee type collected from the same environment [4]. Due to the health benefits and economical relevance of coffee extensive research has been published, in particular regarding its elemental composition, of metals in green (raw) and roasted coffee varieties in different parts of the world [3] using many analytical techniques Several studies have been carried out on determinations. For instance, Vietnam Robusta Coffee was roasted at different roasting degree and roasting temperature and 9 element concentrations (K, Mg, Ca, Na, Fe, Cu, Mn, Zn and Pb) of roasted coffee were analyzed by Flame atomic absorption method (FAAS) in this study [7]. Thirty-seven coffee samples were characterized on the basis of metal concentrations. Sixteen elements including toxic and essential elements were determined by inductively coupled plasma-mass spectrometry [8]. Ca, Mg, Na, K, Fe, Mn, Zn, Cu, Ni, Co, Cr, Pb and Cd from different types of coffee; Jacobs-Aroma, Jacobes-Kronung, Doncafe-elite, Fort-Strong coffee and Nova Brasilia using

Welcome message from author
This document is posted to help you gain knowledge. Please leave a comment to let me know what you think about it! Share it to your friends and learn new things together.
Transcript
IOSR Journal of Environmental Science, Toxicology and Food Technology (IOSR-JESTFT)
e-ISSN: 2319-2402,p- ISSN: 2319-2399.Volume 12, Issue 4 Ver. I (April. 2018), PP 51-70
www.iosrjournals.org
DOI: 10.9790/2402-1204015170 www.iosrjournals.org 51 | Page
Energy Dispersive X-Ray Fluorescence Elemental Analysis of
Roasted and Non- Roasted Ethiopian Coffee Specialty
H. Masresha Feleke1,*
, A. Srinivasulu1, K. Surendra
1, B. Aruna
1, Jaganmoy
Biswas2, M. Sudershan
2, A. D. P. Rao
1, P. V. Lakshmi Narayana
1
1. Department of Nuclear Physics, Andhra University, Visakhapatnam 530003, Andhra Paradesh, India
2. UGC-DAE Consortium for Scientific Research, Trace element lab, Salt Lake, Kolkata 700 098, India
Corresponding Author: H. Masresha Feleke1,*,
Abstract: The aim of the present Investigation was to study the elemental concentration of coffee beans
specialty in Ethiopia using energy dispersive x-ray florescence (EDXRF). It was found that the concentration of
four major elements (P, K, Ca, S) and eight minor elements (Mn, Fe, Cu, Zn, Se, Sr, Rb, Br) from roasted and
non-roasted coffee bean specialty. These samples was carried out at trace element laboratory UGC-DAE
Consortium for Scientific Research, Kolkata Centre by using a Xenemetrix (erstwhile Jordan Valley) EX 3600
EDXRF spectrometer which consists of an X-ray tube with a Rh anode as the source of x-ray with a 50V, 1mA
power supply, Si (Li) detector with a resolution of 143 ev at 5.9 kev and 10 sample pellets analyzing at a time.
The quantitative analysis is carried out by the in- built software nEXT. The system detection calibration and
accuracy check was performed through different countries reported values and analysis of certified reference
materials NIST (SRM 1515) Apple leaves. The order of elements concentration from highest to lowest was K >
Ca > P > S > Fe > Rb, > Mn > Cu > Zn, Sr > Br > Se for roasted and K > Ca > S > P > Fe > Rb, Mn > Cu >
Zn, Sr > Br >Se for non-roasted. In addition to this researchers discussed the elemental concentration of both
roasted and non- roasted coffee beans and their biological effects on human physiology.
Keywords: Roasted and Non-roasted, Coffee specialty, EDXRF, Elemental Analysis, Addis Ababa.
----------------------------------------------------------------------------------------------------------------------------- ----------
Date of Submission: 09-04-2018 Date of acceptance: 23-04-2018
----------------------------------------------------------------------------------------------------------------------------- ----------
I. Introduction Coffee is the fruit and dried seed of the coffee plant regardless of whether it has been toasted or ground of
the plant of the genus Coffea, generally of the cultivated species, and the products of these in their different
stages of the process and use intended for human consumption. It is one of the most consumed infusion drinks in
the world and contains a large variety of chemical compounds responsible for their sensory qualities and their
effects on the body [1]. Coffee is grown as two species: Cofea Arabica and Cofea Canephor. They are
commonly known as Arabica and Robusta. These two major species are known in commerce. Some authors
suggest that Arabica coffees originated in the mountain forests of Ethiopia. [2]
Coffee is one of the most an important trade commodity in the Ethiopian economy as it contributes
subsistence earnings of about 25% of the population, 30% of government direct revenue, and over 60% of the
national foreign exchange earnings [3].The part of the coffee which is important for household consumption and
commercial purposes is the bean, which naturally contains proteins, carbohydrates, vitamins and mineral
substances [4]. Its active substance is the alkaloid caffeine. Effects of coffee on human health are still under
strong debate. Some authors suggest that drinking two to four cups of coffee per day benefit health, reducing the
risk of colon cancer, gallstones, liver cirrhosis and Parkinson’s disease, lower risk of diabetes type 2, decreased
prevalence of some types of cancer [5, 6]. However, the chemical content of the coffee varies with coffee types
and environment in which they are cultivated and also in raw and roasted coffee beans of the same coffee type
collected from the same environment [4].
Due to the health benefits and economical relevance of coffee extensive research has been published, in
particular regarding its elemental composition, of metals in green (raw) and roasted coffee varieties in different
parts of the world [3] using many analytical techniques Several studies have been carried out on determinations.
For instance, Vietnam Robusta Coffee was roasted at different roasting degree and roasting temperature and 9
element concentrations (K, Mg, Ca, Na, Fe, Cu, Mn, Zn and Pb) of roasted coffee were analyzed by Flame
atomic absorption method (FAAS) in this study [7]. Thirty-seven coffee samples were characterized on the basis
of metal concentrations. Sixteen elements including toxic and essential elements were determined by inductively
coupled plasma-mass spectrometry [8]. Ca, Mg, Na, K, Fe, Mn, Zn, Cu, Ni, Co, Cr, Pb and Cd from different
types of coffee; Jacobs-Aroma, Jacobes-Kronung, Doncafe-elite, Fort-Strong coffee and Nova Brasilia using

Energy Dispersive X-Ray Fluorescence Elemental Analysis of Roasted And Non- Roasted…
DOI: 10.9790/2402-1204015170 www.iosrjournals.org 52 | Page
flame atomic absorption spectrometry (FASS). The experimental show that macro elements are represented
99.96% from total mass of minerals, the values decreased in the order: k > Ca > Mg >Na in all coffee
assortments the rest 0.04% Microelements this elements values decreased in the order: Fe > Mn > Cu > Zn > Ni
> Co > Pb > Cd, in all types of coffee. [9]
When we come to Ethiopia very few research had been carried out such as determination of
concentration Ca, Cd, Co, Cu, Fe, K, Mg, Mn, Ni, Pb and Zn in raw and roasted indigenous coffee varieties in
Ethiopia. The results indicated that higher concentrations of these metals in roasted coffee than in the
corresponding raw varieties [10]. The other reports are concentrations of nine essential metals (K, Mg, Ca, Na,
Mn, Fe, Cu, Zn, Co) and two nonessential (Pb, Cd) metals were determined in three brands of commercially
available roasted Ethiopian coffee powders (Abyssinia, Alem and Pride) obtained from local markets and their
infusions using flame atomic absorption spectrometry (FAAS) [3]. However, there are no literature reports on
quality of Ethiopian coffee Arabica specialty (Jimma, Nekemte, Illubabor, Limu, Tepi, Bebeka, Yirgachefe,
Sidamo, and Harar) using the determination of concentration of the elements which is found in the coffee
Arabica by the method of Energy Dispersive X-ray Fluorescence (EDXRF).
II. Materials And Methods 1.1. Sampling and preparation
The coffee bean samples were purchased from the local markets. Coffee bean of different local coffee specialty
packed in sizes of up to 1 kg is available in the local markets. The analysis was conducted on the eight types of
commercially available in different parts of Ethiopia especially Eastern, Southern and South West and most
commonly used Ethiopian coffee beans (Harar, Sidamo, Yirgachefe, Limu, Tepi, Bebeka, Welega and Illubabor
coffee bean). Eight samples of each brand were collected from their specific sampling sites.
1. Chiro (Harar coffee) is a town and separate woreda (district) in eastern Ethiopia. Located in the Amhar
Mountains, it has a latitude and longitude of 9°05′N 40°52′E and an altitude of 1826 meters above sea level.
It is the administrative center of the West Hararghe Zone 318 km from Addis Abeba.[11]
2. Tepi (Tepi coffee) is a town in southern Ethiopia. Located in the Sheka Zone of the Southern Nations,
Nationalities, and People's Region (SNNPR), this town has a latitude and longitude of 7°12′N 35°27′E with
a mean elevation of 1,097 meters above sea level. Distance between Addis Ababa and Tepi
Ethiopia is 576.5 kms or 358.2 miles [12]
3. Aleta Wondo(Sidamo coffee) is in the SNNP Region, Sidama Zone, Aleta Wondo Woreda. 300 miles
(338km) south of Addis Ababa There are three distinct agro-ecological zones; 12 % of the Woreda is
classified as Dega (highlands), 71 % as Woinadega (midlands), and 17 % dry Kolla (lowlands) situated
about 7000 feet above sea level. . Located in a fertile and forested area near Lake Abaya, not far from the
sources of the Ganale Dorya and Dawa Rivers this town has a longitude and latitude
of 6°36′N 38°25′E with an elevation of 2037 meters above sea level.[13]
4. Yirgachefe ( Yirgachefe coffee) is a town in central southern Ethiopia in Yirgachefe District. Located in
the Gedeo Zone of the Southern Nations, Nationalities and Peoples' Region, this town has an elevation
between 1,880 and 1,919 meters (6,168 and 6,296 ft) above sea level. It is the administrative center
of Yirgachefe woreda (or district), an important coffee growing area .latitude and longitude
6° 10′ 0″ N, 38° 12′ 0″ E distance from Addis Abeba 409.2 km. [14]
5. Gimbi (Wellega coffee) is a town in western Ethiopia. Located in the West Welega Zone of the Oromia
Region, it has a latitude and longitude of 9°10′N 35°50′E with an elevation between 1845 and 1930 meters
above sea level. It is the administrative center of Gimbi woreda. distance from Addis Ababa to Gimbi
430.7 km. [15]
6. Metu (Illubabor coffee) is a market town and separate woreda in south-western Ethiopia. Located in
the Illubabor Zone of the Oromia Region (or kilil) along the Sor River, this town has a latitude and
longitude of 8°18′N 35°35′E and an altitude of 1605 meters. Metu has been an important market of
the coffee trade, with several foreigners residing in the town as early as the 1930s to buy the crops from
local farmers. distance from Addis Ababa to Metu 541.5 km[16]
7. Mizan Tefere (Bebeka coffee) is a town in southern Ethiopia. The largest town, and the administrative
center, of the Bench Maji Zone of the Southern Nations, Nationalities, and Peoples Region (SNNPR), and
located about 160 kilometers southwest of Jimma, Mizan Tefere has a latitude and longitude
of 7°0′N 35°35′E and an elevation of 1451 meters. distance from Addis Ababa to Mizan Teferi 564.8
km[17]
8. Limu Kosa(Limu coffee) is one of the woredas in the Oromia Region of Ethiopia Part of the Jimma Zone,
The altitude of this woreda ranges from 1200 to 3020 meters above sea level. Latitude: 8° 09' 60.00" N
Longitude: 37° 09' 60.00" E 426 kilometers south west of Addis Ababa.[18]

Energy Dispersive X-Ray Fluorescence Elemental Analysis of Roasted And Non- Roasted…
DOI: 10.9790/2402-1204015170 www.iosrjournals.org 53 | Page
First of all In a laboratory the collected coffee bean were cleaned from stones and sediments by using
stainless steel forceps and next coffee beans can be washed with tap water and followed by de-ionized water to
remove soil particles and dust. Later on each sample separated in to two and half of them roasted with the home
roaster with a temperatures 180-200 °C for 8-12 min the other half (i.e. non- roasted) can be dried in ovens at
temperatures within 60–103 °C. Finally both roasted and non-roasted coffee beans samples were powdered;
homogenized using a mortar and pestle and 200mg of each powdered sample weighed and compressed using a
150 ton hydraulic press and made into pellets of 13mm diameter and 1- 2mm thickness. Triplicates of each
sample were done.
1.2. Instrumentation and Operational Parameters
1.2.1. Energy Dispersive X-ray Fluorescence EDXRF spectrometry is well recognized as a tool for the qualitative and quantitative determination of
major and minor elements in a wide range of sample types. A typical spectrometer uses an X-ray tube to
bombard the sample with X-rays of sufficient energy to knock out the inner shell electrons of the sample atoms.
Electrons from outer shells then drop down into the vacant inner-shell positions, and characteristic X-rays are
given off. This is known as X-ray fluorescence (XRF). In the energy-dispersive technique (EDXRF), the
energies of the X-rays emitted by the sample are measured using a Si-semiconductor detector and are processed
by a pulse height analyzer. Computer analysis of this data yields an energy spectrum which defines the
elemental composition of the sample. Essentially, the energy of the peak gives the element identification, and
the number of X-rays counted in the peak gives the amount of the element present in the sample.
1.2.2. Operational Parameters
These elemental analysis of roasted and non-roasted coffee bean samples was carried out at trace
element laboratory UGC-DAE Consortium for Scientific Research, Kolkata Centre by using a Xenemetrix
(erstwhile Jordan Valley) EX 3600 EDXRF spectrometer which consists of an X-ray tube with a Rh anode as
the source of x-ray with a 50V, 1mA power supply, Si (Li) detector with a resolution of 143 ev at 5.9 kev and 10
sample pellets analyzing at a time. The quantitative analysis is carried out by the in- built software nEXT.
The working operational parameter of EX 3600 EDXRF spectrometer
Parameters 𝑒1 𝑒2 𝑒3
Voltage (kv) 6 14 23
Current (mA) 200 900 200
Time (sec) 200 300 600
Atmosphere vacuum vacuum vacuum
Energy range (kev) 10 10 40
Through put low low low
Filter none Titanium Iron
Where 𝑒1 , 𝑒2 , 𝑒3 is spectrum 1, 2, 3
III. Results And Discussion Minerals are inorganic substances, vital to the human body, present in all body tissues and fluids and
their presence is necessary for the normal growth, maintains of the body and certain physicochemical processes
which are essential to life. They help form bones and teeth, aid in normal muscle and nerve activity, act as
catalysts in many enzyme systems, help control water levels in the body and are components of such compounds
in the body as hemoglobin and the hormone thyroxin. The Minerals we get from our different diets has chemical
constituents used by the body in many ways. However, our body does not require large stores of minerals. We
can get the proper amounts of most minerals from the foods we eat. This makes supplements often unnecessary
and, if we get too much of any one mineral, supplements can be dangerous. [19] [20][21]. When cooking or
roasted food (coffee beans), the minerals are not changed or destroyed by mixing with other substances,
exposure to air, or extreme heat. From the time a mineral is ingested into the body, to the time it is excreted, it is
never changed into anything else. However, some minerals in boiled foods may be lost because they attach to
water molecules. [21] Green and roasted coffee beans have the same elemental composition, indicating that the
roasting process did not eliminate any of the elements [46] in this research work also similar as it.
Depends on the amount of essential mineral needed by the body mineral can be broadly classified in to
two categories major (macro) and minor (micro) minerals. Major minerals are needed in amounts greater than
100 mg/day and include Calcium (Ca), Phosphorous (P), Potassium (K), Sulfur (S), Sodium (Na), Chloride (Cl),
Magnesium (Mg). Minor minerals are trace elements needed in amounts of less than 100 mg/day and include
Zinc(Zn), Iron (Fe), Manganese (Mn), Copper (Cu), Silicon(Si), Molybdenum (Mo), Chromium (Cr), Selenium

Energy Dispersive X-Ray Fluorescence Elemental Analysis of Roasted And Non- Roasted…
DOI: 10.9790/2402-1204015170 www.iosrjournals.org 54 | Page
(Se), Iodine (I). These all minerals vital to the human body are important because they serve necessary
functions. [20][22]
In this study total 12 elements were determined four major elements like Calcium (Ca), Phosphorous
(P), Potassium (K), Sulfur (S) and eight minor elements like Zinc(Zn), Iron (Fe), Manganese (Mn), Copper
(Cu), Selenium (Se), (Br), (Rb), (Sr) had been analyzed by Energy Dispersive X-ray Fluorescence (EDXRF) in
green coffee beans and roasted coffee beans. It is noticed that the order of elements concentration from highest
to lowest are K > Ca > P > S > Fe > Rb, > Mn > Cu > Zn, Sr > Br > Se for roasted and K > Ca > S > P > Fe >
Rb, Mn > Cu > Zn, Sr > Br >Se for non-roasted. The table below shows quantitative analysis of 12 different
elements of average elemental concentration (n = 3) with ± standard deviation in ppm
Coffee brand
Roasted coffee bean specialty
P S K Ca Mn Fe
Tepi
1425.01
± 154.4
1258.1±
70.8
16286.9 ±
1105.8
2479.3 ±
165.2
24.36 ±
2.16
125.2 ±
5.1
Bebeka 1492.9 ±
76.7
1292.4 ±
932.6
15738.8 ±
321.04
2348.8 ±
134.3
27.4 ± 2.9
4149.7 ±
118.2
Limu 1471.7 ±
76.6
1213.6 ±
40.1
15783.4 ±
539.9
2359.4 ±
88.4
24.98 ±
1.7
221.3 ±
12.4
Yirgachefe 1571.6 ±
36.1
1202.8 ±
26.4
16505.35 ±
411.2
2450.5 ±
132.3
30.5 ± 2.7
408.97 ±
14.82
Sidama 1686.3 ±
43.9
1238.8±
2.2
17862.01 ±
113.8
2648.7 ±
44.7
35.6 ±
1.0
225.2 ±
7.9
Harare 1226.4 ±
34.71
1135.5 ±
51.9
16023.8 ±
834.9
2360.4 ±
159.4
25.8 ±
1.89
239.17 ±
12.07
Gimbi 1638.4 ±
53.75
1251.22±
46.04
16806.9 ±
51.97
2510.03 ±
58.35
25.65 ±
1.0
152.0 ±
21.86
Standards
NIST(1515)
1590 1800 16100 15260 54 83

Energy Dispersive X-Ray Fluorescence Elemental Analysis of Roasted And Non- Roasted…
DOI: 10.9790/2402-1204015170 www.iosrjournals.org 55 | Page
Coffee
brand
Roasted coffee bean specialty
Cu Zn Se Br Rb Sr
Tepi
13.55 ±
1.5
4.6 ±
2.78
2.8 ±
4.26
1.58 ±
1.56
25.18 ±
0.87
9.03 ±
1.5
Bebeka 13.24 ±
1.46
7.2 ±
1.3
0.14 ±
0.03
1.83 ±
0.12
30.33 ±
1.46
4.22 ±
0.51
Limu 12.89 ±
0.81
5.88 ±
0.84
0.66 ±
0.93
1.0 ±
1.05
57.48 ±
3.43
4.61 ±
4.52
Yirgachefee 15.34 ±
0.47
6.47 ±
0.85
0.15 ±
0.04
2.49 ±
1.01
20.4 ±
3.11
3.78 ±
3.52
Sidama 13.97 ±
0.38
5.62 ±
0.34
0.91 ±
0.74
3.24 ±
2.39
24.53 ±
1.64
5.56 ±
1.8
Harare 14.45 ±
1.14
2.87 ±
0.6
0.23 ±
0.15
3.07 ±
0.5
28.86 ±
0.96
4.09 ±
3.43
Gimbi 16.66 ±
1.06
3.79 ±
1.38
0.29 ±
0.22
0.64 ±
1.0
46.84 ±
2.49
5.45 ±
1.92
Standards
NIST(1515)
5.64 12.50 0.05 1.80 10.20 25.00
Table -1; Average elemental concentration with (±) standard deviation in ppm of Roasted Coffee Bean
Coffee
brand
Non - Roasted coffee bean specialty
P S K Ca Mn Fe
Tepi
921.18 ±
350.86
1209.41 ±
115.09
13531.62 ±
1437.59
2048.27 ±
249.75
25.25 ±
0.74
216.19 ±
4.11
Bebeka 1149.83 ±
61.39
1320.83 ±
58.93
14121.43 ±
551.99
2304.04 ±
85.21
44.23 ±
2.64
291.68 ±
7.518
Limu 1209.06 ±
60.14
1234.09 ±
48.06
13792.33 ±
384.04
2198.19 ±
76.52
22.96 ±
1.81
139.85 ±
0.88

Energy Dispersive X-Ray Fluorescence Elemental Analysis of Roasted And Non- Roasted…
DOI: 10.9790/2402-1204015170 www.iosrjournals.org 56 | Page
Yirgachefe 995.27 ±
231.1
1095.95 ±
140.96
12503.92±
1553.21
1945.67 ±
282.23
23.51 ±
3.08
155.49 ±
17.31
Sidama 976.31 ±
291.22
1150.65±
139.5
14071.6 ±
1765.53
2184.0 ±
199.3
39.3 ±
2.46
296 ±
22.75
Harare 1125.2 ±
30.3
1214.2±
16.08
14700.42 ±
248.51
2265.26 ±
60.68
28.85 ±
1.09
209.35 ±
15.17
Gimbi 1490.09 ±
16.29
1249.07±
26.02
15419.99 ±
200.36
2309.41 ±
38.3
27.84 ±
0.57
181.86 ±
3.92
Metu 1272.55 ±
57.9
1247.3±
52.44
14015.78 ±
586.11
2190.98 ±
101.21
28.42 ±
1.47
185.34 ±
5.02
Standards
NIST(1515)
1590 1800 16100 15260 54 83
Coffee
brand
Non-Roasted coffee bean specialty
Cu Zn Se Br Rb Sr
Tepi
12.67 ±
1.12
5.10 ±
1.18
0.29 ±
0.30
2.64 ±
0.82
18.87 ±
0.38
8.13 ±
0.67
Bebeka 14.72 ±
0.95
6.28 ±
0.97
0.15 ±
0.05
1.47 ±
0.69
28.91 ±
1.45
5.58 ±
0.76
Limu 13.92 ±
1.02
4.98 ±
1.14
0.16 ±
0.06
2.09 ±
0.27
49.27 ±
0.77
7.78 ±
4.09
Yirgachefe 14.32 ±
2.47
6.75 ±
0.78
0.35 ±
0.28
1.49 ±
0.38
24.79 ±
3.84
4.76 ±
0.66
Sidama 12.47 ±
0.56
5.72 ±
1.99
0.73 ±
1.02
2.03 ±
1.30
20.16 ±
2.23
6.13 ±
1.14
Harare 13.84 ±
1.67
8.36 ±
0.69
0.34 ±
0.19
2.15 ±
0.42
29.60 ±
0.82
5.13 ±
4.21
Gimbi 15.18 ±
1.55
5.09 ±
1.5
0.46 ±
0.57
0.88 ±
0.82
38.21 ±
2.03
3.17 ±
2.48
Metu 15.35 ±
0.24
5.7 ±
0.74
0.34 ±
0.38
2.13 ±
0.66
44.88 ±
2.63
6.62 ±
2.09
Standards
NIST(1515)
5.64 12.50 0.05 1.80 10.20 25.00

Energy Dispersive X-Ray Fluorescence Elemental Analysis of Roasted And Non- Roasted…
DOI: 10.9790/2402-1204015170 www.iosrjournals.org 57 | Page
Table -2; Average elemental concentration with (±) standard deviation in ppm of Non-Roasted Coffee Bean
Figure 1. Phosphorous (P) concentration in ppm
Figure 2. Sulfur(S) concentration in ppm
0
200
400
600
800
1000
1200
1400
1600
1800
NON-ROASTED
ROASTED
0
200
400
600
800
1000
1200
1400
NON-ROASTED
ROASTED

Energy Dispersive X-Ray Fluorescence Elemental Analysis of Roasted And Non- Roasted…
DOI: 10.9790/2402-1204015170 www.iosrjournals.org 58 | Page
Figure 3. Potassium (K) concentration in ppm
Figure 4. Calcium (Ca) concentration in ppm
0
2000
4000
6000
8000
10000
12000
14000
16000
18000
20000
NON-ROASTED
ROASTED
0
500
1000
1500
2000
2500
3000
NON-ROASTED
ROASTED

Energy Dispersive X-Ray Fluorescence Elemental Analysis of Roasted And Non- Roasted…
DOI: 10.9790/2402-1204015170 www.iosrjournals.org 59 | Page
Figure 5. Manganese (Mn) concentration in ppm
Figure 6. Iron (Fe) concentration in ppm
0
5
10
15
20
25
30
35
40
45
50
NON-ROASTED
ROASTED
0
50
100
150
200
250
300
350
400
450
NON-ROASTED
ROASTED

Energy Dispersive X-Ray Fluorescence Elemental Analysis of Roasted And Non- Roasted…
DOI: 10.9790/2402-1204015170 www.iosrjournals.org 60 | Page
Figure 7. Copper (Cu) concentration in ppm
Figure 8. Zinc (Zn) concentration in ppm
0
2
4
6
8
10
12
14
16
18
NON-ROASTED
ROASTED
0
1
2
3
4
5
6
7
8
9
NON-ROASTED
ROASTED

Energy Dispersive X-Ray Fluorescence Elemental Analysis of Roasted And Non- Roasted…
DOI: 10.9790/2402-1204015170 www.iosrjournals.org 61 | Page
Figure 9. Selenium (Se) concentration in ppm
Figure 10. Bromine (Br) concentration in ppm
0
0.5
1
1.5
2
2.5
3
NON-ROASTED
ROASTED
0
0.5
1
1.5
2
2.5
3
3.5
NON-ROASTED
ROASTED

Energy Dispersive X-Ray Fluorescence Elemental Analysis of Roasted And Non- Roasted…
DOI: 10.9790/2402-1204015170 www.iosrjournals.org 62 | Page
Figure 11. Rubidium (Rb) concentration in ppm
Figure 12. Strontium (Sr) concentration in ppm
Phosphorus (P) is the second most plentiful mineral in your body next to calcium. Your body needs
phosphorus for many functions, such as filtering waste and repairing tissue and cells. In addition it is a vital part
of the growth process, as well as the maintenance of bones and teeth. It works in association with calcium to
create strong bones, which can withstand the normal wear and tear of human life. People get the amount of
phosphorus mineral that they need to our body. The most important sources of phosphorus are Foods that are
0
10
20
30
40
50
60
70
NON-ROASTED
ROASTED
0
1
2
3
4
5
6
7
8
9
10
NON-ROASTED
ROASTED

Energy Dispersive X-Ray Fluorescence Elemental Analysis of Roasted And Non- Roasted…
DOI: 10.9790/2402-1204015170 www.iosrjournals.org 63 | Page
rich in protein are excellent sources of phosphorus. These include: meat and poultry, fish, milk and other dairy
products, eggs and nuts seeds and beans. Some non-protein food sources also contain phosphorus such as whole
grains, potatoes, garlic, dried fruit, and carbonated drinks (phosphoric acid is used to produce the carbonation).
After your body digests food, the phosphorus is absorbed into the blood. The blood then takes it to your bones to
make them strong along with calcium. Extra phosphorus is filtered out of the body by healthy kidneys. [23][24].
If Phosphorus levels that are too high or too low can cause medical complications, such as heart disease, joint
pain, or fatigue. Phosphorus can be found in the human body as a form of phosphates. Phosphate is a dietary
requirement, the recommended intake is 800 mg/day, a normal diet provides between 1000 and 2000 mg/day,
depending on the extent to which phosphate rich foods are consumed. [25]
From the table 1 and 2 the concentration of phosphorus in roasted and non- roasted coffee beans
specialty the result shows that the roasted coffee beans higher phosphorous concentration than non-roasted. In
this study phosphorus is the 3rd major mineral in roasted but the 4th
in non-roasted. The maximum amounts of
phosphorus (1686.26 ± 43.86244) was found from Sidama coffee specialty and the minimum was found Harare
(1226.433 ± 34.70926) in roasted coffee beans. On the non-roasted Gimbi (1490.093 ± 16.29002) has highest
and Tepi (921.1833 ± 350.8612) has the lowest concentration. When we Comparison of Observed phosphorous
concentration with standards and Reported Values for row and roasted coffee beans, respectively, the
phosphorous contents observed are more or less comparable with the standards NIST (1590) specially
Yirgachefe coffee beans specialty (1571.61 ± 36.13521). However, relatively lower concentration of
phosphorus observed in this study in comparison to different countries reported values (1710 ± 140 – 2110 ±
160)[26].
The order roasted and non-roasted coffee specialty concentration from highest to lowest are
Roasted: Sidama (1686.26 ± 43.86244) > Gimbi (1638.403 ± 53.75799) > Yirgachefe (1571.61 ±
36.13521) > Bebeka (1492.873 ± 76.68784) > Limu (1471.743 ± 76.6493) > Tepi (1425.013 ±154.3752) >
Harare (1226.433 ± 34.70926)
For Non-Roasted: Gimbi (1490.093 ± 16.29002) > Metu (1272.547 ± 57.93175) > Limu (1209.063 ±
60.13699) > Bebeka (1149.827 ± 61.39093) > Harare (1125.203 ± 30.30493) > Yirgachefe (995.2667 ±
231.0785) > Sidama (976.31 ± 291.2224) > Tepi (921.1833 ± 350.8612)
Sulfur(S) is an essential component of all living cells and critical to help us detoxify and regenerate
new tissue. It is the seventh or eighth most abundant element in the human body by weight, about equal in
abundance to potassium, and slightly greater than sodium and chlorine. . It is especially important for humans
because it is part of the amino acid (the building block of protein) methionine, which is an absolute dietary
requirement for us. The amino acid cytosine also contains sulfur. The average person takes in around 900 mg of
sulfur per day, mainly in the form of protein. [27][28]. Sulfur is found in a large number of foods, and, as a
consequence, it is assumed that almost any diet would meet the minimum daily requirements. Excellent sources
are eggs, onions, garlic, and leafy dark green vegetables like kale and broccoli. Meats, nuts, and seafood also
contain sulfur. [29]
From the table 1 and 2 the concentration of Sulfur in roasted and non- roasted coffee beans specialty
the result shows that the roasted and non-roasted sulfur concentration more or less similar. In present
investigation Sulfur is 4th major mineral in roasted but the 3rd
in non-roasted. The maximum amounts of
Sulfur (1292.383 ± 932.5906) was found from Bebeka coffee specialty and the minimum was found Harare
(1135.533 ± 51.91361) in roasted coffee beans. On the non-roasted Bebeka (1320.83 ± 58.92707) has highest
and Yirgachefe (1095.947± 140.9638) has the lowest concentration. When we Comparison of Observed Sulfur
concentration with standards and Reported Values for row and roasted coffee beans, respectively, relatively
lower concentration of Sulfur in comparison to both standards NIST (1800) and different countries reported
values (1420 ± 97 – 1640 ± 55)[26] .
The order roasted and non-roasted coffee specialty concentration from highest to lowest are
Roasted: Bebeka (1292.383 ± 932.5906) > Tepi (1258.123 ± 70.80098) > Gimbi (1251.217±
46.04205) > Sidama (1238.843± 2.211274) > Limu (1213.647± 40.09989) > yirgachefe (1202.853± 26.35896) >
Harare (1135.533 ± 51.91361)
For non-roasted: Bebeka (1320.83 ± 58.92707) > Gimbi (1249.067± 26.02347) > Metu (1247.343 ±
52.44017) > Limu (1234.087± 48.05796) > Harare (1214.163± 16.08239) > Tepi (1209.41 ± 115.0927) >
Sidama (1150.647± 139.4998) > Yirgachefe (1095.947± 140.9638)
Potassium (K) is one of the seven essential macro minerals that need to our body to work properly. It
isn’t produced naturally by the body, so it’s important to consume the right balance of potassium-rich foods and
beverages. Many people get all the potassium minerals they need from what they eat and drink. Potassium-rich
sources include: root vegetables (like carrots, and potatoes), fruits (likes bananas, avocados grapes and like),
leafy greens (such as spinach and collards) whole grains, beans and nuts, lean meats etc…There are so many
reasons you need to make sure you consume an adequate amount of potassium-rich foods daily. Because
Potassium supports blood pressure, cardiovascular health, bone strength, muscle contractions, normal water

Energy Dispersive X-Ray Fluorescence Elemental Analysis of Roasted And Non- Roasted…
DOI: 10.9790/2402-1204015170 www.iosrjournals.org 64 | Page
balance, nerve impulses and digestion heart rhythm. Potassium deficiency and consuming too much
potassium can be harmful to the people and the cause for hypokalemia and Hyperkalemia respectively.
Therefore The World Health Organization (WHO) recommend an intake of 3,510 mg per day.[30][31]
From the figure 3 concentration of potassium of roasted and non-roasted coffee beans the experiment
was showed the concentration of roasted coffee beans higher than non-roasted. In general in this study it is the
1st major mineral in roasted and in non-roasted. The maximum amounts of potassium (17862.01 ± 113.7653)
was found from Sidama coffee specialty and the minimum was found Bebeka (15738.77 ± 321.0416) in roasted
coffee beans. In non-roasted Gimbi (15419.99 ± 200.3618) has highest and Yirgachefe (12503.92 ± 1553.209)
has the lowest concentration. When we Comparison of Observed potassium concentration with standards and
Reported Values for row and roasted coffee beans, respectively, the potassium contents observed are more or
less comparable with the standards NIST (16100) specially Harare coffee beans specialty (16023.77 ± 834.875)
and other reported values(14520 ± 428, 14361 ± 478, 14583 ± 495 )[3], (11750 - 15850)[32] . However,
relatively lower concentration of potassium observed in this study in comparison to different countries reported
values (17500 ± 1030 – 19600 ± 1400) [26], (19610 ± 343, 19471 ± 392), (18754 ± 462, 18563 ± 477) [33]. The
order of roasted and non-roasted coffee specialty concentration from highest to lowest are
Roasted: Sidama (17862.01 ± 113.7653) > Gimbi (16806.94 ± 51.97366) > Yirgacheffe (16505.35 ±
411.1679) > Tepi (16286.92 ± 1105.829) > Harare (16023.77 ± 834.875) > Limu (15783.39 ± 539.9007) >
Bebeka (15738.77 ± 321.0416)
Non-Roasted: Gimbi (15419.99 ± 200.3618) > Harare (14700.42 ± 248.5128) > Bebeka (14121.43 ±
551.9988) > Sidama (14071.62 ± 1765.526) > Metu (14015.78 ± 586.1147) > Limu (13792.33 ± 384.0423) >
Tepi (13531.62 ± 1437.588) > Yirgachefe (12503.92 ± 1553.209
Calcium (Ca) is the fifth most abundant element in the human body and an essential element needed
in large quantities. Calcium ions play a vital role in human health in order to building bones, helps our blood
clot, health of the muscular, circulatory, digestive systems, nerves send messages and muscles contract etc….
About 99 percent of the calcium in our bodies is stored in our bones and teeth. Each day, we lose calcium
through our skin, nails, hair, sweat, urine and feces, but our bodies cannot produce new calcium rather it is taken
from our bones. There are many good source of calcium food and beverages which we eat and drink such as
Dairy products (like Milk, Cheese and Yogurt), Vegetables (like Broccoli, Kale, and Chinese cabbage), and
other foods contains calcium in smaller amounts Fortified cereals, juices, soy products, snacks, and breads. The
recommended daily intake (RDI) of calcium is 1,000 mg per day for most adults and for women over 50 years
and everyone over 70 get 1200mg per day, while children aged 4-18 years are advised to get 1,300mg.[34][35].
From the figure 4 concentration of calcium of roasted and non-roasted coffee beans the experiment was showed
the concentration of roasted coffee beans higher than non-roasted. In this study Calcium is 2nd
major mineral in
both roasted and in non-roasted coffee beans. The maximum amounts of calcium (2648.683 ± 44.66317) was
found from sidama coffee specialty and the minimum was found Bebeka (2348.797 ± 134.2805) in roasted
coffee beans. On the non-roasted Gimbi (2309.41 ± 38.30384) has highest and Yirgachefe (1945.673 ±282.231)
has the lowest concentration. When we Comparison of Observed calcium concentration with standards Values
for row and roasted coffee beans, respectively, the calcium contents observed are very less comparable with the
standards NIST (15260). However, relatively higher concentration of Ca observed in this study in comparison to
different countries reported values (934 ± 120 – 1234 ± 290)[26], (943 ± 29, 931 ± 17 )(1009 ± 18, 976 ± 24
)[33], 1259.44 [7], (940 ± 48, 1045 ± 77, 843 ± 70)[3] , (513 - 1620)[32]
The order of roasted and non-roasted coffee specialty concentration from highest to lowest are
Roasted: Sidama (2648.683 ± 44.66317) > Gimbi (2510.033 ± 58.35065) > Tepi (2479.35 ±
165.1651) > Yirgachefe (2450.533 ± 132.341) > Harare (2360.413 ± 159.4063) > Limu (2359.44 ± 88.42021) >
Bebeka (2348.797 ± 134.2805).
Non-Roasted: Gimbi (2309.41 ± 38.30384) > Bebeka (2304.043 ± 85.21007) > Harare (2265.257 ±
60.67798) > Limu (2198.187 ± 76.52463) > Metu (2190.98 ± 101.2133) > Sidama (2184.003 ± 199.2744) >
Tepi (2048.267 ± 249.75) > Yirgachefe (1945.673 ±282.231)
Manganese (Mn) is a naturally occurring mineral in our bodies in very small amounts (around 20mg).
It is found mostly in bones, the liver, kidneys, and pancreas. Manganese helps the body form connective tissue,
helping to create essential enzymes for building bones, blood clotting factors, and sex hormones. It also plays a
role in fat and carbohydrate metabolism, calcium absorption, and blood sugar regulation. Manganese is also
necessary for normal functioning of brain, nerve function and helps to fight free radicals. Supplements and
dietary intake of manganese together should not exceed 10 milligrams per day because of the risk whether to
much or low level manganese in our diet. However the symptoms of manganese deficiency include high blood,
bone malformation, weakness, muscular contraction, high cholesterol, poor eyesight, hearing trouble, severe
memory loss, shivers, and tremors. If too much manganese in the diet it could lead to high levels of manganese
in the body tissues. Abnormal concentrations of manganese in the brain, especially in the basal ganglia, are
associated with neurological disorders similar to Parkinson's disease. Early life manganese exposure at high

Energy Dispersive X-Ray Fluorescence Elemental Analysis of Roasted And Non- Roasted…
DOI: 10.9790/2402-1204015170 www.iosrjournals.org 65 | Page
levels, or low levels, may impact neurodevelopment. Elevated manganese is also associated with poor cognitive
performance in school children. There are some rich sources of manganese include whole grains, nuts, leafy
vegetables, raspberries, pineapples, garlic, grapes, rice, peppermint, oats, nuts, watercress,
watercress, mustard greens, strawberries, blackberries,tropical fruits, lettuce, spinach, molasses, cloves, turmeric
, , bananas, cucumbers, kiwis, figs, almonds, and Foods high in phytic acid, such as beans, seeds, and soy
products, or foods high in oxalic acid, such as cabbage, spinach, and sweet potatoes, may slightly inhibit
manganese absorption. Although teas are rich sources of manganese, the tannins present in tea may moderately
reduce the absorption of manganese and hazelnuts since they maximize the absorption of this important mineral.
[36][37] From the figure 5 concentration of Manganese of roasted and non-roasted coffee beans the experiment
was showed more or less similar. In general in this study Manganese is 2nd
or 3rd
minor mineral next to iron
and/or rubidium in both roasted and non-roasted. The maximum amounts of Manganese (35.59667 ± 1.000117)
was found from Sidama coffee specialty and the minimum was found Tepi (24.36 ± 2.160486) in roasted coffee
beans. On the non-roasted Bebeka (44.23 ± 2.636987) has highest and Limu (22.96333 ± 1.810672) has the
lowest concentration. When we Comparison of Observed Manganese concentration with standards Values for
row and roasted coffee beans, respectively, the Manganese contents observed are less comparable with the
standards NIST (54). However, concentration of Manganese observed in this study more or less similar in
comparison with different countries reported values (19 ± 5 – 39 ± 11)[26], (23 ± 0.5, 21 ± 0.3 )(20 ± 0.1, 19 ±
0.2 )[33], 20.97[7], (24.0 ± 0.6, 24.0 ± 1.5, 22.0 ± 0.5)[3], (16.5 – 40.6)[32]
The order of roasted and non-roasted coffee specialty concentration from highest to lowest are
Roasted: Sidama (35.59667 ± 1.000117) > Yirgachefe (30.52 ± 2.668277) > Bebeka (27.41667 ±
2.89139) > Harare (25.84333 ± 1.890776) > Gimbi (25.64667 ± 1.002314) > Limu (24.98333 ± 1.679891) >
Tepi (24.36 ± 2.160486).
For Non-Roasted: Bebeka (44.23 ± 2.636987) > Sidama (39.26333 ± 2.45895) > Harare (28.85 ±
1.093435) > Metu (28.42333 ± 1.469569) > Gimbi (27.84333 ± 0.568888) > Tepi (25.25333 ± 0.744737) >
Yirgachefe (23.51 ± 3.081412) > Limu (22.96333 ± 1.810672)
Iron (Fe) is biologically important essential transition metals for most life on Earth, including human
beings. It is one of the few trace elements needed for human body to sustain life. There are varies biological role
of iron to our body such as Improves brain function, muscle function, immune system, concentration, oxygen
transportation from lungs to cells and production of energy and Catalase. However if low level of iron to our
body can cause many health problems, including impaired cognitive function, gastrointestinal disturbances, poor
exercise and work performance, lowered immune function and poor body temperature regulation. In order to
avoid iron deficiency we should have use iron rich source foods include red meat, Beef liver, Cereal, soybean,
white beans and flour products, seafood, sunflower seeds and so on .if an excess amount of iron can cause to the
human body such as it causes the enzyme to malfunction, it also causes inflammation. Iron attracts oxygen and
when in excess, the free radical oxygen damages the surrounding body tissue. In addition, as a carrier for
oxygen, iron promotes bacterial growth by feeding it oxygen, leading to chronic infections. Iron can mostly be
found in the pancreas, joints, liver, and intestines. The tolerable upper intake level for iron is between 40-45
milligrams [38]
From the figure 6 concentration of iron of roasted and non-roasted coffee beans the experiment was
showed more or less similar except roasted Bebeka. In general in this study iron is 1st minor mineral in both
roasted and non-roasted. The maximum amounts of iron (414.9667 ± 118.2001) was found from Bebeka coffee
specialty and the minimum was found Tepi (125.1833 ± 5.081499) in roasted coffee beans. On the non-roasted
Sidama (296 ± 22.75277) has highest and Limu (139.8467 ± 0.880928) has the lowest concentration. When we
Comparison of Observed iron concentration with both standards and reported Values for row and roasted coffee
beans, respectively, the iron contents observed are higher comparable with the standards NIST (83) and with
different countries reported values (12 ± 3 – 31 ± 7)[26], 53.44[7] (52.0 ± 4.0, 53.0 ± 5.0, 52.0 ± 3.0)[3]
The order of roasted and non-roasted coffee specialty concentration from highest to lowest are
Roasted: Bebeka (414.9667 ± 118.2001) > Yirgachefe (408.9733 ± 14.81943) > Harare (239.17 ±
12.07383) > sidama (225.2033 ± 7.904052) > Limu (221.3033 ± 12.40336) > Gimbi (152.0133 ± 21.85786) >
Tepi (125.1833 ± 5.081499)
For Non-Roasted: Sidama (296 ± 22.75277) > Bebeka (291.6833 ± 7.517908) > Tepi (216.1867 ±
4.114661) > Harare (209.3467 ± 15.17246) > Metu (185.34 ± 5.019333) > Gimbi (181.8633 ± 3.925714) >
Yirgachefe (155.4933 ± 17.3093) > Limu (139.8467 ± 0.880928)
Copper (Cu) is a trace element also essential for the human body to function properly. Copper is
present in all body tissues and plays a role in the formation of connective tissue, and in the normal functioning
of muscles and the immune and nervous systems. The human body requires copper for normal growth and
health. Copper, along with iron, is a critical component in the formation of red blood cells. Copper also
influences the functioning of the heart and arteries, helps prevent bone defects such as osteoporosis and
osteoarthritis, and promotes healthy connective tissues (hair, skin, nails, tendons, ligaments and blood vessels).

Energy Dispersive X-Ray Fluorescence Elemental Analysis of Roasted And Non- Roasted…
DOI: 10.9790/2402-1204015170 www.iosrjournals.org 66 | Page
(Source: Dr. Andrew Weil, Internet). Good Food sources of copper are Whole grains, vegetables, nuts, beans,
seeds, mushrooms, potatoes and organ meats. Supplements and dietary intake of copper together should not
exceed 0.9 milligrams per day because of the risk whether to much or low level copper in our diet. If you suffer
from a copper deficiency, the normal and healthy growth of organs and tissues, as well as their proper
oxygenation from an ample red blood cell concentration, would be impossible. Copper is a vital component of
the natural dark pigment, melanin, which imparts coloration to the skin, hair, and eyes. Excessive copper levels
have been linked to schizophrenia, learning disabilities, premenstrual syndrome, and anxiety. From the figure 7
concentration of Copper of roasted and non-roasted coffee beans the experiment was showed more or less
similar. In general in this study Copper is 4th
minor mineral in both roasted and non-roasted. The maximum
amounts of Copper (16.66333 ± 1.058411) was found from Gimbi coffee specialty and the minimum was found
Limu (12.89667 ± 0.809341) in roasted coffee beans. On the non-roasted Metu (15.35 ± 0.238956) has highest
and Sidama (12.46667 ± 0.561555) has the lowest concentration. When we Comparison of Observed Copper
concentration with standards Values for row and roasted coffee beans, respectively, the Copper contents
observed are higher comparable with the standards NIST (5.64). However when we compared with different
countries reported values more or less similar (12.5 ± 3.4 – 18.1 ± 2.6) [36], (12 ± 0.3,13 ±0.2), (9 ± 0.3, 10 ±
0.1) [33], 13.15[7], (17 ± 0.2, 14 ± 0.8, 11.0 ± 0.7) [3], (12.1 – 20.1) [32]
The order of roasted and non-roasted coffee specialty concentration from highest to lowest are
Roasted: Gimbi (16.66333 ± 1.058411) > Yirgachefe (15.34 ± 0.475079) > Harare (14.45333 ±
1.142337) > Sidama (13.97 ± 0.385876) > Tepi (13.54667 ± 1.500478) > Bebeka (13.24 ± 1.464616) > Limu
(12.89667 ± 0.809341)
For Non-Roasted: Metu (15.35 ± 0.238956) > Gimbi (15.17667 ± 1.549462) > Bebeka (14.72 ±
0.947787) > Yirgachefe (14.32 ± 2.471922) > Limu (13.92333 ± 1.023442) > Harare (13.84333 ± 1.668725) >
Tepi (12.67 ± 1.1253) > Sidama (12.46667 ± 0.561555)
Zinc (Zn) is one of the essential trace elements and vital micronutrients with diverse physiologic and
metabolic functions [39]. It is important in helping the body to make new cells, process food and heal wounds.
The health benefits of zinc include a proper functioning of the immune and digestive systems,
controlled diabetes, reduction in stress levels, improvement in metabolism,. Also, it is helpful in terms of
pregnancy, hair care, eczema, weight loss, night blindness, cold, eye care, appetite loss, and many other
conditions. A lack of zinc can make a person more susceptible to disease and illness. It is responsible for a
number of functions in the human body, and it helps stimulate the activity of at least 100 different enzymes.
Only a small intake of zinc is necessary to reap the benefits. Currently, the recommended dietary allowance
(RDA) zinc for men needs 5.5-9.5mg per day and women need 4-7mg a day. The zinc element is naturally
found in many different foods, such as red meat, poultry, oysters, seafood, fortified cereals, whole grains, beans
and nuts [40][41]
From the figure 8 concentration of Zinc of roasted and non-roasted coffee beans the experiment was
showed more or less similar. In general in this study Zinc is 5th
minor mineral in both roasted and non-roasted.
The maximum amounts of Zinc (7.203333 ± 1.323077) was found from Bebeka coffee specialty and the
minimum was found Harare (2.87 ± 0.602578) in roasted coffee beans. On the non-roasted Harare (8.363333 ±
0.699809) has highest and Limu (4.976667 ± 1.137776) has the lowest concentration. When we Comparison of
Observed Zinc concentration with standards and reported Values for row and roasted coffee beans, respectively,
the Zinc contents observed are less comparable with the standards NIST (12.5) and with some countries reported
values (14 ± 0.3, 15 ± 0.2 )(17 ± 0.2, 18 ± 0.3)[33], (13.0 ± 0.7, 19.0 ± 0.8, 12.0 ± 0.8)[3], (3.2 – 16.2)[32].
However in few reported values more or less similar (6.51 ± 1.1 – 8.03 ± 1.4) [26], (5.97-6.89) [7]
The order of roasted and non-roasted coffee specialty concentration from highest to lowest are
Roasted: Bebeka (7.203333 ± 1.323077) > Yirgachefe (6.47 ± 0.855804) > Limu (5.88 ± 0.844808) >
Sidama (5.623333 ± 0.343123) > Tepi (4.626667± 2.786707) > Gimbi (3.793333 ± 1.384245) > Harare (2.87 ±
0.602578)
For Non-Roasted: Harare (8.363333 ± 0.699809) > Yirgachefe (6.753333 ± 0.783603) > Bebeka
(6.283333 ± 0.969141) > Sidama (5.72 ± 1.987788) > Metu (5.7 ± 0.735119) > Tepi (5.103333 ± 1.182469) >
Gimbi (5.09 ± 1.512481) > Limu (4.976667 ± 1.137776)
Selenium (Se) is an essential element for humans and animals that is required for key antioxidant
enzyme glutathione peroxides, works with vitamin E in preventing free radical damage to cell membranes [42].
But can be toxic if the daily intake at high concentrations in excess of 2 mg. mainly human exposed to selenium
through our food and water, because selenium is naturally present in grains, nuts, cereals, mushrooms and meat.
Humans need to absorb certain amounts of selenium daily, in order to maintain good health. Food usually
contains enough selenium to prevent disease caused by shortages. If Low levels of selenium render people at
higher risk for cancer; cardiovascular disease; inflammatory diseases, such as asthma; and other conditions
associated with increased free radical damage, including premature aging and cataract formation. [43]

Energy Dispersive X-Ray Fluorescence Elemental Analysis of Roasted And Non- Roasted…
DOI: 10.9790/2402-1204015170 www.iosrjournals.org 67 | Page
From the figure 9 concentration of Selenium of roasted and non-roasted coffee beans the experiment
was showed more or less similar except roasted Tepi coffee beans. In general in this study Selenium is least
minor mineral in both roasted and non-roasted. The maximum amounts of Selenium (2.803333 ± 4.263899) was
found from Tepi coffee specialty and the minimum was found Bebeka (0.14 ± 0.034641) in roasted coffee
beans. On the non-roasted Sidama (0.726667 ± 1.024906) has highest and Bebeka (0.15 ± 0.051962) has the
lowest concentration. When we Comparison of Observed Selenium concentration with standards Values for row
and roasted coffee beans, respectively, the Selenium contents observed are higher than with the standards NIST
(0.05). However their where not found reported values of selenium concentration before.
The order of roasted and non-roasted coffee specialty concentration from highest to lowest are;
Roasted: Tepi (2.803333 ± 4.263899) > Sidama (0.913333 ± 0.741912) > Limu (0.656667 ±
0.929534) > Gimbi (0.293333 ± 0.219393) > Harare (0.233333 ± 0.147422) > Yirgachefe (0.153333 ±
0.040415) > Bebeka (0.14 ± 0.034641)
For Non-Roasted: Sidama (0.726667 ± 1.024906) > Gimbi (0.463333 ± 0.568888) > Yirgachefe
(0.346667 ± 0.280238) > Harare (0.343333 ± 0.195021) > Metu (0.34 ± 0.381051) > Tepi (0.293333 ±
0.300222) > Limu (0.156667 ± 0.063509) > Bebeka (0.15 ± 0.051962)
Bromine (Br) is an active non-metal, which is included in the group of halogens. It is hard to
overestimate the role of bromine in the human body. It is an active part in the digestion of carbohydrates and
fats, Activates pepsin production in gastritis with low acidity, Participates in the activation of certain enzymes,
under the influence of bromide ions is an oppression of the thyroid gland and Regulation of the functions of the
central nervous system. Low level or deficiency of bromine minerals is the cause for Seizures, insomnia,
agitation, irritability, hyperthyroidism. Whereas high level or overdoses are Poor memory, possible attention
deficit / hyperactivity disorder (ADD / ADHD) in children. Drowsiness, fatigue, nausea, vomiting, acne, skin
rash, blurred vision, dizziness, mania, pancreatitis, hallucinations, increased thirst, hunger and urination, muscle
weakness, hypothyroidism, psychosis, coma. Daily recommended intake of bromine from our food and water is
2 – 8 mg per day. The bromine rich source of food is Crops, Bread, Nuts, Kelp, seaweed and fish. [33]
From the figure 10 concentration of Bromide of roasted and non-roasted coffee beans the experiment
was showed more or less similar. In general in this study bromide is least minor mineral but higher than
selenium in both roasted and non-roasted. The maximum amounts of bromide (3.243333 ± 2.387139) was found
from Sidama coffee specialty and the minimum was found Gimbi (0.64 ± 1.00638) in roasted coffee beans. On
the non-roasted Tepi (2.643333 ± 0.8188) has highest and Gimbi (0.883333 ± 0.816354) has the lowest
concentration. When we Comparison of Observed bromide concentration with standards Values for row and
roasted coffee beans, respectively, the bromide contents observed are more or less similar with the standards
NIST (1.8) especially with Bebeka. However their where not found reported values of bromide concentration
before. The order of roasted and non-roasted coffee specialty concentration from highest to lowest are;
Roasted: Sidama (3.243333 ± 2.387139) > Harare (3.066667 ± 0.501431) > Yirgachefe (2.49 ±
1.009505) > Bebeka (1.826667 ± 0.120554) > Tepi (1.576667 ± 1.562189) > Limu (1.003333 ± 1.053107) >
Gimbi (0.64 ± 1.00638)
For Non-Roasted: Tepi (2.643333 ± 0.8188) > Harare (2.15 ± 0.416773) > Metu (2.126667 ±
0.662596) > Limu (2.093333 ± 0.275923) > Sidama (2.033333 ± 1.305731) > Yirgachefe (1.496667 ±
0.379781) > Bebeka (1.47 ± 0.697782) > Gimbi (0.883333 ± 0.816354)
Rubidium (Rb) is found in animal tissue and it resembles potassium in its distribution and excretory
pattern. Relatively high levels can be found in the soft tissue, while the skeletal tissue contains low level. The
additions of rubidium or cesium (Cs) to potassium-deficient diets prevent the lesions characteristic of potassium
depletion in rats and supports near normal growth for short periods of time. [45]
From the figure 11 concentration of Rubidium of roasted and non-roasted coffee beans the experiment
was showed more or less similar. In general in this study Rubidium the 2nd
minor mineral next to iron in both
roasted and non-roasted coffee beans. The maximum amounts of Rubidium (57.48333 ± 3.426432) was found
from Limu coffee specialty and the minimum was found Yirgachefe (20.4 ± 3.106751) in roasted coffee beans.
On the non-roasted Limu (49.27333 ± 0.77436) has highest and Tepi (18.87 ± 0.379868) has the lowest
concentration. When we Comparison of Observed Rubidium concentration with standards Values for row and
roasted coffee beans, respectively, the Rubidium contents observed are higher than the standards NIST (10.2).
However their where not found reported values of Rubidium concentration before.
The order of roasted and non-roasted coffee specialty concentration from highest to lowest are;
Roasted: Limu (57.48333 ± 3.426432) > Gimbi (46.84 ± 2.497539) > Bebeka (30.33 ± 456159) >
Harare (28.85667 ± 0.958454) > Tepi (25.18333 ± 0.870766) > Sidama (24.53 ± 1.636429) > Yirgachefe (20.4
± 3.106751)
For Non-Roasted: Limu (49.27333 ± 0.77436) > Metu (44.88333 ± 2.626906) > Gimbi (38.21 ±
2.030345) > Harare (29.60333 ± 0.825974) > Bebeka (28.91333 ± 1.453008) > Yirgachefe (24.79333 ±
3.836748) > Sidama (20.15667 ± 2.234107) > Tepi (18.87 ± 0.379868)
Energy Dispersive X-Ray Fluorescence Elemental Analysis of Roasted And Non- Roasted…
DOI: 10.9790/2402-1204015170 www.iosrjournals.org 68 | Page
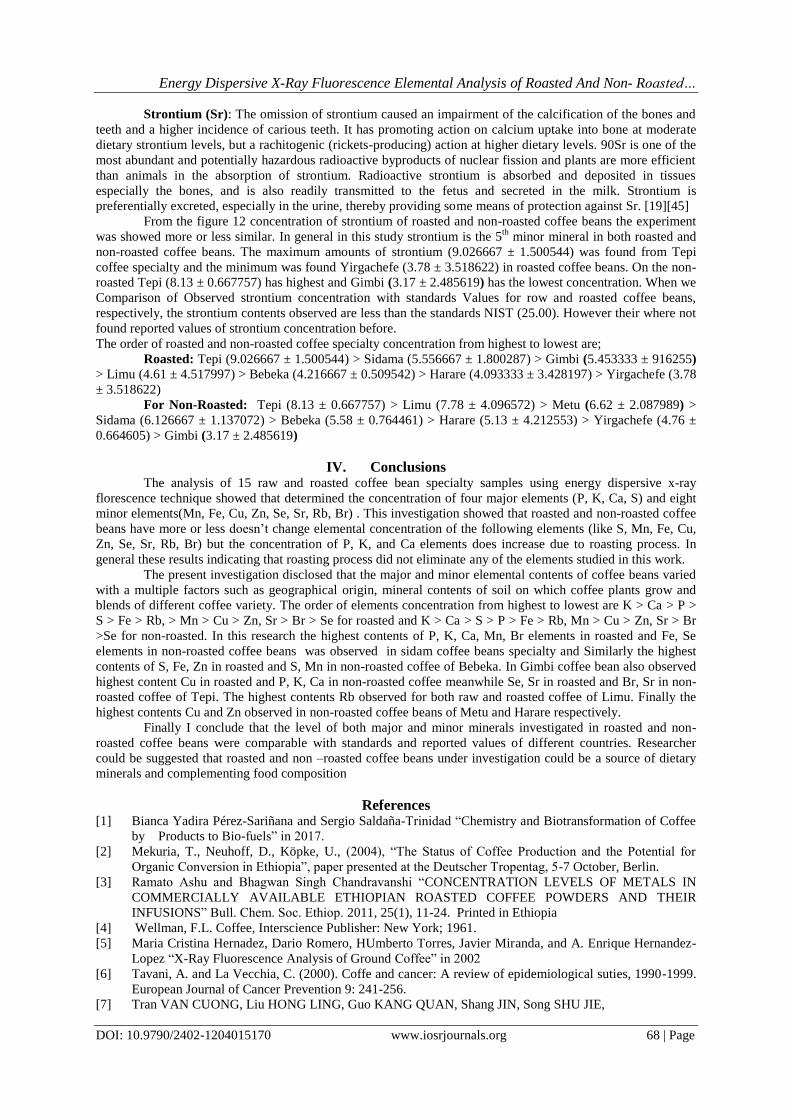
Strontium (Sr): The omission of strontium caused an impairment of the calcification of the bones and
teeth and a higher incidence of carious teeth. It has promoting action on calcium uptake into bone at moderate
dietary strontium levels, but a rachitogenic (rickets-producing) action at higher dietary levels. 90Sr is one of the
most abundant and potentially hazardous radioactive byproducts of nuclear fission and plants are more efficient
than animals in the absorption of strontium. Radioactive strontium is absorbed and deposited in tissues
especially the bones, and is also readily transmitted to the fetus and secreted in the milk. Strontium is
preferentially excreted, especially in the urine, thereby providing some means of protection against Sr. [19][45]
From the figure 12 concentration of strontium of roasted and non-roasted coffee beans the experiment
was showed more or less similar. In general in this study strontium is the 5th
minor mineral in both roasted and
non-roasted coffee beans. The maximum amounts of strontium (9.026667 ± 1.500544) was found from Tepi
coffee specialty and the minimum was found Yirgachefe (3.78 ± 3.518622) in roasted coffee beans. On the non-
roasted Tepi (8.13 ± 0.667757) has highest and Gimbi (3.17 ± 2.485619) has the lowest concentration. When we
Comparison of Observed strontium concentration with standards Values for row and roasted coffee beans,
respectively, the strontium contents observed are less than the standards NIST (25.00). However their where not
found reported values of strontium concentration before.
The order of roasted and non-roasted coffee specialty concentration from highest to lowest are;
Roasted: Tepi (9.026667 ± 1.500544) > Sidama (5.556667 ± 1.800287) > Gimbi (5.453333 ± 916255)
> Limu (4.61 ± 4.517997) > Bebeka (4.216667 ± 0.509542) > Harare (4.093333 ± 3.428197) > Yirgachefe (3.78
± 3.518622)
For Non-Roasted: Tepi (8.13 ± 0.667757) > Limu (7.78 ± 4.096572) > Metu (6.62 ± 2.087989) >
Sidama (6.126667 ± 1.137072) > Bebeka (5.58 ± 0.764461) > Harare (5.13 ± 4.212553) > Yirgachefe (4.76 ±
0.664605) > Gimbi (3.17 ± 2.485619)
IV. Conclusions The analysis of 15 raw and roasted coffee bean specialty samples using energy dispersive x-ray
florescence technique showed that determined the concentration of four major elements (P, K, Ca, S) and eight
minor elements(Mn, Fe, Cu, Zn, Se, Sr, Rb, Br) . This investigation showed that roasted and non-roasted coffee
beans have more or less doesn’t change elemental concentration of the following elements (like S, Mn, Fe, Cu,
Zn, Se, Sr, Rb, Br) but the concentration of P, K, and Ca elements does increase due to roasting process. In
general these results indicating that roasting process did not eliminate any of the elements studied in this work.
The present investigation disclosed that the major and minor elemental contents of coffee beans varied
with a multiple factors such as geographical origin, mineral contents of soil on which coffee plants grow and
blends of different coffee variety. The order of elements concentration from highest to lowest are K > Ca > P >
S > Fe > Rb, > Mn > Cu > Zn, Sr > Br > Se for roasted and K > Ca > S > P > Fe > Rb, Mn > Cu > Zn, Sr > Br
>Se for non-roasted. In this research the highest contents of P, K, Ca, Mn, Br elements in roasted and Fe, Se
elements in non-roasted coffee beans was observed in sidam coffee beans specialty and Similarly the highest
contents of S, Fe, Zn in roasted and S, Mn in non-roasted coffee of Bebeka. In Gimbi coffee bean also observed
highest content Cu in roasted and P, K, Ca in non-roasted coffee meanwhile Se, Sr in roasted and Br, Sr in non-
roasted coffee of Tepi. The highest contents Rb observed for both raw and roasted coffee of Limu. Finally the
highest contents Cu and Zn observed in non-roasted coffee beans of Metu and Harare respectively.
Finally I conclude that the level of both major and minor minerals investigated in roasted and non-
roasted coffee beans were comparable with standards and reported values of different countries. Researcher
could be suggested that roasted and non –roasted coffee beans under investigation could be a source of dietary
minerals and complementing food composition
References [1] Bianca Yadira Pérez-Sariñana and Sergio Saldaña-Trinidad “Chemistry and Biotransformation of Coffee
by Products to Bio-fuels” in 2017.
[2] Mekuria, T., Neuhoff, D., Köpke, U., (2004), “The Status of Coffee Production and the Potential for
Organic Conversion in Ethiopia”, paper presented at the Deutscher Tropentag, 5-7 October, Berlin.
[3] Ramato Ashu and Bhagwan Singh Chandravanshi “CONCENTRATION LEVELS OF METALS IN
COMMERCIALLY AVAILABLE ETHIOPIAN ROASTED COFFEE POWDERS AND THEIR
INFUSIONS” Bull. Chem. Soc. Ethiop. 2011, 25(1), 11-24. Printed in Ethiopia
[4] Wellman, F.L. Coffee, Interscience Publisher: New York; 1961.
[5] Maria Cristina Hernadez, Dario Romero, HUmberto Torres, Javier Miranda, and A. Enrique Hernandez-
Lopez “X-Ray Fluorescence Analysis of Ground Coffee” in 2002
[6] Tavani, A. and La Vecchia, C. (2000). Coffe and cancer: A review of epidemiological suties, 1990-1999.
European Journal of Cancer Prevention 9: 241-256.
[7] Tran VAN CUONG, Liu HONG LING, Guo KANG QUAN, Shang JIN, Song SHU JIE,

Energy Dispersive X-Ray Fluorescence Elemental Analysis of Roasted And Non- Roasted…
DOI: 10.9790/2402-1204015170 www.iosrjournals.org 69 | Page
[8] Tran LE LINH, Tran DUC TIEP “EFFECT OF ROASTING CONDITIONS ON
[9] CONCENTRATION IN ELEMENTS OF VIETNAM ROBUSTA COFFEE” DOI 10.2478/aucft- 2014-
0011
[10] C. Voicaa, I. Fehera, A. M. Iordacheb, G. Cristeaa, A. Deheleana, D. A. Magdasa, and V. Mirela
[11] “Multielemental Analysis of Coffee by Inductively Coupled Plasma-Mass Spectrometry” 2016,
[12] VOL.49, NO. 16, 2627–2643.
[13] Gogoasa I., Pirvu Alexandra , Alda Liana Maria, Velciov Ariana, Rada Maria, Bordea
[14] Despina Maria, Moigradean Diana, Simion A. and Gergen I. “The Mineral Content of Different Coffee
Brands” Volume 17(4), 68- 71, 2013
[15] ABERA GURE. Investigation of Metals in Raw and Roasted Indigenous Coffee Varieties in Ethiopia.
JULY 2006
[16] https://en.wikipedia.org/wiki/Chiro_(town)
[17] https://en.wikipedia.org/wiki/Tepi
[18] https://en.wikipedia.org/wiki/Aleta_Wendo
[19] https://en.wikipedia.org/wiki/Yirgachefe_ (woreda)
[20] https://en.wikipedia.org/wiki/Gimbi
[21] https://en.wikipedia.org/wiki/Metu,_Ethiopia
[22] https://en.wikipedia.org/wiki/Mizan_Teferi
[23] https://en.wikipedia.org/wiki/Limmu_Kosa
[24] K. O. Soetan1, C. O. Olaiya and O. E. Oyewole. The importance of mineral elements for human’s
domestic animals and plants: A review. African Journal of Food Science Vol. 4(5) pp. 200-222, May
2010 Available online http://www.academicjournals.org/ajfs
[25] Sandra Bastin, Ph.D., R.D., L.D. Extension Food & Nutrition Specialist. MINERALS IN THE DIET.
Educational programs of the Kentucky Cooperative Extension Service. Issued 03-96; FN-SSB.028LG.
[26] Ixta Menchaca, Jennifer Smith. Minerals: Elements of Human Nutrition. 2009 Learning Seed. ISBN 1-
55740-544-2. [email protected]
[27] Eruvbetine D (2003). Canine Nutrition and Health. A paper presented at the seminar organized by
Kensington Pharmaceuticals Nig. Ltd. Lagos on August 21, 2003.
[28] Hamilton St. Joseph’s Healthcare. Kidney Disease and Phosphorus. PD 3659 (Rev 2007-01)
[29] Robin Madell. Phosphorus in Your Diet. Helthline Medically reviewed by Debra Sullivan, PhD, MSN,
RN, CNE, COI on December 14, 2015
[30] Health effects of phosphorus. https://www.lenntech.com/periodic/elements/p.htm#ixzz53tUB8ftX
[31] Anderson, K. A.; Smith, B. W. Chemical profiling to differentiate geographic growing origins of coffee,
J. Agric. Food Chem. 2002, 50, 2068-2075.
[32] Health effects of sulfur. https://www.lenntech.com/periodic/elements/p.htm#ixzz53tUB8ftX
[33] KATHRYNE PIRTLE. ORGANIC SULFUR–WHY IS SULFUR SO IMPORTANT TO HEALTH AND
WHY HAS IT BEEN DEPLETED IN OUR FOODS? DECEMBER 30, 2009
[34] STEPHANIE SENEFF, PHD . Sulfur Deficiency. This article appeared in Wise Traditions in Food,
Farming and the Healing Arts, the quarterly journal of the Weston A. Price Foundation, JULY 2 2011.
[35] Kristeen Cherney. Potassium. Helthline Medically reviewed by George Krucik, MD, MBA on November
15, 2006.
[36] Megan Ware RDN LD . Everything you need to know about potassium. Reviewed by Alan Carter,
PharmD medical news today, last updated Wed 10 January 2018
[37] M. Grembecka, E. Malinowska, P. Szefer. Differentiation of market coffee and its infusions in view of
their mineral composition science of Total Environment. 2007, 383, 59.
[38] A.Tesfay Gebretsadik, Tarekegn Berhanu, Belete Kefarge. Levels of Selected Essential and non-
Essential Metals in Roasted Coffee Beans of Yirgacheffe and Sidama, Ethiopia. American Journal of
Environmental Protection. 2015, vol 4. No 4 pp 188-192
[39] Hluchan, Stephen E.; Pomerantz, Kenneth "Calcium and Calcium Alloys", Ullmann's Encyclopedia of
Industrial Chemistry, Weinheim: Wiley-VCH, doi:10.1002/14356007.a04_515.pub2 (2005).
[40] David Kiefer, MD . Calcium/Vitamin D. Calcium WebMD Medical. October 31, 2016.
[41] Steven D. Ehrlich, NMD. Manganese. Review provided by VeriMed Healthcare Network. May 31, 2013
[42] Kies C. Bioavailability of manganese. In: Klimis-Tavantzis DL, ed. Manganese in health and disease.
Boca Raton: CRC Press, Inc; 1994:39-58.
[43] http://drlwilson.com/Articles/IRON.htm
[44] Hambidge M: Zinc and Health: Current status and future directions. J Nutr 2000, 130(Suppl):1344-1349.
[45] Joseph Nordqvist. What are the health benefits of zinc? Reviewed by Debra Rose Wilson, PhD, MSN,
RN, IBCLC, AHN-BC, CHT. Tue 5 December 2017
[46] Dr Rob Hicks . Vitamins & minerals health centre. WebMD. June 30, 2017
Energy Dispersive X-Ray Fluorescence Elemental Analysis of Roasted And Non- Roasted…
DOI: 10.9790/2402-1204015170 www.iosrjournals.org 70 | Page
[47] Murray RK, Granner DK, Mayes PA, Rodwell VW (2000). Harper’s Biochemistry, 25th Edition,
McGraw-Hill, Health Profession Division, USA.
[48] https://www.lenntech.com/periodic/elements/se.htm#ixzz54V5t8fVz from internet 1998-2018 Lenntech
B.
[49] EuroMD, Portal for patients. From internet at
[50] Jump up^ "The biological role of strontium". Retrieved 2010-10-06.
[51] Pawel Pohl & Ewelina Stelmach & Maja Welna & Anna Szymczycha-Madeja “Determination of the
Elemental Composition of Coffee Using Instrumental Methods” Food Anal. Methods (2013) 6:598–613
H. Masresha Feleke1,*,. " Energy Dispersive X-Ray Fluorescence Elemental Analysis of
Roasted And Non- Roasted Ethiopian Coffee Specialty." IOSR Journal of Environmental
Science, Toxicology and Food Technology (IOSR-JESTFT) 12.4 (2018): 51-70.
Related Documents