ENERGY DEMAND AND INDOOR CLIMATE OF A TRADITIONAL LOW-ENERGY BUILDING IN A HOT CLIMATE ANG LI June, 2009 EXAMER:Bahram Moshfegh Master Programme in Energy Systems DEPARTMENT OF TECHNOLOGY AND BUILT ENVIRONMENT

Welcome message from author
This document is posted to help you gain knowledge. Please leave a comment to let me know what you think about it! Share it to your friends and learn new things together.
Transcript

ENERGY DEMAND
AND INDOOR CLIMATE OF A TRADITIONAL
LOW-ENERGY BUILDING
IN A HOT CLIMATE
ANG LI June, 2009
EXAMER:Bahram Moshfegh
Master Programme in Energy Systems
DEPARTMENT OF TECHNOLOGY AND BUILT ENVIRONMENT


ACKNOWLEDGEMENTS
Here I would give my sincere thanks to Professor Bahram Moshfegh, and Ulf Larrson of HIG, for their enthusiastic support and guidance.
Patrik Rohdin of LIU, and Ph. D students Fei Xue, Huijuan Chen of HIG have offered me a lot of kind help during the thesis.
All the teachers here have let me learn a lot; I’m grateful to their and extensive knowledge, and excellent teaching skills.
Special thanks to my classmates Sheng Gong, Dixiao Bao from China, Aitor Sancet from Spain, Yohann from France, and all the other classmates, for their warmhearted help and encouragements in my study and life in Sweden.
All of these compose an unforgettable one-year time in Sweden. It is a unique and happy memory in my life. I love the people; I love Sweden!


ABSTRACT
Energy demand in the built environment is quite important. China holds a large population and the energy use in the building sector is about 1/3. The rebuilding of old houses and building new low energy houses are becoming more and more popular in China. Low energy building not only consumes less energy, but also provides good indoor environment.
An indoor climate software IDA is used in energy and indoor climate simulation. The traditional high isolated low energy house in a hot climate is analyzed, on a typical day in either summer or winter, or during the whole year. Energy consumptions under different parameters are presented. Results show that high isolated house may not always be suitable in a hot climate.
Key words: Low energy building, energy simulation, hot climate


TABLE OF CONTENTS
1 INTRODUCTION.............................................................................................................................1
1.1 BACKGROUNDS ........................................................................................................................1 1.2 OBJECTIVES .............................................................................................................................1 1.3 AIDING TOOLS..........................................................................................................................2
2 THEORIES........................................................................................................................................3
2.1 ENERGY BALANCE OF BUILDING .............................................................................................3 2.2 HEATING & COOLING ..............................................................................................................4
2.2.1 HEAT DEFICIT AND HEAT SURPLUS ........................................................................4 2.2.2 HEATING AND COOLING SYSTEMS.......................................................................5
2.3 VENTILATION...........................................................................................................................6 2.4 INDOOR AIR QUALITY ..............................................................................................................6 2.5 HVAC SYSTEM.........................................................................................................................7
2.5.1 COMPONENTS .................................................................................................................7 2.5.2 TYPES.............................................................................................................................8 2.5.3 ENERGY CONSUMPTION..........................................................................................9
2.6 SHADING DEVICES .................................................................................................................10 2.6.1 INTERNAL SHADING ...................................................................................................10 2.6.2 EXTERNAL SHADING ..............................................................................................10
2.7 THERMAL COMFORT.............................................................................................................. 11 2.8 LOW ENERGY BUILDING.........................................................................................................12
3 PROCESS AND RESULTS ..............................................................................................................13
3.1 DESCRIPTION OF MACAO AND ITS CLIMATE............................................................................13 3.1.1 GEOGRAPHICAL DESCRIPTION OF MACAO ..........................................................13 3.1.2 CLIMATE DESCRIPTION OF MACAO .......................................................................14
3.2 DESCRIPTION OF THE BUILDING............................................................................................16 3.3 CASES DESCRIPTION ..............................................................................................................18
3.3.1 FOUNDATIONAL REFERENCE CASE .......................................................................18 3.3.2 CASES FOR COMPARISON ......................................................................................20
3.4 SIMULATION RESULTS ...........................................................................................................22 3.4.1 ON A TYPICAL SUMMER DAY ....................................................................................22 3.4.2 ON A TYPICAL WINTER DAY..................................................................................26 3.4.3 DURING THE WHOLE COOLING SEASON..........................................................31 3.4.4 DURING THE WHOLE WINTER SEASON............................................................34 3.4.5 DURING THE WHOLE YEAR...........................................................................................37
4 DISCUSSION ..................................................................................................................................39
5 CONCLUSSION .............................................................................................................................45
REFERENCES ........................................................................................................................................47


ENERGY DEMAND AND INDOOR COLIMATE OF A TRIDITIONAL LOW‐ENERGY BUILDING IN A HOT CLIMATE
~ 1 ~
1 INTRODUCTION
1.1 BACKGROUNDS
Energy consumption in the building sector is high, and takes about 1/3 part of the whole social energy consumption [1]. China holds the world largest population, and residential houses amount is quite huge. The total energy consumption of residential building thus is quite high.
To rebuild old houses and build new low energy houses under the consideration of energy saving are now becoming more and more urgent and important. This is becoming the national policy. The government encourages the low energy building and more policy would be carried out [1].
China is big, and covers large different climate zones. In north China, residential buildings rarely need cooling, only heating is needed in the winter; while in south China, residential buildings rarely need heating, only cooling is needed in the summer. However, people are often interested in the building energy saving in the cold climate, and focus on reservation and good utilization of heat in the building in the winter. But people usually pay less attention to the energy saving of the buildings in the south in summer time. Cooling by individual air-conditioner cooling equipments also consumes much energy.
1.2 OBJECTIVES
In this thesis, we will present a traditional low-energy house. This house is well insolated and is always used to study the energy demand in the cold climate, such as in Sweden. Here, I want to put this house into a hot climate, - Macao, special administrative region of P. R. China, where heating is rarely needed.
Under the preconditions of presenting a comfortable residential environment, my objectives are:
To simulate the energy demand of that house in the hot climate;
To present how different parameters affect the energy demand;

ENERGY DEMAND AND INDOOR COLIMATE OF A TRIDITIONAL LOW‐ENERGY BUILDING IN A HOT CLIMATE
~ 2 ~
To give possible suggestions of energy saving of the residential houses in the hot climate.
1.3 AIDING TOOLS
IDA Indoor Climate and Energy (ICE) 3.0 is a tool for simulation of thermal comfort, indoor air quality and energy consumption in buildings. It is a whole building simulator, which allows simultaneous performance assessments of form, fabric, glazing, HVAC systems, controls, light, indoor air quality, comfort, energy consumption and etc [2].
IDA ICE can help us to study the energy consumption in individual zones as well as for the whole building. And indoor climate represents air quality and thermal comfort.

ENERGY DEMAND AND INDOOR COLIMATE OF A TRIDITIONAL LOW‐ENERGY BUILDING IN A HOT CLIMATE
~ 3 ~
2 THEORIES
To analyze the building energy consumption as well as the indoor climate, we should know how the basic theories concerning building simulation. Energy analyzing is commonly based on the building physics theories.
2.1 ENERGY BALANCE OF BUILDING
The indoor climate in the rooms of a building is influenced by four main facts listed below [3]:
The structure and the design of the building;
The activities going on in the building;
The outdoor climate conditions;
The technical systems that provide the required indoor climate.
Energy balance of the building means that energy gains of the building equal the energy loss of the building, which includes all sources and sinks of energy inside a building, as well as all energy flows through the building envelope.
Figure 2-1① Heat Balance of a Building
Thus heat balance can be determined by the following:
① http://nesa1.uni-siegen.de/wwwextern/idea/keytopic/figures/3_2.gif

ENERGY DEMAND AND INDOOR COLIMATE OF A TRIDITIONAL LOW‐ENERGY BUILDING IN A HOT CLIMATE
~ 4 ~
Transport of heat through walls, floors, windows etc. of the building; ( transmission)
Storage of heat in the building structure (e.g. solar irradiation);
Internal heat generation by the equipments, lights, people, etc.;
Ventilation and infiltration through the building envelope;
Etc.
The power balance of a building can be described as in Eq. 2-1 [4]
sewageoninfiltratinventilationransmissiointernalsupply PPPPPP t +++=+η Eq. 2-1)
where η is the power supply efficiency.
internalP consists of several parts, such as solar irradiation, heat from equipments,
lights, or inhabitants. Thus Eq. 2-1 can be rewritten as
( ) ( ) ( )coldsewerwaterp,outinairp,outinetc. lights, ,equipmentssolarsupply TTcvTTcqTTUAPPP −+−+−=++ ∑ &ρη
Eq. 2-2)
where U is the overall thermal transmittance of the building; A is the area; q is
the total ventilation and infiltration airflow; v& is the mass flow of water; while airp,c
and waterp,c are the specific heat capacities of air and water respectively. [5]
2.2 HEATING & COOLING
2.2.1 HEAT DEFICIT AND HEAT SURPLUS
If there is no internal heat generation inside the building envelope, the room temperature would be the same as the outdoor temperature. When the external temperature changes, the internal temperature would be different, but after a long while, a temperature balance would be established.
If there is a internal heat generation inside the building, the internal temperature

ENERGY DEMAND AND INDOOR COLIMATE OF A TRIDITIONAL LOW‐ENERGY BUILDING IN A HOT CLIMATE
~ 5 ~
would be higher than the external temperature. If the temperature difference is kept, there must be a continuous internal heat supply.
Figure 2-2① Heat Deficit and Heat Surplus
Room temperature should be kept in a certain level. Simply speaking, when the internal heat generation goes over the heat loss at the highest accepted room temperature, there will be a heat surplus which has to be removed. On the other hand, in cold days, if the internal heat generation is not enough to reach the lowest accepted room temperature, there will be a heat deficit which has to be added. [3]
This means, if there is a heat surplus, we need cooling; while if there is a heat deficit, we need heating.
2.2.2 HEATING AND COOLING SYSTEMS
Heating and cooling systems consist of production systems and distribution systems. [4]
① Building Energy Systems Lectures 2008, Taghi Karimipanah, HIG

ENERGY DEMAND AND INDOOR COLIMATE OF A TRIDITIONAL LOW‐ENERGY BUILDING IN A HOT CLIMATE
~ 6 ~
Production systems for heating: boilers, heat pumps, heat exchangers, solar heating systems, and district heating systems.
Production systems for cooling: electric air conditioners, absorption cooling devices. In China, individual electric air conditioners are commonly used during summer time, which consume more energy than other cooling devices.
Air, water, or direct electricity system, which is usually used as the energy carrier, composes the heating and cooling distribution system.
2.3 VENTILATION
To supply fresh air and remove pollutants in a controlled way, we use ventilation. Ventilation can be divided into natural ventilation and mechanical ventilation.
When neglecting the effects of latent heat and heat recovery, heat loss due to ventilation can be expressed by
( )outinairp,airnventilatio TTnVcP −= ρ Eq. 2-3)
Where n is the air exchange rate per hour (h-1); V is the room volume.
Fans are commonly used in the mechanical ventilation system. Supply and exhaust fans force the air flow into or out of the building, which make air pressure differences between the building and the surroundings. The electricity consumption of the fans can be gained by
tot
totfan
Δη
pqP = Eq. 2-4)
where q is the airflow introduced ed by the fan; totΔp is the total pressure rise/
drop; totη is the total efficiency of the fan.
2.4 INDOOR AIR QUALITY
The indoor air quality directly impacts the comfort and productivity. Bad indoor

ENERGY DEMAND AND INDOOR COLIMATE OF A TRIDITIONAL LOW‐ENERGY BUILDING IN A HOT CLIMATE
~ 7 ~
air quality even may lead the occupants to a reduced working efficiency. [6]
In a narrow sense, indoor air quality is only related to the airborne pollutants, which are found as different gases and as well as particles of different substances and sizes. These airborne pollutants may come from the activity of occupants, emissions from the building structure or building materials, emissions from furniture and equipments, etc. The more airborne pollutants are, the worse indoor air quality is. [7]
To achieve an acceptable level of air quality, there is always need of some kind of ventilation that removes airborne pollutants, and at the same time we use air for removal of heat surplus. [3]
In a generalized sense, indoor air quality covers more aspects, such as the indoor air temperature, relative air humidity, air velocity, fresh air rate and etc [8]. Table 2-1 shows some data from the China Indoor air quality standard.
Table 2-1
Parameters Units Amount Note 22~28 Summer
Temperature ℃ 16~24 Winter 40~80 Summer
Relative Humidity % 30~60 Winter
0.3 Summer Air Velocity m/s
0.2 Winter Fresh Air Rate m3/h-person 30 max
We will discuss more in the later Thermal Comfort chapter.
2.5 HVAC SYSTEM
HVAC system means Heating, Ventilation, Air Conditioning system. An ideal HVAC system can not only heat and cool the various spaces, but also can provide good indoor air quality in building simultaneously upon requirement.
2.5.1 COMPONENTS
Air Handing Unit (AHU). It is a device used to condition and circulate air and distribute the conditioned air through the building, and returns it to the AHU.[10]
ENERGY DEMAND AND INDOOR COLIMATE OF A TRIDITIONAL LOW‐ENERGY BUILDING IN A HOT CLIMATE
~ 8 ~
Heat exchanger. It is used as a heat recovery device, which is used to heat or cool supply air from the exhaust air.
Air delivery device. It is a device of supplying or returning air in the zones, such as ductwork, diffusers or grilles.
Boilers, chillers, pumps, etc. [9]
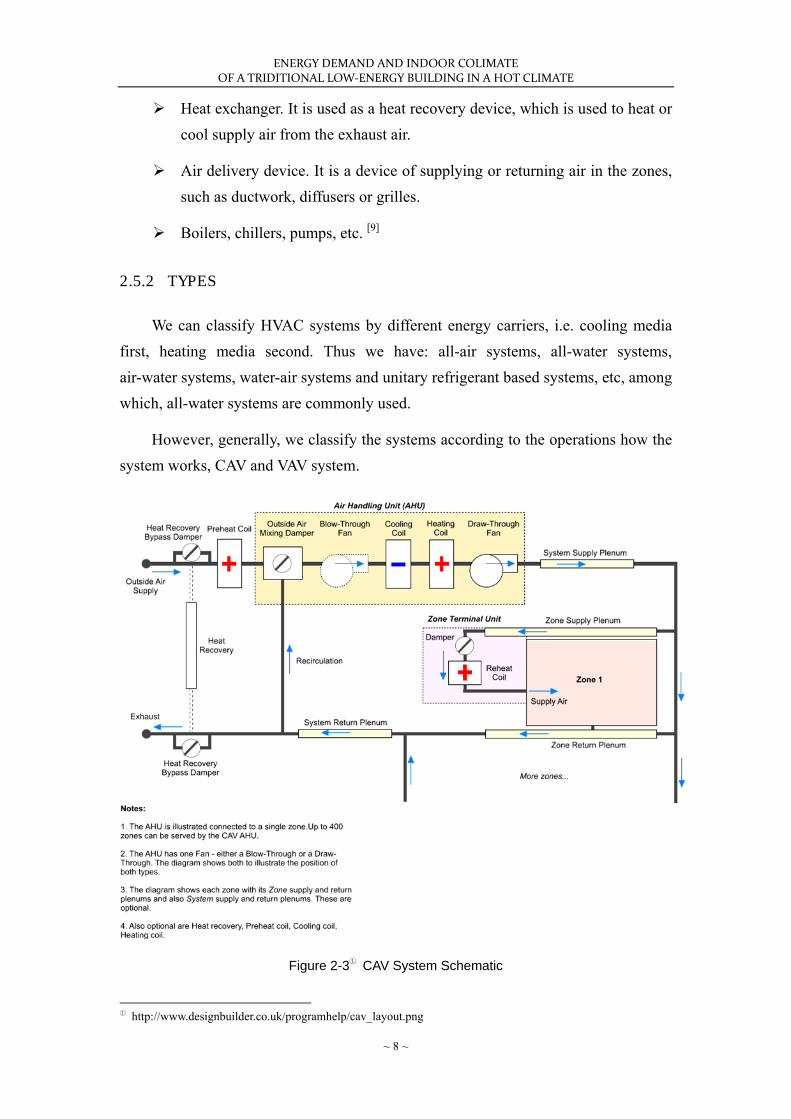
2.5.2 TYPES
We can classify HVAC systems by different energy carriers, i.e. cooling media first, heating media second. Thus we have: all-air systems, all-water systems, air-water systems, water-air systems and unitary refrigerant based systems, etc, among which, all-water systems are commonly used.
However, generally, we classify the systems according to the operations how the system works, CAV and VAV system.
Figure 2-3① CAV System Schematic
① http://www.designbuilder.co.uk/programhelp/cav_layout.png

ENERGY DEMAND AND INDOOR COLIMATE OF A TRIDITIONAL LOW‐ENERGY BUILDING IN A HOT CLIMATE
~ 9 ~
CAV – Constant Air Volume system: In this kind of system, the supply air flow rate is usually constant, and the air conditioner works on/off to meet the heating or cooling requirements.
Figure 2-4① VAV System Schematic
VAV – Variable Air Volume system: The system can adjust itself to provide a proper air flow rate to meet the rising and falling heat gains or losses in the thermal zone. Usually, VAV system can save more energy than a CAV system.
2.5.3 ENERGY CONSUMPTION
The electricity is used to drive fans to supply air into the zones or to exhaust air
① http://www.designbuilder.co.uk/programhelp/vav_layout.png

ENERGY DEMAND AND INDOOR COLIMATE OF A TRIDITIONAL LOW‐ENERGY BUILDING IN A HOT CLIMATE
~ 10 ~
out of zones. Electricity is also used to drive pumps to distribute the water in the ductwork.
Heating or cooling energy is used to heat or cool the water cycle in the ductwork, or to heat or cool the supply air. The heating cooling energy is not usually in the for of electricity.
2.6 SHADING DEVICES
Solar radiation into the occupied zones will increase the heat loads in the building envelope. During summer time or in a hot climate, buildings may face a problem of overheating. Shading devices should prevent unwanted solar gains in summer and permit high solar gains in winter. The solution is to use retractable shading devices. [11]
2.6.1 INTERNAL SHADING
Internal shading devices, which are installed inside the zones, include roller shades, vertical blinds, persian blinds, and blinds between the glass panes.
These internal shading devices can control the glare well to avoid strong sunlight, but they cannot effectively stop the solar heat coming into the zones. The heat is trapped on the interior of the windows, but is still kept inside the zones.
2.6.2 EXTERNAL SHADING
External shading devices are installed on the exterior of the building, fixed a bit higher to the outside window. Typical devices include shutters, awnings, solar screens, and louvers.
External shading devices can cut of direct sunlight radiation, thus contribute to reduce the cooling loads in the summer. They can also control the glare into the zones, and lower the cooling energy consumption, and they are also considered as passive cooling devices.

ENERGY DEMAND AND INDOOR COLIMATE OF A TRIDITIONAL LOW‐ENERGY BUILDING IN A HOT CLIMATE
~ 11 ~
2.7 THERMAL COMFORT
Residential building should provide comfortable conditions for the occupants to live in. Thermal comfort is the condition of mind that expresses satisfaction with the thermal environment.
Thermal comfort conditions depend on not only air temperature, but also other important parameters, such as mean radiant temperature of surrounding surfaces, relative air velocity, water vapour pressure in ambient air, relative humidity, activity and clothing of the occupants, etc. [12]
Thermal environment can be described as a heat balance of a human body as in the following Eq. 2-5
bodybodybodybodybodybody RESEQWMS −−++= Eq. 2-5)
where bodyS is the body heat storage, bodyM is the metabolic rate, bodyW is the
mechanical work, bodyQ is the heat exchange with surroundings including convection,
conduction, and radiation, bodyE is the heat loss due to evaporation, and the last
bodyRES is the heat loss due to respiration.
To quantify the thermal comfort, we must estimate the MET value due to people’s activity and metabolism, and CLO value due to clothing level. All of these can be found in the ASHRAE Fundamentals handbook as a reference.
The human thermal comfort can be quantified by PMV index, which is predicted mean vote index. It is a index of -3~+3 scale to describe the thermal sensation from too cold (-3) to too hot (+3).
The formula proposed by Fanger is [13]
[ ]Le M 028.0303.0155.3PMV 114.0 += − Eq. 2-6)
where L is the heat load on human body due to the parameters of CLO value, air temperature, air velocity, etc.
PMV index is too high or too low means that a large percentage of people would feel uncomfortable in the zones. To see clearly the percentage, PPD index is proposed,

ENERGY DEMAND AND INDOOR COLIMATE OF A TRIDITIONAL LOW‐ENERGY BUILDING IN A HOT CLIMATE
~ 12 ~
which stands for Predicted Percentage of Dissatisfied. Just as its name implied, the PPD index is in percentage form 0~100%, moreover, the lower, the better.
The formula of PPD in relation to PMV is listed as Eq. 2-7 [13] below
( )24 PMV 2179.0PMV 03353.095100PPD +−−= e Eq. 2-7)
We cannot always make 100% people satisfied with the thermal environment. A thermal environment response of 80% satisfied is acceptable, which corresponds to PMV from -1 to +1, according to the ASHRAE standard 55 2004.
2.8 LOW ENERGY BUILDING
It is difficult to define “low energy building” precisely. Low energy building may mean the building that achieves “zero energy” requirements and reduces the energy consumption according to the Abel definition. [14]
The aim of the low energy building is to minimize the amount of external purchased energy in the form of electricity, fuel, district heating, or minimize the energy cost. To achieve this goal, energy consumption should be reduced, and energy utilization efficiency should be increased as well. That is to say, low energy building should aim at the highest energy efficiency as well as consume the lowest possible energy need under consideration of economic limits of reason. [16]
Good design practices and effective use of energy efficient technologies can help to achieve the low energy consumption of building. Even ideally, building can even become the energy producer instead of energy consumer. [15]

ENERGY DEMAND AND INDOOR COLIMATE OF A TRIDITIONAL LOW‐ENERGY BUILDING IN A HOT CLIMATE
~ 13 ~
3 PROCESS AND RESULTS
In this chapter, we start to apply the theories in to a study case in a hot climate. Thus, the climate and the building description should be presented first, and thereafter the study case will be introduced. Different parameters changed cases will be studied with aids of energy simulation software IDA ICE in different conditions.
3.1 DESCRIPTION OF MACAO AND ITS CLIMATE
3.1.1 GEOGRAPHICAL DESCRIPTION OF MACAO
Figure 3-1① Satellite Map of Macao
① Source: Google Earth 2009

ENERGY DEMAND AND INDOOR COLIMATE OF A TRIDITIONAL LOW‐ENERGY BUILDING IN A HOT CLIMATE
~ 14 ~
The Macao Special Administrative Region (MSAR) is a part of P. R. China’s territory. It is facing the South China Sea and located on the Southeast coast of China to the west of the Pearl River Delta. Macao is 60km to the west of Hong Kong and bordering on Zhuhai, Guangdong Province of China mainland.
Macao is located around the latitude of 22.2°N and the longitude of 113.5°E, at the south of tropic of Cancer, and covers 29.2km2 areas. [17]
3.1.2 CLIMATE DESCRIPTION OF MACAO
Macao is under control of a subtropic maritime monsoon climate. It has a hot, rainy, and humid summer. From June to September, the temperature can rise to over 30ºC. On the other hand, Macao’s winter is from January to February, and the average temperature seldom falls below 14ºC. Macao enjoys a delightful winter. The most comfortable period begins from the middle of October to December.
The annual mean temperature is 22.4 degrees Celsius. The annual average relative humidity is around 79.3%, and the total annual rain fall is 2133.4mm. More specific average details of months can be found in Table 3-1 which covers a 30-year statistic of some meteorological elements ( 1971 - 2000 ).
Table 3-1[18]
Air Temperature(°C) Wind Items Mean
Max Average
Mean Min
Average RH(%)
Daylight Hours
Total Rainfall (mm) Direction Speed
Thunderstorm (days)
January 17.7 14.8 12.2 74.3 132.4 32.4 N 13.7 0.1February 17.7 15.2 13.1 80.6 81.8 58.8 N 13.2 1.1
March 20.7 18.2 16.2 84.9 75.9 82.7 ESE 12.1 2April 24.5 22.1 20.2 86.2 87.8 217.4 ESE 11.8 4.6May 28.1 25.5 23.5 85.6 138.4 361.9 ESE 12.1 6.9June 30.3 27.7 25.7 84.4 168.2 339.7 SW 12.2 8.3July 31.5 28.6 26.3 82.2 226.2 300 SW 11.9 9.4
August 31.2 28.3 26 82.5 194.7 351.7 SW 11.2 10.7September 30 27.3 24.9 79 182.2 194.2 ESE 12.8 5.9
October 27.4 24.7 22.3 73.4 195 116.9 ESE 14.9 1November 23.4 20.4 17.8 69.3 177.6 42.6 N 14.8 0.1December 19.6 16.5 13.8 68.8 167.6 35.2 N 14.1 0Average 25.2 22.4 20.2 79.3 1828 2133.4 ESE 12.9 50.1
To see the trend clearly of the temperature and the relative humidity clearly,

ENERGY DEMAND AND INDOOR COLIMATE OF A TRIDITIONAL LOW‐ENERGY BUILDING IN A HOT CLIMATE
~ 15 ~
Figure 2-1 shows the temperature and the relative humidity.
0
10
20
30
40
50
60
70
80
90
100
Janu
ary
February
March
April
MayJu
ne July
Augus
t
Septem
ber
Octobe
r
Novem
ber
Decem
ber
Mean max temperature (°C)Average temperature (°C)Mean min temperature (°C)Average RH(%)
Figure 3-2 30-year statistic of Macao
In this thesis, a package of climate data of a typical whole year in Macao is used. All the meteorological data are taken form the ASHRAE Fundamentals handbook. The average temperature and RH data per hour of the whole year are shown in Figure
3-3.
0
10
20
30
40
50
60
70
80
90
100
0 500 1000 1500 2000 2500 3000 3500 4000 4500 5000 5500 6000 6500 7000 7500 8000 8500
Temperature (°C) RH (%)
Figure 3-3 Climate Data Used in the Simulations

ENERGY DEMAND AND INDOOR COLIMATE OF A TRIDITIONAL LOW‐ENERGY BUILDING IN A HOT CLIMATE
~ 16 ~
3.2 DESCRIPTION OF THE BUILDING
In thesis, a traditional cold region low energy building is used. The building was situated in south of Gothenburg on the west coast of Sweden in a cold climate.
The following figures show the building structures and layout.
Figure 3-4 Side-view of the Building
Some basic data of the building are shown in Table 3-2 below.
Table 3-2 Total floor area 120 m2
Ground floor area 60 m2 External wall area 38 m2
Window area 18 m2 Total volume 340 m3
Ceiling height, ground floor 2.5 m Ceiling height, upper floor 2.2–4.3 m
Windows
Triple glazing (4mm panes) with two low-e coated panes. The spaces
between the panes are either filled with argon or krypton.
The house consists of a ground floor, an upper floor, and an attic. On the ground floor, there is a kitchen, a living room, and a water closet. On the upper floor, there are there bedrooms, a toilet and a hall. The layout of different zone are shown in

ENERGY DEMAND AND INDOOR COLIMATE OF A TRIDITIONAL LOW‐ENERGY BUILDING IN A HOT CLIMATE
~ 17 ~
Figure 3-5.
Figure 3-5 Layout of the House
The detail structure data of each zone is shown in Table 3-3.
Table 3-3 Available Area/m2 Height /m
Kitchen 22.1 2.5 Living Room 37.1 2.5 Bedroom A 13.5 2.5
WC 8.8 2.6 Hall 14.5 4.9
Bedroom B 11.2 2.5 Bedroom C 11.2 2.5

ENERGY DEMAND AND INDOOR COLIMATE OF A TRIDITIONAL LOW‐ENERGY BUILDING IN A HOT CLIMATE
~ 18 ~
3.3 CASES DESCRIPTION
3.3.1 FOUNDATIONAL REFERENCE CASE
The case is designed for a cold climate, so the houses are well insulated. More detailed data are shown below.
MATERIALS
Table 3-4
Heat conductivity
(W/m K)
Density (kg/m3)
Specific Heat (J/kg K)
Plaster 0.8 1800 790 Light Concrete 0.15 500 1050 Light Isolation 0.036 20 750
Gypsum 0.22 970 1090 Air in the Vertical column① 0.17 1.2 1006
Plastic Mat 0.18 1100 920 Concrete 1.7 2300 880
ELEMENTS OF CONSTRUCTION
Table 3-5
External
Walls Internal Walls
Internal Floors
Roof External
Floor U-value (W/m2 K) 0.08 0.62 0.62 0.12 2.9
Plaster 0.01 - - - - Plastic Mat - - 0.005 - 0.005
Gypsum - 0.026 0.013 - - Light Concrete 0.25 - - - -
Concrete - - - - 0.25 Air - 0.032 - - -
Light Isolation 0.38 0.03 0.045 0.28+0.01 - Air - 0.032 - - -
Gypsum - 0.026 0.026 - -
Thickness (m)
Plaster 0.01 - - - -
As for glazing we use a kind of high isolation 2-pane glazing windows (15mm argon between two panes), with the U-value of 0.74 W/m2 K. The solar heat gain coefficient is 0.49, and the solar transmittance is 0.36. Both the internal and external
① Here we consider air gap as a kind of construction materials.

ENERGY DEMAND AND INDOOR COLIMATE OF A TRIDITIONAL LOW‐ENERGY BUILDING IN A HOT CLIMATE
~ 19 ~
emissivities are set to 0.9. There are no external or internal shading devices installed.
HEAT LOADS AND OCCUPANTS
Table 3-6 Equipment Lighting Occupant
Schedule Power
(W) Schedule
Power(W)
ScheduleActivity Level
MET Clothing
Kitchen 24h
every day 182
24h every day
7 7-9,17-22every day
1.8 0.6
Living Room 24h
every day 23.5
24h every day
11.5 17-22
every day1 0.6
Bedroom A 24h
every day 11
24h every day
5 24h
every day0.6 0.6
WC 24h
every day 56
24h every day
3
Bedroom B 24h
every day 14
24h every day
8 17-8
every day0.6 0.6
Bedroom C 24h
every day 14
24h every day
8 17-9
every day0.6 0.6
Here we arrange most of the equipments power averagely of the whole day to conveniently test the PPD during 24 hours a day.
In each zone, a cooling device of maximum power of 2 kilowatts is installed except the hall. No heating devices are installed according to the local custom in Macao, even though a low temperature problem would be faced in extreme cold winter days. Temperatures do go blow 10°C in some winter days, but this seldom occurs.
CONTROLLER SETPOINT IN EACH ZONE
Table 3-7 MIN MAX
Comfort Temperature(°C) 21 26 Mech. Exhaust Air Flow(L/s m2) 0.3 7
Relative Humidity(%) 20 80 Level of CO2 (ppm vol) 700 1100
OTHER PARAMETERS
Air Handling Unit

ENERGY DEMAND AND INDOOR COLIMATE OF A TRIDITIONAL LOW‐ENERGY BUILDING IN A HOT CLIMATE
~ 20 ~
Table 3-8 Heat Exchanger Efficiency 0.77
Supply Fan Efficiency 0.80Exhaust Fan Efficiency 0.80
The supply air temperature would remain the same with the outdoor temperature if it is in the interval of 16 to 30°C. When the outdoor temperature goes below 16°C, the supply air will be heated to 16°C. When the outdoor temperature goes above 30°C, the supply air will be cooled to 30°C.
The AHU type is choose as a CAV system, and the exhaust air flow rate is not the same in different zones as shown below.
Table 3-9
Kitchen Living Room
BedroomA
WC Hall Bedroom
B Bedroom
C Flow Rate (L/s) 18 0.48 0.57 27.5 0 0.28 0.48
ACH (h-1) 1.187 0.019 0.046 4.308 0 0.036 0.063
The boiler efficiency is 1, and the chiller co-efficiency of performance is set to 2.8 compared with an electric air conditioner.
3.3.2 CASES FOR COMPARISON
In order to study how different parameters influence the simulation results, several cases with different parameters will be studied during the summer or winter seasons. Parameters changed are described compared with the reference case.
CASE 1
Ordinary 2-pane glazing is used. The U-value is 3.0 W/m2 K. The solar heat gain coefficient is 0.76, and the solar transmittance is 0.68.
CASE 2
Ordinary 2-pane glazing is used as in Case 1, further more, windows external shading devices are also used. Of course, the external shading devices should be used in cooling seasons. In the winter, Case 2 will not be studied.
CASE 3
Light concrete and light isolation of the external wall will be replaced by a 0.43m thick ordinary concrete. Material has been described before. The external wall

ENERGY DEMAND AND INDOOR COLIMATE OF A TRIDITIONAL LOW‐ENERGY BUILDING IN A HOT CLIMATE
~ 21 ~
U-value is changed to 2.232 W/m2 K.
CASE 4
The supply air temperature will be changed to 16~27°C in cooling seasons, and 18~30°C in the winter.
CASE 5
On the basis of Case 4, the heat exchanger efficiency is set to 0. That is to say, the heat recovery will not be used in this case.
CASE 6
This is a case which combines Case 2 and Case 3, further more, in the cooling seasons, Case 4 is also included. Then different room temperature setpoints will be studied regarding the energy consumption.
To know clearly the differences among the different cases, Table 3-10 is listed below. The blank means unchanged according to the reference case.
Table 3-10
glazing
changed
external shading Added
U-value changed
supply air temperature
changed
heat exchanger efficiency changed
temperature setpoint changed
Summer case1
Winter X
Summer X X case2
Winter N/A Summer
case3 Winter
X
Summer 16~27°C case4
Winter
18~30°C
Summer 16~27°C case5
Winter
18~30°C X
Summer X X X 16~27°C X case6
Winter X X

ENERGY DEMAND AND INDOOR COLIMATE OF A TRIDITIONAL LOW‐ENERGY BUILDING IN A HOT CLIMATE
~ 22 ~
3.4 SIMULATION RESULTS
3.4.1 ON A TYPICAL SUMMER DAY
We choose August 10th as a typical summer day to simulate and analyze. Energy consumption and thermal comfort will be considered.
The simulation results of the reference case are shown below.
OVERVIEW
The purchased energy are show in Table 3-11 below.
Table 3-11 Electric energy
Central (HVAC systems) Local (zones) Month
Consumption (kWh)
CostConsumption
(kWh) Cost
8. 9.99 0.00 7.97 0.00Total 9.99 0.00 7.97 0.00
The purchased energy is divided into two parts:
Consumption of HVAC systems: delivered by heating/Cooling devices, pumps, fans, etc;
Consumption in local zones: equipments, lighting, etc.
Energy used (kWh), contributions by source is listed as Table 3-12 below. The utility of the energy can be seen clearly.
Table 3-12
Energy delivered
by room units
Energy delivered or recovered
by central air handling units
Energy used, other than via mechanical heating or cooling
Month
Heat Cooling Heat Cooling Recovery Fans Pumps Equipment Lighting Hot
water8.00 0.00 26.76 0.00 0.00 -0.60 0.40 0.04 6.95 1.02 0.00Total 0.00 26.76 0.00 0.00 -0.60 0.40 0.04 6.95 1.02 0.00
IDA ICE ver. 3.0 provides anther way to test the thermal comfort. Lost work is a significant output parameter, which is an account for working hours lost due to over or under heating. Too high or too low in temperature would lead to reduce the

ENERGY DEMAND AND INDOOR COLIMATE OF A TRIDITIONAL LOW‐ENERGY BUILDING IN A HOT CLIMATE
~ 23 ~
efficiency of the occupants. Operative temperature of 20 to 25°C is regarded as lost, and beyond this interval limit, experiments show an average loss of 2% in performance per degree. [20]
The lost work, due to under or over heating, is listed below.
Table 3-13
Month Total Working
Hours Lost Working
Hours
8. 36.60 0.93 Total 36.60 0.93
In the air handling unit, we can monitor the outside temperature, the supply air temperature and the return air temperature, as well as the overall supply and exhaust air flows. Figure 3-6 and Figure 3-7 show the details.
Supply air dry-bulb temperature, Deg-C
Return air dry-bulb temperature, Deg-C
Outside air dry-bulb temperature, Deg-C
0 2 4 6 8 10 12 14 16 18 20 22 24
癈
26.0
26.5
27.0
27.5
28.0
28.5
29.0
29.5
30.0
30.5
31.0
31.5
Last day of simulation: 2006-08-10
Figure 3-6 AHU Temperatures
The supply temperature is cooled to 30 °C if the out door temperature is higher than that point. The return air temperature is about 26°C, so there is still a potential to cool the supply air temperature a little lower than 30°C.

ENERGY DEMAND AND INDOOR COLIMATE OF A TRIDITIONAL LOW‐ENERGY BUILDING IN A HOT CLIMATE
~ 24 ~
Exhaust air flow, l/s
Supply air flow, l/s
0 2 4 6 8 10 12 14 16 18 20 22 24
l/s
47.8
48.0
48.2
48.4
48.6
48.8
49.0
49.2
49.4
49.6
49.8
50.0
Last day of simulation: 2006-08-10
Figure 3-7 AHU Air Flows
INDIVIDUAL ZONES
Here we still concentrate on only one occupied zone – Bedroom A, again. Conditions in other zones are similar.
Operative temperature 1, Deg-C
Mean air temperature, Deg-C
0 2 4 6 8 10 12 14 16 18 20 22 24
癈
26.00
26.05
26.10
26.15
26.20
26.25
26.30
26.35
26.40
26.45Last day of simulation: 2006-08-10
Figure 3-8 Main Temperatures of Bedroom A
Figure 3-8 shows the mean air temperature and the operative temperatures. The results show that mean air temperature is well kept at around 26°C and the thermal conditions in Bedroom A are very good.

ENERGY DEMAND AND INDOOR COLIMATE OF A TRIDITIONAL LOW‐ENERGY BUILDING IN A HOT CLIMATE
~ 25 ~
Heat from air flows and cold bridges, WHeat from occupants (incl. latent), WHeat from equipment, WHeat from heating and/or cooling room units, WHeat from windows (including absorbed solar), WHeat from walls and floors (structure), WHeat from lighting, WHeat from daylight (direct solar), W
0 2 4 6 8 10 12 14 16 18 20 22 24
W
-300.0
-250.0
-200.0
-150.0
-100.0
-50.0
0.0
50.0
100.0
150.0
Last day of simulation: 2006-08-10
Figure 3-9 Heat Balance of Bedroom A
Figure 3-9 shows the heat balance of Bedroom A. It is clear that the main heat loads come from the heat of air flow and the occupants. Since we set the supply air temperature in the range of 16 to 30°C, the heat surplus will be removed by the cooling devices in the zone. The orange line in the figure shows the working power of the cooling device in the room. The maximum cooling power removed is 334.4W.
PPD, Predicted Pecentage of Dissatisfied, at occupant 1, %
PMV, Predicted Mean Vote, at occupant 1, (*10)
0 2 4 6 8 10 12 14 16 18 20 22 24
-6.0
-4.0
-2.0
0.0
2.0
4.0
6.0
8.0
10.0
12.0
14.0
16.0
18.0
Last day of simulation: 2006-08-10
Figure 3-10 Fanger's Comfort Indices of Bedroom A

ENERGY DEMAND AND INDOOR COLIMATE OF A TRIDITIONAL LOW‐ENERGY BUILDING IN A HOT CLIMATE
~ 26 ~
The PPD is in the range of 11.2% to 18.9%, and the mean PPD is 15.37%, and mean PMV is -0.63. Results show it is quite comfort to live in.
Conditions in all the zones are shown in Table 3-14 below.
Table 3-14
Mean Air
Temperature(°C)
Mean Operative
Temperature(°C)
Mean PPD(%)
Mean PMV
Max Cooling Power
(W) Kitchen 26.0 25.6 14.72 0.41 142.3
Living Room 26.0 26.4 4.75 0.17 655.0 Bedroom A 26.0 26.3 15.37 -0.63 334.4
WC 26.0 26.0 9.22 0.40 200.0 Hall 26.5 26.9 19.53 0.73 N/A
Bedroom B 26.0 26.5 8.41 -0.34 406.7 Bedroom C 26.0 26.5 8.54 -0.35 433.7
All the zones show good comfortable conditions. The mean air temperature is well kept at around 26°C. The maximum mean PPD is under 20%, and the max cooling power is 655.0W.
Cases regarding different temperature setpoints are also studied as shown in Figure 3-11. It is clear that, with the decreasing of the maximum permitted temperature setpoint, the energy consumption for cooling in the summer is increasing.
33.21
29.86
26.76
23.08
19.3
0 5 10 15 20 25 30 35
Energy Used for Cooling (kWh)
24
25
26
27
28
Max SetpointTemperature (°
C)
Figure 3-11 Energy Used for Cooling at Different Max Setpoint Temperatures
3.4.2 ON A TYPICAL WINTER DAY
We choose February 1st as a typical winter day to simulate and analyze. Energy consumption and thermal comfort will be considered. Note that there are no heaters

ENERGY DEMAND AND INDOOR COLIMATE OF A TRIDITIONAL LOW‐ENERGY BUILDING IN A HOT CLIMATE
~ 27 ~
installed in zones.
The simulation results of the reference case are shown below.
OVERVIEW
The purchased energy are show in Table 3-15 below.
Table 3-15 Electric energy
Central (HVAC systems) Local (zones) Month
Consumption(kWh)
Cost Consumption
(kWh) Cost
2. 0.54 0.00 7.97 0.00 Total 0.54 0.00 7.97 0.00
Energy used (kWh), contributions by source is listed as Table 3-12 below. The utility of the energy can be seen clearly.
Table 3-16
Energy delivered
by room units
Energy delivered or recovered
by central air handling units
Energy used, other than via mechanical heating or cooling
Month
Heat Cooling Heat Cooling Recovery Fans Pumps Equipment Lighting Hot
water2.00 0.00 0.46 0.00 0.00 4.96 0.37 0.00 6.95 1.02 0.00Total 0.00 0.46 0.00 0.00 4.96 0.37 0.00 6.95 1.02 0.00
The energy for heating/cooling can be considered as 0, because there is no need to cool the zones in such a winter day. The two table above show a very little cooling energy because of the accuracy of the software simulation.
The lost work, due to under or over heating, is listed below.
Table 3-17
Month Total Working
Hours Lost Working
Hours
2. 36.60 0.00 Total 36.60 0.00
In the air handling unit, we can monitor the outside temperature, the supply air temperature and the return air temperature, as well as the overall supply and exhaust air flows. Figure 3-12 and Figure 3-13 show the details.

ENERGY DEMAND AND INDOOR COLIMATE OF A TRIDITIONAL LOW‐ENERGY BUILDING IN A HOT CLIMATE
~ 28 ~
Supply air dry-bulb temperature, Deg-C
Return air dry-bulb temperature, Deg-C
Outside air dry-bulb temperature, Deg-C
0 2 4 6 8 10 12 14 16 18 20 22 24
癈
0.0
2.0
4.0
6.0
8.0
10.0
12.0
14.0
16.0
18.0
20.0
22.0
Last day of simulation: 2006-02-01
Figure 3-12 AHU Temperatures
The supply temperature is heated to 16°C by the heat recovery of the heat exchanger in the HVAC system. It is clear that the return air is about 23°C, so there is still a potential of heating the supply air to a higher temperature if it is needed.
Exhaust air flow, l/s
Supply air flow, l/s
0 2 4 6 8 10 12 14 16 18 20 22 24
l/s
45.045.245.445.645.846.046.246.446.646.847.047.247.447.647.8
Last day of simulation: 2006-02-01
Figure 3-13 AHU Air Flows
INDIVIDUAL ZONES
Here we concentrate on only one occupied zone – Bedroom A. Conditions in other zones are similar.

ENERGY DEMAND AND INDOOR COLIMATE OF A TRIDITIONAL LOW‐ENERGY BUILDING IN A HOT CLIMATE
~ 29 ~
Operative temperature 1, Deg-C
Mean air temperature, Deg-C
0 2 4 6 8 10 12 14 16 18 20 22 24
癈
21.7
21.8
21.9
22.0
22.1
22.2
22.3
22.4
22.5
Last day of simulation: 2006-02-01
Figure 3-14 Main Temperatures of Bedroom A
Figure 3-14 shows the mean air temperature and the operative temperatures. The results show that mean air temperature varies between 21.6 to 22.4°C and operative temperature is from 21.8 to 22.6 °C . The thermal conditions in Bedroom A are good.
Heat from air flows and cold bridges, WHeat from occupants (incl. latent), WHeat from equipment, WHeat from heating and/or cooling room units, WHeat from windows (including absorbed solar), WHeat from walls and floors (structure), WHeat from lighting, WHeat from daylight (direct solar), W
0 2 4 6 8 10 12 14 16 18 20 22 24
W
-120.0
-100.0
-80.0
-60.0
-40.0
-20.0
0.0
20.0
40.0
60.0
80.0
100.0
Last day of simulation: 2006-02-01
Figure 3-15 Heat Balance of Bedroom A
Figure 3-15 shows the heat balance of Bedroom A. It is clear that the main heat loads come from the occupants and the daylight. The main way of losing heat is from

ENERGY DEMAND AND INDOOR COLIMATE OF A TRIDITIONAL LOW‐ENERGY BUILDING IN A HOT CLIMATE
~ 30 ~
the lower temperature supply air.
PPD, Predicted Pecentage of Dissatisfied, at occupant 1, %
PMV, Predicted Mean Vote, at occupant 1, (*10)
0 2 4 6 8 10 12 14 16 18 20 22 24
-10.0
0.0
10.0
20.0
30.0
40.0
50.0
60.0
70.0
Last day of simulation: 2006-02-01
Figure 3-16 Fanger's Comfort Indices of Bedroom A
The result shows no longer satisfied conditions. PPD is in the range of 65.6% to 77.5%, and the mean PPD is 71.27%, and mean PMV is -1.78, which means the zone is a little cold to live in. No heating in winter season may lead to cold conditions and bad satisfaction.
Conditions in all the zones are shown in Table 3-18 below.
Table 3-18
Mean Air
Temperature(°C)
Mean Operative
Temperature(°C)
Kitchen 23.6 23.3 Living Room 23.1 23.2 Bedroom A 22.0 22.2
WC 22.8 22.8 Hall 22.3 22.4
Bedroom B 22.3 22.5 Bedroom C 21.9 22.2
The mean air temperature is well kept at around 22.6°C in the winter.

ENERGY DEMAND AND INDOOR COLIMATE OF A TRIDITIONAL LOW‐ENERGY BUILDING IN A HOT CLIMATE
~ 31 ~
3.4.3 DURING THE WHOLE COOLING SEASON
We simulate the cases during the whole cooling season, which covers from May 1st to October 31st according to the local custom. We concentrate on the energy consumption. The results are shown as following.
REFERENCE CASE
The purchased energy is shown as Table 3-19, the total cooling energy for the HVAC system is 1839.7kWh.
Table 3-19 Electric energy
Central (HVAC systems) Local (zones) Month
Consumption(kWh)
Cost Consumption
(kWh) Cost
5 252.1 0 246.9 0 6 296.8 0 238.9 0 7 342.9 0 247 0 8 320.7 0 247.1 0 9 324 0 238.7 0
10 303.2 0 247.3 0 Total 1839.7 0 1465.9 0
Energy used, contributions by source is listed in Table 3-20. The energy coming from the heat recovery is -35.25kWh.
Table 3-20 Energy
delivered by room units
Energy delivered or recovered by central air
handling units
Energy used, other than via mechanical heating or cooling
Month
Heat Cooling Heat Cooling Recovery Fans Pumps Equipment Lighting Hot
water5.00 6.00 7.00 8.00 9.00
10.00
0.00 0.00 0.00 0.00 0.00 0.00
669.40 794.90 922.50 860.50 870.80 812.10
0.00 0.00 0.00 0.00 0.00 0.00
0.00 0.00 0.00 0.00 0.00 0.00
-0.11 -9.03
-12.57 -10.51 -3.07 0.04
12.1311.8212.2512.2511.7812.05
0.89 1.05 1.22 1.14 1.16 1.10
215.30 208.40 215.40 215.50 208.20 215.60
31.61 30.59 31.62 31.64 30.56 31.65
0.000.000.000.000.000.00
Total 0.00 4930.20 0.00 0.00 -35.25 72.28 6.55 1278.40 187.67 0.00
AHU temperatures and air flows are monitored as shown below.

ENERGY DEMAND AND INDOOR COLIMATE OF A TRIDITIONAL LOW‐ENERGY BUILDING IN A HOT CLIMATE
~ 32 ~
Supply air dry-bulb temperature, Deg-C
Return air dry-bulb temperature, Deg-C
Outside air dry-bulb temperature, Deg-C
3000. 3500. 4000. 4500. 5000. 5500. 6000. 6500. 7000.
癈
0.0
5.0
10.0
15.0
20.0
25.0
30.0
Entire simulation: from 2006-05-01 to 2006-10-31
Figure 3-17 AHU Temperatures during Cooling Seasons
Exhaust air flow, l/s
Supply air flow, l/s
3000. 3500. 4000. 4500. 5000. 5500. 6000. 6500. 7000.
l/s
45.0
45.5
46.0
46.5
47.0
47.5
48.0
48.5
49.0
49.5
50.0
50.5Entire simulation: from 2006-05-01 to 2006-10-31
Figure 3-18 AHU Air Flows during Cooling Seasons
RESULTS OF ALL CASES
Table 3-21 below shows the purchased energy for the HVAC system, which mostly consumes by the cooling devices in each zone. Case 2 consumes the least energy.

ENERGY DEMAND AND INDOOR COLIMATE OF A TRIDITIONAL LOW‐ENERGY BUILDING IN A HOT CLIMATE
~ 33 ~
Table 3-21
Month 5 6 7 8 9 10 Total Reference 252.1 296.8 342.9 320.7 324 303.2 1839.7
Case1 292.5 357.4 417.5 388.6 397.5 377.1 2230.6Case2 223.2 281.2 334.4 305.8 287.1 218.3 1650Case3 263 362.5 435.8 396.1 388.9 310 2156.3Case4 248.7 283.1 321.7 303.8 312.7 303.4 1773.4Case5 259.5 328.5 389.3 361 342.7 304.9 1985.9Case6 231.8 333.8 405.7 363.5 340.2 228.7 1903.7
Table 3-22 shows the energy used by the cooling devices as well as the heat recovery by the heat exchanger.
Table 3-22
Month 5 6 7 8 9 10 Total Energy used for
cooling 669.4 794.9 922.5 860.5 870.8 812.1 4930.2Refer
ence Heat recovery -0.11 -9.03 -12.57 -10.51 -3.07 0.04 -35.25
Energy used for cooling
782.1 964 1130 1050 1076 1018 6020.1Case1
Heat recovery -0.11 -9.05 -12.58 -10.48 -3.11 0.04 -35.29Energy used for
cooling 588.8 751.5 898.8 818.9 768.1 575.4 4401.5Case
2 Heat recovery -0.12 -9.04 -12.52 -10.51 -3.11 0.04 -35.26
Energy used for cooling
699.9 978.4 1182 1071 1052 831 5814.3Case3
Heat recovery -0.11 -9.06 -12.52 -10.53 -3.11 0.04 -35.29Energy used for
cooling 659.82 756.58 863.28 813.43 839.47 812.7 4745.28Case
4 Heat recovery -13.35 -54.89 -81.69 -70.16 -37.44 -4.45 -261.98
Energy used for cooling
690.06 883 1051.3 972.3 922.88 816.95 5336.49Case5
Heat recovery 0 0 0 0 0 0 0Energy used for
cooling 612.93 898.18 1097.9 979.95 916.22 604.3 5109.46Case
6 Heat recovery -13.47 -54.93 -81.81 -70.18 -37.37 -4.43 -262.19
CASE 6 AT DIFFERENT TEMPERATURE SETPOINTS
In order to study the energy consumption for cooling in during the summer seasons, different temperature setpoints are arranged to get their relationship,
On the basis of Case 6, maximum temperature setpoints of 25°C, 26°C, and 27°C are presented. The total purchased, the energy needed for cooling and the heat

ENERGY DEMAND AND INDOOR COLIMATE OF A TRIDITIONAL LOW‐ENERGY BUILDING IN A HOT CLIMATE
~ 34 ~
recovery from the heat exchanger are shown below.
1642.6
1903.7
2213.7
4381.2
5109.2
5971.6
-201.6
-262.2
-328.2
-1000 0 1000 2000 3000 4000 5000 6000 7000
27
26
25Te
mpe
ratu
re S
etpo
int °
C
kWh
heat recoverycooling energypurchased energy
Figure 3-19 Energy Consumption at Different Setpoints
3.4.4 DURING THE WHOLE WINTER SEASON
Winter season or cold season starts from November 1st to April 30th next year according to the local custom. But IDA ICE 3.0 does not support the simulations across a calendar year. So the simulations can be achieved by dividing into two parts, which are Part I (November 1st ~ December 31st) and Part II (January 1st ~ April 30th). We also concentrate on the energy consumption. The results are shown as following.
The purchased energy is shown as Table 3-23.
Table 3-23
Electric energy
Central (HVAC systems) Local (zones) Month
Consumption (kWh) Cost Consumption (kWh) Cost 11 225.4 0 238.9 0 12 151.8 0 247.1 0 1 117.5 0 246.9 0 2 69.93 0 223.2 0 3 82.59 0 246.8 0 4 123.3 0 238.9 0
Total 770.52 0 1441.8 0
Energy used, contributions by source is listed in Table 3-24. Energy for cooling still takes a large partition. It means that there are still hot days occurring in winter days, and room air temperature may go above 26°C. According to the local custom, even this happens, people seldom use the cooling device to achieve a better condition. So the energy for cooling can be neglected during the winter season. Cooling energy

ENERGY DEMAND AND INDOOR COLIMATE OF A TRIDITIONAL LOW‐ENERGY BUILDING IN A HOT CLIMATE
~ 35 ~
equals 0.
Table 3-24 Energy
delivered by room units
Energy delivered or recovered by central air
handling units
Energy used, other than via mechanical heating or cooling
Month Heat Cooling Heat Cooling Recovery Fans Pumps Equipment Lighting Hot
water11 0 596.5 0 0 -0.11 11.54 0.83 208.3 30.58 012 0 390.4 0 0 25.51 11.77 0.56 215.4 31.63 01 0 295 0 0 59.57 11.73 0.42 215.3 31.61 02 0 165.6 0 0 70.31 10.55 0.24 194.6 28.57 03 0 197.4 0 0 27.29 11.83 0.27 215.2 31.6 04 0 311.5 0 0 3.08 11.58 0.42 208.3 30.58 0
Total 0 1956.4 0 0 185.65 69 2.74 1257.1 184.57 0
AHU temperatures and air flows are monitored as shown below.
Supply air dry-bulb temperature, Deg-C
Return air dry-bulb temperature, Deg-C
Outside air dry-bulb temperature, Deg-C
7400. 7600. 7800. 8000. 8200. 8400. 8600.
?
0.0 2.0 4.0 6.0 8.010.012.014.016.018.020.022.024.026.028.0
Entire simulation: from 2005-11-01 to 2005-12-31
0. 200. 400. 600. 800. 1000. 1200. 1400. 1600. 1800. 2000. 2200. 2400. 2600. 2800.
Entire simulation: from 2006-01-01 to 2006-04-30
Figure 3-20 AHU Temperatures during Winter
Exhaust air flow, l/s
Supply air flow, l/s
7400. 7600. 7800. 8000. 8200. 8400. 8600.
l/s
45.0
45.5
46.0
46.5
47.0
47.5
48.0
48.5
49.0
49.5
Entire simulation: from 2005-11-01 to 2005-12-31
0. 200. 400. 600. 800. 1000. 1200. 1400. 1600. 1800. 2000. 2200. 2400. 2600. 2800.
Entire simulation: from 2006-01-01 to 2006-04-30
Figure 3-21 AHU Air Flows during Winter

ENERGY DEMAND AND INDOOR COLIMATE OF A TRIDITIONAL LOW‐ENERGY BUILDING IN A HOT CLIMATE
~ 36 ~
RESULTS OF ALL CASES
Table 3-25
Month 11 12 1 2 3 4 Total
Energy by cooling
596.5 390.4 295 165.6 197.4 311.5 1956.4
Energy by heating
0 0 0 0 0 0 0 Reference
Heat recovery -0.11 25.51 59.57 70.31 27.29 3.08 185.65 Energy by
cooling 757.1 486.4 367.3 188.3 213.3 338.5 2350.9
Energy by heating
0 0 0 0 0 0 0 Case1
Heat recovery -0.09 25.51 59.55 70.35 27.29 3.11 185.72 Energy by
cooling 616 272.4 207.5 76.78 126.5 251.6 1550.8
Energy by heating
0 0 0 0 0 0 0 Case3
Heat recovery -0.12 25.5 59.22 69.07 27.29 3.11 184.07 Energy by
cooling 600.4 420.5 320.9 188.3 207.5 314.7 2052.3
Energy by heating
0 0 0 0 0 0 0 Case4
Heat recovery 4.43 64.84 110.8 132.4 58.06 11.29 381.82 Energy by
cooling 599.9 391.5 300.1 165.3 199.1 313.4 1969.3
Energy by heating
0.38 25.38 59.37 70.05 27.15 4.77 187.1 Case5
Heat recovery 0 0 0 0 0 0 0 Energy by
cooling 616 272.4 207.5 76.78 126.5 251.6 1550.8
Energy by heating
0 0 0 0 0 0 0 Case6
Heat recovery -0.12 25.5 59.22 69.07 27.29 3.11 184.07
Table 3-25 shows the energy consumptions by cooling, heating and by heat recovery. In winter seasons, room temperature may go above 26°C, so there are still cooling energy demands in winter. Case 3 consumes the lowest cooling energy. On the other hand, heat from recovery or direct heating is also needed, in order to heat the supply air to the demand setpoint.

ENERGY DEMAND AND INDOOR COLIMATE OF A TRIDITIONAL LOW‐ENERGY BUILDING IN A HOT CLIMATE
~ 37 ~
3.4.5 DURING THE WHOLE YEAR
Here we summarize the total energy use for the reference case during the whole year, which starts form November 1st to October 31st.
Table 3-26 Energy
delivered by room units
Energy delivered or recovered by central air
handling units
Energy used, other than via mechanical heating or cooling
Month
Heat Cooling Heat Cooling Recovery Fans Pumps Equipment Lighting Hot
water
11 0 0 0 0 -0.11 11.54 0.83 208.3 30.58 012 0 0 0 0 25.51 11.77 0.56 215.4 31.63 01 0 0 0 0 59.57 11.73 0.42 215.3 31.61 02 0 0 0 0 70.31 10.55 0.24 194.6 28.57 03 0 0 0 0 27.29 11.83 0.27 215.2 31.6 04 0 0 0 0 3.08 11.58 0.42 208.3 30.58 05 0 669.4 0 0 -0.11 12.13 0.89 215.3 31.61 06 0 794.9 0 0 -9.03 11.82 1.05 208.4 30.59 07 0 922.5 0 0 -12.57 12.25 1.22 215.4 31.62 08 0 860.5 0 0 -10.51 12.25 1.14 215.5 31.64 09 0 870.8 0 0 -3.07 11.78 1.16 208.2 30.56 0
10 0 812.1 0 0 0.04 12.05 1.1 215.6 31.65 0Total 0 4930.2 0 0 N/A 141.28 9.3 2535.5 372.24 0
In the above table, the energy consumption is set to 0 during the winter. According to the cooling COP, the real cooling energy consumption is 4930.2/2.8=1760.8kWh.
The structure of energy use for the whole year is shown in Figure 3-22.
Cooling37%
Equipment52%
Lighting8%
Pumps0%
Fans3%
Figure 3-22 Pie Chart of Energy Use Structure

ENERGY DEMAND AND INDOOR COLIMATE OF A TRIDITIONAL LOW‐ENERGY BUILDING IN A HOT CLIMATE
~ 38 ~
The heat recovery also plays an important role in the HVAC system to heat or cool the supply air. The following figure shows the relationship between the average out door temperature and the heat recovery (plus or minus) from the heat exchanger.
25.51
59.57
70.31
27.29
3.08
-9.03-12.57 -10.51
0.04-3.07-0.11 -0.11
21.53
15.6414.54
21.74
25.69
27.8928.87 28.43 27.65
24.71
1718.29
-20
-10
0
10
20
30
40
50
60
70
80
Nov Dec Jan Feb Mar Apr May Jun Jul Aug Sep Oct
0
5
10
15
20
25
30
35
Heat recovery (kWh)
Average Month Temperature (°C)
Figure 3-23 Heat Recovery and Average Month Outdoor Temperature

ENERGY DEMAND AND INDOOR COLIMATE OF A TRIDITIONAL LOW‐ENERGY BUILDING IN A HOT CLIMATE
~ 39 ~
4 DISCUSSION
COOLING SEASONS
On the typical summer day, it is quite necessary to remove the heat surplus by the cooling devices to achieve a better thermal comfort. However, HVAC system energy consumption for cooling takes about 56% of the total purchased energy.
The heat balance of Bedroom A shows that, in a well isolated building, the heat loads mainly come from the occupants, the incoming air flows, and direct daylight. This means, we can reduce the energy use by studying how to reduce the heat from the incoming air flows and the direct daylight.
The supply air temperature will definitely influence the heat load of the supply air. But reducing the supply air temperature consumes much energy. The heat exchanger can contribute to save the energy for cooling the supply air. Comparing the supply air temperature and return air temperature, we can use the lower temperature return air to cool the higher temperature outdoor air and then supply the cooled air into the zones. On the other hand, the direct daylight can be sheltered by the external shading devices. However, we cannot stop the heat emission from the occupant body and activities.
PPD is an important reference regarding to the thermal comfort conditions. Results show that under the help of cooling devices, PPD can be lower, and most people will be satisfied.
In hot days people have a bad habit: to set the air conditioner temperature as low as possible. However, lower room air temperature will lead to higher energy consumption. Results show that 1°C lower on the desired temperature will increase the energy consumption for cooling by about 15% on average.
Different cases are studied during the whole cooling season.
Results of Case 1 show a 21% higher energy consumption than that of reference case. It is because lower U-value and higher transmission coefficient of the window inlet more heat from the outside air and the sunlight.
Results of Case 2 show a energy consumption reduction of 26% compared with Case 1. External shading plays a more important role in the heat introduction into the

ENERGY DEMAND AND INDOOR COLIMATE OF A TRIDITIONAL LOW‐ENERGY BUILDING IN A HOT CLIMATE
~ 40 ~
building envelope.
1839.7
2230.6
1650
2156.3
1773.41985.9 1903.7
0
500
1000
1500
2000
2500
Cooling Energy
Consumption (kWh)
Reference Case1 Case2 Case3 Case4 Case5 Case6
Figure 4-1 Cooling Energy Consumption of Different Cases in Summer
The U-value of the external walls in Case 3 is nearly 28 times that of the reference case, but the energy consumption for cooling is only about 17% increase. This might be too little compared with the U-value change. A high isolation external wall in a cold climate is essential. Since temperature difference of the internal and external conditions is even 30°C high, a well isolated wall can keep the internal heat from escaping. But in such a hot climate, the temperature difference is only around 4°C, higher U-value external walls are not that important.
About 4% energy is saved by Case 4 compared with the reference case. It is the contribution of the heat recovery of the heat exchanger of the HVAC system. Cooling down the supply air by the exhaust air, and fully utilizing the potential of the temperature difference between the exhaust air and the supply air will contribute to save the energy use. Case 5 consumes 12% more cooling energy than Case 4 because of no heat exchanger used.
We can conclude from the studies above, external shading is the most important way to save energy for cooling during the summer, and better heat recovery can save energy as an assistant means. Wild higher isolation of the external walls and windows seems not so important when considering the investment.
Hence, Case 6 is taken out. Only 3% more energy is cost compared with the reference case.
On the basis of Case 6, energy consumption under different temperature setpoints is studied. Results show that, 1°C lower of the setpoint, 28% more energy will be gained from the heat recovery. But more important, purchased energy is increasing by about 16%. Cooling mainly depends on the purchased energy. To save

ENERGY DEMAND AND INDOOR COLIMATE OF A TRIDITIONAL LOW‐ENERGY BUILDING IN A HOT CLIMATE
~ 41 ~
the energy, lower temperature setpoint should not be adopted if it not essential.
NON-COOLING SEASONS
On the typical winter day, even though the outdoor temperature is lower at about 13°C, there are still risks of over heating in the zones. This is because the building is well insolated, and the high power internal heating will increase the occupied zone temperature, and the heat is not easy to loss. However, commonly the zone is facing the problem of low air temperature because of no heating devices installed, and we must well utilize the internal heat to achieve a better thermal comfort condition.
Heat balance shows that the main ways of heat gains are the heat from the occupants, the direct sunlight, and the main way of heat loss is due to the lower supply air temperature. This means, we can keep the heat energy by studying how to get higher temperature supply air efficiently and gain more direct daylight.
The heat exchanger of the HVAC system here also plays an very important role. The internal heat loss to the exhaust air can be recovered by the heat exchanger. This time, the exhaust air will heat the supply air to a higher temperature to help the occupied zones achieve more comfortable condition. On the other hand, external shading will not be used in order to inlet more sunlight as an internal heat recourse.
Here, PPD is high because of low room temperature. As the local custom concerned, Heating devices are seldom used and cost a certain investment, and people usually wear thicker clothes to defend the coldness in special days. Since there are no heating devices, the study of energy consumptions according to different temperature setpoints is not necessary.
Different cases are studied during the whole cooling season.
699
840
554
733703
554
0
200
400
600
800
1000
Cooling Energy
Consumption (kWh)
Reference Case1 Case3 Case4 Case5 Case6
Figure 4-2 Cooling Demand of Different Cases in Winter
When considering the cooling demand in cold seasons, we can analyze the over

ENERGY DEMAND AND INDOOR COLIMATE OF A TRIDITIONAL LOW‐ENERGY BUILDING IN A HOT CLIMATE
~ 42 ~
heating during the non-cooling seasons by studying the cooling demand in winter.
Case 1 inlets more sunlight and consumes about 20% more energy to cool the inside building, because of lower U-value and higher transmission coefficient. It is similar with results in summer.
In Case 3, U-value is increased by around 28 times, but the cooling energy demand decreases by about 21%. This is because, during the non-cooling season, outdoor thermal comfort may occur. In this condition, lower U-value will block the heat coming out of the building envelope, over heating inside the building may occur. However, the internal heat will easily go through the higher U-value external walls. Thus the overheating problem can be solved. The cooling energy demand is reduced. The results of Case 3 in the winter show an opposite of those in the summer.
Case 4 better utilizes the heat from the exhaust air to heat the supply air, but overheating inside the building envelope may become worse. More cooling energy will be need to remove the heat surplus. This is why Case 4 consumes about 5% more energy than the reference case.
On the basis of Case 4, if no heat exchanger is used, overheating problem may not be such serious. Thus the cooling energy consumption of Case 5 is reduced by about 4%. But on the other hand, no heat recovery from the heat exchanger, in extreme cold days, more energy to heat the supply air is needed as a total of 181.7kWh.
We can conclude from the studies above, higher U-value is a better solution to save the energy to achieve better thermal comfort. Case 6 is a combination of Case 1 and Case 3. The cooling energy is reduced by about 21%.
As mentioned before, local people usually do not use the cooling devices in these months. If the weather is hot, slight overheating problem may happen. On the other hand, local people do not usually use the heating devices either. If the weather is extreme cold, people may feel a little cold inside the building. Uncomfortable conditions may occur, but much energy is saved.
WHOLE YEAR
If no heating or cooling is used in non-cooling seasons, all the energy consumption for cooling will take about 37% of the total energy use. Equipment energy use is estimated as the most important energy consumption part, which takes

ENERGY DEMAND AND INDOOR COLIMATE OF A TRIDITIONAL LOW‐ENERGY BUILDING IN A HOT CLIMATE
~ 43 ~
about 52% of total annual energy use.
As for the heat recovery, we examine the relationship between the heat recovery amount and the outside temperature. Results show that, if the outside temperature goes low, heat recovery will work as a heater to heat the supply air; if the outside temperature goes high, heat recovery will work as a chiller to cool the supply air. The more outside temperature goes extreme, the more heat recovery is needed.


ENERGY DEMAND AND INDOOR COLIMATE OF A TRIDITIONAL LOW‐ENERGY BUILDING IN A HOT CLIMATE
~ 45 ~
5 CONCLUSSION
The thesis presents the assumption of a traditional high isolated low energy building in Sweden moves into a hot climate, such as Macao. The simulation of energy consumption and thermal conditions are carried out with the aids of program IDA ICE 3.0.
Conditions on a typical summer day, on a typical winter day, during the whole cooling seasons, during the whole winter seasons, as well as during the whole year are analyzed. Different parameters of the building are changed, such as the glazing, external shading, external wall U-value, supply air temperature, heat exchanger efficiency, as well as the different temperature setpoints, to test the fitness of the building in a hot climate.
After studying all the cases under different kinds of conditions, we can get the conclusions below.
External shading contributes much to save the cooling energy in the summer;
Supply air temperature affects the indoor thermal comfort much. Much heating energy in the winter or cooling energy in the summer is used to get a better supply air temperature;
Heat recovery is important for the energy saving. The temperature difference of the exhaust and the supply air should be well utilized by the heat exchanger to save energy;
Ultra low U-value materials may not be suitable in a hot climate. Far different from the buildings in cold climates, the temperature difference on each side of the structure in the hot climate is low, through which less heat would transfer. On the other hand, low U-value material may block the internal overheating energy coming outside.
Nowadays, more experts and researchers claim that there no need to apply a high insolated building in a hot climate, whose investment is high, and such building may not save but waste the energy.[21],[22]
However, as for the buildings in a hot climate, we should concentrate more on

ENERGY DEMAND AND INDOOR COLIMATE OF A TRIDITIONAL LOW‐ENERGY BUILDING IN A HOT CLIMATE
~ 46 ~
the external shading of windows or the external walls, the more efficient heat recovery, central absorption cooling systems instead of electric air conditioner, etc.

ENERGY DEMAND AND INDOOR COLIMATE OF A TRIDITIONAL LOW‐ENERGY BUILDING IN A HOT CLIMATE
~ 47 ~
REFERENCES
[1]. Energy Conservation Becomes the National Policy, http://press.idoican.com.cn/detail/articles/20090320200D2712/, accessed 2009-5-2 (in Chinese)
[2]. IDA ICE: the simulation tool for making the whole building energy and HAM analysis, Targo Kalamees, Annex 41 MOIST-ENG, Working meeting May 12-14, Zurich, Switzerland
[3]. Building Energy Systems Lectures 2008, Taghi Karimipanah, HIG
[4]. Multi-dimensional approach used for energy and indoor climate evaluation applied to a low-energy building, Fredrik Karlsson, Linköping Studies in Science and Technology, Dissertation No. 1065
[5]. Björk, C. (1983) Huset som energisystem, LiTH-IKP-R-292, Energisystem, Linköpings universitet, Linköping
[6]. Sick Building Syndrome, Jack Rostron, Spons Architecture, Mar-1998
[7]. Indoor Air Quality and Displacement Ventilation, Hairong Dong, Journal of Hebei Institute of Architectural Engineering, 2003 vol.04 (in Chinese)
[8]. China Indoor air quality standard, GB/T 18883-2002, 2003-03-01
[9]. Energy survey and energy savings in an office building with aid of building software, Ravi Kiran. Musunuri, Yinghao Lu, Students thesis 2008, HIG
[10]. Wikipedia, http://en.wikipedia.org/wiki/Main_Page, accessed 2009-5-4
[11]. Evaluation of overheating protection with sun-shading systems, Tilmann E. Kuhn et.al., Solar Energy, Volume 69(59-74), 2001
[12]. Fanger, P.O. (1970) Thermal comfort: analysis and applications in environmental engineering. Copenhagen: Danish Technical Press.
[13]. Thermal comfort indices, Fange, P.O., Melikov AK, Turbulence and draft. ASHRAE J 1989
[14]. Abel, E., Low-energy buildings, Energy and Buildings, 21 (3): 169-174, 1994
[15]. Todesco, G., Super-efficient buildings: how low can you go?, ASHRAE Journal, 38 (12): 35-40
[16]. Low energy building design in high density urban cities, Sam C. M. Hui, World Renewable Energy Congress VI, 1-7 July 2000
[17]. Macao SAR Government, http://www.gov.mo/, accessed 2009-5-12

ENERGY DEMAND AND INDOOR COLIMATE OF A TRIDITIONAL LOW‐ENERGY BUILDING IN A HOT CLIMATE
~ 48 ~
[18]. Macau Meteorological and Geophysical Bureau, http://www.smg.gov.mo/e_index.php, accessed 2009-5-12
[19]. Boström, T., Glad, W., Isaksson, C., Karlsson, F., Persson, M.L., Werner, A. (2003) Tvärvetenskaplig analys av lågenergihusen i Lindås Park, Göteborg (Interdisciplinary analysis of low-energy house in Lindås Park, Göteborg). Linköping, Energy Systems Program, Linköping University (Working paper 25).
[20]. Wyon, D. 2000. Individual control at each workplace: the means and the potential benefits In: Clements- Croome, D. (editor). Creating the roductive workplace. E & FN Spon. London and New York
[21]. High isolation of external may not be suitable in the south, http://blog.sina.com.cn/s/blog_4ba8d591010006q1.html, accessed 2009-5-20 (in Chinese)
[22]. Should we apply high isolation external walls to the buildings in South?, http://www.gxcic.net/News/shownews_91559.html, accessed 2009-5-20 (in Chinese)
[23]. IDA Indoor Climate and Energy 3.0 manual, EQUA Simulation AB, January 2002,Version: 3.0
[24]. Hugo Hens, Building Physics –Heat, Air and Moisture, 2007 Ernst & Sons Verlag, ISBN 978-3-433-01841-5, Germany.
[25]. Per Erik Nilsson (editor), Achieving the Desired Indoor Climate –Energy Efficiency Aspects of System Design, 2003, Studentlitteratur, ISBN 91-44-03235-8, Printed in Denmark by Narayana Press
Related Documents


