The Centre for Sustainable Transportation The Centre for Sustainable Transportation Le Centre pour un transport durable 1 Energy Constraints and Transport Sustainability Richard Gilbert Presentation to the Windsor Workshop Toronto, June 14 and 17, 2004 Enquiries to Richard Gilbert at [email protected] or 416 923 8839

Welcome message from author
This document is posted to help you gain knowledge. Please leave a comment to let me know what you think about it! Share it to your friends and learn new things together.
Transcript
Th
e C
en
tre
fo
r S
usta
ina
ble
Tra
nsp
ort
ation
Th
e C
en
tre
fo
r S
usta
ina
ble
Tra
nsp
ort
ation
Le C
entr
e p
our
un tra
nsport
dura
ble
1
Energy Constraints and Transport Sustainability
Richard Gilbert
Presentation to theWindsor Workshop
Toronto, June 14 and 17, 2004
Enquiries to Richard Gilbert at [email protected] or 416 923 8839
Th
e C
en
tre
fo
r S
usta
ina
ble
Tra
nsp
ort
ation
Th
e C
en
tre
fo
r S
usta
ina
ble
Tra
nsp
ort
ation
Le C
entr
e p
our
un tra
nsport
dura
ble
2
What should be the main concerns oftransport policy-makers?
Sustainability? Yes. But it means different things to
different people, often quite different; bridging the
differences can be a huge challenge.
Kyoto? Yes. But it‟s hard to persuade Canadians that
warmer winters will be a problem, or that they should
prevent or prepare for sea-level rise in 2050.
Energy constraints? Yes. It‟s hardly on policy-makers‟
radar, but signs of early—perhaps profound—impacts
are clear. Energy concerns should be foremost in our
policy-making and shape our approaches to sustaina-
bility and climate change.
Th
e C
en
tre
fo
r S
usta
ina
ble
Tra
nsp
ort
ation
Th
e C
en
tre
fo
r S
usta
ina
ble
Tra
nsp
ort
ation
Le C
entr
e p
our
un tra
nsport
dura
ble
3
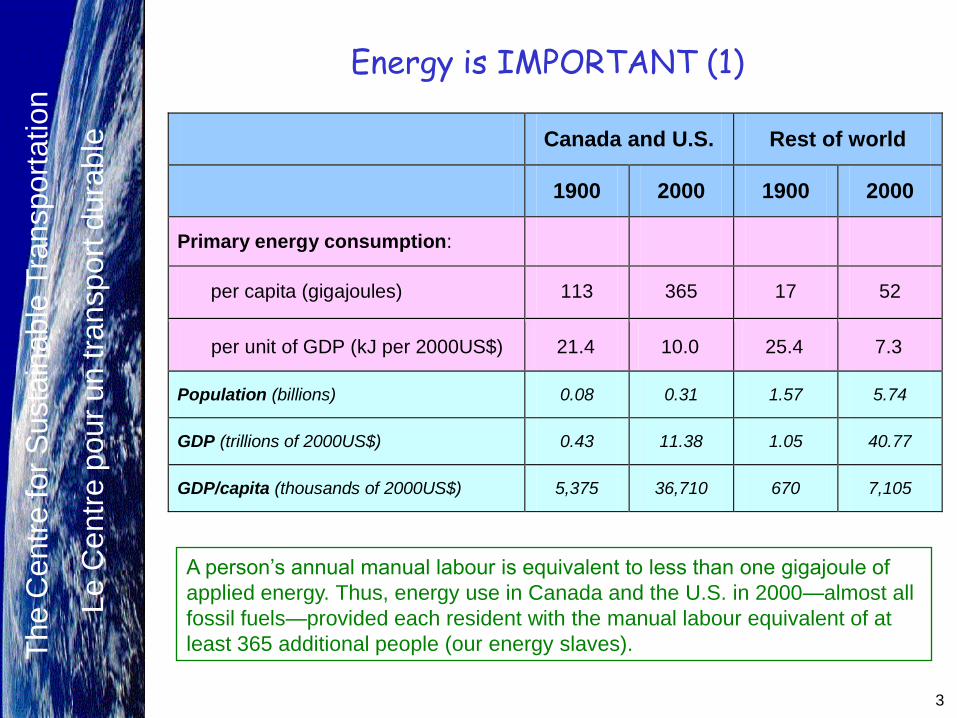
Energy is IMPORTANT (1)
Canada and U.S. Rest of world
1900 2000 1900 2000
Primary energy consumption:
per capita (gigajoules) 113 365 17 52
per unit of GDP (kJ per 2000US$) 21.4 10.0 25.4 7.3
Population (billions) 0.08 0.31 1.57 5.74
GDP (trillions of 2000US$) 0.43 11.38 1.05 40.77
GDP/capita (thousands of 2000US$) 5,375 36,710 670 7,105
A person‟s annual manual labour is equivalent to less than one gigajoule of
applied energy. Thus, energy use in Canada and the U.S. in 2000—almost all
fossil fuels—provided each resident with the manual labour equivalent of at
least 365 additional people (our energy slaves).
Th
e C
en
tre
fo
r S
usta
ina
ble
Tra
nsp
ort
ation
Th
e C
en
tre
fo
r S
usta
ina
ble
Tra
nsp
ort
ation
Le C
entr
e p
our
un tra
nsport
dura
ble
4
Energy is IMPORTANT (2)
Without ample supplies of inexpensive added energy,
modern civilization as we know it may not be possible.
Our buildings would be hardly habitable, our transport
arrangements would be primitive, and most of our worldly
goods would be irreplaceable.
The most profound impact could be on population, now
sustained by energy-intensive agriculture and public health
practices.
Without energy slaves from one-time deposits of fossil fuels,
our planet might support a billion „slaves to the soil‟, rather
than six billion humans often living in extraordinary comfort.
Th
e C
en
tre
fo
r S
usta
ina
ble
Tra
nsp
ort
ation
Th
e C
en
tre
fo
r S
usta
ina
ble
Tra
nsp
ort
ation
Le C
entr
e p
our
un tra
nsport
dura
ble
5
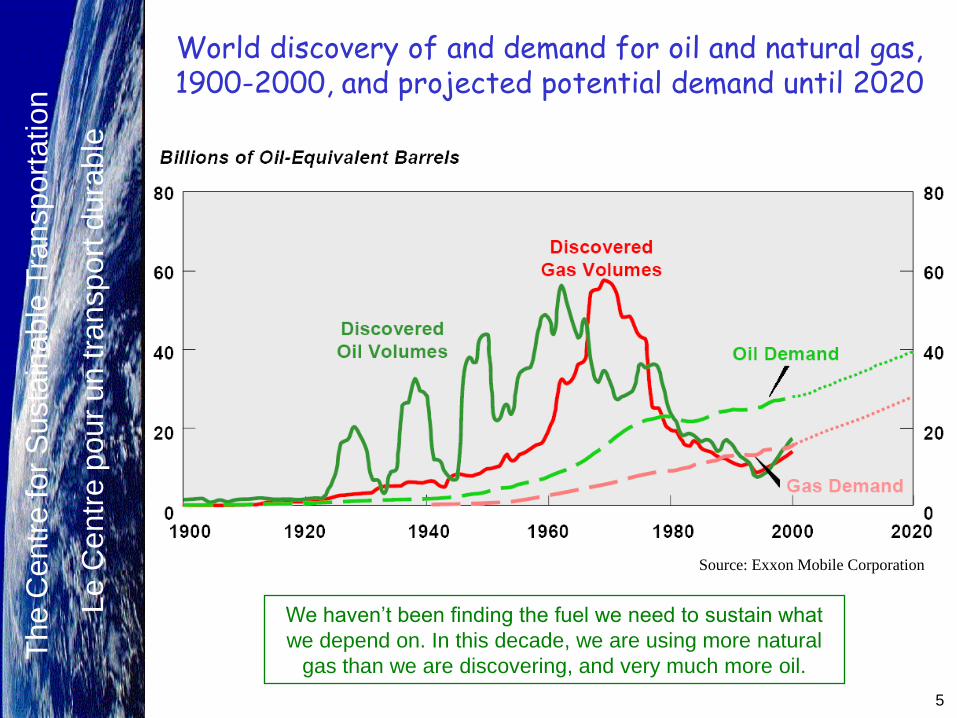
World discovery of and demand for oil and natural gas, 1900-2000, and projected potential demand until 2020
We haven‟t been finding the fuel we need to sustain what
we depend on. In this decade, we are using more natural
gas than we are discovering, and very much more oil.
Source: Exxon Mobile Corporation
Th
e C
en
tre
fo
r S
usta
ina
ble
Tra
nsp
ort
ation
Th
e C
en
tre
fo
r S
usta
ina
ble
Tra
nsp
ort
ation
Le C
entr
e p
our
un tra
nsport
dura
ble
6
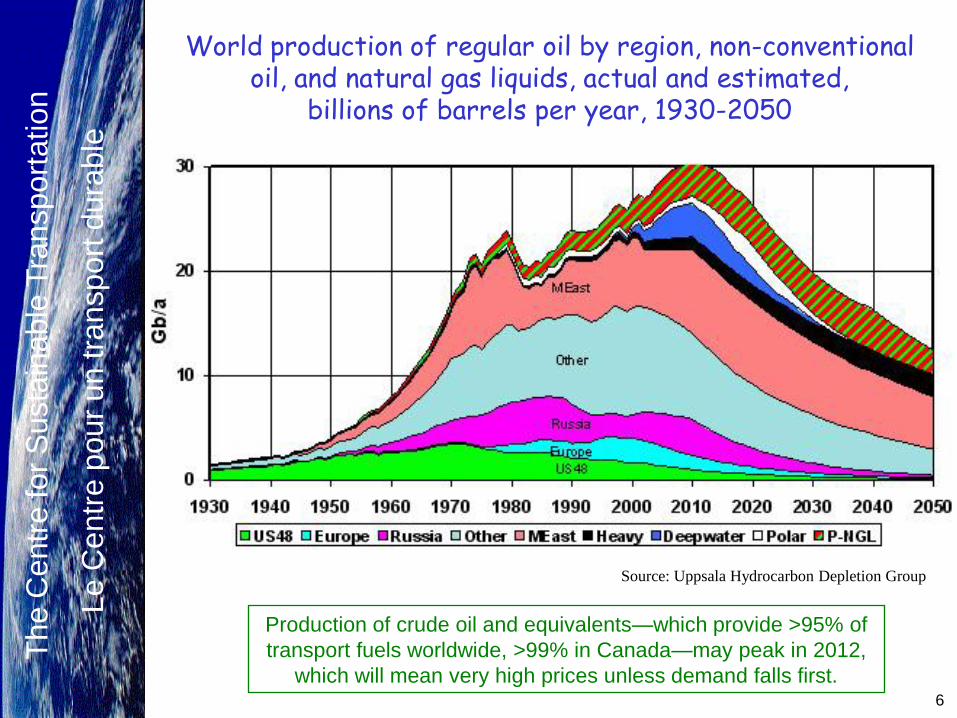
World production of regular oil by region, non-conventional oil, and natural gas liquids, actual and estimated,
billions of barrels per year, 1930-2050
Production of crude oil and equivalents—which provide >95% of
transport fuels worldwide, >99% in Canada—may peak in 2012,
which will mean very high prices unless demand falls first.
Source: Uppsala Hydrocarbon Depletion Group
Th
e C
en
tre
fo
r S
usta
ina
ble
Tra
nsp
ort
ation
Th
e C
en
tre
fo
r S
usta
ina
ble
Tra
nsp
ort
ation
Le C
entr
e p
our
un tra
nsport
dura
ble
7
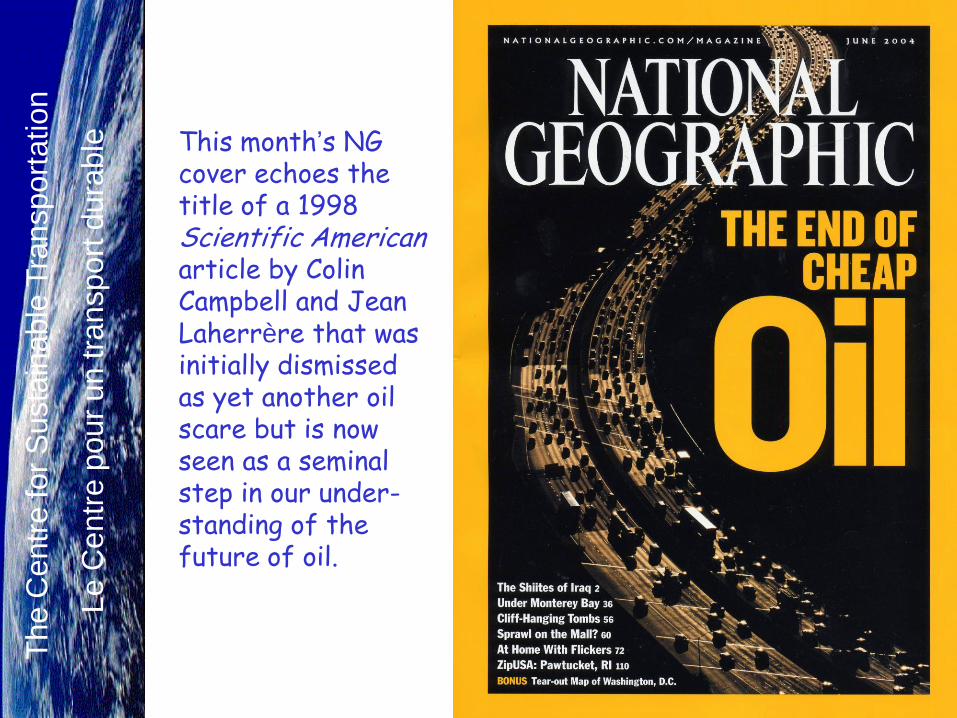
This month‟s NG cover echoes the title of a 1998 Scientific American article by Colin Campbell and Jean Laherrère that was initially dismissed as yet another oil scare but is now seen as a seminal step in our under-standing of the future of oil.

Th
e C
en
tre
fo
r S
usta
ina
ble
Tra
nsp
ort
ation
Th
e C
en
tre
fo
r S
usta
ina
ble
Tra
nsp
ort
ation
Le C
entr
e p
our
un tra
nsport
dura
ble
8
David Green and colleagues‟ qualifying statement
“The authors believe that their analysis
has a bias toward optimism about oil
resource availability because it does not
attempt to incorporate political or
environmental constraints on production,
nor does it explicitly include geologic
constraints on production rates.”
Th
e C
en
tre
fo
r S
usta
ina
ble
Tra
nsp
ort
ation
Th
e C
en
tre
fo
r S
usta
ina
ble
Tra
nsp
ort
ation
Le C
entr
e p
our
un tra
nsport
dura
ble
9
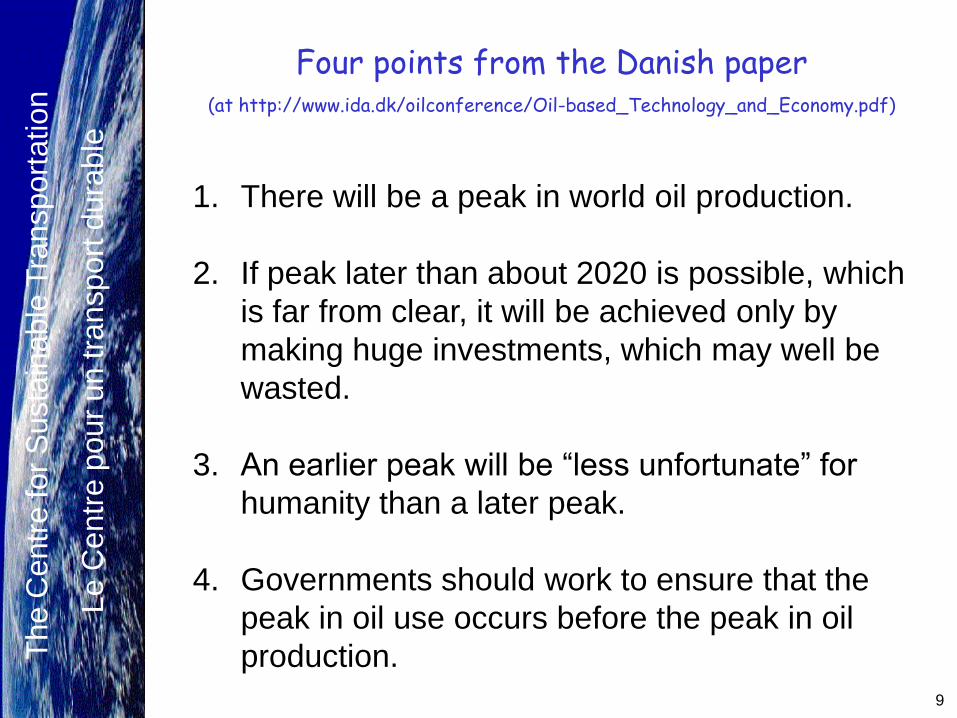
Four points from the Danish paper(at http://www.ida.dk/oilconference/Oil-based_Technology_and_Economy.pdf)
1. There will be a peak in world oil production.
2. If peak later than about 2020 is possible, which
is far from clear, it will be achieved only by
making huge investments, which may well be
wasted.
3. An earlier peak will be “less unfortunate” for
humanity than a later peak.
4. Governments should work to ensure that the
peak in oil use occurs before the peak in oil
production.
Th
e C
en
tre
fo
r S
usta
ina
ble
Tra
nsp
ort
ation
Th
e C
en
tre
fo
r S
usta
ina
ble
Tra
nsp
ort
ation
Le C
entr
e p
our
un tra
nsport
dura
ble
10
1. There will be a peak in oil production
Estimates of timing vary according to estimates of (a) extent
of reserves; (b) their recoverability.
Geologists tend to say earlier rather than later (before 2020,
perhaps as early as 2007, even before), based on what is in
ground and extraction experience.
Economists tend to say later rather than earlier (after 2020,
maybe even 2035 or later), based on how price increases
stimulate human ingenuity.
Just about all estimates point to a production peak well
within lifetimes of people alive today.
North American natural gas provides a portent: its produc-
tion peak may have already occurred.

Th
e C
en
tre
fo
r S
usta
ina
ble
Tra
nsp
ort
ation
Th
e C
en
tre
fo
r S
usta
ina
ble
Tra
nsp
ort
ation
Le C
entr
e p
our
un tra
nsport
dura
ble
11
The usual focus on reserves seems misplaced. Reserves are
important (although often questionable) but production—or rather,
ability to produce—may be much more important.
An Oil Enigma: Production Falls Even as
Reserves Rise
By ALEX BERENSON
June 12, 2004For six consecutive years, ChevronTexaco has had
good news for anyone worried that the world is
running out of oil: the company has found more oil
and natural gas than it has produced. Over that time,
ChevronTexaco’s proven oil and gas reserves have
risen 14 percent, more than one billion barrels.
But near the bottom of ChevronTexaco’s financial
filings is a much less promising statistic. For each of
those years, ChevronTexaco’s wells have produced
less oil and gas than the year before. Even as reserves
have risen, the company's annual output has fallen by
almost 15 percent, and the declines have continued
recently despite a company promise to increase
production in 2002.
An Oil Enigma: Production Falls Even as
Reserves Rise
By ALEX BERENSON
June 12, 2004
…. continued
An Oil Enigma: Production Falls Even as
Reserves Rise
By ALEX BERENSON
June 12, 2004For six consecutive years, ChevronTexaco has had
good news for anyone worried that the world is
running out of oil: the company has found more oil
and natural gas than it has produced. Over that time,
ChevronTexaco’s proven oil and gas reserves have
risen 14 percent, more than one billion barrels.
But near the bottom of ChevronTexaco’s financial
filings is a much less promising statistic. For each of
those years, ChevronTexaco’s wells have produced
less oil and gas than the year before. Even as reserves
have risen, the company's annual output has fallen by
almost 15 percent, and the declines have continued
recently despite a company promise to increase
production in 2002.
An Oil Enigma: Production Falls Even as
Reserves Rise
By ALEX BERENSON
June 12, 2004
…. continued

Th
e C
en
tre
fo
r S
usta
ina
ble
Tra
nsp
ort
ation
Th
e C
en
tre
fo
r S
usta
ina
ble
Tra
nsp
ort
ation
Le C
entr
e p
our
un tra
nsport
dura
ble
12
2. A later peak will require much investment
All who think a later peak is possible also see the need for
large amounts of investment in exploration and in extraction
technology.
An example is Exxon Mobil, which points to the need for oil
industry investments of one trillion U.S. dollars worldwide by
2010 to produce new production capacity of 80 million
barrels a day (now worldwide about 75 mb/day).
IEA says investment of $3.1 trillion needed to add 200 mb/
day by 2021 (for exploration, refining, distribution).
These are much above current rates of investment and a lot
of money to waste if oil cannot be found or if recovery rates
cannot be increased.

Th
e C
en
tre
fo
r S
usta
ina
ble
Tra
nsp
ort
ation
Th
e C
en
tre
fo
r S
usta
ina
ble
Tra
nsp
ort
ation
Le C
entr
e p
our
un tra
nsport
dura
ble
13
3. Better an earlier rather than later peak
An earlier peak would be “less unfortunate” for two reasons.
One is that there will be less dependency on oil worldwide.
The other is that an earlier peak would be more likely to
have a gradual rather than a steep decline in post-peak
production.
Thus, there is a strong case for investing more in reduced oil
dependence than in finding and extracting oil.
Th
e C
en
tre
fo
r S
usta
ina
ble
Tra
nsp
ort
ation
Th
e C
en
tre
fo
r S
usta
ina
ble
Tra
nsp
ort
ation
Le C
entr
e p
our
un tra
nsport
dura
ble
14
4. Ensure oil use peaks before production peaks
Then we will already be reducing oil use and thus have a
relatively „soft landing‟ when the production peak occurs.
To do this, first identify the date of the production peak.
Then develop a plan to have oil use fall before this peak.
Then implement the plan.
The transition could be helped by use of the proceeds
from diverting investment.
Oil use could be reduced through efficiency, through
reduced motorized activity, and through use of alternative
vehicle systems and fuels—e.g., tethered vehicles.
Th
e C
en
tre
fo
r S
usta
ina
ble
Tra
nsp
ort
ation
Th
e C
en
tre
fo
r S
usta
ina
ble
Tra
nsp
ort
ation
Le C
entr
e p
our
un tra
nsport
dura
ble
15
Government‟s Kyoto plan would plateau oil use
Kyoto looks more promising with EU backing of Russian
accession to WTO.
The Climate Change Plan for Canada appears to favour a
plateauing of oil use by 2010, at about the 2001 level.
(About 70% of Canada‟s final oil use is for transport.)
It would be relatively easy to refocus relevant policy to
start pushing oil use down, within the Kyoto framework, so
Canada becomes economically as well as environmentally
sustainable.

Th
e C
en
tre
fo
r S
usta
ina
ble
Tra
nsp
ort
ation
Th
e C
en
tre
fo
r S
usta
ina
ble
Tra
nsp
ort
ation
Le C
entr
e p
our
un tra
nsport
dura
ble
16
Actions need for short, medium, and longer terms
Short-term actions are the most important, to get oil use
moving down before the oil production peak (in 2012?). A
focus on trucks‟ load factors may produce the biggest
gains.
Medium-term actions are required to keep pushing oil use
down further after the peak (and to help in the short term).
A focus on new-vehicle fuel consumption may produce the
biggest gains.
Longer-term actions are required to help reduce oil use
much more, while maintaining mobility and advancing
sustainability. For this, adoption of tethered vehicle
systems may offer the best strategy.
Th
e C
en
tre
fo
r S
usta
ina
ble
Tra
nsp
ort
ation
Th
e C
en
tre
fo
r S
usta
ina
ble
Tra
nsp
ort
ation
Le C
entr
e p
our
un tra
nsport
dura
ble
17
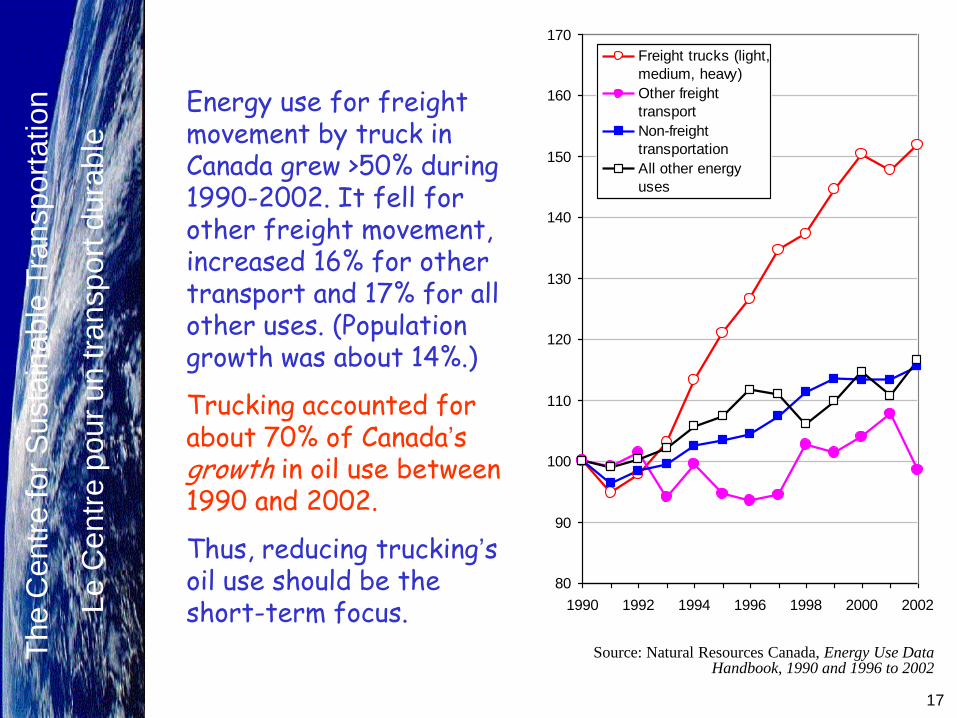
Energy use for freight movement by truck in Canada grew >50% during 1990-2002. It fell for other freight movement, increased 16% for other transport and 17% for all other uses. (Population growth was about 14%.)
Trucking accounted for about 70% of Canada‟s growth in oil use between 1990 and 2002.
Thus, reducing trucking‟s oil use should be the short-term focus.
80
90
100
110
120
130
140
150
160
170
1990 1992 1994 1996 1998 2000 2002
Freight trucks (light,
medium, heavy)
Other freight
transport
Non-freight
transportation
All other energy
uses
Source: Natural Resources Canada, Energy Use Data Handbook, 1990 and 1996 to 2002
Th
e C
en
tre
fo
r S
usta
ina
ble
Tra
nsp
ort
ation
Th
e C
en
tre
fo
r S
usta
ina
ble
Tra
nsp
ort
ation
Le C
entr
e p
our
un tra
nsport
dura
ble
18
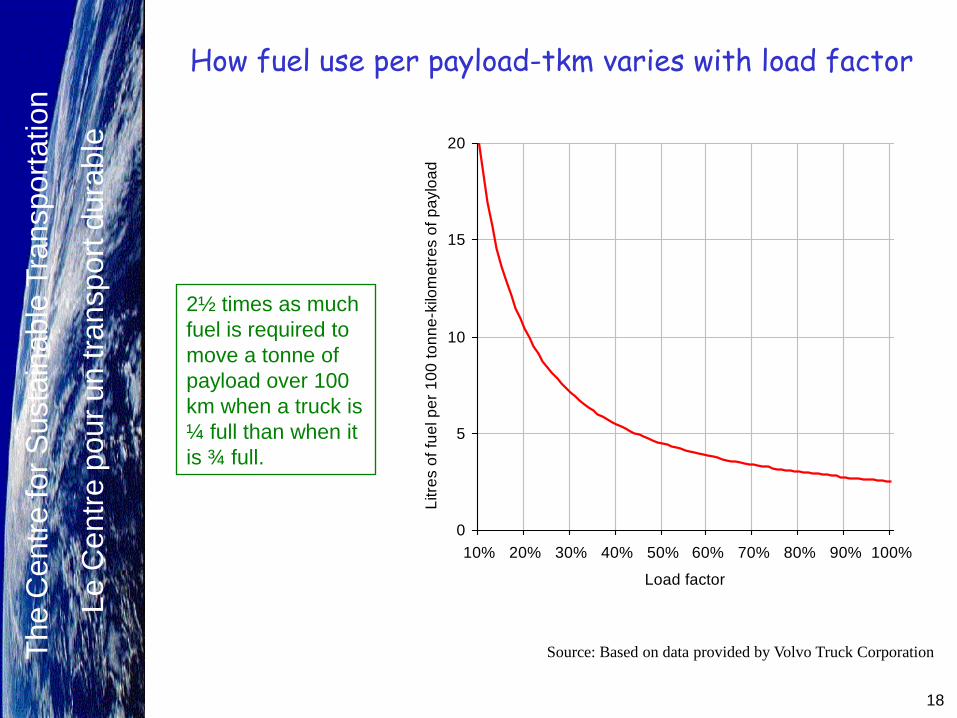
Source: Based on data provided by Volvo Truck Corporation
0
5
10
15
20
10% 20% 30% 40% 50% 60% 70% 80% 90% 100%
Load factor
Litre
s o
f fu
el p
er
10
0 t
on
ne
-kilo
me
tre
s o
f p
aylo
ad
How fuel use per payload-tkm varies with load factor
2½ times as much
fuel is required to
move a tonne of
payload over 100
km when a truck is
¼ full than when it
is ¾ full.
Th
e C
en
tre
fo
r S
usta
ina
ble
Tra
nsp
ort
ation
Th
e C
en
tre
fo
r S
usta
ina
ble
Tra
nsp
ort
ation
Le C
entr
e p
our
un tra
nsport
dura
ble
19
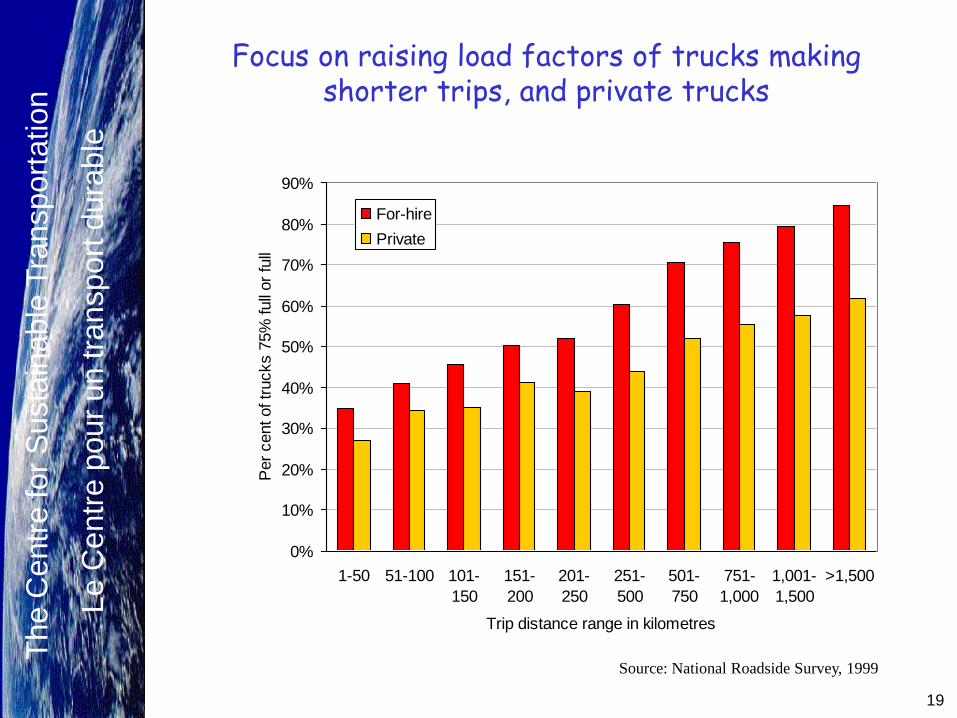
Source: National Roadside Survey, 1999
Focus on raising load factors of trucks making shorter trips, and private trucks
0%
10%
20%
30%
40%
50%
60%
70%
80%
90%
1-50 51-100 101-
150
151-
200
201-
250
251-
500
501-
750
751-
1,000
1,001-
1,500
>1,500
Trip distance range in kilometres
Per
cent of tr
ucks 7
5%
full
or
full
For-hire
Private
Th
e C
en
tre
fo
r S
usta
ina
ble
Tra
nsp
ort
ation
Th
e C
en
tre
fo
r S
usta
ina
ble
Tra
nsp
ort
ation
Le C
entr
e p
our
un tra
nsport
dura
ble
20
Improving trucks‟ load factors
Education: chiefly of shippers—who make the decisions—
rather than carriers, but also carriers.
Taxes: higher fuel taxes might help. Or higher costs generally
(which force efficiencies).
Regulations: access limits for vehicles half-empty or less.
Regulations: removing cabotage rules and differences in
provincial regulations.
Consolidation: distribution centres that consolidate loads,
rationalize pick-ups (Heathrow Airport: 90% reduction in truck
traffic for store deliveries and pick-ups).

Th
e C
en
tre
fo
r S
usta
ina
ble
Tra
nsp
ort
ation
Th
e C
en
tre
fo
r S
usta
ina
ble
Tra
nsp
ort
ation
Le C
entr
e p
our
un tra
nsport
dura
ble
21
Source: U.S. Environmental Protection Agency, 2004
Weighted average rated fuel use (left) and sales per capita (right), light-duty vehicles sold in the U.S., 1975-2004 model years
Note rapid adjustment to 1973 oil shock, and CAFE‟s control of fuel use.
Rated fuel use: litres/100 kilometres
8
10
12
14
16
18
20
22
1975 1980 1985 1990 1995 2000
Sales per 1000 residents
0
10
20
30
40
50
60
70
1975 1980 1985 1990 1995 2000
Weight in kilograms
1200
1350
1500
1650
1800
1950
2100
2250
1975 1980 1985 1990 1995 2000
Power in kilowatts
50
70
90
110
130
150
170
190
1975 1980 1985 1990 1995 2000
Cars Other (SUVs etc.) All
Th
e C
en
tre
fo
r S
usta
ina
ble
Tra
nsp
ort
ation
Th
e C
en
tre
fo
r S
usta
ina
ble
Tra
nsp
ort
ation
Le C
entr
e p
our
un tra
nsport
dura
ble
22
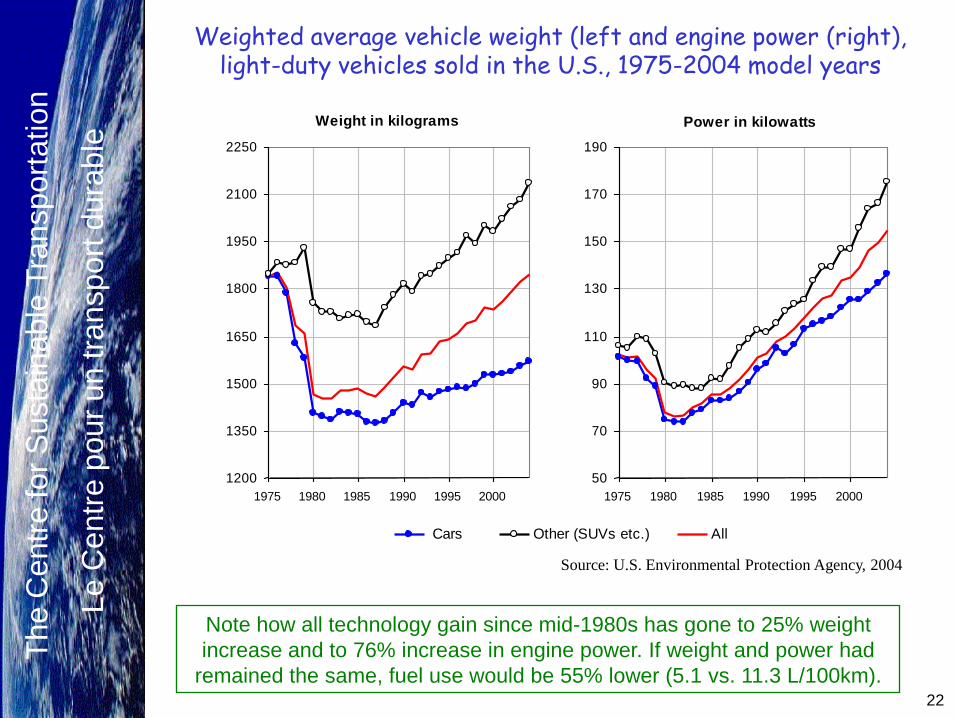
Source: U.S. Environmental Protection Agency, 2004
Weighted average vehicle weight (left and engine power (right), light-duty vehicles sold in the U.S., 1975-2004 model years
Note how all technology gain since mid-1980s has gone to 25% weight
increase and to 76% increase in engine power. If weight and power had
remained the same, fuel use would be 55% lower (5.1 vs. 11.3 L/100km).
Weight in kilograms
1200
1350
1500
1650
1800
1950
2100
2250
1975 1980 1985 1990 1995 2000
Power in kilowatts
50
70
90
110
130
150
170
190
1975 1980 1985 1990 1995 2000
Cars Other (SUVs etc.) All
Weight in kilograms
1200
1350
1500
1650
1800
1950
2100
2250
1975 1980 1985 1990 1995 2000
Power in kilowatts
50
70
90
110
130
150
170
190
1975 1980 1985 1990 1995 2000
Cars Other (SUVs etc.) All

Th
e C
en
tre
fo
r S
usta
ina
ble
Tra
nsp
ort
ation
Th
e C
en
tre
fo
r S
usta
ina
ble
Tra
nsp
ort
ation
Le C
entr
e p
our
un tra
nsport
dura
ble
23
Replacing Canada‟s personal vehicle fleet
Manufacturers can be nimble if consumers demand (see late
1970s); therefore educate consumers, and manufacturers.
Higher fuel prices would help change demand.
Challenge is that at current replacement rates it takes seven
years to turn over half the fleet (12 years for 75% of the fleet).
Incentives could help speed the turnover, including rebates
and feebates. Higher fuel prices might speed things up too.
Problem: if replacement vehicle has not at least 15% lower fuel
use, early replacement could result in added energy use
because of energy used to manufacture and distribute
vehicles.
Th
e C
en
tre
fo
r S
usta
ina
ble
Tra
nsp
ort
ation
Th
e C
en
tre
fo
r S
usta
ina
ble
Tra
nsp
ort
ation
Le C
entr
e p
our
un tra
nsport
dura
ble
24
What are tethered vehicles?
They are electrically driven vehicles that get their motive energy
from an overhead wire or wires (or third rail) rather than from an on-
board source.
They have high „wire-to-wheel‟ fuel efficiency for four reasons:
>95% of applied energy is converted to traction
electric motors are intrinsically lighter than ICEs
constant torque at all speeds means no oversizing
there is no fuel to carry.
Overall efficiency and environmental impacts depend on the
distribution system (perhaps a 10% loss) and the primary fuel
source, which can range from inefficient and dirty (e.g., coal) to
efficient and clean (e.g., wind).
Tethered systems can use a wide range of fuels and switch among
them without disrupting transport activity, making for smooth
transitions towards sustainable transportation.
Th
e C
en
tre
fo
r S
usta
ina
ble
Tra
nsp
ort
ation
Th
e C
en
tre
fo
r S
usta
ina
ble
Tra
nsp
ort
ation
Le C
entr
e p
our
un tra
nsport
dura
ble
25
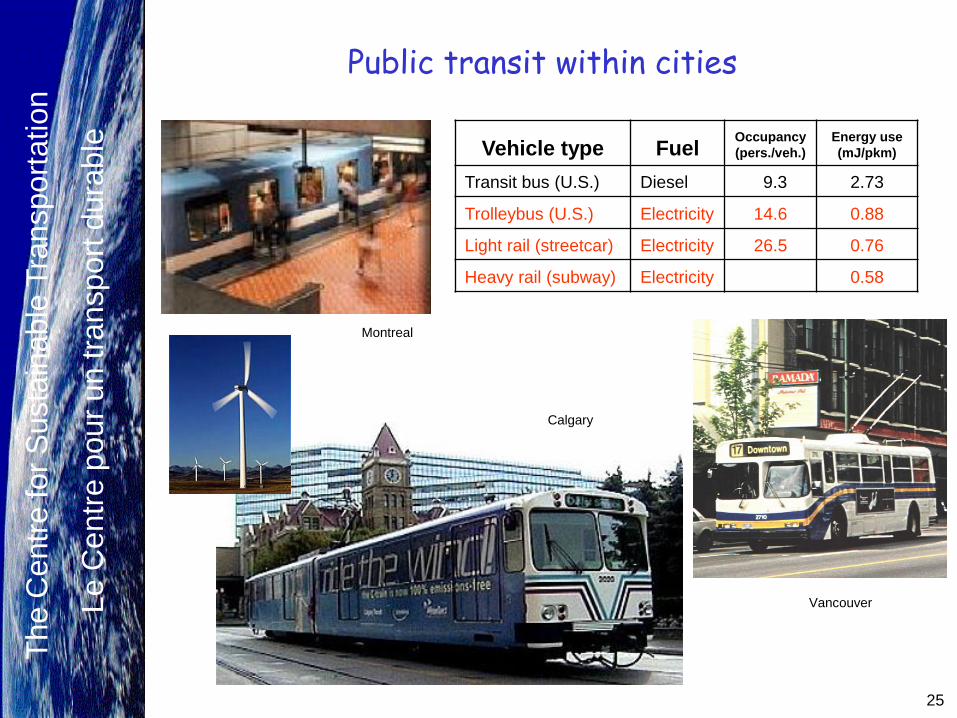
Public transit within cities
Vehicle type FuelOccupancy
(pers./veh.)
Energy use
(mJ/pkm)
Transit bus (U.S.) Diesel 9.3 2.73
Trolleybus (U.S.) Electricity 14.6 0.88
Light rail (streetcar) Electricity 26.5 0.76
Heavy rail (subway) Electricity 0.58
Vancouver
Calgary
Montreal

Th
e C
en
tre
fo
r S
usta
ina
ble
Tra
nsp
ort
ation
Th
e C
en
tre
fo
r S
usta
ina
ble
Tra
nsp
ort
ation
Le C
entr
e p
our
un tra
nsport
dura
ble
26
Public transit between cities
Vehicle
type FuelOccupancy
(pers./veh.)
Energy use
(mJ/pkm)
Intercity rail Diesel 2.20
School bus Diesel 19.5 1.02
Intercity bus Diesel 16.8 0.90
Intercity rail Electricity 0.64
German ICE
Amtrak Acela at Boston South station

Th
e C
en
tre
fo
r S
usta
ina
ble
Tra
nsp
ort
ation
Th
e C
en
tre
fo
r S
usta
ina
ble
Tra
nsp
ort
ation
Le C
entr
e p
our
un tra
nsport
dura
ble
27
Personal vehicles
Vehicle type FuelOccupancy
(pers./veh.)
Energy use
(mJ/pkm)
SUVs, vans, etc. Gasoline 1.70 3.27
Large cars Gasoline 1.65 2.55
Small cars Gasoline 1.65 2.02
Motorcycles Gasoline 1.10 1.46
Fuel-cell car Hydrogen 1.65 0.92
Hybrid electric car Gasoline 1.65 0.90
Very small car Diesel 1.30 0.89
Personal Rapid Transit Electricity 1.65 0.49
Skyweb Express (Cincinnati concept)
Düsseldorf Airport SkyTrain
Th
e C
en
tre
fo
r S
usta
ina
ble
Tra
nsp
ort
ation
Th
e C
en
tre
fo
r S
usta
ina
ble
Tra
nsp
ort
ation
Le C
entr
e p
our
un tra
nsport
dura
ble
28
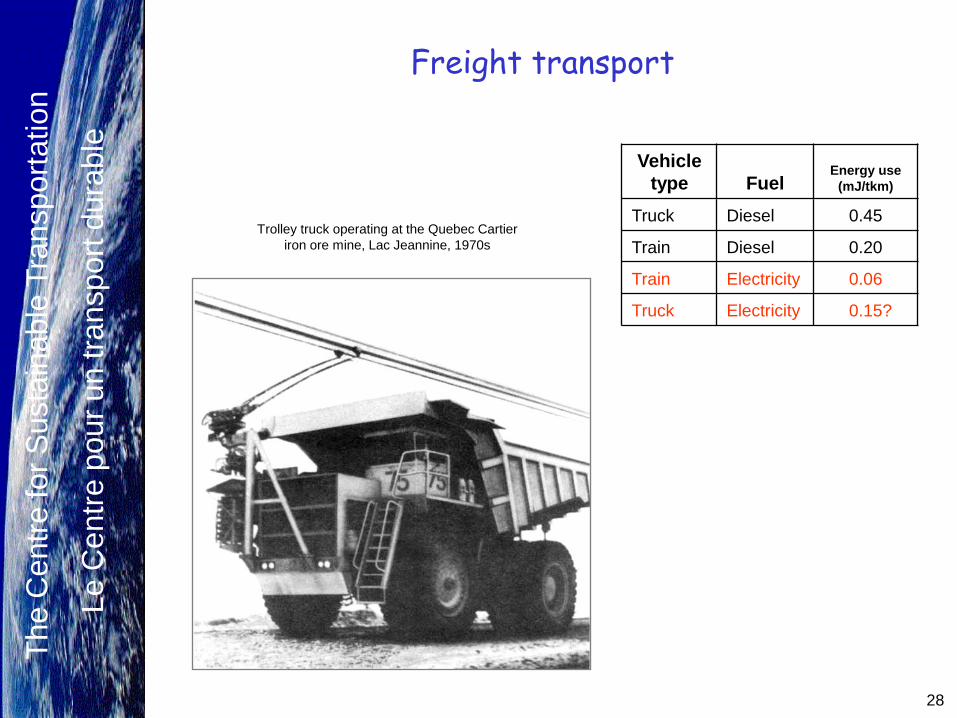
Freight transport
Vehicle
type FuelEnergy use
(mJ/tkm)
Truck Diesel 0.45
Train Diesel 0.20
Train Electricity 0.06
Truck Electricity 0.15?
Trolley truck operating at the Quebec Cartier
iron ore mine, Lac Jeannine, 1970s
Th
e C
en
tre
fo
r S
usta
ina
ble
Tra
nsp
ort
ation
Th
e C
en
tre
fo
r S
usta
ina
ble
Tra
nsp
ort
ation
Le C
entr
e p
our
un tra
nsport
dura
ble
29
Tethered vehicles and the next transport revolution (1)
The main contexts for the next transport revolution could
be super-high oil prices and little in the way of availability
of hydrogen or uses for it.
The main transport concerns will be (i) getting the most
movement for the least energy use; (ii) taking advantage
of the widest possible range of energy sources.
Much more than other systems, tethered vehicle systems
meet both of these needs.
We should invest now in rails, wires, and other infra-
structure for tethered vehicles. Sustaining our transport-
dependent way of life may well depend on it.
Th
e C
en
tre
fo
r S
usta
ina
ble
Tra
nsp
ort
ation
Th
e C
en
tre
fo
r S
usta
ina
ble
Tra
nsp
ort
ation
Le C
entr
e p
our
un tra
nsport
dura
ble
30
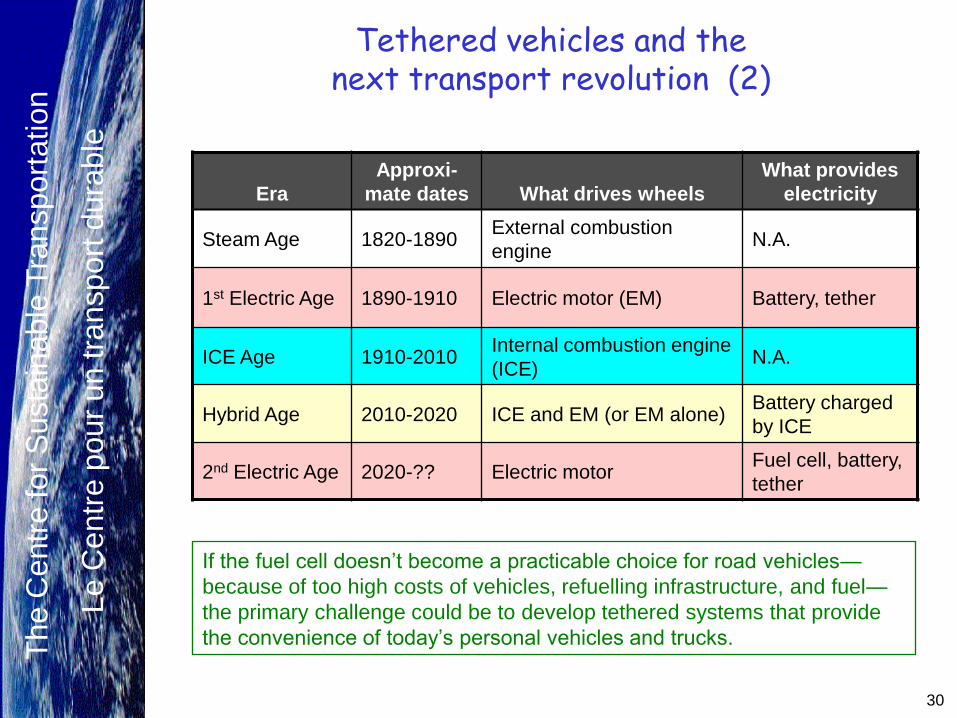
Tethered vehicles and the next transport revolution (2)
Era
Approxi-
mate dates What drives wheels
What provides
electricity
Steam Age 1820-1890External combustion
engineN.A.
1st Electric Age 1890-1910 Electric motor (EM) Battery, tether
ICE Age 1910-2010Internal combustion engine
(ICE)N.A.
Hybrid Age 2010-2020 ICE and EM (or EM alone) Battery charged
by ICE
2nd Electric Age 2020-?? Electric motorFuel cell, battery,
tether
If the fuel cell doesn‟t become a practicable choice for road vehicles—
because of too high costs of vehicles, refuelling infrastructure, and fuel—
the primary challenge could be to develop tethered systems that provide
the convenience of today‟s personal vehicles and trucks.
Related Documents