Energy Benchmarking Service for Data Centre Industry in Hong Kong and Initial Findings Simon Lam Acting Deputy Director, Business Marketing & Development Department, CLP Power

Welcome message from author
This document is posted to help you gain knowledge. Please leave a comment to let me know what you think about it! Share it to your friends and learn new things together.
Transcript
Energy Benchmarking Service for Data Centre Industry in
Hong Kong and Initial Findings
Simon Lam Acting Deputy Director
Business Marketing amp Development Department CLP Power
2
1 Introduction Why Energy Benchmarking
2 Methodology
3 Initial Findings
4 Best Practices from the Top Performers
5 Way Forward
Agenda
3
Introduction Why Energy Benchmarking
Customer needs - DC is Energy Intensive - Keen to save energy cost - Premium customer service
World trend in energy saving - Benchmark with peers - Facilitate ldquoBehavior Changerdquo - Interactive productservice
CLPrsquos commitment in pursuing green - Responsible energy provider - Driving energy efficiency - Benchmarking tools in place
- Eco-Optimizer (Domestic) - Energy Billboard (RetailSMEs)
CLPrsquos unique position - Independent position facilitates data
amp insights collection - Follow up with individual DC by
dedicated account managers
4
Methodology
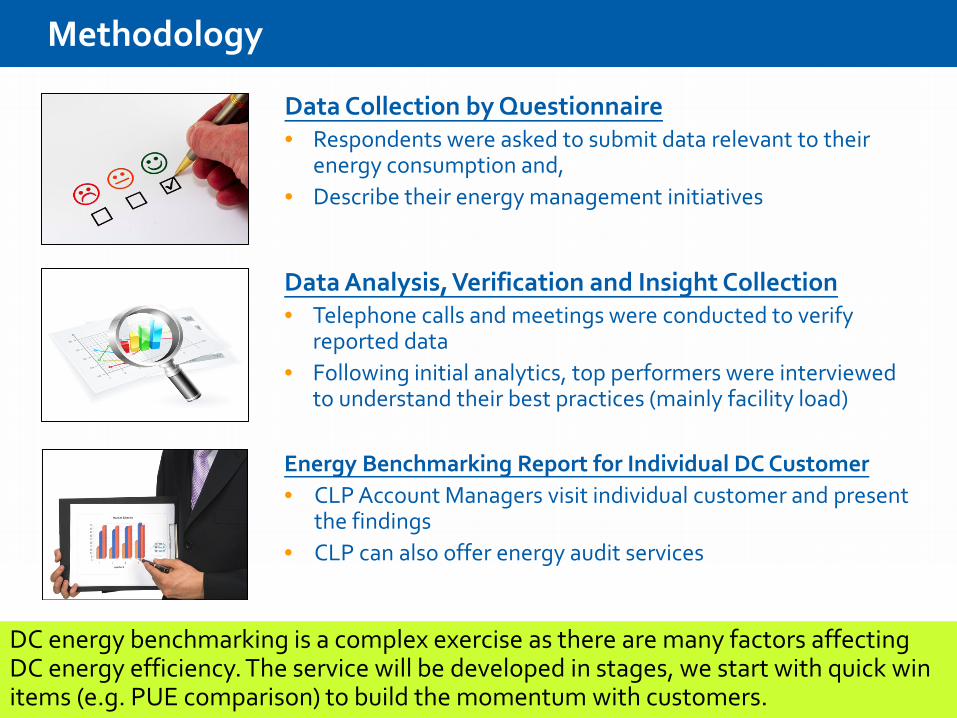
Data Collection by Questionnaire bull Respondents were asked to submit data relevant to their
energy consumption and bull Describe their energy management initiatives
Data Analysis Verification and Insight Collection bull Telephone calls and meetings were conducted to verify
reported data bull Following initial analytics top performers were interviewed
to understand their best practices (mainly facility load)
Energy Benchmarking Report for Individual DC Customer bull CLP Account Managers visit individual customer and present
the findings bull CLP can also offer energy audit services
DC energy benchmarking is a complex exercise as there are many factors affecting
DC energy efficiency The service will be developed in stages we start with quick win items (eg PUE comparison) to build the momentum with customers
5
Road Map of New Energy Benchmarking Service
Measurement Base lining
Stage ONE Stage TWO
bull Understand their energy performance amongst peers
bull Learn the best practices
Value to Customers bull Individual report
bull Face to face discussion bull Invite more Data Centres to
join
Result discussion Sharing of best practices in industry Collect more data and enhance the service
Jan 2013 September 2014
Concept development Data gathering Analytics amp Validation
Development of Energy Benchmarking service
Meeting with Top performers Present initial findings
June
We are here today
6
Initial Findings
7
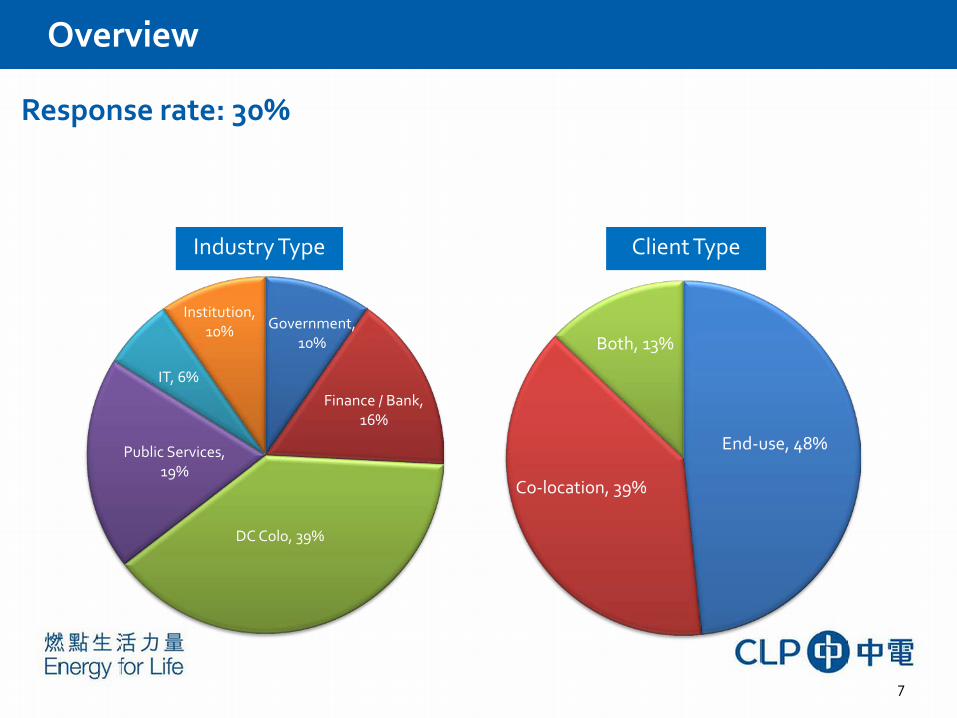
End-use 48
Co-location 39
Both 13 Government
10
Finance Bank 16
DC Colo 39
Public Services 19
IT 6
Institution 10
Response rate 30
Industry Type Client Type
Overview
8
Tier-2 39
Tier-3 55
Tier-4 6
Overview
Tier Level Electrical System Generator Back-up
N 0
N+1 33
2N 67
N 52 N+1 28
2N 21
Use of Floor Area
IT area in use 50
IT Expansion area 13
Non-IT area
(facility) 38
Chiller Type
Water-cooled
28
Air-cooled 59
Both 14
9
00
10
20
30
40
Average PUE = 22
DC Sites
PUE
IT consumption + Facility consumption IT consumption PUE =
(the smaller the better)
DC Avg PUE
Age lt 5 years
Water-cooled chillers
IT Load kWRack
Top 25
17 50 70 32
Rest 75
24 30 30 14
Reported Power Usage Effectiveness (PUE)
DC Industry standard to measure how well DCrsquos manage their energy efficiency
Delve into 4 different perspectives to better understand PUEs
C IT Consumption (GWh per annum)
D DC Tier Level B No of Server Rack
A Trade Class
10
Reported Power Usage Effectiveness (PUE)
A Benchmark Grade for each of the 4 Perspectives Trade Rack IT GWh amp Tier-Level
A) Overall Average = 22
B) Sub-class Average Eg Trade class for A = 20 Grade B
Grade C
Grade A
PUE Your Score eg Trade
Your Total
Scores
Trade No of Rack IT GWh
Average
Below Average
Tier Level
C) Compare with your performance Eg Yoursquore in Trade A your PUE=18 Above Average
amp
11
An index to reflect how well you manage your energy usage pattern Total Consumption Max Demand
(from 0 to ~720)
DC Load pattern Other Commercial amp Industrial
The Flatter the load the Larger the load factor = Lower the demand charge
LF =
Load Factor (LF)
75 of DCs are enjoying discounts from High Load Factor Rider (LF gt 500) 1-3 saving potential if the customers can better manage their usage pattern
12
Top Performersrsquo Insights
13
A) Temperature Setting
Air Temp setting of DC Avg PUE
gt= 24 deg-C 15 17
gt= 23 deg-C 40 18
lt 23 deg-C 60 22
lt 22 deg-C 20 23
Real Life Saving Examples bull Case 1 25 to 29 deg-C 14 saving Practically FREE of cost bull Case 2 20 to 25 deg-C 22 saving Practically FREE of cost
Considerations bull Gradually increase 1 degree at a time bull Risk mitigation measures (1) consult with vendor (2) critical spares stored on-
site amp shortened time for fault handling (3) more temperature sensors bull Hurdle to overcome educate end-use customers change SLA terms bull New trend for Colo DC Market a DC hall as ldquoGreen Zonerdquo with higher
temperature setting in SLA and share the benefits with end-use customers
Industry average = 224 deg-C New equipment can operate at gt35 deg-C
14
Real Life Saving Examples bull Case A Plastic sheets to shield off cold aisle
PUE = 16 payback = 1 year bull Case B To install high grade glass wall expected
saving 8 on chiller payback = 4 years
B) Cold Aisle Containment Before After
Considerations bull Best for high power density zone where cooling demand is
highly concentrated [eg IT density gt 6kWrack] bull Glass wall containment is ideal for new project Can consider
plastic sheet shield-off for retrofitting projects
Short circuit Short circuit
15
Methodology 1 Install sensors for one-off or continuous
monitoring identify hot amp cold spot 2 Optimise flow rate by reducing fan speed
of CRAC OR install boosters amp dampers so that some CRACs can be shutdown
C) Air Flow Balancing Management
Real Life Saving Examples bull Case 1 measure bi-annually 6 saving on reduced CRAC output payback = 8
months bull Case 2 install boosters and dampers shutdown of some CRACs payback = 4
years
Considerations bull Maintenance issues for additional boosters amp dampers bull Rebalancing on regular basis (cater IT load growth) bull New trend dynamic system
16
IT load initiatives bull Server virtualisation and switch off idle servers to reduce peak bull Replace energy efficient IT equipment (difference in consumption 25)
D) Improve Load Factor
Considerations bull Follow regulations from WSD amp EPD (Please approach CLP welcome to
share our experience with you)
Facility load initiatives bull Case 1 Water mist spray to air-cooled evaporators reduce 10 peak load bull Case 2 Optimise chiller sequencing reduce 10 peak load
17
Your Road Map to Energy Sustainability
18
A) Build awareness and keep monitoring bull Compare the PUE among peers in the measured variables
bull Compare the LF among peers
Your Road Map to Energy Sustainability
Your Energy Benchmarking Report
B) Know how to further improve bull Understand the Best Practices in DC industry in Hong Kong bull Plan your energy management initiatives in existing or new
DC
19
C) Talk to our dedicated account management team bull We provide a one-stop-shop services
1 Energy Audit review the energy performance of your DC and provide customised energy saving measures
2 Technical advice on major energy systems eg Chillers measure the chiller performance and plan ahead the practicality of initiatives
bull Visit our dedicated website (clponline) to get energy efficiency best practices for Data Centres
Your Road Map to Energy Sustainability
For those who havenrsquot joined us yet Join our DC Energy Benchmarking Service NOW
20
CLP ndash Your Preferred Energy Partner
Please contact me if CLP can be of any assistance to your green and energy management initiatives
simonlamclpcomhk or
datacentreclpcomhk
Thank you
21
Disclaimer
CLP Power does not guarantee the accuracy of the data or the derived results or benefits from tips provided in this presentation and is not responsible for the accuracy completeness or usefulness of the information so provided herein It should be understood and accepted that the information contained herein may lack qualifying details and CLP will not be required to furnish any further data to support or substantiate any findings contained herein CLP will not be liable whatsoever in any form to whosoever from without limitation any form of loss whatsoever arising or associated with the use of the contents herein
- Energy Benchmarking Service forData Centre Industry in Hong Kong and Initial Findings
- Slide Number 2
- Slide Number 3
- Methodology
- Road Map of New Energy Benchmarking Service
- Slide Number 6
- Overview
- Overview
- Slide Number 9
- Slide Number 10
- Slide Number 11
- Slide Number 12
- Slide Number 13
- Slide Number 14
- Slide Number 15
- Slide Number 16
- Slide Number 17
- Slide Number 18
- Slide Number 19
- Slide Number 20
- Disclaimer
-
2
1 Introduction Why Energy Benchmarking
2 Methodology
3 Initial Findings
4 Best Practices from the Top Performers
5 Way Forward
Agenda
3
Introduction Why Energy Benchmarking
Customer needs - DC is Energy Intensive - Keen to save energy cost - Premium customer service
World trend in energy saving - Benchmark with peers - Facilitate ldquoBehavior Changerdquo - Interactive productservice
CLPrsquos commitment in pursuing green - Responsible energy provider - Driving energy efficiency - Benchmarking tools in place
- Eco-Optimizer (Domestic) - Energy Billboard (RetailSMEs)
CLPrsquos unique position - Independent position facilitates data
amp insights collection - Follow up with individual DC by
dedicated account managers
4
Methodology
Data Collection by Questionnaire bull Respondents were asked to submit data relevant to their
energy consumption and bull Describe their energy management initiatives
Data Analysis Verification and Insight Collection bull Telephone calls and meetings were conducted to verify
reported data bull Following initial analytics top performers were interviewed
to understand their best practices (mainly facility load)
Energy Benchmarking Report for Individual DC Customer bull CLP Account Managers visit individual customer and present
the findings bull CLP can also offer energy audit services
DC energy benchmarking is a complex exercise as there are many factors affecting
DC energy efficiency The service will be developed in stages we start with quick win items (eg PUE comparison) to build the momentum with customers
5
Road Map of New Energy Benchmarking Service
Measurement Base lining
Stage ONE Stage TWO
bull Understand their energy performance amongst peers
bull Learn the best practices
Value to Customers bull Individual report
bull Face to face discussion bull Invite more Data Centres to
join
Result discussion Sharing of best practices in industry Collect more data and enhance the service
Jan 2013 September 2014
Concept development Data gathering Analytics amp Validation
Development of Energy Benchmarking service
Meeting with Top performers Present initial findings
June
We are here today
6
Initial Findings
7
End-use 48
Co-location 39
Both 13 Government
10
Finance Bank 16
DC Colo 39
Public Services 19
IT 6
Institution 10
Response rate 30
Industry Type Client Type
Overview
8
Tier-2 39
Tier-3 55
Tier-4 6
Overview
Tier Level Electrical System Generator Back-up
N 0
N+1 33
2N 67
N 52 N+1 28
2N 21
Use of Floor Area
IT area in use 50
IT Expansion area 13
Non-IT area
(facility) 38
Chiller Type
Water-cooled
28
Air-cooled 59
Both 14
9
00
10
20
30
40
Average PUE = 22
DC Sites
PUE
IT consumption + Facility consumption IT consumption PUE =
(the smaller the better)
DC Avg PUE
Age lt 5 years
Water-cooled chillers
IT Load kWRack
Top 25
17 50 70 32
Rest 75
24 30 30 14
Reported Power Usage Effectiveness (PUE)
DC Industry standard to measure how well DCrsquos manage their energy efficiency
Delve into 4 different perspectives to better understand PUEs
C IT Consumption (GWh per annum)
D DC Tier Level B No of Server Rack
A Trade Class
10
Reported Power Usage Effectiveness (PUE)
A Benchmark Grade for each of the 4 Perspectives Trade Rack IT GWh amp Tier-Level
A) Overall Average = 22
B) Sub-class Average Eg Trade class for A = 20 Grade B
Grade C
Grade A
PUE Your Score eg Trade
Your Total
Scores
Trade No of Rack IT GWh
Average
Below Average
Tier Level
C) Compare with your performance Eg Yoursquore in Trade A your PUE=18 Above Average
amp
11
An index to reflect how well you manage your energy usage pattern Total Consumption Max Demand
(from 0 to ~720)
DC Load pattern Other Commercial amp Industrial
The Flatter the load the Larger the load factor = Lower the demand charge
LF =
Load Factor (LF)
75 of DCs are enjoying discounts from High Load Factor Rider (LF gt 500) 1-3 saving potential if the customers can better manage their usage pattern
12
Top Performersrsquo Insights
13
A) Temperature Setting
Air Temp setting of DC Avg PUE
gt= 24 deg-C 15 17
gt= 23 deg-C 40 18
lt 23 deg-C 60 22
lt 22 deg-C 20 23
Real Life Saving Examples bull Case 1 25 to 29 deg-C 14 saving Practically FREE of cost bull Case 2 20 to 25 deg-C 22 saving Practically FREE of cost
Considerations bull Gradually increase 1 degree at a time bull Risk mitigation measures (1) consult with vendor (2) critical spares stored on-
site amp shortened time for fault handling (3) more temperature sensors bull Hurdle to overcome educate end-use customers change SLA terms bull New trend for Colo DC Market a DC hall as ldquoGreen Zonerdquo with higher
temperature setting in SLA and share the benefits with end-use customers
Industry average = 224 deg-C New equipment can operate at gt35 deg-C
14
Real Life Saving Examples bull Case A Plastic sheets to shield off cold aisle
PUE = 16 payback = 1 year bull Case B To install high grade glass wall expected
saving 8 on chiller payback = 4 years
B) Cold Aisle Containment Before After
Considerations bull Best for high power density zone where cooling demand is
highly concentrated [eg IT density gt 6kWrack] bull Glass wall containment is ideal for new project Can consider
plastic sheet shield-off for retrofitting projects
Short circuit Short circuit
15
Methodology 1 Install sensors for one-off or continuous
monitoring identify hot amp cold spot 2 Optimise flow rate by reducing fan speed
of CRAC OR install boosters amp dampers so that some CRACs can be shutdown
C) Air Flow Balancing Management
Real Life Saving Examples bull Case 1 measure bi-annually 6 saving on reduced CRAC output payback = 8
months bull Case 2 install boosters and dampers shutdown of some CRACs payback = 4
years
Considerations bull Maintenance issues for additional boosters amp dampers bull Rebalancing on regular basis (cater IT load growth) bull New trend dynamic system
16
IT load initiatives bull Server virtualisation and switch off idle servers to reduce peak bull Replace energy efficient IT equipment (difference in consumption 25)
D) Improve Load Factor
Considerations bull Follow regulations from WSD amp EPD (Please approach CLP welcome to
share our experience with you)
Facility load initiatives bull Case 1 Water mist spray to air-cooled evaporators reduce 10 peak load bull Case 2 Optimise chiller sequencing reduce 10 peak load
17
Your Road Map to Energy Sustainability
18
A) Build awareness and keep monitoring bull Compare the PUE among peers in the measured variables
bull Compare the LF among peers
Your Road Map to Energy Sustainability
Your Energy Benchmarking Report
B) Know how to further improve bull Understand the Best Practices in DC industry in Hong Kong bull Plan your energy management initiatives in existing or new
DC
19
C) Talk to our dedicated account management team bull We provide a one-stop-shop services
1 Energy Audit review the energy performance of your DC and provide customised energy saving measures
2 Technical advice on major energy systems eg Chillers measure the chiller performance and plan ahead the practicality of initiatives
bull Visit our dedicated website (clponline) to get energy efficiency best practices for Data Centres
Your Road Map to Energy Sustainability
For those who havenrsquot joined us yet Join our DC Energy Benchmarking Service NOW
20
CLP ndash Your Preferred Energy Partner
Please contact me if CLP can be of any assistance to your green and energy management initiatives
simonlamclpcomhk or
datacentreclpcomhk
Thank you
21
Disclaimer
CLP Power does not guarantee the accuracy of the data or the derived results or benefits from tips provided in this presentation and is not responsible for the accuracy completeness or usefulness of the information so provided herein It should be understood and accepted that the information contained herein may lack qualifying details and CLP will not be required to furnish any further data to support or substantiate any findings contained herein CLP will not be liable whatsoever in any form to whosoever from without limitation any form of loss whatsoever arising or associated with the use of the contents herein
- Energy Benchmarking Service forData Centre Industry in Hong Kong and Initial Findings
- Slide Number 2
- Slide Number 3
- Methodology
- Road Map of New Energy Benchmarking Service
- Slide Number 6
- Overview
- Overview
- Slide Number 9
- Slide Number 10
- Slide Number 11
- Slide Number 12
- Slide Number 13
- Slide Number 14
- Slide Number 15
- Slide Number 16
- Slide Number 17
- Slide Number 18
- Slide Number 19
- Slide Number 20
- Disclaimer
-
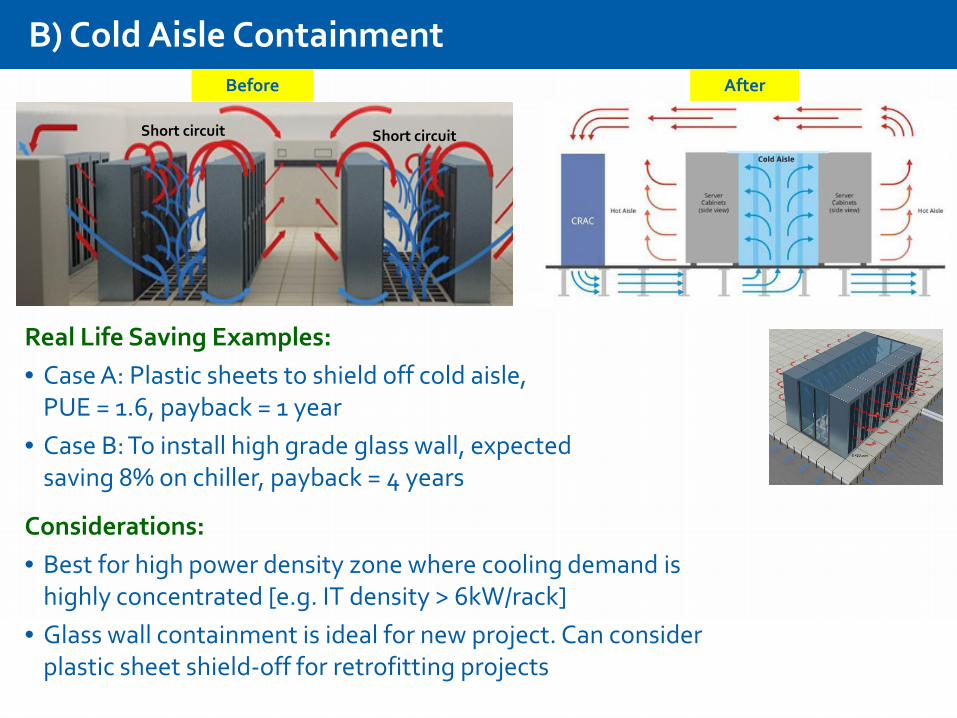
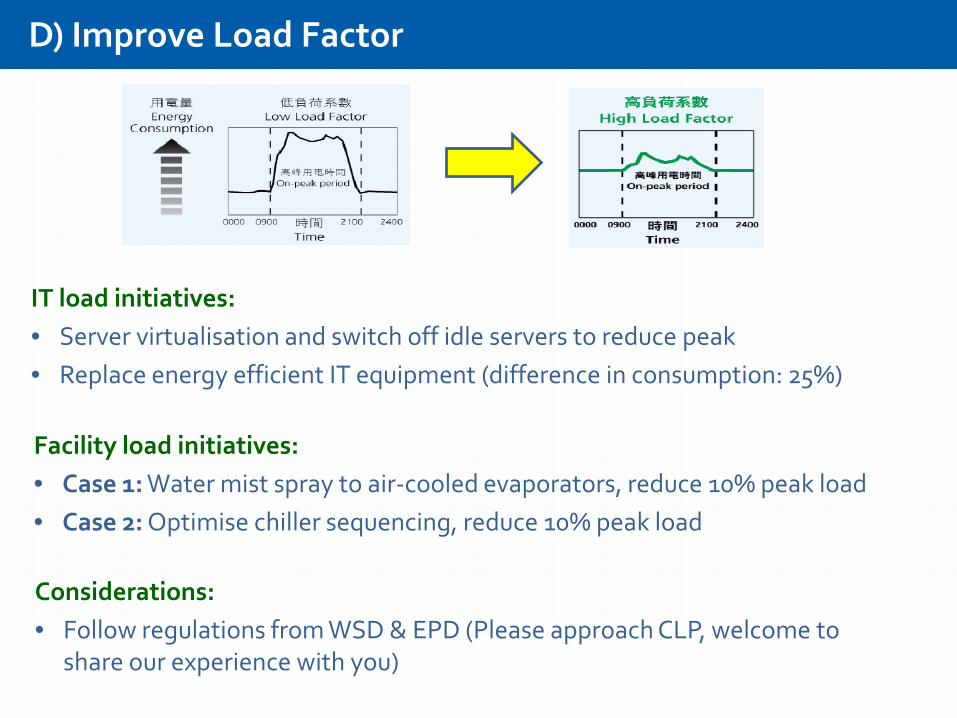
Related Documents

![Luminaria Urbana Decorativa LED - Pequeá [ESP].pdf · 2018-10-25 · 3 Diseños técnicos Curvas Fotométricas CLP-LC30 CLP-LC60 CLP-LC40 CLP-LC90 CLP-LC120 CLP-LC150 CLP-LC180](https://static.cupdf.com/doc/110x72/5f7f0d06d654ea598d3eac7f/luminaria-urbana-decorativa-pequea-esppdf-2018-10-25-3-diseos-tcnicos.jpg)