This article appeared in a journal published by Elsevier. The attached copy is furnished to the author for internal non-commercial research and education use, including for instruction at the authors institution and sharing with colleagues. Other uses, including reproduction and distribution, or selling or licensing copies, or posting to personal, institutional or third party websites are prohibited. In most cases authors are permitted to post their version of the article (e.g. in Word or Tex form) to their personal website or institutional repository. Authors requiring further information regarding Elsevier’s archiving and manuscript policies are encouraged to visit: http://www.elsevier.com/authorsrights

Welcome message from author
This document is posted to help you gain knowledge. Please leave a comment to let me know what you think about it! Share it to your friends and learn new things together.
Transcript

This article appeared in a journal published by Elsevier. The attachedcopy is furnished to the author for internal non-commercial researchand education use, including for instruction at the authors institution
and sharing with colleagues.
Other uses, including reproduction and distribution, or selling orlicensing copies, or posting to personal, institutional or third party
websites are prohibited.
In most cases authors are permitted to post their version of thearticle (e.g. in Word or Tex form) to their personal website orinstitutional repository. Authors requiring further information
regarding Elsevier’s archiving and manuscript policies areencouraged to visit:
http://www.elsevier.com/authorsrights
Author's personal copy
Energy and Buildings 75 (2014) 51–59
Contents lists available at ScienceDirect
Energy and Buildings
j ourna l ho me page: www.elsev ier .com/ locate /enbui ld
Energy and investment intensity of integrated renovation and 2030cost optimal savings
Jarek Kurnitskia,∗, Kalle Kuuska, Teet Tarka, Aivar Uutarb, Targo Kalameesa, Ergo Pikasa
a Tallinn University of Technology, Faculty of Civil Engineering, Estoniab AU Energy Service Ltd, Estonia
a r t i c l e i n f o
Article history:Received 12 January 2014Accepted 25 January 2014
Keywords:Cost optimalEnergy savingsIntegrated renovationDeep renovationRenovation costFinal energyPrimary energy
a b s t r a c t
Energy and investment intensity of integrated renovation variants were studied to determine cost optimalenergy savings by 2030 as a part of new Estonian energy roadmap preparation. For major residentialand non-residential building types, 3–4 renovation variants with different ambition were defined, allincluding the installation of adequate ventilation system in order not to compromise indoor climate.Cost optimal energy performance level of renovation corresponded in most cases to minimum energyperformance requirements of new buildings. In most of building types cost optimal renovation cost wasslightly below or higher of 200 D /m2 which could be seen as major barrier in residential buildings needingsupport schemes in order to realize the potential. Cost optimal energy savings were remarkable in heatingenergy, which was reduced by factor of 3 to 4, but electricity use tended to increase in most of buildingtypes while retail and industrial buildings showed strong electricity reduction potential. The reductionin electricity use by 2030 was without and with new construction 7 and −8%, respectively. By 2030 costoptimal renovation saved 16% of final energy, but with the inclusion of new construction the reductionsin final energy and non-renewable primary energy were 8% and 0% respectively.
© 2014 Elsevier B.V. All rights reserved.
1. Introduction
National energy roadmaps and action plans need solid evi-dence based technical input about energy savings, indoor climateimprovements and cost effectiveness of energy performanceimprovement measures. Such technical and economic data canthen be used in scenarios with different ambition to predict energyuse development trends in the building stock, required invest-ments, direct and indirect economic effects in order to find mostsuitable measures for the implementation. This study contributesto the preparation of new Estonian energy roadmap ENMAK2030+[1], which uses the reference level of 2010 and constructsthree building stock improvement scenarios by 2030.
ENAMK 2030+ is an actual example of a national roadmap; it ispartly implementing EU 2020 targets and goes up to 2030, which isthe time frame for next detailed EU targets currently under discus-sion as described in Green Paper [2]. Green Paper reflects a need ona new 2030 framework for climate and energy policies and refers toroadmaps for 2050. Energy Roadmap 2050 [3] states that the primefocus should remain on energy efficiency, where buildings play amajor role. It is stated that an analysis of more ambitious energy
∗ Corresponding author at: Ehitajate tee 5, 19086 Tallinn, Estonia,Tel.: +372 5866 4370; fax: +372 620 2405.
E-mail address: [email protected] (J. Kurnitski).
efficiency measures and cost-optimal policy is required which isone core activity in ENMAK 2030+. The roadmap concludes thatelectricity will have to play a much greater role than now (almostdoubling its share in final energy demand to 36–39% in 2050), thatshows an importance of electricity use also in buildings. Therefore,energy saving potential assessment in buildings cannot be limitedon heating energy, as often done [4], but electricity use shouldbe a consistent part of analyses as affecting both energy use andcost effectiveness. Roadmap 2050 [5] sets out a cost-efficient path-way to reach the target of reducing domestic emissions by 80% by2050. To get there, Europe’s emissions should be 40% below 1990levels by 2030, and the sector specific target for residential andservice sectors CO2 reduction is 37 to 53%, which include efficiencyimprovements together with increase of the share of low carbontechnologies in electricity mix up to 75–80% in 2030 [5].
In energy efficiency targets, the building stock and its energyperformance improvements play a major role, because energy usein buildings has steadily increased and has exceeded the othermajor sectors: industrial and transportation [6] while the replace-ment rate of the existing stock is only 1–2% per year. Compared to1994, energy use in buildings increased in 2004 by factor of 1.17,but stayed in about of 37% of total EU final energy consumptionduring this period [6]. In the last years, energy use in buildings hasshown some decrease, but grew again substantially reaching thehighest level of the last 20 years with the share of 39.9% in 2010[7].
0378-7788/$ – see front matter © 2014 Elsevier B.V. All rights reserved.http://dx.doi.org/10.1016/j.enbuild.2014.01.044
Author's personal copy
52 J. Kurnitski et al. / Energy and Buildings 75 (2014) 51–59
Nomenclature
Final energy is the energy finally consumed in the trans-port, industrial, commercial, agricultural, public andhousehold sectors. It excludes deliveries to theenergy transformation sector and to the energyindustries themselves.
Primary energy is the extraction of energy from a naturalsource.
Renewable energy includes hydroelectricity, biomass, wind,solar, tidal and geothermal energies.
AcronymsNPV Net present valueEP Energy performance valueEPC Energy performance certificatenZEB Nearly zero energy buildingHRV Heat recovery ventilationAHU Air handling unit
Symbolsftot Total primary energy factorfnren Non-renewable primary energy factor
Energy use in buildings varies in members states while Euro-pean average annual heating energy use has been estimated173 kWh/m2 in apartment buildings [8] and in residential buildingsbetween 150 and 230 kWh/m2 [9]. Estonian data is in the range andis discussed in the results. Cost effective energy saving potential in10 countries was calculated in [4] concluding that cost-effectivesaving of 10% of heating energy can be achieved by 2020 and 20%by 2030. Reported minimum and maximum costs of renovationsshow remarkable variation between countries, min values rangingfrom 3 to 70 D /m2 and max values from 5 to 200 D /m2 allowingto conclude that cost optimal renovation variants depend much onlocal conditions.
Regarding cost effective renovation measures, Nemry et al. [10]modeled building stock for the EU-25 and reported that additionalroof and fac ade insulation as well as sealing of leakages were costeffective in houses while sealing of leakages appeared to be the onlycost effective measure in multi-family and high-rise buildings. Ver-beeck and Hens [11] reported economically feasible hierarchy ofenergy-saving measures, based on five reference building describ-ing Belgian residential buildings, as follows: insulation of the roof;insulation of the floor, if easily accessible; new windows; moreenergy efficient heating system and renewable energy systems.These measures are generally in line with ones used in this studywith the exception of heat recovery ventilation that is indispens-able in a colder climate.
EPBD directive, launched 2007 and 2010 [12] has generated inEstonia a deep renovation of 520 apartment buildings with KredExsupport scheme [13], which experience and technical solutions areutilized in this study. This study focuses on energy performancemeasures intended for integrated (deep) renovation of residentialand non-residential buildings. By integrated renovation it is meantthat both adequate indoor climate (especially improved ventila-tion) and improved energy performance are to be achieved.
The aim of this study was to develop a useful minimum num-ber of alternative integrated renovation variants for minimumnumber of reference buildings representing building types inorder to be able to predict energy use in Estonian building stockas well as required investment needs for integrated renovation.Energy use and renovation of Estonian apartment buildings hasbeen previously comprehensively studied in [14] allowing to use
representative reference buildings and renovation package variantsfrom these studies. For other building types, reference buildingsand alternative integrated renovation variants were defined in thisstudy. For each renovation variant studied, investment cost and netpresent value of 20 years with corresponding energy and cost datawas calculated. As an application of defined renovation variantsand reference buildings, technical and cost optimal energy savingpotentials of Estonian building stock were determined. Achiev-able energy savings by 2030 were calculated in final and primaryenergy with assumptions of three scenarios which included incen-tives and cost optimal renovation variants. The study was limited toenergy and investment intensity analyses of building type specificintegrated renovation variants and building stock energy analyses.These results will be used as input to national economy analy-ses which will be conducted in ENAMK 2030+for buildings andother sectors to show direct and indirect effects, benefits and pub-lic finance effects allowing one to identify most suitable measuresfor the implementation.
2. Methods
The methodology used in this study was oriented on detaileddescription of renovation alternatives which will most proba-bly used in majority of renovated buildings in future. This wassomehow different approach compared to building stock energymodeling, where enough detailed distributions of age and build-ing types play an important role and for example 300 categorieshave been used in the modeling of Swedish building stock [15].In this study, the accuracy of the energy modeling in the buildingstock was intentionally compromised, so that very limited numberof reference buildings was used, to be able to cover about 80% ofthe building stock, which was considered enough for the estima-tion of the technical energy saving potential. Major effort was put todetailed energy and cost simulations of such integrated renovationvariants which would be directly applicable in practice. For everyreference building, 3–4 renovation variants with different ambitionwere studied so that even the variant with the lowest cost includedthe installation of adequate ventilation system, in order to strictlyavoid energy savings at the cost of indoor climate that was a spe-cific target of ENMAK 2030+and is also stated in EPBD recast [12].The renovation variants with higher ambition were intended to beused together with relevant incentives.
The building types used, to describe the building stock withgiven limitations, were selected according to floor area distribu-tion of the building stock as shown in Table 1. Major categories ofresidential and non-residential buildings were described with ref-erence buildings for which detailed energy and cost simulationswere conducted. For industrial buildings (without process) andretail an available sample of buildings with implemented energyperformance improvement measures was used.
Table 1The size of Estonian conditioned (heated and ventilated) building stock and thenumber of reference building used in the study.
Building type Floor area (m2) Floor area (%) No of ref.buildings
Multifamily 34,281,629 31 4Single family 26,447,774 24 2Other residential 5,962,745 5 -Industrial (w/o process) 16,658,128 15 1Office buildings 8,269,072 8 2Retail 6,487,440 6 1Educational 4,133,084 4 2Hotels 1,741,856 2 –Hospitals, clinics 1,840,182 2 –Other 4,419,816 4 –Total 110,241,726 100
Author's personal copy
J. Kurnitski et al. / Energy and Buildings 75 (2014) 51–59 53
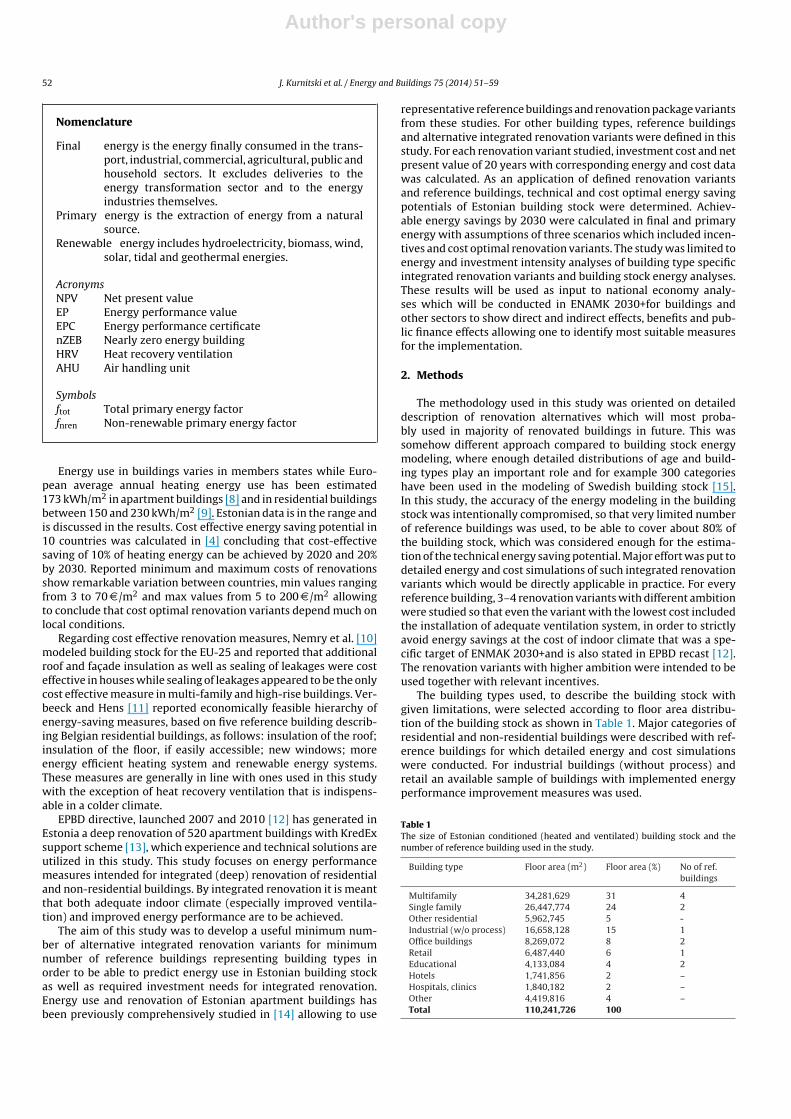
Table 2Residential reference buildings used in the study. The compactness is defined as the ratio of building envelope surface area to volume. Old houses have a mix of stove, woodand electric heating, new houses gas or electric heating and majority of apartment buildings district heating.
DH-New DH-Old AP2 AP4 AP5 AP10
No of stories, – 2 1.5 2 4 5 10Net floor area, m2 218 165 508 1383 3147 11,374Heated floor area, m2 182 165 388 1154 2623 10,781No of apartments, – 1 1 8 32 40 162Wall U-value, W/(m2 K) 0.25 0.54 1.1 1.0 0.8 0.8Roof U, W/(m2 K) 0.16 0.48 1.1 1.1 0.9 0.7Window U, W/(m2 K) 1.8 2.8 2.8 2.8 2.8 2.8Leakage q50, m3/(h m2) 6 15 4 4 4 4Compactness A/V, m−1 0.98 0.8 0.60 0.44 0.47 0.32
Table 3Description of renovation variants, classified according to Estonian energy performance certificate scale [18] which primary energy limit values in kWh/m2 (detachedhouses/apartment buildings) are shown in parentheses. Thermal bridges are accounted and maximum leakage rate reduction is 50% applying for wall and roof insulationtogether with windows replacement.
EP-class DH-New DH-Old Apartment buildings
E (260/280) HRV 80% HRV 80%, pellet boiler, roof insulation 250mm
Wall insulation 200 mm, windows U = 1.1, mechanicalexhaust ventilation
D (210/180) E + pellet boiler E + wall insulation 200 mm, windows U = 0.7 E + roof insulation 300 mm, basement ceiling 150 mm,two pipe heating system, exhaust air heat pump
C (160/150) E + GSHP, roof insulation 250 mm,windows U = 0.7
HRV 80%, GSHP, roof insulation 250 mm, wall300 mm, windows U = 0.7
D + HRV 60% (apartment AHU or central AHU)
B (120/120) C + solar collectors, wall insulation250 mm, floor insulation 300 mm
C + solar collectors, floor insulation 300 mm(B class not achieved EP = 136)
C + windows U = 0.6, solar collectors, HRV 80%(apartment AHU)
In the selection of reference buildings, previous studies were uti-lized. Kalamees et al. [14] has analyzed the distribution and energyuse of Estonian multifamily building stock, which was describedwith four representative reference buildings and most cost effectiveintegrated renovation variants with different ambition accordingto this study. The data of Hani [16] was utilized to select refer-ence buildings and renovation variants of office buildings. For singlefamily buildings, the only available data was published in [17] fromwhich one reference building representing relatively new detachedhouses (DH-New) and another representing an old houses (DH-Old)with major renovation needs were used. For school buildings, twotypical school buildings representing larger schools were modeledin this study. Main parameters of the residential reference buildingsused are shown in Table 2 and description of renovation variantsin Table 3.
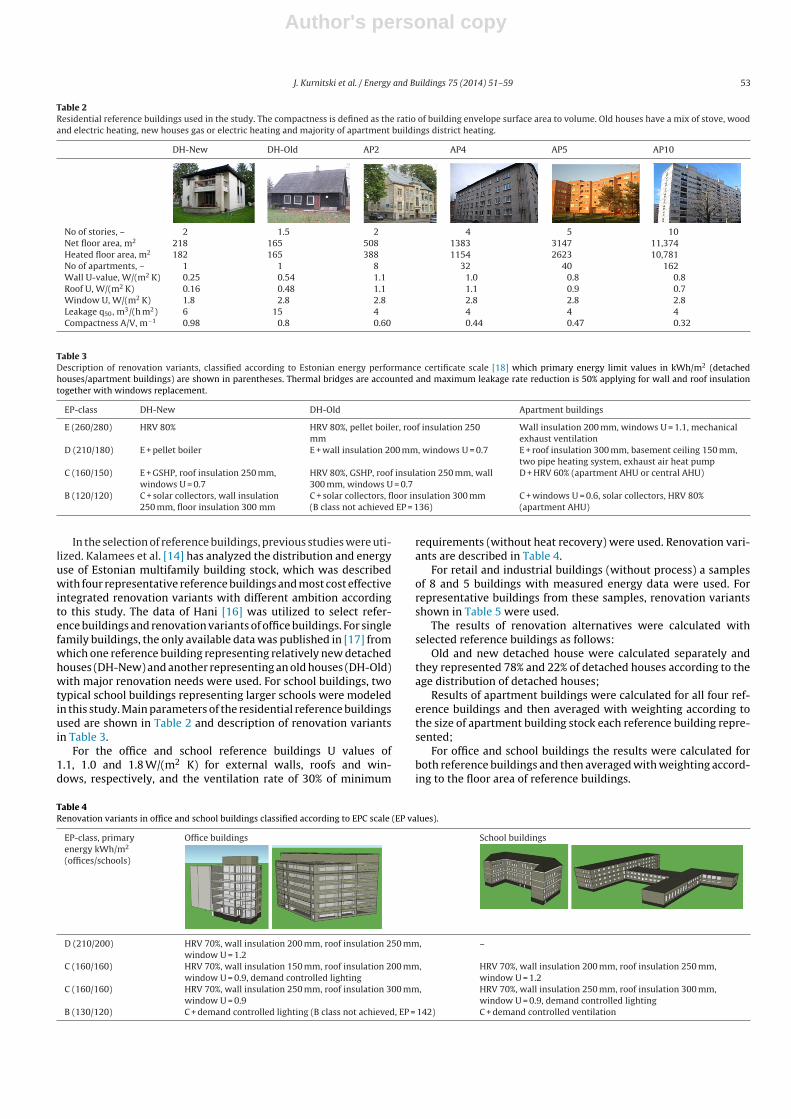
For the office and school reference buildings U values of1.1, 1.0 and 1.8 W/(m2 K) for external walls, roofs and win-dows, respectively, and the ventilation rate of 30% of minimum
requirements (without heat recovery) were used. Renovation vari-ants are described in Table 4.
For retail and industrial buildings (without process) a samplesof 8 and 5 buildings with measured energy data were used. Forrepresentative buildings from these samples, renovation variantsshown in Table 5 were used.
The results of renovation alternatives were calculated withselected reference buildings as follows:
Old and new detached house were calculated separately andthey represented 78% and 22% of detached houses according to theage distribution of detached houses;
Results of apartment buildings were calculated for all four ref-erence buildings and then averaged with weighting according tothe size of apartment building stock each reference building repre-sented;
For office and school buildings the results were calculated forboth reference buildings and then averaged with weighting accord-ing to the floor area of reference buildings.
Table 4Renovation variants in office and school buildings classified according to EPC scale (EP values).
EP-class, primaryenergy kWh/m2
(offices/schools)
Office buildings School buildings
D (210/200) HRV 70%, wall insulation 200 mm, roof insulation 250 mm,window U = 1.2
–
C (160/160) HRV 70%, wall insulation 150 mm, roof insulation 200 mm,window U = 0.9, demand controlled lighting
HRV 70%, wall insulation 200 mm, roof insulation 250 mm,window U = 1.2
C (160/160) HRV 70%, wall insulation 250 mm, roof insulation 300 mm,window U = 0.9
HRV 70%, wall insulation 250 mm, roof insulation 300 mm,window U = 0.9, demand controlled lighting
B (130/120) C + demand controlled lighting (B class not achieved, EP = 142) C + demand controlled ventilation
Author's personal copy
54 J. Kurnitski et al. / Energy and Buildings 75 (2014) 51–59
Table 5Renovation variants in retail and industrial buildings classified according to EPC scale (EP values).
EP-class, primary energy Retail Industrial buildings without process
E (330/−) Renovation of lighting system Renovation of lighting systemD (280/−) E + renovation of heating and ventilation system, BMS E + renovation of heating and ventilation system,C (230/−) D + new display cabinets D + insulation of walls and roofB (160/−) C + insulation of walls and roof
Cost effectiveness of renovation variants was assessed withfinancial calculation of net present value according to principlesset in the Commission’s cost optimality methodology [19] devel-oped for the assessment of cost optimal energy performance levels.The net present value was calculated as global cost consisting ofconstruction cost and discounted energy costs according to [20]:
Cg = CI + Ca · fpv (n)Afloor
(1)
where:Cg global cost, NPV, D /m2
CI construction cost of the renovation variant, DCa annual energy cost during starting year, Dfpv(n) present value factor for the calculation period of n years,
-Afloor heated net floor area, m2
Construction cost of renovation variants was calculated as fullcost (i.e. not only energy performance related) where all costs ofconstruction works and installations were taken into account. Forexample, in the case of roof insulation, all construction works of roofrepair were included. Renovation variants did not include interiorremodeling, but internal finishing was taken into account in thecase of window replacement and heating and ventilation installa-tions. To calculate the present value factor fpv(n), real interest rateRR depending on the market interest rate R and on the inflation rateRi (all in per cents) was calculated [20]:
RR = R − Ri
1 + Ri/100(2)
The present value factor fpv(n) for the calculation period of nyears was calculated [20]:
fpv (n) =1 −
(1 + (RR − e) /100
)−n
(RR − e) /100(3)
where:RR the real interest rate, %e escalation of the energy prices, % (inflation reduced from actual
price increase)n the number of years considered, i.e. the length of the calcula-
tion period, -
3. Results
3.1. Final and primary energy use
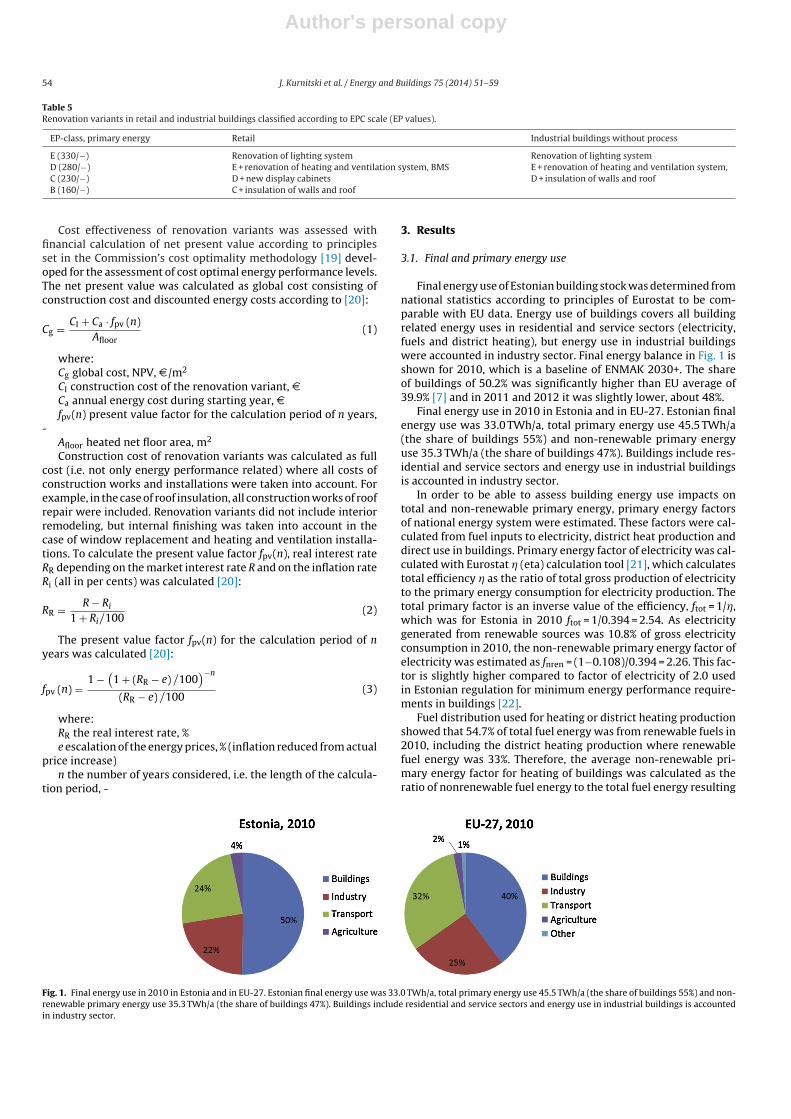
Final energy use of Estonian building stock was determined fromnational statistics according to principles of Eurostat to be com-parable with EU data. Energy use of buildings covers all buildingrelated energy uses in residential and service sectors (electricity,fuels and district heating), but energy use in industrial buildingswere accounted in industry sector. Final energy balance in Fig. 1 isshown for 2010, which is a baseline of ENMAK 2030+. The shareof buildings of 50.2% was significantly higher than EU average of39.9% [7] and in 2011 and 2012 it was slightly lower, about 48%.
Final energy use in 2010 in Estonia and in EU-27. Estonian finalenergy use was 33.0 TWh/a, total primary energy use 45.5 TWh/a(the share of buildings 55%) and non-renewable primary energyuse 35.3 TWh/a (the share of buildings 47%). Buildings include res-idential and service sectors and energy use in industrial buildingsis accounted in industry sector.
In order to be able to assess building energy use impacts ontotal and non-renewable primary energy, primary energy factorsof national energy system were estimated. These factors were cal-culated from fuel inputs to electricity, district heat production anddirect use in buildings. Primary energy factor of electricity was cal-culated with Eurostat � (eta) calculation tool [21], which calculatestotal efficiency � as the ratio of total gross production of electricityto the primary energy consumption for electricity production. Thetotal primary factor is an inverse value of the efficiency, ftot = 1/�,which was for Estonia in 2010 ftot = 1/0.394 = 2.54. As electricitygenerated from renewable sources was 10.8% of gross electricityconsumption in 2010, the non-renewable primary energy factor ofelectricity was estimated as fnren = (1−0.108)/0.394 = 2.26. This fac-tor is slightly higher compared to factor of electricity of 2.0 usedin Estonian regulation for minimum energy performance require-ments in buildings [22].
Fuel distribution used for heating or district heating productionshowed that 54.7% of total fuel energy was from renewable fuels in2010, including the district heating production where renewablefuel energy was 33%. Therefore, the average non-renewable pri-mary energy factor for heating of buildings was calculated as theratio of nonrenewable fuel energy to the total fuel energy resulting
Fig. 1. Final energy use in 2010 in Estonia and in EU-27. Estonian final energy use was 33.0 TWh/a, total primary energy use 45.5 TWh/a (the share of buildings 55%) and non-renewable primary energy use 35.3 TWh/a (the share of buildings 47%). Buildings include residential and service sectors and energy use in industrial buildings is accountedin industry sector.
Author's personal copy
J. Kurnitski et al. / Energy and Buildings 75 (2014) 51–59 55
in fnren = 0.453. These primary energy factors are used in Section3.4 in the assessment of renovation and new construction effectson energy use.
3.2. Energy and investment intensity of integrated renovationvariants
For most of reference buildings defined in Section 2, a ventilationrate problem was faced, before it was possible to start simulationof renovation alternatives. If the energy use of existing situationwas simulated with minimum outdoor airflow rate requirementsof [22] following category II of EN 15251 [23], the simulated energyuse was much higher than statistical average in the considered seg-ment of studied building type, because of lower ventilation ratesand sometimes also lower occupancy in existing buildings. Thisapplied for all reference buildings except the retail and industrialbuilding, which had balanced ventilation with heat recovery andwhere ventilation was considered adequate. For all other referencebuildings energy use with two ventilation rates was calculated:
Ventilation rate of 20–40% of minimum requirements resultingin statistical average energy use;
Standard ventilation rate equal to minimum requirementsresulting in higher energy use.
The energy use calculated with lower ventilation rates describesthe situation in existing building stock with poor indoor climate.This value is relevant for the assessment of average energy usein the building stock, which is needed for scenario calculations,because any scenario should be compared with existing situa-tion. For the integrated renovation variants assessment the higherenergy use value with ventilation rate equal to minimum require-ments was used. The higher value corresponds to situation, whereventilation will be improved with available means (including win-dow opening) in order to fulfill the requirements and to continuethe operation of building, which could be a typical situation espe-cially in school and office buildings. In residential buildings thisoption was considered also as relevant baseline, because other-wise deteriorated indoor climate could cause major public healthexpenses, which are to be quantified as one cost component ofenergy savings.
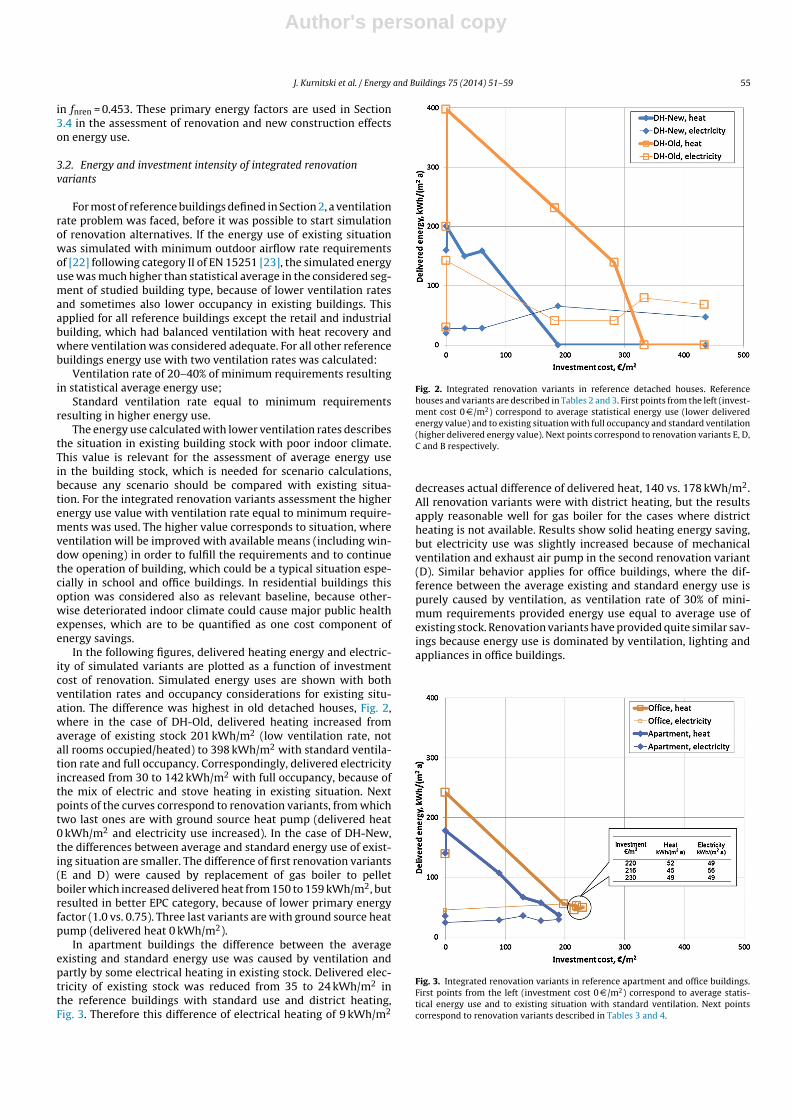
In the following figures, delivered heating energy and electric-ity of simulated variants are plotted as a function of investmentcost of renovation. Simulated energy uses are shown with bothventilation rates and occupancy considerations for existing situ-ation. The difference was highest in old detached houses, Fig. 2,where in the case of DH-Old, delivered heating increased fromaverage of existing stock 201 kWh/m2 (low ventilation rate, notall rooms occupied/heated) to 398 kWh/m2 with standard ventila-tion rate and full occupancy. Correspondingly, delivered electricityincreased from 30 to 142 kWh/m2 with full occupancy, because ofthe mix of electric and stove heating in existing situation. Nextpoints of the curves correspond to renovation variants, from whichtwo last ones are with ground source heat pump (delivered heat0 kWh/m2 and electricity use increased). In the case of DH-New,the differences between average and standard energy use of exist-ing situation are smaller. The difference of first renovation variants(E and D) were caused by replacement of gas boiler to pelletboiler which increased delivered heat from 150 to 159 kWh/m2, butresulted in better EPC category, because of lower primary energyfactor (1.0 vs. 0.75). Three last variants are with ground source heatpump (delivered heat 0 kWh/m2).
In apartment buildings the difference between the averageexisting and standard energy use was caused by ventilation andpartly by some electrical heating in existing stock. Delivered elec-tricity of existing stock was reduced from 35 to 24 kWh/m2 inthe reference buildings with standard use and district heating,Fig. 3. Therefore this difference of electrical heating of 9 kWh/m2
Fig. 2. Integrated renovation variants in reference detached houses. Referencehouses and variants are described in Tables 2 and 3. First points from the left (invest-ment cost 0 D /m2) correspond to average statistical energy use (lower deliveredenergy value) and to existing situation with full occupancy and standard ventilation(higher delivered energy value). Next points correspond to renovation variants E, D,C and B respectively.
decreases actual difference of delivered heat, 140 vs. 178 kWh/m2.All renovation variants were with district heating, but the resultsapply reasonable well for gas boiler for the cases where districtheating is not available. Results show solid heating energy saving,but electricity use was slightly increased because of mechanicalventilation and exhaust air pump in the second renovation variant(D). Similar behavior applies for office buildings, where the dif-ference between the average existing and standard energy use ispurely caused by ventilation, as ventilation rate of 30% of mini-mum requirements provided energy use equal to average use ofexisting stock. Renovation variants have provided quite similar sav-ings because energy use is dominated by ventilation, lighting andappliances in office buildings.
Fig. 3. Integrated renovation variants in reference apartment and office buildings.First points from the left (investment cost 0 D /m2) correspond to average statis-tical energy use and to existing situation with standard ventilation. Next pointscorrespond to renovation variants described in Tables 3 and 4.
Author's personal copy
56 J. Kurnitski et al. / Energy and Buildings 75 (2014) 51–59
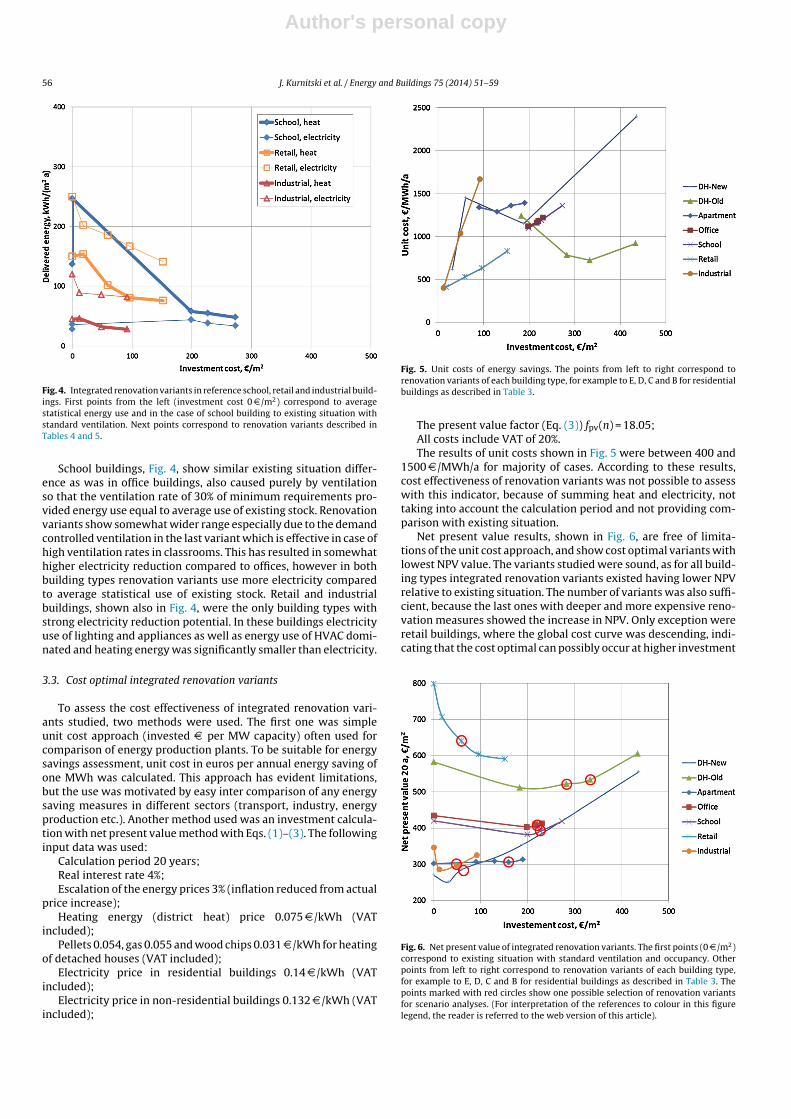
Fig. 4. Integrated renovation variants in reference school, retail and industrial build-ings. First points from the left (investment cost 0 D /m2) correspond to averagestatistical energy use and in the case of school building to existing situation withstandard ventilation. Next points correspond to renovation variants described inTables 4 and 5.
School buildings, Fig. 4, show similar existing situation differ-ence as was in office buildings, also caused purely by ventilationso that the ventilation rate of 30% of minimum requirements pro-vided energy use equal to average use of existing stock. Renovationvariants show somewhat wider range especially due to the demandcontrolled ventilation in the last variant which is effective in case ofhigh ventilation rates in classrooms. This has resulted in somewhathigher electricity reduction compared to offices, however in bothbuilding types renovation variants use more electricity comparedto average statistical use of existing stock. Retail and industrialbuildings, shown also in Fig. 4, were the only building types withstrong electricity reduction potential. In these buildings electricityuse of lighting and appliances as well as energy use of HVAC domi-nated and heating energy was significantly smaller than electricity.
3.3. Cost optimal integrated renovation variants
To assess the cost effectiveness of integrated renovation vari-ants studied, two methods were used. The first one was simpleunit cost approach (invested D per MW capacity) often used forcomparison of energy production plants. To be suitable for energysavings assessment, unit cost in euros per annual energy saving ofone MWh was calculated. This approach has evident limitations,but the use was motivated by easy inter comparison of any energysaving measures in different sectors (transport, industry, energyproduction etc.). Another method used was an investment calcula-tion with net present value method with Eqs. (1)–(3). The followinginput data was used:
Calculation period 20 years;Real interest rate 4%;Escalation of the energy prices 3% (inflation reduced from actual
price increase);Heating energy (district heat) price 0.075 D /kWh (VAT
included);Pellets 0.054, gas 0.055 and wood chips 0.031 D /kWh for heating
of detached houses (VAT included);Electricity price in residential buildings 0.14 D /kWh (VAT
included);Electricity price in non-residential buildings 0.132 D /kWh (VAT
included);
Fig. 5. Unit costs of energy savings. The points from left to right correspond torenovation variants of each building type, for example to E, D, C and B for residentialbuildings as described in Table 3.
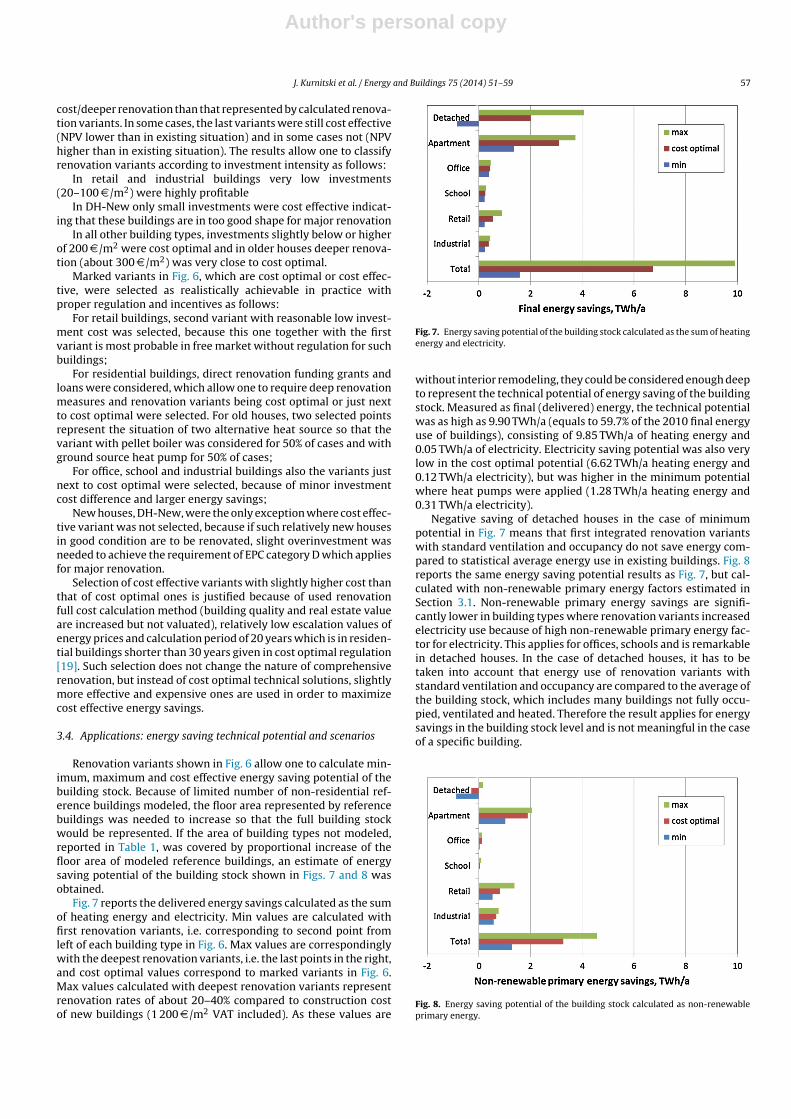
The present value factor (Eq. (3)) fpv(n) = 18.05;All costs include VAT of 20%.The results of unit costs shown in Fig. 5 were between 400 and
1500 D /MWh/a for majority of cases. According to these results,cost effectiveness of renovation variants was not possible to assesswith this indicator, because of summing heat and electricity, nottaking into account the calculation period and not providing com-parison with existing situation.
Net present value results, shown in Fig. 6, are free of limita-tions of the unit cost approach, and show cost optimal variants withlowest NPV value. The variants studied were sound, as for all build-ing types integrated renovation variants existed having lower NPVrelative to existing situation. The number of variants was also suffi-cient, because the last ones with deeper and more expensive reno-vation measures showed the increase in NPV. Only exception wereretail buildings, where the global cost curve was descending, indi-cating that the cost optimal can possibly occur at higher investment
Fig. 6. Net present value of integrated renovation variants. The first points (0 D /m2)correspond to existing situation with standard ventilation and occupancy. Otherpoints from left to right correspond to renovation variants of each building type,for example to E, D, C and B for residential buildings as described in Table 3. Thepoints marked with red circles show one possible selection of renovation variantsfor scenario analyses. (For interpretation of the references to colour in this figurelegend, the reader is referred to the web version of this article).
Author's personal copy
J. Kurnitski et al. / Energy and Buildings 75 (2014) 51–59 57
cost/deeper renovation than that represented by calculated renova-tion variants. In some cases, the last variants were still cost effective(NPV lower than in existing situation) and in some cases not (NPVhigher than in existing situation). The results allow one to classifyrenovation variants according to investment intensity as follows:
In retail and industrial buildings very low investments(20–100 D /m2) were highly profitable
In DH-New only small investments were cost effective indicat-ing that these buildings are in too good shape for major renovation
In all other building types, investments slightly below or higherof 200 D /m2 were cost optimal and in older houses deeper renova-tion (about 300 D /m2) was very close to cost optimal.
Marked variants in Fig. 6, which are cost optimal or cost effec-tive, were selected as realistically achievable in practice withproper regulation and incentives as follows:
For retail buildings, second variant with reasonable low invest-ment cost was selected, because this one together with the firstvariant is most probable in free market without regulation for suchbuildings;
For residential buildings, direct renovation funding grants andloans were considered, which allow one to require deep renovationmeasures and renovation variants being cost optimal or just nextto cost optimal were selected. For old houses, two selected pointsrepresent the situation of two alternative heat source so that thevariant with pellet boiler was considered for 50% of cases and withground source heat pump for 50% of cases;
For office, school and industrial buildings also the variants justnext to cost optimal were selected, because of minor investmentcost difference and larger energy savings;
New houses, DH-New, were the only exception where cost effec-tive variant was not selected, because if such relatively new housesin good condition are to be renovated, slight overinvestment wasneeded to achieve the requirement of EPC category D which appliesfor major renovation.
Selection of cost effective variants with slightly higher cost thanthat of cost optimal ones is justified because of used renovationfull cost calculation method (building quality and real estate valueare increased but not valuated), relatively low escalation values ofenergy prices and calculation period of 20 years which is in residen-tial buildings shorter than 30 years given in cost optimal regulation[19]. Such selection does not change the nature of comprehensiverenovation, but instead of cost optimal technical solutions, slightlymore effective and expensive ones are used in order to maximizecost effective energy savings.
3.4. Applications: energy saving technical potential and scenarios
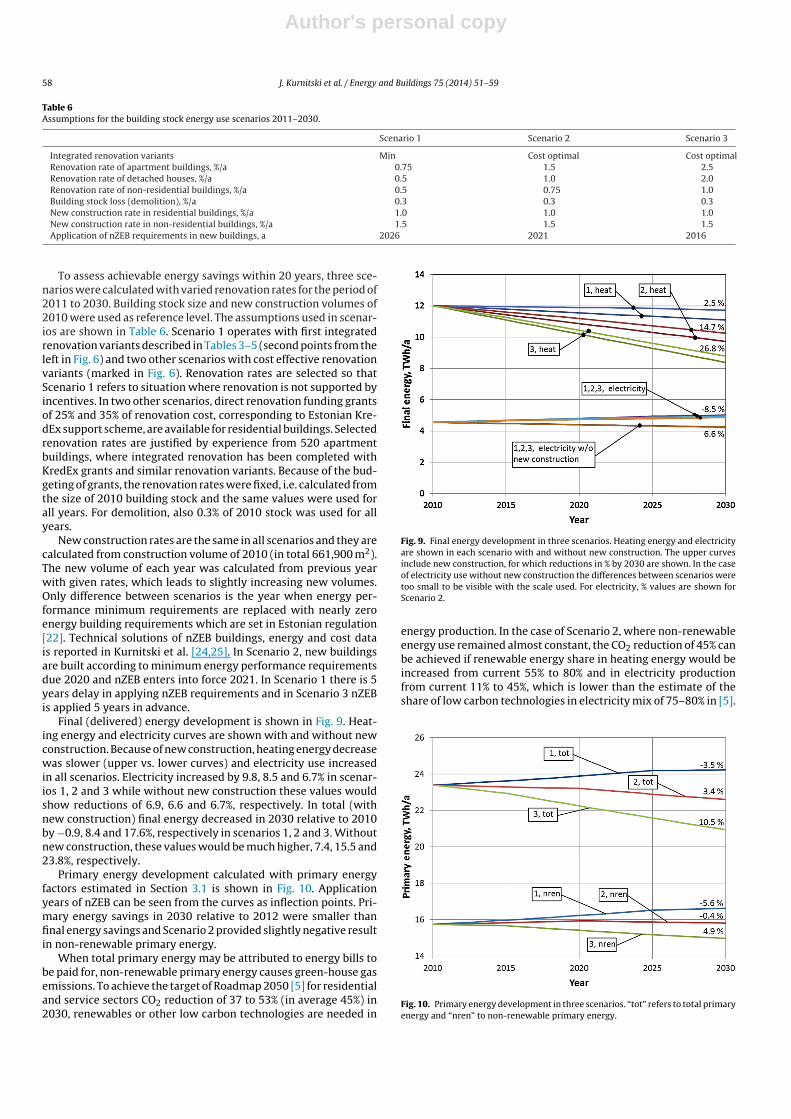
Renovation variants shown in Fig. 6 allow one to calculate min-imum, maximum and cost effective energy saving potential of thebuilding stock. Because of limited number of non-residential ref-erence buildings modeled, the floor area represented by referencebuildings was needed to increase so that the full building stockwould be represented. If the area of building types not modeled,reported in Table 1, was covered by proportional increase of thefloor area of modeled reference buildings, an estimate of energysaving potential of the building stock shown in Figs. 7 and 8 wasobtained.
Fig. 7 reports the delivered energy savings calculated as the sumof heating energy and electricity. Min values are calculated withfirst renovation variants, i.e. corresponding to second point fromleft of each building type in Fig. 6. Max values are correspondinglywith the deepest renovation variants, i.e. the last points in the right,and cost optimal values correspond to marked variants in Fig. 6.Max values calculated with deepest renovation variants representrenovation rates of about 20–40% compared to construction costof new buildings (1 200 D /m2 VAT included). As these values are
Fig. 7. Energy saving potential of the building stock calculated as the sum of heatingenergy and electricity.
without interior remodeling, they could be considered enough deepto represent the technical potential of energy saving of the buildingstock. Measured as final (delivered) energy, the technical potentialwas as high as 9.90 TWh/a (equals to 59.7% of the 2010 final energyuse of buildings), consisting of 9.85 TWh/a of heating energy and0.05 TWh/a of electricity. Electricity saving potential was also verylow in the cost optimal potential (6.62 TWh/a heating energy and0.12 TWh/a electricity), but was higher in the minimum potentialwhere heat pumps were applied (1.28 TWh/a heating energy and0.31 TWh/a electricity).
Negative saving of detached houses in the case of minimumpotential in Fig. 7 means that first integrated renovation variantswith standard ventilation and occupancy do not save energy com-pared to statistical average energy use in existing buildings. Fig. 8reports the same energy saving potential results as Fig. 7, but cal-culated with non-renewable primary energy factors estimated inSection 3.1. Non-renewable primary energy savings are signifi-cantly lower in building types where renovation variants increasedelectricity use because of high non-renewable primary energy fac-tor for electricity. This applies for offices, schools and is remarkablein detached houses. In the case of detached houses, it has to betaken into account that energy use of renovation variants withstandard ventilation and occupancy are compared to the average ofthe building stock, which includes many buildings not fully occu-pied, ventilated and heated. Therefore the result applies for energysavings in the building stock level and is not meaningful in the caseof a specific building.
Fig. 8. Energy saving potential of the building stock calculated as non-renewableprimary energy.
Author's personal copy
58 J. Kurnitski et al. / Energy and Buildings 75 (2014) 51–59
Table 6Assumptions for the building stock energy use scenarios 2011–2030.
Scenario 1 Scenario 2 Scenario 3
Integrated renovation variants Min Cost optimal Cost optimalRenovation rate of apartment buildings, %/a 0.75 1.5 2.5Renovation rate of detached houses, %/a 0.5 1.0 2.0Renovation rate of non-residential buildings, %/a 0.5 0.75 1.0Building stock loss (demolition), %/a 0.3 0.3 0.3New construction rate in residential buildings, %/a 1.0 1.0 1.0New construction rate in non-residential buildings, %/a 1.5 1.5 1.5Application of nZEB requirements in new buildings, a 2026 2021 2016
To assess achievable energy savings within 20 years, three sce-narios were calculated with varied renovation rates for the period of2011 to 2030. Building stock size and new construction volumes of2010 were used as reference level. The assumptions used in scenar-ios are shown in Table 6. Scenario 1 operates with first integratedrenovation variants described in Tables 3–5 (second points from theleft in Fig. 6) and two other scenarios with cost effective renovationvariants (marked in Fig. 6). Renovation rates are selected so thatScenario 1 refers to situation where renovation is not supported byincentives. In two other scenarios, direct renovation funding grantsof 25% and 35% of renovation cost, corresponding to Estonian Kre-dEx support scheme, are available for residential buildings. Selectedrenovation rates are justified by experience from 520 apartmentbuildings, where integrated renovation has been completed withKredEx grants and similar renovation variants. Because of the bud-geting of grants, the renovation rates were fixed, i.e. calculated fromthe size of 2010 building stock and the same values were used forall years. For demolition, also 0.3% of 2010 stock was used for allyears.
New construction rates are the same in all scenarios and they arecalculated from construction volume of 2010 (in total 661,900 m2).The new volume of each year was calculated from previous yearwith given rates, which leads to slightly increasing new volumes.Only difference between scenarios is the year when energy per-formance minimum requirements are replaced with nearly zeroenergy building requirements which are set in Estonian regulation[22]. Technical solutions of nZEB buildings, energy and cost datais reported in Kurnitski et al. [24,25]. In Scenario 2, new buildingsare built according to minimum energy performance requirementsdue 2020 and nZEB enters into force 2021. In Scenario 1 there is 5years delay in applying nZEB requirements and in Scenario 3 nZEBis applied 5 years in advance.
Final (delivered) energy development is shown in Fig. 9. Heat-ing energy and electricity curves are shown with and without newconstruction. Because of new construction, heating energy decreasewas slower (upper vs. lower curves) and electricity use increasedin all scenarios. Electricity increased by 9.8, 8.5 and 6.7% in scenar-ios 1, 2 and 3 while without new construction these values wouldshow reductions of 6.9, 6.6 and 6.7%, respectively. In total (withnew construction) final energy decreased in 2030 relative to 2010by −0.9, 8.4 and 17.6%, respectively in scenarios 1, 2 and 3. Withoutnew construction, these values would be much higher, 7.4, 15.5 and23.8%, respectively.
Primary energy development calculated with primary energyfactors estimated in Section 3.1 is shown in Fig. 10. Applicationyears of nZEB can be seen from the curves as inflection points. Pri-mary energy savings in 2030 relative to 2012 were smaller thanfinal energy savings and Scenario 2 provided slightly negative resultin non-renewable primary energy.
When total primary energy may be attributed to energy bills tobe paid for, non-renewable primary energy causes green-house gasemissions. To achieve the target of Roadmap 2050 [5] for residentialand service sectors CO2 reduction of 37 to 53% (in average 45%) in2030, renewables or other low carbon technologies are needed in
Fig. 9. Final energy development in three scenarios. Heating energy and electricityare shown in each scenario with and without new construction. The upper curvesinclude new construction, for which reductions in % by 2030 are shown. In the caseof electricity use without new construction the differences between scenarios weretoo small to be visible with the scale used. For electricity, % values are shown forScenario 2.
energy production. In the case of Scenario 2, where non-renewableenergy use remained almost constant, the CO2 reduction of 45% canbe achieved if renewable energy share in heating energy would beincreased from current 55% to 80% and in electricity productionfrom current 11% to 45%, which is lower than the estimate of theshare of low carbon technologies in electricity mix of 75–80% in [5].
Fig. 10. Primary energy development in three scenarios. “tot” refers to total primaryenergy and “nren” to non-renewable primary energy.
Author's personal copy
J. Kurnitski et al. / Energy and Buildings 75 (2014) 51–59 59
4. Conclusions
Energy and investment intensity of integrated building typespecific renovation variants were studied to determine cost opti-mal energy savings by 2030 as a part of new Estonian energyroadmap ENMAK 2030+preparation. For major residential and non-residential building types 3–4 renovation variants with differentambition were defined so that even the variant with the lowest costincluded the installation of adequate ventilation system, in orderto strictly avoid energy savings at the cost of indoor climate.
Cost optimal energy performance level of deep integratedrenovation corresponded in most cases to minimum energy per-formance requirements of new buildings (EPC category C) both inresidential and non-residential buildings. Depending on the build-ing type, the renovation variants were possible to classify accordingto investment intensity as follows:
In retail and industrial buildings very low investments(20–100 D /m2) were highly profitable;
In relatively new detached houses only small investments werecost effective indicating that these buildings are in too good shapefor major renovation;
In all other residential and non-residential building types,investments slightly below or higher of 200 D /m2 were cost opti-mal and in older houses even deeper renovation (about 300 D /m2)was very close to cost optimal.
Typical cost optimal renovation cost of about 200 D /m2 was atleast by factor 2 higher than that reported in [4], indicating thathigh investment cost is one major barriers for deep renovation.Therefore, in order to realize cost optimal energy saving potential,support schemes are needed especially in residential buildings, inorder to provide financial support which allows also to require theuse of deep integrated renovation measures. This is supported byprevious experience from Estonian KredEx support scheme oper-ating with grants of 25 and 35% of renovation cost.
Cost optimal energy savings were remarkable in heating energy,which was reduced by factor 3 in residential buildings and evenby factor 4 in office and school buildings. In contrary, electric-ity use tended to increase in all of these building types becauseof increased ventilation and heat pumps in residential buildings.Retail and industrial buildings were the only building types withstrong electricity reduction potential. This resulted in negligibletechnical and cost optimal electricity saving potential in the build-ing stock (0.3 and 0.7% respectively) while heating energy savingpotentials were 60 and 40% of the energy use in 2010, respectively.
Calculated scenarios showed the significant effect of new con-struction which made heating energy decrease slower and led toincreased electricity use in all scenarios. Without new construc-tion the reduction in electricity use by 2030 relative to 2010 was inthe middle cost optimal scenario 6.6% but with new construction itincreased by 8.5%. In the middle cost optimal scenario, final energyreduction by 2030 was 8.4%. This is less than previously estimated20% [4], however the difference would be smaller if new construc-tion is not taken into account, in such a case the reduction was16%.
Middle cost optimal scenario led to total primary energy reduc-tion of 3.4% and non-renewable primary energy reduction of about0% by 2030 which are significantly less than reductions in finalenergy because energy savings were mostly attributed to heatingenergy including a large portion of renewable biomass. While totalprimary energy may be attributed to energy bills to be paid for, non-renewable primary energy causes emissions. To achieve the targetof Roadmap 2050 for residential and service sectors CO2 reduc-tion in average of 45% by 2030, in the case of middle cost optimalscenario, renewable energy share in heating energy needs to beincreased from current 55% to 80% and in electricity productionfrom current 11% to 45%.
Acknowledgment
The research was supported by the Estonian Research Council,with Institutional research funding grant IUT1-15, and with a grantof the European Union, the European Social Fund, Mobilitas grantNo MTT74.
References
[1] ENMAK 2030+Estonian Energy Roadmap 2030+ (in Estonian).http://www.energiatalgud.ee/index.php?title = ENMAK:Eesti pikaajalineenergiamajanduse arengukava 2030%2B
[2] Green Paper, A 2030 framework for climate and energy policies, COM (2013)169. http://ec.europa.eu/energy/consultations/20130702 green paper 2030en.htm
[3] Energy Roadmap 2050, Brussels, 15.12.2011 COM(2011) 885 final.http://ec.europa.eu/energy/energy2020/roadmap/index en.htm
[4] P. Tuominen, K. Klobut, A. Tolman, A. Adjeib, M. de Best-Waldhoberc, Energysavings potential in buildings and overcoming market barriers in memberstates of the European Union, Energy and Buildings 51 (2012) 48–55.
[5] Roadmap for moving to a competitive low-carbon economy in 2050. Brussels,8.3.2011 COM(2011) 112 final. http://ec.europa.eu/clima/policies/roadmap/index en.htm
[6] Perez-Lombard Luis, Ortiz Jose, Pout. Christine, A review on buildings energyconsumption information, Energy and Buildings 40 (2008) 394–398.
[7] P. Bertoldi, B. Hirl, N. Labanca, Energy Efficiency Status Report 2012, Electric-ity Consumption and Efficiency Trends in the EU-27. JRC Scientific and PolicyReports, European Union, 2012, 10.2788/37564.
[8] C.A. Balaras, K. Droutsa, E. Dascalaki, S. Kontoyiannidis, Heating energyconsumption and resulting environmental impact of European apartmentbuildings, Energy and Buildings 37 (2005) 429–442.
[9] C.A. Balaras, K. Droutsa, A.A. Argiriou, D.N. Asimakopoulos, Potential for energyconservation in apartment buildings, Energy and Buildings 31 (2) (2000)143–154.
[10] F. Nemry, et al., Options to reduce the environmental impacts of residentialbuildings in the European Union—Potential and costs, Energy and Buildings 42(2010) 976–984.
[11] G. Verbeeck, H. Hens, Energy savings in retrofitted dwellings: economicallyviable? Energy and Buildings 37 (2005) 747–754.
[12] Directive 2010/31/EU of the European Parliament and of the Council of 19May 2010 on the energy performance of buildings (recast) http://ec.europa.eu/energy/efficiency/buildings/buildings en.htm
[13] Fund KredEx, Reconstruction grant. http://www.kredex.ee/[14] T. Kalamees, K. Kuusk, E. Arumägi, S. Ilomets, M. Maivel, The analysis of
measured energy consumption in apartment buildings in Estonia, Annex 55RAP-RETRO Working Meeting, Vienna, Austria 23–25 April (2012).
[15] E. Mata, A.S. Kalagasidis, F. Johnsson, Energy usage and technical potential forenergy saving measures in the Swedish residential building stock, Energy Policy55 (2013) 404–414.
[16] A. Hani, Investigation of Energy Efficiency in Buildings and HVAC Systems,Doctoral Theses on Civil Engineering F36, Tallinn University of Technology,2012.
[17] A. Allikmaa, Typology and improvement of energy performance of Estoniandetached houses (in Estonian), Master Theses, Tallinn University of Technology,2013.
[18] Majandus- ja kommunikatsiooniministeriumi määrus nr. 30. Energiamär-gise vorm ja väljaandmise kord. Riigi Teataja, I, 30.04.2013, 2. https://www.riigiteataja.ee/akt/130042013002.
[19] COMMISSION DELEGATED REGULATION (EU) No 244/2012 of 16 January2012 supplementing Directive 2010/31/EU of the European Parliament andof the Council on the energy performance of buildings by establishing acomparative methodology framework for calculating cost-optimal levels ofminimum energy performance requirements for buildings and building ele-ments. http://ec.europa.eu/energy/efficiency/buildings/buildings en.htm
[20] EN 15459: 2007, Energy performance of buildings—Economic evaluation pro-cedure for energy systems in buildings, European Standard, CEN 2007.
[21] Eurostat, Energy Statistics, ((eta) time series (1990-2011), ETA time series.xlsx,http://epp.eurostat.ec.europa.eu/portal/page/portal/energy/other documents
[22] Vabariigi Valitsuse määrus nr. 68 (30.08.2012). Energiatõhususe miini-mumnõuded. Riigi Teataja, I, 05.09.2012, 4. https://www.riigiteataja.ee/akt/105092012004.
[23] EN 15251:2007 Indoor environmental parameters for design and assessmentof energy performance of buildings addressing indoor air quality, thermal envi-ronment, lightning and acoustics. European Standard, CEN 2007.
[24] J. Kurnitski, A. Saari, T. Kalamees, M. Vuolle, J. Niemelä, T. Tark, Cost optimal andnearly zero (nZEB) energy performance calculations for residential buildingswith REHVA definition for nZEB national implementation, Energy and Buildings43 (11) (2011) 3279–3288.
[25] J. Kurnitski, A. Saari, T. Kalamees, M. Vuolle, J. Niemelä, T. Tark, Cost optimal andnearly zero energy performance requirements for buildings in Estonia, EstonianJournal of Engineering 19 (3) (2013) 183–202.
Related Documents