ENERGY AND ENVIRONMENTAL ASSESSMENT OF HIGH SPEED ROUNDABOUTS Kyoungho Ahn Virginia Tech Transportation Institute 7054 Haycock Rd Falls Church, VA 22043 (703) 538-8447 [email protected] Nopadon Kronprasert Department of Civil and Environmental Engineering, Virginia Tech 7054 Haycock Rd Falls Church, VA 22043 [email protected] Hesham Rakha * Department of Civil and Environmental Engineering, Virginia Tech Virginia Tech Transportation Institute 3500 Transportation Research Plaza Blacksburg, VA 24061– 0536 (540) 231-1505 Fax: (540) 231-1555 [email protected] Total word count: 5,232 (text) + 2,250 (10 tables & figures) = 7,482 Resubmitted on Nov. 15, 2008 * Corresponding author

Welcome message from author
This document is posted to help you gain knowledge. Please leave a comment to let me know what you think about it! Share it to your friends and learn new things together.
Transcript
ENERGY AND ENVIRONMENTAL ASSESSMENT OF HIGH SPEED ROUNDABOUTS Kyoungho Ahn Virginia Tech Transportation Institute 7054 Haycock Rd Falls Church, VA 22043 (703) 538-8447 [email protected] Nopadon Kronprasert Department of Civil and Environmental Engineering, Virginia Tech 7054 Haycock Rd Falls Church, VA 22043 [email protected] Hesham Rakha* Department of Civil and Environmental Engineering, Virginia Tech Virginia Tech Transportation Institute 3500 Transportation Research Plaza Blacksburg, VA 24061– 0536 (540) 231-1505 Fax: (540) 231-1555 [email protected] Total word count: 5,232 (text) + 2,250 (10 tables & figures) = 7,482 Resubmitted on Nov. 15, 2008
* Corresponding author
Ahn, Kronprasert, and Rakha
ABSTRACT Recently an increased number of roundabouts have been implemented across the United Sates in an effort to improve intersection efficiency and safety. However, relatively few studies have evaluated the energy and environmental impact of these roundabouts. Consequently, this study quantifies the energy and environmental impact of an isolated roundabout on a high speed road using second-by-second speed profiles derived from traffic simulation models in conjunction with microscopic energy and emission models. The study demonstrates that, at the intersection of a high- with a low-speed road, an isolated roundabout does not necessarily reduce vehicle fuel consumption and emissions compared to other forms of intersection control (stop sign and traffic signal control). This case study found that the roundabout reduces the delay and queue lengths on the intersection approaches. However, the roundabout results in a significant increase in vehicle fuel consumption and emission levels compared to a two-way stop control scenario. The study demonstrates, for this case study, that the roundabout provides efficient movements to vehicles when the approach traffic volumes are relatively low. However, as the demand increases, the roundabout experiences substantial increases in unnecessary delay in comparison to a signalized intersection control strategy.
Ahn, Kronprasert, and Rakha 1
INTRODUCTION Recently an increased number of roundabouts have been implemented across the United Sates in an effort to improve intersection efficiency and safety. Although the precise number of roundabouts is unknown, approximately 2,000 roundabouts have been built in the United States while there are approximately 20,000 roundabouts in France, 15,000 in Australia, and 10,000 in the United Kingdom [1]. However, relatively few studies have evaluated the energy and environmental impact of these roundabouts. Consequently, this study investigates the energy and environmental impact of an isolated roundabout on a high speed road using second-by-second speed profiles derived from traffic simulation models in conjunction with microscopic energy and emission models.
A roundabout is a type of circular intersection that uses yield control to regulate entering vehicles [2]. While roundabouts emerged as new traffic control approaches in the United States in recent years, the modern roundabout was developed in the United Kingdom to correct problems associated with traffic circles in the 1960s. The new form of junction adopted a “right of way” rule to vehicles at circular intersections, which requires entering traffic to yield to circulating traffic, the addition of a splitter island, and no crosswalks in the circulating path. Moreover, modern roundabouts also involve low speeds for entering and circulating traffic to improve the safety of these facilities. A recent study [3] found that roundabouts are statistically safer than traditional intersection controls by eliminating or altering conflict types; reducing speed differentials at intersections; and forcing drivers to decrease speeds as they proceed into and through the intersection. Furthermore low speeds associated with roundabouts allow drivers more time to react to potential conflicts.
While traditional intersections force vehicular traffic to slow down and stop, modern roundabouts improve traffic flow and reduce vehicle idling times at intersections. As a result, roundabouts are considered as one of the most efficient forms of intersection control that can improve fuel economy and vehicle emissions. Furthermore even when traffic volumes are high, vehicles continue to advance slowly rather than coming to a complete stop, which may improve air quality and produce energy savings by reducing acceleration/deceleration and idling maneuvers [2, 4].
Roundabouts on high speed approaches (72 km/h or greater) have increased with the development of suburban areas. The traffic control devices in sprawling suburban and rural areas were predominantly connected by higher speed roadways and more and more intersections have been replaced by modern roundabouts at these intersections [5]. While roundabouts may have positive effects on the air quality eliminating longer stops and improving mobility, roundabouts also involve operational changes on driver deceleration and acceleration events from/to initial speeds. Thus there are concerns about possible emission increases due to excessive speed changes for approaching vehicles and occurrence of partial stops [6].
The objectives of this study are twofold. First, the study presents a case-study evaluation of the energy and environmental effects of roundabout operations with high speed approaches. Specifically, the study investigates whether modern roundabouts are appropriate at intersections with high-speed approaches from an environmental perspective. A case study site which currently operates as a two-way stop control intersection was selected. Second, the study compares the operational efficiency of a two-way stop control, a roundabout, a fixed-time traffic signal at an isolated intersection in terms of travel time, fuel consumption, and emissions. This
Ahn, Kronprasert, and Rakha 2
study compares the feasibility of a roundabout and a fixed-time traffic signal control strategy at the study site from an environmental perspective.
OVERVIEW OF ENVIRONMENTAL IMPACTS OF ROUNDABOTS Very few studies have investigated the energy and environmental effects on roundabouts. Roundabouts: an Information Guide by the Federal Highway Administration (FHWA) and Status Report by the Insurance Institute for Highway Safety (IIHS) briefly mentioned that roundabouts might cut vehicle pollution and fuel consumption compared with alternatives by reducing vehicle delay and idling times at intersections. Specifically, the reports claim that traffic through roundabouts produce less vehicle emissions and consume less fuel than traffic at fixed-time signalized intersections [2, 7]. Redington [8] concluded that roundabouts comprise a significant potential for conserving energy, reducing air pollutants and addressing global warming. The study investigated multiple case studies and concluded that newly installed roundabouts could provide considerable environmental benefits For example; a Clearwater, Florida study found that roundabouts could produce savings in vehicle emissions by up to 68% in comparison to traffic signal controlled intersections.
Alternatively, studies conducted in Sweden showed that roundabouts increased CO and NOx emissions by 4 to 6% relative to yield regulated intersections and reduced emissions by 20 to 29% relative to traffic signal controlled intersections [9, 10]. However, a similar study using floating cars in a before/after study found that the rebuilding of a signalized intersection into a roundabout produced savings in CO, NOx, and fuel consumption by 29%, 21% and 28%, respectively [11]. Swiss researchers also evaluated the environmental and energy impacts of roundabouts using a portable emission measurement system (PEMS) or mobile exhaust gas measurement apparatus (MAMA) using a single vehicle. The study concluded that roundabouts resulted in increases in vehicle fuel consumption and emissions relative to traffic signal control. In addition, increased deceleration and acceleration maneuvers at roundabouts resulted in higher fuel consumption and emission levels [12].
Coelho et al. [6] estimated emissions using a Vehicle Specific Power (VSP) method with congestion-specific speed profiles on roundabout approaches in urban corridors in Lisbon, Portugal and Raleigh, US. The study concluded that roundabouts increase vehicle emissions. When conflicting traffic is low, emissions are increased since the acceleration levels to cruise speeds appear to be high. The study concluded that as the difference between the approaching speeds and circulating speeds became larger, emissions substantially increased due to the increased acceleration rates. Researchers from Kansas State University investigated the environmental impacts of modern roundabouts using the SIDRA software [4]. The study found that roundabouts could save HC, CO, NOx, CO2 emissions by as much as 65%, 42%, 48%, and 59%, respectively relative to stop-controlled intersections.
In summary, the literature presents mixed results on the environmental impacts of roundabouts. These differences could be a result of differences in data collection methods, road characteristics, vehicle demands, and emission estimation methods. Previous studies did not consider high speed approach roundabouts. Also most of studies utilized aggregate characteristics without considering driving patterns of individual vehicles and their associated impact on vehicle energy consumption and emission levels. In an attempt to overcome the limitations of previous studies, this study utilizes two widely utilized microscopic traffic simulation models, INTEGRATION and VISSIM to replicate realistic driving behavior and mimic deceleration and acceleration events at a roundabout, stop sign, and signalized
Ahn, Kronprasert, and Rakha 3
intersection. The proposed study investigates the energy and environmental effects of a roundabout using microscopic emission models together with second-by-second speed profiles obtained from traffic simulation models.
METHODOLOGY There are various methods and techniques that can be utilized to evaluate the energy and environmental impacts of roundabouts. The main components of the study are twofold. First, the study requires the understanding of driving patterns of vehicles for different intersection control strategies, including stop signs, traffic signals, and roundabouts. Second, measurements and/or estimates of vehicle fuel consumption and emissions are required. The information on driving patterns includes speed, acceleration and deceleration levels, travel times, and vehicle delays (or stopping time). The general methodologies to measure and/or estimate driving patterns include field measurements and simulations using computer-based micro simulation methods. Also, in order to capture the changes in driving behavior during different traffic controls, the realistic representations of individual vehicles are essential. However, it is almost impossible to collect speed profiles of all approaching vehicles for various intersection control strategies. Consequently, microscopic traffic simulation was utilized. The INTEGRATION and VISSIM software were employed to simulate driving patterns at the study site. Both simulation packages have not only been validated against standard traffic flow theory, but have also been utilized for the evaluation of real-life applications.
In order to quantify the energy and environmental impact of various traffic control strategies, vehicle fuel consumption and emission levels should be measured or predicted. Dynamometer testing or on-road emission measurement equipment (OEM) are widely used to measure real-time emissions from vehicles. Though both methods are relatively accurate in measuring vehicle emissions in laboratories and in-field, the emission measurements from dynamometers and OEMs are limited to only a few test vehicles. Without utilizing sufficient test vehicles, the fuel consumption and emission data collected using these techniques are limited. Thus, fuel consumption and emission models that can represent general vehicle fleets are considered in this study.
Several methods and techniques can be utilized to predict accurate fuel consumption and emission levels. The state-of-the-practice is to utilize simple methodologies such as average speed methods to estimate fuel consumption and emission rates. However, this approach does not consider transient changes in a vehicle’s speed and acceleration as it travels on a road, which produces significant contributions to fuel consumption and emission levels. Specifically, a roundabout involves significant speed changes with various deceleration and acceleration events. Consequently, the usage of traditional average speed models cannot capture these effects on vehicle emissions. Therefore, this study utilizes microscopic fuel consumption and emission models that can estimate instantaneous vehicle emissions. The use of microscopic energy and emission models with second-by-second vehicle speed profiles may result in unreasonable energy and emission estimates at high speed and acceleration levels. Thus in order to overcome the possible weakness, speed and acceleration levels were ensured to be within the confines of the models.
CASE STUDY SITE CHARACTERISTICS A two-way stop controlled intersection was selected for this study. The site is located at the intersection of VA Route 606 and Ariane way in Loudoun County, VA and is adjacent to the
Ahn, Kronprasert, and Rakha 4
Washington Dulles Airport as shown in Figure 1. The intersection is frequently used as an alternative access point to Washington Dulles Airport and experiences high traffic volumes during peak hours. The posted speed limit is 88 km/h for eastbound and westbound traffic on Route 606. Northbound and southbound traffic on Ariane way have a 40 km/h speed limit and also are controlled by two-way stop signs. Figure 1 also illustrates the traffic volumes at the intersection during an average P.M. peak hour. As shown, very few vehicles enter and exit to the northern side and thus the intersection operates more like a T-intersection. The Route 606 corridor section has is a divided four-lane highway (two lanes per direction) with an extra left turn lane on each approach while the northbound approach from Ariane way has only two lanes, a left turn lane and a right turn lane.
During the non-peak hours the traffic volume is fairly low and the two-way stop controlled intersection is operated without any significant delay. However as the traffic volume increases during peak hours, travel times increase substantially. Specifically, the northbound traffic (from Ariane to Route 66) are typically more congested than other portions of the intersection. The northbound left turn volume is controlled by a stop sign and typical queue lengths at Ariane way range between 10 to 15 vehicles during P.M. peak hours. In addition, left turn vehicles from Ariane way are forced to make aggressive gap acceptance maneuvers, typically accepting gaps ranging from 3 to 5 seconds in size through the high speed approaching traffic stream from VA Route 606. In order to reduce the intersection delay and enhance the intersection safety, the feasibility of a modern roundabout was explored by local transportation professionals. This study investigated the feasibility of alternative intersection control strategies on various measures of effectiveness including energy and environmental impacts.
TRAFFIC SIMULATION MODELS Traffic simulation is increasingly being used to assess traffic operations along many different types of applications. The INTEGRATION and VISSIM software were employed for this study. Both microscopic traffic simulation software have been utilized and validated for a number of traffic control applications. Both models can provide reasonable assessment of how a proposed intersection or a roundabout may operate. Simulating traffic control applications using both INTEGRATION and VISSIM can replicate realistic driving behavior and mimic deceleration/acceleration events at a roundabout, stop sign, and signalized intersection.
The simulation models were constructed using parameters derived from field data. Only passenger cars were utilized for both simulation models in this study. The field-collected information included the number of lanes, lane striping, traffic volumes, free-flow speed, saturation flow rate, jam density, and queue length. In particular, all links were coded for a base saturation flow rate of 1,800 veh/h/lane and a jam density of 120 veh/km/lane with an exception for the northbound approaches which experience aggressive driving behavior due to excessively long queues. A saturation flow rate of 2,000 veh/h/lane was utilized for the northbound approach. The speeds-at-capacity were not measured from the study site. The speed-at-capacity is varied from 80 to 100% the free-flow speed on typical North America roads [13]. Thus, for INTEGRATION, the speed-at-capacity was coded at 90% of the free-flow speed of each link to represent typical speed/flow relationship on U.S. roads [13, 14]. However, for VISSIM software which utilizes Weidemann models, the default value was used for the speed-at-capacity, which equals the free-flow speed, since there is no parameter to adjust the speed-at-capacity. The base gap was set between 3 to 4 seconds for modeling of opposed saturation flow rates. The simulation models were calibrated using field data and validated against side-street queue length.
Ahn, Kronprasert, and Rakha 5
Each 60 minutes simulation run was executed for each scenario using both INTEGRATION and VISSIM.
Figure 2 compares the field-observed side-street queue lengths for the northbound left turn approach to the simulation model estimates. The northbound left turn approach was selected since the movement suffers from excessively long delays as a result of the stop sign control. As illustrated in the figure, the queue sizes generated from the simulation shows good agreement with the field-observed queue length data, indicating that the simulation models reasonably replicate the P.M. peak traffic condition on the study corridor. In particular, it was observed that the simulated queue lengths were within the range of the observed queue length, 10 to 15 vehicles. Figure 2 also shows that the simulation results were in very good agreement in terms of travel time trends and absolute values. Specifically, the eastbound and westbound travel times of both simulation models were similar with a difference of four seconds while the travel time difference for the northbound left turn vehicles was more significant at two minutes.
Figure 3 compares the queue length on the northbound left-turn approach and travel times for major movements for the proposed roundabout and signalized intersection. For both scenarios, the INTERATION and VISSIM model inputs were identical to the stop sign alternative. However, the base unopposed saturation flow rate of the northbound approach was reduced to 1,800 veh/h/lane since vehicles would not be as aggressive with the improvement of traffic conditions. The signalized intersection was designed with two phase movements (EB-WB and NB-SB) and a 35-second cycle length with a 77/33 phase split. The optimum cycle length and green split were estimated based on the level of the traffic demand. In the case of the roundabout design, the entry speed of 50 km/h and a diameter of 60 m were utilized based on the Roundabouts: An Information Guide recommendations [2].
The simulation results demonstrate that the queue lengths on the northbound approach were significantly reduced in the case of a roundabout or a traffic signal, as illustrated in Figure 3. Specifically, the VISSIM results demonstrate that both the roundabout and the signalized intersection reduce the average queue length to 1 m and 3 m, respectively, from 118 m in the case of the stop sign. Similarly, the results of the INTERGRATION software show that replacing a two-way stop sign intersection for a roundabout or a signalized intersection can cut the queue length by as much as 84 m or 10 vehicles. The simulation study shows that substituting a two-stop sign control for a roundabout or a traffic signal may increase travel times for the through traffic by less than 6 s per vehicle. However, the figure clearly demonstrates that the alternative traffic controls significantly reduce the travel time by as much as 220 s per vehicle on the northbound approach. Figures 2 and 3 illustrate similarities and discrepancies between the results of two simulation models. Both the VISSIM and INTEGRATION software incorporate similar psycho-physical approaches which accounts for vehicle acceleration constraints. However, since each simulation model was developed using different car-following models and other underlying logics, each model generates slightly different results. Indeed, a detailed description of the model comparison is out of scope of this study but is provided in the literature [13].
A comparison of different measures of effectiveness, computed using the INTEGRATION software, including the number of vehicle stops and average intersection delay is demonstrated in Figure 4. Interestingly, both the traffic signal and roundabout marginally increased the average number of vehicle stops. The computation of vehicle stops includes both complete and partial stops [15]. The increased number of stops in the case of a roundabout is caused by the partial stops incurred to vehicles approaching the roundabout. However, the increase in vehicle stops does not necessarily increase the total delay as illustrated in Figure 4.
Ahn, Kronprasert, and Rakha 6
The simulation results demonstrate that the proposed roundabout reduces the total delay by as much as 64%, from 15.8 s to 5.6 s. The roundabout is more effective than the signalized intersection eliminating 34 % of the total delay during the P.M. peak. In summary, a roundabout installation can generate reductions in vehicle delay and enhance the intersection capacity of high speed intersections.
ENERGY AND EMISSION MODELS The VT-Micro model and the Comprehensive Modal Emissions Model (CMEM) were utilized to estimate vehicle fuel consumption and emission levels using the second-by-second speed profiles derived from the simulation runs. The VT-Micro model is a mathematical model that estimates vehicle fuel consumption and emission levels for individual and/or composite vehicles using instantaneous speed and acceleration as explanatory variables. The VT-Micro model was developed as a regression model from experimentation with numerous polynomial combinations of speed and acceleration levels to construct a dual-regime model of the form. The model was developed utilizing a number of data sources including data collected at the Oak Ridge National Laboratory (ORNL) (9 vehicles) and the Environmental Protection Agency (EPA) (101 vehicles). In this study, an average composite vehicle for the nine ORNL vehicles was utilized. This composite vehicle included six light-duty automobiles and three light-duty trucks. These vehicles were selected in order to produce an average vehicle that was consistent with average vehicle sales in terms of engine displacement, vehicle curb weight, and vehicle type at the time the data were gathered. The VT-Micro model fuel consumption and emission rates were found to be highly accurate compared to the original data with coefficients of determination (R2) ranging from 0.92 to 0.99. The model is easy to use for the evaluation of the environmental impacts of operational-level projects including ITS [16, 17].
The Comprehensive Modal Emissions Model was developed by researchers at the University of California, Riverside. CMEM estimates light-duty vehicle (LDV) and light-duty truck (LDT) emissions as a function of the vehicle’s operating mode. The term “comprehensive” is utilized to reflect the ability of the model to predict emissions for a wide variety of LDVs and LDTs in various operating states. CMEM predicts second-by-second tailpipe emissions and fuel-consumption rates for a wide range of vehicle and technology categories. Vehicle operational variables (such as speed, acceleration, and road grade) and model-calibrated parameters (such as cold-start coefficients and engine-friction factor) are utilized as input data [18]. In order to estimate fuel consumption and emissions, the CMEM vehicle category 11 was utilized. Category 11 represents Tier 1, relatively new low-mileage vehicles which reflect low-emitting passenger cars.
ENVRIONMENTAL IMPACT OF A ROUNDABOUT Because the INTEGRATION software includes the VT-Micro model the energy and environmental output are generated automatically, however, in the case of the VISSIM software the VT-Micro model was applied as a post processor using individual second-by-second vehicle speed profiles. In addition the fuel consumption and emission estimates were also estimated using the CMEM model considering the speed profiles generated by the INTEGRATION and VISSIM software.
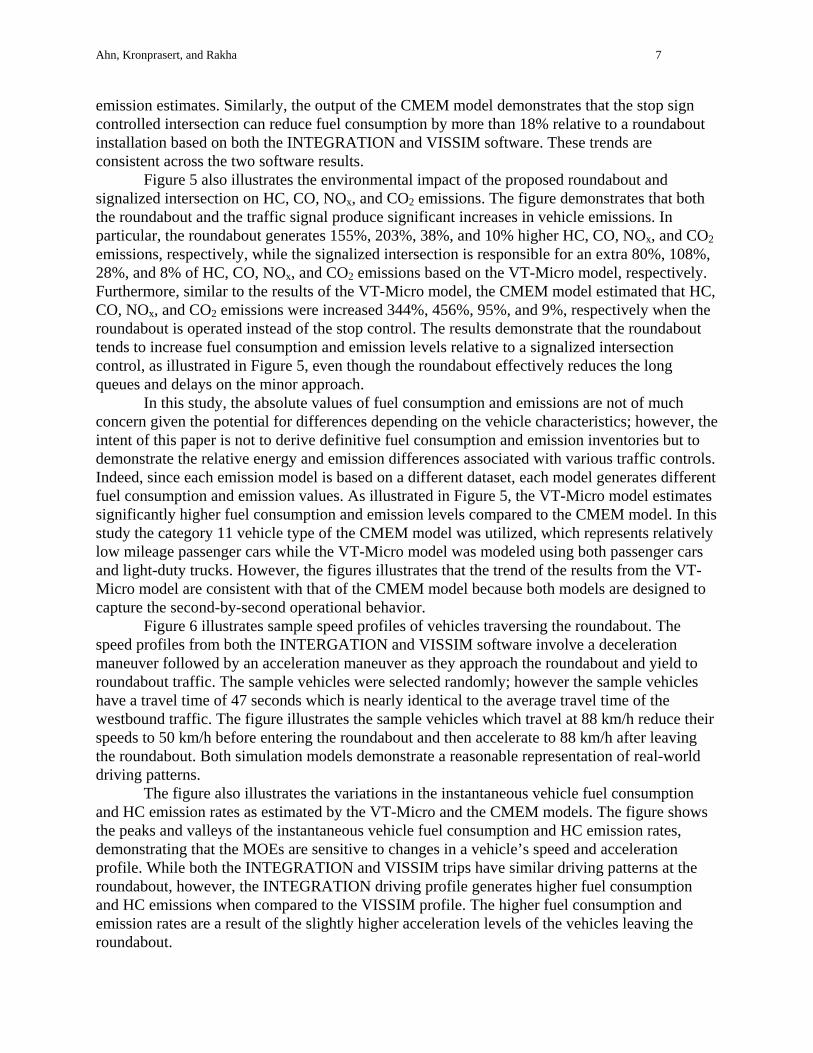
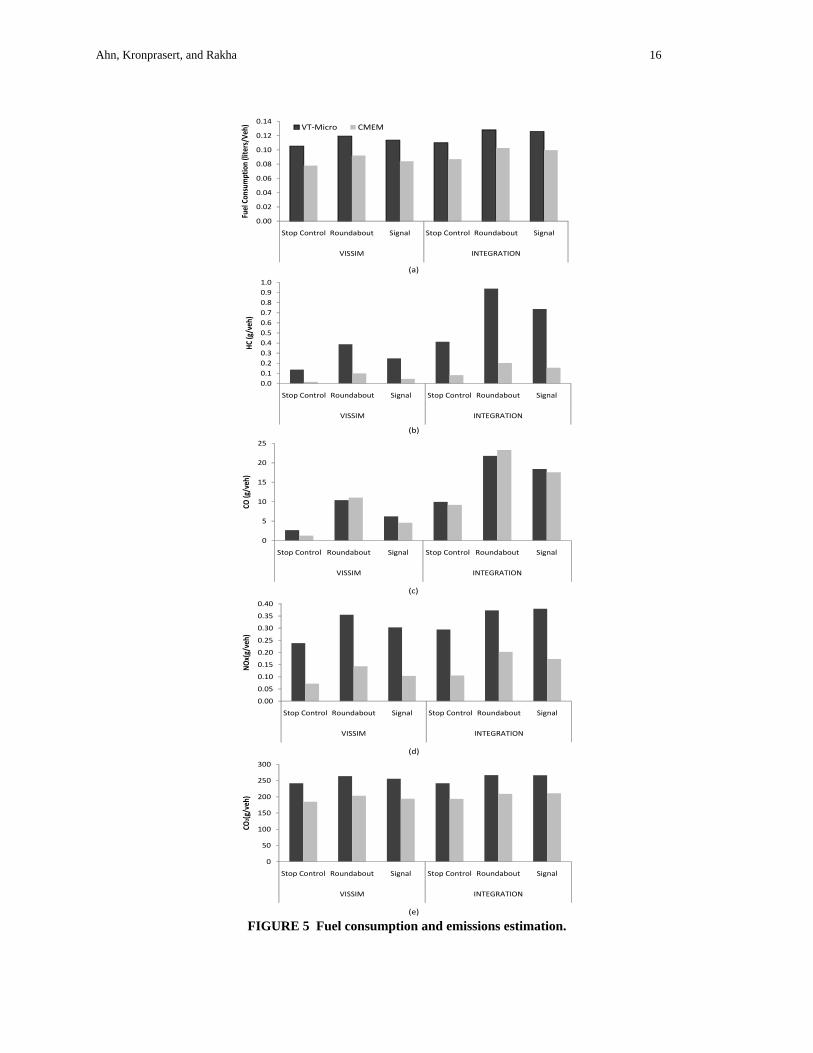
Figure 5 demonstrates that the fuel consumption increases by 13% and 8% when the stop sign controlled intersection is replaced for the proposed roundabout or a signalized intersection, respectively based on the VISSIM speed profiles and the VT-Micro fuel consumption and
Ahn, Kronprasert, and Rakha 7
emission estimates. Similarly, the output of the CMEM model demonstrates that the stop sign controlled intersection can reduce fuel consumption by more than 18% relative to a roundabout installation based on both the INTEGRATION and VISSIM software. These trends are consistent across the two software results.
Figure 5 also illustrates the environmental impact of the proposed roundabout and signalized intersection on HC, CO, NOx, and CO2 emissions. The figure demonstrates that both the roundabout and the traffic signal produce significant increases in vehicle emissions. In particular, the roundabout generates 155%, 203%, 38%, and 10% higher HC, CO, NOx, and CO2 emissions, respectively, while the signalized intersection is responsible for an extra 80%, 108%, 28%, and 8% of HC, CO, NOx, and CO2 emissions based on the VT-Micro model, respectively. Furthermore, similar to the results of the VT-Micro model, the CMEM model estimated that HC, CO, NOx, and CO2 emissions were increased 344%, 456%, 95%, and 9%, respectively when the roundabout is operated instead of the stop control. The results demonstrate that the roundabout tends to increase fuel consumption and emission levels relative to a signalized intersection control, as illustrated in Figure 5, even though the roundabout effectively reduces the long queues and delays on the minor approach.
In this study, the absolute values of fuel consumption and emissions are not of much concern given the potential for differences depending on the vehicle characteristics; however, the intent of this paper is not to derive definitive fuel consumption and emission inventories but to demonstrate the relative energy and emission differences associated with various traffic controls. Indeed, since each emission model is based on a different dataset, each model generates different fuel consumption and emission values. As illustrated in Figure 5, the VT-Micro model estimates significantly higher fuel consumption and emission levels compared to the CMEM model. In this study the category 11 vehicle type of the CMEM model was utilized, which represents relatively low mileage passenger cars while the VT-Micro model was modeled using both passenger cars and light-duty trucks. However, the figures illustrates that the trend of the results from the VT-Micro model are consistent with that of the CMEM model because both models are designed to capture the second-by-second operational behavior.
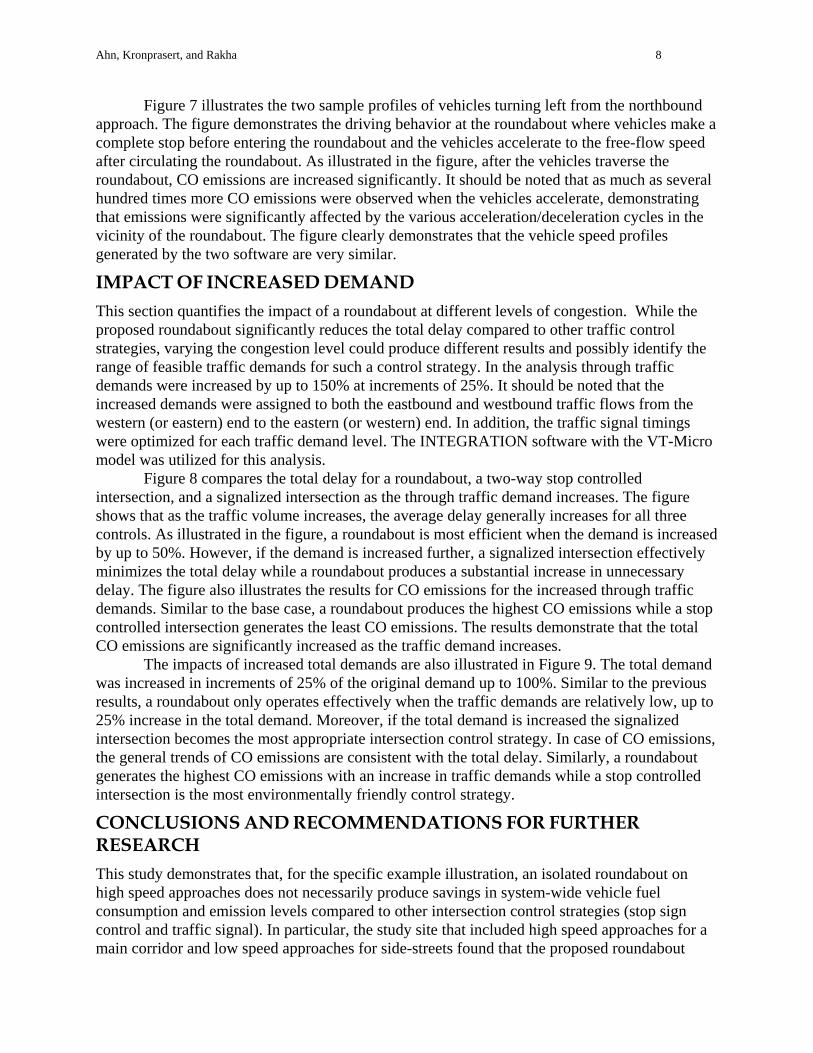
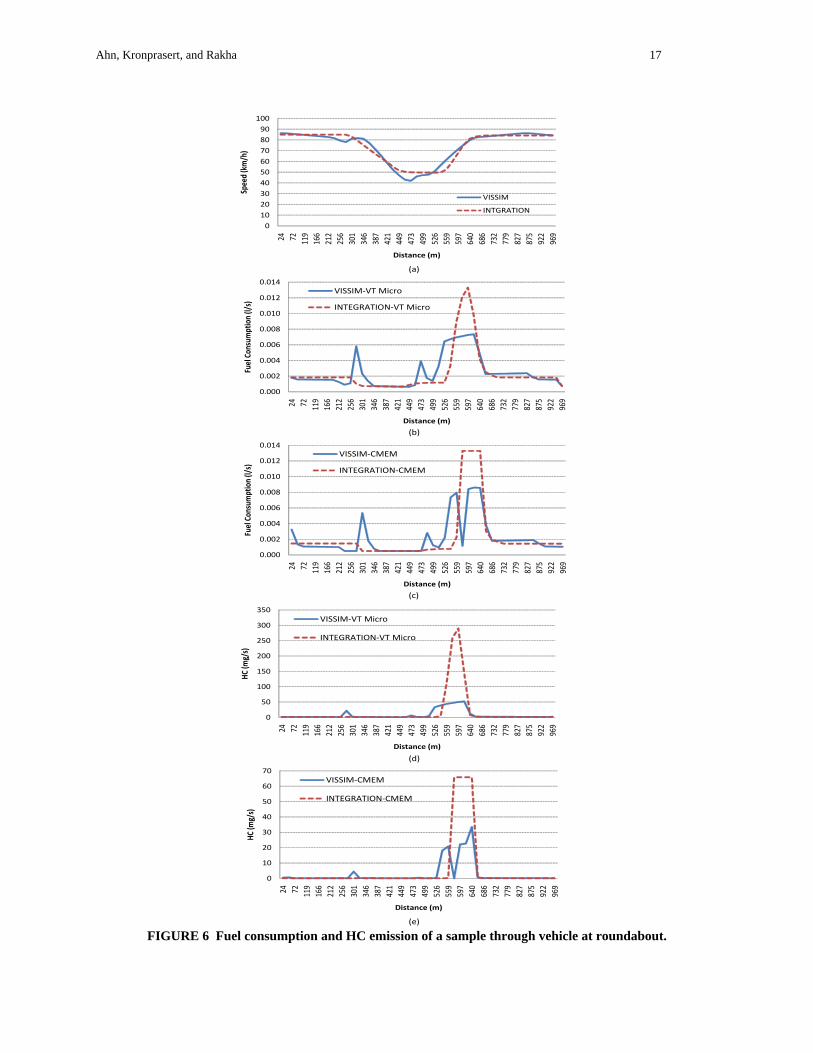
Figure 6 illustrates sample speed profiles of vehicles traversing the roundabout. The speed profiles from both the INTERGATION and VISSIM software involve a deceleration maneuver followed by an acceleration maneuver as they approach the roundabout and yield to roundabout traffic. The sample vehicles were selected randomly; however the sample vehicles have a travel time of 47 seconds which is nearly identical to the average travel time of the westbound traffic. The figure illustrates the sample vehicles which travel at 88 km/h reduce their speeds to 50 km/h before entering the roundabout and then accelerate to 88 km/h after leaving the roundabout. Both simulation models demonstrate a reasonable representation of real-world driving patterns.
The figure also illustrates the variations in the instantaneous vehicle fuel consumption and HC emission rates as estimated by the VT-Micro and the CMEM models. The figure shows the peaks and valleys of the instantaneous vehicle fuel consumption and HC emission rates, demonstrating that the MOEs are sensitive to changes in a vehicle’s speed and acceleration profile. While both the INTEGRATION and VISSIM trips have similar driving patterns at the roundabout, however, the INTEGRATION driving profile generates higher fuel consumption and HC emissions when compared to the VISSIM profile. The higher fuel consumption and emission rates are a result of the slightly higher acceleration levels of the vehicles leaving the roundabout.
Ahn, Kronprasert, and Rakha 8
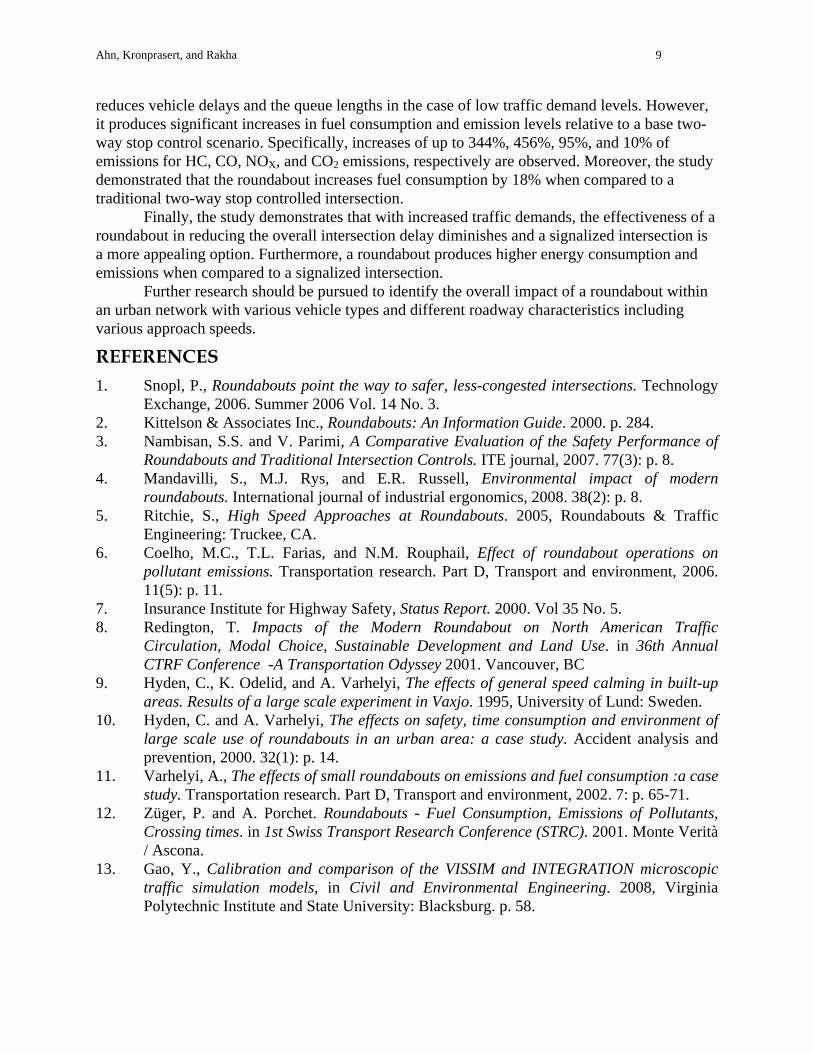
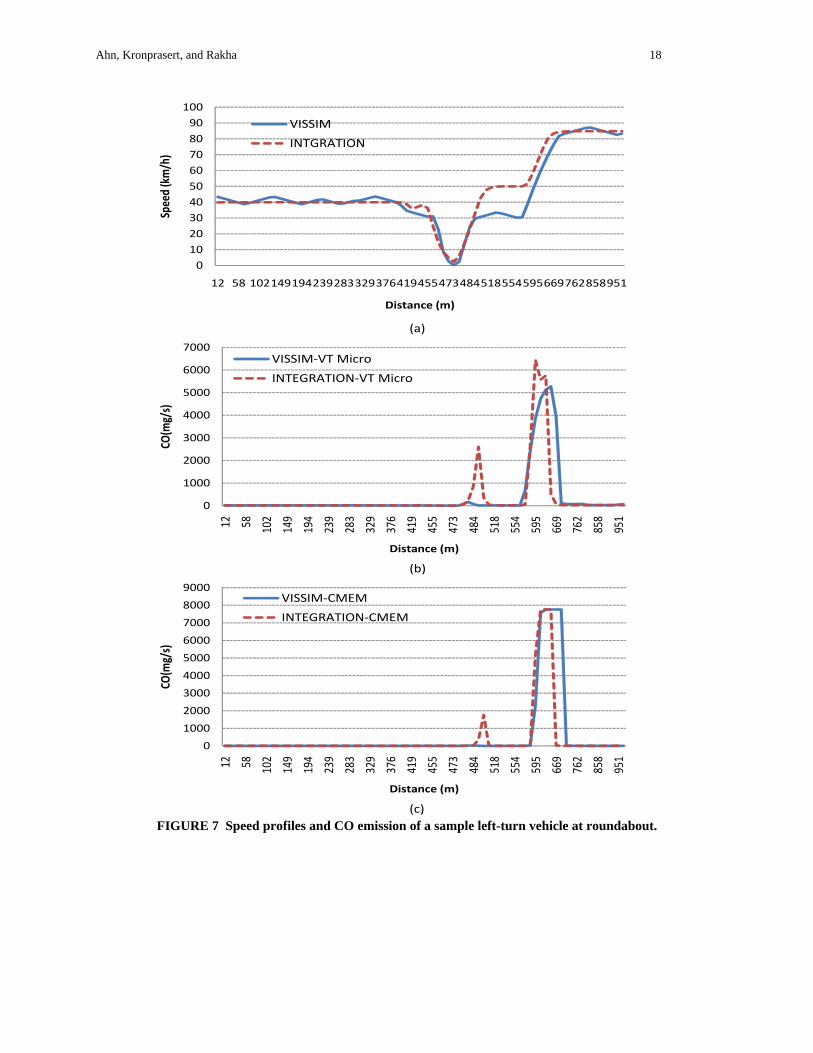
Figure 7 illustrates the two sample profiles of vehicles turning left from the northbound approach. The figure demonstrates the driving behavior at the roundabout where vehicles make a complete stop before entering the roundabout and the vehicles accelerate to the free-flow speed after circulating the roundabout. As illustrated in the figure, after the vehicles traverse the roundabout, CO emissions are increased significantly. It should be noted that as much as several hundred times more CO emissions were observed when the vehicles accelerate, demonstrating that emissions were significantly affected by the various acceleration/deceleration cycles in the vicinity of the roundabout. The figure clearly demonstrates that the vehicle speed profiles generated by the two software are very similar.
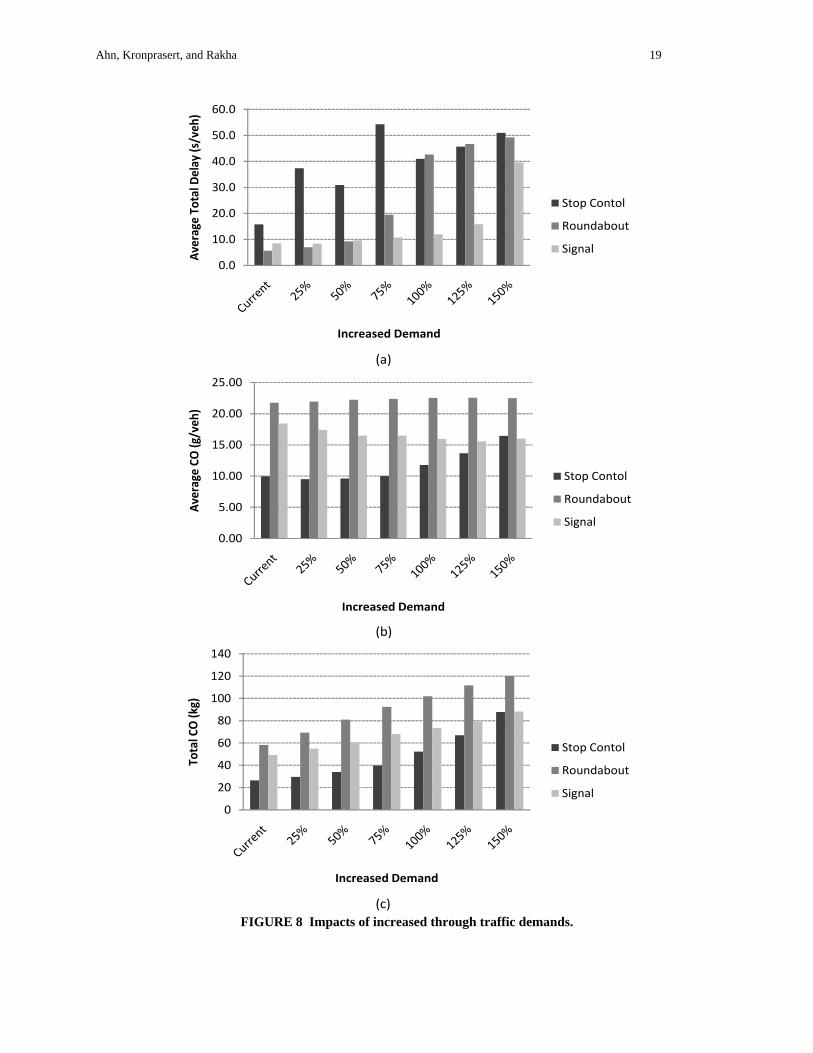
IMPACT OF INCREASED DEMAND This section quantifies the impact of a roundabout at different levels of congestion. While the proposed roundabout significantly reduces the total delay compared to other traffic control strategies, varying the congestion level could produce different results and possibly identify the range of feasible traffic demands for such a control strategy. In the analysis through traffic demands were increased by up to 150% at increments of 25%. It should be noted that the increased demands were assigned to both the eastbound and westbound traffic flows from the western (or eastern) end to the eastern (or western) end. In addition, the traffic signal timings were optimized for each traffic demand level. The INTEGRATION software with the VT-Micro model was utilized for this analysis.
Figure 8 compares the total delay for a roundabout, a two-way stop controlled intersection, and a signalized intersection as the through traffic demand increases. The figure shows that as the traffic volume increases, the average delay generally increases for all three controls. As illustrated in the figure, a roundabout is most efficient when the demand is increased by up to 50%. However, if the demand is increased further, a signalized intersection effectively minimizes the total delay while a roundabout produces a substantial increase in unnecessary delay. The figure also illustrates the results for CO emissions for the increased through traffic demands. Similar to the base case, a roundabout produces the highest CO emissions while a stop controlled intersection generates the least CO emissions. The results demonstrate that the total CO emissions are significantly increased as the traffic demand increases.
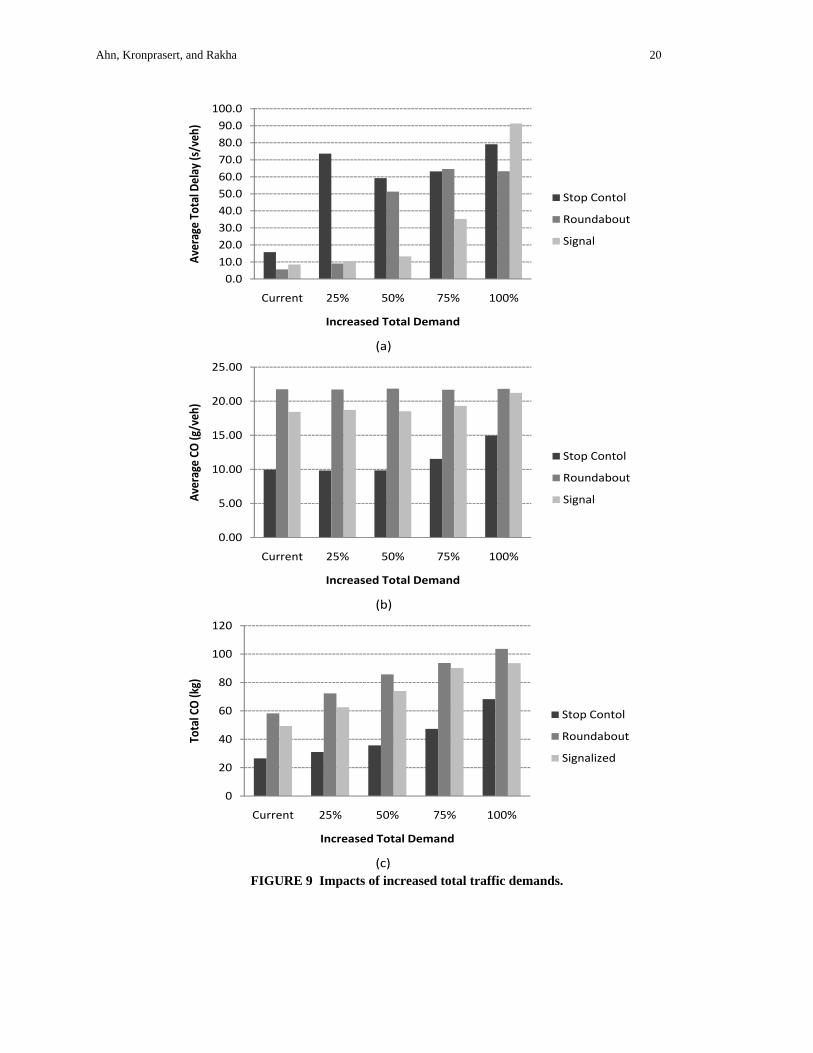
The impacts of increased total demands are also illustrated in Figure 9. The total demand was increased in increments of 25% of the original demand up to 100%. Similar to the previous results, a roundabout only operates effectively when the traffic demands are relatively low, up to 25% increase in the total demand. Moreover, if the total demand is increased the signalized intersection becomes the most appropriate intersection control strategy. In case of CO emissions, the general trends of CO emissions are consistent with the total delay. Similarly, a roundabout generates the highest CO emissions with an increase in traffic demands while a stop controlled intersection is the most environmentally friendly control strategy.
CONCLUSIONS AND RECOMMENDATIONS FOR FURTHER RESEARCH This study demonstrates that, for the specific example illustration, an isolated roundabout on high speed approaches does not necessarily produce savings in system-wide vehicle fuel consumption and emission levels compared to other intersection control strategies (stop sign control and traffic signal). In particular, the study site that included high speed approaches for a main corridor and low speed approaches for side-streets found that the proposed roundabout
Ahn, Kronprasert, and Rakha 9
reduces vehicle delays and the queue lengths in the case of low traffic demand levels. However, it produces significant increases in fuel consumption and emission levels relative to a base two-way stop control scenario. Specifically, increases of up to 344%, 456%, 95%, and 10% of emissions for HC, CO, NOX, and CO2 emissions, respectively are observed. Moreover, the study demonstrated that the roundabout increases fuel consumption by 18% when compared to a traditional two-way stop controlled intersection.
Finally, the study demonstrates that with increased traffic demands, the effectiveness of a roundabout in reducing the overall intersection delay diminishes and a signalized intersection is a more appealing option. Furthermore, a roundabout produces higher energy consumption and emissions when compared to a signalized intersection.
Further research should be pursued to identify the overall impact of a roundabout within an urban network with various vehicle types and different roadway characteristics including various approach speeds.
REFERENCES 1. Snopl, P., Roundabouts point the way to safer, less-congested intersections. Technology
Exchange, 2006. Summer 2006 Vol. 14 No. 3. 2. Kittelson & Associates Inc., Roundabouts: An Information Guide. 2000. p. 284. 3. Nambisan, S.S. and V. Parimi, A Comparative Evaluation of the Safety Performance of
Roundabouts and Traditional Intersection Controls. ITE journal, 2007. 77(3): p. 8. 4. Mandavilli, S., M.J. Rys, and E.R. Russell, Environmental impact of modern
roundabouts. International journal of industrial ergonomics, 2008. 38(2): p. 8. 5. Ritchie, S., High Speed Approaches at Roundabouts. 2005, Roundabouts & Traffic
Engineering: Truckee, CA. 6. Coelho, M.C., T.L. Farias, and N.M. Rouphail, Effect of roundabout operations on
pollutant emissions. Transportation research. Part D, Transport and environment, 2006. 11(5): p. 11.
7. Insurance Institute for Highway Safety, Status Report. 2000. Vol 35 No. 5. 8. Redington, T. Impacts of the Modern Roundabout on North American Traffic
Circulation, Modal Choice, Sustainable Development and Land Use. in 36th Annual CTRF Conference -A Transportation Odyssey 2001. Vancouver, BC
9. Hyden, C., K. Odelid, and A. Varhelyi, The effects of general speed calming in built-up areas. Results of a large scale experiment in Vaxjo. 1995, University of Lund: Sweden.
10. Hyden, C. and A. Varhelyi, The effects on safety, time consumption and environment of large scale use of roundabouts in an urban area: a case study. Accident analysis and prevention, 2000. 32(1): p. 14.
11. Varhelyi, A., The effects of small roundabouts on emissions and fuel consumption :a case study. Transportation research. Part D, Transport and environment, 2002. 7: p. 65-71.
12. Züger, P. and A. Porchet. Roundabouts - Fuel Consumption, Emissions of Pollutants, Crossing times. in 1st Swiss Transport Research Conference (STRC). 2001. Monte Verità / Ascona.
13. Gao, Y., Calibration and comparison of the VISSIM and INTEGRATION microscopic traffic simulation models, in Civil and Environmental Engineering. 2008, Virginia Polytechnic Institute and State University: Blacksburg. p. 58.
Ahn, Kronprasert, and Rakha 10
14. Rakha, H. and B. Crowther, Comparison and calibration of FRESIM and INTEGRATION steady-state car-following behavior. Transportation research. Part A, Policy and practice, 2003. 37(1): p. 1-27.
15. Rakha, H., Y.-S. Kang, and F. Dion, Estimating vehicle stops at undersaturated and oversaturated fixed-time signalized intersections. Transportation Research Record, 2001. n 1776: p. 128-137
16. Ahn, K., et al., Estimating vehicle fuel consumption and emissions based on instantaneous speed and acceleration levels. Journal of Transportation Engineering, 2002. 128(2): p. 182-190.
17. Rakha, H., K. Ahn, and A. Trani, Development of VT-Micro model for estimating hot stabilized light duty vehicle and truck emissions. Transportation Research Part D-Transport and Environment, 2004. 9(1): p. 49-74.
18. Barth, M., et al., Comprehensive modal emission model (CMEM), version 2.0 user's guide. 2000, Riverside, CA.

Ahn, Kronprasert, and Rakha 11
LIST OF FIGURES FIGURE 1: Study Site. FIGURE 2: Simulation model validation. FIGURE 3: Comparisons of alternative traffic controls. FIGURE 4: Operational performances of alternative traffic controls. FIGURE 5: Fuel consumption and emissions estimation. FIGURE 6: Fuel consumption and HC emission of a sample through vehicle at roundabout. FIGURE 7: Speed profiles and CO emission of a sample left-turn vehicle at roundabout. FIGURE 8: Impacts of increased through traffic demands. FIGURE 9: Impacts of increased total traffic demands.
Ahn, Kronprasert, and Rakha 12
1000
1200100
900
275
500
225120
1080
PM peak volume per hour
10
FIGURE 1 Study Site.
Ahn, Kronprasert, and Rakha 13
(a)
(b)
0
2
4
6
8
10
12
14
16
VISSIM INTGRATION Observed
Ave. Que
ue Le
ngth (n
o. of veh
)
0
50
100
150
200
250
300
350
WB Through EB Through NB Left Turn WB Through EB Through NB Left Turn
VISSIM INTGRATION
Average T
ravel Tim
e (s)
FIGURE 2 Simulation model validation.
Ahn, Kronprasert, and Rakha 14
(a)
(b)
0
20
40
60
80
100
120
140
Stop Control Roundabout Signal
Que
ue Len
gth (m
)
VISSIM
INTGRATION
0
50
100
150
200
250
300
350
WB Through
EB Through
NB Left Turn
WB Through
EB Through
NB Left Turn
VISSIM INTGRATION
Average Travel Tim
e (s)
Stop Control
Roundabout
Signal
FIGURE 3 Comparisons of alternative traffic controls.
Ahn, Kronprasert, and Rakha 15
(a)
(b)
0
0.1
0.2
0.3
0.4
0.5
0.6
0.7
0.8
Stop Control Signal Roundabout
Average Ve
hicle
Stop
s
0
2
4
6
8
10
12
14
16
18
Stop Control Signal Roundabout
Average Intersectio
n De
lay (s/veh)
FIGURE 4 Operational performances of alternative traffic controls.
Ahn, Kronprasert, and Rakha 16
(a)
(b)
(c)
(d)
(e)
0.00
0.02
0.04
0.06
0.08
0.10
0.12
0.14
Stop Control Roundabout Signal Stop Control Roundabout Signal
VISSIM INTEGRATIONFuel Con
sumption (liters/V
eh) VT‐Micro CMEM
0.00.10.20.30.40.50.60.70.80.91.0
Stop Control Roundabout Signal Stop Control Roundabout Signal
VISSIM INTEGRATION
HC (g/veh
)
0
5
10
15
20
25
Stop Control Roundabout Signal Stop Control Roundabout Signal
VISSIM INTEGRATION
CO (g/veh
)
0.00
0.05
0.10
0.15
0.20
0.25
0.30
0.35
0.40
Stop Control Roundabout Signal Stop Control Roundabout Signal
VISSIM INTEGRATION
NOx(g/veh)
0
50
100
150
200
250
300
Stop Control Roundabout Signal Stop Control Roundabout Signal
VISSIM INTEGRATION
CO2(g
/veh
)
FIGURE 5 Fuel consumption and emissions estimation.
Ahn, Kronprasert, and Rakha 17
(a)
(b)
(c)
(d)
(e)
0102030405060708090100
24 72 119
166
212
256
301
346
387
421
449
473
499
526
559
597
640
686
732
779
827
875
922
969
Speed (km/h)
Distance (m)
VISSIM
INTGRATION
0.000
0.002
0.004
0.006
0.008
0.010
0.012
0.01424 72 119
166
212
256
301
346
387
421
449
473
499
526
559
597
640
686
732
779
827
875
922
969
Fuel Con
sumption (l/s)
Distance (m)
VISSIM‐VT Micro
INTEGRATION‐VT Micro
0
50
100
150
200
250
300
350
24 72 119
166
212
256
301
346
387
421
449
473
499
526
559
597
640
686
732
779
827
875
922
969
HC (m
g/s)
Distance (m)
VISSIM‐VT Micro
INTEGRATION‐VT Micro
0.000
0.002
0.004
0.006
0.008
0.010
0.012
0.014
24 72 119
166
212
256
301
346
387
421
449
473
499
526
559
597
640
686
732
779
827
875
922
969
Fuel Con
sumption (l/s)
Distance (m)
VISSIM‐CMEM
INTEGRATION‐CMEM
0
10
20
30
40
50
60
70
24 72 119
166
212
256
301
346
387
421
449
473
499
526
559
597
640
686
732
779
827
875
922
969
HC (m
g/s)
Distance (m)
VISSIM‐CMEM
INTEGRATION‐CMEM
FIGURE 6 Fuel consumption and HC emission of a sample through vehicle at roundabout.
Ahn, Kronprasert, and Rakha 18
(a)
(b)
(c)
0102030405060708090100
12 58 102149194239283329376419455473484518554595669762858951
Speed (km/h)
Distance (m)
VISSIM
INTGRATION
0
1000
2000
3000
4000
5000
6000
7000
12 58 102
149
194
239
283
329
376
419
455
473
484
518
554
595
669
762
858
951
CO(m
g/s)
Distance (m)
VISSIM‐VT Micro
INTEGRATION‐VT Micro
0
1000
2000
3000
4000
5000
6000
7000
8000
9000
12 58 102
149
194
239
283
329
376
419
455
473
484
518
554
595
669
762
858
951
CO(m
g/s)
Distance (m)
VISSIM‐CMEM
INTEGRATION‐CMEM
FIGURE 7 Speed profiles and CO emission of a sample left-turn vehicle at roundabout.
Ahn, Kronprasert, and Rakha 19
(a)
(b)
(c)
0.0
10.0
20.0
30.0
40.0
50.0
60.0
Average
Total Delay (s/veh
)
Increased Demand
Stop Contol
Roundabout
Signal
0.00
5.00
10.00
15.00
20.00
25.00
Average
CO (g/veh
)
Increased Demand
Stop Contol
Roundabout
Signal
0
20
40
60
80
100
120
140
Total CO (k
g)
Increased Demand
Stop Contol
Roundabout
Signal
FIGURE 8 Impacts of increased through traffic demands.
Ahn, Kronprasert, and Rakha 20
(a)
(b)
(c)
0.010.020.030.040.050.060.070.080.090.0
100.0
Current 25% 50% 75% 100%
Average To
tal D
elay (s/veh
)
Increased Total Demand
Stop Contol
Roundabout
Signal
0.00
5.00
10.00
15.00
20.00
25.00
Current 25% 50% 75% 100%
Average CO
(g/veh
)
Increased Total Demand
Stop Contol
Roundabout
Signal
0
20
40
60
80
100
120
Current 25% 50% 75% 100%
Total CO (kg)
Increased Total Demand
Stop Contol
Roundabout
Signalized
FIGURE 9 Impacts of increased total traffic demands.
Related Documents


![Why Roundabouts? [Infographic]](https://static.cupdf.com/doc/110x72/5479635fb479599f098b4744/why-roundabouts-infographic.jpg)

