2-15 SECTION 2.2 ENERGY AND ECONOMIC DEVELOPMENT INTRODUCTION Policies that promote a secure, competitive, and reasonably priced energy supply will help attract, retain, and expand businesses in New York. These include policies that support reducing energy costs to consumers, improving the reliability of the State’s energy supplier and infrastructures, and developing energy-related businesses in New York. In addition, promoting cost-effective energy-efficiency improvements, indigenous and renewable energy resource development, and alternative-fueled vehicles, stimulates in-State job creation, particularly when these technologies or their components are manufactured in New York. A secure and reliable energy supply will provide businesses with the confidence necessary to invest in New York. The increase in business profitability and consumer purchasing power that results from lower energy costs will further stimulate business investment, consumer spending, and employment growth within the State. ENERGY SUPPLY With the growth in electricity demand that has occurred over the last five years, adequate and reliable energy supplies are critical to the State’s continuing economic prosperity. New York has added 802,000 private sector jobs since 1995, leading all other Northern industrialized states in the rate of job creation. From 1999 to 2000, the State ranked tenth among all states for private sector job growth. Continuing this economic growth will depend, in part, on the State securing additional energy resources, including electricity generation and infrastructure improvements. The State has taken a number of actions to ensure that electricity supply is adequate to meet demand. In the near-term, the New York Independent System Operator (NYISO) has implemented the Emergency Demand Response and Day-Ahead Demand Bidding programs, the New York Power Authority (NYPA) has installed new generators in the metropolitan New York City area, and the New York State Energy Research and Development Authority (NYSERDA) and utilities have implemented new programs to assist businesses in reducing demand and becoming more energy-efficient. In the long term, the siting of new base load plants will help ensure reliability and support more stable pricing. In addition to new generation resources, the State is promoting greater investment in energy efficiency, indigenous and renewable resources, and distributed generation.

Energy and Economic Development
Feb 17, 2016
Energy and economic development
Welcome message from author
This document is posted to help you gain knowledge. Please leave a comment to let me know what you think about it! Share it to your friends and learn new things together.
Transcript

2-15
SECTION 2.2
ENERGY AND ECONOMIC DEVELOPMENT
INTRODUCTION
Policies that promote a secure, competitive, and reasonably priced energy supply
will help attract, retain, and expand businesses in New York. These include policies that
support reducing energy costs to consumers, improving the reliability of the State’s
energy supplier and infrastructures, and developing energy-related businesses in New
York. In addition, promoting cost-effective energy-efficiency improvements, indigenous
and renewable energy resource development, and alternative-fueled vehicles, stimulates
in-State job creation, particularly when these technologies or their components are
manufactured in New York. A secure and reliable energy supply will provide businesses
with the confidence necessary to invest in New York. The increase in business
profitability and consumer purchasing power that results from lower energy costs will
further stimulate business investment, consumer spending, and employment growth
within the State.
ENERGY SUPPLY
With the growth in electricity demand that has occurred over the last five years,
adequate and reliable energy supplies are critical to the State’s continuing economic
prosperity. New York has added 802,000 private sector jobs since 1995, leading all other
Northern industrialized states in the rate of job creation. From 1999 to 2000, the State
ranked tenth among all states for private sector job growth. Continuing this economic
growth will depend, in part, on the State securing additional energy resources, including
electricity generation and infrastructure improvements.
The State has taken a number of actions to ensure that electricity supply is
adequate to meet demand. In the near-term, the New York Independent System Operator
(NYISO) has implemented the Emergency Demand Response and Day-Ahead Demand
Bidding programs, the New York Power Authority (NYPA) has installed new generators
in the metropolitan New York City area, and the New York State Energy Research and
Development Authority (NYSERDA) and utilities have implemented new programs to
assist businesses in reducing demand and becoming more energy-efficient. In the long
term, the siting of new base load plants will help ensure reliability and support more
stable pricing. In addition to new generation resources, the State is promoting greater
investment in energy efficiency, indigenous and renewable resources, and distributed
generation.
1 Area Development, Sites and Facility Planning, "Corporate Survey," December, 1997.
2 Glen Weisbrod (Hagler Bailly Consulting, Inc.) and Howard Friedman (DynCorp), Economic Competitiveness Impacts
of Utility Rates and Programs, April 1, 1996, p.8.
2-16
ROLE OF ENERGY PRICES IN BUSINESS LOCATION AND EXPANSION
Geographic variation in energy prices gives businesses some degree of control
over the prices they pay, but only to the extent that they are able to easily relocate. As a
result, energy prices tend to be important factors in business location and expansion
decisions, particularly for energy-intensive businesses. Other considerations of varying
importance, depending on the type of business, include availability and reliability of
energy supply, taxes, availability of raw materials and other process inputs, access to
capital, proximity to transportation systems and markets, availability of a skilled
workforce, labor costs, government regulation, and environmental policies.
In a national survey of businesses that primarily included manufacturers, 81% of
respondents considered energy cost and availability to be either an important or very
important site-selection factor.1 Given the relative cost of energy in New York,
manufacturers in the State regard energy costs as being even more significant than is
indicated by the national survey. For most businesses in New York, the cost of energy
represents less than 5% of total product cost; however, energy prices can have a
substantial impact on profits. In many industries, profit margins are extremely thin,
representing less than 5% of gross sales.2 Reducing energy costs, therefore, can have a
substantial effect on a business’ profitability. Moreover, facilities in New York compete
with other companies within the State and with facilities within the same company
located in states with lower operating costs. In some cases, same-company facilities
compete for additional capacity and jobs; in other cases, they compete to remain in
operation. Corporations routinely favor locations that have the greatest profit potential.
Less profitable facilities will, at best, not be expanded. At worst, they will be closed,
with a resultant loss of jobs.
ECONOMIC DEVELOPMENT PROGRAMS
To overcome relatively higher energy costs, various programs, policies, and
initiatives have been developed to attract and retain businesses in the State. Both of the
State’s public power authorities, the Long Island Power Authority (LIPA) and NYPA,
3 It is estimated that LIPA’s four-year electric rate cut, rebates, and capital programs have contributed to the
expansion of Long Island’s economy by $10 billion.
2-17
have economic development programs to attract and retain businesses in New York.3
NYPA also administers the Power for Jobs program. NYSERDA offers a variety of
programs to encourage business growth, and the State’s investor-owned utilities offer
flexible rates and fixed discount programs to businesses that meet strict eligibility criteria.
New York Power Authority
NYPA provides low-cost electricity to businesses through programs designed to
promote economic development. In 2001, NYPA provided more than 1,500 megawatts
(MW) to 990 employers, ranging from heavy manufacturing and financial services to
health care facilities and cultural institutions. NYPA’s low-cost power supports more
than 450,000 jobs statewide. It operates two major hydroelectric power projects (Niagara
and St. Lawrence-FDR), a pumped storage hydropower project (Blenheim-Gilboa), five
small hydroelctric plants, two fossil fuel power projects (Poletti and Flynn) and 11 small
natural gas-fired turbines. In 2000, these facilities generated 22,710,360 megawatthours
(MWh) of electricity. That figure does not include the electricity produced by the
FitzPatrick and Indian Point 3 nuclear facilities, which were sold to Entergy in November
2000. The output of the nuclear facilities is purchased by NYPA under a long-term
agreement. Besides providing electricity, NYPA provides energy efficiency assistance
and other customized services to help its customers and other public entities lower energy
costs.
One of New York’s most valuable economic development tools is the low-cost
electricity produced by NYPA’s major hydroelectric facilities. For example,
approximately 50,000 jobs at nearly 100 companies in Western New York are tied to the
2,400 MW Niagara Power Project. In addition, NYPA’s 800 MW St. Lawrence-Franklin
D. Roosevelt Power Project in Northern New York provides some of the least-expensive
power in the nation for businesses and other upstate customers.
NYPA’s programs to assist economic growth include two programs using low-
cost hydropower from its Niagara Power Project. The Expansion Power program
provides 250 MW earmarked under State law for job creation and retention in New
York's three westernmost counties. The Replacement Power program provides 445 MW
designated by federal law for industries located in the Niagara Mohawk service territory
within 30 miles of the Niagara Power Project. Under both programs, the contracts for the
power allocations include customer commitments to sustain agreed-upon levels of
employment.
2-18
NYPA's sales of low-cost power to the State's 51 municipal electric systems and
rural cooperatives also benefit many businesses located within these service areas. The
Economic Development Power (EDP) program provides for job creation and business
revitalization throughout the State. Electricity for this program is supplied by the
FitzPatrick Purchased Power and Energy Agreement with Entergy. To receive EDP,
companies must commit to maintain a specific level of jobs and, in the case of business
retention, invest in real property improvements. The State EDP Allocation Board, created
by the State Legislature, evaluates applications and makes recommendations to NYPA’s
trustees. New York's businesses also benefit from NYPA's Municipal Distribution
Agency (MDA) power, another designated portion of the FitzPatrick nuclear power that is
sold to downstate local municipal distribution agencies.
The Power for Jobs program was signed into law in July 1997. This program
provides low-cost electricity to assist New York employers at risk of reducing or closing
their operations or moving out of State, or that were willing to expand job opportunities
in the State. The program authorizes NYPA to allocate an additional 450 MW of
low-cost electricity to New York businesses that commit to preserve or create jobs, with
up to 100 MW set aside for small businesses and not-for-profit corporations.
Applications are recommended by the EDP Allocation Board to the NYPA trustees. One-
half the electricity provided under the Power for Jobs program is produced at the
FitzPatrick Nuclear Power Plant and the remainder is purchased by NYPA under a
competitive procurement process. Allocation of the power available under the first three
phases of the program was completed by March 28, 2000. In 2000, NYPA was
authorized to provide a fourth phase of the Power for Jobs program, making 300 MW
available beginning January 1, 2001. Allocation of power available under Phase Four of
the program was completed by July 1, 2001. Power for Jobs has led to the creation and
retention of more than 300,000 jobs by providing low-cost power to more than 700
businesses and not-for-profit organizations. Over the life of the program, Power for Jobs
will save businesses more than $500 million. The Governor has proposed legislation that
would extend the Power for Jobs program to allow new allocations and authorize
companies with expiring Power for Jobs contracts to be eligible for reallocations.
In October 2001, legislation was signed into law containing an array of measures
to address New York’s economic recovery in the wake of the events of September 11,
2001. Among the provisions of the legislation was authorization for NYPA to sell up to
80 MW to assist in the economic recovery of New York City. NYPA had previously
provided 80 MW of electricity to the Port Authority of New York and New Jersey for the
World Trade Center. The New York City Economic Recovery Power program will
provide low-cost electricity to former tenants of the World Trade Center and other

2-19
businesses located in, or intending to locate in, the Liberty Zone and Resurgence Zone, as
designated by the legislation. This power is expected to save businesses more than $6
million annually.
New York State Energy Research and Development Authority
NYSERDA is a public benefit corporation created by the State Legislature in
1975. It provides technical and financial assistance for the development and deployment
of innovative technologies that improve energy efficiency and reduce energy-related
environmental impacts for businesses, municipalities, and residents.
In January 1998, the New York State Public Service Commission (PSC)
designated NYSERDA the administrator of the public benefits program. This program,
known as New York Energy $martK, supports activities that are not expected to be
adequately carried out during the transition to a more competitive electricity market.
Activities supported by the public benefits program include energy efficiency
deployment, low-income assistance programs, research and development, and
environmental monitoring and protection. A total of $174 million was made available to
NYSERDA to develop and implement a variety of programs for the initial three-year
period from July 1, 1998 to June 30, 2001. In January 2001, the PSC extended and
increased the amount of public benefits program funding to approximately $150 million
per year through June 2006. The extended programs continue to address market barriers,
but will also expand peak load reduction and price-sensitive load initiatives, including
non-electric energy efficiency measures to promote fuel-switching, and expand the
statewide coverage of the programs.
NYSERDA’s research, development, and demonstration (RD&D) program
focuses on developing high-value-added energy and environmental products, addressing
energy-related environmental concerns when there is insufficient private-sector incentive
to do so, assisting customers, and providing objective technical analysis. The program
has five main areas: Industry, Buildings, Energy Resources, Environment, and
Transportation and Power Systems. Funding for this program reaches about $16.5
million per year and funds approximately 150 projects each year with businesses,
municipalities, institutions, and universities. Since 1991, NYSERDA’s RD&D program
has stimulated new product sales of $200 million for New York companies, created 1,174
permanent jobs, developed 141 new products, processes, or services for commercial use,
and leveraged nearly $2 of funding from outside sources for every dollar invested by
NYSERDA.
2-20
NYSERDA’s energy efficiency deployment program complements its RD&D
program by aiding in the commercialization of new technologies and encouraging their
use. The program targets five areas: small business, institutions and government,
residential, low-income, and vehicle fleets. It focuses on stimulating markets and
promoting competition for energy-efficient and environmentally-clean products,
removing barriers to market adoption of proven technologies and practices, and building
manufacturing and sales infrastructure to make energy efficiency products available to
customers. Value-added services and technical economic assistance are provided to help
small customers stay competitive. Since 1991, NYSERDA's programs have saved $277
million in energy and other costs for New York's businesses, municipalities, and
institutions.
NYSERDA’s newly created Economic Development Program strives to improve
the State’s business climate through strategic partnerships and product development. The
Economic Development Program provides assistance to companies concerned with
energy and environmental efficiency, innovative product development, and product
commercialization to help these companies create, enhance, and retain jobs. Using both
internal and external sources of funding to enhance its efforts, NYSERDA works to forge
strategic partnerships with a variety of organizations (both public and private) to be able
to provide expertise in marketing, financing, and business development to its
constituents. The types of assistance pursued by NYSERDA include federal and State
grants, loans, bond financing, venture capital, and technical services.
In August 2001, NYSERDA announced the creation of the Saratoga Energy
Technology Park, specifically devoted to promoting the development of new, clean
energy technologies. NYSERDA, working jointly with the University at Albany and the
Saratoga Economic Development Corporation (SEDC), hopes to attract between 1,000
and 1,500 jobs to the Capital Region when emerging, environmentally-friendly energy
companies take advantage of the park’s resources.
NYSERDA is forging other partnerships with many public and private
organizations to work on the following projects:
1. Promoting NYSERDA's core programs to support the State’s revitalization effortsin the Niagara Falls area. This has led to the investment of $4 million in variousenergy and environmental programs and projects.
2. Working to establish partnerships with local businesses, government, anddevelopers to build wind farms in Central New York. Over 40 MW of wind

2-21
power generating capacity has been installed in the Towns of Fenner andMadison.
3. Examining the potential development of Power Quality Parks. Such parks, ifdeveloped, will feature industrial sites with reliable power sources to help attractnew businesses.
4. Working with the Rensselaer Polytechnic Institute (RPI) and its Venture B SeriesProgram to find venture capital for businesses. NYSERDA is also a member ofthe Tech Valley Angel Network (TVAN) as a partner in this program. NYSERDA serves as a link between entrepreneurs and investors in northeasternNew York to facilitate access to venture capital.
Department of Public Service
Staff of the Department of Public Service (DPS) assist businesses in learning
about economic development programs, resolving disputes between businesses and
utilities about economic development issues, working with State and local government in
retaining, attracting and expanding businesses, and participating in the Power For Jobs
program. DPS staff have participated with parties in several recent utility restructuring,
rate, and merger proceedings to improve the utilities’ ability to assist in economic
development. For example, as a result of the PSC’s decision in a recent Central Hudson
Gas & Electric Corporation case, a collaborative effort among the utility, DPS, Empire
State Development, State and local governments, and other interested parties has been
initiated to design new, more effective economic development programs, including
electricity discounts, suited to the needs of the utility’s customers.
The PSC’s electricity cost and pricing policies are changing to reflect the
restructuring of investor-owned utilities, the transition to competitive markets, and the
need for more service unbundling. These policies are pointing in the long-term to
separating the delivery function from commodity sales. Such policies will be especially
beneficial to businesses by reducing delivery costs of electricity, and facilitating the
ability of businesses to shop for electricity. During the transition to competitive markets,
there is a continuing need to maintain economic development incentives and discounts
that will ensure that the State will have the ability to retain, expand, and attract
businesses.
2-22
Utility Flexible Rates and Fixed Discount Programs
Since 1983, New York’s electric and gas utilities have encouraged economic
growth by filing tariffs with the PSC that provide discounted rates to qualified
commercial and industrial customers, including incentive rates for businesses that are
certified as eligible for Economic Development Zone (Empire Zones) benefits pursuant to
State law. Utilities have designed economic development programs to suit the needs of
their particular regions by offering varying terms and levels of discounts from the
standard tariff rates. Among other things, such programs include: Flexible Rates,
designed to allow individually negotiated contracts with customers who have competitive
energy alternatives to standard utility service; Business Incentive Rates, designed to
bring in new businesses or expand existing commercial or industrial load in a utility’s
service territory; Economic Revitalization rate programs, designed to retain customers by
helping them regain economic competitiveness; and Economic Development (Empire
Zone) Rates, designed to attract businesses to locate in specially designated areas.
The Empire Zones Program was developed to encourage economic development,
with a mission to assist in the revitalization of economically distressed geographic
regions within New York characterized by “persistent and pervasive poverty, high
unemployment, limited new job creation, a dependence on public assistance income,
dilapidated and abandoned industrial and commercial facilities, and shrinking tax base.”
Currently, there are 62 Empire Zones in New York. Among the incentives applicable to
businesses locating within these zones are capital investment credits, wage tax credits,
sales and local tax relief, and low-cost power contractual agreements with utilities,
usually with ten-year terms. Certified businesses within the State’s Empire Zones are
eligible to receive significant tax credits and other benefits valued at more than $213
million annually, when fully effective. More than 3,800 businesses participated in the
program in 2000, creating more than 30,000 new full-time jobs and investing more than
$670 million of private capital in Empire Zone communities.
The discount programs offered by utilities are designed to encourage business
retention and expansion, as well as to encourage new businesses to expand or locate in
economically depressed areas, while preventing rate increases for remaining customers
that might otherwise be necessary if the participating customers were to leave the utility
system. Utility economic development programs provide an estimated $85 million in
discounts annually. In today’s newly competitive era, however, the issue of how to
appropriately fund such electricity discounts needs to be considered.

4 NYS Department of Labor Employment Review, December 1996, p. 7.
2-23
To that end, in the recent Central Hudson Gas and Electric Corporation, Niagara
Mohawk Power Corporation, and New York State Electric and Gas Corporation rate
proceedings, funding of these economic development programs has been discussed. It
has been determined that these activities should be financed through the development of
an Economic Development Fund. This will enable each utility to continue its
commitment to economic development activities in their respective service areas. Empire
State Development is working with other economic development professionals and the
utility staffs to ensure the programs developed provide for continuing and expanding
appropriate economic development programs. These economic development programs
will help attract and retain business in New York. Benefits will flow to utilities in terms
of increased sales and enhanced revenues, which in turn will help keep rates down for all
ratepayers.
Energy Programs and Policies to Promote Economic Development
Between 1985 and 1994, New York lost more than 342,634 (or nearly 26%) of its
manufacturing jobs.4 The State, however, has been able to add more than 802,000
private sector jobs since 1995. These data highlight the importance of job growth and
retention in the State’s industries that drive economic activity, including manufacturing
and other higher-wage industries that export services from the State. Industries that drive
economic activity, typically large, higher-wage industrial and commercial firms, support a
variety of other industries that provide intermediate inputs to production of goods and
services, as well as numerous service industries and retail establishments. The State has
taken a number of steps to attract business, including reducing State taxes, providing
incentives to municipalities to lower local taxes, reducing workers' compensation costs,
and modifying or removing regulations that hinder business productivity and economic
growth.
The cost of energy, however, remains an obstacle to overcome in New York’s
efforts to retain, expand, and attract businesses. New York's success in working with
businesses that could relocate to other states frequently depends on the availability of
discounted, low-cost energy and incentives offered through various State and local
government and utility-sponsored programs. Even though a competitive electricity
market is expected to result in lower prices, New York's energy prices may remain
somewhat higher than those of most other states in the short-term. Therefore, effective
5 The REMI Economic and Demographic Forecasting Model, developed by Regional Economic Models, Inc. of
Amherst, MA., is a 53-sector dynamic structural model of the New York State economy that is linked to a U.S.economic model. The model simulates inter-industry transactions and trading flows into and out of the State, based onthe costs of doing business. The relative cost of doing business is built up for each industry based on wages, costs ofintermediate inputs, fuel costs, and taxes.
2-24
energy-related economic development programs for businesses will continue to be
necessary to help preserve and expand the State's economic base.
ECONOMIC DEVELOPMENT POTENTIAL OF REDUCING ENERGY COSTS
Reducing energy costs will make the State’s businesses and industries more
competitive with other states and regions of the country. In addition, lower energy costs
will position New York to attract new businesses and retain and expand existing
businesses. Moreover, lower energy costs will increase business profitability and
consumer purchasing power, which, in turn, will stimulate business investment and
consumer spending and contribute to continued job growth. An economic analysis, using
the REMI statewide economic model, demonstrates the importance of energy cost
reductions as a means to stimulate economic growth.5 Important indicators of economic
development potential include: gross output, or total sales value of goods and services
produced, which is an indicator of total economic activity in the State; personal income,
which measures the aggregate wages, salaries, and proprietors’ income earned by in-State
workers; and employment, which is the number of in-State jobs. The analysis reflects the
expected effects on economic activity of increased business profits and consumer
spending that result from lower energy costs. The analysis estimates that a permanent
energy price reduction of $100 million per year would stimulate, over a ten-year period,
the development of approximately 1,600 jobs in New York, increase the State’s gross
output of goods and services by about $119 million, and increase personal income by
about $105 million. Incremental output of goods and services, personal income, and jobs
created as a result of lower energy prices would generally be sustained over time because
the incremental business profits and consumer purchasing power would be available in
each subsequent year, resulting in a continued higher level of business investment and
consumer spending.
2-25
Figure 1
EMPLOYMENT IMPACTS OF ENERGY EFFICIENCY IMPROVEMENTS
While the State is the fourth-largest energy user among all states, only an
estimated 11% of New York's total end-use energy requirements are met from indigenous
resources, of which 55% is hydroelectric power and 41% is from bio-fuels. In 2000, New
Yorkers spent $38 billion on energy, consisting of $15.7 billion for electricity, $5.9
billion for natural gas, $16.3 billion for petroleum products, and $0.1 billion for coal.
Petroleum products include distillate and residual fuel oil, motor gasoline, aviation fuels,
kerosene, and propane.
Because New York imports most of its primary energy supplies from other states
and foreign sources, a large portion of the $38 billion annual energy expenditure flows
out of the State to pay for imported energy. While imported energy supplies contribute to
some economic activity within the State, investment in cost-effective energy efficiency
reduces economic leakage, as more dollars are retained in the State, thereby increasing
discretionary income. In addition to the jobs created by in-State spending of energy
savings, jobs are created by the purchase and installation of new equipment, to the extent
that the equipment or its components are manufactured in New York, purchased from in-
State suppliers, and installed by in-State labor. The precise number of jobs created is site-
and industry-specific and is sensitive to business and consumer spending patterns,
payback periods, and useful life-spans of the technologies installed.
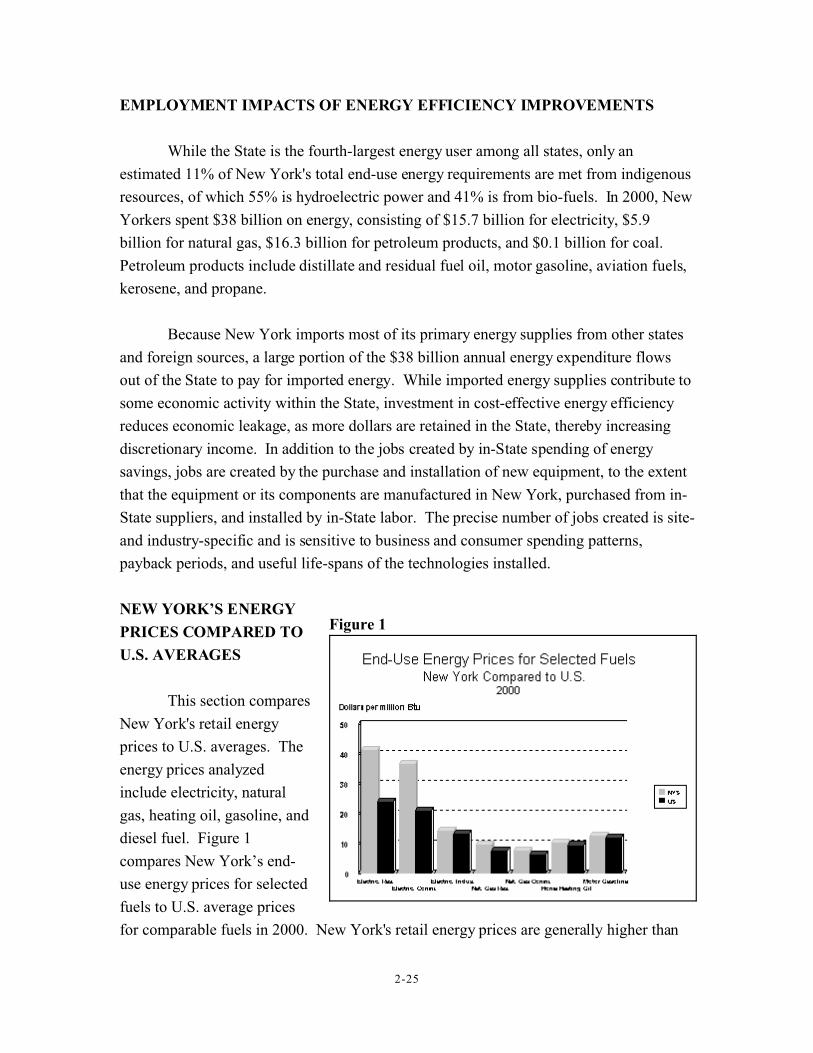
NEW YORK’S ENERGY
PRICES COMPARED TO
U.S. AVERAGES
This section compares
New York's retail energy
prices to U.S. averages. The
energy prices analyzed
include electricity, natural
gas, heating oil, gasoline, and
diesel fuel. Figure 1
compares New York’s end-
use energy prices for selected
fuels to U.S. average prices
for comparable fuels in 2000. New York's retail energy prices are generally higher than

2-26
Figure 2
national average prices for comparable fuels and customer sectors. Figure 2 shows, for
each fuel, the change in price from 1996 to 2000 for New York compared to the U.S.
Since 1996,
improvements in the price
differential between New York
and U.S. prices have been
observed for industrial
electricity, residential natural
gas, and commercial natural
gas. In contrast, the
differentials between New
York and U.S. prices in 2000
were somewhat greater than in
1996 for residential electricity,
commercial electricity, home
heating oil, and motor
gasoline. It should be
recognized that use of year 2000 prices for comparative purposes presents an incomplete
picture of energy prices because of the unusual short-term run-up in natural gas prices
that year, which have since returned to lower levels. Year 2000 prices, however, are the
most recent available and are used in the comparisons that follow.
NEW YORK’S ENERGY PRICES COMPARED TO SELECTED STATES
This section compares New York's retail energy prices to prices paid in other
states that compete with New York in attracting business. To the extent possible, the
analysis includes component analyses of retail energy prices for the eleven states studied.
These states include two New England states (Massachusetts and Connecticut), two Mid-
Atlantic states (Pennsylvania and New Jersey), one Midwestern state (Ohio), three
Southeastern states (North Carolina, South Carolina, and Florida), and one South Central
state (Texas). Two West Coast states (California and Washington) are also included to
present a wider perspective.

2-27
Figure 3
This analysis of the various fuel types considers property taxes and State and
federal income taxes, where applicable, as components of distribution costs. Data are not
available to estimate the specific amounts of these types of taxes for electricity, natural
gas, and petroleum products. As a result, the tax components shown for these fuels
reflect only taxes that are easily isolated and are specifically added to the retail price of
fuel, such as the Gross Receipts Tax, franchise tax, Petroleum Business Tax, excise tax,
and state sales tax. Local sales tax is not included due to the variability between states
and localities within states.
New York has historically taxed energy products and services to a greater degree
than other states. In an effort to reduce energy costs, the State has initiated the phase-out
of the Gross Receipts Tax (GRT) on energy and telecommunication utilities, as well as
the sales tax on transmission and delivery of electricity and natural gas for industrial and
commercial consumers. When fully effective on January 1, 2005, elimination of the GRT
is expected to save energy users approximately $330 million per year, and it is anticipated
that the sales tax phase-out will save them approximately $150 million per year when
fully effective on January 1, 2004. Phase-out of the GRT, collected by utilities but paid
by both businesses and consumers, was initiated in 1998 and will continue in stages,
ultimately resulting in total elimination by the end of 2004. Also, the Petroleum Business
Tax (PBT), a business tax surcharge, will be reduced on oil used by commercial and
industrial customers by up to eight cents per gallon. The PBT was, in essence, a “tax on a
tax” that added approximately 15% to the amount of GRT collected from all customers.
Effective in 1997, the net
PBT on commercial
heating and railroad fuel
was reduced, and the
manufacturing fuel oil
PBT was eliminated.
Also, the net PBT on
diesel fuel was reduced.
2-28
Electricity
Figure 3 compares New York’s average electricity price in 2000 with the average
electricity prices in eleven other states. With the advent of restructuring, data to perform
a complete analysis of the various components of electric prices are no longer available.
This is because certain market participants are no longer required to file data with the
Federal Energy Regulatory Commission. Nevertheless, the primary factors that
contribute to New York’s high electricity prices relative to other states are well known.
As documented in the 1998 State Energy Plan, these factors include: higher State and
local taxes on electricity and on equipment and property used to generate, transmit, and
distribute electricity; the cost of power purchased by utilities under contract (as mandated
by State and federal laws); the costs associated with two large nuclear projects; and the
higher costs, in wages and operations and maintenance, of doing business in New York.
The State has taken steps to address each of these factors:
C In addition to the State tax reform initiatives described earlier, the new owners ofdivested utility generating plants have in many cases negotiated reductions inlocal property taxes. These lower tax levels can be expected to be passed along tocustomers in the form of lower wholesale prices, as generators lower the pricescharged for their output.
C Since the repeal in 1992 of the mandatory minimum six-cent per kilowatt-hourpurchase price for power produced by cogenerators and other qualifying facilities,utilities have generally lowered the costs for purchased power to market-basedlevels. In addition, some utilities have been successful in renegotiating long-term power purchase contracts to obtain a lower price. Still, the legacy of the six-centlaw and contract prices based on administratively-determined long-run avoidedcosts continue to be a major cost driver in New York’s electricity prices.
C The State has been more successful in reducing the costs associated with theShoreham and Nine Mile Point 2 nuclear plants. LIPA, as part of the takeover ofthe electric system on Long Island, refinanced the debt associated with Shoreham,decreasing rates significantly on Long Island. More recently, nearly all of theremaining debt associated with the Nine Mile Point 2 plant has been eliminated inthe process of the sale of that plant to an independent firm, Constellation Energy.
C Finally, after more than a decade of price caps and other incentive plans to reducerates, utilities have significantly reduced wage, operating and maintenance costs.
6 In a study presented to the New York ISO, the ISO’s market advisor concluded that the increase in natural
gas and oil prices and the sustained outage of the Indian Point 2 nuclear plant in Buchanan were the primary
factors in the run-up in wholesale electricity prices in 2000 (New York Market Advisor Annual Report on
the New York Electric Markets for Calendar Year 2000).
2-29
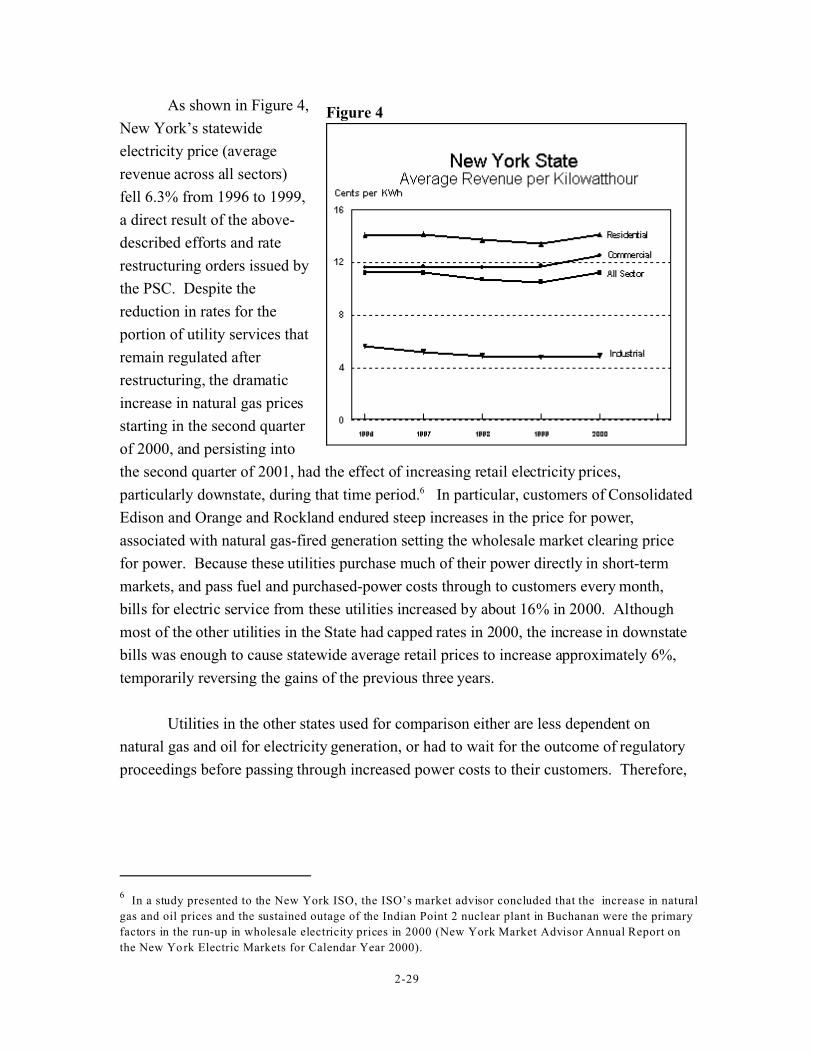
Figure 4As shown in Figure 4,
New York’s statewide
electricity price (average
revenue across all sectors)
fell 6.3% from 1996 to 1999,
a direct result of the above-
described efforts and rate
restructuring orders issued by
the PSC. Despite the
reduction in rates for the
portion of utility services that
remain regulated after
restructuring, the dramatic
increase in natural gas prices
starting in the second quarter
of 2000, and persisting into
the second quarter of 2001, had the effect of increasing retail electricity prices,
particularly downstate, during that time period.6 In particular, customers of Consolidated
Edison and Orange and Rockland endured steep increases in the price for power,
associated with natural gas-fired generation setting the wholesale market clearing price
for power. Because these utilities purchase much of their power directly in short-term
markets, and pass fuel and purchased-power costs through to customers every month,
bills for electric service from these utilities increased by about 16% in 2000. Although
most of the other utilities in the State had capped rates in 2000, the increase in downstate
bills was enough to cause statewide average retail prices to increase approximately 6%,
temporarily reversing the gains of the previous three years.
Utilities in the other states used for comparison either are less dependent on
natural gas and oil for electricity generation, or had to wait for the outcome of regulatory
proceedings before passing through increased power costs to their customers. Therefore,

7 A comparison of New York’s average price in the first seven months of 2001 to that of MA, PA, FL, TX
and CA shows the difference in prices to be much reduced from what it was in 2000, as utilities in these other
states gained approval to increase retail rates in response to increased power costs.
8 For example, the October 2001 bill for the typical Consolidated Edison residential customer was $50.87 or
17.0 cents per kWh, compared to $56.88 or 19.0 cents per kWh in October 2000.
2-30
the gap between New York electric prices and the other states compared widened in
2000.7
Since the second quarter of 2001, natural gas prices have dropped to previous
levels. Electric prices have also declined, and the most recent bills for Consolidated
Edison and Orange and Rockland customers have moderated significantly from 2000
levels.8 In addition, in 2001, the PSC significantly lowered distribution rates for
customers of Consolidated Edison, Rochester Gas & Electric, and Central Hudson Gas
and Electric. Niagara Mohawk’s annual distribution revenues were reduced by $152
million (largely offsetting earlier approved increases in commodity prices) with the
approval of its merger with National Grid and New York State Electric and Gas’
distribution revenues were reduced by $205 million with the approval of its merger with
Rochester Gas & Electric. The trend in lower distribution rates, with decreasing, but
perhaps volatile, commodity prices, is expected to continue in the future (see the
Electricity Resource Assessment).
Residential Natural Gas
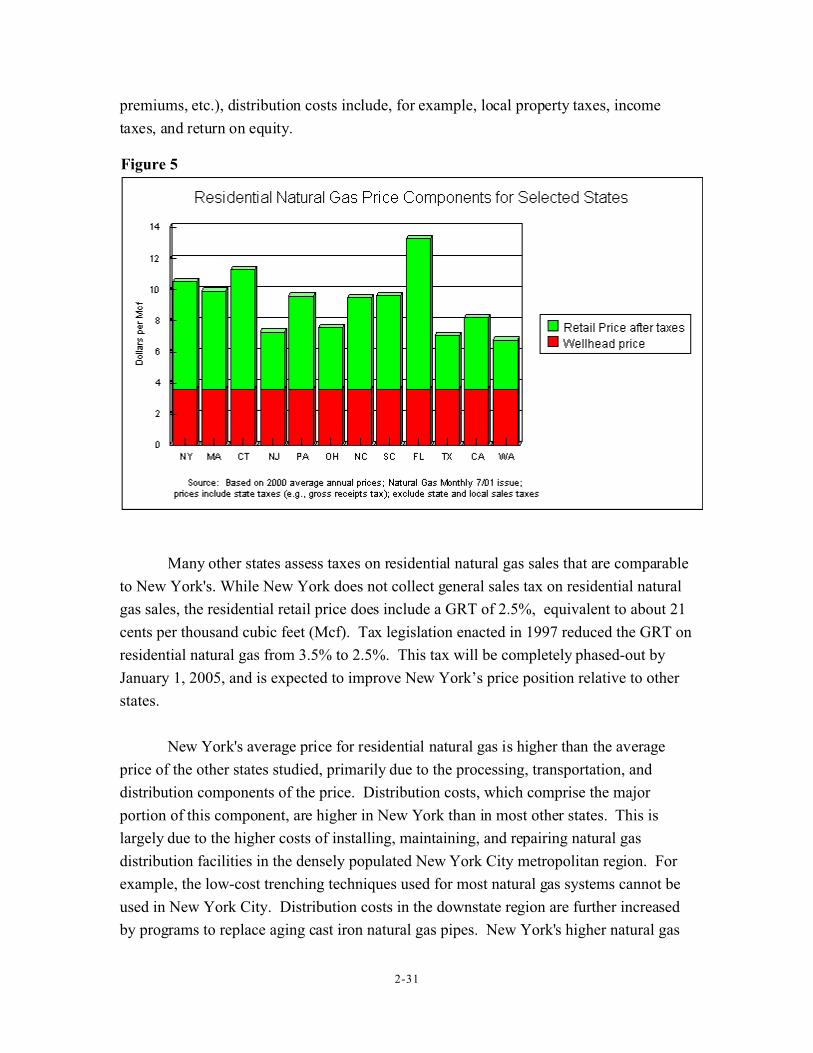
New York's average natural gas price, after taxes, for residential customers in
2000 was $10.51, lower than Connecticut and Florida but higher than the other states
studied, as shown in Figure 5. The wellhead price component for natural gas is identical
for all states because this price is determined by North American market conditions rather
than by actual production costs.
The largest price component is “processing, transportation, and distribution.”
Processing refers to any cleaning or liquid removal that occurs after the natural gas is
removed from the wellhead. Transportation refers to moving the natural gas from the
wellhead to the entry point of the local distribution carrier’s network. Distribution refers
to moving the natural gas through the local distribution carrier’s network and delivering
the product to end-users. Besides the direct costs of installing, maintaining, and repairing
the natural gas distribution system itself (e.g., materials, wages, workers’ compensation
2-31
Figure 5
premiums, etc.), distribution costs include, for example, local property taxes, income
taxes, and return on equity.
Many other states assess taxes on residential natural gas sales that are comparable
to New York's. While New York does not collect general sales tax on residential natural
gas sales, the residential retail price does include a GRT of 2.5%, equivalent to about 21
cents per thousand cubic feet (Mcf). Tax legislation enacted in 1997 reduced the GRT on
residential natural gas from 3.5% to 2.5%. This tax will be completely phased-out by
January 1, 2005, and is expected to improve New York’s price position relative to other
states.
New York's average price for residential natural gas is higher than the average
price of the other states studied, primarily due to the processing, transportation, and
distribution components of the price. Distribution costs, which comprise the major
portion of this component, are higher in New York than in most other states. This is
largely due to the higher costs of installing, maintaining, and repairing natural gas
distribution facilities in the densely populated New York City metropolitan region. For
example, the low-cost trenching techniques used for most natural gas systems cannot be
used in New York City. Distribution costs in the downstate region are further increased
by programs to replace aging cast iron natural gas pipes. New York's higher natural gas
2-32
Figure 6
price compared to states to its south and west is also partially due to the State’s location
near the end of the interstate pipeline distribution system.
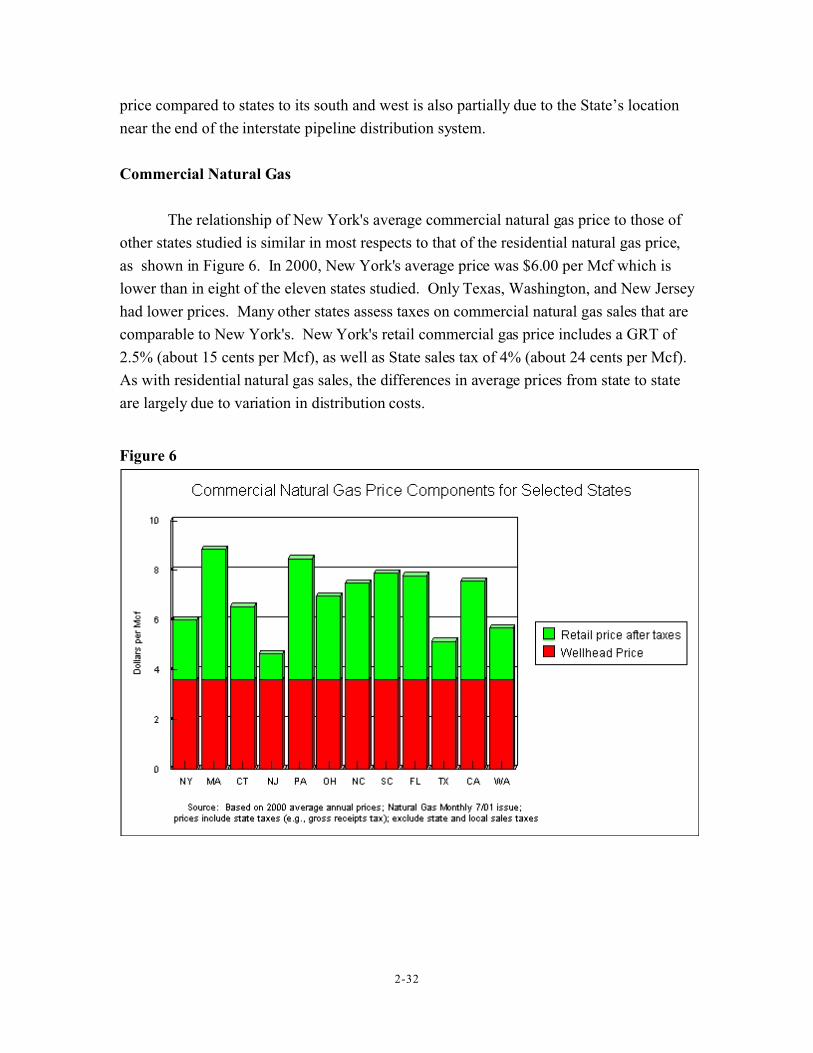
Commercial Natural Gas
The relationship of New York's average commercial natural gas price to those of
other states studied is similar in most respects to that of the residential natural gas price,
as shown in Figure 6. In 2000, New York's average price was $6.00 per Mcf which is
lower than in eight of the eleven states studied. Only Texas, Washington, and New Jersey
had lower prices. Many other states assess taxes on commercial natural gas sales that are
comparable to New York's. New York's retail commercial gas price includes a GRT of
2.5% (about 15 cents per Mcf), as well as State sales tax of 4% (about 24 cents per Mcf).
As with residential natural gas sales, the differences in average prices from state to state
are largely due to variation in distribution costs.
2-33
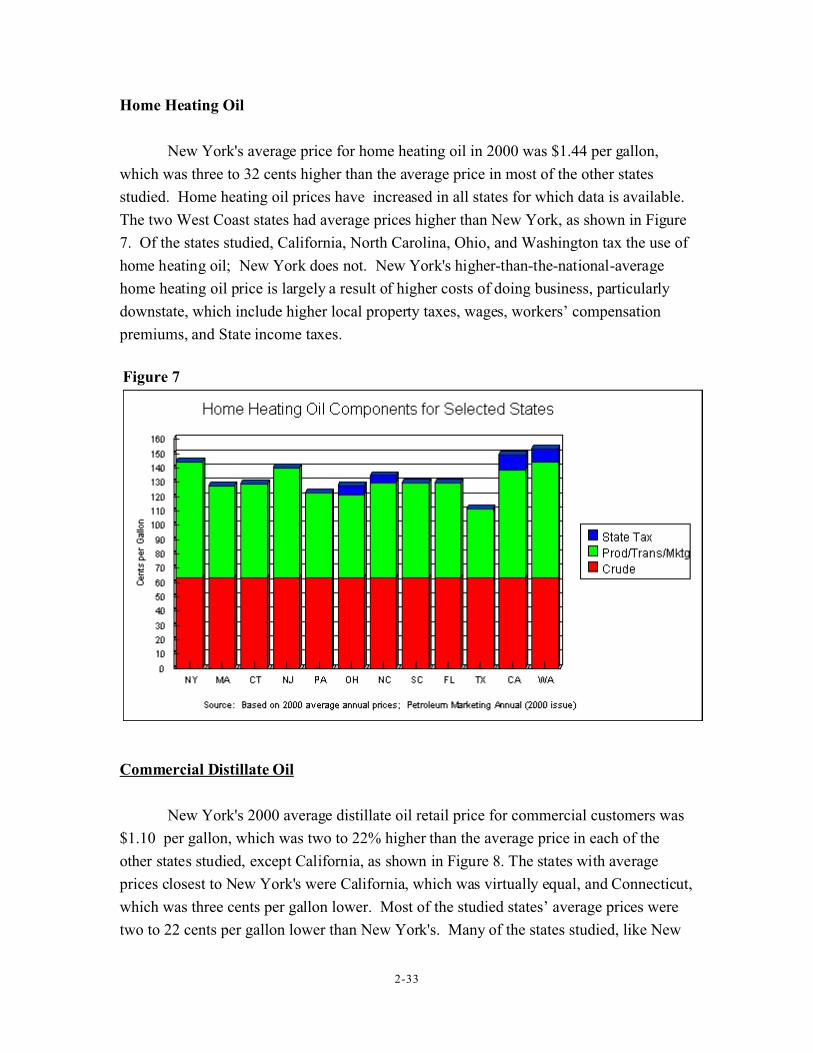
Figure 7
Home Heating Oil
New York's average price for home heating oil in 2000 was $1.44 per gallon,
which was three to 32 cents higher than the average price in most of the other states
studied. Home heating oil prices have increased in all states for which data is available.
The two West Coast states had average prices higher than New York, as shown in Figure
7. Of the states studied, California, North Carolina, Ohio, and Washington tax the use of
home heating oil; New York does not. New York's higher-than-the-national-average
home heating oil price is largely a result of higher costs of doing business, particularly
downstate, which include higher local property taxes, wages, workers’ compensation
premiums, and State income taxes.
Commercial Distillate Oil
New York's 2000 average distillate oil retail price for commercial customers was
$1.10 per gallon, which was two to 22% higher than the average price in each of the
other states studied, except California, as shown in Figure 8. The states with average
prices closest to New York's were California, which was virtually equal, and Connecticut,
which was three cents per gallon lower. Most of the studied states’ average prices were
two to 22 cents per gallon lower than New York's. Many of the states studied, like New

2-34
Figure 8
York, collect some sales tax on commercial distillate oil, but no other state collects a PBT
or other oil tax comparable to New York's. The PBT increases New York's average
commercial distillate oil price by approximately 7.3 cents per gallon.
Gasoline
New York's 2000 average gasoline price for all grades of gasoline was $1.56 per
gallon (excluding local sales taxes), as shown in Figure 9. This price was higher than that
in seven of the states studied, but it was lower than Connecticut, California, and
Washington. Connecticut's average price was 10 cents per gallon higher than New
York's, due primarily to higher state taxes. Washington's average price was higher than
New York's, due primarily to the longer transport distance to retail outlets. Average
gasoline prices in New Jersey and South Carolina were lower than in New York as a
result of lower state taxes. Average gasoline prices in the remaining states studied were
between six and 18 cents per gallon less than in New York.

2-35
Figure 9
Gasoline prices vary from state to state largely as a result of differences in state
tax policies and regional differences in costs of doing business. Refiner acquisition costs
of crude oil are identical for all states because crude oil commodity prices are determined
by world markets. Similarly, the federal gasoline tax of 18.4 cents per gallon is the same
for all states. Most of the states studied, with the exception of Connecticut, New Jersey,
and South Carolina, impose a combination of excise or other taxes on gasoline. The
combined effect of these taxes on retail price is comparable to that of New York's excise
tax and PBT. For example, New York's excise tax and PBT are 22 cents per gallon;
similar state taxes in Massachusetts, Pennsylvania, and Ohio are 21, 26, and 22 cents,
respectively. New York's average price appears to be higher than those of the other states
studied largely due to the fact that it collects general State sales tax on gasoline. Of the
study group states, New York and California are the only states to assess a sales tax on
gasoline.
Diesel Fuel
As shown in Figure 10, New York's 2000 average price for diesel fuel was $1.63
per gallon (excluding local sales tax). This price was higher than that in many of the
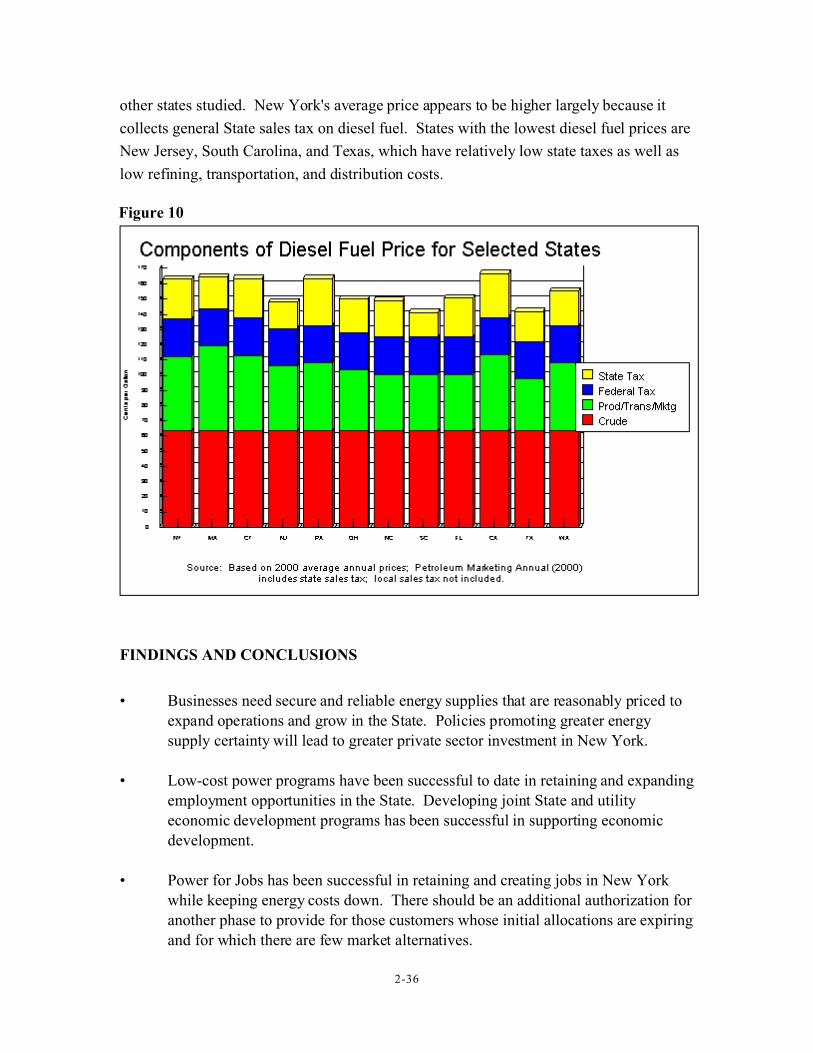
2-36
Figure 10
other states studied. New York's average price appears to be higher largely because it
collects general State sales tax on diesel fuel. States with the lowest diesel fuel prices are
New Jersey, South Carolina, and Texas, which have relatively low state taxes as well as
low refining, transportation, and distribution costs.
FINDINGS AND CONCLUSIONS
• Businesses need secure and reliable energy supplies that are reasonably priced toexpand operations and grow in the State. Policies promoting greater energysupply certainty will lead to greater private sector investment in New York.
• Low-cost power programs have been successful to date in retaining and expanding
employment opportunities in the State. Developing joint State and utilityeconomic development programs has been successful in supporting economicdevelopment.
• Power for Jobs has been successful in retaining and creating jobs in New Yorkwhile keeping energy costs down. There should be an additional authorization foranother phase to provide for those customers whose initial allocations are expiringand for which there are few market alternatives.

2-37
• Offering electricity discounts as a means of retaining or attracting jobs is animportant economic development tool.
• Efforts should continue to be made to forge State and private businesspartnerships to grow New York’s economy in an environmentally-sound manner.
• Energy prices need to be brought more in-line with other states to compete moreeffectively for economic opportunities.
Related Documents