Every year, nations collect and publish informa- tion related to their domestic energy use and their associated GHG emissions. This information is also submitted to international organizations, such as the UN, the International Energy Agency (IEA), and the International Panel on Climate Change (IPCC), which utilize these data to report estimates of national and global energy usage and GHG emissions. Private organizations, such as BP, along with national govern- mental organizations, such as the US Department of Energy, also collect and publish international energy and emission data. Recently, GHG emission inven- tories have become important in domestic and inter- national policy settings owing to IPCC negotiations, and many states have enacted policies designed to reduce national energy usage and GHG emissions, since it is usually the main GHG contributor and statistics from this sector are readily available with a comparatively low level of uncertainty [1] . Non-IPCC reports provide an opportunity for independent veri- fication of the data considered in climate negotiations and climate projections. However, the methods and reported data from these sources differ in important ways from IPCC standards as well as among differ- ent datasets. These differences are often not acknowl- edged; however, assuming that the data reported are fungible could lead to misleading comparisons of energy use as well as contradictory results between datasets. These unmentioned uncertainties have the potential to undermine policy goals and scientific study conclusions if uncertainties and differences are not adequately taken into consideration. This review will identify and analyze differences in energy and carbon reports to improve the use of energy and emissions data. Methods In this review, data were collected from four promi- nent international energy statistics datasets (Table 1) , referred to throughout this article as BP (2010) [2] , US Energy Information Administration (EIA) (2010) [101] , IEA (2010) [3,4] and UN (2010) [5,6] . For carbon emission inventories, five datasets that make use of these energy reports are considered (Table 2) , referred to throughout this review as EIA (2010) [101] , the Carbon Dioxide Information Analysis Center Carbon Management (2011) 2(2), 189–205 Energy and CO 2 emission data uncertainties Jordan Macknick † There can be substantial differences in the estimates of global and national primary energy statistics and CO 2 emission inventories that are published annually by organizations that are independent of the International Panel on Climate Change. This review analyzes the sources of discrepancies from reports published by international organizations, government agencies and private companies that are commonly referenced in analyses of primary energy statistics and CO 2 emissions. National and global estimates of CO 2 emissions from fossil fuel combustion are based directly on estimates of primary energy use, which varied by 9.2% (43 EJ) globally for the year 2007. The resulting CO 2 emissions from fossil fuel combustion varied by 2.7% (786 MtCO 2 ) for the same year. Depending on which data sources are used, national trends in energy intensity and carbon intensity may appear to be increasing or decreasing. This review identifies and compares the assumptions of the major energy statistics and CO 2 emissions estimates to facilitate more comprehensive and consistent comparisons and analyses of the most recent published data. REVIEW † 3218 W. 27th Avenue, Denver, CO 80211, USA; E-mail: [email protected] future science group 189 ISSN 1758-3004 10.4155/CMT.11.10 © 2011 Future Science Ltd For reprint orders, please contact [email protected]

Welcome message from author
This document is posted to help you gain knowledge. Please leave a comment to let me know what you think about it! Share it to your friends and learn new things together.
Transcript

Every year, nations collect and publish informa-tion related to their domestic energy use and their associated GHG emissions. This information is also submitted to international organizations, such as the UN, the International Energy Agency (IEA), and the International Panel on Climate Change (IPCC), which utilize these data to report estimates of national and global energy usage and GHG emissions. Private organizations, such as BP, along with national govern-mental organizations, such as the US Department of Energy, also collect and publish international energy and emission data. Recently, GHG emission inven-tories have become important in domestic and inter-national policy settings owing to IPCC negotiations, and many states have enacted policies designed to reduce national energy usage and GHG emissions, since it is usually the main GHG contributor and statistics from this sector are readily available with a comparatively low level of uncertainty [1]. Non-IPCC reports provide an opportunity for independent veri-fication of the data considered in climate negotiations and climate projections. However, the methods and reported data from these sources differ in important
ways from IPCC standards as well as among differ-ent datasets. These differences are often not acknowl-edged; however, assuming that the data reported are fungible could lead to misleading comparisons of energy use as well as contradictory results between datasets. These unmentioned uncertainties have the potential to undermine policy goals and scientific study conclusions if uncertainties and differences are not adequately taken into consideration. This review will identify and analyze differences in energy and carbon reports to improve the use of energy and emissions data.
Methods
In this review, data were collected from four promi-nent international energy statistics datasets (Table 1), referred to throughout this article as BP (2010) [2], US Energy Information Administration (EIA) (2010) [101],
IEA (2010) [3,4] and UN (2010) [5,6]. For carbon emission inventories, five datasets that make use of these energy reports are considered (Table 2), referred to throughout this review as EIA (2010) [101], the Carbon Dioxide Information Analysis Center
Carbon Management (2011) 2(2), 189–205
Energy and CO2 emission data uncertainties
Jordan Macknick†
There can be substantial differences in the estimates of global and national primary energy statistics and CO2 emission inventories that are published annually by organizations that are independent of the International Panel on Climate Change. This review analyzes the sources of discrepancies from reports published by international organizations, government agencies and private companies that are commonly referenced in analyses of primary energy statistics and CO2 emissions. National and global estimates of CO2 emissions from fossil fuel combustion are based directly on estimates of primary energy use, which varied by 9.2% (43 EJ) globally for the year 2007. The resulting CO2 emissions from fossil fuel combustion varied by 2.7% (786 MtCO2) for the same year. Depending on which data sources are used, national trends in energy intensity and carbon intensity may appear to be increasing or decreasing. This review identifies and compares the assumptions of the major energy statistics and CO2 emissions estimates to facilitate more comprehensive and consistent comparisons and analyses of the most recent published data.
REVIEW
†3218 W. 27th Avenue, Denver, CO 80211, USA; E-mail: [email protected]
future science group 189ISSN 1758-300410.4155/CMT.11.10 © 2011 Future Science Ltd
For reprint orders, please contact [email protected]

(CDIAC) (2010) [7,8], the emissions database for global atmospheric research system (EDGAR) (2010) [102], IEA-R and IEA-S [9]. These reports were selected owing to their frequent use in academic and policy studies. Data were not altered except for unit conversions.
The energy data statistics considered here refer to primary energy consumption. Primary energy is the energy embodied in fossil fuels and biomass before undergoing manmade transformations, such as to elec-tricity [10]. Primary energy ‘consumption,’ (and the IEA equivalent total primary energy supply), is determined using the concept of apparent consumption.
CO2 emissions include emissions from fuel combus-
tion (also termed energy-related emissions), as well as emissions from the flaring of natural gas, cement production and land-use change.
Data were collected from the most recent published reports and consolidated into a harmonization data-base [103]. The publicly available harmonization database provides the capability of utilizing consistent conver-sion assumptions across datasets to facilitate meaningful comparisons. Assumptions that may be altered relate to primary energy equivalences, boundary conditions, data sources for nonfuel combustion sources of carbon emissions, and units.
Comparability challenges
Comparisons among organizations are complicated by differences in the energy and carbon emission categories published. Considering fossil fuels, UN (2010) reports aggregated fossil fuel energy consumption in terms of solids, liquids and gases, whereas BP (2010), EIA (2010), and IEA (2010) aggregate fossil fuels in terms of coal, petroleum and natural gas. For this review, the solids, liquids and gases of UN (2010) are considered equivalent to the coal, petroleum and natural gas categories, respectively, of the other orga-nizations. This categorization scheme means that some solid petroleum-based products (i.e., shale oil) and gas-based liquids (i.e., natural gas liquids) are categorized differently. While these definitional differences do not necessarily lead to differences between total national and global data, the differences in fuel disaggregation complicate direct comparisons of data and affect carbon emission calculations.
Organizations also tabulate and organize published data in different fuel categories. IEA (2010) pub-lishes emissions according to the specific fuel category (e.g., coking coal, natural gas liquids and petroleum coke) and in addition gives a grand total. EIA (2010) aggregates emissions into coal, petroleum, and natural
Table 1. Overview of energy-reporting organizations and publications.
Organization Dataset
code
Publications Time period Refs
BP BP (2010) BP Statistical Review of World Energy 1965–2009 [2]
International Energy Agency IEA (2010) Energy Balances of Non-OECD CountriesEnergy Balances of OECD Countries
1971–20071960–2008
[3,4]
UN UN (2010) Energy Statistics YearbookEnergy Statistics Database
1950–2007 [5,6]
US Energy Information Administration EIA (2010) International Energy Statistics 1980–2008 [101]
OECD: Organization for Economic Co-operation and Development.
Table 2. Overview of carbon emission-reporting organizations and publications.
Organization Dataset code Publications Energy data used Time period Refs
Carbon Dioxide Information Analysis Center
CDIAC (2010) Global, Regional, and National Fossil-Fuel CO2 EmissionsCarbon Flux to the Atmosphere from Land-Use Changes
UN (2010) 1751–20071850–2005
[7,8]
European Commission, Joint Research Centre/Netherlands Environmental Assessment Agency
EDGAR (2010) Emissions Database for Global Atmospheric Research
IEA (2010) 1970–2005 [102]
International Energy Agency IEA-R (2010) CO2 Emissions from Fuel Combustion-Reference Approach
IEA (2010) 1960–2007 [9]
International Energy Agency IEA-S (2010) CO2 Emissions from Fuel Combustion-Sectoral Approach
IEA (2010) 1960–2007 [9]
US Energy Information Administration EIA (2010) International Energy Statistics EIA (2010) 1980–2008 [101]
EDGAR: Emissions database for global atmospheric research.
Carbon Management (2011) 2(2) future science group190
Review Macknick

Key terms
Primary energy: Energy embodied in
natural resources prior to undergoing
any human-made conversions or
transformations. Examples include coal,
crude oil, sunlight, wind, running rivers,
vegetation and uranium.
Apparent consumption: Equal to:
production + imports - exports -
bunkers ± stock changes. A top-down
energy accounting approach that
assumes all primary energy production
in a country is utilized domestically,
exported, utilized in ports or in
international transit, or added to
existing stocks.
Primary energy equivalence: For fuels
that produce electricity and have no
obvious calorific content (e.g., nuclear,
hydroelectric, wind and solar), as there
is with fossil fuels and biomass, a
primary energy equivalence must be
assigned to each unit of electric output.
Substitution equivalence and direct
equivalence are two methods of
assigning primary energy equivalences.
gas categories. CDIAC (2010), utilizing UN (2010) data, reports aggregated energy emissions into solids, liquids and gases. This review equates solids, liquids and gases categories with coal, petroleum and natural gas categories, while acknowledging the discrepancies discussed with energy statistics above. EDGAR (2010) aggregates emissions according to the IPCC sector emis-sion categories, which differentiate emissions accord-ing to their source category (such as transportation or energy production) and not by their fuel-type, making fuel-specific comparisons between EDGAR (2010) and the other organizations nearly impossible [11].
Differences in energy data statistics
Despite methodological differences among report-ing organizations, unadjusted aggregate global totals of primary energy use do not always appear to dif-fer greatly (Figure 1A). Unadjusted EIA (2010) and IEA (2010) estimates of total global primary energy use in 2007 differ by less than 1%, or 5 EJ. UN (2010) and BP (2010) values are 5% (26 EJ) and 9% (43 EJ) lower, respectively, than EIA (2010). However, the similarities between data sources should not be taken at face value. Real differences in global and national data between organizations are hidden beneath the aggre-gated published datasets. Using consistent assumptions across agencies highlights the discrepancies in reported primary energy use (Figure 1B). Data have been harmo-nized by considering energy only from coal, petroleum and natural gas, as well as electricity from hydroelec-tric and nuclear sources using a consistent primary energy equivalent eff iciency [12]. IEA (2010) values preharmoniza-tion were 8% (38 EJ) greater than BP (2010) data; however, posthar-monization, the two datasets’ total values are nearly identical. These values are 2% (7 EJ) and 6% (28 EJ) less than global primary energy consumption of UN (2010) and EIA (2010), respectively. BP (2010) and IEA (2010) aggregated simi-larities mask further fuel-specific differences: IEA (2010) reports petroleum consumption that is 5 EJ greater than BP (2010), yet this is offset by BP (2010) reporting 5 EJ more natural gas consumption than IEA (2010). The apparent simi-larities and revealed discrepancies among datasets are due to the differ-ent assumptions employed by each reporting organization. Important assumption differences include
differences in raw data inputs, boundary conditions, fossil fuel calorific contents and electricity conversion factors.
The raw data used to compile energy use data may often be dif-ferent among energy statistics reports [13–15,104]. UN (2010) and IEA (2010) send annual surveys to member states as the primary method of collecting data, with the IEA using UN survey results for non-IEA member nations. By con-trast, BP (2010) and EIA (2010) rely primarily on national reports and information from regional agencies. Differences in surveys and in collection sources can lead to disparities in the values of reported physical quantities of fuels (such as tonnes of coal or m3 of natural gas). For example, although BP and the EIA use similar methods to obtain natural gas consumption data, EIA (2010) reports 2008 world natural gas consumption to be 119 billion m3, or 4% greater than BP (2010). Since the EIA began collecting data in 1980, the differences between these two organizations’ values have been as high as 8%. EIA (2010) estimates total crude petroleum production (in barrels) to be 1.2% greater than BP (2010) crude production in 2007. Differences between UN (2010)
IEA (2
010)
EIA (2
010)
BP (201
0)UN (2
010)
Exa
jou
les
(EJ)
600
500
400
300
200
100
0
IEA (2
010)
EIA (2
010)
BP (201
0)UN (2
010)
Exa
jou
les
(EJ)
600
500
400
300
200
100
0
OilCoalNatural gasNuclearHydroRenewablesBiomassTotal
A B
Figure 1. 2005 global primary energy use. (A) As reported and, (B) with harmonized assumptions, including only commercial energy and utilizing a primary energy equivalence of 38.6%. EIA: US Energy Information Administration; IEA: International Energy Agency.
Energy & CO2 emission data uncertainties Review
future science group www.future-science.com 191

and IEA (2010) crude production data (in tonnes, since they do not report barrels) are less than 1% in 2007. Estimates of 2007 coal pro-duction (in tonnes) are within 0.5% for all datasets.
To convert estimates of physical quantities of fuels consumed (such as tonnes of coal or m3 of natural gas) into energy values (in joules, for example), reporting organizations utilize a conversion factor termed a calorific value. The calorific value of a fuel is the total amount of energy released during combustion for a specified unit of mass (or volume) of a particular product derived from coal, natural gas or petroleum. Reporting organizations calculate energy consumption based on the gross calorific value (GCV) or the net calorific value (NCV) of fuels. In general, EIA (2010) uses GCV, the UN (2010) and IEA (2010) use NCV, and BP (2010) uses a combi-nation of the two. Calorific values utilized by reporting organizations are country- and region-specific. However, the energy content of a fuel, such as coal, is often not uni-form within any particular country; different coal deposits have coal
resources of varying qualities, for example. Country-specific calorific values often differ among energy statis-tics reports, which has the effect of creating apparent dif-ferences in energy consumption in countries where the reported value of physical quantities of fuels consumed are identical. In 2007, differences in coal production (in tonnes) between EIA (2010), which utilizes GCV,
and BP (2010), which utilizes NCV, is less than 0.3%; however, the reported energy differences for this value differ by more than 7.4%, or 10 EJ. Considering two organizations that both utilize NCV, there can also be differences: IEA (2010) 2007 petroleum consump-tion is approximately 2.5% (4 EJ) greater than that of UN (2010), even though UN (2010) reports its physical units to be 0.7% greater.
Further conversion differences are seen among energy statistics when electricity generation from sources in which there is no obvious primary energy content (e.g., nuclear, hydroelectric and modern renewables), must be converted into a primary energy value. Datasets utilize region- and country-specific conversion factors termed the primary energy equivalence of electricity for this transformation. There are two competing methods for developing the primary energy equivalence: the sub-
stitution equivalent method and the direct equivalence
method. The energy reported from electricity using the substitution equivalent method, which assumes these sources to have efficiencies comparable to an average fossil power plant (30–40%), can be three-times higher than the energy reported using the direct equivalence method, which assumes 100% energy-to-electricity conversion. All of the energy statistics reports calcu-late the primary energy equivalence of electricity dif-ferently, which can lead to significant differences in reported energy consumption (Table 3). For example, in 2007, UN (2010) reported 168 TWh more (5.6%) of global hydroelectric generation than EIA (2010), yet the EIA (2010) energy value, which utilizes the substitution equivalent method, was 2.74-times (19.9 EJ) greater than the UN (2010) energy value, which utilizes the direct equivalence method. Similarly, IEA (2010), utilizing a substitution equivalent method, reports primary energy from global nuclear electricity generation in 2007 to be 3.1-times (20.1 EJ) greater than UN (2010), despite a 1.5% (40 TWh) difference in generation.
Beyond conversion differences, energy statistics can differ on national and global levels owing to bound-ary conditions related to what sources of energy are included. There is also considerable uncertainty over the nonenergy use of fossil fuels, particularly for petroleum feedstocks in the chemical industry [16,17]. Differences in system boundaries are most apparent with the inclu-sion or omission of international bunker fuels, modern renewable energy sources, and energy from biomass and wastes. According to IEA (2010), in 2007, nearly 9% of total global petroleum consumption was from bunker fuels, consumed in international ports, airports or dur-ing international transport. EIA (2010) and BP (2010) include bunker fuels in individual national energy con-sumption totals as well as in aggregated global energy consumption totals. IEA (2010) includes bunker fuels
Table 3. Summary of primary energy equivalence assumptions for
2007 data.
IEA (2010)† EIA (2010)‡ BP (2010)§ UN (2010)¶
Nuclear (%) 33.0 28.0–35.1 38.6 100 (Direct)#
Hydro (%) 100 (Direct) 34.5 38.6 100 (Direct)Renewables (%) 100 (Direct) 34.4 N/A 100 (Direct)Geothermal (%) 10.0 16.2 N/A 100 (Direct)††
N/A: Not applicable.†Data from [3,4].‡Data from [101].§Data from [2].¶Data from [5,6].#UN claims a nuclear efficiency of 33% (UN, 2008). However, calculations reveal use of
100% efficiency.††UN claims a geothermal efficiency of 10% (UN, 2008). However, calculations reveal use of
100% efficiency.
Key terms
Calorific value (heat content): The
energy released as heat when a
compound undergoes complete
combustion with oxygen under
standard conditions. Gross calorific
value assumes all vapor produced
during the combustion process is fully
condensed, whereas net calorific value
assumes the water leaves with the
combustion products without being
fully condensed.
Substitution equivalence method: The
primary energy equivalence of
electricity generation represents the
amount of energy that would be
necessary to generate an identical
amount of electricity in conventional
thermal power plants. The primary
energy equivalent is calculated using an
average generating efficiency of these
plants, approximately 30–40%, leading
to primary energy values approximately
three-times as large as direct
equivalence values.
Direct equivalence (physical energy content) method: The primary energy
equivalence of electricity generation
represents the physical energy content
of the electricity generated in the plant,
which amounts to assuming an
efficiency of 100%.
Energy intensity: A macroeconomic
measure of the energy required per unit
of economic output. It is commonly
expressed as units of energy per unit of
gross domestic product.
Carbon Management (2011) 2(2) future science group192
Review Macknick

in aggregated global energy consumption totals, but does not attribute any bunker fuel consumption to a particular nation. UN (2010) does report bunker fuel consumption on a national and global level, but these data are reported in a separate category that does not contribute to total energy consumption values. Owing to this, for countries with high traffic international ports, such as Singapore and The Netherlands, EIA (2010) and BP (2010) report much higher petroleum consump-tion values than IEA (2010) and UN (2010). For 2007, EIA (2010) reports petroleum consumption values for The Netherlands that are 31% (0.5 EJ) greater than UN (2010). Estimates of bunker fuels can also vary greatly. For the USA in 2007, bunker fuel estimates ranged from 1.3 EJ (IEA) to 1.9 EJ (UN).
Although modern renewable energy sources (e.g., solar photovoltaics, wind energy, geothermal and tidal power) comprise less than 1% of current total global primary energy use, their installed capacity has been rapidly increasing and could play a larger role in the future energy mix. IEA (2010), EIA (2010), and UN (2010) report electricity generated (in multiples of watt-hours and associated primary energy equivalent) from these sources, in addition to heat generated from geothermal plants, whereas BP only includes installed capacity from these sources.
All organizations report consumption of biomass fuels and wastes to some degree, yet there is great vari-ation in where these values are counted and what is included in these categories. All organizations include liquid biofuels (such as corn- or sugar-based ethanol) in their global and national totals of energy use, but they are included in different categories. IEA (2010) accounts for these fuels in its ‘Combustible Renewables and Wastes’ category and EIA (2010) accounts for these fuels in its ‘Wood and Wastes’ category [3,101]. By contrast, UN (2010) and BP (2010) add biofuels to their ‘Liquids’ and ‘Oil’ categories, respectively, thus it is often in the same category as petroleum. In 2007, UN (2010) and IEA (2010) reported global biofuels consumption to be approximately 1.5 EJ, approximately 1% of global petroleum consumption. Other than bio-fuels, EIA (2010) only includes energy from the Wood and Wastes category if it produces electricity.
Only UN (2010) and IEA (2010) provide data for traditional, noncommercial sources of biomass energy, termed ‘traditional fuels’ for this review. UN (2010) defines these traditional fuels as being composed of fuelwood, bagasse, charcoal, animal wastes, vegetal wastes, municipal wastes, industrial wastes and other wastes. IEA (2010) refers to these energy sources as ‘combustible renewables and wastes’, and are categorized as biogas, liquid biomass, industrial waste, municipal waste and solid biomass. For both organizations, only
the amounts specifically used for energy purposes are included in energy statistics. As noted above, IEA (2010) combustible renewables liquid biomass category includes biofuels (e.g., biodiesel and ethanol produced from biomass), yet UN (2010) considers these in its ‘Alcohol’ and ‘Biodiesel’ sub-categories of its ‘Liquids’ category. Similarly, biogas, production of which UN (2010) reports as 0.5 EJ, or 0.4% of natural gas production in 2007, is treated in the ‘Gases’ cat-egory of UN (2010) and the ‘Combustible Renewables’ category of IEA (2010). Estimates of traditional fuels represent a significant percentage of total energy con-sumption reported by IEA (2010) and UN (2010) in 2007, (10 and 9%, respectively), and there are con-siderable differences between values reported by these organizations (Figure 2).
Energy intensity
Energy trend analyses, such as the energy intensity of the economy can be affected by the choice of the data-set. Although there may be exceptions and there is a high dependency on the level of development, as nations develop and transition from manufacturing economies to service-based economies, their energy intensity of the economy decreases [18,19]. Including different factors such as traditional biomass can severely alter trends in energy intensity, especially for developing nations, since
60
50
40
30
20
10
01970 1975 1980 1985 1990 1995 2000 2005
Year
Exa
jou
les
(EJ)
IEA (2010)UN (2010)
Figure 2. Global primary energy supply of traditional fuels and
wastes from 1971–2007 as reported by IEA (2010) in the ‘Combustible
Renewables and Wastes’ category [3,4] and UN (2010) in the ‘Traditional
Fuels’ category [5,6]. IEA: International Energy Agency.
Energy & CO2 emission data uncertainties Review
future science group www.future-science.com 193

they replace fuelwood consumption with more mod-ern, cleaner fuels, such as natural gas [20]. For example, depending on which data source is used, Indonesian data shows a net increase or a net decrease in energy intensity for the period 1980–2007 (Figure 3). Using IEA (2010)data that includes traditional fuels, the energy intensity of Indonesia has decreased by approxi-mately 16% over the past three decades. According to EIA (2010), which does not report traditional fuel use, energy intensity increased by nearly 6%. Assessments of the ‘progress’ a country is making can be greatly affected by the choice of datasets, and conflicting narratives can be constructed based upon the results of these analyses.
Differences in carbon emission data statistics
CO2 emission inventories from fuel combustion are
calculated directly from reported energy data statis-tics. However, even sources citing the same energy data source provide different estimates of the resulting GHG emissions. Understanding differences in energy statistics is imperative to understanding differences in CO
2 emission inventory analyses.
Considering unadjusted total CO2 emissions,
(including industrial emissions from EDGAR [2010] but not land-use change emissions), CDIAC (2010) shows the highest reported emissions in 2005, 29,200 MtCO
2 (Figure 4A). IEA-S (2010) reports the
lowest global CO2 emissions, at 27,100 MtCO
2. From
1971 to 2007, CDIAC (2010) reports of global emis-sions are, on average, 7% higher than emissions reported from the IEA-S (2010) method. When only emissions from fuel combustion are considered, CDIAC (2010) is on average 3% higher than IEA-S (2010) each year from 1971 to 2007 (Figure 4B). Fuel combustion emis-sions from EIA (2010) are, on average, 2% higher than IEA-S (2010). EDGAR (2010) energy-only emis-sions, utilizing IPCC sector-based emission factors, are consistently lower than other reported values.
Disaggregating global emission inventories into fossil fuel-specific emissions makes the differences between datasets more apparent. For coal (solids), CDIAC (2010) consistently reported the highest emissions until the late 1990s, when EIA (2010) began reporting higher emissions (Figure 5). Conversely, EIA (2010) consistently reported higher petroleum (liquids) emissions until the early 1990s, when CDIAC (2010) overtook it (Figure 6). EIA (2010) has consistently reported higher emissions from natural gas (gases), and since 1999 has gener-ally reported the highest overall emissions from fossil fuels (Figure 7).
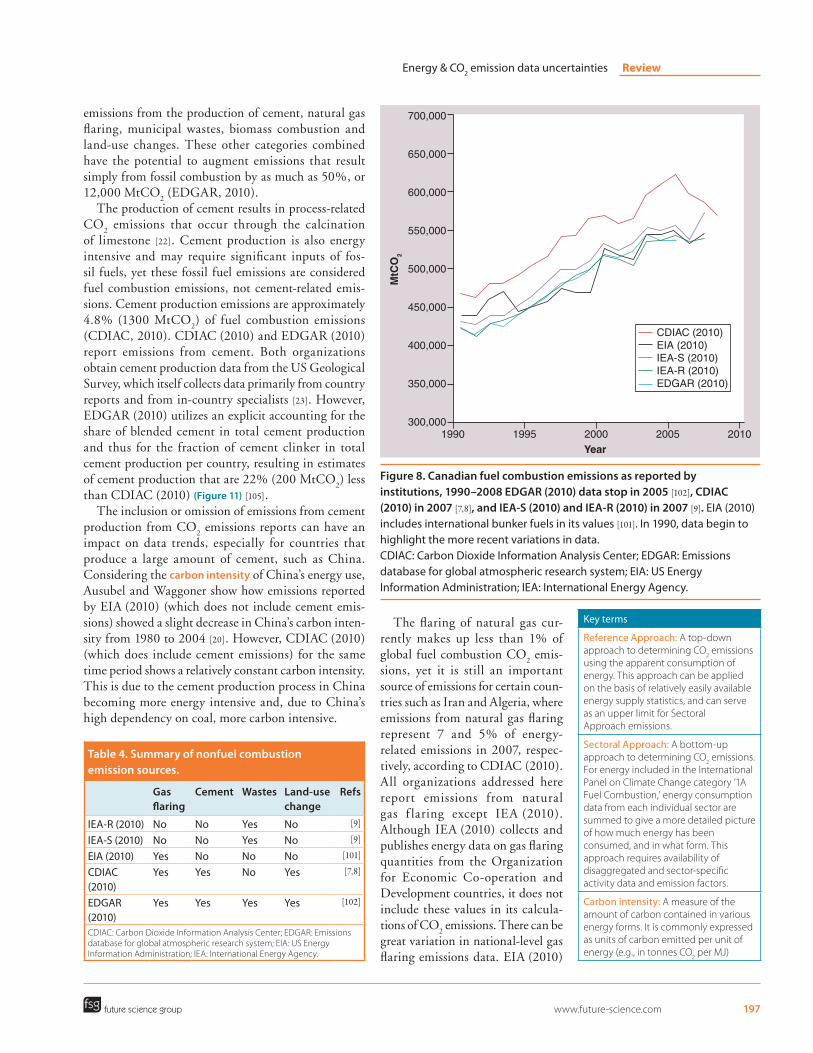
Differences on a global level may mask larger differ-ences on a national level for certain countries. Of the 26 top carbon-emitting nations in 2007, representing 80% of global fuel combustion emissions, seven show differences of greater than 10% between EIA (2010) data and IEA-S (2010) data. For Canadian fuel com-bustion emissions from 1990 to 2008, EIA (2010) data are on average 8.5% greater than IEA-S (2009) data, partly because EIA (2010) includes emissions resulting from bunker fuels consumption (Figure 8). However, the disparity is not only due to bunker fuels, which represents only 5% of the total amount of petroleum consumed in Canada from 1990 to 2007 (IEA 2010). It is worthy of note that from 1993 to 1994 and from 1997 to 1999, CDIAC (2010) data uniquely shows a decline in emissions. From 2003 to 2004, EIA (2010) and IEA-S (2009) show increases in emissions, whereas other datasets show declines. From 2006–2007, both IEA-R (2009) and IEA-S (2009) show increases in emissions, whereas EIA (2010) shows a decline. While short-term trend discrepancies are not as important as long-term trajectories, these differences do highlight the hazards of using just one dataset to examine short-term emission trends. Sources of discrepancies for CO
2
emission inventory data in Canada, as well as for other countries and global totals, result from differences in
40
45
30
20
10
01980 1985 1990 1995 2000 2005
Year
MJ/
$ (U
S20
00$
Mar
ket
Exc
han
ge
Rat
es)
IEA (2010)EIA (2010)
15
25
35
5
Figure 3. Energy intensity of Indonesia, 1990–2006, from energy data
as reported by IEA (2010) [3,4] and EIA (2010) [101]. Market exchange rates from World Development Indicators are used for GDP [12]. The World Energy Council’s primary energy equivalency recommendation of 38.6% is used for the harmonized cases. EIA: US Energy Information Administration; IEA: International Energy Agency.
Carbon Management (2011) 2(2) future science group194
Review Macknick

energy data inputs, corresponding CO2 emission factors,
inclusion of nonfuel combustion emission sources, and accounting methods.
For most countries, nationally and internationally regulated anthropogenic sources of CO
2 result primarily
from direct combustion of energy. The choice of energy data has implications not only owing to the physical quantities of fuels reported in energy statistics, which may differ substantially, but also owing to the calorific values ascribed to those fossil fuels.
CO2 emission factors, with the exception of those
used by CDIAC (2010), are based on the energy con-tent of particular fuels and are thus directly affected by calorific values of energy data. CDIAC (2010) utilizes the carbon content of the fuel to determine CO
2 emis-
sion factors [21]. Theoretically, the choice of NCV or GCV for energy consumption accounting is immaterial for CO
2 emissions accounting if corresponding (NCV
or GCV) CO2 emission factors are used; consumption
of a barrel of petroleum should lead to the same CO2
emissions across all datasets, regardless of whether NCV or GCV was chosen. However, in 2007, EIA (2010) reported emissions from global coal combustion to be 3.5% (420 MtCO
2) greater than CDIAC (2010)
emissions, despite the physical quantities of coal
19801970 1975 1985 1990 1995 2000 2005 2010Year
CDIAC (2010)EIA (2010)IEA-R (2010)IEA-S (2010)EDGAR (2010)
32,000
30,000
28,000
26,000
20,000
18,000
16,000
22,000
24,000
14,000
12,000
MtC
O2
19801970 1975 1985 1990 1995 2000 2005Year
32,000
30,000
28,000
26,000
20,000
18,000
16,000
22,000
24,000
14,000
12,000
MtC
O2
A B
Figure 4. Global emissions from (A) energy and industrial sources and (B) from fuel combustion only, as reported by institutions,
1971–2008. EIA (2010) data begin in 1980 [101]. EDGAR (2010) data stop in 2005 and industrial sources include cement emissions [102]. CDIAC (2010) data stop in 2007 and industrial data include gas flaring and cement emissions [7,8]. IEA-S (2010) and IEA-R (2010) data stop in 2007 and industrial data include municipal waste emissions [9]. CDIAC: Carbon Dioxide Information Analysis Center; EDGAR: Emissions database for global atmospheric research system; EIA: US Energy Information Administration; IEA: International Energy Agency.
1970 1975 1980 1985 1990 1995 2000 2005 2010Year
IEA-S (2010)IEA-R (2010)EIA (2010)CDIAC (2010)
13,000
12,000
11,000
10,000
9000
8000
7000
6000
5000
4000
MtC
O2
Figure 5. Global emissions from the consumption of coal. CDIAC (2010) reports consumption of solids as opposed to coal [7,8]. CDIAC: Carbon Dioxide Information Analysis Center.
Energy & CO2 emission data uncertainties Review
future science group www.future-science.com 195

contributing to these calculations differing by less than 0.5%. CDIAC (2010) global petroleum emissions were 3.9% (420 MtCO
2) greater than IEA (2010) petroleum
emissions in 2007, despite IEA (2010) reporting slightly higher (0.7%) physical units. These discrepancies high-light the implied differences in calorific values for fossil fuels (and sub-categories of fuels) and corresponding CO
2 emission factors.
Further differences in carbon emission data from similar energy data result from the energy accounting methods utilized. There are two distinct carbon account-ing methods employed in the five emission inventory esti-mates analyzed here: the top-down Reference Approach and the bottom-up Sectoral Approach. The Reference Approach considers a nation’s aggregated energy sup-ply, whereas the Sectoral Approach considers energy use in specific sectors to calculate emissions. IEA-R (2010) and CDIAC (2010) employ the Reference Approach. IEA-S (2010) and EIA (2010) utilize the Sectoral Approach, with IEA-S (2010) explicitly using the Tier 1 Sectoral Approach using 1996 IPCC guidelines [9]. The EDGAR (2010) Sectoral Approach utilizes the Tier 2 approach, using combustion technology-based (as opposed to average fuel-based) emission factors.
Both the Sectoral and Reference Approaches should give identical results, given sufficient quality data [9]. In practice, there are disparities that result from the meth-ods employed, and the accounting method should there-fore always be noted. Comparing the two IEA carbon accounting approaches, which utilize the same energy data inputs, lead to total global differences in CO
2 emis-
sions in 2007 of less than 2%, or 400 MtCO2. However,
certain countries have vast differences between Sectoral and Reference Approaches. South Africa’s difference in 2007 amounts to 26% (89 MtCO
2), and the Organization
for Economic Co-operation and Development countries such as Canada, Mexico, and Australia demonstrate differences greater than 5% in 2007 (Figure 9).
Differences are also apparent between IEA-S (2010) and EDGAR (2010) data, which both utilize IEA energy data inputs and use a Sectoral Approach. The difference between the agency methods relates to the categorization of emissions and the accounting method. Furthermore, EDGAR uses technology-based emission factors, whereas IEA-S uses average fuel emission fac-tors. IEA-S (2010) reported that global emissions from fossil fuel consumption are consistently higher than EDGAR (2010) emissions from 1971 to the present. While annual emissions differ only by approximately 2% each year (or 0.440 MtCO
2 in 2005), it highlights
the variation that is possible from using different levels of detail in the Sectoral Approach (Figure 10).
In addition to direct emissions from fossil fuel com-bustion, there are a number of other categories of emis-sion sources that can affect national and global emis-sion inventories (Table 4). Other anthropogenic sources of CO
2 that are published by certain datasets include
1970 1975 1980 1985 1990 1995 2000 2005 2010Year
IEA-S (2010)IEA-R (2010)EIA (2010)CDIAC (2010)
6000
5000
5500
4000
3000
3500
2000
2500
4500
MtC
O2
Figure 6. Global emissions from the consumption of natural gas. CDIAC (2010) reports consumption of gases as opposed to natural gas [7,8]. CDIAC: Carbon Dioxide Information Analysis Center.
1970 1975 1980 1985 1990 1995 2000 2005 2010Year
IEA-S (2010)IEA-R (2010)EIA (2010)CDIAC (2010)
12,000
10,000
8000
9000
6000
7000
11,000
MtC
O2
Figure 7. Global emissions from the consumption of petroleum. CDIAC (2010) reports consumption of liquids as opposed to petroleum [7,8].
Carbon Management (2011) 2(2) future science group196
Review Macknick
emissions from the production of cement, natural gas flaring, municipal wastes, biomass combustion and land-use changes. These other categories combined have the potential to augment emissions that result simply from fossil combustion by as much as 50%, or 12,000 MtCO
2 (EDGAR, 2010).
The production of cement results in process-related CO
2 emissions that occur through the calcination
of limestone [22]. Cement production is also energy intensive and may require significant inputs of fos-sil fuels, yet these fossil fuel emissions are considered fuel combustion emissions, not cement-related emis-sions. Cement production emissions are approximately 4.8% (1300 MtCO
2) of fuel combustion emissions
(CDIAC, 2010). CDIAC (2010) and EDGAR (2010) report emissions from cement. Both organizations obtain cement production data from the US Geological Survey, which itself collects data primarily from country reports and from in-country specialists [23]. However, EDGAR (2010) utilizes an explicit accounting for the share of blended cement in total cement production and thus for the fraction of cement clinker in total cement production per country, resulting in estimates of cement production that are 22% (200 MtCO
2) less
than CDIAC (2010) (Figure 11) [105]. The inclusion or omission of emissions from cement
production from CO2 emissions reports can have an
impact on data trends, especially for countries that produce a large amount of cement, such as China. Considering the carbon intensity of China’s energy use, Ausubel and Waggoner show how emissions reported by EIA (2010) (which does not include cement emis-sions) showed a slight decrease in China’s carbon inten-sity from 1980 to 2004 [20]. However, CDIAC (2010) (which does include cement emissions) for the same time period shows a relatively constant carbon intensity. This is due to the cement production process in China becoming more energy intensive and, due to China’s high dependency on coal, more carbon intensive.
The flaring of natural gas cur-rently makes up less than 1% of global fuel combustion CO
2 emis-
sions, yet it is still an important source of emissions for certain coun-tries such as Iran and Algeria, where emissions from natural gas flaring represent 7 and 5% of energy-related emissions in 2007, respec-tively, according to CDIAC (2010). All organizations addressed here report emissions from natural gas f laring except IEA (2010). Although IEA (2010) collects and publishes energy data on gas flaring quantities from the Organization for Economic Co-operation and Development countries, it does not include these values in its calcula-tions of CO
2 emissions. There can be
great variation in national-level gas flaring emissions data. EIA (2010)
Table 4. Summary of nonfuel combustion
emission sources.
Gas
flaring
Cement Wastes Land-use
change
Refs
IEA-R (2010) No No Yes No [9]
IEA-S (2010) No No Yes No [9]
EIA (2010) Yes No No No [101]
CDIAC (2010)
Yes Yes No Yes [7,8]
EDGAR (2010)
Yes Yes Yes Yes [102]
CDIAC: Carbon Dioxide Information Analysis Center; EDGAR: Emissions
database for global atmospheric research system; EIA: US Energy
Information Administration; IEA: International Energy Agency.
1990 1995 2000 2005 2010Year
CDIAC (2010)EIA (2010)IEA-S (2010)IEA-R (2010)EDGAR (2010)
700,000
650,000
600,000
550,000
500,000
450,000
400,000
350,000
300,000
MtC
O2
Figure 8. Canadian fuel combustion emissions as reported by
institutions, 1990–2008 EDGAR (2010) data stop in 2005 [102], CDIAC
(2010) in 2007 [7,8], and IEA-S (2010) and IEA-R (2010) in 2007 [9]. EIA (2010) includes international bunker fuels in its values [101]. In 1990, data begin to highlight the more recent variations in data. CDIAC: Carbon Dioxide Information Analysis Center; EDGAR: Emissions database for global atmospheric research system; EIA: US Energy Information Administration; IEA: International Energy Agency.
Key terms
Reference Approach: A top-down
approach to determining CO2 emissions
using the apparent consumption of
energy. This approach can be applied
on the basis of relatively easily available
energy supply statistics, and can serve
as an upper limit for Sectoral
Approach emissions.
Sectoral Approach: A bottom-up
approach to determining CO2 emissions.
For energy included in the International
Panel on Climate Change category ‘1A
Fuel Combustion,’ energy consumption
data from each individual sector are
summed to give a more detailed picture
of how much energy has been
consumed, and in what form. This
approach requires availability of
disaggregated and sector-specific
activity data and emission factors.
Carbon intensity: A measure of the
amount of carbon contained in various
energy forms. It is commonly expressed
as units of carbon emitted per unit of
energy (e.g., in tonnes CO2 per MJ)
Energy & CO2 emission data uncertainties Review
future science group www.future-science.com 197

reports natural gas flaring emissions in Mexico to be 13.2 MtCO
2 in 2007, whereas CDIAC (2010) reports
emissions to be less than half of that value, 4.7 MtCO2.
For Russia, EIA (2010) reports 7.5 MtCO2 from
natural gas flaring in 2006, whereas CDIAC (2010) reports emissions to be more than three-times greater: 24.7 MtCO
2. EIA (2010) global estimates of natural gas
flaring emissions are 5% (10.1 MtCO2) in 2007, which
is greater than CDIAC (2010) estimates (Figure 12).CO
2 emissions from municipal and industrial wastes,
which result primarily from incineration of plastics, make up less than 1% of emissions from energy sources (IEA, 2010). IEA data sources and EDGAR (2010) report waste emissions, yet include different sources of waste. In 2005, the IEA-S (2010) and IEA-R (2010) reported emissions from industrial wastes to be 45 MtCO
2 and
municipal wastes to be 46 MtCO2, while EDGAR (2010)
estimates emissions from municipal waste incineration of municipal wastes to be 30 MtCO
2.
CO2 emissions are also released from land-use
changes. Emissions from land-use changes could rep-resent a large fraction of total anthropogenic CO
2 emis-
sions, and have been addressed in other studies [24–26]. Emission-causing land-use changes include savannah and agricultural waste burning as well as forest and grassland fires [11]. Emissions from these sources are estimated by EDGAR (2010) and CDIAC (2010) only. CDIAC (2010) includes one general land-use change category of ‘carbon flux’ while EDGAR (2010) separates these into two distinct categories according to IPCC codes: “Agriculture (including savannah burning)” and “Land-use change and forestry” (Figure 13).
There is great uncertainty in these data, with EDGAR (2010) reporting uncertainty estimates of 50% and CDIAC (2010) reporting uncertainty esti-mates of 30%. An additional complication to estimat-ing emissions from land-use changes is determining whether releases are ‘net’ or ‘gross’ emissions, (where net emissions contribute to atmospheric CO
2 concentra-
tion increases and gross emissions are presumably par-tially offset each year by sink sequestration and storage). Given uncertainty ranges, EDGAR (2010) estimates on a global scale that land-use change emissions could be half as large as emissions from energy sources. As many of these land-use changes may be long-lasting, they are a crucial component of future estimations of CO
2 emissions, especially given the magnitude of
emissions by developing countries. For example, using EDGAR (2010) data for the year 2005, the Democratic Republic of Congo is ranked 126th in terms of emis-sions from energy and industrial sectors, emitting just 2.6 MtCO
2, whereas the USA emitted 5974 Mt CO
2
the same year. However, once emissions from land-use changes are included, the Democratic Republic of
1990 1995 2000 2005 2010Year
IEA-R (2010)IEA-S (2010)
MtC
O2
450
400
350
300
250
Figure 9. Australia fuel combustion emissions as reported by IEA-R (2010)
and IEA-S (2010) 1990–2007 [9]. Both methods use the same energy data but use different methods of accounting. In 1990 data begin to highlight the most recent data discrepancies. IEA: International Energy Agency.
19901985198019751970 1995 2000 2005 2010Year
IEA-S (2010)EDGAR (2010)
MtC
O2
30,000
28,000
26,000
20,000
18,000
16,000
22,000
24,000
14,000
12,000
Figure 10. Global fuel combustion emissions 1971–2007 as reported by
IEA-S (2010) and EDGAR (2010) [9,102]. Both organizations use the same energy data and both utilize a sectoral approach, but EDGAR (2010) uses technology-based emission factors whereas IEA-S (2010) uses average fuel emission factors. EDGAR (2010) emissions stop in 2005. EDGAR: Emissions database for global atmospheric research system; IEA: International Energy Agency.
Carbon Management (2011) 2(2) future science group198
Review Macknick

Congo is ranked 10th, emitting a total of 1,367 MtCO2.
Indeed, since EDGAR (2010) estimates that over 80% of emissions from Brazil and Indonesia as well as 40% from India arise from land-use changes, these emission sources will continue to be an important issue addressed at the national and international policy level.
Carbon intensity
The inclusion or omission of traditional fuels in energy statistics can lead to significant trend differences in car-bon intensity analyses. Considering the carbon intensity of energy use for India, a country that utilizes more traditional fuels than any other, the differences are clear (Figure 14). IEA-S (2010), using IEA (2010) energy data that include traditional fuels, shows a lower absolute car-bon intensity (due to energy being produced from bio-mass that has no corresponding calculated emissions); however, as the share of biomass decreases and the share of other fuels increases over time, carbon inten-sity steadily increases. For EIA (2010) data, which do not include traditional fuels, carbon intensity has stayed relatively constant since 1990. Thus, the data reported by these two institutions lead to contradictory decar-bonization trends. There is also a third possible trend: when energy usage from traditional biomass sources are included and carbon emissions from these sources are also included (using the IPCC standard average emis-sion factor of 109.6 g CO
2/MJ), there is a steady decline
in carbon intensity, highlighting the energy end-use improvements India has made [27]. These three contra-dictory interpretations of the carbon intensity of energy use in India indicate the importance that the choice of energy and emission sources has on trend analyses.
Importance of differences in energy statistics &
carbon emission inventories
Carbon emissions data uncertainty in the
context of climate change negotiation
The carbon emission inventory reports discussed here offer an opportunity for independent reviews of national emission inventories pursuant to the UN Framework Convention on Climate Change (UNFCCC) pro-tocols and subject to IPCC reporting guidelines. The UNFCCC requires Parties to the convention (i.e., nations) to regularly report their emissions follow-ing the standard methods outlined by the IPCC; how-ever, there is still considerable uncertainty in emission reports that must be addressed and that can affect mod-eling analyses [28–33]. Different methods and different primary data sources can assist in identifying irregulari-ties in national-level data, yet for effective independent verification, data collection and reporting must improve among the datasets discussed, providing values that are directly comparable to IPCC values.
19901985198019751970 1995 2000 2005 2010Year
CDIAC (2010)EDGAR (2010)
MtC
O2
1600
1400
1200
1000
800
600
400
200
0
Figure 11. Global emissions from the production of cement, 1970–2006. EDGAR (2010) data stop in 2005 [102]. EDGAR: Emissions database for global atmospheric research system.
199019851980 1995 2000 2005Year
CDIAC (2010)EIA (2010)EDGAR (2010)
MtC
O2 200
0
350
300
250
150
100
50
Figure 12. Global emissions from the flaring of natural gas, 1980–2008. EDGAR (2010) data stop at 2005 [102]. CDIAC (2010) data stop at 2007 [7,8]. CDIAC: Carbon Dioxide Information Analysis Center; EDGAR: Emissions database for global atmospheric research system; EIA: US Energy Information Administration.
Energy & CO2 emission data uncertainties Review
future science group www.future-science.com 199

The combination of different energy statistics and carbon emission inventory calculation methods can lead to significantly different results of national and global carbon emissions; greater transparency of data is needed to ensure comparisons between datasets are consider-ing consistent assumptions and boundary conditions. While many discrepancies among datasets could be
avoided through the use of one standardized account-ing method across organizations, barriers such as access to available data, questions regarding data quality, and availability of monetary resources may prevent this from occurring. At the very least, energy statistics and carbon emission inventory reporting organizations could uti-lize consistent boundary conditions, utilize consistent categorization schemes within fuel categories, organize data according to IPCC categories, and perform sensi-tivity analyses associated with ranges of fuel calorific values and CO
2 emission factors.
Given that we do not know the ‘true’ quantity of all carbon emissions released annually by indi-vidual nations, the consideration of data reported by independent carbon emission reporting organizations (with their different methodologies) facilitates car-bon emission monitoring and may assist in addressing uncertainty when developing national and international policies [34]. The different methods employed by the independent carbon emission reporting organizations can provide a more comprehensive glimpse into what actual emissions may be, yet these data must be pre-sented in a format that is comparable with other datasets in order to be useful. Improving the quality and con-sistency of data in carbon emission reporting organiza-tions could facilitate the development of a more robust independent verification procedure for IPCC national emission inventories.
Unrecognized uncertainties in publications
A consequence of the multitude of methods used to cal-culate CO
2 emissions is that competing conclusions can
be made by the choice of one dataset over another, as seen earlier in this article from the carbon intensity analyses from energy use in India. Thus, in any ana lysis of CO
2
emissions it is critical to provide alternative datasets so as to provide a better assessment of the uncertainty in val-ues associated with different CO
2 accounting methods.
Many studies have used CO2 reports for analyses, yet
Raupach et al. has received considerable attention for its
1990198519801970 1975 1995 2000 2005 2010Year
EDGAR (2010): land-usechange and forestryEDGAR (2010): agriculture(including savannah burning)CDIAC (2010): carbon flux
MtC
O2
0
8000
9000
7000
6000
5000
4000
3000
2000
1000
Figure 13. Global emissions from land-use changes, 1970–2005. Data from [7,8,102]. CDIAC: Carbon Dioxide Information Analysis Center; EDGAR: Emissions database for global atmospheric research system.
199019851980 1995 2000 2005 2010Year
IEA-S (2010): as reportedIEA-S (2010): harmonizedEIA (2010): as reportedEIA (2010): harmonized
g C
O2
per
MJ
0
120
100
80
60
40
20
Figure 14. Conflicting trends of the carbon intensity
of India, 1980–2007. IEA-S (2010) data utilize IEA (2010) energy statistics, which include traditional fuel consumption [3,4,9]. EIA (2010) carbon data utilize EIA (2010) energy statistics, which do not include traditional fuel consumption [101]. Harmonized datasets include emissions from fuel combustion and from IEA (2010)-reported traditional fuel consumption. IEA (2010)-reported traditional fuel energy values were added to EIA (2010) data to make them consistent with IEA (2010) energy data. EIA: US Energy Information Administration; IEA: International Energy Agency.
Carbon Management (2011) 2(2) future science group200
Review Macknick

conclusions taken from recent data, namely that recent CO
2 emissions
trends exceed the highest extreme emission scenario of the IPCC’s Special Report on Emission Scenarios (SRES) [35]. Since being published, several authors have referenced that conclusion, noting the added urgency to reduce emissions [36–41].
However, as has been observed, Raupach et al. excludes individual IPCC scenarios, constructs an aver-age of the emission scenario families and ignores certain IPCC illustra-tive marker scenarios [42,43]. It is worth noting that Raupach et al. only includes emissions data from EIA (2010) and CDIAC (2010), the two organizations as noted earlier that consistently report the highest emissions levels from fuel combus-tion. By excluding emissions from IEA-R (2010), IEA-S (2010) and EDGAR (2010), Raupach et al. are excluding data with lower levels of reported CO
2 emissions.
Figure 15 displays the full range of the IPCC SRES emission scenarios along with data from EIA (2010), CDIAC (2010), IEA-R (2010), IEA-S (2010), EDGAR (2010) and BP (2010) estimates of CO
2. Emission values for
BP (2010) have been included in the most recent BP report. Emissions from BP (2010) utilize average fuel emission factors applied to the aggregated fuel catego-ries of oil, coal and natural gas. BP (2010) values are consistently higher than other datasets, due to the use of IPCC-suggested emission factors, which are higher than the implied emission factors when fuel types are disaggregated and more specific emission factors are used. While BP (2010) estimates are not appropriate for analyzing absolute values, they can be useful in indicating recent trends [44]. Natural gas flaring emis-sions and cement emissions from 2008 and 2009 were calculated exogenously and added to BP (2010) values to provide consistency with other data. Natural gas flar-ing data were derived by utilizing a ratio of historical natural gas emissions to gas flaring emissions data from CDIAC (2010) and EIA (2010) from the last 10 years. Cement production emissions were estimated from the most recent US Geological Survey cement production statistics, based on 10 years of historical data of cement production compared with CDIAC (2010)-reported cement emissions [45].
IEA-S (2009), IEA-R (2009), and EDGAR (2010) data show lower emissions than EIA (2010) and CDIAC (2010). It is worthy of note that all organi-zations’ data, with the exception of BP (2010) data (which is only included for trend ana lysis), fall within the range of the SRES emission scenarios. Estimates from BP (2010) for 2009 indicate a decline in global emissions, further confining emissions within the range of the IPCC scenarios. Furthermore, EDGAR (2010) data, which utilizes the most specific detailed meth-odology, indicates the lowest level of emissions and is well within the IPCC scenario limits. While there are uncertainties and problems associated with each of the methodologies employed by these organiza-tions, including them gives a better understanding of the uncertainties inherent in estimating global emission trends.
Raupach et al. also point to a trend reversal with regard to regional and global carbon intensities [35]. While there is an obvious increase in carbon intensity values from 2000 to 2006, most recent BP (2010) data show that this increase may be leveling out (Figure 16). However, it is still too early to definitively conclude
1990 1995 2000 2005 2010Year
BP (2010): actual emisionsCDIAC (2010): actual emisionsEIA (2010): actual emisionsIEA-R (2010): actual emisionsIEA-S (2010): actual emisionsEDGAR (2010): actual emisions
CO
2 em
issi
on
s (G
tC y
-1)
11
10
9
8
7
6
5
SRES MAX (A1-ASF)
SRES MIN (B1-MARIA)
A1B
A1F1
A1T
B2
A2B1
Figure 15. Global emissions from energy and cement sources compared with the
International Panel on Climate Change’s Special Report on Emission Scenarios raw
data, 1990–2009. EDGAR (2010) data stops in 2005 [102], CDIAC (2010) [7,8], IEA-S (2010) and IEA-R (2010) [9] stop in 2007, and EIA (2010) stops in 2008 [101]. Triangles represent the six illustrative Special Report on Emission Scenarios marker scenarios. Emissions are reported in terms of carbon, not CO2, to be consistent with previous discussions of this issue. CDIAC: Carbon Dioxide Information Analysis Center; EDGAR: Emissions database for global atmospheric research system; EIA: US Energy Information Administration; IEA: International Energy Agency.
Energy & CO2 emission data uncertainties Review
future science group www.future-science.com 201

whether or not there is a disruption in the long-term trend of decarbonization. More years of data are required, especially since the declines in energy usage were not uniform among developing and industrial-ized countries [46]. Interestingly, the decline in car-bon emissions in Figure 15 is greater than the decline in carbon intensity in Figure 16, suggesting that while total emissions have decreased, this is probably due to a decrease in total energy consumed owing to a global economic recession and not owing to efficiency or tech-nology improvements in the energy sector. An economic (and energy) recovery without efficiency or technology improvements in the energy sector would probably have the effect of bringing CO
2 emissions to previous levels.
However, if economic recovery occurs alongside with energy efficiency and decarbonization measures, CO
2
emission may not increase as much.
Online energy-carbon harmonization database
Given the difficulty of identifying and rectifying dis-crepancies among multiple agency methods and assump-tions for energy and carbon data, important assumption differences may not always be adequately addressed by scholars and policy makers. Unless all organizations begin utilizing consistent methods, this problem will persist. An online harmonizing database of energy and
carbon emission data, first described by Macknick, offers a temporary solution to certain assumption and data discrepancies [47,103].
The database consolidates data from different sources and displays different organizations’ reported energy and carbon emission values side-by-side for select countries and for the global total, while converting all reported energy consumption and CO
2 emission totals
into consistent International System of Units values to allow for direct comparisons. In addition, the database has the ability to harmonize assumptions to be applied consistently across all data. Energy assumptions that can be harmonized include: the primary energy equiva-lence assumptions applied to electricity from hydroelec-tric, nuclear and renewable sources; the inclusion of traditional fuels; and the inclusion of electricity from modern renewable energy sources (e.g., wind, solar, geothermal and ocean) For CO
2 emissions, assump-
tions that can be altered are: emissions from cement sources; emissions from natural gas flaring; emissions from traditional fuels; emissions from the combustion of municipal and industrial wastes; and emissions from land-use changes. The database is updated with each new agency report.
Future perspective
Data discrepancies in energy statistics and CO2 inven-
tories can greatly affect climate modeling inputs as well as national and international policies that depend on accurate estimates of emissions, if not fully understood. Intranational and international carbon emissions trad-ing programs (such as the US Regional GHG Initiative and the EU Emissions Trading System) could have sub-stantially different allocations of carbon emissions, and thus financial outcomes for individual member parties, depending on which datasets and methodologies are used to calculate emissions. Whereas the uncertainty regard-ing emissions from fuel combustion has been well-docu-mented in many cases, the inclusion of nonfuel combus-tion emissions, such as emissions from cement production and land-use change, could add greater uncertainty to our assessments of total anthropogenic impacts on the carbon cycle and carbon policy decisions. If new national carbon taxes were implemented in particular countries or credits apportioned to carbon-emitting activities, much consideration would be needed regarding what emis-sions (e.g., fuel combustion-related as well as nonfuel combustion-related emissions) would be taxed or given credits in addition to how to collect, monitor and assess the uncertainty of those data.
The harmonizing database described here may facilitate consistent comparisons among datasets, but it should only be seen as a partial strategy to address the current existing disparities among reporting
19901985198019751970 1995 2000 2005 2010Year
UN (2010)/CDIAC (2010)BP (2010)EIA (2010)IEA-R (2010)IEA-S (2010)EDGAR (2010)
g C
O2
per
MJ
1.20
1.15
1.10
1.05
1.00
0.95
0.90
Figure 16. World carbon intensity 1971–2009. Emissions from fuel combustion divided by commercial energy only. EDGAR (2010) data stop in 2005 [102]. BP (2010) data stop in 2009 [2]. All other data sources stop in 2007. 1990 is the reference year and equals 1 for all organizations.
Carbon Management (2011) 2(2) future science group202
Review Macknick
organizations’ data. Further action could be taken by both reporting organizations and researchers to reduce the chance that data are unintentionally used out of context in political, economic or scientific activities.
To ensure more consistent data comparisons in the future, reporting organizations could use a consistent reporting format with comparable fuel categories to the IPCC, which clearly presents how emissions should be categorized and estimated. Deviations from this standard format should be transparently communicated.
Organizations may not come to a consensus regard-ing choices of national fuel calorific content values for fossil fuels in energy reports, or the corresponding car-bon emission factors for the CO
2 emission inventory
reports, yet performing sensitivity analyses with these assumptions would provide a better estimate of the uncertainty associated with fuel composition in particu-lar nations. This would lead to insights regarding why organizations reporting identical values of petroleum barrel or coal tonnage consumption report different associated emissions.
Organizations could also make an effort to report uncertainties inherent in their own data. While data may come from national reports that may not report uncertainties, publishing data that may
have high unrecognized uncertainties could lead to wide irregularities in data that may be mistaken for trend changes.
For researchers and policy makers utilizing these data, multiple data sources should be consulted and included in analyses to give a comprehensive view of discrepancies. All data sources considered here can meaningfully contribute to emission analyses, provided that the assumptions of each are clearly explained.
Researchers should also be explicit about which assumptions are inherent in the data sources they are using. While this may often already be performed when discussing carbon emissions from energy and certain industry sources, other factors not addressed are the underlying heating values and emission factors used, which can be a significant determinant of reported emis-sions. Researchers utilizing the energy-carbon database tool will be able to take advantage of side-by-side compari-sons of the various data sources along with an explanation of the assumptions going into each unmodified report.
Given the potential severe climatic consequences and massive potential economic implications of efforts to reduce CO
2 emissions, we should make special efforts
to improve our awareness of the full discrepancies of published emission data.
Executive summary
Energy data discrepancies
Reporting organizations collect data using different methods, leading to different reported physical quantities of primary energy consumption data.
Average calorific values of fossil fuels differ from report to report, compounding differences in physical quantities. Methods for converting the electricity generated from nuclear, hydroelectric and modern renewable sources into a primary energy
equivalent differ, leading to primary energy values that may differ by a factor of three, despite general agreement in the amount of electricity generated.
Traditional, combustible biomass fuels are a significant part of many countries’ primary energy use, and are not captured by all organizations.
Many national and global energy statistics differences associated with primary energy equivalences, calorific values and traditional fuels are masked by aggregated data.
Analyses of energy intensity show conflicting trends, depending on which data sources are used.Carbon emission inventory data discrepancies
CO2 emission inventory data from fuel combustion are based directly on energy use reports. Reporting organizations include different sources of carbon emissions in addition to energy consumption, with some reporting emissions
from the production of cement, natural gas flaring, waste combustion and land-use changes. Certain organizations use a top-down method of accounting for carbon emissions based on apparent consumption, whereas other
organizations use a bottom-up method of accounting based on data from individual economic sectors. Organizations report emissions in different categories that are not always directly comparable. Organizations utilize different emission factors for fossil fuels that are not entirely explained by differences in the calorific value of the fuel
when calculating energy statistics. Analyses of carbon intensity show conflicting trends, depending on which data sources are used.
Implications of energy & CO2 data discrepancies
Analyses of CO2 emissions and trends are becoming increasingly important and will probably impact future energy and climate policy decisions.
Data sources can be manipulated to show conflicting trends that could be used to support or negate policy proposals. Existing publications of energy statistics and CO2 emissions do not adequately convey statistical uncertainties in reported data. A publicly available online tool has been developed to harmonize certain energy and CO2 emission assumptions to facilitate consistent and
timely comparisons of data.
Energy & CO2 emission data uncertainties Review
future science group www.future-science.com 203

Financial & competing
interests disclosure
The author has no relevant affiliations or financial involvement with any organization or entity with a financial interest in or financial conflict with the subject matter or materials discussed in the manu-script. This includes employment, consultancies, honoraria, stock ownership or options, expert t estimony, grants or patents received or pending, or royalties.
No writing assistance was utilized in the production of this manuscript.
BibliographyPapers of special note have been highlighted as:
of interest
of considerable interest
1 Grübler A. Trends in global emissions: carbon, sulfur, and nitrogen. In: Encyclopedia of Global Environmental Change Volume 3. Douglas I (Ed.). John Wiley & Sons Ltd, Chichester, UK 35–53 (2002).
2 BP. BP Statistical Review of World Energy. BP, London, UK (2010).
3 International Energy Agency. Energy Balances of Non-OECD Countries. IEA, Paris, France (2010).
4 International Energy Agency. Energy Balances of OECD Countries. IEA, Paris, France (2010).
5 United Nations. Energy Statistics Yearbook. UN, NY, USA (2010).
6 United Nations. Energy Statistics Database. UN, NY, USA (2010).
7 Boden T, Marland G, Andres R. Global, regional and national fossil-fuel CO
2
emissions. Carbon Dioxide Information Analysis Center, Oak Ridge National Laboratory, US Department of Energy, TN, USA. DOI: 10.3334/CDIAC/00001 (2010).
8 Houghton R. Carbon flux to the atmosphere from land-use changes: 1850–2005. In: TRENDS: A Compendium of Data on Global Change. Carbon Dioxide Information Analysis Center, Oak Ridge National Laboratory, US Department of Energy, TN, USA (2008).
9 International Energy Agency. CO2 Emissions
from Fuel Combustion. IEA, Paris, France (2010).
10 Kydes A. Primary energy. In: Encyclopedia of Earth. Cleveland C (Ed.). Environmental Information Coalition, National Council for Science and the Environment, Washington, DC, USA (2007).
11 Intergovernmental Panel on Climate Change. 2006 IPCC Guidelines for National Greenhouse Gas Inventories. IGES, Hayama, Japan (2006).
12 World Energy Council. Energy for Tomorrow’s World: the Real Options and the Agenda for Achievements. Kogan Page, London, UK. (1993).
13 International Energy Agency. Energy balances of non-OECD countries: Beyond 2020 documentation. IEA, Paris, France (2008).
14 International Energy Agency. Energy balances of OECD countries: Beyond 2020 documentation. IEA, Paris, France (2008).
15 BP. Definitions and explanatory notes. In: Statistical Review of World Energy 2010. BP, London, UK (2010).
16 Weiss M, Neelis M, Zuidberg M, Patel M. Applying bottom-up ana lysis to identify the system boundaries of nonenergy use data in international energy statistics. Energy 33, 1609–1622 (2008).
17 Weiss M, Neelis M, Blok K, Patel M. Nonenergy use of fossil fuels and resulting carbon dioxide emissions: bottom-up estimates for the world as a whole and for major developing countries. Climatic Change 95, 369–394 (2009).
18 Nilsson L. Energy intensity trends in 31 industrial and developing countries 1950–1988. Energy 18(4), 309–322 (1993).
19 Sun J. The decrease in the difference of energy intensities between OECD countries from 1971 to 1998. Energy Policy 30(8), 631–635 (2002).
20 Ausubel J, Waggoner P. Dematerialization: variety, caution, and persistence. Proc. Natl Acad. Sci. USA 105, 12774–12779 (2008).
Insightful assessment of various energy and CO
2 emission trends for select countries
based on different data sources.
21 Marland G, Rotty R. Carbon dioxide emissions from fossil fuels: a procedure for estimation and results for 1950–1982. Tellus B 36, 232–261 (1984).
22 Gibbs M, Soyka P, Conneely D. CO2
emissions from cement production. In: Good Practice Guidance and Uncertainty Management in National Greenhouse Gas Inventories. Intergovernmental Panel on Climate Change, Geneva, Switzerland (2000).
23 Busse J. Survey methods for nonfuel minerals. In: US Geological Survey 2005 Minerals Yearbook. US Government Printing Office, Washington, DC, USA (2007).
24 Fearnside P. Global warming and tropical land-use change: greenhouse gas emissions from biomass burning, decomposition and soils in forest conversion, shifting cultivation and secondary vegetation. Climatic Change 46(1–2), 115–158 (2000).
25 Archard F, Eva H, Mayaux P, Stibig H, Belward A. Improved estimates of net carbon emissions from land cover change in the tropics for the 1990s. Global Biogeochem. Cycles 18(GB2008), (2004).
26 De Campos C, Muvlaert M, Rosa L. Historical CO
2 emissions and concentrations
due to land use change of croplands and pastures by country. Sci. Total Environ. 346(1–3), 149–155 (2005).
27 Intergovernmental Panel on Climate Change. Revised 1996 IPCC Guidelines for National Greenhouse Gas Inventories. Volume 1: Greenhouse Gas Inventory Reporting Instructions. IPCC, Bracknell, UK (1997).
28 Jonas M, Krey V, Wagner F, Marland G, Nahorski Z. Dealing with uncertainty in greenhouse gas inventories in an emissions constrained world. Presented at: The 3rd International Workshop on Uncertainty in Greenhouse Gas Inventories. Lviv, Ukraine 22–24 September 2010.
29 Olivier J, Van Aardenne J, Monni S, Doring U, Peters J, Janssens-Maenhout G. Application of the IPCC uncertainty methods to EDGAR 4.1 global greenhouse gas inventories. Presented at: The 3rd International Workshop on Uncertainty in Greenhouse Gas Inventories. Lviv, Ukraine 22–24 September 2010.
30 Peylin P, Houweling S, Krol M et al. Importance of fossil fuel emission uncertainties over Europe for CO
2 modeling:
model intercomparison. Atmospheric Chem. Physics Discussion 9, 74457–77503 (2009).
31 Winiwarter W. National greenhouse gas inventories: understanding uncertainties versus potential for improving reliability. Water Air Soil Pollution: Focus 7, 443–450 (2007).
32 Olivier J, Peters J. Uncertainties in global, regional and national emission inventories. Presented at: Non-CO
2 Greenhouse Gases:
Scientific Understanding, Control Options and Policy Aspects. Maastricht, The Netherlands 21–23 January 2002.
33 Marland G, Hamal K, Jonas M. Carbon accounting and decarbonization: how uncertain are estimates of CO
2 emissions?
J. Industrial Ecology 13(1), (2009).
Interesting discussion of how historical CO2
emissions may change with each successive carbon emission report.
Carbon Management (2011) 2(2) future science group204
Review Macknick

34 Ermolieva T, Ermoliev M, Jonas M et al. A model for robust emission trading under uncertainties. Presented at: The 3rd International Workshop on Uncertainty in Greenhouse Gas Inventories. Lviv, Ukraine 22–24 September 2010.
35 Raupach M, Marland G, Ciais P et al. Global and regional drivers of accelerating CO
2
emissions. Proc. Natl Acad. Sci. USA 104, 10288–10293 (2007).
36 Anderson K, Bows A. Reframing the climate challenge in light of post-2000 emission trends. Philos. Trans. R. Soc. Lond. A 366, 3863–3882 (2008).
37 Caldeira K, Wood L. Global and Arctic climate engineering: numerical model studies. Philos. Trans. R. Soc. Lond. A 366, 4039–4056 (2008).
38 Canadell J, Le Quere C, Raupach M. From the cover: contributions to accelerating atmospheric CO
2 growth from economic
activity, carbon intensity, and efficiency of natural sinks. Proc. Natl Acad. Sci. USA 104, 18866–18870 (2007).
39 Canadell J, Raupach M. Managing forests for climate change mitigation. Science 320, 1456–1457 (2008).
40 Howden S, Soussana J, Tubiello F, Chetri N, Dunlop M, Meinke H. Climate change and food security special feature:
Adapting agriculture to climate change. Proc. Natl Acad. Sci. USA 104, 19691–19696 (2007).
41 Joos F, Spahni R. Rates of change in natural and anthropogenic radiative forcing over the past 20,000 years. Proc. Natl Acad. Sci. USA 105, 1425–1430 (2008).
42 Manning M, Edmonds J, Emori S. Misrepresentations of the IPCC CO
2 emission
scenarios. Nature Geosciences 3, 376–377 (2010).
43 Van Vuuren D, Riahi K. Do recent emission trends imply higher emissions forever? Climatic Change 91, 237–248 (2008).
44 Myhre G, Alterskjaer K, Lowe D. A fast method for updating global fossil fuel carbon dioxide emissions. Environ. Res. Lett. 4, 1–4 (2009).
Provides a novel method for using recent BP energy data to project CO
2 emissions.
45 US Geological Survey. Mineral Commodity Summaries. US Government Printing Office, Washington, DC, USA (2010).
46 Olivier J, Peters J. No growth in total global CO
2 emissions in 2009. Netherlands
Environmental Assessment Agency (PBL), Bilthoven, The Netherlands (2010).
47 Macknick J. More caution about energy and carbon reports. Proc. Natl Acad. Sci. USA 106, 15 (2009).
Websites
101 US Energy Information Administration. International Energy Statistics (2010). www.eia.doe.gov/cfapps/ipdbproject/IEDIndex3.cfm
102 European Commission JRC NEAA. Emission Database for Global Atmospheric Research (EDGAR). Release version 4.1 (2010). http://edgar.jrc.ec.europa.eu/index.php
103 Macknick J. Energy and Carbon Emission Harmonization Database (2011). www.iiasa.ac.at/Research/TNT/WEB/Publications/Energy_Carbon_DataBase
104 US Energy Information Administration. Sources for International Energy Statistics (2010). www.eia.gov/cfapps/ipdbproject/docs/sources.cfm
105 European Commission JRCNEaA. Main differences in greenhouse gas emissions between EDGAR 4.1 and version 4.0 (2010). http://edgar.jrc.ec.europa.eu/Main_differences_between_EDGAR_version_41and40.pdf
Energy & CO2 emission data uncertainties Review
future science group www.future-science.com 205
Related Documents