Association Movement Agency Energy and Carbon Emissions Profiles of 54 South Asian Cities ICLEI-South Asia ICLEI-Local Governments for Sustainability, South Asia First Floor, Tower ‘B’ Plot No 5, Logix Techno Park, Sector 127, NOIDA-201304, India T +91 120 4368400 F +91 120 4368401 E [email protected] W www.iclei.org/sa About ICLEI-South Asia ICLEI-South Asia, the South Asian regional chapter of ICLEI Local Governments for Sustainability has a mission to help regional cities in their efforts to promote sustainable development. The Secretariat is located at NOIDA, India and is functional since 2005. It has been working with several large and small local governments on the issues of environmental sustainability, energy and climate change. It provides solutions to local environmental issues through various programmes and influences international negotiations by raising collective voices of local governments at various international fora. It is part of a United Nations recognised, membership-based global association of over 1,100 local governments. About British High Commission Strategic Programme Fund: The Strategic Programme Fund (SPF) is the UK Foreign and Commonwealth Office’s (FCO) flagship programme budget. It was originally launched in 2003 under the name of the Global Opportunities Fund. The Foreign and Commonwealth Office’s Strategic Programme Fund (SPF) seeks to create real, measurable outcomes in support of the FCO’s policy goals. This programme supports FCO’s Strategic Objective “To promote a low carbon, high growth global economy”. For more information on SPF, please visit www.ukinindia.fco.gov.uk Association Movement Agency

Welcome message from author
This document is posted to help you gain knowledge. Please leave a comment to let me know what you think about it! Share it to your friends and learn new things together.
Transcript
Local Action Moves the World4 Local Action Moves the World 5
Association Movement Agency
Energy and Carbon Emissions Profi les of
54 South Asian Cities
ICLEI-South Asia
ICLEI-Local Governments for Sustainability, South Asia
First Floor, Tower ‘B’ Plot No 5, Logix Techno Park, Sector 127, NOIDA-201304, India
T +91 120 4368400 F +91 120 4368401
E [email protected] W www.iclei.org/sa
About ICLEI-South Asia
ICLEI-South Asia, the South Asian regional chapter of ICLEI Local Governments for Sustainability has a mission to help regional cities in their efforts to promote sustainable development. The Secretariat is located at NOIDA, India and is functional since 2005. It has been working with several large and small local governments on the issues of environmental sustainability, energy and climate change. It provides solutions to local environmental issues through various programmes and infl uences international negotiations by raising collective voices of local governments at various international fora. It is part of a United Nations recognised, membership-based global association of over 1,100 local governments.
About British High Commission
Strategic Programme Fund: The Strategic Programme Fund (SPF) is the UK Foreign and Commonwealth Offi ce’s (FCO) fl agship programme budget. It was originally launched in 2003 under the name of the Global Opportunities Fund. The Foreign and Commonwealth Offi ce’s Strategic Programme Fund (SPF) seeks to create real, measurable outcomes in support of the FCO’s policy goals. This programme supports FCO’s Strategic Objective “To promote a low carbon, high growth global economy”.
For more information on SPF, please visit www.ukinindia.fco.gov.uk
Association Movement Agency
Local Action Moves the World6 Local Action Moves the World 3
Preface
What once was considered a scientifi c theory and was limited only to academic discussions, is today a grave concern facing mankind. Climate change is a reality and there is a need for immediate, effective and responsible actions. Action is needed from all parts of the society across the globe. The local governments have a crucial role to play, as a tier of government closest to the citizens and with the ability to implement climate smart actions locally.
The British High Commission has initiated the ‘Roadmap of South Asian Cities and Local Governments for the Post 2012 Global Climate Agreement and Actions’ project through ICLEI-South Asia, funded under the Strategic Programme Fund (SPF) of the UK’s Foreign and Commonwealth Offi ce. The report would support South Asian local governments in understanding the contribution of city level carbon emissions and develop regional consensus on local action plans. It will act as a platform for them to collectively contribute to international efforts and reach a fair, ambitious and effective agreement at COP 15 in Copenhagen.
The project has developed City Energy Status Reports and Carbon Emissions Inventory for 54 large South Asian Cities for the fi rst time. Based on this data, cities developed plans to combat climate change at local level. These actions include effi cient water usage, effective solid waste management and generating clean energy and thereby decrease air pollution.
We hope this wealth of information will be used by the respective agencies in their future planning and actions. And the network of South Asian local governments created under the project will contribute towards sharing best practices and deliver effi cient public services.
I am delighted to see the level of awareness and enthusiasm shown by the South Asian local governments. We highly appreciate the work done by ICLEI-South Asia in coordinating the enormous task of gathering information from the South Asian cities and in compiling this comprehensive report. The British High Commissions in New Delhi, Colombo, Dhaka and Kathmandu, and the Deputy High Commissions in Mumbai, Chennai, Kolkata and Bengaluru look forward to deepening our collaboration with cities across South Asia on this vital, progressive and win-win agenda.
Regards,
Mr Fergus AuldFirst Secretary, Climate Change and EnergyBritish High CommissionP
REFA
CE
Mr Fergus AuldFirst Secretary
Note to the Reader
This report is an output of the ‘Roadmap of South Asian Cities and Local Governments for the Post 2012 Global Climate Agreement and Actions’ project and is prepared by ICLEI-South Asia with support from the British High Commission. This report provides a brief inventory of energy status and carbon emissions of 54 South Asian cities.
Comments and suggestions are welcome and could be sent to ICLEI-South Asia.
ICLEI-South Asia Team
Mr Emani Kumar, Executive DirectorMs Anuradha Das, ManagerMr Ravi Ranjan Guru, Senior Project Offi cerMr Kamlesh Pathak, Senior Project Offi cerMr Ashish Verma, Project Offi cer
Version 1@November 2009
Designed and Produced by:
CREATIVE INCH 7B, 2nd Floor, Kalkaji, New Delhi-110 019T +91 11 4163 4301 E [email protected]
Local Action Moves the World4 Local Action Moves the World 5
It is possible to expect that the fi ndings of this report will provide a signifi cant and solid background for all stakeholders to start developing appropriate policies in all relevant fi elds.
More importantly, it is our sincere hope and wish, that the experience and dialogues established within the course of the project, be considered as fi rst steps for establishing sustainable local-national-international partnerships on the way to Copenhagen in December 2009.
Hence, ICLEI and other global network of cities and local governments believe that such spirit of partnership is the key to achieve a global, strong, comprehensive international climate change regime now, up to and beyond ‘Post 2012’, where each and every citizen of the world will have a better and more equitable chance to survive, share and prosper.
With kindest regards,
Mr David Cadman Mr Konrad Otto-ZimmermannPresident Secretary GeneralICLEI ICLEI
Message from the President and Secretary General, ICLEI
Dear Readers,
ICLEI – Local Governments for Sustainability, is a network, an agency and a movement of over 1,100 cities from every continent. Since 1990, ICLEI acts as the leading alliance of the cities and local governments in their efforts to achieve global sustainability through local sustainability.
Scientists and civil society have long been advocating that climate change shall be considered as the biggest challenge that humanity has faced so far. For many years, issues focusing on reduction of emissions of anthropogenic greenhouse gases, were considered as the priority and the responsibility of developed countries.
After more than two decades of collaborative action, the international community has come up with the conclusion that tackling climate change is in fact a successful means to reach energy effi ciency, energy security, sustainable jobs, cleaner air and better livelihood around the world.
Thus, it has been widely accepted that reducing emissions paves the way for a transition to a low carbon, climate resilient human communities.
Since early 1990s, right after the adoption of the United Nations Framework Convention on Climate Change and long before any discussions on the Kyoto Protocol, ICLEI and its member cities started committing themselves to signifi cant reductions in CO2 emissions. Based on the success of the past 20 years, ICLEI’s Council, which gathered hundreds of local leaders from around the world in Edmonton, Canada 2009, has noted that we must act faster and faster, arrive at deeper CO2 reductions, and choose more radical solutions, if we want to ensure the continued existence of life on Earth.
This report, prepared by extraordinary efforts of the Director and Staff of ICLEI-South Asia, along with the generous support of the British High Commission, through valuable contributions of national and sub-national governments resulting from a fruitful collaboration with partnering local governments, is a concrete evidence that dealing with climate change is possible and necessary in each and every part of the world, including South Asian nations and cities.
Mr David CadmanPresident
Mr Konrad Otto-Zimmermann
Secretary General
Local Action Moves the World6 Local Action Moves the World 7
Message from the Director, NIUA
In 2001, about 286 million people were living in urban areas of India and it was the second largest urban population in the world. The urban population is expected to rise to around 38 per cent by 2026. India has to improve its urban areas to achieve the objective of economic development. Huge investment is required in India’s urban sector. Since public funds for these services are inadequate, Urban Local Bodies (ULBs) have to look for innovative approaches for fi nancing and managing urban services. In response to urban problems, the Government of India launched a reform-linked urban infrastructure investment project, Jawaharlal Nehru National Urban Renewal Mission (JnNURM).
The National Institute of Urban Affairs (NIUA) is a premier agency for urban development and management research, training and information dissemination in the country. It enjoys the support and commitment of the Ministry of Urban Development (MoUD), Government of India. The institute has completed a large variety of projects including policy research studies and evaluation studies in areas of urban development, management and governance including urbanisation and urban policy, urban management, urban infrastructure and services, urban environment, etc. NIUA supports MoUD in planning and implementing JnNURM. It is the national coordinator for PEARL/JnNURM that networks 65 JnNURM cities and is also the knowledge manager for high powered experts committee on urban infrastructure.
The ‘Roadmap of South Asian Cities and Local Governments for the Post 2012 Global Climate Agreement and Actions’ project is a joint effort by ICLEI-South Asia and NIUA with support from the British High Commission, which has created the ‘Energy Status Report and Carbon Emissions Inventory for 54 South Asian Cities’. The report, a result of a rigorous fact fi nding exercise, would help in better assessing the situation at local level and charting out the future course of action. The need of the hour is to take well-thought actions, and reports like these would be helpful in this direction.
With regards,
Mr Chetan VaidyaDirectorNational Institute of Urban AffairsM
ES
SA
GE
MES
SA
GE
Message from the Executive Director, ICLEI-South Asia
Off late, there has been an increased focus on following a responsible growth path, one that takes into consideration the impacts that our actions have on the environment. In this direction, South Asian federal governments and specialised sectors have pledged their commitment and support to address climate change in various forums. Similarly, national committees in various countries are working on fi nding practical solutions to this issue. However, there is little focus on urban centres and their impact on climate change even though there is a specifi c need to develop the city government’s capacity to engage different stakeholders to address local climate issues.
ICLEI-South Asia, with the support from the British High Commission, is working on the ‘Roadmap of South Asian Cities and Local Governments for the Post 2012 Global Climate Agreement and Actions’ project and has come out with this unique ‘City Energy Status Report and Carbon Emissions Inventory for 54 South Asian Cities’.
The project, being a South Asian initiative, gave ICLEI-South Asia an opportunity to visit and interact with Ministers, Mayors and other senior offi cials of countries like Bhutan, Bangladesh, Nepal and Sri Lanka and gain insights about their opinions and concerns.
The team was delighted to see the enthusiasm of the local and national governments of the respective countries participating in the project. In India too, the selected Urban Local Bodies (ULBs) and their state governments have been very cooperative in sharing the necessary information for the report.
We hope this report will help all stakeholders, in particular, the participating national and local governments, to plan and implement climate change policies and actions and help the world to combat climate change.
With best regards,
Mr Emani KumarExecutive DirectorICLEI-South Asia
Mr Emani KumarExecutive Director
Mr Chetan VaidyaDirector

Local Action Moves the World8 Local Action Moves the World 9
The threat of climate change is alarming and is evident from the changing sea level and melting glaciers. The issue of climate change shall be addressed through a holistic approach rather in isolation. I strongly feel a need of effective efforts for environmental protection from the government, local authorities and private sector. Considering that the increasing irregularities in the seasonal weather patterns and a global rise in temperatures is already being felt throughout the world, immediate and radical action is imperative and such studies will help the cities to understand their position on energy consumption and the resulting emissions thereof.
Mr Umesh Prasad Mainali Former Secretary, Ministry of Environment Science and Technology Government of Nepal
I would like to mention just a few words. As we all know Bhutan is a fast emerging urban society, it’s all a very new phenomenon and hence, people have to face this aspect in a new way. How to make a proper urban citizen is going to be a major concern for Bhutan. Hope we all come out with good deliberations towards making an environment-friendly urban society, which would help in tackling issues like climate change.
Mr Dasho J Dorjee Advisor National Environment Commission Bhutan
As the Minister for Urban Development, Sri Lanka, I would personally encourage all the cities in Sri Lanka to join ICLEI’s endeavour. The workshop done in Sri Lanka on October 1, 2009 in Kandy, gave the local governments the much needed guidance and experience to all the Mayors, Deputy Mayors, Chairmen and Councillors who were present on the occasion. Like the other cities in Asia, we too have problems in solid waste management, street lighting, water management, etc. Recently, ICLEI with the support from BHC collected data from few cities in Sri Lanka. I do hope that in the near future, Sri Lanka will benefi t from ICLEI with the support from BHC and other donor agencies to eliminate the above problems.
Mr Rohana Dassanayake Minister for Urban Development Sri Lanka
As the local governments of respective countries are involved in the disposal of waste, supply and use of electricity for street lighting, buildings, water pumping systems, etc., which cause carbon emissions, the local governments have some responsibility to manage these activities effi ciently. In this context, this initiative by ICLEI-South Asia and the British High Commission is useful in providing information and generating knowledge among local governments to implement activities to reduce carbon emissions.
Dr Mihir Kanti Majumdar Secretary, Ministry of Environment and Forests, Government of the People’s Republic of Bangladesh
IN Q
UO
TES
IN Q
UO
TES
Local Action Moves the World10 Local Action Moves the World 11
We would also like to thank our partners for having helped us in collecting and compiling this report.
Bangladesh Centre for Advanced Studies (BCAS) – Dhaka, Bangladesh
City Managers’ Association – Karnataka, India
City Managers’ Association – Madhya Pradesh, India
Energy Forum – Colombo, Sri Lanka
Geosensing Information Pvt. Ltd. – Chennai, India
Municipal Association of Nepal (MuAN), Kathmandu, Nepal
School of Planning, Centre for Environmental Planning and Technology – Ahmedabad, India
SENES Consultants India Pvt. Ltd. – NOIDA, India
Society for Environment Education & Development (SEED) –Lucknow, India
University of Petroleum & Energy Studies – Gurgaon, India
Acknowledgement
ICLEI-South Asia and the British High Commission wish to thank the following Urban Local Bodies (ULBs) and their utilities for their cooperation in providing the information that made this publication possible.
Participating Urban Local Bodies
India
Agra Ahmedabad AsansolBengaluru Bhavnagar Bhopal Bhubaneswar Chennai Coimbatore Dehradun Faridabad Gurgaon Guntur Gwalior Haldia Indore Jabalpur Jaipur Jamshedpur (UA) Kanpur Kochi, Ernakulam Kolkata Lucknow Madurai Mysore Nagpur Nashik Patna Pune Raipur Rajkot Ranchi Sangli Shimla Surat Thane Thiruvananthapuram Tiruchirapalli Udaipur Vijayawada Visakhapatnam
Bangladesh
Dhaka Chittagong KhulnaRajshahi
Bhutan
Thimphu Phuentsholing
Sri Lanka
Colombo Kandy Kurunagela Matale
Nepal
Kathmandu Lalitpur Pokhara AC
KN
OW
LED
GEM
EN
T
AC
KN
OW
LED
GEM
EN
T

Local Action Moves the World12 Local Action Moves the World 13
Nagpur 45
Nashik 46
Patna 47
Pune 48
Raipur 49
Rajkot 50
Ranchi 51
Sangli 52
Shimla 53
Surat 54
Thane 55
Thiruvananthapuram 56
Tiruchirapalli 57
Udaipur 58
Vijayawada 59
Visakhapatnam 60
Chittagong, Bangladesh 61
Dhaka, Bangladesh 62
Khulna, Bangladesh 63
Rajshahi, Bangladesh 64
Phuentsholing, Bhutan 65
Thimphu, Bhutan 66
Kathmandu, Nepal 67
Lalitpur, Nepal 68
Pokhara, Nepal 69
Colombo, Sri Lanka 70
Kandy, Sri Lanka 71
Kurunagela, Sri Lanka 72
Matale, Sri Lanka 73
Action Plans for Reduction of GHG Emissions 74
Survey Analysis 76
Calls – A South Asian Perspective 78
References 80IND
EX
Index
Preface 3
Message from the President and Secretary General, ICLEI 4
Message from the Executive Director, ICLEI-South Asia 6
Message from the Director, NIUA 7
Acknowledgement 10
About the Project 14
Information for the Reader 16
Abbreviations, Acronyms and Units 19
Agra 20
Ahmedabad 21
Asansol 22
Bengaluru 23
Bhavnagar 24
Bhopal 25
Bhubaneswar 26
Chennai 27
Coimbatore 28
Dehradun 29
Faridabad 30
Guntur 31
Gurgaon 32
Gwalior 33
Haldia 34
Indore 35
Jabalpur 36
Jaipur 37
Jamshedpur (UA) 38
Kanpur 39
Kochi 40
Kolkata 41
Lucknow 42
Madurai 43
Mysore 44 IND
EX
Local Action Moves the World14 Local Action Moves the World 15
NGOs, institutions, etc.) by giving presentations on their energy status and guiding them with the next possible steps forward
• Provided platform for local governments to generate a South Asian position/consensus/opinion on international environmental treaties for the formation of a realistic, robust, durable and fair framework of commitments in the ‘Post 2012’ period
• Consolidated feedback/suggestions and presented in above mentioned workshops and showcased their status and needed actions so as to build a consensus
• Coordinated and empowered a ‘Local Government Delegation’ comprising local leaders from all parts of the South Asian region, to participate in interaction with the international negotiation process at COP 14 and the parallel national dialogues in Poznan, Poland (Will form a delegation to participate at COP 15 as well)
• Documentation of activities and outcomes under the project to act as a reference for continued action by participating South Asian cities to further develop and share strategies and solutions towards local action for climate protection
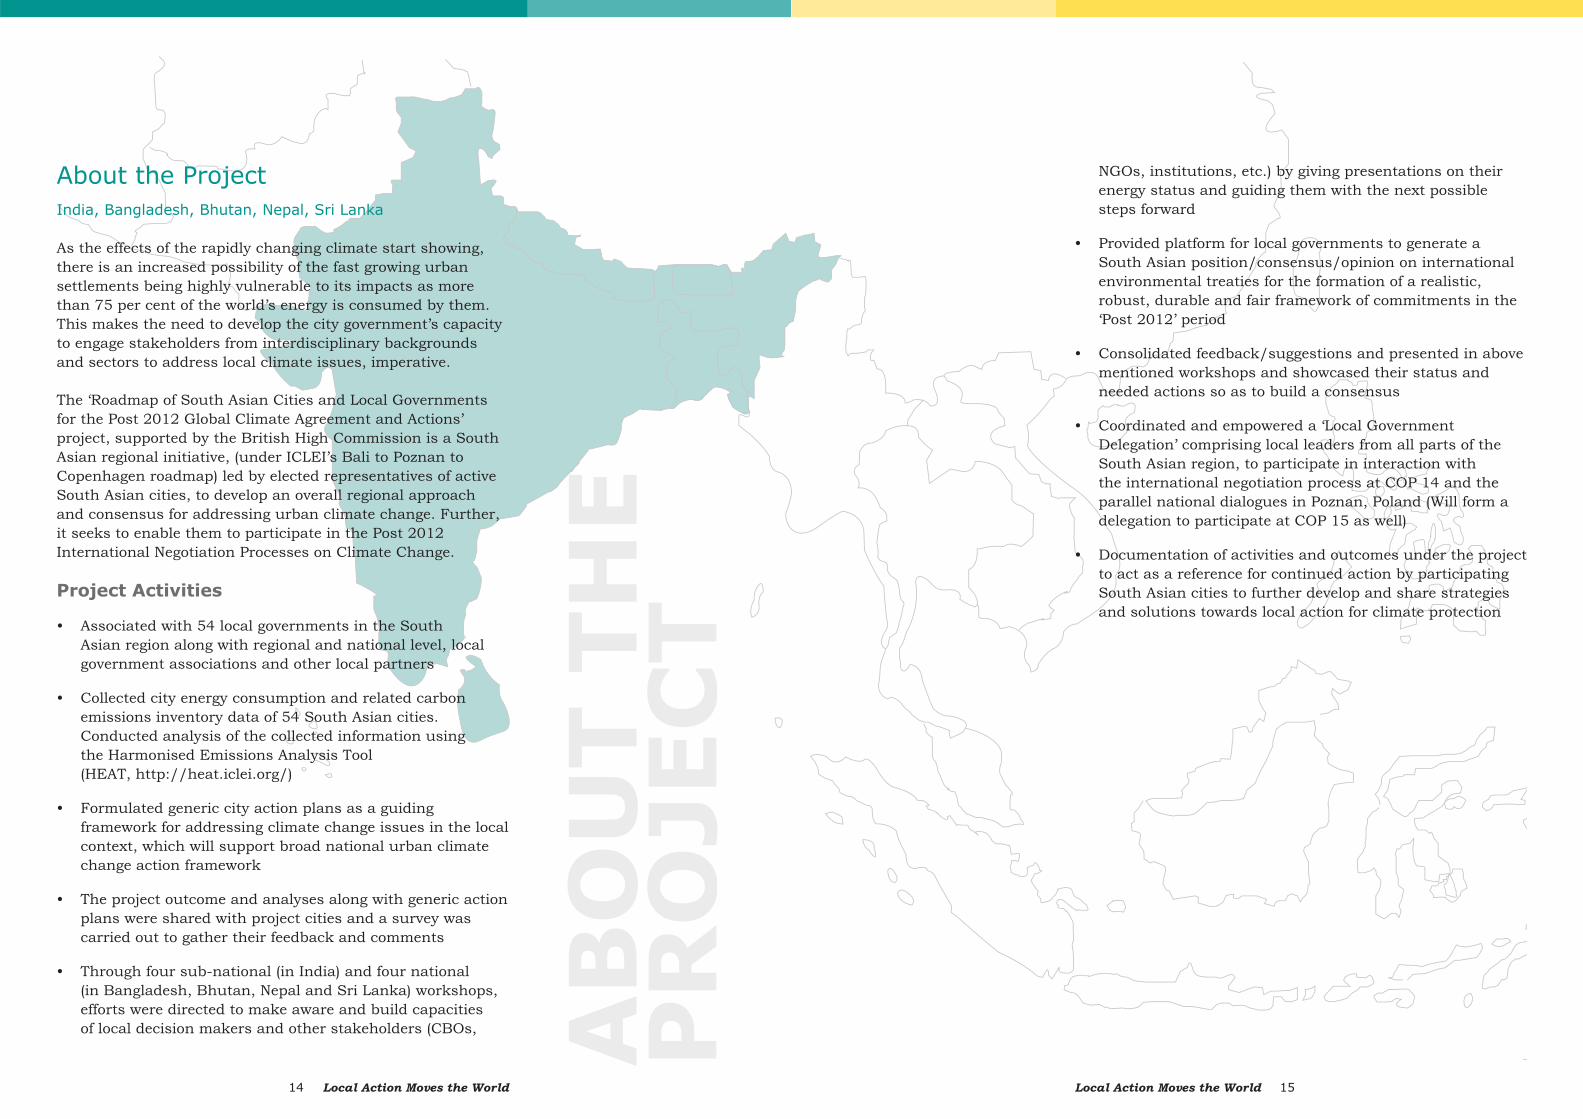
About the ProjectIndia, Bangladesh, Bhutan, Nepal, Sri Lanka
As the effects of the rapidly changing climate start showing, there is an increased possibility of the fast growing urban settlements being highly vulnerable to its impacts as more than 75 per cent of the world’s energy is consumed by them. This makes the need to develop the city government’s capacity to engage stakeholders from interdisciplinary backgrounds and sectors to address local climate issues, imperative.
The ‘Roadmap of South Asian Cities and Local Governments for the Post 2012 Global Climate Agreement and Actions’ project, supported by the British High Commission is a South Asian regional initiative, (under ICLEI’s Bali to Poznan to Copenhagen roadmap) led by elected representatives of active South Asian cities, to develop an overall regional approach and consensus for addressing urban climate change. Further, it seeks to enable them to participate in the Post 2012 International Negotiation Processes on Climate Change.
Project Activities
• Associated with 54 local governments in the South Asian region along with regional and national level, local government associations and other local partners
• Collected city energy consumption and related carbon emissions inventory data of 54 South Asian cities. Conducted analysis of the collected information using the Harmonised Emissions Analysis Tool (HEAT, http://heat.iclei.org/)
• Formulated generic city action plans as a guiding framework for addressing climate change issues in the local context, which will support broad national urban climate change action framework
• The project outcome and analyses along with generic action plans were shared with project cities and a survey was carried out to gather their feedback and comments
• Through four sub-national (in India) and four national (in Bangladesh, Bhutan, Nepal and Sri Lanka) workshops, efforts were directed to make aware and build capacities of local decision makers and other stakeholders (CBOs, AB
OU
T T
HEE
PR
OJE
CT
Local Action Moves the World16 Local Action Moves the World 17
• The same pattern has been followed for all the cities
• The names of the commissioners and mayors were taken at the time of compiling this report
Information for the Reader• The study is based on the data collected from the
engineering and administrative departments of the participating Urban Local Bodies (ULBs) to assess the energy consumption by them for services rendered to the citizens across the city. This study also collected data from relevant agencies responsible for energy supply to various sectors contributing to infrastructure growth within the city such as residential, commercial, industrial, transportation, etc., however, not owned by ULBs
• The study follows the principle drawn from WRI/WBCSD/ICLEI GHG Protocol guidelines through a structured feedback process
• The equivalent carbon emissions from the selected fuel and energy sources for local governments and community operations is calculated using Harmonised Emissions Analysis Tool (HEAT), a unique and customised emissions calculation tool/software for ULBs/local governments
• The result is arrived at through a rigorous and structured feedback process by engaging engineering and administrative staff at one level, followed by the involvement of municipal leaders, relevant institutions and ministries at another level
• The study covers the operations owned by Municipal Corporations as Corporation Level emissions (that includes all the services such as street lighting, water supply system, sewage system, etc.) and the City Level emissions that includes the rest of the city information (such as residential, transportation, commercial, etc.)
• The Community Energy Consumption includes the energy consumption information of sectors like residential, commercial, industrial, transportation, waste, others, etc. The unit has been mentioned in the middle row with the type of energy. The last column has the entire consumption fi gure of 2007-08. The second table has the entire consumption fi gure at the Corporation Level which includes street lighting, water supply system, sewage system, building and facilities, etc.
• The City Level and Corporation Level carbon emissions pattern has been shown with the help of two pie charts at the bottom of the page. The total City Level carbon emissions, city per capita has also been given in the report IN
FO
RM
ATIO
NFO
R T
HE R
EA
DER
INFO
RM
ATIO
NFO
R T
HE R
EA
DER
Measures and Metrics
Carbon Dioxide (CO2): CO2 is the reference of comparison of all GHGs.
Carbon Dioxide Equivalent (CDE): A metric measure used to compare the emissions from GHGs based on their GWP. Carbon dioxide equivalents are usually expressed as “Million Metric Tonnes of Carbon Dioxide Equivalents (MMTCDE)” or “Million Short Tonnes of Carbon Dioxide Equivalents (MSTCDE)”.
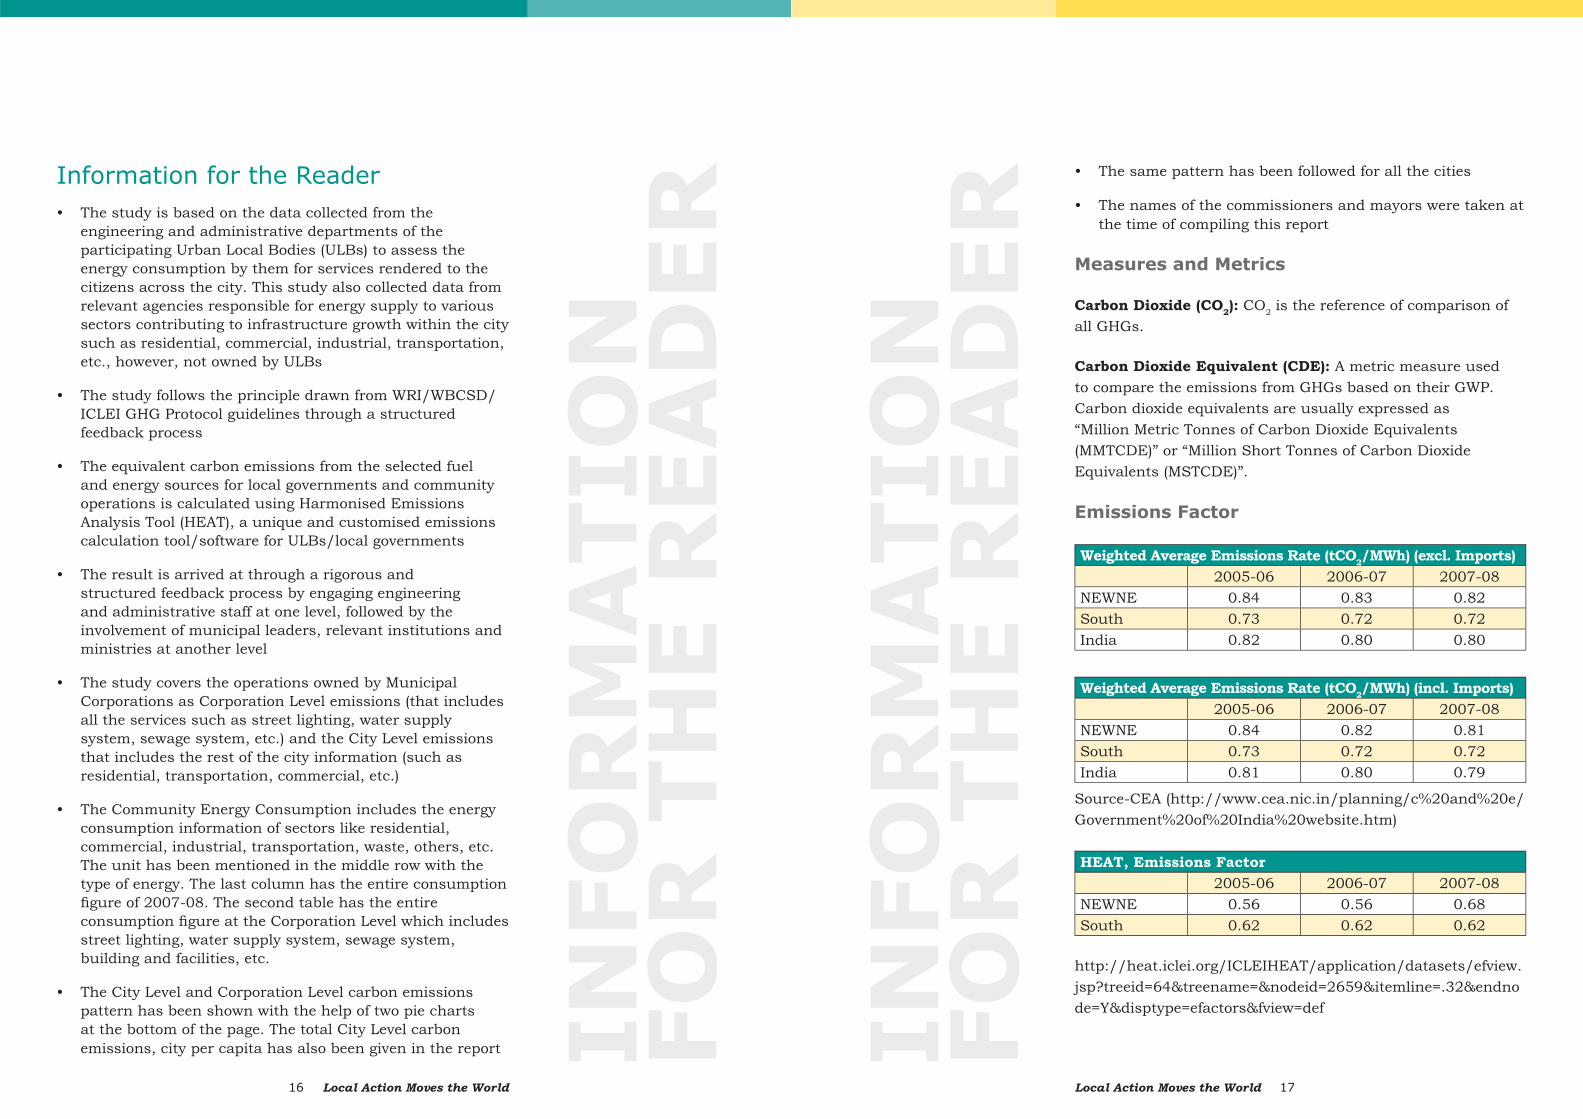
Emissions Factor
Weighted Average Emissions Rate (tCO2/MWh) (excl. Imports)2005-06 2006-07 2007-08
NEWNE 0.84 0.83 0.82South 0.73 0.72 0.72India 0.82 0.80 0.80
Weighted Average Emissions Rate (tCO2/MWh) (incl. Imports)2005-06 2006-07 2007-08
NEWNE 0.84 0.82 0.81South 0.73 0.72 0.72India 0.81 0.80 0.79
Source-CEA (http://www.cea.nic.in/planning/c%20and%20e/Government%20of%20India%20website.htm)
HEAT, Emissions Factor2005-06 2006-07 2007-08
NEWNE 0.56 0.56 0.68South 0.62 0.62 0.62
http://heat.iclei.org/ICLEIHEAT/application/datasets/efview.jsp?treeid=64&treename=&nodeid=2659&itemline=.32&endnode=Y&disptype=efactors&fview=def
Local Action Moves the World18 Local Action Moves the World 19
INFO
RM
ATIO
NFO
R T
HE R
EA
DER
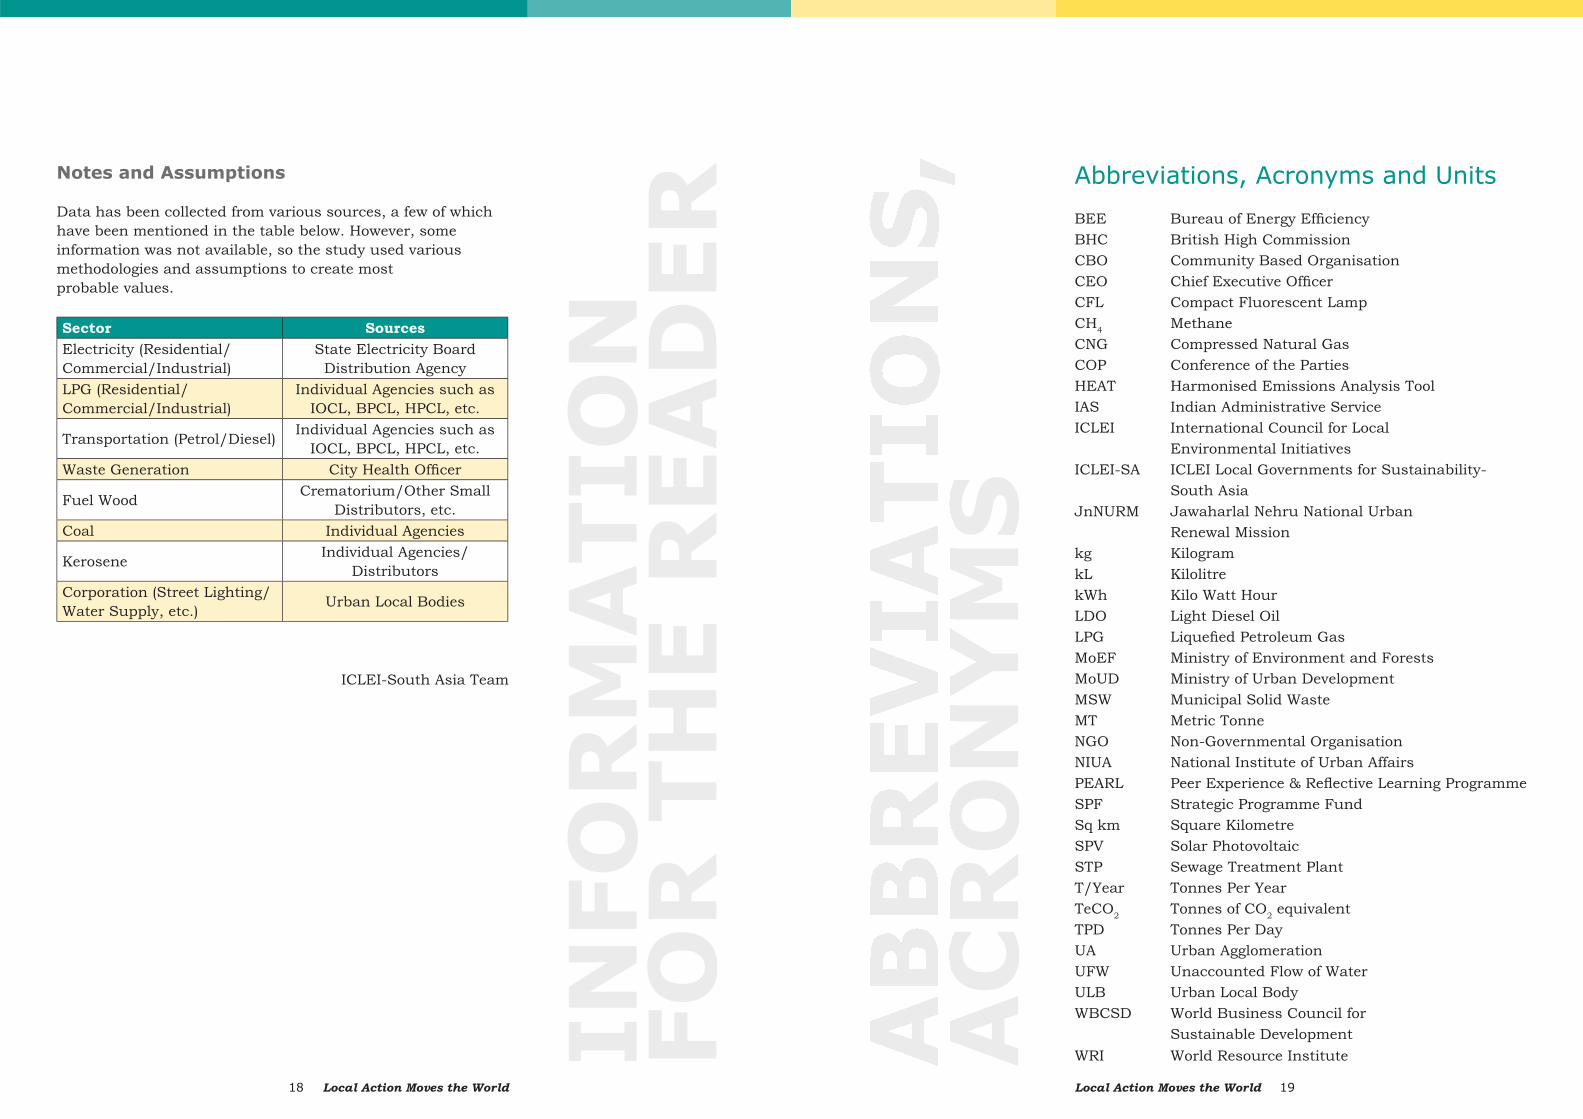
Notes and Assumptions
Data has been collected from various sources, a few of which have been mentioned in the table below. However, some information was not available, so the study used various methodologies and assumptions to create most probable values.
Sector SourcesElectricity (Residential/Commercial/Industrial)
State Electricity BoardDistribution Agency
LPG (Residential/Commercial/Industrial)
Individual Agencies such as IOCL, BPCL, HPCL, etc.
Transportation (Petrol/Diesel) Individual Agencies such as IOCL, BPCL, HPCL, etc.
Waste Generation City Health Offi cer
Fuel Wood Crematorium/Other Small Distributors, etc.
Coal Individual Agencies
Kerosene Individual Agencies/Distributors
Corporation (Street Lighting/Water Supply, etc.) Urban Local Bodies
ICLEI-South Asia Team
AC
RO
NY
MS
Abbreviations, Acronyms and Units
BEE Bureau of Energy Effi ciencyBHC British High CommissionCBO Community Based OrganisationCEO Chief Executive Offi cerCFL Compact Fluorescent LampCH4 MethaneCNG Compressed Natural Gas COP Conference of the Parties HEAT Harmonised Emissions Analysis ToolIAS Indian Administrative ServiceICLEI International Council for Local Environmental InitiativesICLEI-SA ICLEI Local Governments for Sustainability- South Asia JnNURM Jawaharlal Nehru National Urban Renewal Missionkg KilogramkL KilolitrekWh Kilo Watt HourLDO Light Diesel OilLPG Liquefi ed Petroleum GasMoEF Ministry of Environment and ForestsMoUD Ministry of Urban DevelopmentMSW Municipal Solid WasteMT Metric TonneNGO Non-Governmental OrganisationNIUA National Institute of Urban Affairs PEARL Peer Experience & Refl ective Learning ProgrammeSPF Strategic Programme FundSq km Square KilometreSPV Solar PhotovoltaicSTP Sewage Treatment PlantT/Year Tonnes Per YearTeCO2 Tonnes of CO2 equivalentTPD Tonnes Per DayUA Urban AgglomerationUFW Unaccounted Flow of WaterULB Urban Local Body WBCSD World Business Council for Sustainable Development WRI World Resource Institute
Local Action Moves the World20 Local Action Moves the World 21
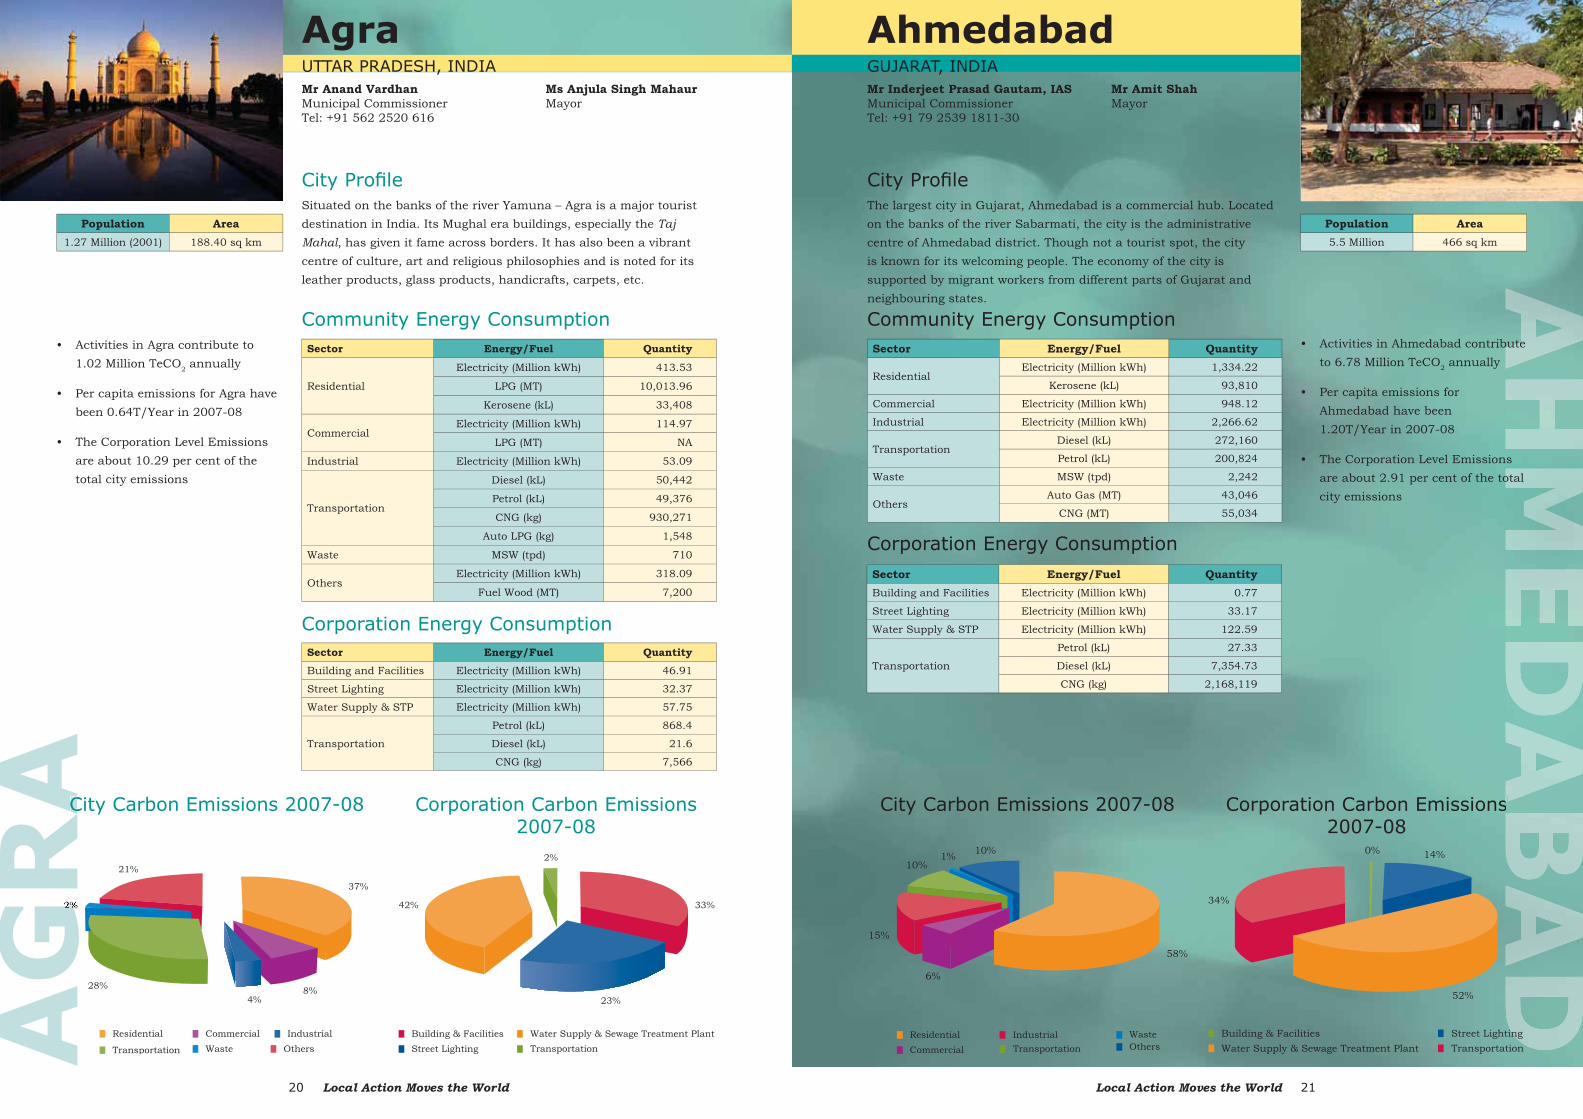
Sector Energy/Fuel Quantity
Residential
Electricity (Million kWh) 413.53
LPG (MT) 10,013.96
Kerosene (kL) 33,408
CommercialElectricity (Million kWh) 114.97
LPG (MT) NA
Industrial Electricity (Million kWh) 53.09
Transportation
Diesel (kL) 50,442
Petrol (kL) 49,376
CNG (kg) 930,271
Auto LPG (kg) 1,548
Waste MSW (tpd) 710
OthersElectricity (Million kWh) 318.09
Fuel Wood (MT) 7,200
Sector Energy/Fuel QuantityBuilding and Facilities Electricity (Million kWh) 46.91
Street Lighting Electricity (Million kWh) 32.37
Water Supply & STP Electricity (Million kWh) 57.75
Transportation
Petrol (kL) 868.4
Diesel (kL) 21.6
CNG (kg) 7,566
City Carbon Emissions 2007-08 Corporation Carbon Emissions 2007-08
Corporation Energy Consumption
• Activities in Agra contribute to 1.02 Million TeCO2 annually
• Per capita emissions for Agra have been 0.64T/Year in 2007-08
• The Corporation Level Emissions are about 10.29 per cent of the total city emissions
Situated on the banks of the river Yamuna – Agra is a major tourist destination in India. Its Mughal era buildings, especially the Taj Mahal, has given it fame across borders. It has also been a vibrant centre of culture, art and religious philosophies and is noted for its leather products, glass products, handicrafts, carpets, etc.
City Carbon Emissions 2007-08 Corporation Carbon Emissions 2007-08
City Profi le
Community Energy Consumption
AG
RA
GG
CC
UTTAR PRADESH, INDIAMr Anand Vardhan Municipal CommissionerTel: +91 562 2520 616
Ms Anjula Singh Mahaur Mayor
Agra
Population Area1.27 Million (2001) 188.40 sq km
AhmedabadGUJARAT, INDIAMr Inderjeet Prasad Gautam, IASMunicipal CommissionerTel: +91 79 2539 1811-30
Population Area5.5 Million 466 sq km
Sector Energy/Fuel Quantity
ResidentialElectricity (Million kWh) 1,334.22
Kerosene (kL) 93,810
Commercial Electricity (Million kWh) 948.12
Industrial Electricity (Million kWh) 2,266.62
TransportationDiesel (kL) 272,160
Petrol (kL) 200,824
Waste MSW (tpd) 2,242
OthersAuto Gas (MT) 43,046
CNG (MT) 55,034
Sector Energy/Fuel QuantityBuilding and Facilities Electricity (Million kWh) 0.77
Street Lighting Electricity (Million kWh) 33.17
Water Supply & STP Electricity (Million kWh) 122.59
Transportation
Petrol (kL) 27.33
Diesel (kL) 7,354.73
CNG (kg) 2,168,119
• Activities in Ahmedabad contribute to 6.78 Million TeCO2 annually
• Per capita emissions for Ahmedabad have been 1.20T/Year in 2007-08
• The Corporation Level Emissions are about 2.91 per cent of the total city emissions
The largest city in Gujarat, Ahmedabad is a commercial hub. Located on the banks of the river Sabarmati, the city is the administrative centre of Ahmedabad district. Though not a tourist spot, the city is known for its welcoming people. The economy of the city is supported by migrant workers from different parts of Gujarat and neighbouring states.
City Profi le
Community Energy Consumption
Corporation Energy Consumption
Mr Amit Shah Mayor
Local Action Moves the World22 Local Action Moves the World 23
City Carbon Emissions 2007-08 Corporation Carbon Emissions 2007-08
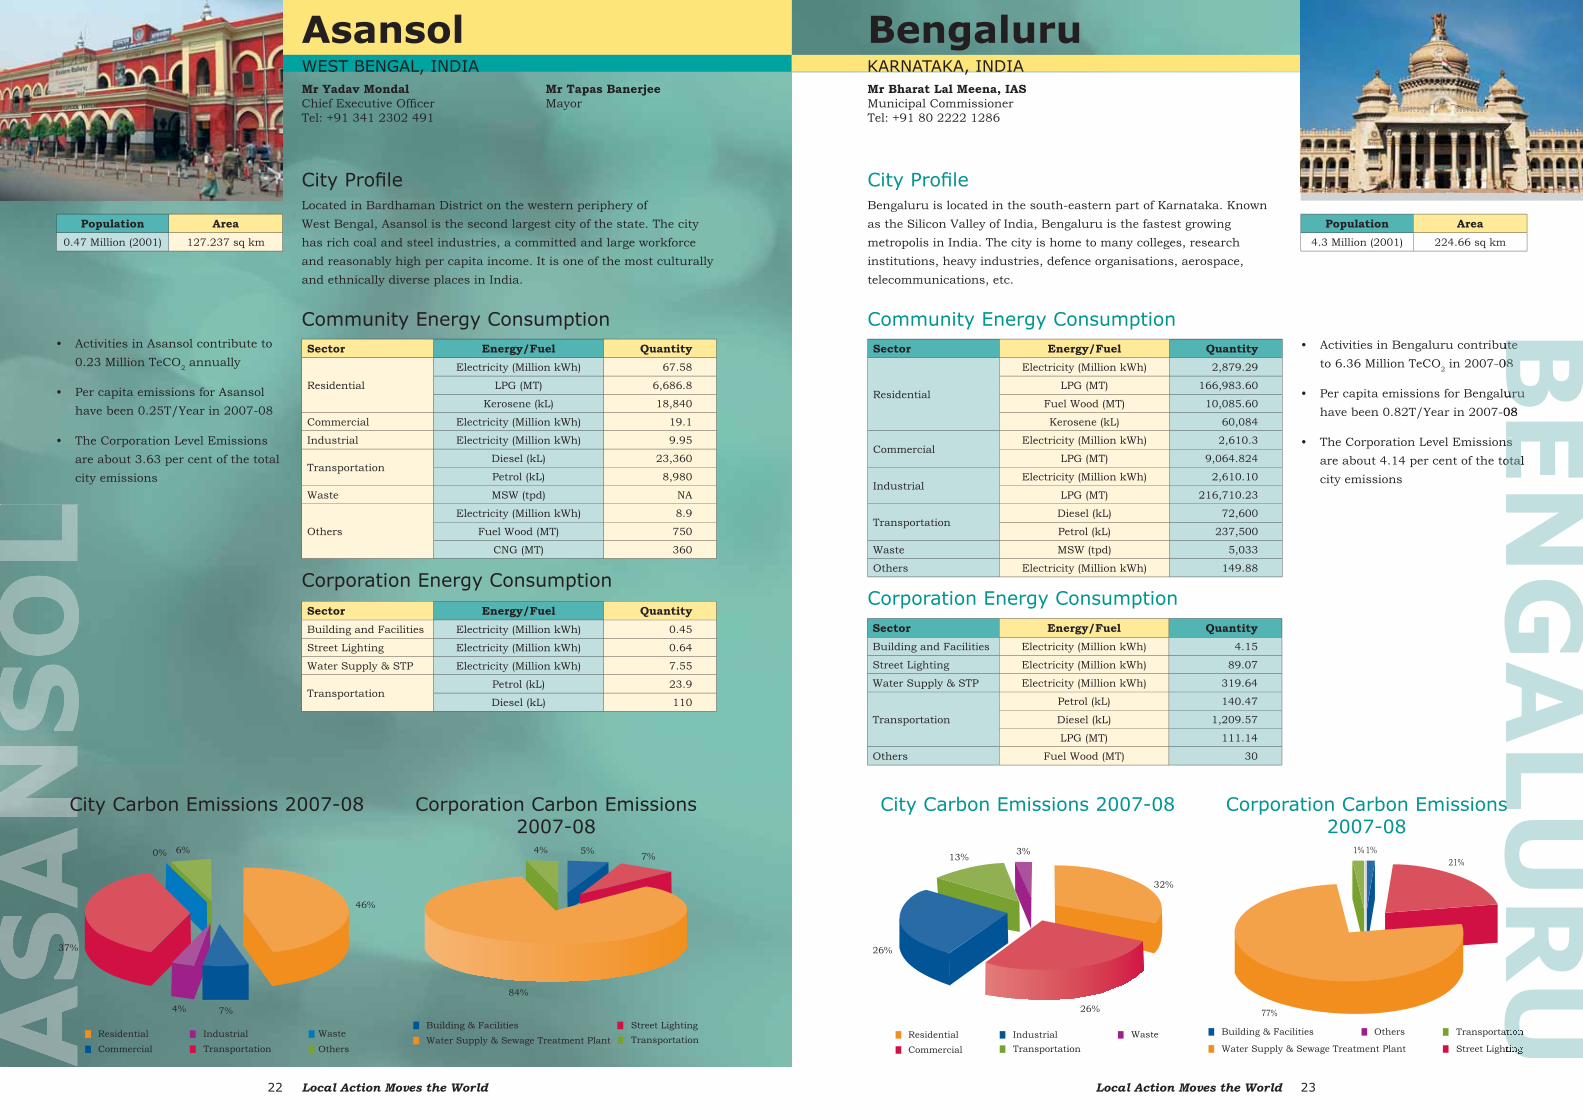
WEST BENGAL, INDIAMr Yadav Mondal Chief Executive Offi cerTel: +91 341 2302 491
Mr Tapas BanerjeeMayor
Located in Bardhaman District on the western periphery of West Bengal, Asansol is the second largest city of the state. The city has rich coal and steel industries, a committed and large workforce and reasonably high per capita income. It is one of the most culturally and ethnically diverse places in India.
City Profi le
Sector Energy/Fuel Quantity
Residential
Electricity (Million kWh) 67.58
LPG (MT) 6,686.8
Kerosene (kL) 18,840
Commercial Electricity (Million kWh) 19.1
Industrial Electricity (Million kWh) 9.95
TransportationDiesel (kL) 23,360
Petrol (kL) 8,980
Waste MSW (tpd) NA
Others
Electricity (Million kWh) 8.9
Fuel Wood (MT) 750
CNG (MT) 360
Sector Energy/Fuel QuantityBuilding and Facilities Electricity (Million kWh) 0.45
Street Lighting Electricity (Million kWh) 0.64
Water Supply & STP Electricity (Million kWh) 7.55
TransportationPetrol (kL) 23.9
Diesel (kL) 110
Corporation Energy Consumption
Community Energy Consumption• Activities in Asansol contribute to
0.23 Million TeCO2 annually
• Per capita emissions for Asansol have been 0.25T/Year in 2007-08
• The Corporation Level Emissions are about 3.63 per cent of the total city emissions
Population Area0.47 Million (2001) 127.237 sq km
Population Area4.3 Million (2001) 224.66 sq km
• Activities in Bengaluru contribute to 6.36 Million TeCO2 in 2007-08
• Per capita emissions for Bengaluru have been 0.82T/Year in 2007-08
• The Corporation Level Emissions are about 4.14 per cent of the total city emissions
BEN
GA
LU
RU
ute ute 088
uru uru 08
ns s otal otal
UUUUUUUUUU
City Carbon Emissions 2007-08 Corporation Carbon Emissions 2007-08
BengaluruMr Bharat Lal Meena, IASMunicipal CommissionerTel: +91 80 2222 1286
Sector Energy/Fuel Quantity
Residential
Electricity (Million kWh) 2,879.29
LPG (MT) 166,983.60
Fuel Wood (MT) 10,085.60
Kerosene (kL) 60,084
CommercialElectricity (Million kWh) 2,610.3
LPG (MT) 9,064.824
IndustrialElectricity (Million kWh) 2,610.10
LPG (MT) 216,710.23
TransportationDiesel (kL) 72,600
Petrol (kL) 237,500
Waste MSW (tpd) 5,033
Others Electricity (Million kWh) 149.88
Sector Energy/Fuel QuantityBuilding and Facilities Electricity (Million kWh) 4.15
Street Lighting Electricity (Million kWh) 89.07
Water Supply & STP Electricity (Million kWh) 319.64
Transportation
Petrol (kL) 140.47
Diesel (kL) 1,209.57
LPG (MT) 111.14
Others Fuel Wood (MT) 30
Bengaluru is located in the south-eastern part of Karnataka. Known as the Silicon Valley of India, Bengaluru is the fastest growing metropolis in India. The city is home to many colleges, research institutions, heavy industries, defence organisations, aerospace, telecommunications, etc.
Corporation Energy Consumption
City Profi le
Community Energy Consumption
KARNATAKA, INDIA
Asansol
Local Action Moves the World24 Local Action Moves the World 25
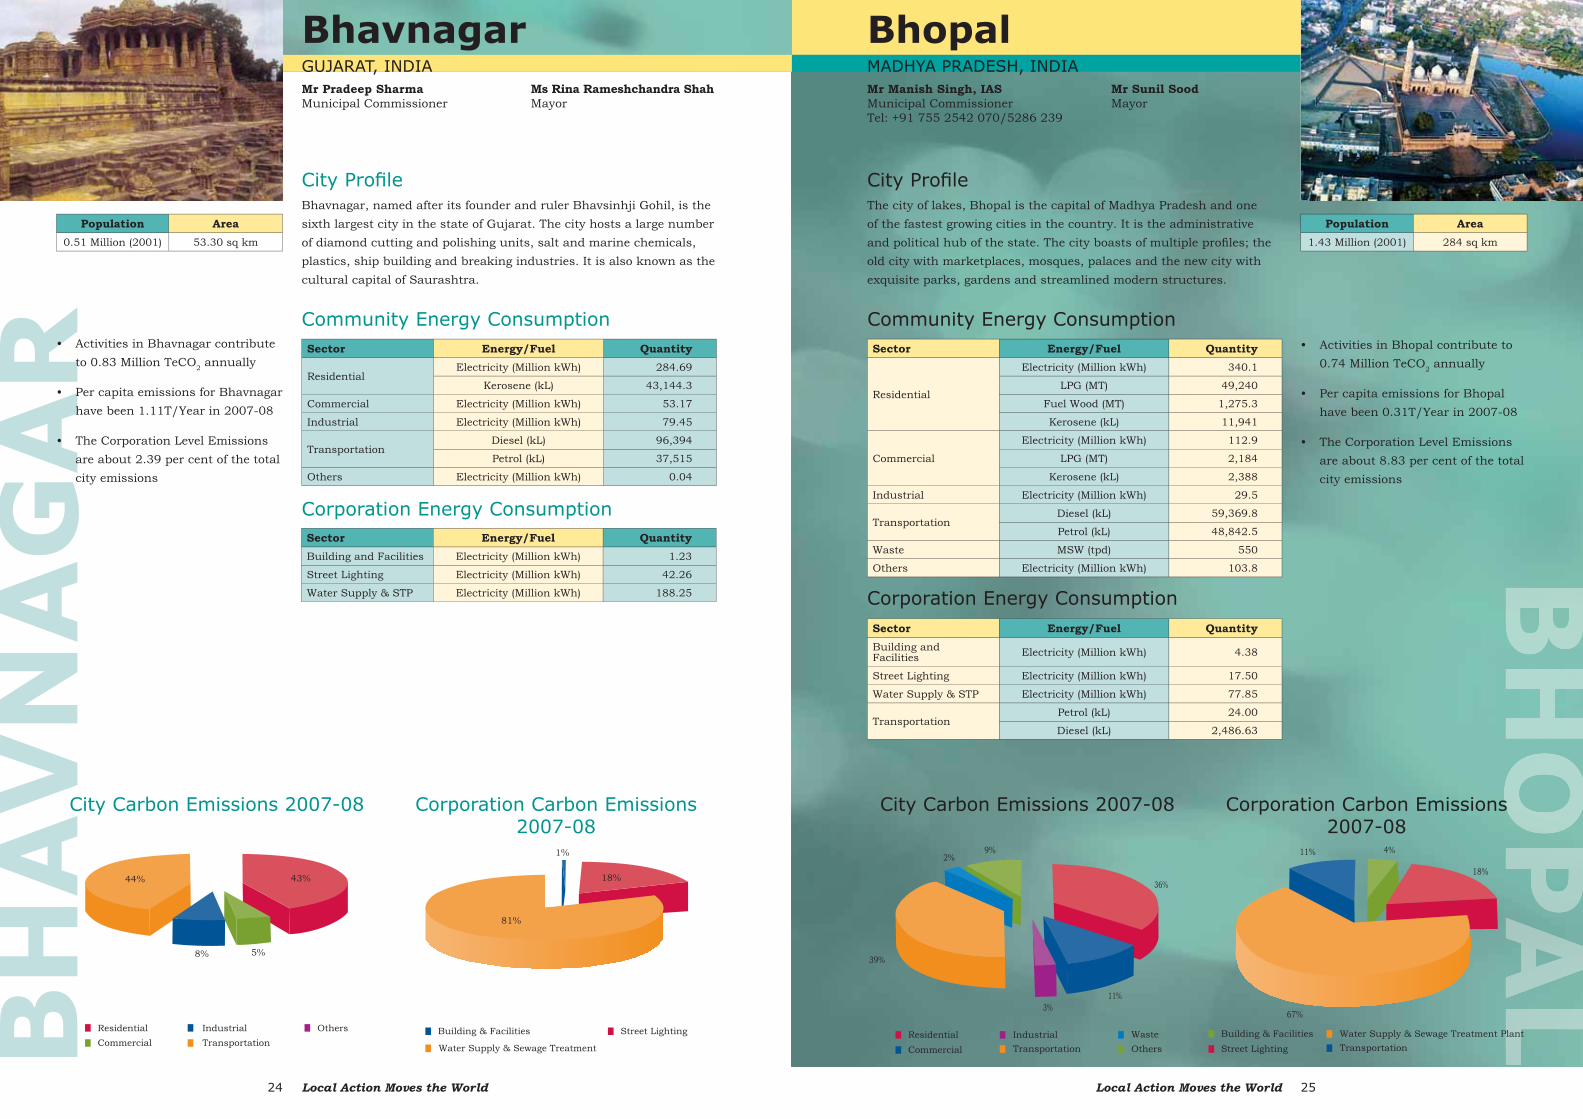
BhopalMADHYA PRADESH, INDIAMr Manish Singh, IASMunicipal CommissionerTel: +91 755 2542 070/5286 239
Population Area1.43 Million (2001) 284 sq km
Sector Energy/Fuel Quantity
Residential
Electricity (Million kWh) 340.1
LPG (MT) 49,240
Fuel Wood (MT) 1,275.3
Kerosene (kL) 11,941
Commercial
Electricity (Million kWh) 112.9
LPG (MT) 2,184
Kerosene (kL) 2,388
Industrial Electricity (Million kWh) 29.5
TransportationDiesel (kL) 59,369.8
Petrol (kL) 48,842.5
Waste MSW (tpd) 550
Others Electricity (Million kWh) 103.8
Sector Energy/Fuel QuantityBuilding andFacilities Electricity (Million kWh) 4.38
Street Lighting Electricity (Million kWh) 17.50
Water Supply & STP Electricity (Million kWh) 77.85
TransportationPetrol (kL) 24.00
Diesel (kL) 2,486.63
• Activities in Bhopal contribute to 0.74 Million TeCO2 annually
• Per capita emissions for Bhopal have been 0.31T/Year in 2007-08
• The Corporation Level Emissions are about 8.83 per cent of the total city emissions
The city of lakes, Bhopal is the capital of Madhya Pradesh and one of the fastest growing cities in the country. It is the administrative and political hub of the state. The city boasts of multiple profi les; the old city with marketplaces, mosques, palaces and the new city with exquisite parks, gardens and streamlined modern structures.
Corporation Energy Consumption
City Carbon Emissions 2007-08 Corporation Carbon Emissions 2007-08
City Profi le
Community Energy Consumption
Mr Sunil SoodMayor
BH
AV
NA
GA
RBhavnagarGUJARAT, INDIAMr Pradeep Sharma Municipal Commissioner
Population Area0.51 Million (2001) 53.30 sq km
Sector Energy/Fuel Quantity
ResidentialElectricity (Million kWh) 284.69
Kerosene (kL) 43,144.3
Commercial Electricity (Million kWh) 53.17
Industrial Electricity (Million kWh) 79.45
TransportationDiesel (kL) 96,394
Petrol (kL) 37,515
Others Electricity (Million kWh) 0.04
Sector Energy/Fuel QuantityBuilding and Facilities Electricity (Million kWh) 1.23
Street Lighting Electricity (Million kWh) 42.26
Water Supply & STP Electricity (Million kWh) 188.25
• Activities in Bhavnagar contribute to 0.83 Million TeCO2 annually
• Per capita emissions for Bhavnagar have been 1.11T/Year in 2007-08
• The Corporation Level Emissions are about 2.39 per cent of the total city emissions
Bhavnagar, named after its founder and ruler Bhavsinhji Gohil, is the sixth largest city in the state of Gujarat. The city hosts a large number of diamond cutting and polishing units, salt and marine chemicals, plastics, ship building and breaking industries. It is also known as the cultural capital of Saurashtra.
Corporation Energy Consumption
City Carbon Emissions 2007-08 Corporation Carbon Emissions 2007-08
City Profi le
Community Energy Consumption
Ms Rina Rameshchandra ShahMayor
Local Action Moves the World26 Local Action Moves the World 27
CH
EN
NA
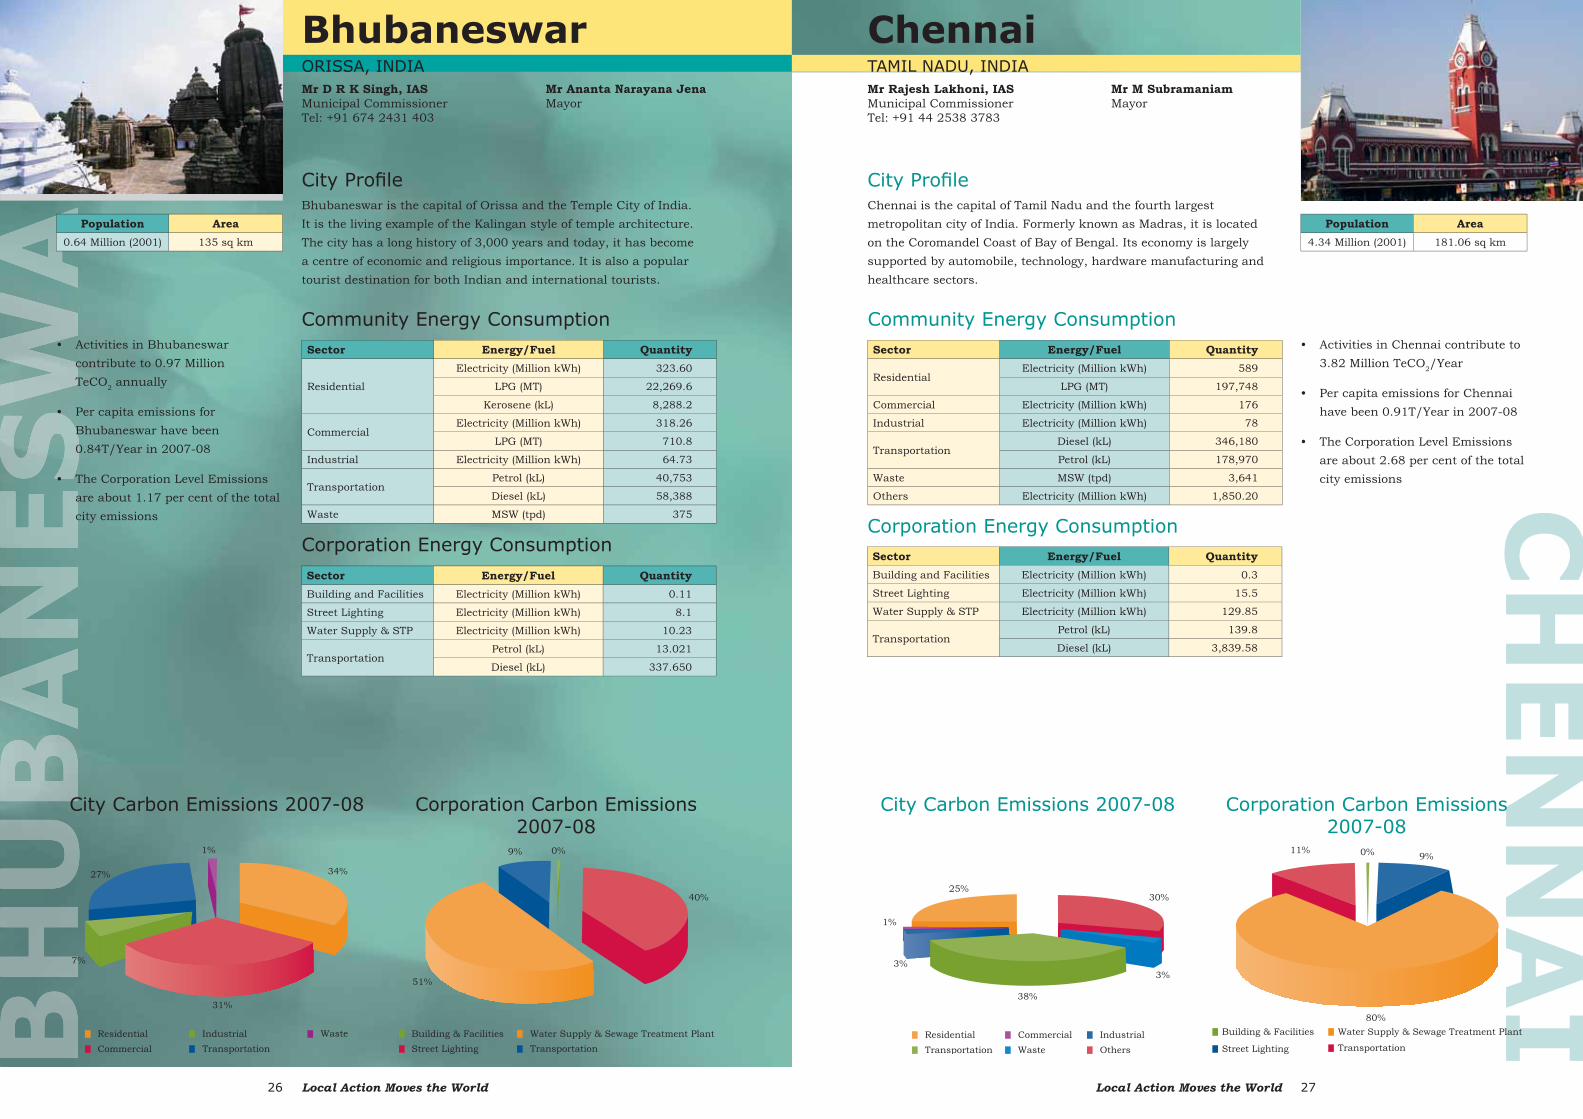
IChennaiTAMIL NADU, INDIAMr Rajesh Lakhoni, IASMunicipal CommissionerTel: +91 44 2538 3783
Population Area4.34 Million (2001) 181.06 sq km
Sector Energy/Fuel Quantity
ResidentialElectricity (Million kWh) 589
LPG (MT) 197,748
Commercial Electricity (Million kWh) 176
Industrial Electricity (Million kWh) 78
TransportationDiesel (kL) 346,180
Petrol (kL) 178,970
Waste MSW (tpd) 3,641
Others Electricity (Million kWh) 1,850.20
Sector Energy/Fuel QuantityBuilding and Facilities Electricity (Million kWh) 0.3
Street Lighting Electricity (Million kWh) 15.5
Water Supply & STP Electricity (Million kWh) 129.85
TransportationPetrol (kL) 139.8
Diesel (kL) 3,839.58
• Activities in Chennai contribute to 3.82 Million TeCO2/Year
• Per capita emissions for Chennai have been 0.91T/Year in 2007-08
• The Corporation Level Emissions are about 2.68 per cent of the total city emissions
Chennai is the capital of Tamil Nadu and the fourth largest metropolitan city of India. Formerly known as Madras, it is located on the Coromandel Coast of Bay of Bengal. Its economy is largely supported by automobile, technology, hardware manufacturing and healthcare sectors.
Corporation Energy Consumption
City Carbon Emissions 2007-08 Corporation Carbon Emissions 2007-08
City Profi le
Community Energy Consumption
Mr M SubramaniamMayor
BhubaneswarORISSA, INDIAMr D R K Singh, IASMunicipal CommissionerTel: +91 674 2431 403
Population Area0.64 Million (2001) 135 sq km
Sector Energy/Fuel Quantity
Residential
Electricity (Million kWh) 323.60
LPG (MT) 22,269.6
Kerosene (kL) 8,288.2
CommercialElectricity (Million kWh) 318.26
LPG (MT) 710.8
Industrial Electricity (Million kWh) 64.73
TransportationPetrol (kL) 40,753
Diesel (kL) 58,388
Waste MSW (tpd) 375
Sector Energy/Fuel QuantityBuilding and Facilities Electricity (Million kWh) 0.11
Street Lighting Electricity (Million kWh) 8.1
Water Supply & STP Electricity (Million kWh) 10.23
TransportationPetrol (kL) 13.021
Diesel (kL) 337.650
• Activities in Bhubaneswar contribute to 0.97 Million TeCO2 annually
• Per capita emissions for Bhubaneswar have been 0.84T/Year in 2007-08
• The Corporation Level Emissions are about 1.17 per cent of the total city emissions
Bhubaneswar is the capital of Orissa and the Temple City of India. It is the living example of the Kalingan style of temple architecture. The city has a long history of 3,000 years and today, it has become a centre of economic and religious importance. It is also a popular tourist destination for both Indian and international tourists.
Corporation Energy Consumption
City Carbon Emissions 2007-08 Corporation Carbon Emissions 2007-08
City Profi le
Community Energy Consumption
Mr Ananta Narayana JenaMayor
Local Action Moves the World28 Local Action Moves the World 29
DehradunUTTARAKHAND, INDIAMr Indudhar DudaiMunicipal CommissionerTel: +91 135 2657 884/2655 620
Population Area0.42 Million (2001) 300 sq km
Sector Energy/Fuel Quantity
Residential
Electricity (Million kWh) 234.66
LPG (MT) 28,699
Kerosene (kL) 10,668
Commercial Electricity (Million kWh) 192.7
Industrial Electricity (Million kWh) 19.34
TransportationDiesel (kL) 44,435
Petrol (kL) 42,457
Waste MSW (tpd) 143
OthersFuel Wood (MT) 525
Electricity (Million kWh) 10.16
Sector Energy/Fuel QuantityBuilding and Facilities Electricity (Million kWh) 0.06
Street Lighting Electricity (Million kWh) 17.56
Water Supply & STP Electricity (Million kWh) 42.08
TransportationPetrol (kL) 22.99
Diesel (kL) 119.40
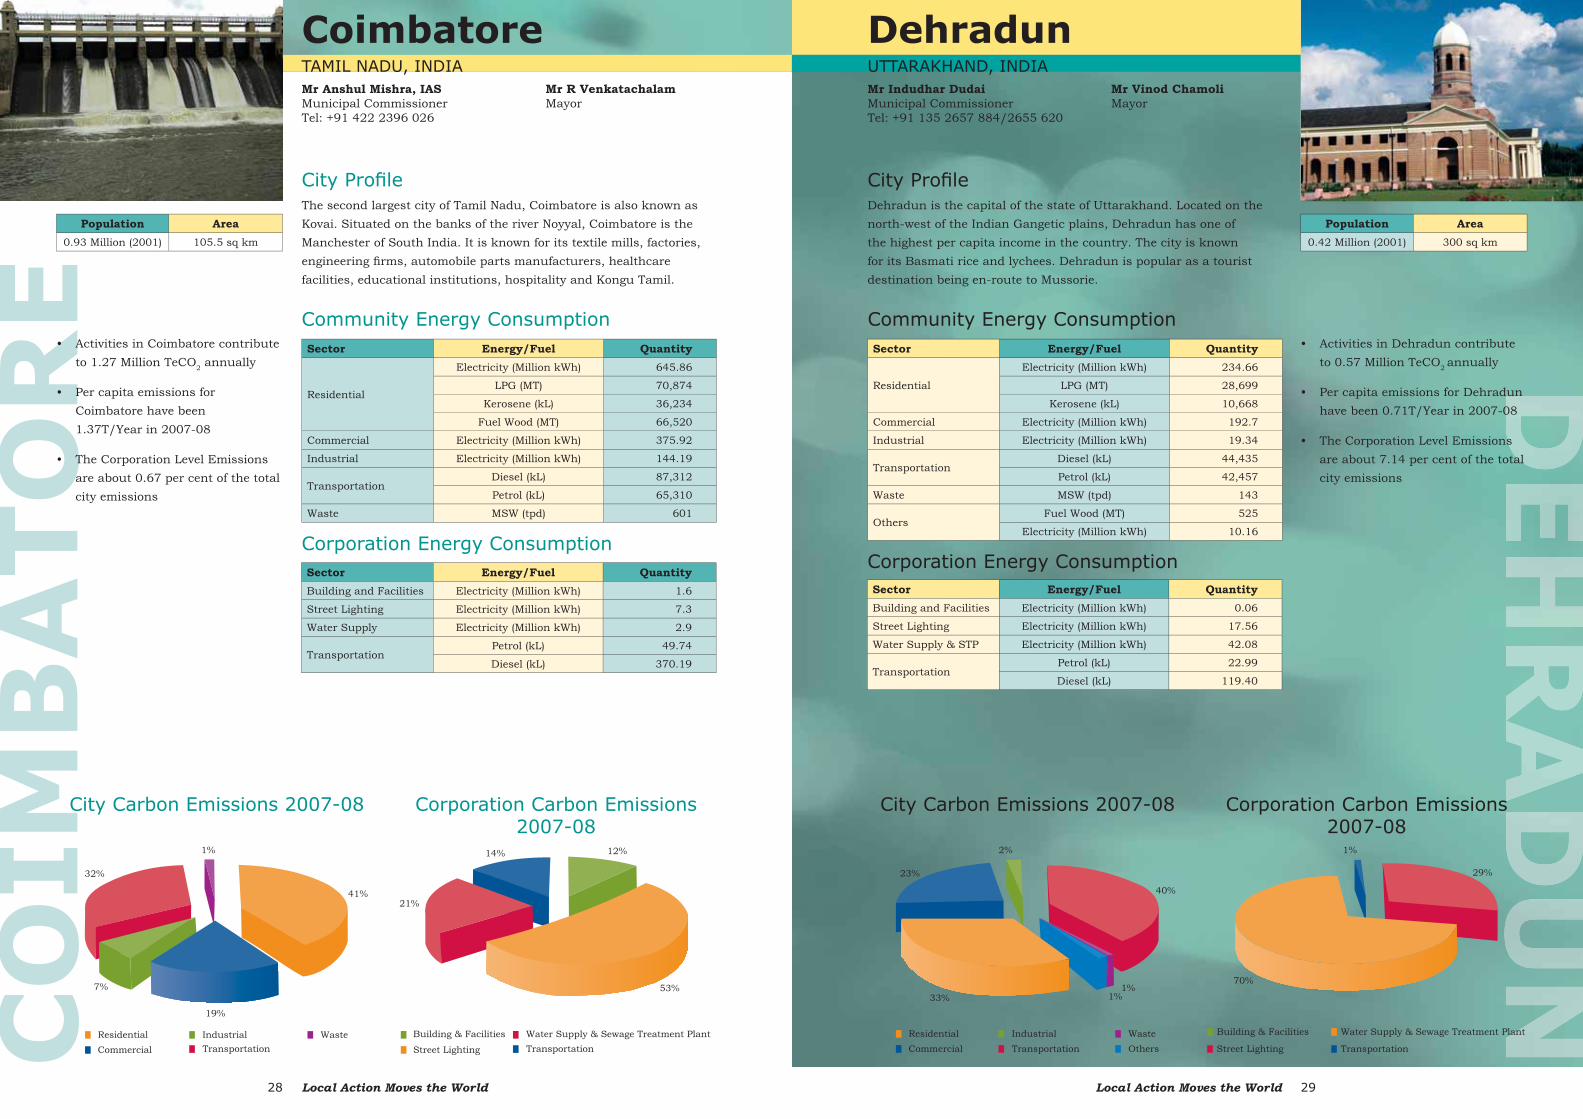
• Activities in Dehradun contribute to 0.57 Million TeCO2 annually
• Per capita emissions for Dehradun have been 0.71T/Year in 2007-08
• The Corporation Level Emissions are about 7.14 per cent of the total city emissions
Dehradun is the capital of the state of Uttarakhand. Located on the north-west of the Indian Gangetic plains, Dehradun has one of the highest per capita income in the country. The city is known for its Basmati rice and lychees. Dehradun is popular as a tourist destination being en-route to Mussorie.
Corporation Energy Consumption
City Carbon Emissions 2007-08 Corporation Carbon Emissions 2007-08
City Profi le
Community Energy Consumption
Mr Vinod ChamoliMayor
CO
IMB
ATO
RE
CoimbatoreTAMIL NADU, INDIAMr Anshul Mishra, IASMunicipal CommissionerTel: +91 422 2396 026
Population Area0.93 Million (2001) 105.5 sq km
Sector Energy/Fuel Quantity
Residential
Electricity (Million kWh) 645.86
LPG (MT) 70,874
Kerosene (kL) 36,234
Fuel Wood (MT) 66,520
Commercial Electricity (Million kWh) 375.92
Industrial Electricity (Million kWh) 144.19
TransportationDiesel (kL) 87,312
Petrol (kL) 65,310
Waste MSW (tpd) 601
Sector Energy/Fuel QuantityBuilding and Facilities Electricity (Million kWh) 1.6
Street Lighting Electricity (Million kWh) 7.3
Water Supply Electricity (Million kWh) 2.9
TransportationPetrol (kL) 49.74
Diesel (kL) 370.19
• Activities in Coimbatore contribute to 1.27 Million TeCO2 annually
• Per capita emissions for Coimbatore have been 1.37T/Year in 2007-08
• The Corporation Level Emissions are about 0.67 per cent of the total city emissions
The second largest city of Tamil Nadu, Coimbatore is also known as Kovai. Situated on the banks of the river Noyyal, Coimbatore is the Manchester of South India. It is known for its textile mills, factories, engineering fi rms, automobile parts manufacturers, healthcare facilities, educational institutions, hospitality and Kongu Tamil.
Corporation Energy Consumption
City Carbon Emissions 2007-08 Corporation Carbon Emissions 2007-08
City Profi le
Community Energy Consumption
Mr R VenkatachalamMayor
Local Action Moves the World30 Local Action Moves the World 31
GU
NTU
RGunturANDHRA PRADESH, INDIAMr K Ilambarithi, IASMunicipal CommissionerTel: +91 863 2224 202/2241 689
Population Area0.51 Million (2001) 63.15 sq km
Sector Energy/Fuel Quantity
Residential
Electricity (Million kWh) 255
LPG (MT) 645,293.87
Kerosene (kL) 1,733
Fuel Wood (MT) 14,888
Commercial
Electricity (Million kWh) 250
LPG (MT) 19,929.13
Kerosene (kL) 174
Industrial Electricity (Million kWh) 93.75
TransportationDiesel (kL) 20,200
Petrol (kL) 25,700
Waste MSW (tpd) 356
Others Electricity (Million kWh) 10.03
Sector Energy/Fuel QuantityBuilding and Facilities Electricity (Million kWh) 1.97
Street Lighting Electricity (Million kWh) 5.29
Water Supply & STP Electricity (Million kWh) 6.56
TransportationPetrol (kL) 6.54
Diesel (kL) 331.56
Others Petrol & Diesel (kL) 9
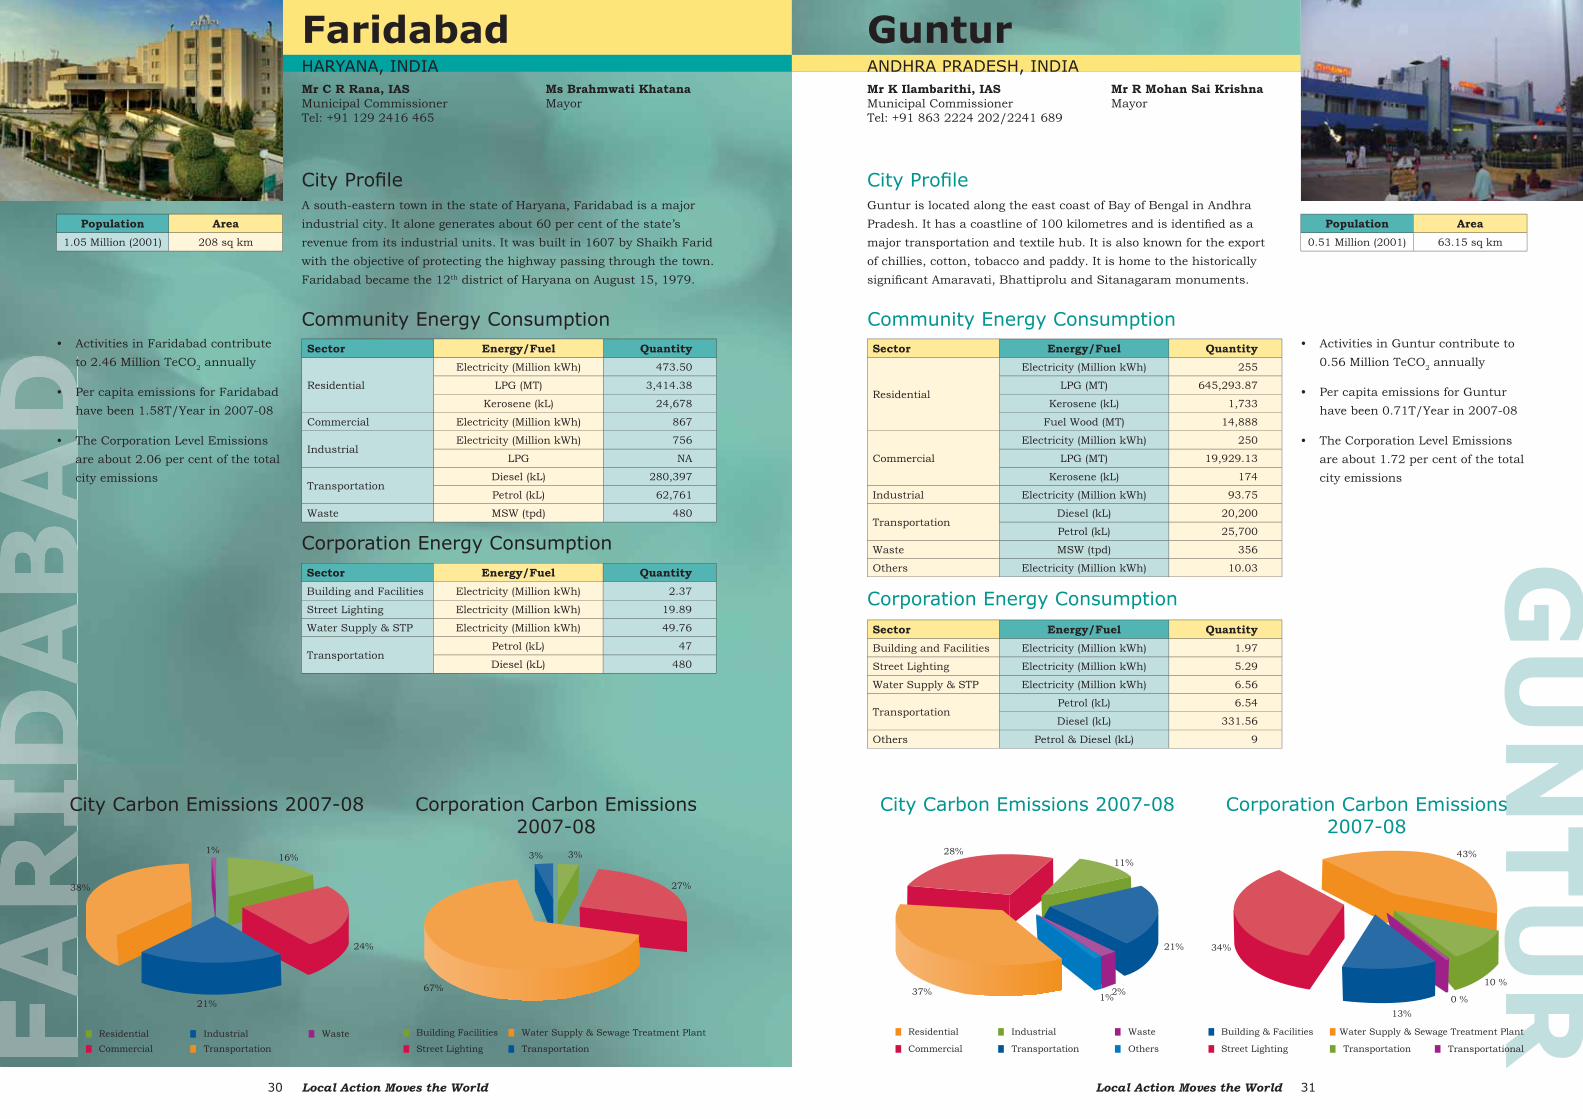
• Activities in Guntur contribute to 0.56 Million TeCO2 annually
• Per capita emissions for Guntur have been 0.71T/Year in 2007-08
• The Corporation Level Emissions are about 1.72 per cent of the total city emissions
Guntur is located along the east coast of Bay of Bengal in Andhra Pradesh. It has a coastline of 100 kilometres and is identifi ed as a major transportation and textile hub. It is also known for the export of chillies, cotton, tobacco and paddy. It is home to the historically signifi cant Amaravati, Bhattiprolu and Sitanagaram monuments.
Corporation Energy Consumption
City Carbon Emissions 2007-08 Corporation Carbon Emissions 2007-08
City Profi le
Community Energy Consumption
Mr R Mohan Sai KrishnaMayor
FaridabadHARYANA, INDIAMr C R Rana, IASMunicipal CommissionerTel: +91 129 2416 465
Population Area1.05 Million (2001) 208 sq km
Sector Energy/Fuel Quantity
Residential
Electricity (Million kWh) 473.50
LPG (MT) 3,414.38
Kerosene (kL) 24,678
Commercial Electricity (Million kWh) 867
IndustrialElectricity (Million kWh) 756
LPG NA
TransportationDiesel (kL) 280,397
Petrol (kL) 62,761
Waste MSW (tpd) 480
Sector Energy/Fuel QuantityBuilding and Facilities Electricity (Million kWh) 2.37
Street Lighting Electricity (Million kWh) 19.89
Water Supply & STP Electricity (Million kWh) 49.76
TransportationPetrol (kL) 47
Diesel (kL) 480
• Activities in Faridabad contribute to 2.46 Million TeCO2 annually
• Per capita emissions for Faridabad have been 1.58T/Year in 2007-08
• The Corporation Level Emissions are about 2.06 per cent of the total city emissions
A south-eastern town in the state of Haryana, Faridabad is a major industrial city. It alone generates about 60 per cent of the state’s revenue from its industrial units. It was built in 1607 by Shaikh Farid with the objective of protecting the highway passing through the town. Faridabad became the 12th district of Haryana on August 15, 1979.
Corporation Energy Consumption
City Carbon Emissions 2007-08 Corporation Carbon Emissions 2007-08
City Profi le
Community Energy Consumption
Ms Brahmwati KhatanaMayor
Local Action Moves the World32 Local Action Moves the World 33
RGwaliorMADHYA PRADESH, INDIAMr Pawan Kumar Sharma, IASMunicipal CommissionerTel: +91 751 2438 300
Population Area0.82 Million (2001) 289.5 sq km
Sector Energy/Fuel Quantity
Residential
Electricity (Million kWh) 253.30
Kerosene (kL) 9,461
Fuel Wood (MT) 1,020
CommercialElectricity (Million kWh) 105.4
LPG (MT) 881
Industrial Electricity (Million kWh) 28.5
TransportationDiesel (kL) 50,203.3
Petrol (kL) 20,460
Waste MSW (tpd) 285
Sector Energy/Fuel QuantityBuilding and Facilities Electricity (Million kWh) 1.53
Street Lighting Electricity (Million kWh) 6.67
Water Supply & STP Electricity (Million kWh) 27.22
TransportationPetrol (kL) 20.46
Diesel (kL) 2,001.73
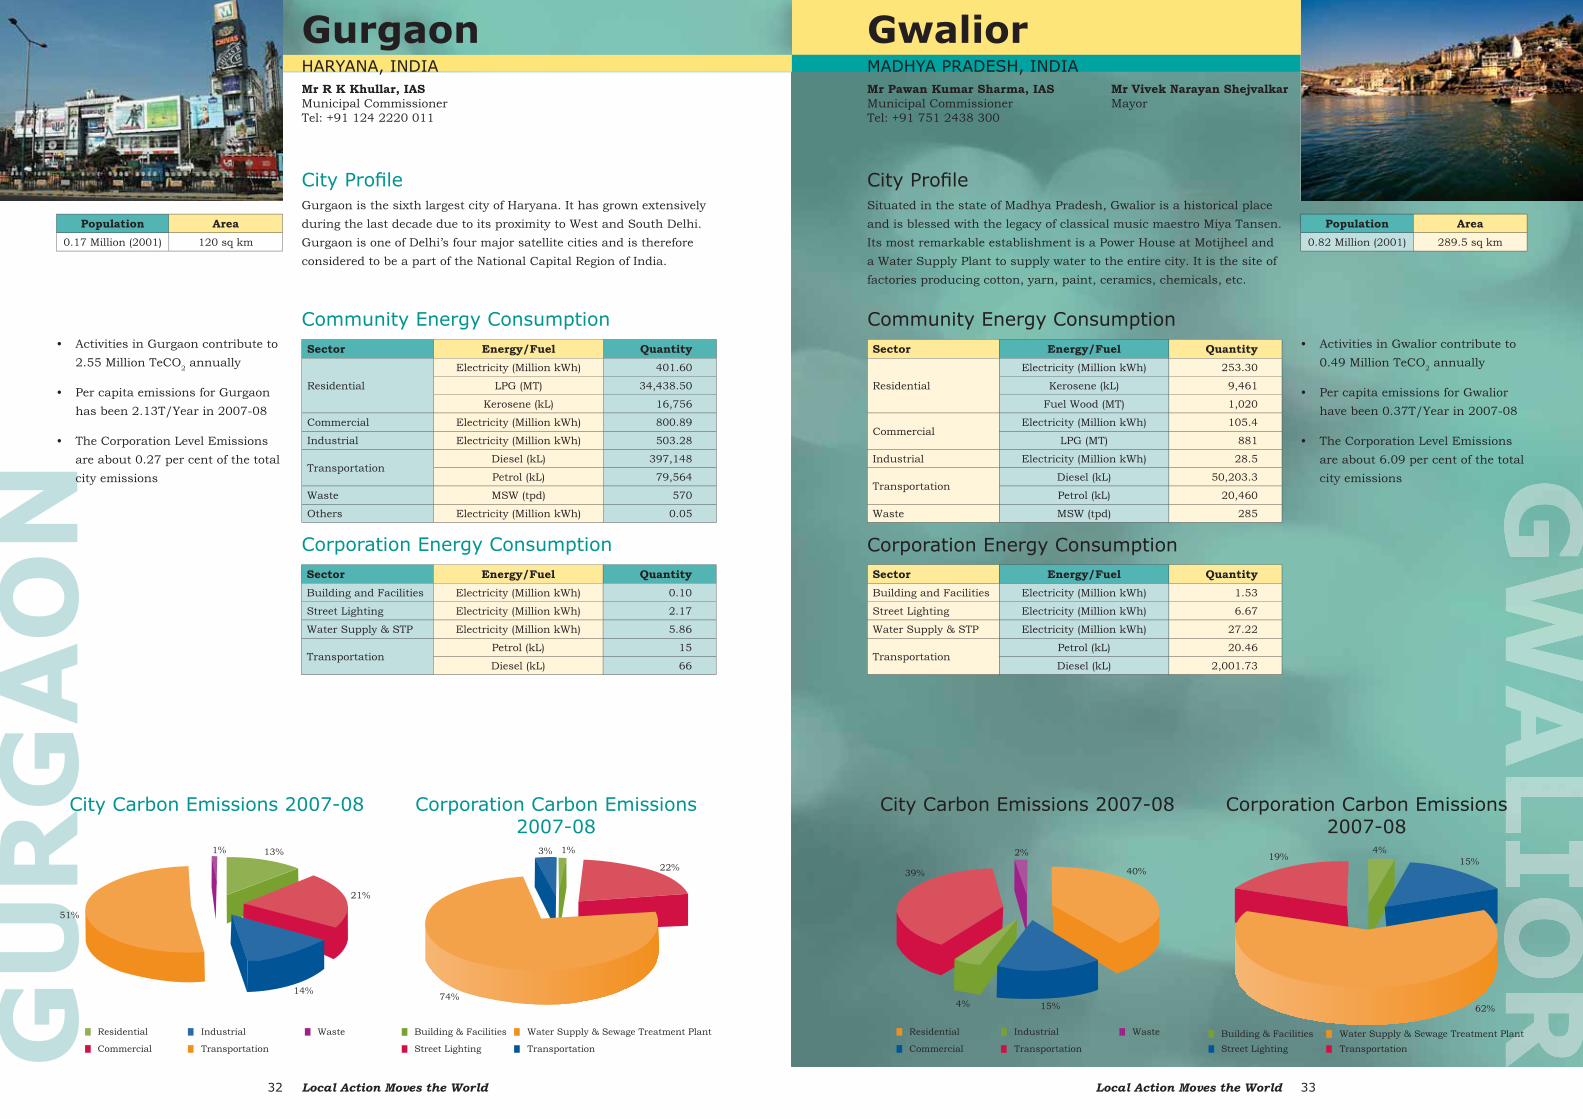
• Activities in Gwalior contribute to 0.49 Million TeCO2 annually
• Per capita emissions for Gwalior have been 0.37T/Year in 2007-08
• The Corporation Level Emissions are about 6.09 per cent of the total city emissions
Situated in the state of Madhya Pradesh, Gwalior is a historical place and is blessed with the legacy of classical music maestro Miya Tansen. Its most remarkable establishment is a Power House at Motijheel and a Water Supply Plant to supply water to the entire city. It is the site of factories producing cotton, yarn, paint, ceramics, chemicals, etc.
Corporation Energy Consumption
City Carbon Emissions 2007-08 Corporation Carbon Emissions 2007-08
City Profi le
Community Energy Consumption
Mr Vivek Narayan ShejvalkarMayor
GU
RG
AO
NGurgaonHARYANA, INDIAMr R K Khullar, IASMunicipal CommissionerTel: +91 124 2220 011
Population Area0.17 Million (2001) 120 sq km
Sector Energy/Fuel Quantity
Residential
Electricity (Million kWh) 401.60
LPG (MT) 34,438.50
Kerosene (kL) 16,756
Commercial Electricity (Million kWh) 800.89
Industrial Electricity (Million kWh) 503.28
TransportationDiesel (kL) 397,148
Petrol (kL) 79,564
Waste MSW (tpd) 570
Others Electricity (Million kWh) 0.05
Sector Energy/Fuel QuantityBuilding and Facilities Electricity (Million kWh) 0.10
Street Lighting Electricity (Million kWh) 2.17
Water Supply & STP Electricity (Million kWh) 5.86
TransportationPetrol (kL) 15
Diesel (kL) 66
• Activities in Gurgaon contribute to 2.55 Million TeCO2 annually
• Per capita emissions for Gurgaon has been 2.13T/Year in 2007-08
• The Corporation Level Emissions are about 0.27 per cent of the total city emissions
Gurgaon is the sixth largest city of Haryana. It has grown extensively during the last decade due to its proximity to West and South Delhi. Gurgaon is one of Delhi’s four major satellite cities and is therefore considered to be a part of the National Capital Region of India.
Corporation Energy Consumption
City Carbon Emissions 2007-08 Corporation Carbon Emissions 2007-08
City Profi le
Community Energy Consumption
Local Action Moves the World34 Local Action Moves the World 35
IND
OR
EIndoreMADHYA PRADESH, INDIAMr C B Singh, IASMunicipal CommissionerTel: +91 731 2431 610
Population Area1.47 Million (2001) 214 sq km
Sector Energy/Fuel Quantity
Residential
Electricity (Million kWh) 466.99
LPG (MT) 82,987
Fuel Wood (MT) 131
Kerosene (kL) 14,172
CommercialElectricity (Million kWh) 157.67
LPG (MT) 3,983
Industrial Electricity (Million kWh) 117.03
TransportationDiesel (kL) 102,435.5
Petrol (kL) 39,036.83
Waste MSW (tpd) 600
Others Electricity (Million kWh) 36.17
Sector Energy/Fuel QuantityBuilding and Facilities Electricity (Million kWh) 0.53
Street Lighting Electricity (Million kWh) 2.38
Water Supply & STP Electricity (Million kWh) 21.03
TransportationPetrol (kL) 22.00
Diesel (kL) 1,989.30
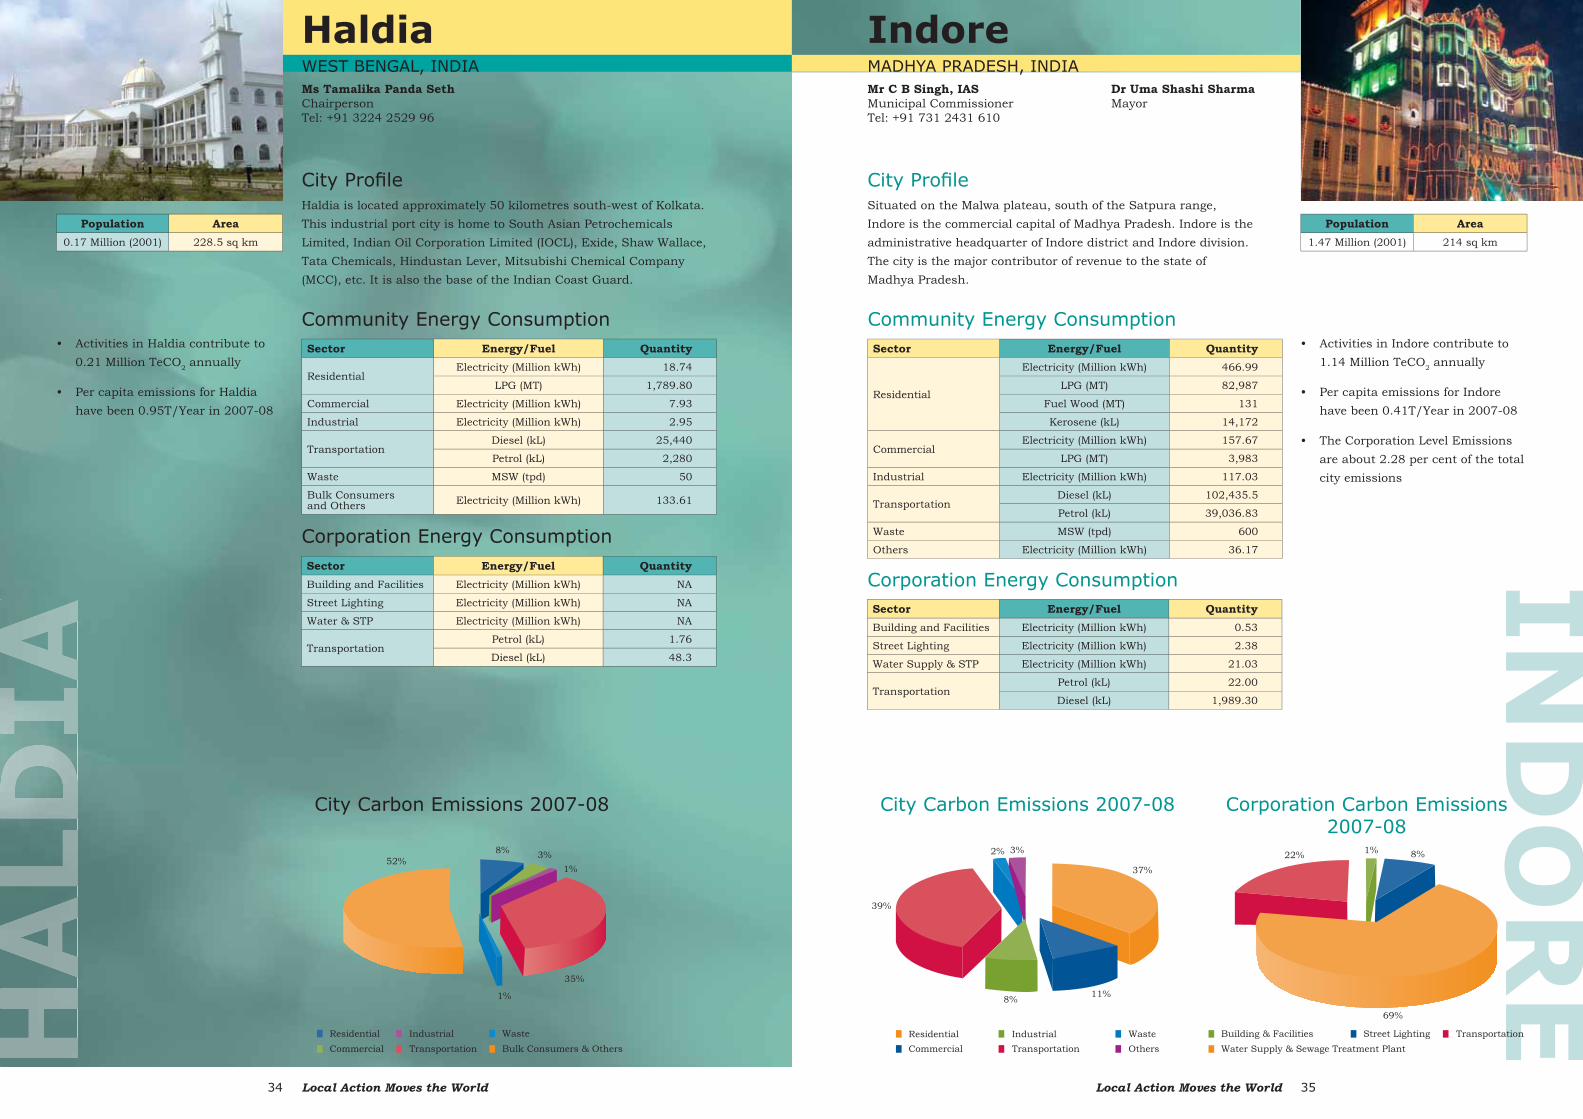
• Activities in Indore contribute to 1.14 Million TeCO2 annually
• Per capita emissions for Indore have been 0.41T/Year in 2007-08
• The Corporation Level Emissions are about 2.28 per cent of the total city emissions
Situated on the Malwa plateau, south of the Satpura range, Indore is the commercial capital of Madhya Pradesh. Indore is the administrative headquarter of Indore district and Indore division. The city is the major contributor of revenue to the state of Madhya Pradesh.
Corporation Energy Consumption
City Carbon Emissions 2007-08 Corporation Carbon Emissions 2007-08
City Profi le
Community Energy Consumption
Dr Uma Shashi SharmaMayor
HaldiaWEST BENGAL, INDIAMs Tamalika Panda SethChairpersonTel: +91 3224 2529 96
Population Area0.17 Million (2001) 228.5 sq km
Sector Energy/Fuel Quantity
ResidentialElectricity (Million kWh) 18.74
LPG (MT) 1,789.80
Commercial Electricity (Million kWh) 7.93
Industrial Electricity (Million kWh) 2.95
TransportationDiesel (kL) 25,440
Petrol (kL) 2,280
Waste MSW (tpd) 50
Bulk Consumersand Others Electricity (Million kWh) 133.61
Sector Energy/Fuel QuantityBuilding and Facilities Electricity (Million kWh) NA
Street Lighting Electricity (Million kWh) NA
Water & STP Electricity (Million kWh) NA
TransportationPetrol (kL) 1.76
Diesel (kL) 48.3
• Activities in Haldia contribute to 0.21 Million TeCO2 annually
• Per capita emissions for Haldia have been 0.95T/Year in 2007-08
Haldia is located approximately 50 kilometres south-west of Kolkata. This industrial port city is home to South Asian Petrochemicals Limited, Indian Oil Corporation Limited (IOCL), Exide, Shaw Wallace, Tata Chemicals, Hindustan Lever, Mitsubishi Chemical Company (MCC), etc. It is also the base of the Indian Coast Guard.
Corporation Energy Consumption
City Profi le
Community Energy Consumption
City Carbon Emissions 2007-08
Local Action Moves the World36 Local Action Moves the World 37
RJaipurRAJASTHAN, INDIAMr Lalit Mehra, IASChief Executive Offi cerTel: +91 141 2742 823
Population Area1.40 Million (2001) 200.4 sq km
Sector Energy/Fuel Quantity
Residential
Electricity (Million kWh) 919.06
LPG (MT) 86,965
Kerosene (kL) 16,932
Commercial Electricity (Million kWh) 504.11
Industrial Electricity (Million kWh) 740.24
TransportationDiesel (kL) 145,224
Petrol (kL) 137,881
Waste MSW (tpd) 621
OthersElectricity (Million kWh) 133.21
Coal (Tonnes) 13,200
Sector Energy/Fuel QuantityBuilding and Facilities Electricity (Million kWh) 3.15
Street Lighting Electricity (Million kWh) 29.85
Water Supply & STP Electricity (Million kWh) 109.61
TransportationPetrol (kL) NA
Diesel (kL) 1,666.67
• Activities in Jaipur contribute to 2.41 Million TeCO2 annually
• Per capita emissions for Jaipur have been 1.63T/Year in 2007-08
• The Corporation Level Emissions are about 4.22 per cent of the total city emissions
Corporation Energy Consumption
Popularly known as the Pink City, Jaipur was founded in 1727 by Maharaja Sawai Jai Singh. Jaipur is the capital of the majestic state of Rajasthan. It is known for its historical importance and monuments like Hawa Mahal, Nahargarh Fort, Amer Fort, etc. The city boasts of rich traditions and customs.
City Carbon Emissions 2007-08 Corporation Carbon Emissions 2007-08
City Profi le
Community Energy Consumption
Mr Pankaj Joshi Mayor
JAB
ALP
UR
JabalpurMADHYA PRADESH, INDIAMr O P Shrivastav, IASMunicipal CommissionerTel: +91 761 2410 777
Population Area0.93 Million (2001) 154.21 sq km
Sector Energy/Fuel Quantity
Residential
Electricity (Million kWh) 204.8
LPG (MT) 37,945
Fuel Wood (MT) 6,927
Kerosene (kL) 11,497
Commercial
Electricity (Million kWh) 66.3
LPG (MT) 890
Kerosene (kL) 2,299
Industrial Electricity (Million kWh) 18.8
TransportationDiesel (kL) 51,110.5
Petrol (kL) 30,584.6
Waste MSW (tpd) 330
Sector Energy/Fuel QuantityBuilding and Facilities Electricity (Million kWh) 1.43
Street Lighting Electricity (Million kWh) 14.34
Water Supply & STP Electricity (Million kWh) 21.07
TransportationPetrol (kL) 16.5
Diesel (kL) 1,740.64
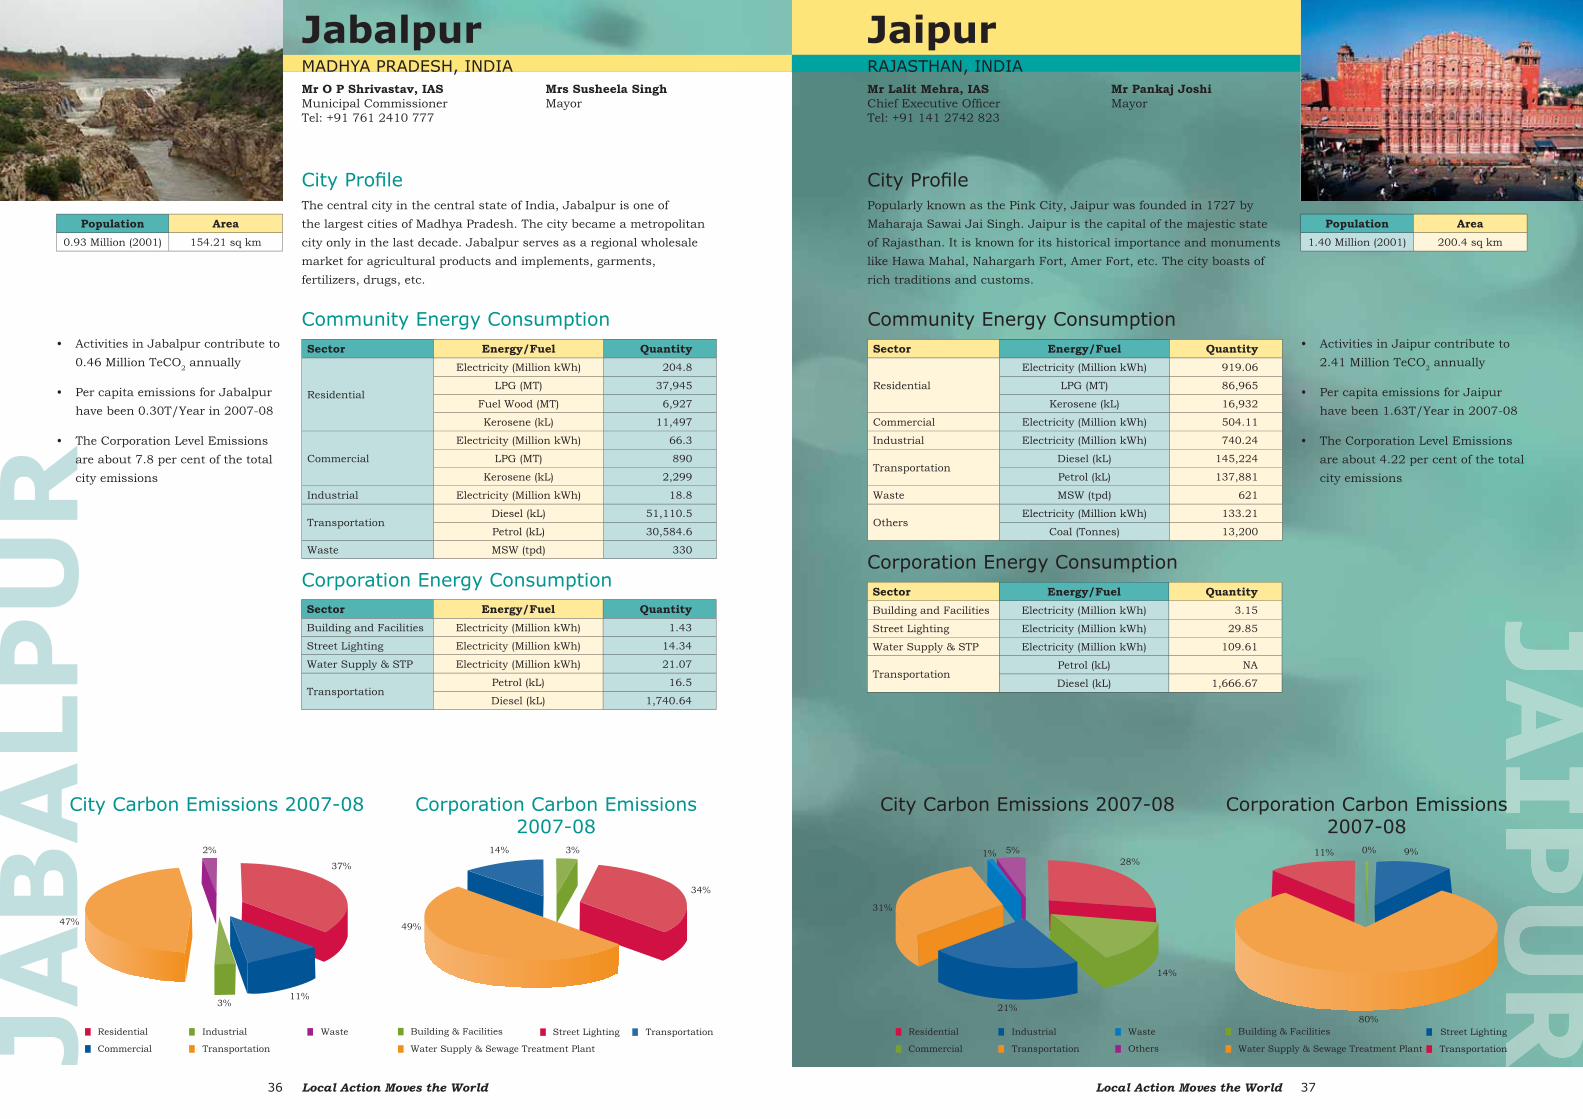
• Activities in Jabalpur contribute to 0.46 Million TeCO2 annually
• Per capita emissions for Jabalpur have been 0.30T/Year in 2007-08
• The Corporation Level Emissions are about 7.8 per cent of the total city emissions
The central city in the central state of India, Jabalpur is one of the largest cities of Madhya Pradesh. The city became a metropolitan city only in the last decade. Jabalpur serves as a regional wholesale market for agricultural products and implements, garments, fertilizers, drugs, etc.
Corporation Energy Consumption
City Carbon Emissions 2007-08 Corporation Carbon Emissions 2007-08
City Profi le
Community Energy Consumption
Mrs Susheela Singh Mayor
Local Action Moves the World38 Local Action Moves the World 39
KA
NP
UR
KanpurUTTAR PRADESH, INDIAMr Rajiv SharmaMunicipal CommissionerTel: +91 512 2551 416/2546 194
Population Area2.55 Million (2001) 300 sq km
Sector Energy/Fuel Quantity
Residential
Electricity (Million kWh) 806.70
LPG (MT) 608,044
Kerosene (kL) 48,384
CommercialElectricity (Million kWh) 214.14
LPG (MT) 3,975
Industrial Electricity (Million kWh) 320.66
Transportation
Diesel (kL) 40,645
Petrol (kL) 53,828
CNG (kg) 10,225,631
Waste MSW (tpd) 1,200
Others Electricity (Million kWh) 361.16
Sector Energy/Fuel QuantityBuilding and Facilities Electricity (Million kWh) 12.24
Street Lighting Electricity (Million kWh) 36.38
Water Supply & STP Electricity (Million kWh) 39.12
Transportation
Petrol (kL) 638.02
Diesel (kL) 208.32
CNG (kg) 7,326
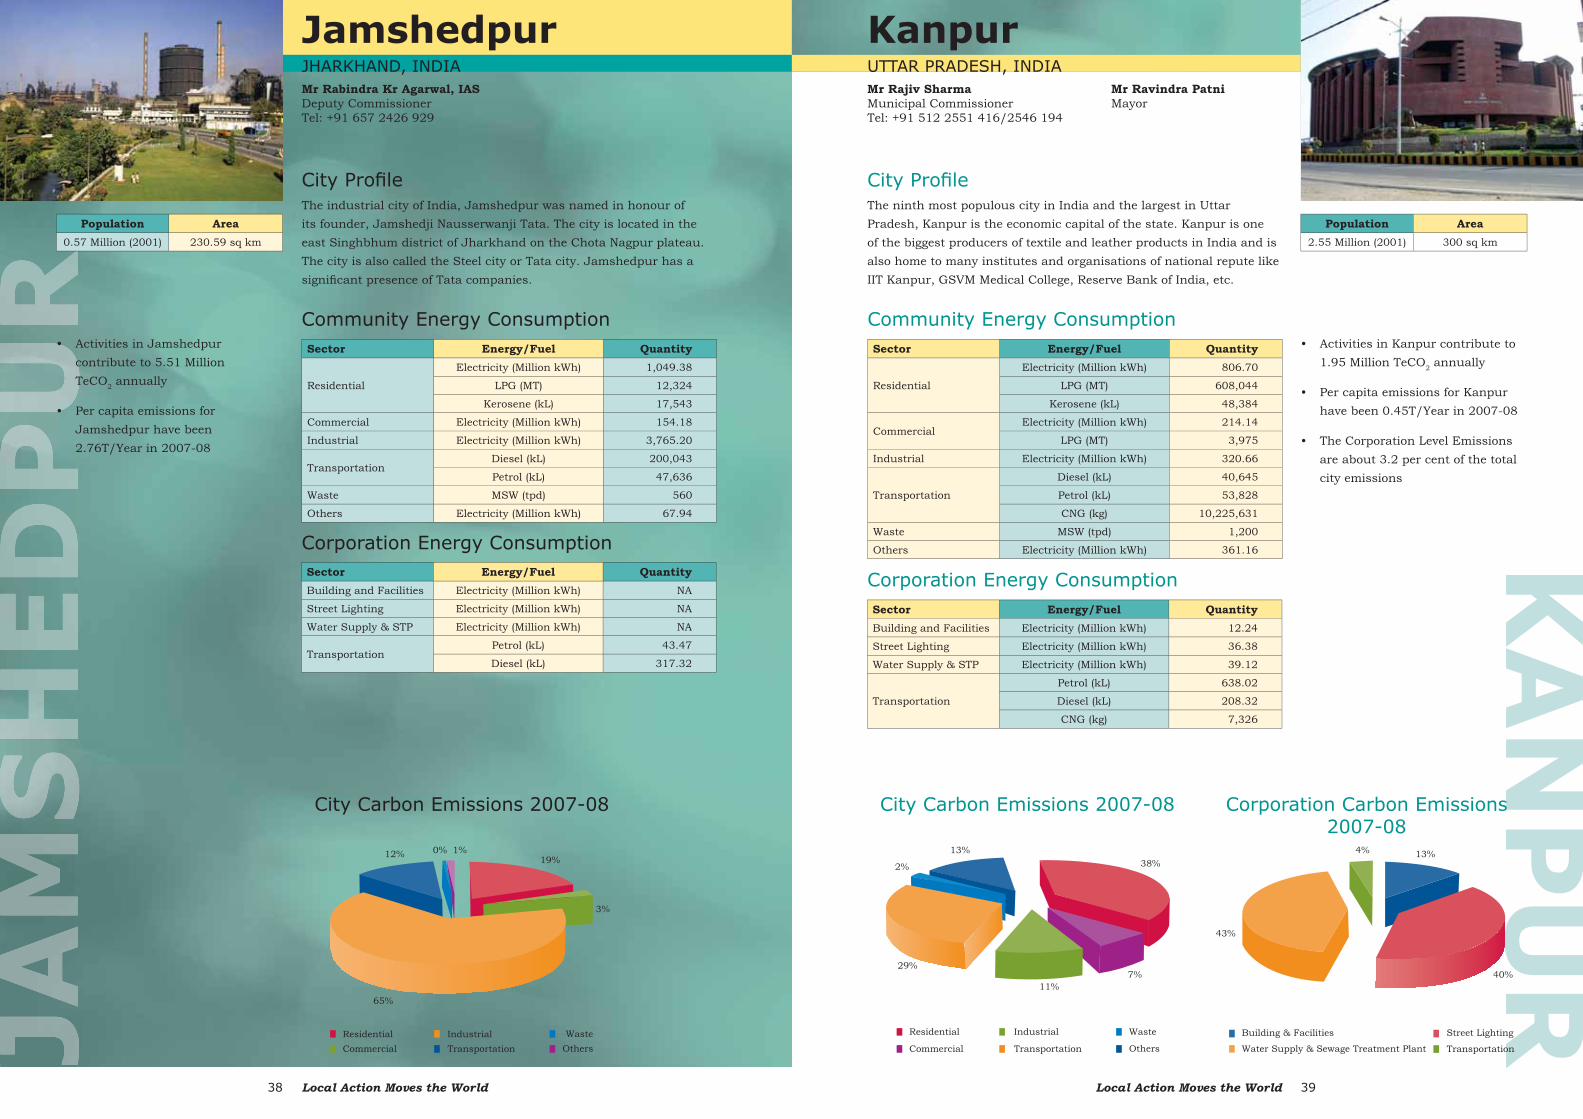
• Activities in Kanpur contribute to 1.95 Million TeCO2 annually
• Per capita emissions for Kanpur have been 0.45T/Year in 2007-08
• The Corporation Level Emissions are about 3.2 per cent of the total city emissions
Corporation Energy Consumption
The ninth most populous city in India and the largest in Uttar Pradesh, Kanpur is the economic capital of the state. Kanpur is one of the biggest producers of textile and leather products in India and is also home to many institutes and organisations of national repute like IIT Kanpur, GSVM Medical College, Reserve Bank of India, etc.
City Carbon Emissions 2007-08 Corporation Carbon Emissions 2007-08
City Profi le
Community Energy Consumption
Mr Ravindra Patni Mayor
JamshedpurJHARKHAND, INDIAMr Rabindra Kr Agarwal, IASDeputy CommissionerTel: +91 657 2426 929
Sector Energy/Fuel Quantity
Residential
Electricity (Million kWh) 1,049.38
LPG (MT) 12,324
Kerosene (kL) 17,543
Commercial Electricity (Million kWh) 154.18
Industrial Electricity (Million kWh) 3,765.20
TransportationDiesel (kL) 200,043
Petrol (kL) 47,636
Waste MSW (tpd) 560
Others Electricity (Million kWh) 67.94
Sector Energy/Fuel QuantityBuilding and Facilities Electricity (Million kWh) NA
Street Lighting Electricity (Million kWh) NA
Water Supply & STP Electricity (Million kWh) NA
TransportationPetrol (kL) 43.47
Diesel (kL) 317.32
• Activities in Jamshedpur contribute to 5.51 Million TeCO2 annually
• Per capita emissions for Jamshedpur have been 2.76T/Year in 2007-08
The industrial city of India, Jamshedpur was named in honour of its founder, Jamshedji Nausserwanji Tata. The city is located in the east Singhbhum district of Jharkhand on the Chota Nagpur plateau. The city is also called the Steel city or Tata city. Jamshedpur has a signifi cant presence of Tata companies.
Corporation Energy Consumption
City Carbon Emissions 2007-08
City Profi le
Community Energy Consumption
Population Area0.57 Million (2001) 230.59 sq km
Local Action Moves the World40 Local Action Moves the World 41
KolkataWEST BENGAL, INDIAMr Arnab Roy, IASMunicipal CommissionerTel: +91 33 2286 1234/1034
Population Area4.57 Million (2001) 185 sq km
Sector Energy/Fuel Quantity
Residential
Electricity (Million kWh) 1,196.06
LPG (MT) 75,997
Kerosene (kL) 292,240
Commercial Electricity (Million kWh) 984.54
IndustrialElectricity (Million kWh) 503.16
Coal/Wood (Tonnes) 2,929,348
TransportationDiesel (kL) 488,955
Petrol (kL) 117,987
Waste MSW (tpd) 4,000
Others Electricity (Million kWh) NA
Sector Energy/Fuel QuantityBuilding and Facilities Electricity (Million kWh) 23.14
Street Lighting Electricity (Million kWh) 53.04
Water Supply & STP Electricity (Million kWh) 138.84
TransportationPetrol (kL) 540
Diesel (kL) 4,320
OthersLPG (MT) 5,280
LDO (kL) 960
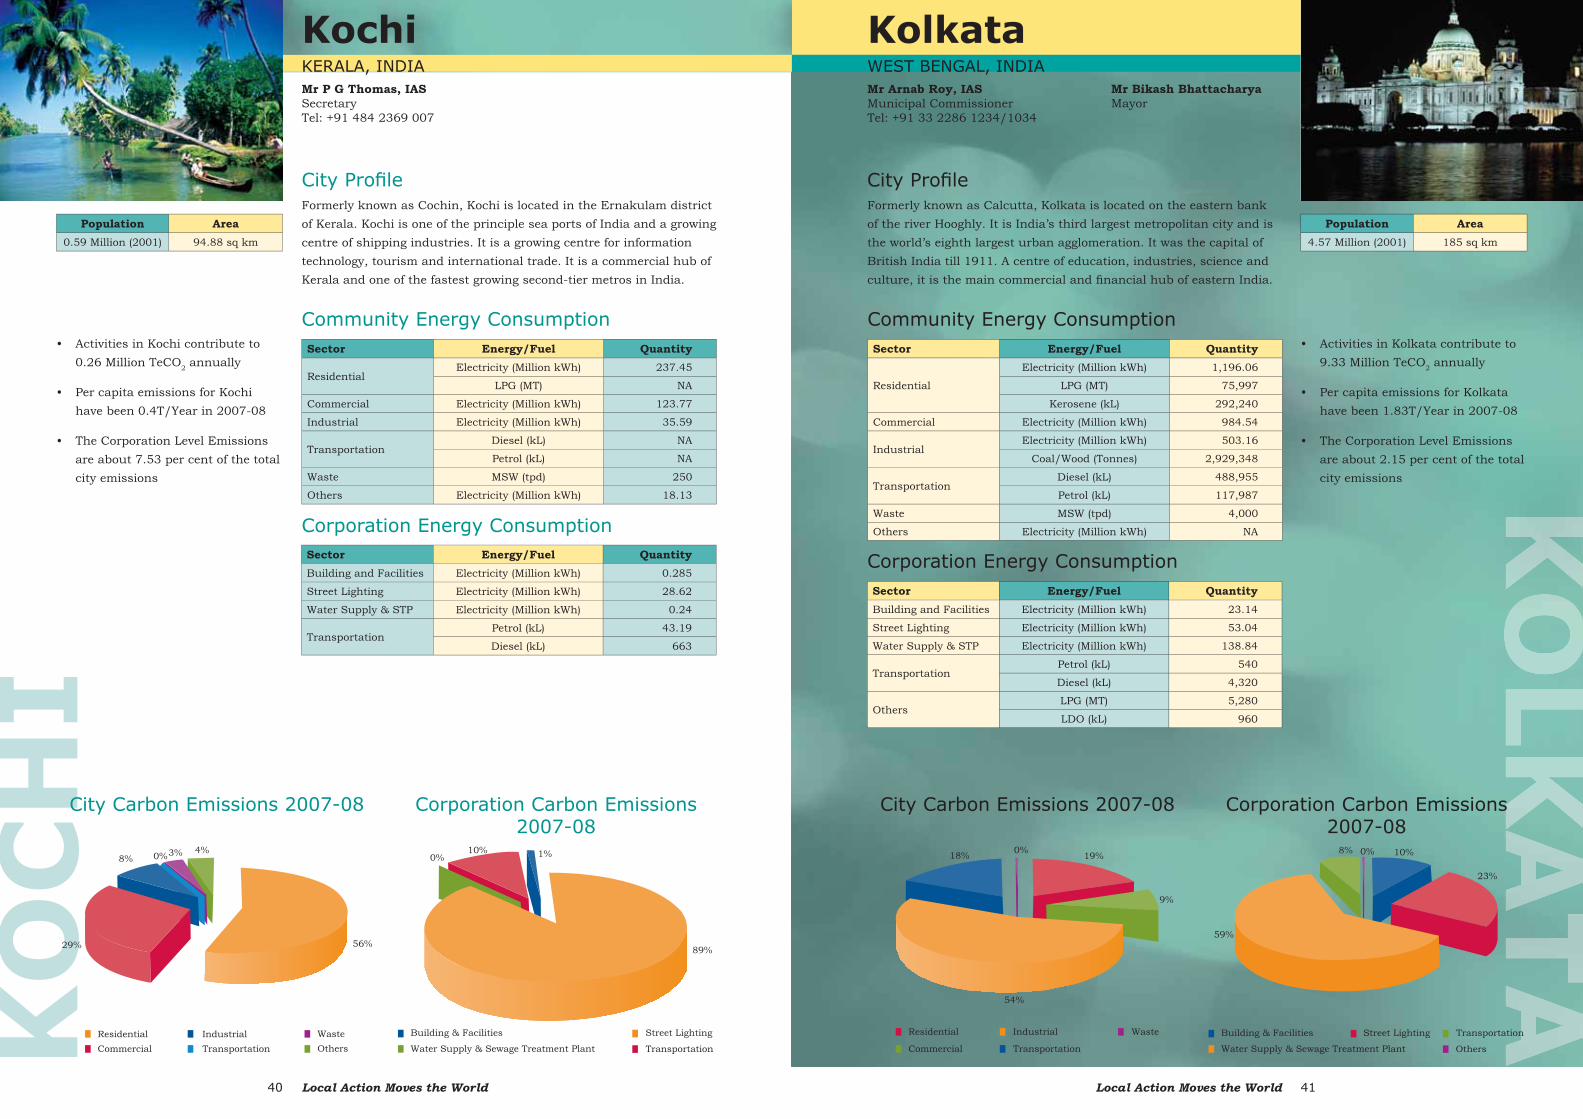
• Activities in Kolkata contribute to 9.33 Million TeCO2 annually
• Per capita emissions for Kolkata have been 1.83T/Year in 2007-08
• The Corporation Level Emissions are about 2.15 per cent of the total city emissions
Corporation Energy Consumption
Formerly known as Calcutta, Kolkata is located on the eastern bank of the river Hooghly. It is India’s third largest metropolitan city and is the world’s eighth largest urban agglomeration. It was the capital of British India till 1911. A centre of education, industries, science and culture, it is the main commercial and fi nancial hub of eastern India.
City Carbon Emissions 2007-08 Corporation Carbon Emissions 2007-08
City Profi le
Community Energy Consumption
Mr Bikash Bhattacharya Mayor
KO
CH
IKochiKERALA, INDIAMr P G Thomas, IASSecretaryTel: +91 484 2369 007
Population Area0.59 Million (2001) 94.88 sq km
Sector Energy/Fuel Quantity
ResidentialElectricity (Million kWh) 237.45
LPG (MT) NA
Commercial Electricity (Million kWh) 123.77
Industrial Electricity (Million kWh) 35.59
TransportationDiesel (kL) NA
Petrol (kL) NA
Waste MSW (tpd) 250
Others Electricity (Million kWh) 18.13
Sector Energy/Fuel QuantityBuilding and Facilities Electricity (Million kWh) 0.285
Street Lighting Electricity (Million kWh) 28.62
Water Supply & STP Electricity (Million kWh) 0.24
TransportationPetrol (kL) 43.19
Diesel (kL) 663
• Activities in Kochi contribute to 0.26 Million TeCO2 annually
• Per capita emissions for Kochi have been 0.4T/Year in 2007-08
• The Corporation Level Emissions are about 7.53 per cent of the total city emissions
Formerly known as Cochin, Kochi is located in the Ernakulam district of Kerala. Kochi is one of the principle sea ports of India and a growing centre of shipping industries. It is a growing centre for information technology, tourism and international trade. It is a commercial hub of Kerala and one of the fastest growing second-tier metros in India.
Corporation Energy Consumption
City Profi le
Community Energy Consumption
City Carbon Emissions 2007-08 Corporation Carbon Emissions 2007-08
Local Action Moves the World42 Local Action Moves the World 43
MA
DU
RA
IMaduraiTAMIL NADU, INDIAMr S SebastineMunicipal CommissionerTel: +91 452 2531 116
Population Area0.92 Million (2001) 109 sq km
Sector Energy/Fuel Quantity
Residential
Electricity (Million kWh) 50
LPG (MT) 37,570
Kerosene (kL) 27,187
Fuel Wood (MT) 15,512
Commercial Electricity (Million kWh) 15
Industrial Electricity (Million kWh) 9
TransportationDiesel (kL) 35,054
Petrol (kL) 21,323
Waste MSW (tpd) 450
Sector Energy/Fuel QuantityBuilding and Facilities Electricity (Million kWh) 0.21
Street Lighting Electricity (Million kWh) 29.15
Water & STP Electricity (Million kWh) 5.12
TransportationPetrol (kL) NA
Diesel (kL) 1,022
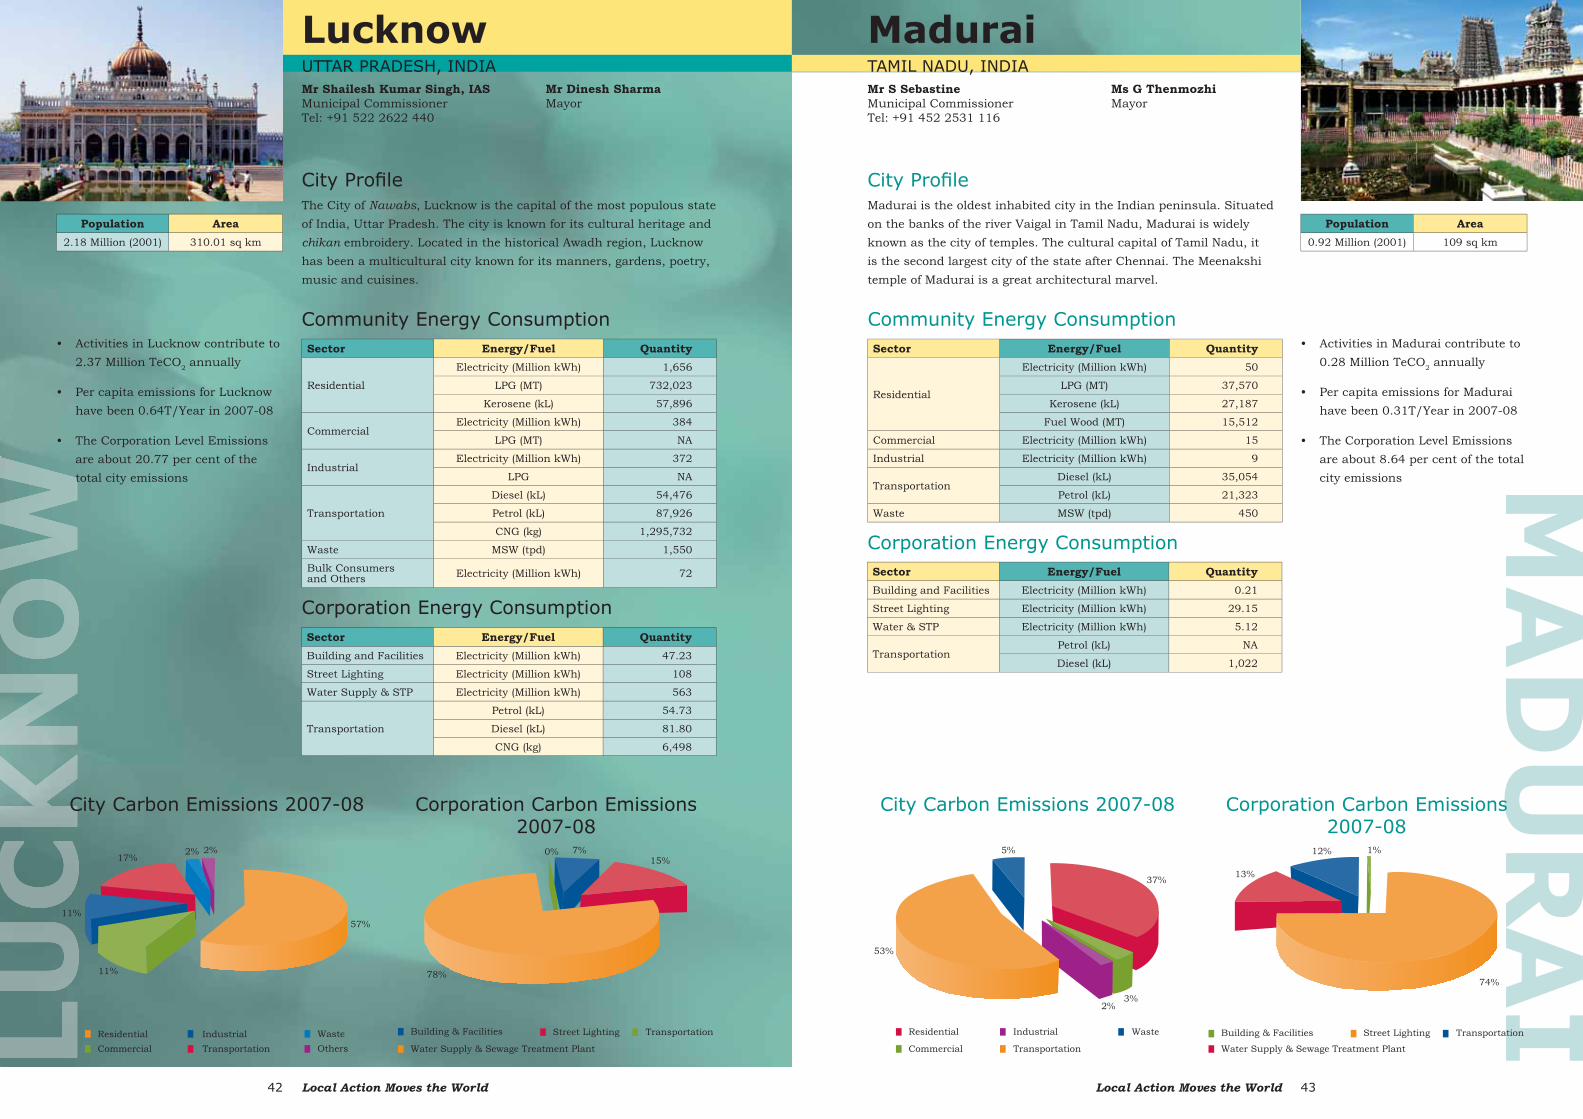
• Activities in Madurai contribute to 0.28 Million TeCO2 annually
• Per capita emissions for Madurai have been 0.31T/Year in 2007-08
• The Corporation Level Emissions are about 8.64 per cent of the total city emissions
Madurai is the oldest inhabited city in the Indian peninsula. Situated on the banks of the river Vaigal in Tamil Nadu, Madurai is widely known as the city of temples. The cultural capital of Tamil Nadu, it is the second largest city of the state after Chennai. The Meenakshi temple of Madurai is a great architectural marvel.
Corporation Energy Consumption
City Carbon Emissions 2007-08 Corporation Carbon Emissions 2007-08
City Profi le
Community Energy Consumption
Ms G Thenmozhi Mayor
LucknowUTTAR PRADESH, INDIAMr Shailesh Kumar Singh, IASMunicipal CommissionerTel: +91 522 2622 440
Population Area2.18 Million (2001) 310.01 sq km
Sector Energy/Fuel Quantity
Residential
Electricity (Million kWh) 1,656
LPG (MT) 732,023
Kerosene (kL) 57,896
CommercialElectricity (Million kWh) 384
LPG (MT) NA
IndustrialElectricity (Million kWh) 372
LPG NA
Transportation
Diesel (kL) 54,476
Petrol (kL) 87,926
CNG (kg) 1,295,732
Waste MSW (tpd) 1,550
Bulk Consumersand Others Electricity (Million kWh) 72
Sector Energy/Fuel QuantityBuilding and Facilities Electricity (Million kWh) 47.23
Street Lighting Electricity (Million kWh) 108
Water Supply & STP Electricity (Million kWh) 563
Transportation
Petrol (kL) 54.73
Diesel (kL) 81.80
CNG (kg) 6,498
• Activities in Lucknow contribute to 2.37 Million TeCO2 annually
• Per capita emissions for Lucknow have been 0.64T/Year in 2007-08
• The Corporation Level Emissions are about 20.77 per cent of the total city emissions
The City of Nawabs, Lucknow is the capital of the most populous state of India, Uttar Pradesh. The city is known for its cultural heritage and chikan embroidery. Located in the historical Awadh region, Lucknow has been a multicultural city known for its manners, gardens, poetry, music and cuisines.
Corporation Energy Consumption
City Profi le
Community Energy Consumption
City Carbon Emissions 2007-08 Corporation Carbon Emissions 2007-08
Mr Dinesh Sharma Mayor
Local Action Moves the World44 Local Action Moves the World 45
RNagpurMAHARASHTRA, INDIAMr Aseem Gupta, IASMunicipal Commissioner
Population Area2.05 Million (2001) 218 sq km
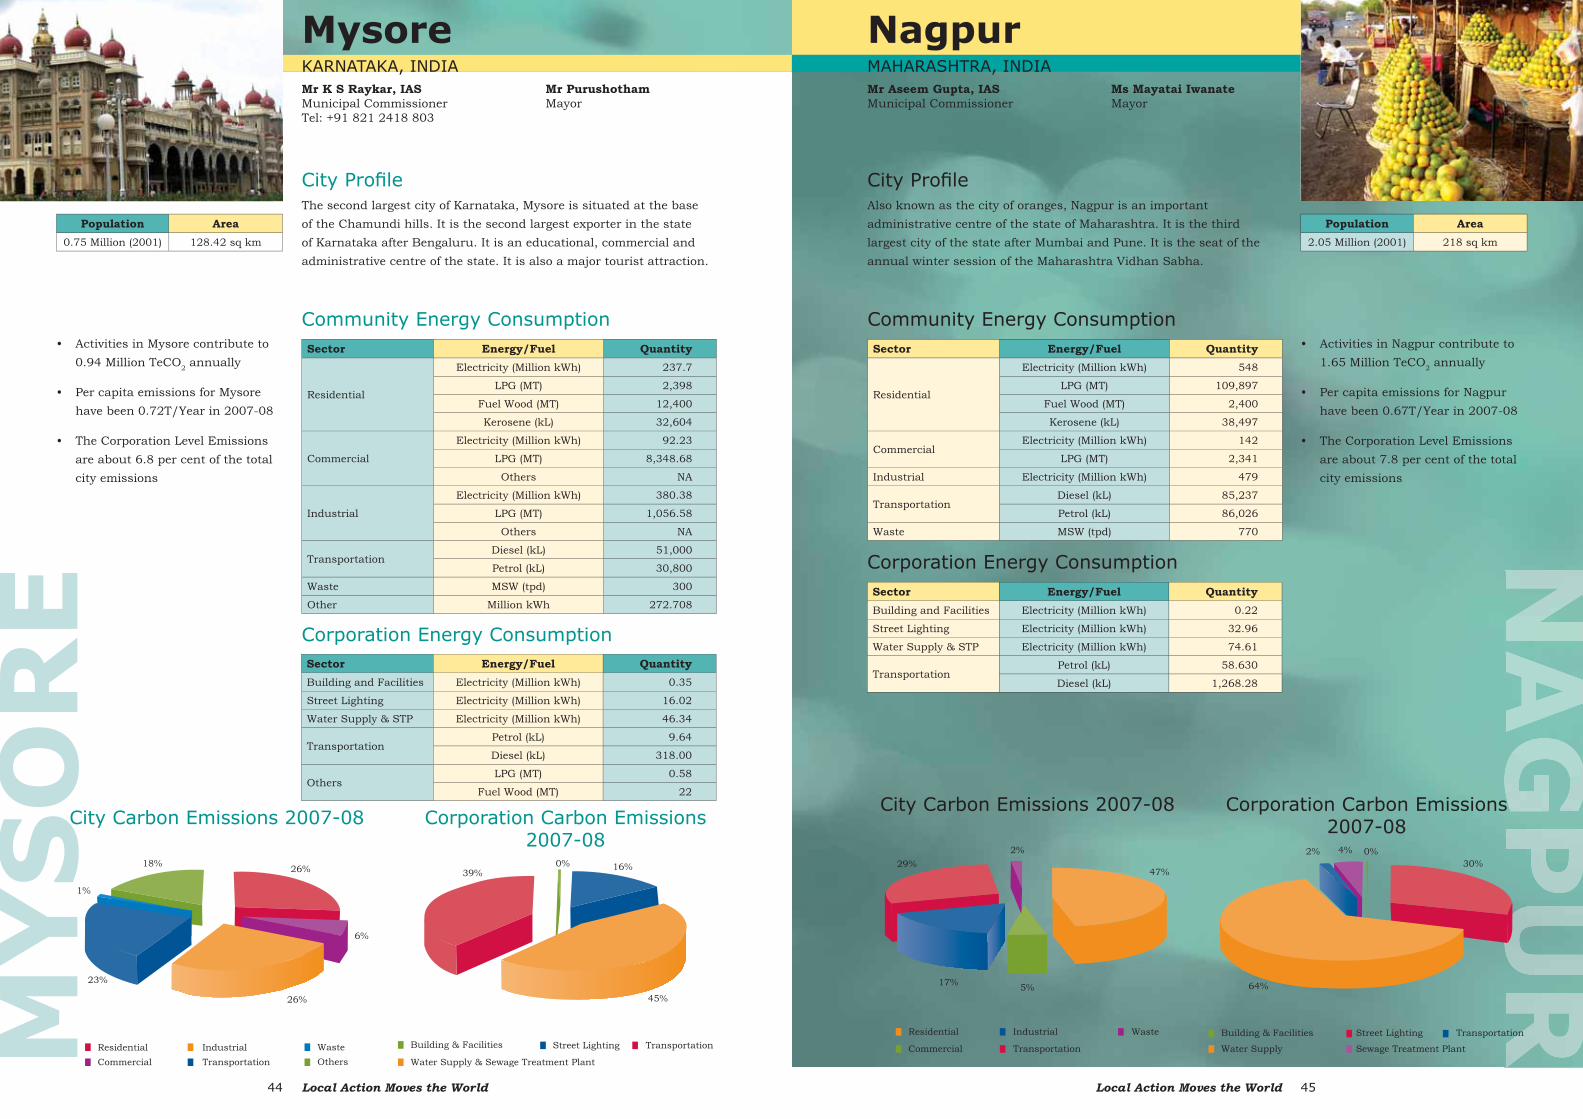
Sector Energy/Fuel Quantity
Residential
Electricity (Million kWh) 548
LPG (MT) 109,897
Fuel Wood (MT) 2,400
Kerosene (kL) 38,497
CommercialElectricity (Million kWh) 142
LPG (MT) 2,341
Industrial Electricity (Million kWh) 479
TransportationDiesel (kL) 85,237
Petrol (kL) 86,026
Waste MSW (tpd) 770
Sector Energy/Fuel QuantityBuilding and Facilities Electricity (Million kWh) 0.22
Street Lighting Electricity (Million kWh) 32.96
Water Supply & STP Electricity (Million kWh) 74.61
TransportationPetrol (kL) 58.630
Diesel (kL) 1,268.28
• Activities in Nagpur contribute to 1.65 Million TeCO2 annually
• Per capita emissions for Nagpur have been 0.67T/Year in 2007-08
• The Corporation Level Emissions are about 7.8 per cent of the total city emissions
Corporation Energy Consumption
Also known as the city of oranges, Nagpur is an important administrative centre of the state of Maharashtra. It is the third largest city of the state after Mumbai and Pune. It is the seat of the annual winter session of the Maharashtra Vidhan Sabha.
City Carbon Emissions 2007-08 Corporation Carbon Emissions 2007-08
City Profi le
Community Energy Consumption
Ms Mayatai Iwanate Mayor
MY
SO
RE
MysoreKARNATAKA, INDIAMr K S Raykar, IASMunicipal CommissionerTel: +91 821 2418 803
Population Area0.75 Million (2001) 128.42 sq km
Sector Energy/Fuel Quantity
Residential
Electricity (Million kWh) 237.7
LPG (MT) 2,398
Fuel Wood (MT) 12,400
Kerosene (kL) 32,604
Commercial
Electricity (Million kWh) 92.23
LPG (MT) 8,348.68
Others NA
Industrial
Electricity (Million kWh) 380.38
LPG (MT) 1,056.58
Others NA
TransportationDiesel (kL) 51,000
Petrol (kL) 30,800
Waste MSW (tpd) 300
Other Million kWh 272.708
Sector Energy/Fuel QuantityBuilding and Facilities Electricity (Million kWh) 0.35
Street Lighting Electricity (Million kWh) 16.02
Water Supply & STP Electricity (Million kWh) 46.34
TransportationPetrol (kL) 9.64
Diesel (kL) 318.00
OthersLPG (MT) 0.58
Fuel Wood (MT) 22
• Activities in Mysore contribute to 0.94 Million TeCO2 annually
• Per capita emissions for Mysore have been 0.72T/Year in 2007-08
• The Corporation Level Emissions are about 6.8 per cent of the total city emissions
The second largest city of Karnataka, Mysore is situated at the base of the Chamundi hills. It is the second largest exporter in the state of Karnataka after Bengaluru. It is an educational, commercial and administrative centre of the state. It is also a major tourist attraction.
Corporation Energy Consumption
City Carbon Emissions 2007-08 Corporation Carbon Emissions 2007-08
City Profi le
Community Energy Consumption
Mr Purushotham Mayor
Local Action Moves the World46 Local Action Moves the World 47
PA
TN
APatnaBIHAR, INDIAMr K Senthil Kumar, IASMunicipal CommissionerTel: +91 612 2223 791
Population Area1.69 Million (2001) 135 sq km
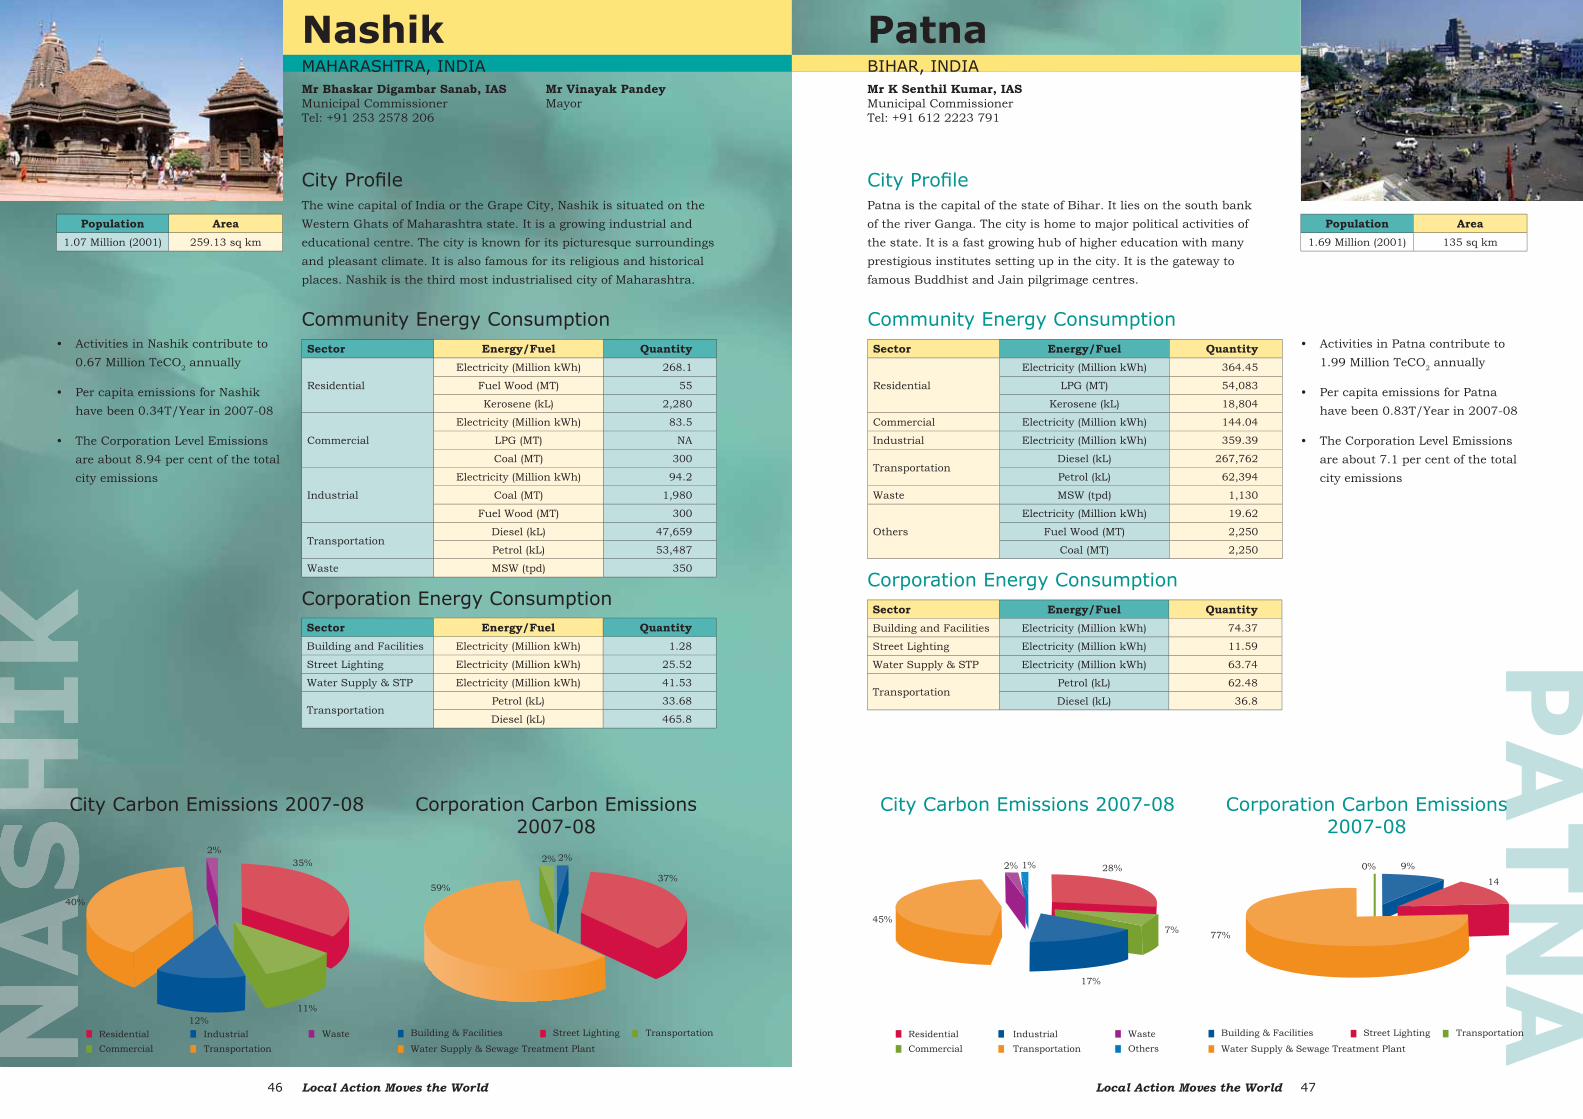
Sector Energy/Fuel Quantity
Residential
Electricity (Million kWh) 364.45
LPG (MT) 54,083
Kerosene (kL) 18,804
Commercial Electricity (Million kWh) 144.04
Industrial Electricity (Million kWh) 359.39
TransportationDiesel (kL) 267,762
Petrol (kL) 62,394
Waste MSW (tpd) 1,130
Others
Electricity (Million kWh) 19.62
Fuel Wood (MT) 2,250
Coal (MT) 2,250
Sector Energy/Fuel QuantityBuilding and Facilities Electricity (Million kWh) 74.37
Street Lighting Electricity (Million kWh) 11.59
Water Supply & STP Electricity (Million kWh) 63.74
TransportationPetrol (kL) 62.48
Diesel (kL) 36.8
• Activities in Patna contribute to 1.99 Million TeCO2 annually
• Per capita emissions for Patna have been 0.83T/Year in 2007-08
• The Corporation Level Emissions are about 7.1 per cent of the total city emissions
Corporation Energy Consumption
Patna is the capital of the state of Bihar. It lies on the south bank of the river Ganga. The city is home to major political activities of the state. It is a fast growing hub of higher education with many prestigious institutes setting up in the city. It is the gateway to famous Buddhist and Jain pilgrimage centres.
City Carbon Emissions 2007-08 Corporation Carbon Emissions 2007-08
City Profi le
Community Energy Consumption
NashikMAHARASHTRA, INDIAMr Bhaskar Digambar Sanab, IASMunicipal CommissionerTel: +91 253 2578 206
Sector Energy/Fuel Quantity
Residential
Electricity (Million kWh) 268.1
Fuel Wood (MT) 55
Kerosene (kL) 2,280
Commercial
Electricity (Million kWh) 83.5
LPG (MT) NA
Coal (MT) 300
Industrial
Electricity (Million kWh) 94.2
Coal (MT) 1,980
Fuel Wood (MT) 300
TransportationDiesel (kL) 47,659
Petrol (kL) 53,487
Waste MSW (tpd) 350
Sector Energy/Fuel QuantityBuilding and Facilities Electricity (Million kWh) 1.28
Street Lighting Electricity (Million kWh) 25.52
Water Supply & STP Electricity (Million kWh) 41.53
TransportationPetrol (kL) 33.68
Diesel (kL) 465.8
• Activities in Nashik contribute to 0.67 Million TeCO2 annually
• Per capita emissions for Nashik have been 0.34T/Year in 2007-08
• The Corporation Level Emissions are about 8.94 per cent of the total city emissions
The wine capital of India or the Grape City, Nashik is situated on the Western Ghats of Maharashtra state. It is a growing industrial and educational centre. The city is known for its picturesque surroundings and pleasant climate. It is also famous for its religious and historical places. Nashik is the third most industrialised city of Maharashtra.
Corporation Energy Consumption
City Profi le
Community Energy Consumption
Population Area1.07 Million (2001) 259.13 sq km
City Carbon Emissions 2007-08 Corporation Carbon Emissions 2007-08
Mr Vinayak Pandey Mayor
Local Action Moves the World48 Local Action Moves the World 49
RRaipurCHHATTISGARH, INDIAMr Amit Kataria, IASMunicipal CommissionerTel: +91 771 2227 395
Population Area0.75 Million (2001) 154 sq km
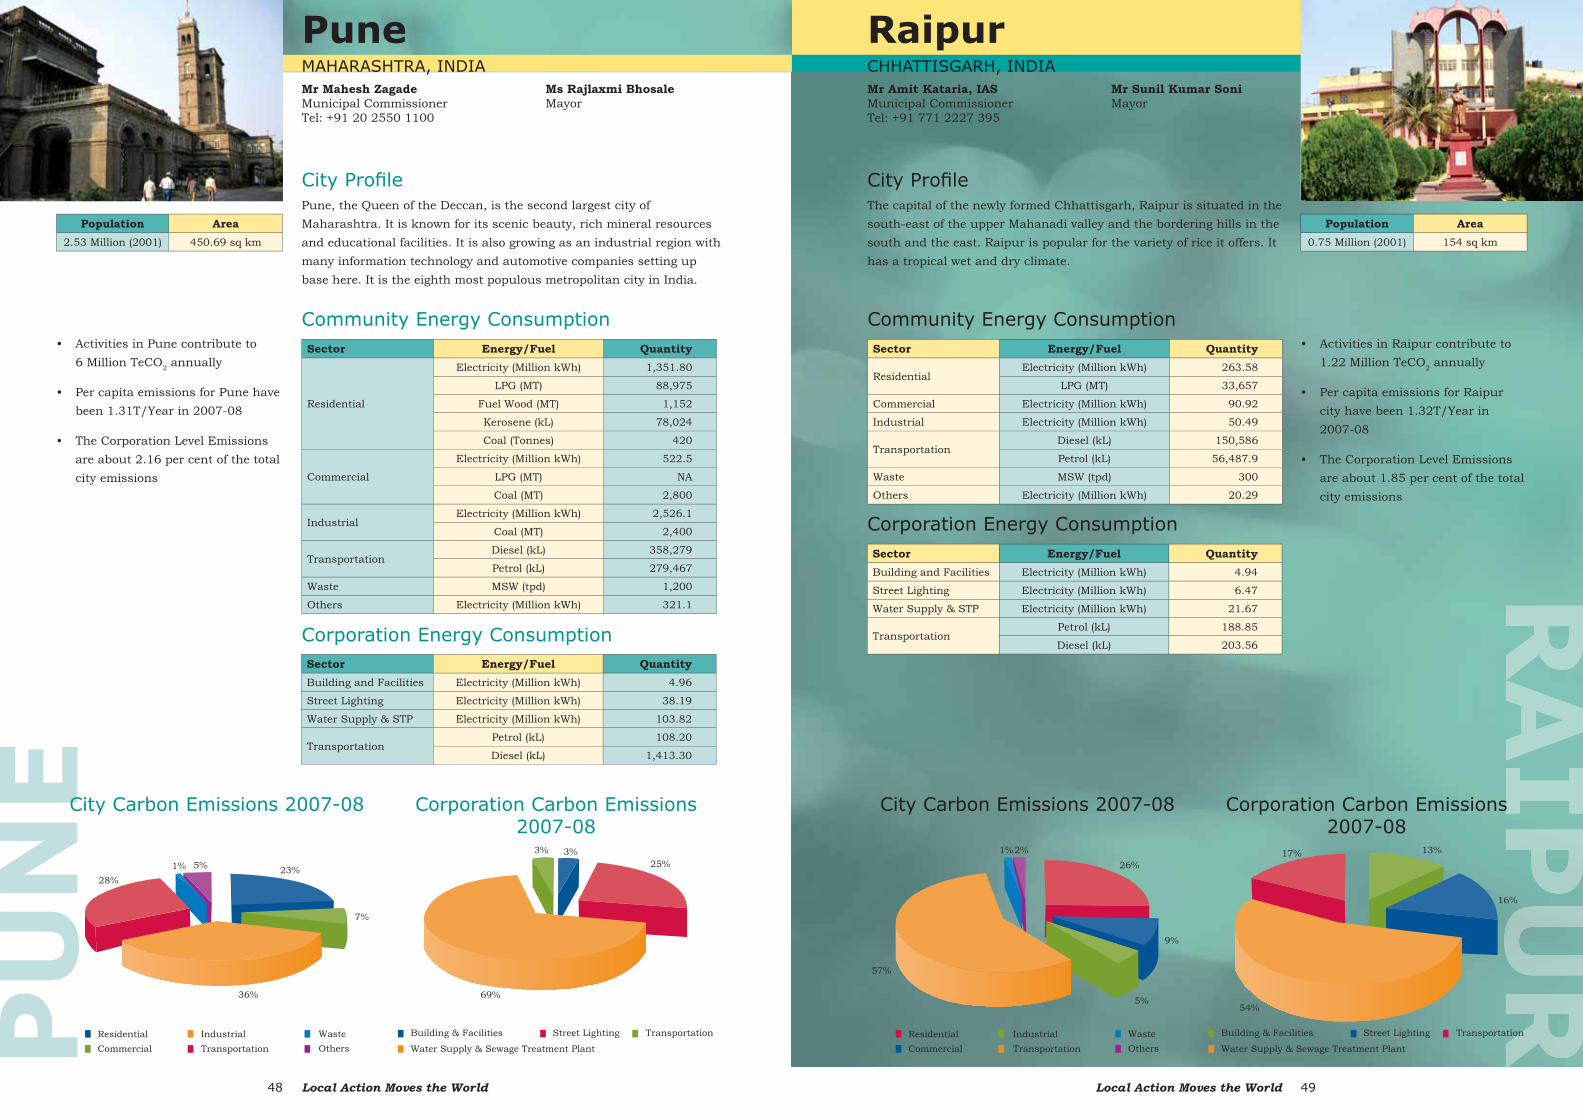
Sector Energy/Fuel Quantity
ResidentialElectricity (Million kWh) 263.58
LPG (MT) 33,657
Commercial Electricity (Million kWh) 90.92
Industrial Electricity (Million kWh) 50.49
TransportationDiesel (kL) 150,586
Petrol (kL) 56,487.9
Waste MSW (tpd) 300
Others Electricity (Million kWh) 20.29
Sector Energy/Fuel QuantityBuilding and Facilities Electricity (Million kWh) 4.94
Street Lighting Electricity (Million kWh) 6.47
Water Supply & STP Electricity (Million kWh) 21.67
TransportationPetrol (kL) 188.85
Diesel (kL) 203.56
• Activities in Raipur contribute to 1.22 Million TeCO2 annually
• Per capita emissions for Raipur city have been 1.32T/Year in 2007-08
• The Corporation Level Emissions are about 1.85 per cent of the total city emissions
Corporation Energy Consumption
The capital of the newly formed Chhattisgarh, Raipur is situated in the south-east of the upper Mahanadi valley and the bordering hills in the south and the east. Raipur is popular for the variety of rice it offers. It has a tropical wet and dry climate.
City Carbon Emissions 2007-08 Corporation Carbon Emissions 2007-08
City Profi le
Community Energy Consumption
Mr Sunil Kumar SoniMayor
PU
NEPuneMAHARASHTRA, INDIA Mr Mahesh ZagadeMunicipal CommissionerTel: +91 20 2550 1100
Population Area2.53 Million (2001) 450.69 sq km
Sector Energy/Fuel Quantity
Residential
Electricity (Million kWh) 1,351.80
LPG (MT) 88,975
Fuel Wood (MT) 1,152
Kerosene (kL) 78,024
Coal (Tonnes) 420
Commercial
Electricity (Million kWh) 522.5
LPG (MT) NA
Coal (MT) 2,800
IndustrialElectricity (Million kWh) 2,526.1
Coal (MT) 2,400
TransportationDiesel (kL) 358,279
Petrol (kL) 279,467
Waste MSW (tpd) 1,200
Others Electricity (Million kWh) 321.1
Sector Energy/Fuel QuantityBuilding and Facilities Electricity (Million kWh) 4.96
Street Lighting Electricity (Million kWh) 38.19
Water Supply & STP Electricity (Million kWh) 103.82
TransportationPetrol (kL) 108.20
Diesel (kL) 1,413.30
• Activities in Pune contribute to 6 Million TeCO2 annually
• Per capita emissions for Pune have been 1.31T/Year in 2007-08
• The Corporation Level Emissions are about 2.16 per cent of the total city emissions
Pune, the Queen of the Deccan, is the second largest city of Maharashtra. It is known for its scenic beauty, rich mineral resources and educational facilities. It is also growing as an industrial region with many information technology and automotive companies setting up base here. It is the eighth most populous metropolitan city in India.
Corporation Energy Consumption
City Profi le
Community Energy Consumption
City Carbon Emissions 2007-08 Corporation Carbon Emissions 2007-08
Ms Rajlaxmi BhosaleMayor
Local Action Moves the World50 Local Action Moves the World 51
RA
NC
HI
RanchiJHARKHAND, INDIADr Sunil Kumar SinghChief Executive Offi cerTel: +91 651 2203 469
Population Area0.84 Million (2001) 111 sq km
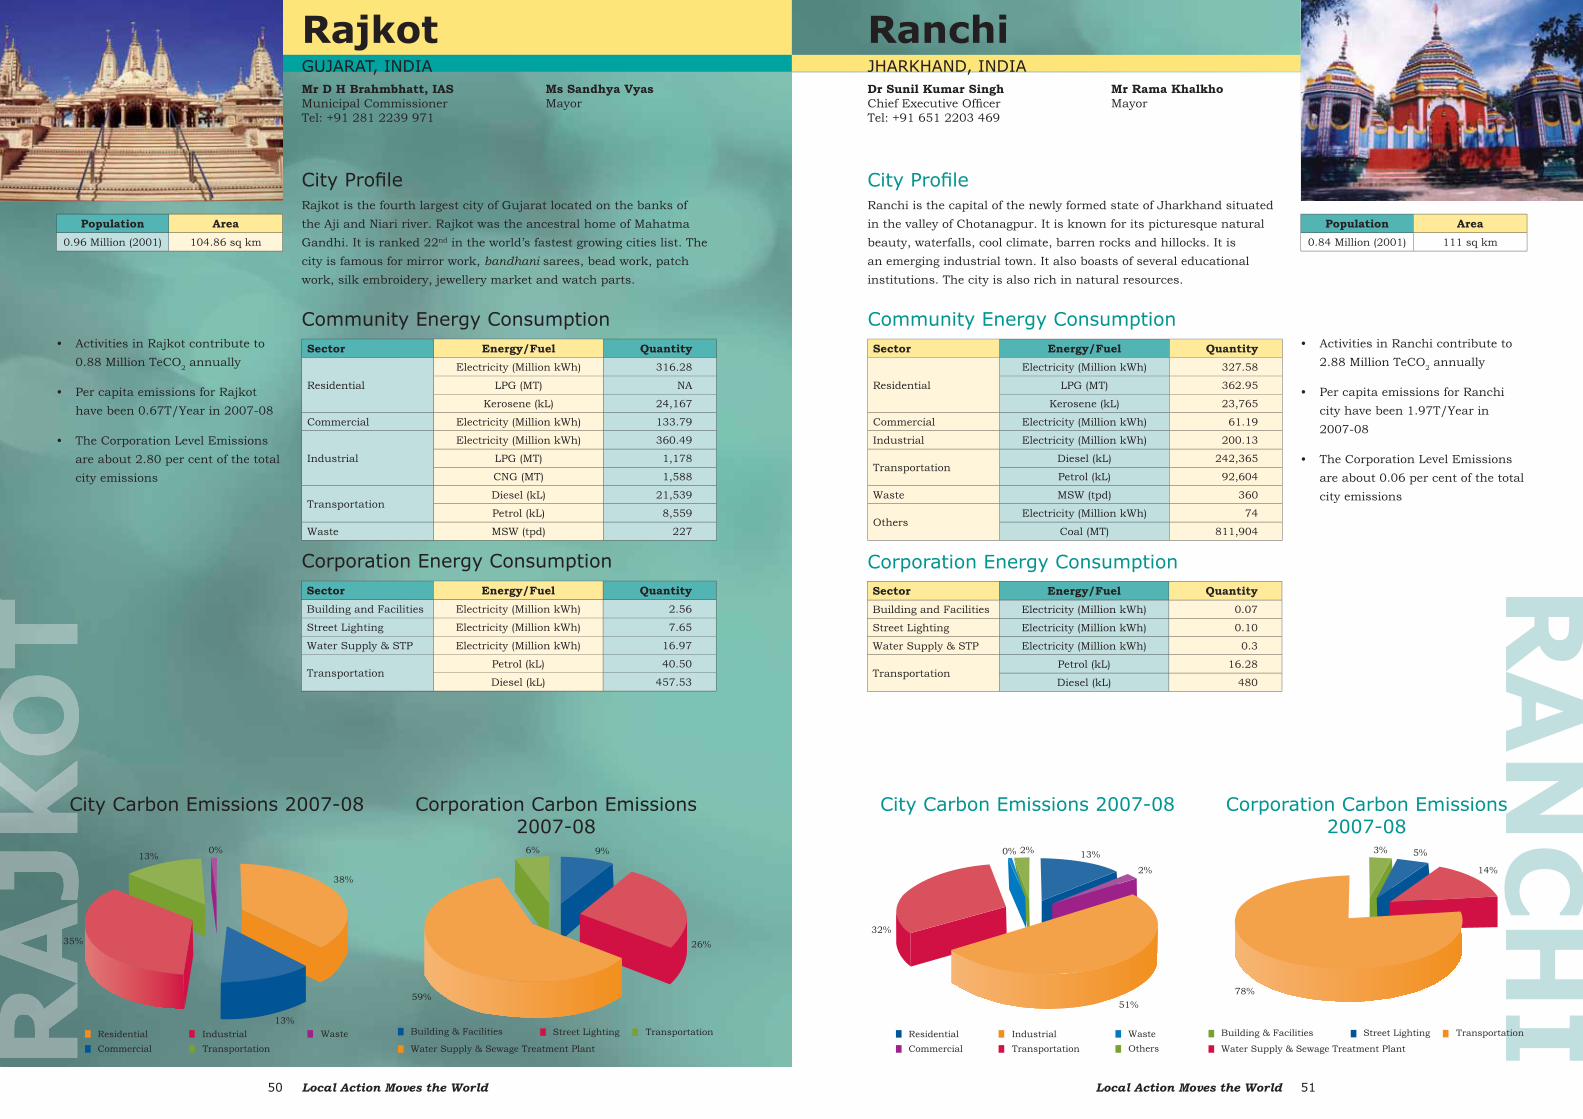
Sector Energy/Fuel Quantity
Residential
Electricity (Million kWh) 327.58
LPG (MT) 362.95
Kerosene (kL) 23,765
Commercial Electricity (Million kWh) 61.19
Industrial Electricity (Million kWh) 200.13
TransportationDiesel (kL) 242,365
Petrol (kL) 92,604
Waste MSW (tpd) 360
OthersElectricity (Million kWh) 74
Coal (MT) 811,904
Sector Energy/Fuel QuantityBuilding and Facilities Electricity (Million kWh) 0.07
Street Lighting Electricity (Million kWh) 0.10
Water Supply & STP Electricity (Million kWh) 0.3
TransportationPetrol (kL) 16.28
Diesel (kL) 480
• Activities in Ranchi contribute to 2.88 Million TeCO2 annually
• Per capita emissions for Ranchi city have been 1.97T/Year in 2007-08
• The Corporation Level Emissions are about 0.06 per cent of the total city emissions
Ranchi is the capital of the newly formed state of Jharkhand situated in the valley of Chotanagpur. It is known for its picturesque natural beauty, waterfalls, cool climate, barren rocks and hillocks. It is an emerging industrial town. It also boasts of several educational institutions. The city is also rich in natural resources.
Corporation Energy Consumption
City Carbon Emissions 2007-08 Corporation Carbon Emissions 2007-08
City Profi le
Community Energy Consumption
Mr Rama Khalkho Mayor
RajkotGUJARAT, INDIAMr D H Brahmbhatt, IASMunicipal CommissionerTel: +91 281 2239 971
Population Area0.96 Million (2001) 104.86 sq km
Sector Energy/Fuel Quantity
Residential
Electricity (Million kWh) 316.28
LPG (MT) NA
Kerosene (kL) 24,167
Commercial Electricity (Million kWh) 133.79
Industrial
Electricity (Million kWh) 360.49
LPG (MT) 1,178
CNG (MT) 1,588
TransportationDiesel (kL) 21,539
Petrol (kL) 8,559
Waste MSW (tpd) 227
Sector Energy/Fuel QuantityBuilding and Facilities Electricity (Million kWh) 2.56
Street Lighting Electricity (Million kWh) 7.65
Water Supply & STP Electricity (Million kWh) 16.97
TransportationPetrol (kL) 40.50
Diesel (kL) 457.53
• Activities in Rajkot contribute to 0.88 Million TeCO2 annually
• Per capita emissions for Rajkot have been 0.67T/Year in 2007-08
• The Corporation Level Emissions are about 2.80 per cent of the total city emissions
Rajkot is the fourth largest city of Gujarat located on the banks of the Aji and Niari river. Rajkot was the ancestral home of Mahatma Gandhi. It is ranked 22nd in the world’s fastest growing cities list. The city is famous for mirror work, bandhani sarees, bead work, patch work, silk embroidery, jewellery market and watch parts.
Corporation Energy Consumption
City Profi le
Community Energy Consumption
City Carbon Emissions 2007-08 Corporation Carbon Emissions 2007-08
Ms Sandhya Vyas Mayor
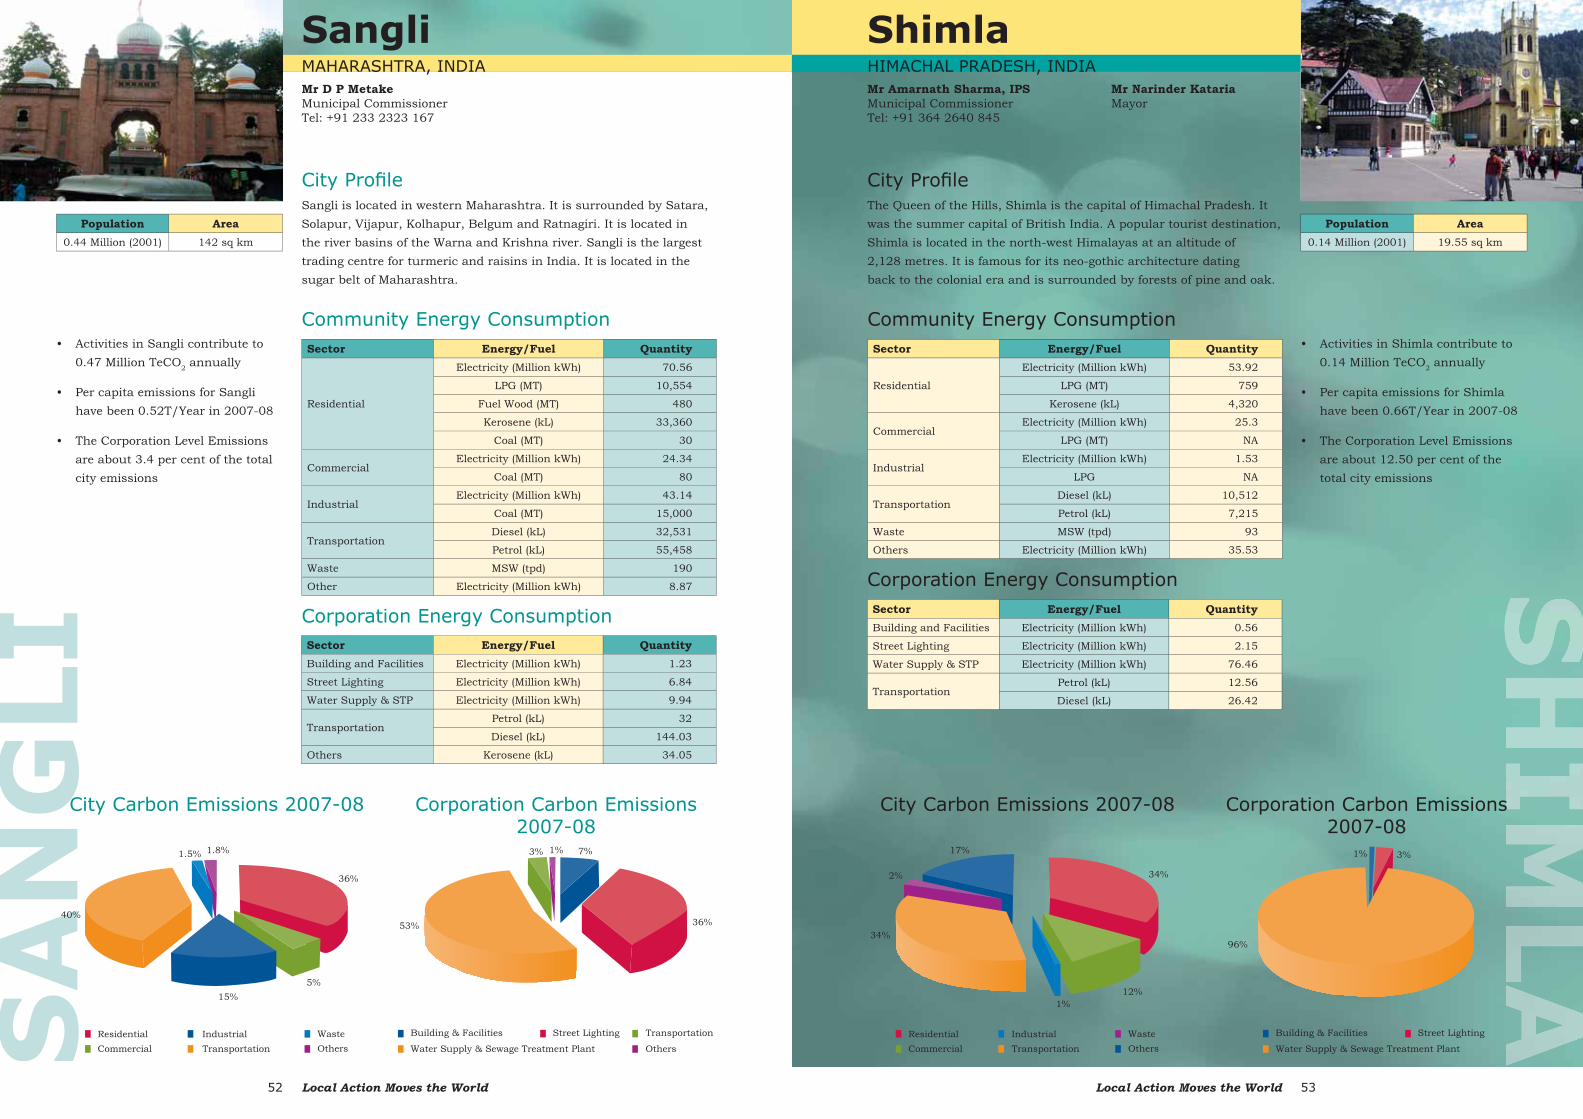
Local Action Moves the World52 Local Action Moves the World 53
ShimlaHIMACHAL PRADESH, INDIA Mr Amarnath Sharma, IPSMunicipal Commissioner Tel: +91 364 2640 845
Population Area0.14 Million (2001) 19.55 sq km
Sector Energy/Fuel Quantity
Residential
Electricity (Million kWh) 53.92
LPG (MT) 759
Kerosene (kL) 4,320
CommercialElectricity (Million kWh) 25.3
LPG (MT) NA
IndustrialElectricity (Million kWh) 1.53
LPG NA
TransportationDiesel (kL) 10,512
Petrol (kL) 7,215
Waste MSW (tpd) 93
Others Electricity (Million kWh) 35.53
Sector Energy/Fuel QuantityBuilding and Facilities Electricity (Million kWh) 0.56
Street Lighting Electricity (Million kWh) 2.15
Water Supply & STP Electricity (Million kWh) 76.46
TransportationPetrol (kL) 12.56
Diesel (kL) 26.42
• Activities in Shimla contribute to 0.14 Million TeCO2 annually
• Per capita emissions for Shimla have been 0.66T/Year in 2007-08
• The Corporation Level Emissions are about 12.50 per cent of the total city emissions
Corporation Energy Consumption
The Queen of the Hills, Shimla is the capital of Himachal Pradesh. It was the summer capital of British India. A popular tourist destination, Shimla is located in the north-west Himalayas at an altitude of 2,128 metres. It is famous for its neo-gothic architecture dating back to the colonial era and is surrounded by forests of pine and oak.
City Carbon Emissions 2007-08 Corporation Carbon Emissions 2007-08
City Profi le
Community Energy Consumption
Mr Narinder KatariaMayor
SA
NG
LI
SangliMAHARASHTRA, INDIA Mr D P Metake Municipal Commissioner Tel: +91 233 2323 167
Population Area0.44 Million (2001) 142 sq km
Sector Energy/Fuel Quantity
Residential
Electricity (Million kWh) 70.56
LPG (MT) 10,554
Fuel Wood (MT) 480
Kerosene (kL) 33,360
Coal (MT) 30
CommercialElectricity (Million kWh) 24.34
Coal (MT) 80
IndustrialElectricity (Million kWh) 43.14
Coal (MT) 15,000
TransportationDiesel (kL) 32,531
Petrol (kL) 55,458
Waste MSW (tpd) 190
Other Electricity (Million kWh) 8.87
Sector Energy/Fuel QuantityBuilding and Facilities Electricity (Million kWh) 1.23
Street Lighting Electricity (Million kWh) 6.84
Water Supply & STP Electricity (Million kWh) 9.94
TransportationPetrol (kL) 32
Diesel (kL) 144.03
Others Kerosene (kL) 34.05
• Activities in Sangli contribute to 0.47 Million TeCO2 annually
• Per capita emissions for Sangli have been 0.52T/Year in 2007-08
• The Corporation Level Emissions are about 3.4 per cent of the total city emissions
Sangli is located in western Maharashtra. It is surrounded by Satara, Solapur, Vijapur, Kolhapur, Belgum and Ratnagiri. It is located in the river basins of the Warna and Krishna river. Sangli is the largest trading centre for turmeric and raisins in India. It is located in the sugar belt of Maharashtra.
Corporation Energy Consumption
City Carbon Emissions 2007-08 Corporation Carbon Emissions 2007-08
City Profi le
Community Energy Consumption
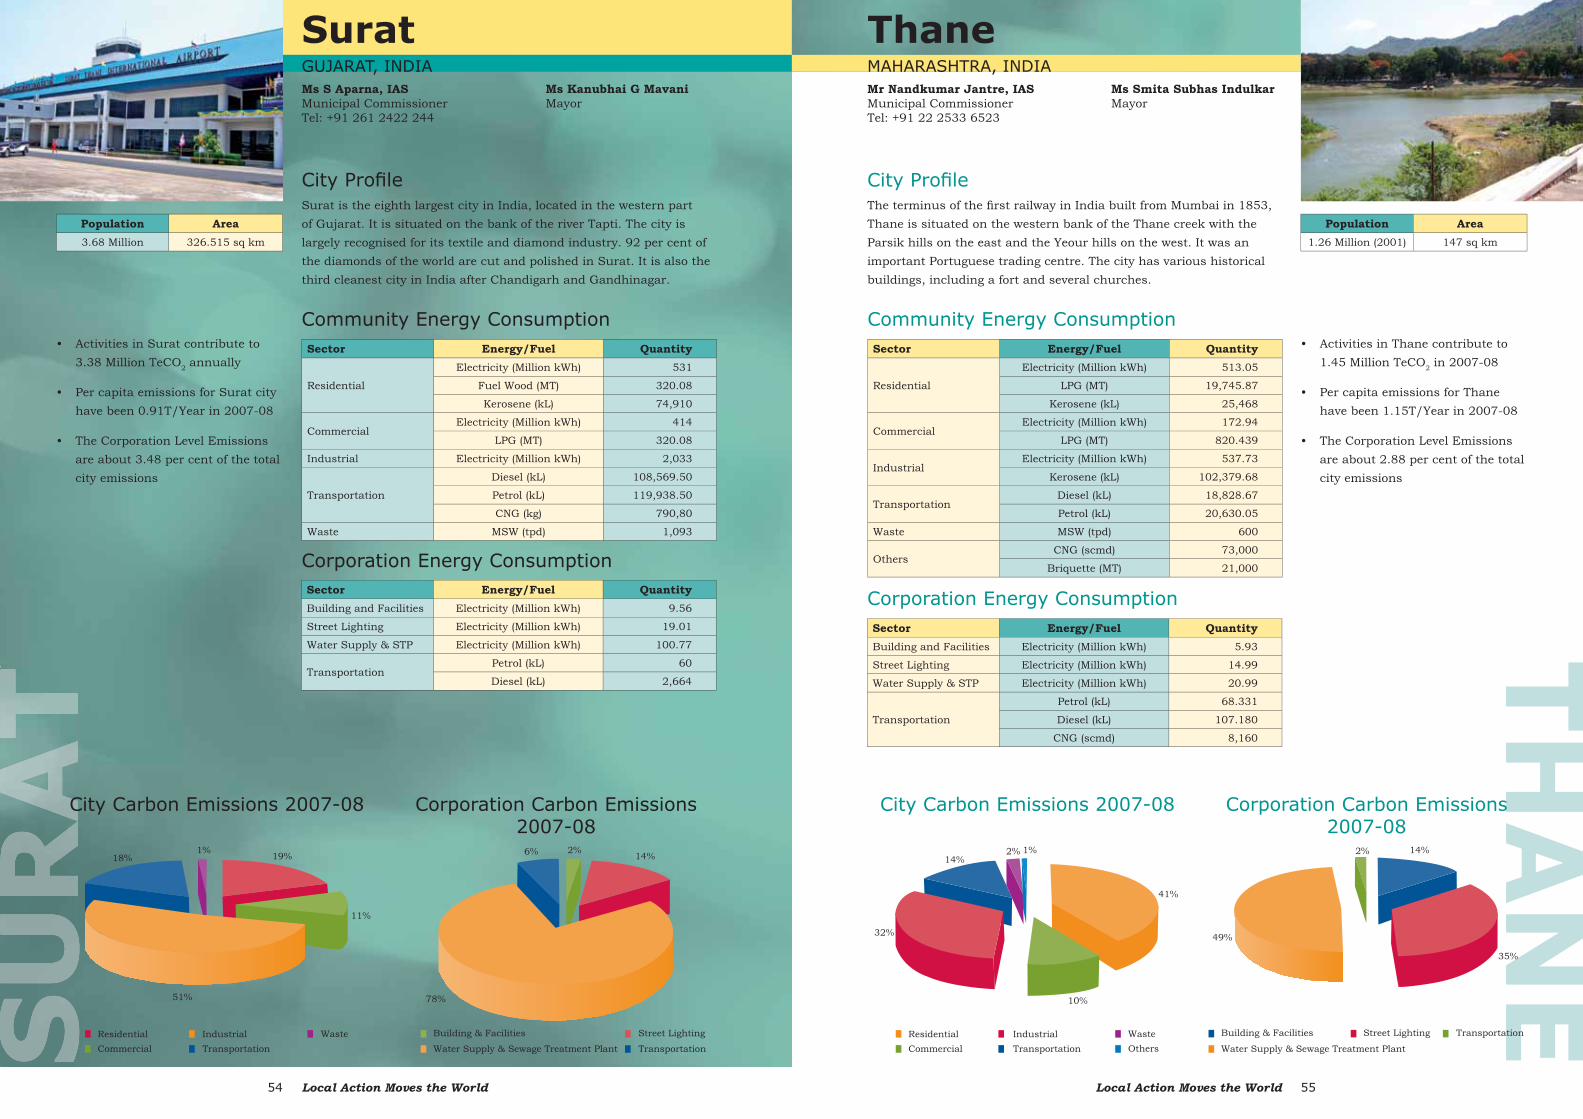
Local Action Moves the World54 Local Action Moves the World 55
TH
AN
E
Thane MAHARASHTRA, INDIAMr Nandkumar Jantre, IASMunicipal Commissioner Tel: +91 22 2533 6523
Population Area1.26 Million (2001) 147 sq km
Sector Energy/Fuel Quantity
Residential
Electricity (Million kWh) 513.05
LPG (MT) 19,745.87
Kerosene (kL) 25,468
CommercialElectricity (Million kWh) 172.94
LPG (MT) 820.439
IndustrialElectricity (Million kWh) 537.73
Kerosene (kL) 102,379.68
TransportationDiesel (kL) 18,828.67
Petrol (kL) 20,630.05
Waste MSW (tpd) 600
Others CNG (scmd) 73,000
Briquette (MT) 21,000
Sector Energy/Fuel QuantityBuilding and Facilities Electricity (Million kWh) 5.93
Street Lighting Electricity (Million kWh) 14.99
Water Supply & STP Electricity (Million kWh) 20.99
Transportation
Petrol (kL) 68.331
Diesel (kL) 107.180
CNG (scmd) 8,160
• Activities in Thane contribute to 1.45 Million TeCO2 in 2007-08
• Per capita emissions for Thane have been 1.15T/Year in 2007-08
• The Corporation Level Emissions are about 2.88 per cent of the total city emissions
Corporation Energy Consumption
The terminus of the fi rst railway in India built from Mumbai in 1853, Thane is situated on the western bank of the Thane creek with the Parsik hills on the east and the Yeour hills on the west. It was an important Portuguese trading centre. The city has various historical buildings, including a fort and several churches.
City Carbon Emissions 2007-08 Corporation Carbon Emissions 2007-08
City Profi le
Community Energy Consumption
Ms Smita Subhas IndulkarMayor
Surat GUJARAT, INDIAMs S Aparna, IASMunicipal Commissioner Tel: +91 261 2422 244
Sector Energy/Fuel Quantity
Residential
Electricity (Million kWh) 531
Fuel Wood (MT) 320.08
Kerosene (kL) 74,910
CommercialElectricity (Million kWh) 414
LPG (MT) 320.08
Industrial Electricity (Million kWh) 2,033
Transportation
Diesel (kL) 108,569.50
Petrol (kL) 119,938.50
CNG (kg) 790,80
Waste MSW (tpd) 1,093
Sector Energy/Fuel QuantityBuilding and Facilities Electricity (Million kWh) 9.56
Street Lighting Electricity (Million kWh) 19.01
Water Supply & STP Electricity (Million kWh) 100.77
TransportationPetrol (kL) 60
Diesel (kL) 2,664
• Activities in Surat contribute to 3.38 Million TeCO2 annually
• Per capita emissions for Surat city have been 0.91T/Year in 2007-08
• The Corporation Level Emissions are about 3.48 per cent of the total city emissions
Surat is the eighth largest city in India, located in the western part of Gujarat. It is situated on the bank of the river Tapti. The city is largely recognised for its textile and diamond industry. 92 per cent of the diamonds of the world are cut and polished in Surat. It is also the third cleanest city in India after Chandigarh and Gandhinagar.
Corporation Energy Consumption
City Profi le
Community Energy Consumption
Population Area3.68 Million 326.515 sq km
City Carbon Emissions 2007-08 Corporation Carbon Emissions 2007-08
Ms Kanubhai G MavaniMayor
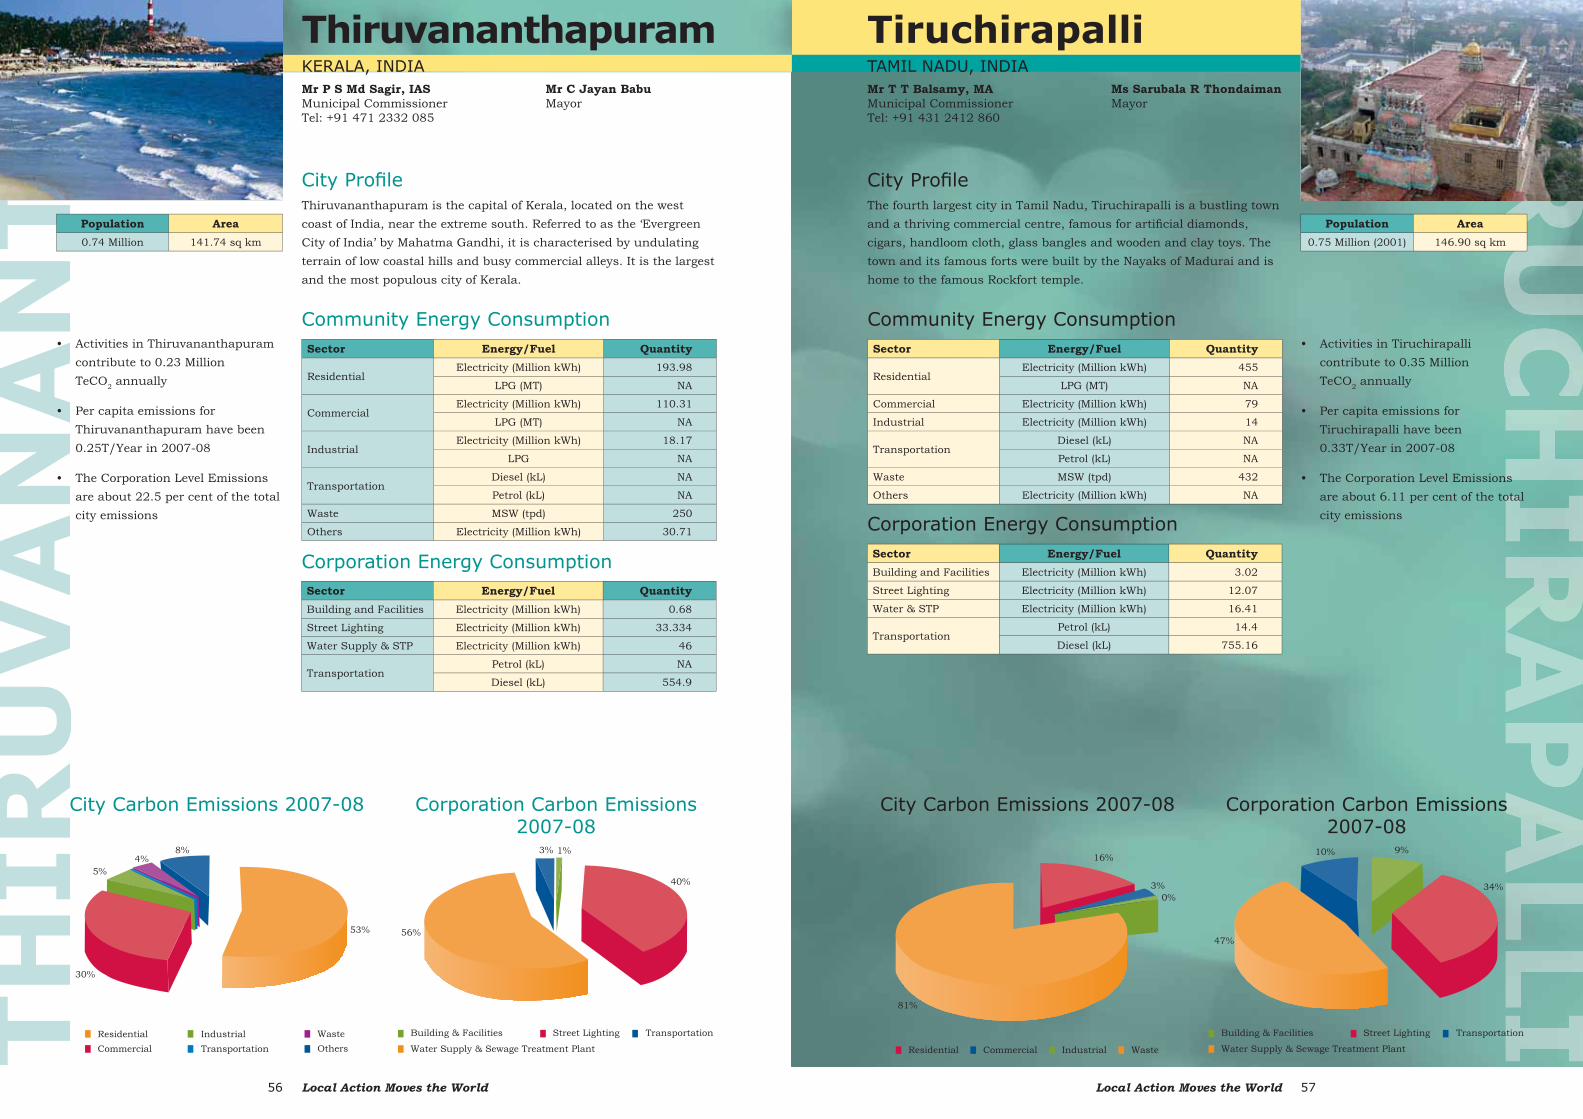
Local Action Moves the World56 Local Action Moves the World 57
Tiruchirapalli TAMIL NADU, INDIA Mr T T Balsamy, MA Municipal Commissioner Tel: +91 431 2412 860
Population Area0.75 Million (2001) 146.90 sq km
Sector Energy/Fuel Quantity
ResidentialElectricity (Million kWh) 455
LPG (MT) NA
Commercial Electricity (Million kWh) 79
Industrial Electricity (Million kWh) 14
TransportationDiesel (kL) NA
Petrol (kL) NA
Waste MSW (tpd) 432
Others Electricity (Million kWh) NA
Sector Energy/Fuel QuantityBuilding and Facilities Electricity (Million kWh) 3.02
Street Lighting Electricity (Million kWh) 12.07
Water & STP Electricity (Million kWh) 16.41
TransportationPetrol (kL) 14.4
Diesel (kL) 755.16
• Activities in Tiruchirapalli contribute to 0.35 Million TeCO2 annually
• Per capita emissions for Tiruchirapalli have been 0.33T/Year in 2007-08
• The Corporation Level Emissions are about 6.11 per cent of the total city emissions
Corporation Energy Consumption
The fourth largest city in Tamil Nadu, Tiruchirapalli is a bustling town and a thriving commercial centre, famous for artifi cial diamonds, cigars, handloom cloth, glass bangles and wooden and clay toys. The town and its famous forts were built by the Nayaks of Madurai and is home to the famous Rockfort temple.
City Carbon Emissions 2007-08 Corporation Carbon Emissions 2007-08
City Profi le
Community Energy Consumption
Ms Sarubala R ThondaimanMayor
TH
IRU
VA
NA
NTH
A Thiruvananthapuram KERALA, INDIAMr P S Md Sagir, IAS Municipal Commissioner Tel: +91 471 2332 085
Population Area0.74 Million 141.74 sq km
Sector Energy/Fuel Quantity
ResidentialElectricity (Million kWh) 193.98
LPG (MT) NA
CommercialElectricity (Million kWh) 110.31
LPG (MT) NA
IndustrialElectricity (Million kWh) 18.17
LPG NA
TransportationDiesel (kL) NA
Petrol (kL) NA
Waste MSW (tpd) 250
Others Electricity (Million kWh) 30.71
Sector Energy/Fuel QuantityBuilding and Facilities Electricity (Million kWh) 0.68
Street Lighting Electricity (Million kWh) 33.334
Water Supply & STP Electricity (Million kWh) 46
TransportationPetrol (kL) NA
Diesel (kL) 554.9
• Activities in Thiruvananthapuram contribute to 0.23 Million TeCO2 annually
• Per capita emissions for Thiruvananthapuram have been 0.25T/Year in 2007-08
• The Corporation Level Emissions are about 22.5 per cent of the total city emissions
Thiruvananthapuram is the capital of Kerala, located on the west coast of India, near the extreme south. Referred to as the ‘Evergreen City of India’ by Mahatma Gandhi, it is characterised by undulating terrain of low coastal hills and busy commercial alleys. It is the largest and the most populous city of Kerala.
Corporation Energy Consumption
City Profi le
Community Energy Consumption
City Carbon Emissions 2007-08 Corporation Carbon Emissions 2007-08
Mr C Jayan BabuMayor
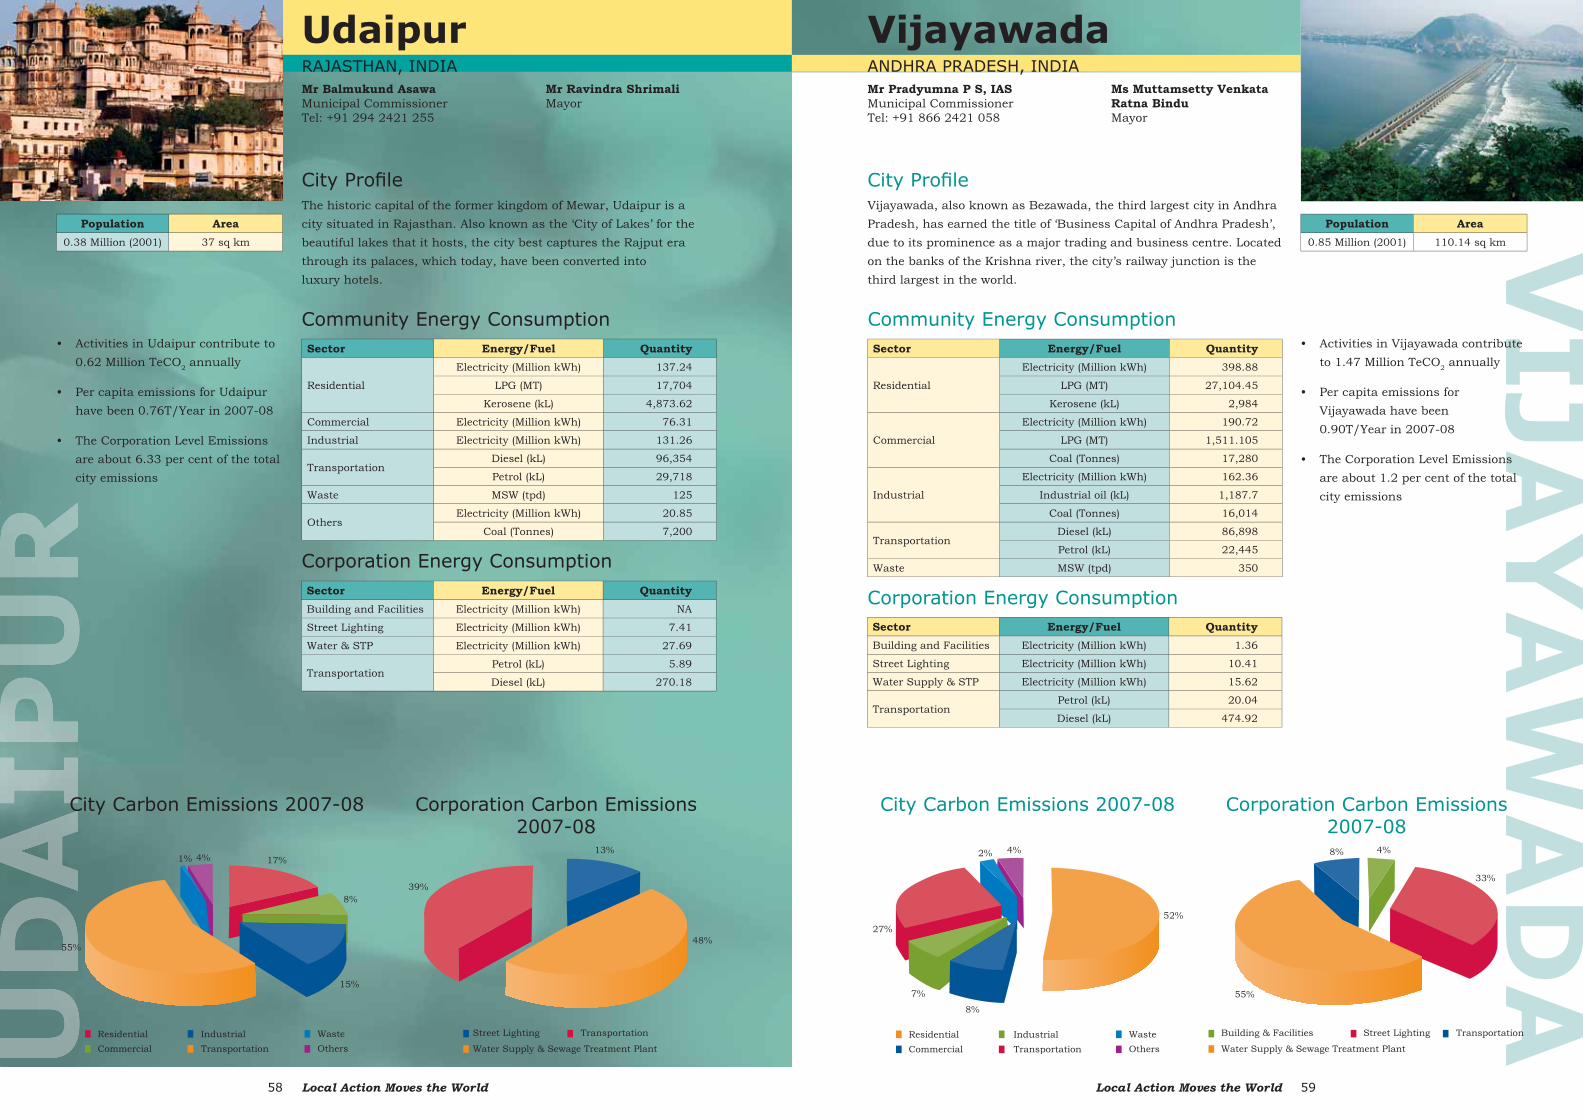
Local Action Moves the World58 Local Action Moves the World 59
VIJA
YA
WA
DA
VijayawadaANDHRA PRADESH, INDIA Mr Pradyumna P S, IASMunicipal Commissioner Tel: +91 866 2421 058
Population Area0.85 Million (2001) 110.14 sq km
Sector Energy/Fuel Quantity
Residential
Electricity (Million kWh) 398.88
LPG (MT) 27,104.45
Kerosene (kL) 2,984
Commercial
Electricity (Million kWh) 190.72
LPG (MT) 1,511.105
Coal (Tonnes) 17,280
Industrial
Electricity (Million kWh) 162.36
Industrial oil (kL) 1,187.7
Coal (Tonnes) 16,014
TransportationDiesel (kL) 86,898
Petrol (kL) 22,445
Waste MSW (tpd) 350
Sector Energy/Fuel QuantityBuilding and Facilities Electricity (Million kWh) 1.36
Street Lighting Electricity (Million kWh) 10.41
Water Supply & STP Electricity (Million kWh) 15.62
TransportationPetrol (kL) 20.04
Diesel (kL) 474.92
• Activities in Vijayawada contribute to 1.47 Million TeCO2 annually
• Per capita emissions for Vijayawada have been 0.90T/Year in 2007-08
• The Corporation Level Emissions are about 1.2 per cent of the total city emissions
Vijayawada, also known as Bezawada, the third largest city in Andhra Pradesh, has earned the title of ‘Business Capital of Andhra Pradesh’, due to its prominence as a major trading and business centre. Located on the banks of the Krishna river, the city’s railway junction is the third largest in the world.
Corporation Energy Consumption
City Carbon Emissions 2007-08 Corporation Carbon Emissions 2007-08
City Profi le
Community Energy Consumption
Ms Muttamsetty Venkata Ratna BinduMayor
Udaipur RAJASTHAN, INDIA Mr Balmukund AsawaMunicipal Commissioner Tel: +91 294 2421 255
Population Area0.38 Million (2001) 37 sq km
Sector Energy/Fuel Quantity
Residential
Electricity (Million kWh) 137.24
LPG (MT) 17,704
Kerosene (kL) 4,873.62
Commercial Electricity (Million kWh) 76.31
Industrial Electricity (Million kWh) 131.26
TransportationDiesel (kL) 96,354
Petrol (kL) 29,718
Waste MSW (tpd) 125
Others Electricity (Million kWh) 20.85
Coal (Tonnes) 7,200
Sector Energy/Fuel QuantityBuilding and Facilities Electricity (Million kWh) NA
Street Lighting Electricity (Million kWh) 7.41
Water & STP Electricity (Million kWh) 27.69
TransportationPetrol (kL) 5.89
Diesel (kL) 270.18
• Activities in Udaipur contribute to 0.62 Million TeCO2 annually
• Per capita emissions for Udaipur have been 0.76T/Year in 2007-08
• The Corporation Level Emissions are about 6.33 per cent of the total city emissions
The historic capital of the former kingdom of Mewar, Udaipur is a city situated in Rajasthan. Also known as the ‘City of Lakes’ for the beautiful lakes that it hosts, the city best captures the Rajput era through its palaces, which today, have been converted into luxury hotels.
Corporation Energy Consumption
City Profi le
Community Energy Consumption
City Carbon Emissions 2007-08 Corporation Carbon Emissions 2007-08
Mr Ravindra ShrimaliMayor
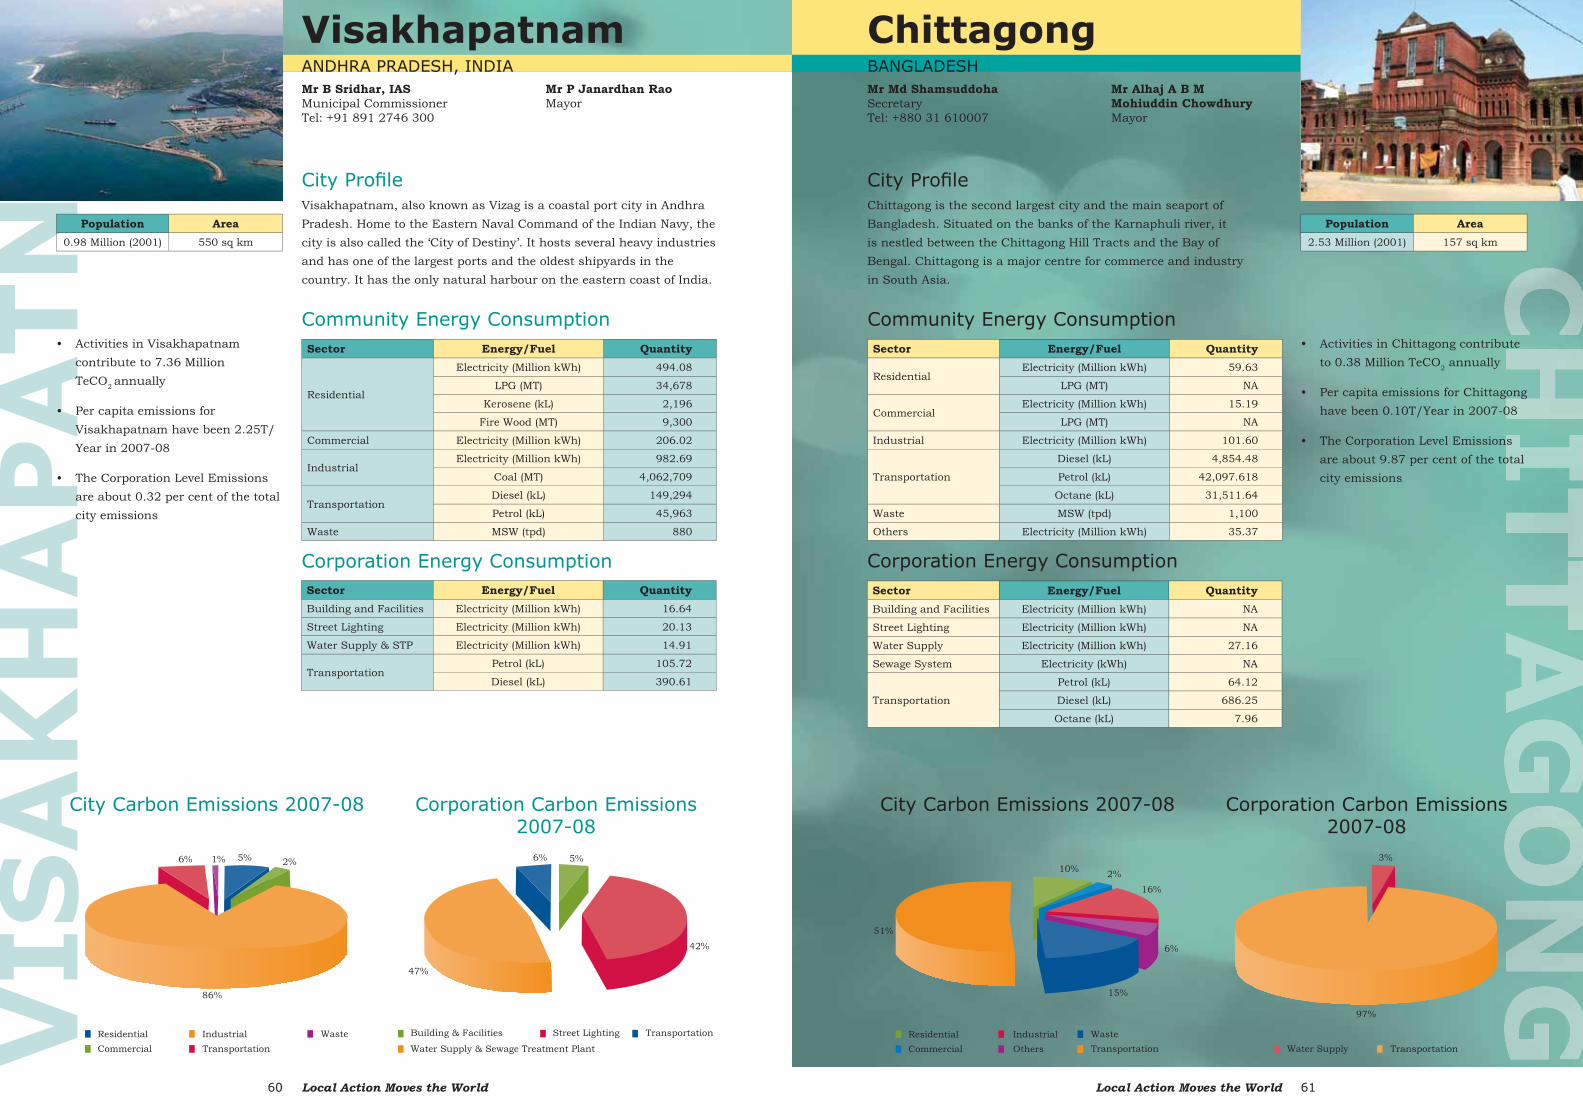
Local Action Moves the World60 Local Action Moves the World 61
Chittagong BANGLADESHMr Md ShamsuddohaSecretaryTel: +880 31 610007
Population Area2.53 Million (2001) 157 sq km
Sector Energy/Fuel Quantity
ResidentialElectricity (Million kWh) 59.63
LPG (MT) NA
CommercialElectricity (Million kWh) 15.19
LPG (MT) NA
Industrial Electricity (Million kWh) 101.60
Transportation
Diesel (kL) 4,854.48
Petrol (kL) 42,097.618
Octane (kL) 31,511.64
Waste MSW (tpd) 1,100
Others Electricity (Million kWh) 35.37
Sector Energy/Fuel QuantityBuilding and Facilities Electricity (Million kWh) NA
Street Lighting Electricity (Million kWh) NA
Water Supply Electricity (Million kWh) 27.16
Sewage System Electricity (kWh) NA
Transportation
Petrol (kL) 64.12
Diesel (kL) 686.25
Octane (kL) 7.96
• Activities in Chittagong contribute to 0.38 Million TeCO2 annually
• Per capita emissions for Chittagong have been 0.10T/Year in 2007-08
• The Corporation Level Emissions are about 9.87 per cent of the total city emissions
Corporation Energy Consumption
Chittagong is the second largest city and the main seaport of Bangladesh. Situated on the banks of the Karnaphuli river, it is nestled between the Chittagong Hill Tracts and the Bay of Bengal. Chittagong is a major centre for commerce and industry in South Asia.
City Carbon Emissions 2007-08 Corporation Carbon Emissions 2007-08
City Profi le
Community Energy Consumption
Mr Alhaj A B M Mohiuddin ChowdhuryMayor
VIS
AK
HA
PA
TN
AM
Visakhapatnam ANDHRA PRADESH, INDIA Mr B Sridhar, IASMunicipal Commissioner Tel: +91 891 2746 300
Population Area0.98 Million (2001) 550 sq km
Sector Energy/Fuel Quantity
Residential
Electricity (Million kWh) 494.08
LPG (MT) 34,678
Kerosene (kL) 2,196
Fire Wood (MT) 9,300
Commercial Electricity (Million kWh) 206.02
IndustrialElectricity (Million kWh) 982.69
Coal (MT) 4,062,709
TransportationDiesel (kL) 149,294
Petrol (kL) 45,963
Waste MSW (tpd) 880
Sector Energy/Fuel QuantityBuilding and Facilities Electricity (Million kWh) 16.64
Street Lighting Electricity (Million kWh) 20.13
Water Supply & STP Electricity (Million kWh) 14.91
TransportationPetrol (kL) 105.72
Diesel (kL) 390.61
• Activities in Visakhapatnam contribute to 7.36 Million TeCO2 annually
• Per capita emissions for Visakhapatnam have been 2.25T/Year in 2007-08
• The Corporation Level Emissions are about 0.32 per cent of the total city emissions
Visakhapatnam, also known as Vizag is a coastal port city in Andhra Pradesh. Home to the Eastern Naval Command of the Indian Navy, the city is also called the ‘City of Destiny’. It hosts several heavy industries and has one of the largest ports and the oldest shipyards in the country. It has the only natural harbour on the eastern coast of India.
Corporation Energy Consumption
City Carbon Emissions 2007-08 Corporation Carbon Emissions 2007-08
City Profi le
Community Energy Consumption
Mr P Janardhan RaoMayor
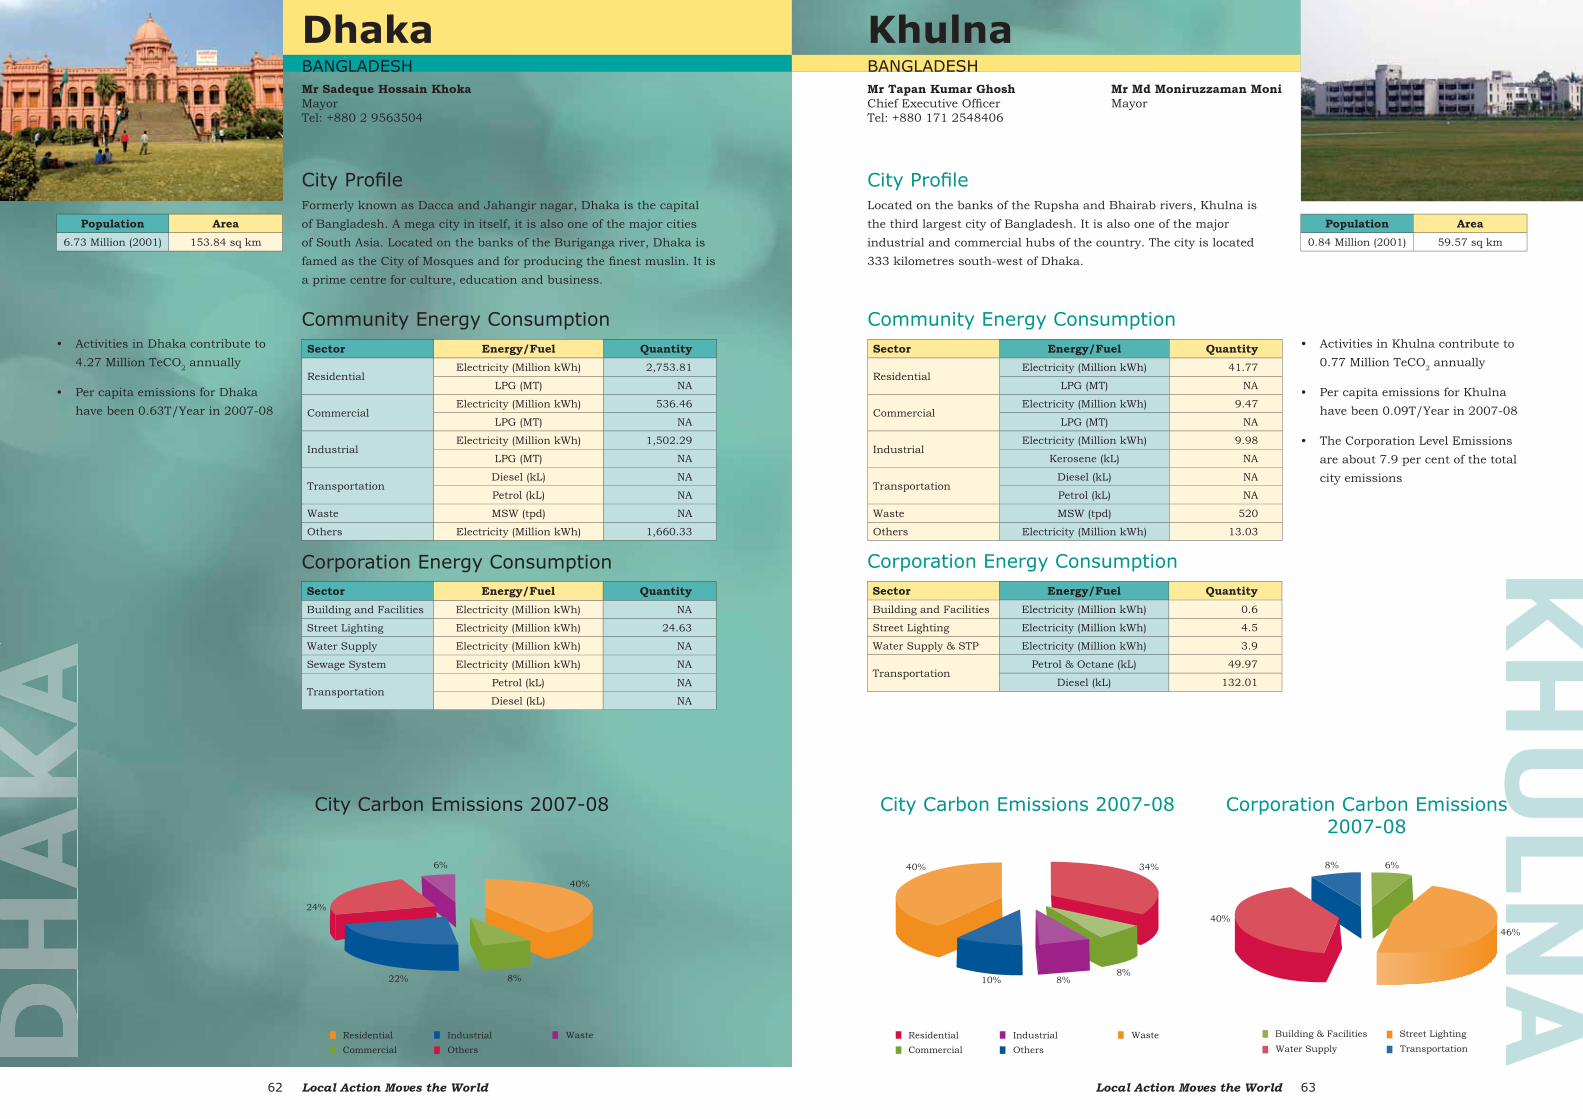
Local Action Moves the World62 Local Action Moves the World 63
KH
ULN
AKhulnaBANGLADESHMr Tapan Kumar GhoshChief Executive Offi cerTel: +880 171 2548406
Population Area0.84 Million (2001) 59.57 sq km
Sector Energy/Fuel Quantity
ResidentialElectricity (Million kWh) 41.77
LPG (MT) NA
CommercialElectricity (Million kWh) 9.47
LPG (MT) NA
IndustrialElectricity (Million kWh) 9.98
Kerosene (kL) NA
TransportationDiesel (kL) NA
Petrol (kL) NA
Waste MSW (tpd) 520
Others Electricity (Million kWh) 13.03
Sector Energy/Fuel QuantityBuilding and Facilities Electricity (Million kWh) 0.6
Street Lighting Electricity (Million kWh) 4.5
Water Supply & STP Electricity (Million kWh) 3.9
TransportationPetrol & Octane (kL) 49.97
Diesel (kL) 132.01
• Activities in Khulna contribute to 0.77 Million TeCO2 annually
• Per capita emissions for Khulna have been 0.09T/Year in 2007-08
• The Corporation Level Emissions are about 7.9 per cent of the total city emissions
Corporation Energy Consumption
Located on the banks of the Rupsha and Bhairab rivers, Khulna is the third largest city of Bangladesh. It is also one of the major industrial and commercial hubs of the country. The city is located 333 kilometres south-west of Dhaka.
City Carbon Emissions 2007-08 Corporation Carbon Emissions 2007-08
City Profi le
Community Energy Consumption
Mr Md Moniruzzaman MoniMayor
DhakaBANGLADESHMr Sadeque Hossain KhokaMayorTel: +880 2 9563504
Sector Energy/Fuel Quantity
ResidentialElectricity (Million kWh) 2,753.81
LPG (MT) NA
CommercialElectricity (Million kWh) 536.46
LPG (MT) NA
IndustrialElectricity (Million kWh) 1,502.29
LPG (MT) NA
TransportationDiesel (kL) NA
Petrol (kL) NA
Waste MSW (tpd) NA
Others Electricity (Million kWh) 1,660.33
Sector Energy/Fuel QuantityBuilding and Facilities Electricity (Million kWh) NA
Street Lighting Electricity (Million kWh) 24.63
Water Supply Electricity (Million kWh) NA
Sewage System Electricity (Million kWh) NA
TransportationPetrol (kL) NA
Diesel (kL) NA
• Activities in Dhaka contribute to 4.27 Million TeCO2 annually
• Per capita emissions for Dhaka have been 0.63T/Year in 2007-08
Formerly known as Dacca and Jahangir nagar, Dhaka is the capital of Bangladesh. A mega city in itself, it is also one of the major cities of South Asia. Located on the banks of the Buriganga river, Dhaka is famed as the City of Mosques and for producing the fi nest muslin. It is a prime centre for culture, education and business.
Corporation Energy Consumption
City Profi le
Community Energy Consumption
Population Area6.73 Million (2001) 153.84 sq km
City Carbon Emissions 2007-08
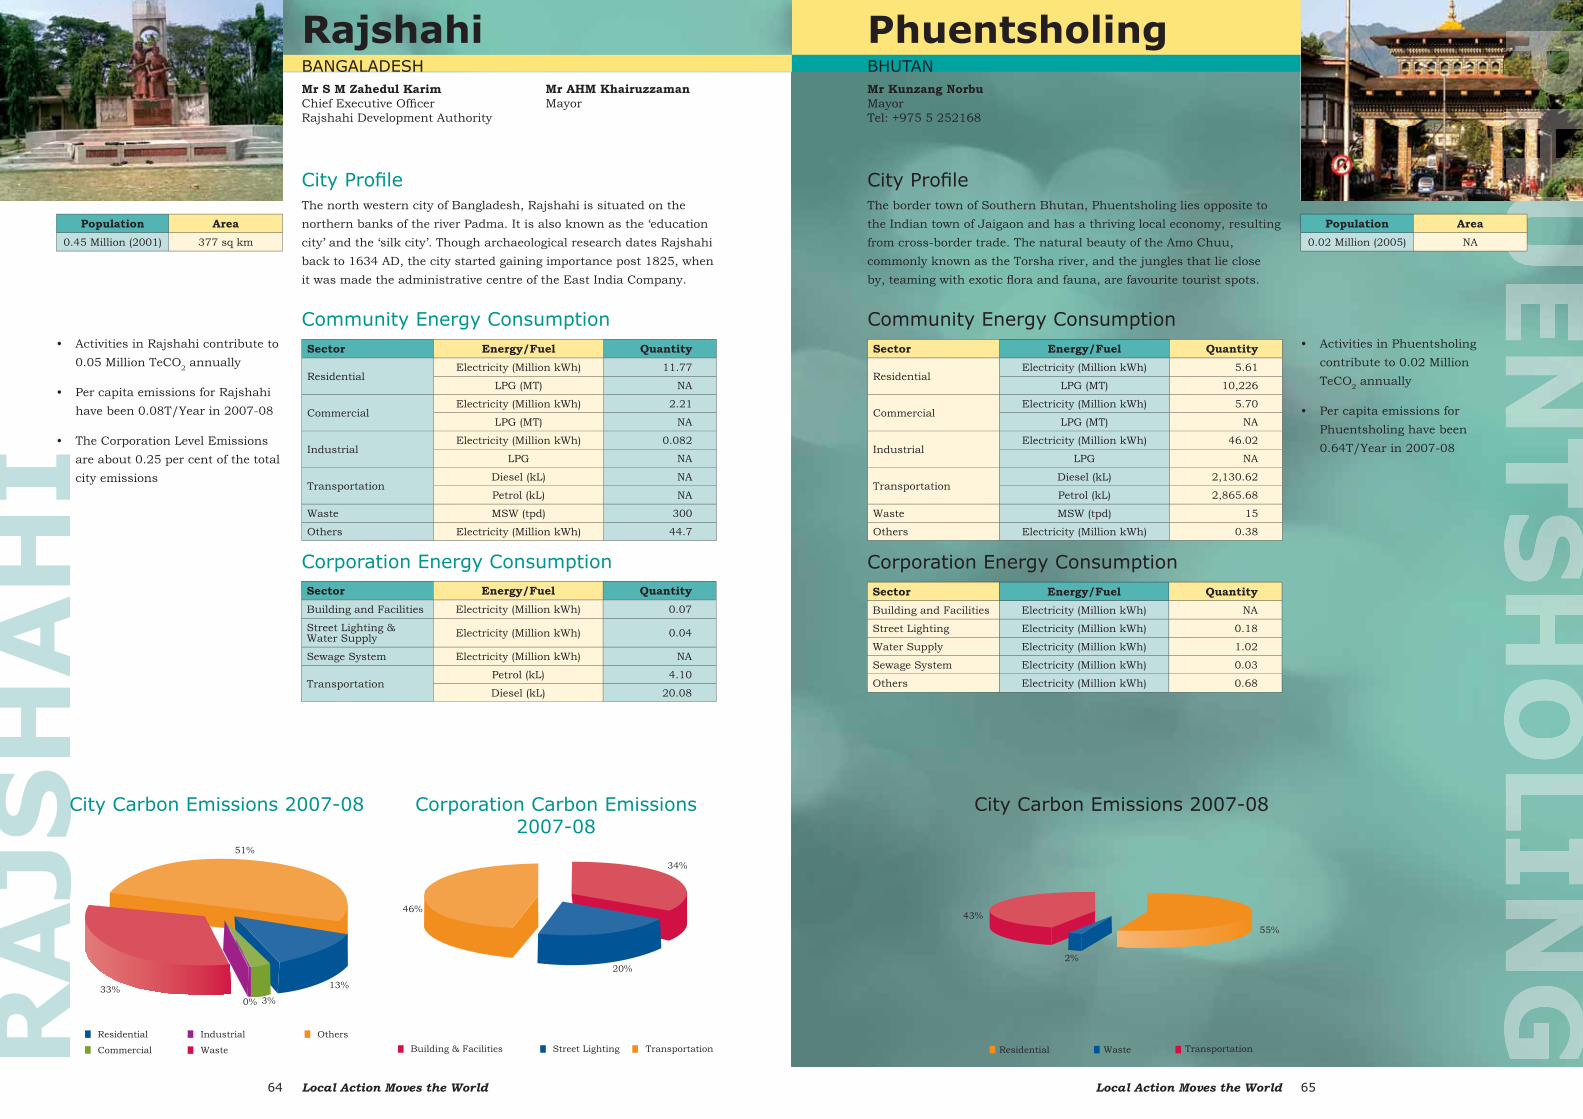
Local Action Moves the World64 Local Action Moves the World 65
PhuentsholingBHUTANMr Kunzang NorbuMayorTel: +975 5 252168
Sector Energy/Fuel Quantity
ResidentialElectricity (Million kWh) 5.61
LPG (MT) 10,226
CommercialElectricity (Million kWh) 5.70
LPG (MT) NA
IndustrialElectricity (Million kWh) 46.02
LPG NA
TransportationDiesel (kL) 2,130.62
Petrol (kL) 2,865.68
Waste MSW (tpd) 15
Others Electricity (Million kWh) 0.38
Sector Energy/Fuel QuantityBuilding and Facilities Electricity (Million kWh) NA
Street Lighting Electricity (Million kWh) 0.18
Water Supply Electricity (Million kWh) 1.02
Sewage System Electricity (Million kWh) 0.03
Others Electricity (Million kWh) 0.68
• Activities in Phuentsholing contribute to 0.02 Million TeCO2 annually
• Per capita emissions for Phuentsholing have been 0.64T/Year in 2007-08
Corporation Energy Consumption
The border town of Southern Bhutan, Phuentsholing lies opposite to the Indian town of Jaigaon and has a thriving local economy, resulting from cross-border trade. The natural beauty of the Amo Chuu, commonly known as the Torsha river, and the jungles that lie close by, teaming with exotic fl ora and fauna, are favourite tourist spots.
City Carbon Emissions 2007-08
City Profi le
Community Energy Consumption
Population Area0.02 Million (2005) NA
RA
JSH
AH
IRajshahiBANGALADESHMr S M Zahedul KarimChief Executive Offi cerRajshahi Development Authority
Population Area0.45 Million (2001) 377 sq km
Sector Energy/Fuel Quantity
ResidentialElectricity (Million kWh) 11.77
LPG (MT) NA
CommercialElectricity (Million kWh) 2.21
LPG (MT) NA
IndustrialElectricity (Million kWh) 0.082
LPG NA
TransportationDiesel (kL) NA
Petrol (kL) NA
Waste MSW (tpd) 300
Others Electricity (Million kWh) 44.7
Sector Energy/Fuel QuantityBuilding and Facilities Electricity (Million kWh) 0.07
Street Lighting &Water Supply Electricity (Million kWh) 0.04
Sewage System Electricity (Million kWh) NA
TransportationPetrol (kL) 4.10
Diesel (kL) 20.08
• Activities in Rajshahi contribute to 0.05 Million TeCO2 annually
• Per capita emissions for Rajshahi have been 0.08T/Year in 2007-08
• The Corporation Level Emissions are about 0.25 per cent of the total city emissions
The north western city of Bangladesh, Rajshahi is situated on the northern banks of the river Padma. It is also known as the ‘education city’ and the ‘silk city’. Though archaeological research dates Rajshahi back to 1634 AD, the city started gaining importance post 1825, when it was made the administrative centre of the East India Company.
Corporation Energy Consumption
City Profi le
Community Energy Consumption
City Carbon Emissions 2007-08 Corporation Carbon Emissions 2007-08
Mr AHM Khairuzzaman Mayor
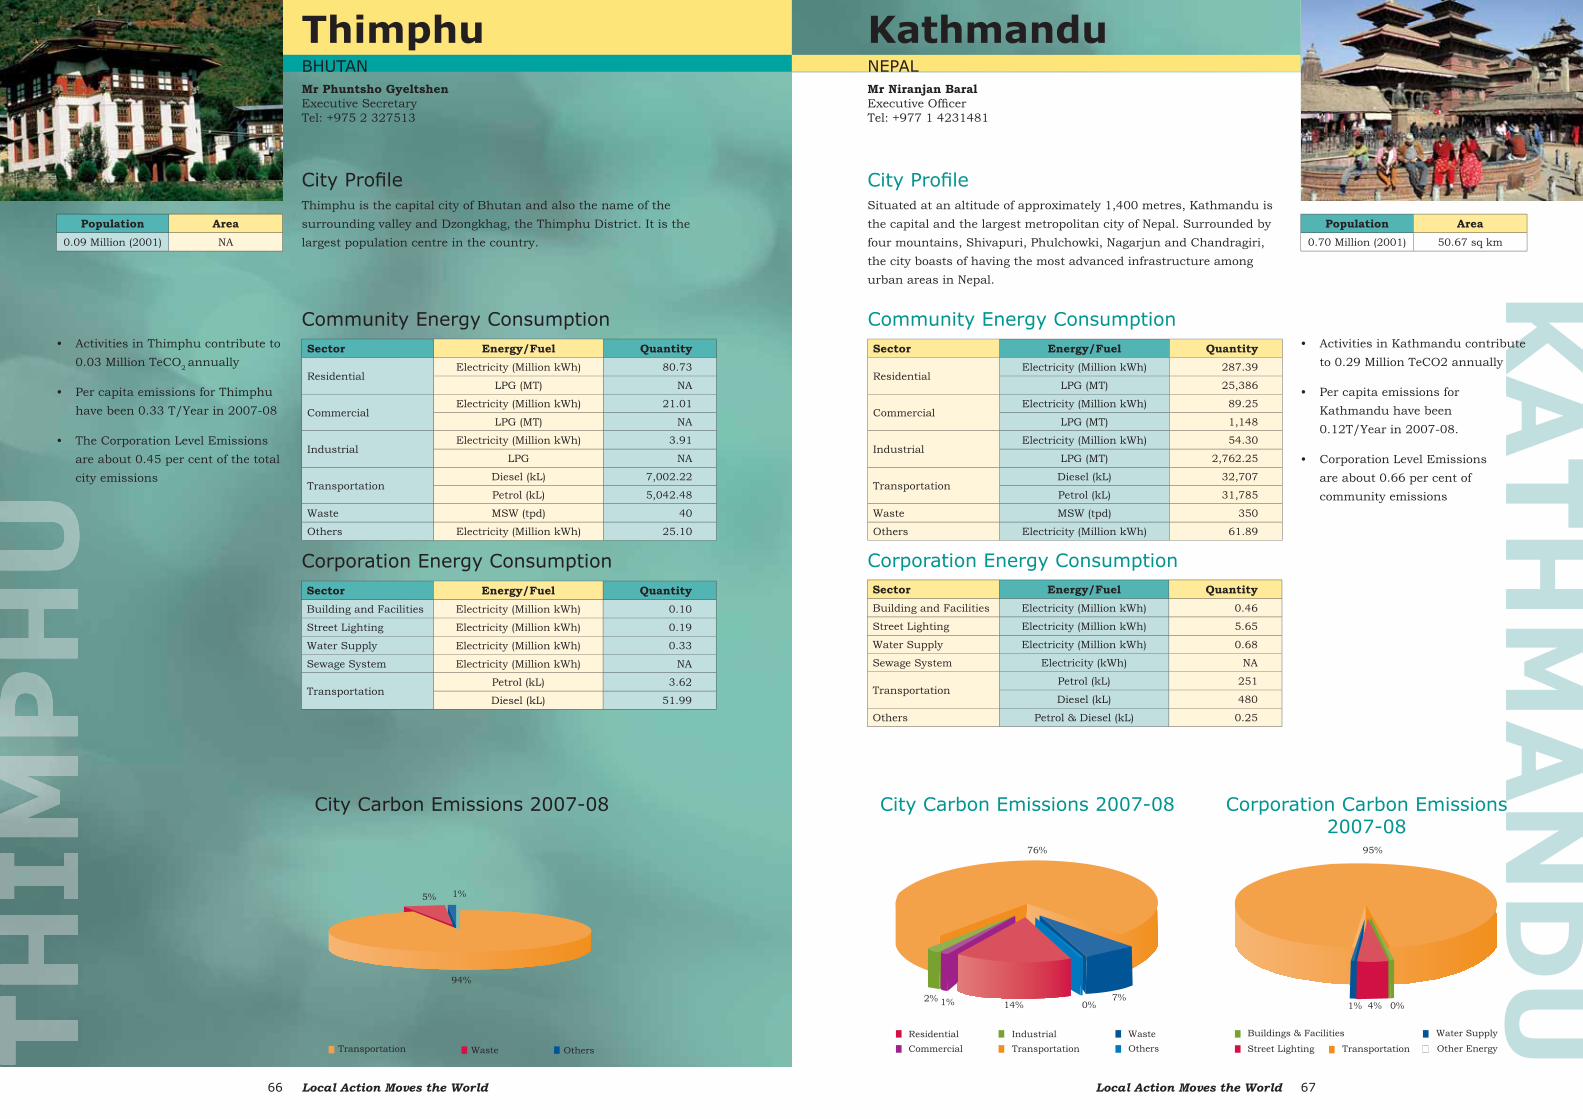
Local Action Moves the World66 Local Action Moves the World 67
KA
TH
MA
ND
UKathmanduNEPALMr Niranjan BaralExecutive Offi cerTel: +977 1 4231481
Population Area0.70 Million (2001) 50.67 sq km
Sector Energy/Fuel Quantity
ResidentialElectricity (Million kWh) 287.39
LPG (MT) 25,386
CommercialElectricity (Million kWh) 89.25
LPG (MT) 1,148
IndustrialElectricity (Million kWh) 54.30
LPG (MT) 2,762.25
TransportationDiesel (kL) 32,707
Petrol (kL) 31,785
Waste MSW (tpd) 350
Others Electricity (Million kWh) 61.89
Sector Energy/Fuel QuantityBuilding and Facilities Electricity (Million kWh) 0.46
Street Lighting Electricity (Million kWh) 5.65
Water Supply Electricity (Million kWh) 0.68
Sewage System Electricity (kWh) NA
TransportationPetrol (kL) 251
Diesel (kL) 480
Others Petrol & Diesel (kL) 0.25
• Activities in Kathmandu contribute to 0.29 Million TeCO2 annually
• Per capita emissions for Kathmandu have been 0.12T/Year in 2007-08.
• Corporation Level Emissions are about 0.66 per cent of community emissions
Situated at an altitude of approximately 1,400 metres, Kathmandu is the capital and the largest metropolitan city of Nepal. Surrounded by four mountains, Shivapuri, Phulchowki, Nagarjun and Chandragiri, the city boasts of having the most advanced infrastructure among urban areas in Nepal.
Corporation Energy Consumption
City Carbon Emissions 2007-08 Corporation Carbon Emissions 2007-08
City Profi le
Community Energy Consumption
ThimphuBHUTANMr Phuntsho GyeltshenExecutive SecretaryTel: +975 2 327513
Population Area0.09 Million (2001) NA
Sector Energy/Fuel Quantity
ResidentialElectricity (Million kWh) 80.73
LPG (MT) NA
CommercialElectricity (Million kWh) 21.01
LPG (MT) NA
IndustrialElectricity (Million kWh) 3.91
LPG NA
TransportationDiesel (kL) 7,002.22
Petrol (kL) 5,042.48
Waste MSW (tpd) 40
Others Electricity (Million kWh) 25.10
Sector Energy/Fuel QuantityBuilding and Facilities Electricity (Million kWh) 0.10
Street Lighting Electricity (Million kWh) 0.19
Water Supply Electricity (Million kWh) 0.33
Sewage System Electricity (Million kWh) NA
TransportationPetrol (kL) 3.62
Diesel (kL) 51.99
• Activities in Thimphu contribute to 0.03 Million TeCO2 annually
• Per capita emissions for Thimphu have been 0.33 T/Year in 2007-08
• The Corporation Level Emissions are about 0.45 per cent of the total city emissions
Thimphu is the capital city of Bhutan and also the name of the surrounding valley and Dzongkhag, the Thimphu District. It is the largest population centre in the country.
Corporation Energy Consumption
City Profi le
Community Energy Consumption
City Carbon Emissions 2007-08
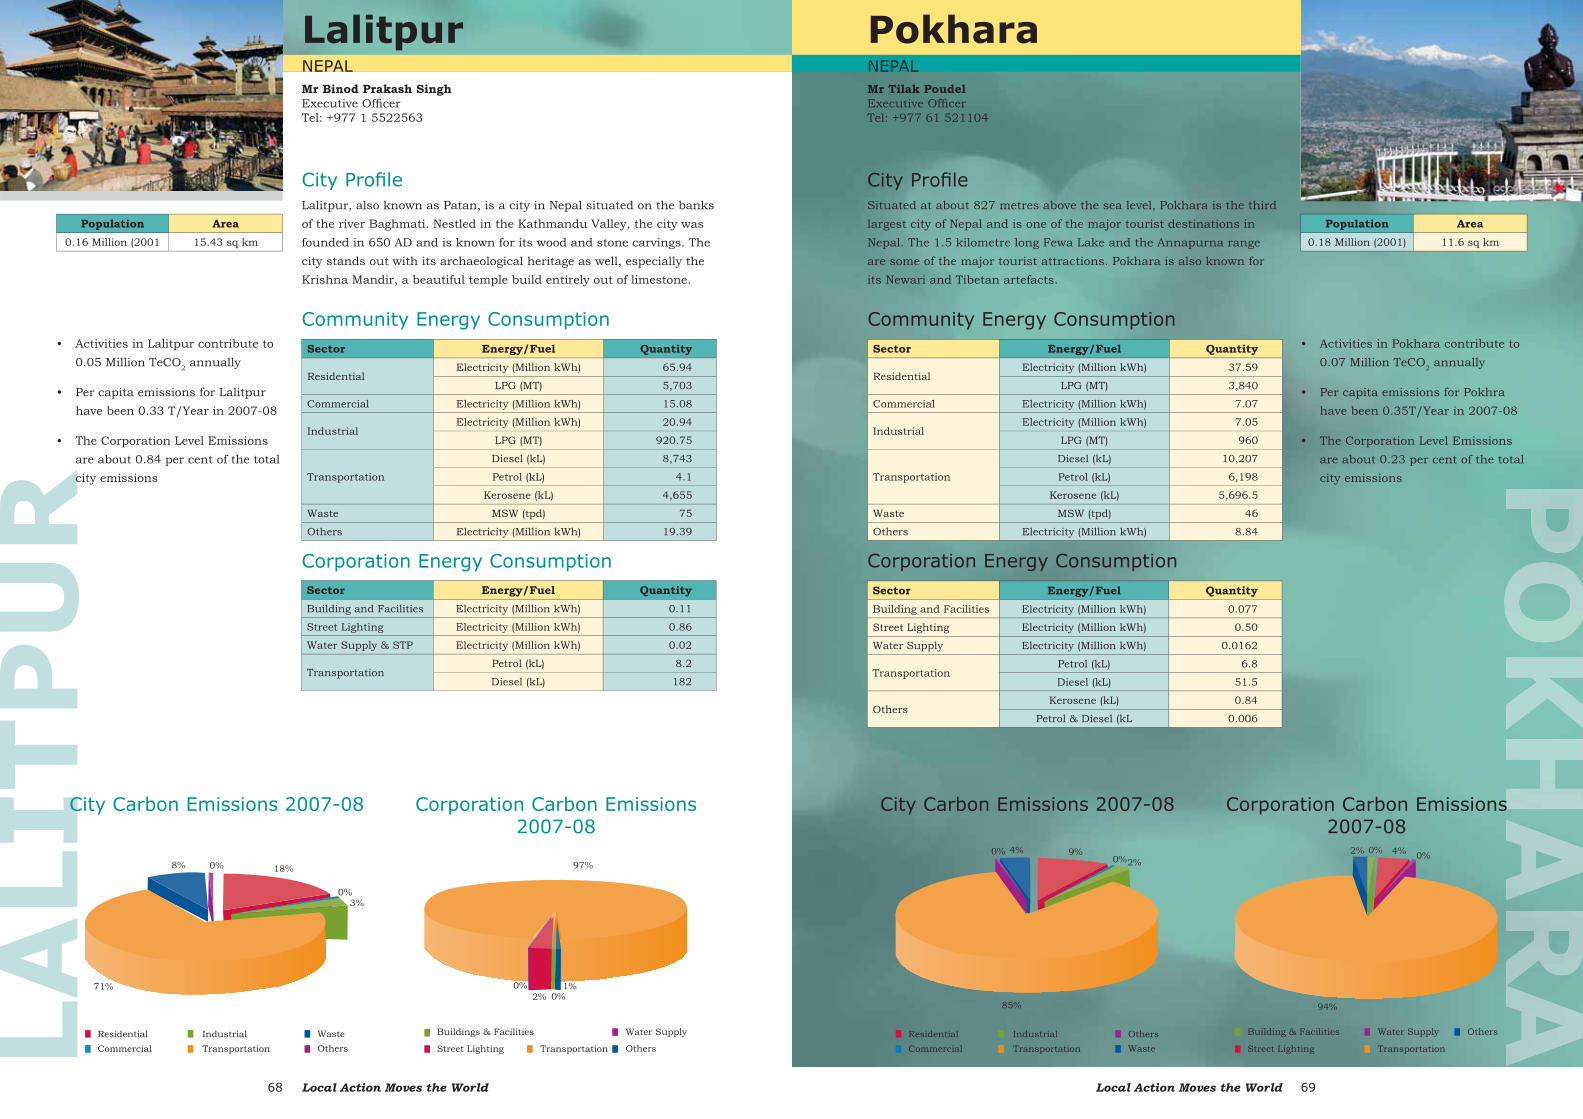
Local Action Moves the World68 Local Action Moves the World 69
PokharaNEPALMr Tilak PoudelExecutive Offi cerTel: +977 61 521104
Population Area0.18 Million (2001) 11.6 sq km
Sector Energy/Fuel Quantity
ResidentialElectricity (Million kWh) 37.59
LPG (MT) 3,840
Commercial Electricity (Million kWh) 7.07
IndustrialElectricity (Million kWh) 7.05
LPG (MT) 960
Transportation
Diesel (kL) 10,207
Petrol (kL) 6,198
Kerosene (kL) 5,696.5
Waste MSW (tpd) 46
Others Electricity (Million kWh) 8.84
Sector Energy/Fuel QuantityBuilding and Facilities Electricity (Million kWh) 0.077
Street Lighting Electricity (Million kWh) 0.50
Water Supply Electricity (Million kWh) 0.0162
TransportationPetrol (kL) 6.8
Diesel (kL) 51.5
OthersKerosene (kL) 0.84
Petrol & Diesel (kL 0.006
• Activities in Pokhara contribute to 0.07 Million TeCO2 annually
• Per capita emissions for Pokhra have been 0.35T/Year in 2007-08
• The Corporation Level Emissions are about 0.23 per cent of the total city emissions
Corporation Energy Consumption
Situated at about 827 metres above the sea level, Pokhara is the third largest city of Nepal and is one of the major tourist destinations in Nepal. The 1.5 kilometre long Fewa Lake and the Annapurna range are some of the major tourist attractions. Pokhara is also known for its Newari and Tibetan artefacts.
City Carbon Emissions 2007-08 Corporation Carbon Emissions 2007-08
City Profi le
Community Energy Consumption
LA
LIT
PU
RLalitpurNEPALMr Binod Prakash SinghExecutive Offi cerTel: +977 1 5522563
Population Area0.16 Million (2001 15.43 sq km
Sector Energy/Fuel Quantity
ResidentialElectricity (Million kWh) 65.94
LPG (MT) 5,703
Commercial Electricity (Million kWh) 15.08
IndustrialElectricity (Million kWh) 20.94
LPG (MT) 920.75
Transportation
Diesel (kL) 8,743
Petrol (kL) 4.1
Kerosene (kL) 4,655
Waste MSW (tpd) 75
Others Electricity (Million kWh) 19.39
Sector Energy/Fuel QuantityBuilding and Facilities Electricity (Million kWh) 0.11
Street Lighting Electricity (Million kWh) 0.86
Water Supply & STP Electricity (Million kWh) 0.02
TransportationPetrol (kL) 8.2
Diesel (kL) 182
• Activities in Lalitpur contribute to 0.05 Million TeCO2 annually
• Per capita emissions for Lalitpur have been 0.33 T/Year in 2007-08
• The Corporation Level Emissions are about 0.84 per cent of the total city emissions
Lalitpur, also known as Patan, is a city in Nepal situated on the banks of the river Baghmati. Nestled in the Kathmandu Valley, the city was founded in 650 AD and is known for its wood and stone carvings. The city stands out with its archaeological heritage as well, especially the Krishna Mandir, a beautiful temple build entirely out of limestone.
Corporation Energy Consumption
City Carbon Emissions 2007-08 Corporation Carbon Emissions 2007-08
City Profi le
Community Energy Consumption
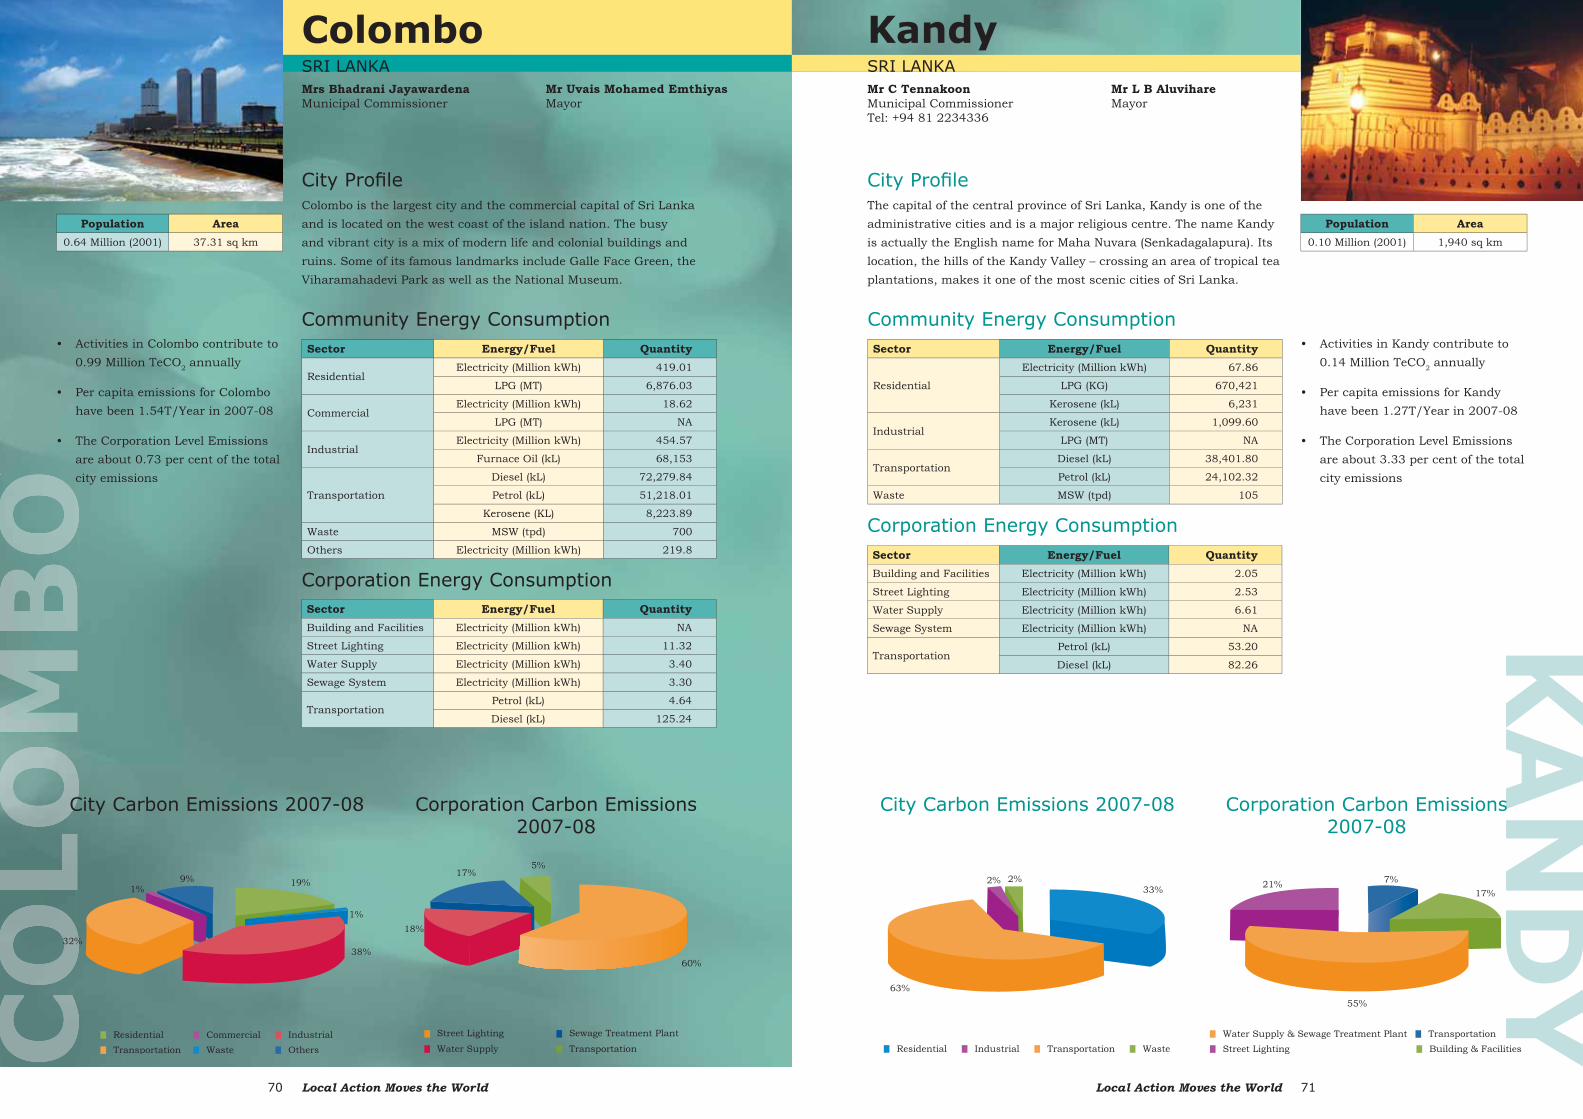
Local Action Moves the World70 Local Action Moves the World 71
KA
ND
YKandySRI LANKAMr C TennakoonMunicipal CommissionerTel: +94 81 2234336
Population Area0.10 Million (2001) 1,940 sq km
Sector Energy/Fuel Quantity
Residential
Electricity (Million kWh) 67.86
LPG (KG) 670,421
Kerosene (kL) 6,231
IndustrialKerosene (kL) 1,099.60
LPG (MT) NA
TransportationDiesel (kL) 38,401.80
Petrol (kL) 24,102.32
Waste MSW (tpd) 105
Sector Energy/Fuel QuantityBuilding and Facilities Electricity (Million kWh) 2.05
Street Lighting Electricity (Million kWh) 2.53
Water Supply Electricity (Million kWh) 6.61
Sewage System Electricity (Million kWh) NA
TransportationPetrol (kL) 53.20
Diesel (kL) 82.26
• Activities in Kandy contribute to 0.14 Million TeCO2 annually
• Per capita emissions for Kandy have been 1.27T/Year in 2007-08
• The Corporation Level Emissions are about 3.33 per cent of the total city emissions
Corporation Energy Consumption
The capital of the central province of Sri Lanka, Kandy is one of the administrative cities and is a major religious centre. The name Kandy is actually the English name for Maha Nuvara (Senkadagalapura). Its location, the hills of the Kandy Valley – crossing an area of tropical tea plantations, makes it one of the most scenic cities of Sri Lanka.
City Carbon Emissions 2007-08
City Profi le
Community Energy Consumption
Corporation Carbon Emissions 2007-08
Mr L B AluvihareMayor
ColomboSRI LANKAMrs Bhadrani JayawardenaMunicipal Commissioner
Sector Energy/Fuel Quantity
ResidentialElectricity (Million kWh) 419.01
LPG (MT) 6,876.03
CommercialElectricity (Million kWh) 18.62
LPG (MT) NA
IndustrialElectricity (Million kWh) 454.57
Furnace Oil (kL) 68,153
Transportation
Diesel (kL) 72,279.84
Petrol (kL) 51,218.01
Kerosene (KL) 8,223.89
Waste MSW (tpd) 700
Others Electricity (Million kWh) 219.8
Sector Energy/Fuel QuantityBuilding and Facilities Electricity (Million kWh) NA
Street Lighting Electricity (Million kWh) 11.32
Water Supply Electricity (Million kWh) 3.40
Sewage System Electricity (Million kWh) 3.30
TransportationPetrol (kL) 4.64
Diesel (kL) 125.24
• Activities in Colombo contribute to 0.99 Million TeCO2 annually
• Per capita emissions for Colombo have been 1.54T/Year in 2007-08
• The Corporation Level Emissions are about 0.73 per cent of the total city emissions
Colombo is the largest city and the commercial capital of Sri Lanka and is located on the west coast of the island nation. The busy and vibrant city is a mix of modern life and colonial buildings and ruins. Some of its famous landmarks include Galle Face Green, the Viharamahadevi Park as well as the National Museum.
Corporation Energy Consumption
City Profi le
Community Energy Consumption
Population Area0.64 Million (2001) 37.31 sq km
City Carbon Emissions 2007-08 Corporation Carbon Emissions 2007-08
Mr Uvais Mohamed EmthiyasMayor
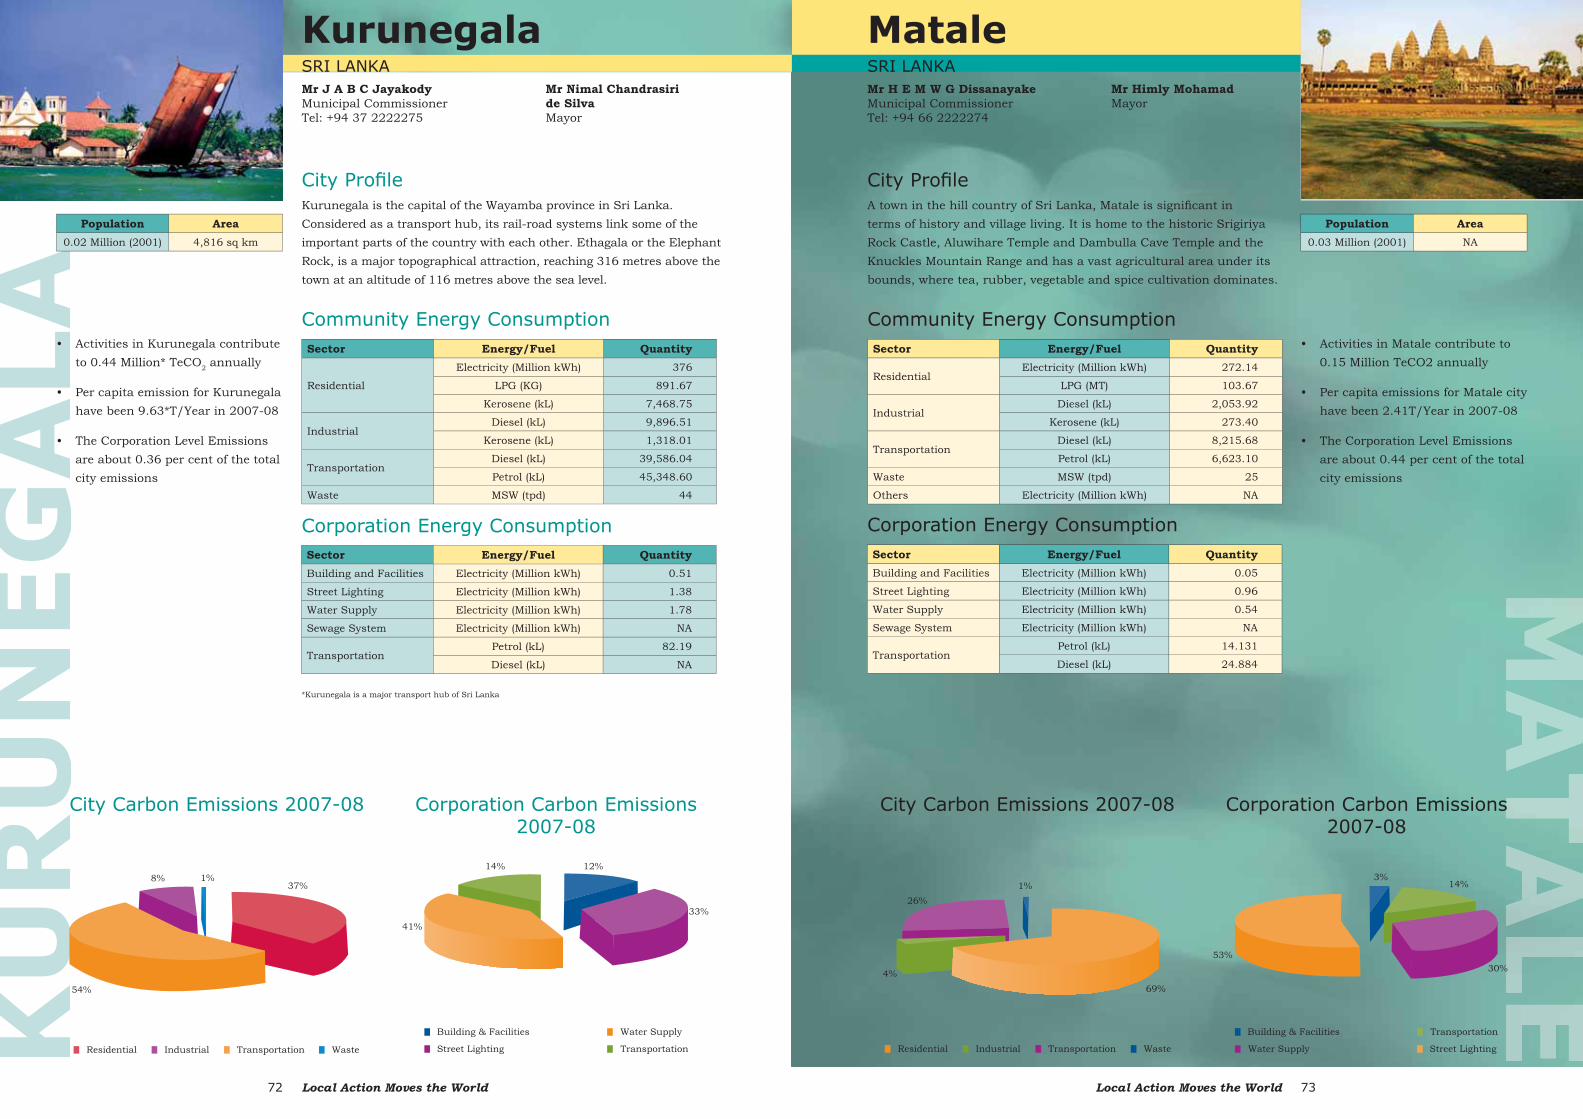
Local Action Moves the World72 Local Action Moves the World 73
MataleSRI LANKAMr H E M W G DissanayakeMunicipal CommissionerTel: +94 66 2222274
Sector Energy/Fuel Quantity
ResidentialElectricity (Million kWh) 272.14
LPG (MT) 103.67
IndustrialDiesel (kL) 2,053.92
Kerosene (kL) 273.40
TransportationDiesel (kL) 8,215.68
Petrol (kL) 6,623.10
Waste MSW (tpd) 25
Others Electricity (Million kWh) NA
Sector Energy/Fuel QuantityBuilding and Facilities Electricity (Million kWh) 0.05
Street Lighting Electricity (Million kWh) 0.96
Water Supply Electricity (Million kWh) 0.54
Sewage System Electricity (Million kWh) NA
TransportationPetrol (kL) 14.131
Diesel (kL) 24.884
• Activities in Matale contribute to 0.15 Million TeCO2 annually
• Per capita emissions for Matale city have been 2.41T/Year in 2007-08
• The Corporation Level Emissions are about 0.44 per cent of the total city emissions
Corporation Energy Consumption
A town in the hill country of Sri Lanka, Matale is signifi cant in terms of history and village living. It is home to the historic Srigiriya Rock Castle, Aluwihare Temple and Dambulla Cave Temple and the Knuckles Mountain Range and has a vast agricultural area under its bounds, where tea, rubber, vegetable and spice cultivation dominates.
City Carbon Emissions 2007-08
City Profi le
Community Energy Consumption
Population Area0.03 Million (2001) NA
Corporation Carbon Emissions 2007-08
Mr Himly MohamadMayor
KU
RU
NEG
ALA
KurunegalaSRI LANKAMr J A B C JayakodyMunicipal CommissionerTel: +94 37 2222275
Population Area0.02 Million (2001) 4,816 sq km
Sector Energy/Fuel Quantity
Residential
Electricity (Million kWh) 376
LPG (KG) 891.67
Kerosene (kL) 7,468.75
IndustrialDiesel (kL) 9,896.51
Kerosene (kL) 1,318.01
TransportationDiesel (kL) 39,586.04
Petrol (kL) 45,348.60
Waste MSW (tpd) 44
Sector Energy/Fuel QuantityBuilding and Facilities Electricity (Million kWh) 0.51
Street Lighting Electricity (Million kWh) 1.38
Water Supply Electricity (Million kWh) 1.78
Sewage System Electricity (Million kWh) NA
TransportationPetrol (kL) 82.19
Diesel (kL) NA
• Activities in Kurunegala contribute to 0.44 Million* TeCO2 annually
• Per capita emission for Kurunegala have been 9.63*T/Year in 2007-08
• The Corporation Level Emissions are about 0.36 per cent of the total city emissions
Kurunegala is the capital of the Wayamba province in Sri Lanka. Considered as a transport hub, its rail-road systems link some of the important parts of the country with each other. Ethagala or the Elephant Rock, is a major topographical attraction, reaching 316 metres above the town at an altitude of 116 metres above the sea level.
Corporation Energy Consumption
City Profi le
Community Energy Consumption
City Carbon Emissions 2007-08 Corporation Carbon Emissions 2007-08
Mr Nimal Chandrasiri de SilvaMayor
*Kurunegala is a major transport hub of Sri Lanka
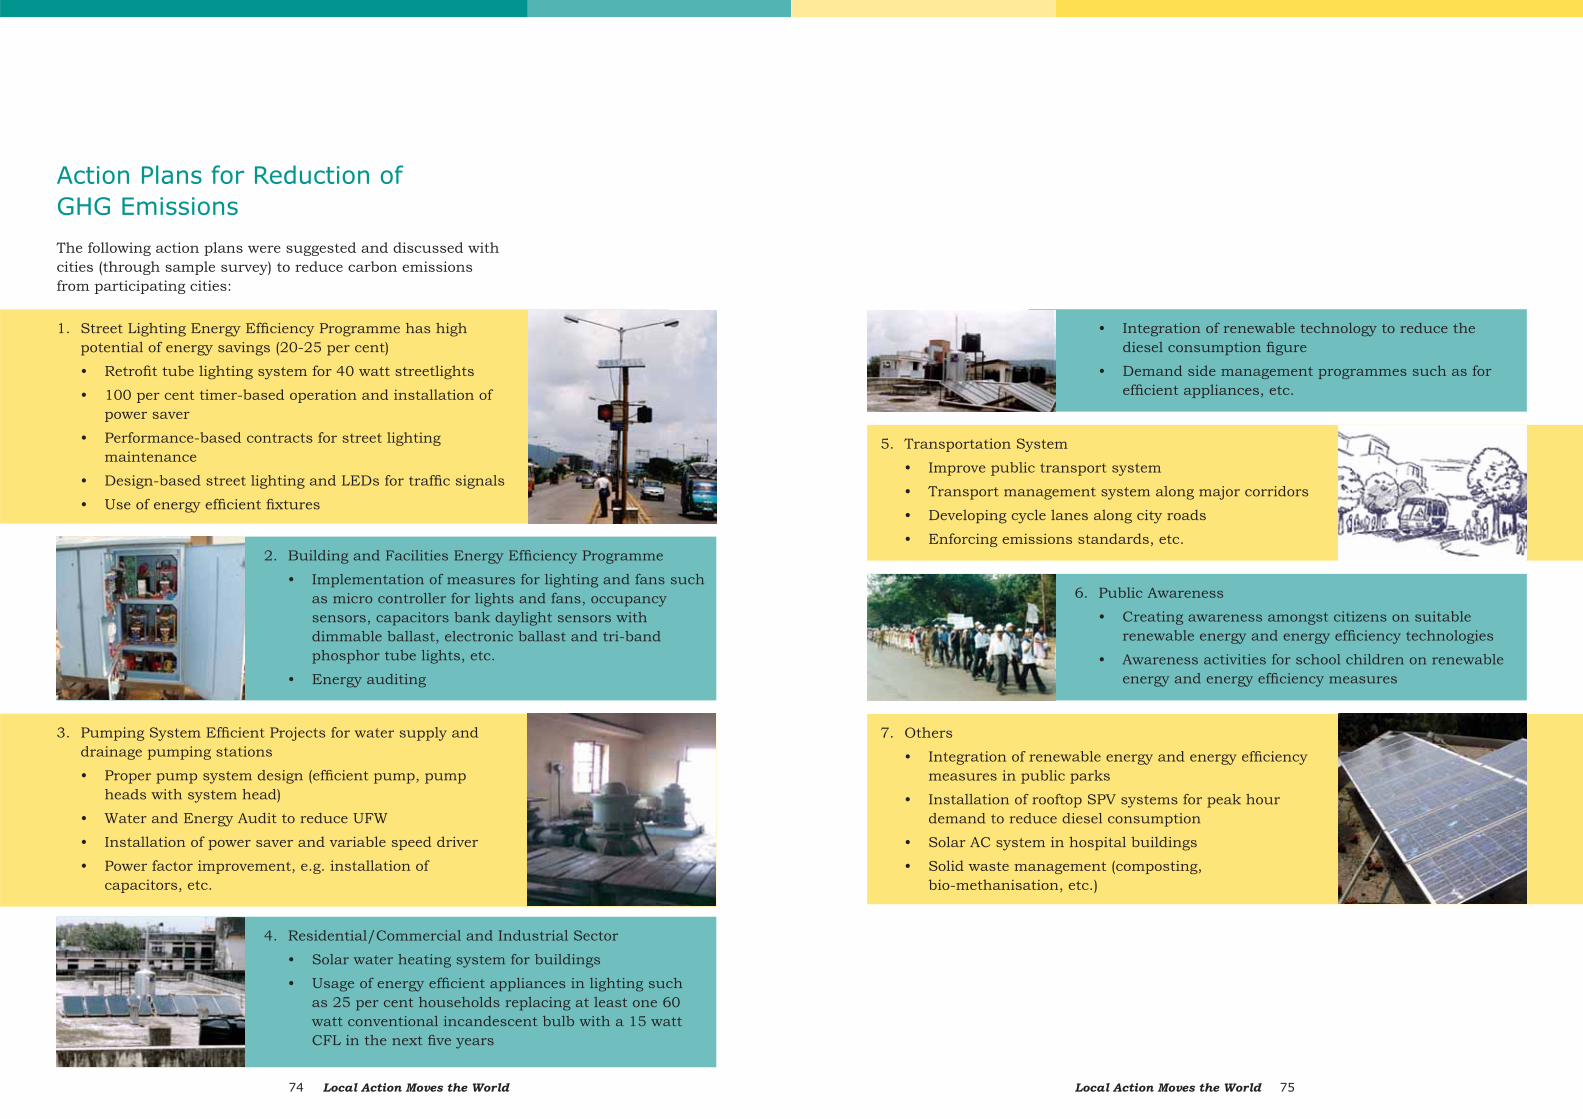
Local Action Moves the World74 Local Action Moves the World 75
• Integration of renewable technology to reduce the diesel consumption fi gure
• Demand side management programmes such as for effi cient appliances, etc.
5. Transportation System • Improve public transport system • Transport management system along major corridors • Developing cycle lanes along city roads • Enforcing emissions standards, etc.
6. Public Awareness • Creating awareness amongst citizens on suitable
renewable energy and energy effi ciency technologies • Awareness activities for school children on renewable
energy and energy effi ciency measures
7. Others • Integration of renewable energy and energy effi ciency
measures in public parks • Installation of rooftop SPV systems for peak hour
demand to reduce diesel consumption • Solar AC system in hospital buildings • Solid waste management (composting,
bio-methanisation, etc.)
Action Plans for Reduction of GHG Emissions
The following action plans were suggested and discussed with cities (through sample survey) to reduce carbon emissions from participating cities:
1. Street Lighting Energy Effi ciency Programme has high potential of energy savings (20-25 per cent)
• Retrofi t tube lighting system for 40 watt streetlights • 100 per cent timer-based operation and installation of
power saver • Performance-based contracts for street lighting
maintenance • Design-based street lighting and LEDs for traffi c signals • Use of energy effi cient fi xtures
2. Building and Facilities Energy Effi ciency Programme • Implementation of measures for lighting and fans such
as micro controller for lights and fans, occupancy sensors, capacitors bank daylight sensors with dimmable ballast, electronic ballast and tri-band phosphor tube lights, etc.
• Energy auditing
3. Pumping System Effi cient Projects for water supply and drainage pumping stations
• Proper pump system design (effi cient pump, pump heads with system head)
• Water and Energy Audit to reduce UFW • Installation of power saver and variable speed driver • Power factor improvement, e.g. installation of
capacitors, etc.
4. Residential/Commercial and Industrial Sector • Solar water heating system for buildings • Usage of energy effi cient appliances in lighting such
as 25 per cent households replacing at least one 60 watt conventional incandescent bulb with a 15 watt CFL in the next fi ve years
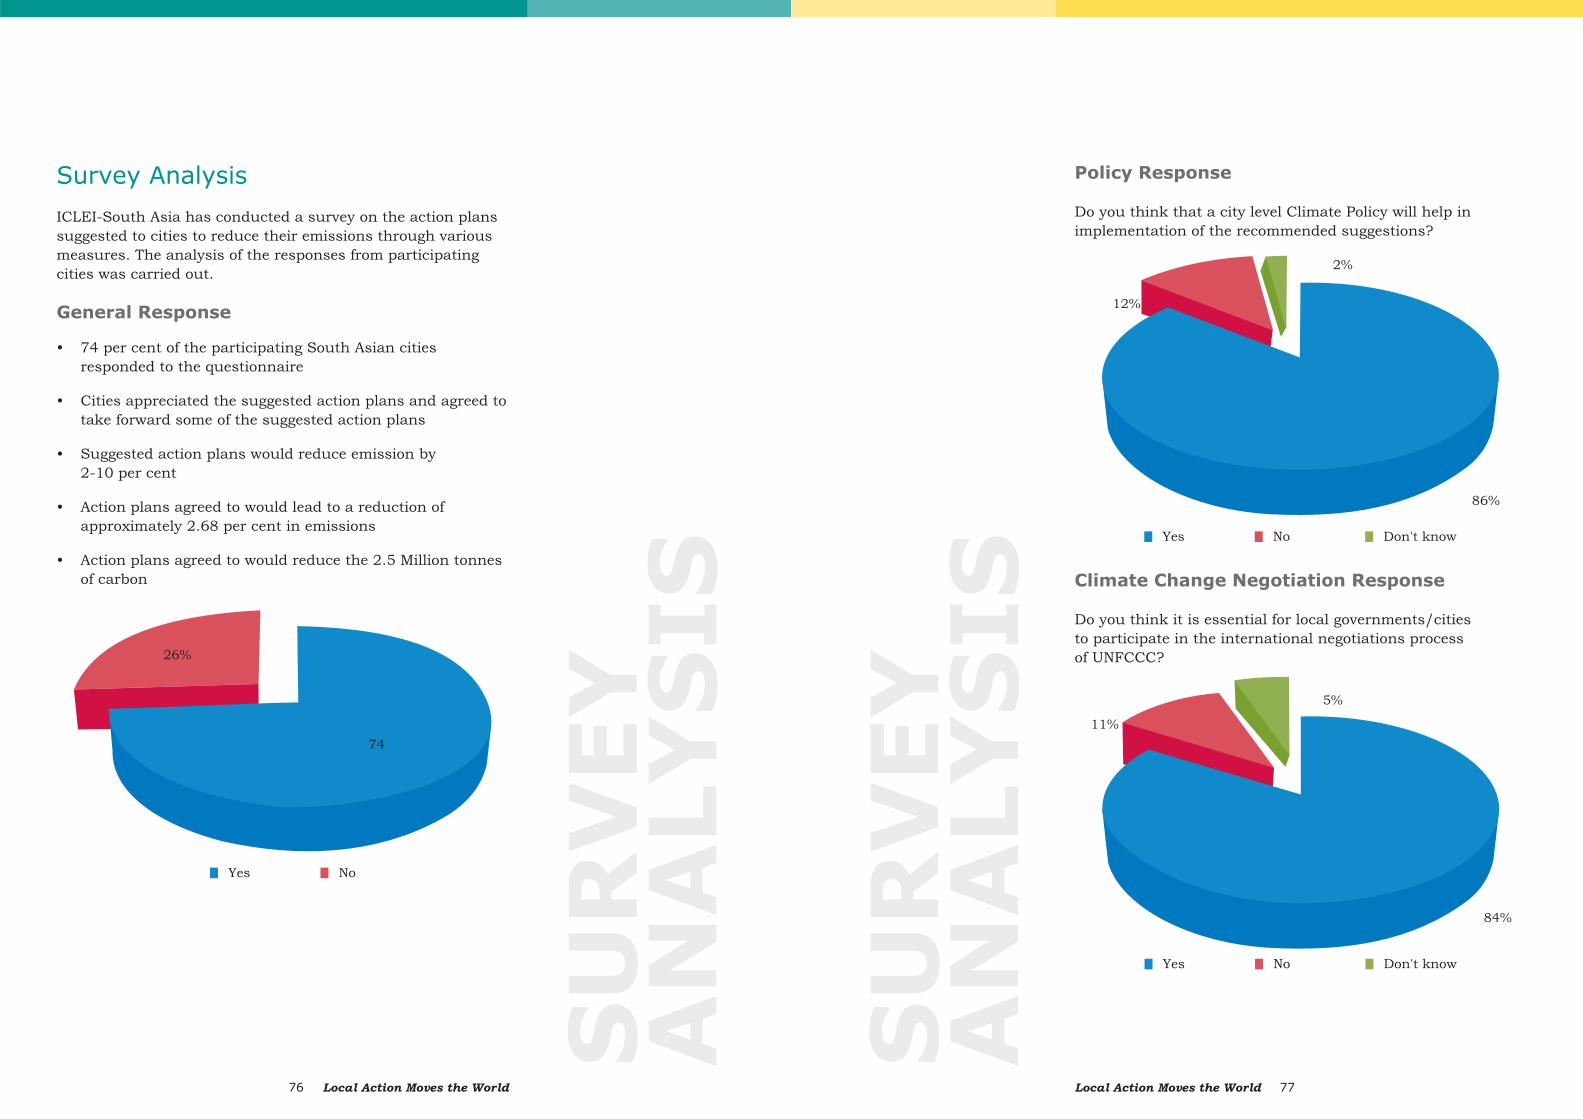
Local Action Moves the World76 Local Action Moves the World 77
Policy Response
Do you think that a city level Climate Policy will help in implementation of the recommended suggestions?
Climate Change Negotiation Response
Do you think it is essential for local governments/citiesto participate in the international negotiations process of UNFCCC?
Survey Analysis
ICLEI-South Asia has conducted a survey on the action plans suggested to cities to reduce their emissions through various measures. The analysis of the responses from participating cities was carried out.
General Response
• 74 per cent of the participating South Asian cities responded to the questionnaire
• Cities appreciated the suggested action plans and agreed to take forward some of the suggested action plans
• Suggested action plans would reduce emission by 2-10 per cent
• Action plans agreed to would lead to a reduction of approximately 2.68 per cent in emissions
• Action plans agreed to would reduce the 2.5 Million tonnes of carbon
SU
RV
EY
A
NA
LY
SIS
SU
RV
EY
A
NA
LY
SIS
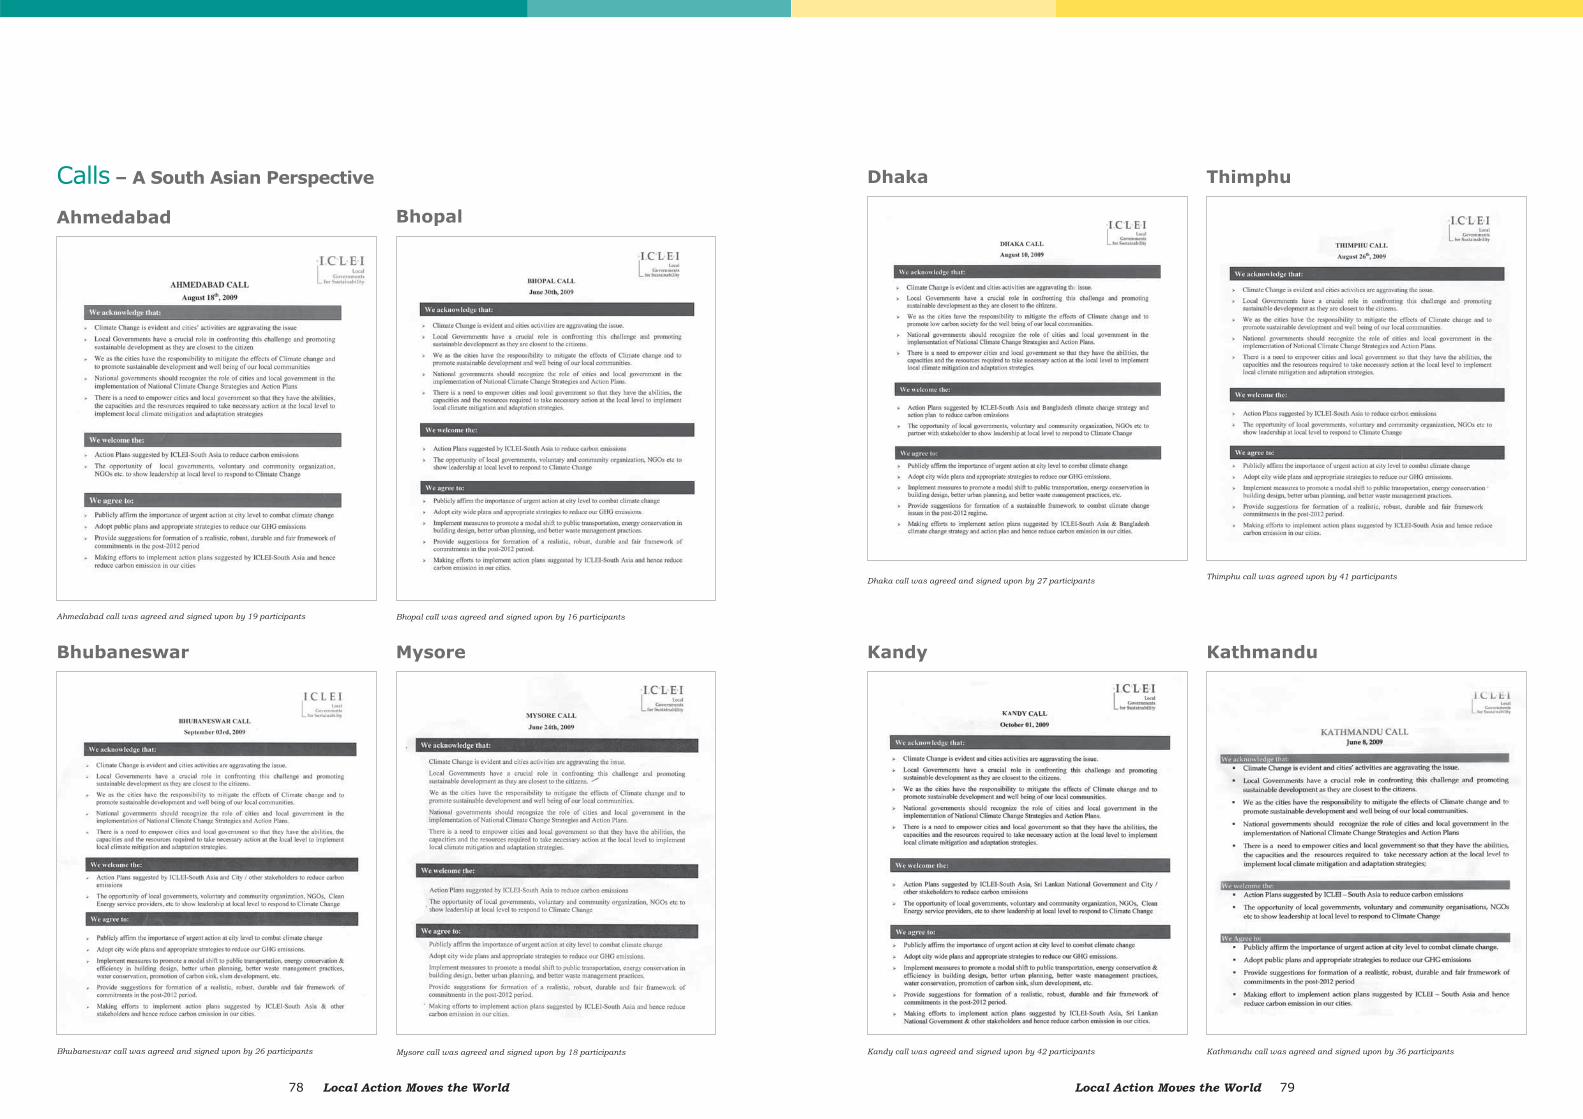
Local Action Moves the World78 Local Action Moves the World 79
Bhubaneswar
Bhubaneswar call was agreed and signed upon by 26 participants
Dhaka
Dhaka call was agreed and signed upon by 27 participants
Calls – A South Asian Perspective
Ahmedabad
Ahmedabad call was agreed and signed upon by 19 participants
Bhopal
Bhopal call was agreed and signed upon by 16 participants
Kathmandu
Kathmandu call was agreed and signed upon by 36 participants
Kandy
Kandy call was agreed and signed upon by 42 participants
Mysore
Mysore call was agreed and signed upon by 18 participants
Thimphu
Thimphu call was agreed upon by 41 participants
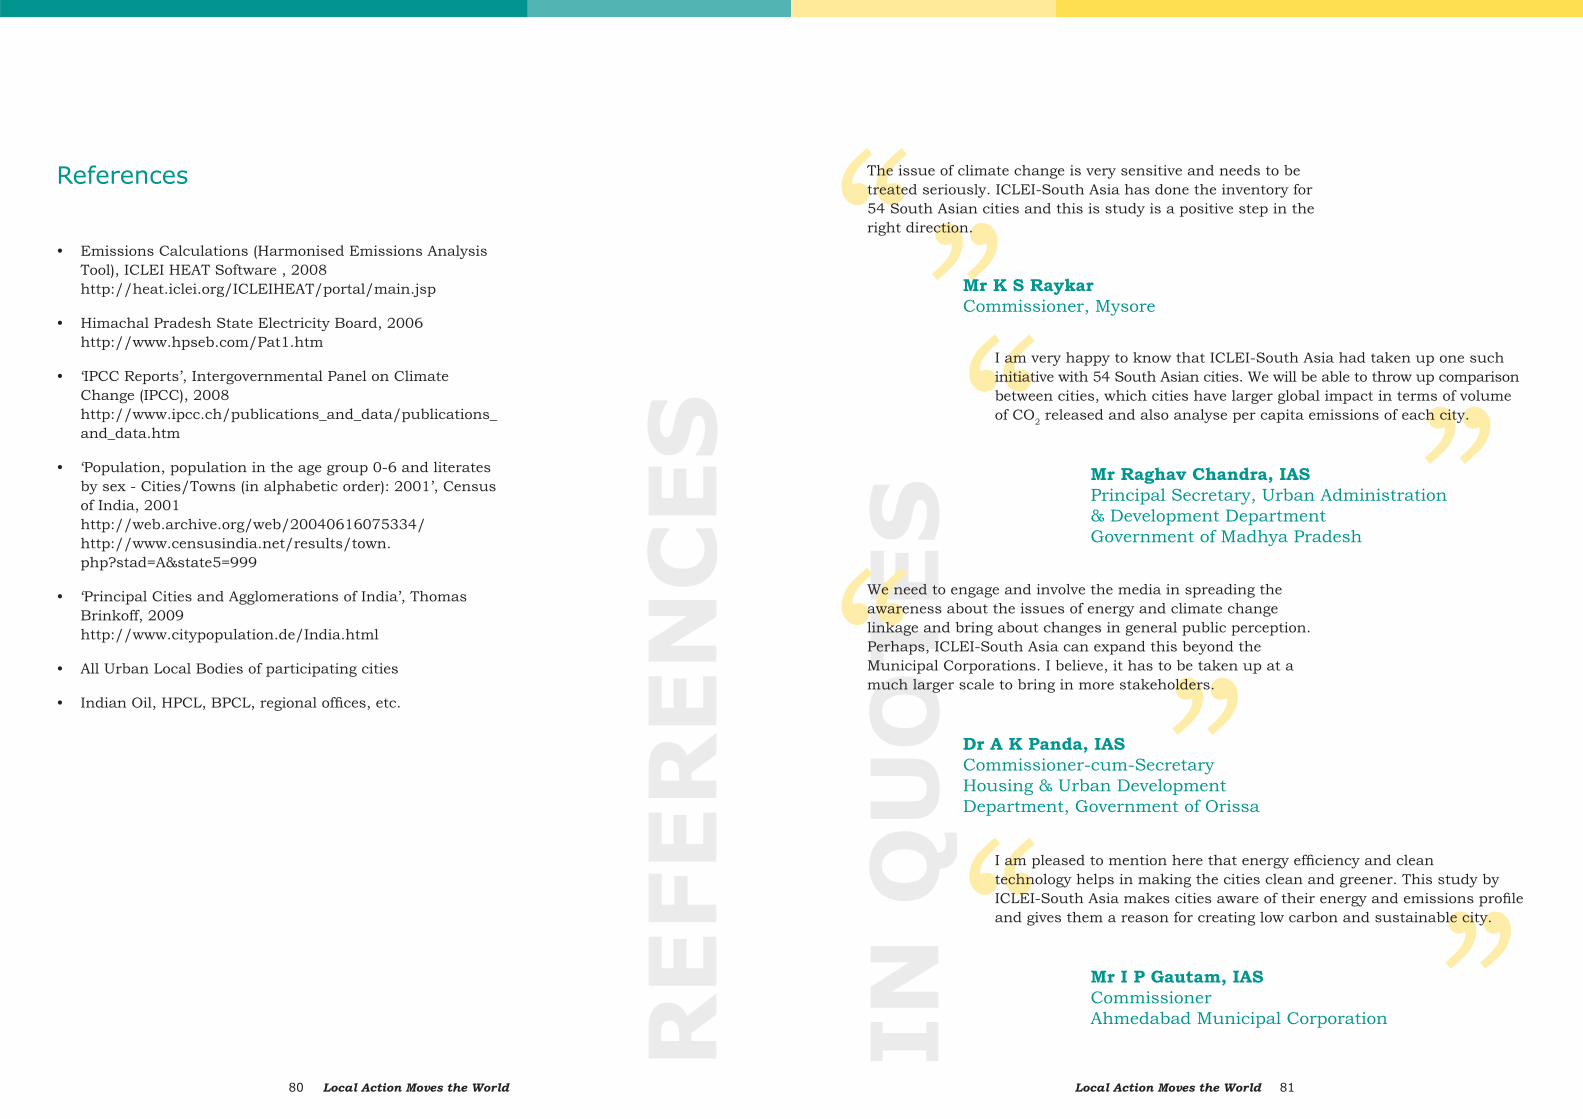
Local Action Moves the World80 Local Action Moves the World 81
References
• Emissions Calculations (Harmonised Emissions Analysis Tool), ICLEI HEAT Software , 2008http://heat.iclei.org/ICLEIHEAT/portal/main.jsp
• Himachal Pradesh State Electricity Board, 2006http://www.hpseb.com/Pat1.htm
• ‘IPCC Reports’, Intergovernmental Panel on Climate Change (IPCC), 2008http://www.ipcc.ch/publications_and_data/publications_and_data.htm
• ‘Population, population in the age group 0-6 and literates by sex - Cities/Towns (in alphabetic order): 2001’, Census of India, 2001http://web.archive.org/web/20040616075334/http://www.censusindia.net/results/town.php?stad=A&state5=999
• ‘Principal Cities and Agglomerations of India’, Thomas Brinkoff, 2009http://www.citypopulation.de/India.html
• All Urban Local Bodies of participating cities
• Indian Oil, HPCL, BPCL, regional offi ces, etc.R
EFER
EN
CES
IN Q
UO
TES
The issue of climate change is very sensitive and needs to be treated seriously. ICLEI-South Asia has done the inventory for 54 South Asian cities and this is study is a positive step in the right direction.
Mr K S Raykar Commissioner, Mysore
I am very happy to know that ICLEI-South Asia had taken up one suchinitiative with 54 South Asian cities. We will be able to throw up comparison between cities, which cities have larger global impact in terms of volume of CO2 released and also analyse per capita emissions of each city.
Mr Raghav Chandra, IAS Principal Secretary, Urban Administration & Development Department Government of Madhya Pradesh
We need to engage and involve the media in spreading the awareness about the issues of energy and climate change linkage and bring about changes in general public perception. Perhaps, ICLEI-South Asia can expand this beyond the Municipal Corporations. I believe, it has to be taken up at a much larger scale to bring in more stakeholders.
Dr A K Panda, IAS Commissioner-cum-Secretary Housing & Urban Development Department, Government of Orissa
I am pleased to mention here that energy effi ciency and clean technology helps in making the cities clean and greener. This study by ICLEI-South Asia makes cities aware of their energy and emissions profi le and gives them a reason for creating low carbon and sustainable city.
Mr I P Gautam, IAS Commissioner Ahmedabad Municipal Corporation
Local Action Moves the World82
Disclaimer
The information contained herein has been obtained from sources believed to be reliable. The information contained in sections of the report refl ects data that was derived from both public and confi dential information collected during the conduct of the study by ICLEI-South Asia and supported by the British High Commission.
The fi ndings and views in this report do not represent those of ICLEI-South Asia and British High Commission or the UK Government and are solely the opinion of those who participated in the survey. Readers should note that ICLEI-South Asia verifi ed data and assumptions used in these analyses in part. ICLEI-South Asia and the British High Commission shall have no liability for errors, omissions or inadequacies in the information contained herein or for interpretations thereof.
The material in this publication is copyrighted. No part of this report can be reproduced either on paper or electronic media without permission in writing from ICLEI-South Asia. Request for permission to reproduce any part of the report may be sent to ICLEI-South Asia.
DIS
CLA
IMER
Related Documents


