Proceedings of the 15th IBPSA Conference San Francisco, CA, USA, Aug. 7-9, 2017 1131 https://doi.org/10.26868/25222708.2017.294 Energy Analysis of Phase Change Wall Integrated with Night Ventilation in Western China Yan Liu a, b , Jiang Liu a , Liu Yang a, b , Liqiang Hou a , Yuhao Qiao a , Mengyuan Wang a a School of Architecture, Xi’an University of Architecture and Technology, Xi’an, Shaanxi 710055, P.R. China b State Key Laboratory of Green Building in West China, Xi’an, Shaanxi 710055, P.R. China Corresponding author: Tel & Fax: +86-82205390, E-mail address: [email protected] (L. Yang) Abstract Recently, research on energy saving in buildings attracts more and more attention. In present work, the effect of phase change material wall (PCW) and night ventilation (NV) on energy saving of a typical office building in five key cities (Lhasa, Xi’an, Kunming, Chengdu and Urumchi) in Western China, is investigated using EnergyPlus 8.6. The influences of different climate conditions, phase change temperature, NV rates on mean indoor temperature are carefully studied. Suitability and energy saving potential of PCW integrated with NV are also analysed. The results contribute towards a more comprehensive evaluation and understanding of interaction effects between PCW and NV. Introduction The report from Building Energy Conservation Research Center of Tsinghua University showed that, energy consumption of buildings would account for more than 35 % of total primary energy use in China in 2020 (Building Energy Conservation Research Center of Tsinghua University (2013)). In order to reduce the energy consumption of the buildings sector while the human comfort remains unchanged, different design strategies of energy saving are proposed, mainly containing active design strategy and passive design strategy. Considered from energy conservation and economic efficiency, passive buildings show larger advantages than active buildings. Integration application of NV and thermal mass in buildings could effectively reduce cooling and heating load, and further building energy consumption (Wang et al. (2014), Shaviv et al. (2001) and Ramponi et al. (2014)). According to Yang and Li (2008), thermal mass is mainly the thermal materials in buildings, which absorbs heat, stores heat, and then releases heat. Thermal mass in buildings generally includes building envelopes, internal walls, furniture and additional thermal mass (Sadineni wt al. (2011)). Heat storage capacity of thermal mass play an important role to determine the thermal performance of buildings (Li et al. (2013)). Rencently, to understand passive design strategy and climatic stuitability of NV, several related studies have been lauched and some useful conclusions have been drawn. Givoni (1998) found that, for buildings with light envelope, the effect of NV on maximum indoor temperature was quite limited. On the contrary, for buildings with heavy envelope, it was quite effective in reducing the maximum indoor temperature. Santamouris et al. (2010) concluded that, under the specific conditions, the potential contribution of NV increased with the increase of cooling demand of the buildings. Lam et al. (2006) studied energy saving potentials of passive strategies such as NV with thermal mass in China. Based on these analyses, passive design zones were divided based on different climates. Liu et al. (2017) proposed a porous building model to investigate unsteady flow and heat transfer around and through an isolated high-rise building based on NV and thermal mass. Recently, Yang (2010) investigated climatic suitability of NV design strategy and obtained climatic cooling potential (CCP) distributions of NV in northern China (see Figure 1). Figure 1 dipicts that, most parts of northern China are quite suitable to perform NV, due to most values of CCP are larger than 10. The previous investigations show that, passive design zones (including NV and thermal mass) have been divided and the influences of NV on indoor temperature have been obtained. However, functional supplement of PCM and NV has not caused enough attentions in passive design in China. Figure 1: Climatic cooling potential distributions of NV in northern China. Meanwhile, energy saving performance of PCM-based envelope, combination mode of building envelope and PCM are also investigated (Kuznik et al. (2011)). Lin et al. (2004) applied a kind of under floor electric heating system with PCM plates to charge heat by using cheap nighttime electricity and discharge the heat stored at daytime. Jin et al. (2016) optimized the location of a thin PCM layer in the frame wall. They found that, the optimal PCM location was closer to the interior surface of the wall with the increase of the interior surface temperature of the wall. Mi et al. (2016) conducted energy savings simulation and economic analysis of building integrated with PCM in different cities of China. Energy saving potential and PCM investment of different cities were compared. Roman et al. (2016) employed thermal energy simulation to determine the effectiveness of PCM roof

Welcome message from author
This document is posted to help you gain knowledge. Please leave a comment to let me know what you think about it! Share it to your friends and learn new things together.
Transcript

Proceedings of the 15th IBPSA ConferenceSan Francisco, CA, USA, Aug. 7-9, 2017
1131https://doi.org/10.26868/25222708.2017.294
Energy Analysis of Phase Change Wall Integrated with Night Ventilation
in Western China
Yan Liua, b, Jiang Liua, Liu Yanga, b, Liqiang Houa, Yuhao Qiaoa, Mengyuan Wanga
a School of Architecture, Xi’an University of Architecture and Technology, Xi’an, Shaanxi 710055, P.R. China b State Key Laboratory of Green Building in West China, Xi’an, Shaanxi 710055, P.R. China
Corresponding author: Tel & Fax: +86-82205390, E-mail address: [email protected] (L. Yang)
Abstract
Recently, research on energy saving in buildings attracts
more and more attention. In present work, the effect of
phase change material wall (PCW) and night ventilation
(NV) on energy saving of a typical office building in five
key cities (Lhasa, Xi’an, Kunming, Chengdu and
Urumchi) in Western China, is investigated using
EnergyPlus 8.6. The influences of different climate
conditions, phase change temperature, NV rates on mean
indoor temperature are carefully studied. Suitability and
energy saving potential of PCW integrated with NV are
also analysed. The results contribute towards a more
comprehensive evaluation and understanding of
interaction effects between PCW and NV.
Introduction
The report from Building Energy Conservation Research
Center of Tsinghua University showed that, energy
consumption of buildings would account for more than
35 % of total primary energy use in China in 2020
(Building Energy Conservation Research Center of
Tsinghua University (2013)). In order to reduce the
energy consumption of the buildings sector while the
human comfort remains unchanged, different design
strategies of energy saving are proposed, mainly
containing active design strategy and passive design
strategy. Considered from energy conservation and
economic efficiency, passive buildings show larger
advantages than active buildings. Integration application
of NV and thermal mass in buildings could effectively
reduce cooling and heating load, and further building
energy consumption (Wang et al. (2014), Shaviv et al.
(2001) and Ramponi et al. (2014)). According to Yang
and Li (2008), thermal mass is mainly the thermal
materials in buildings, which absorbs heat, stores heat,
and then releases heat. Thermal mass in buildings
generally includes building envelopes, internal walls,
furniture and additional thermal mass (Sadineni wt al.
(2011)). Heat storage capacity of thermal mass play an
important role to determine the thermal performance of
buildings (Li et al. (2013)).
Rencently, to understand passive design strategy and
climatic stuitability of NV, several related studies have
been lauched and some useful conclusions have been
drawn. Givoni (1998) found that, for buildings with light
envelope, the effect of NV on maximum indoor
temperature was quite limited. On the contrary, for
buildings with heavy envelope, it was quite effective in
reducing the maximum indoor temperature. Santamouris
et al. (2010) concluded that, under the specific conditions,
the potential contribution of NV increased with the
increase of cooling demand of the buildings. Lam et al.
(2006) studied energy saving potentials of passive
strategies such as NV with thermal mass in China. Based
on these analyses, passive design zones were divided
based on different climates. Liu et al. (2017) proposed a
porous building model to investigate unsteady flow and
heat transfer around and through an isolated high-rise
building based on NV and thermal mass. Recently, Yang
(2010) investigated climatic suitability of NV design
strategy and obtained climatic cooling potential (CCP)
distributions of NV in northern China (see Figure 1).
Figure 1 dipicts that, most parts of northern China are
quite suitable to perform NV, due to most values of CCP
are larger than 10. The previous investigations show that,
passive design zones (including NV and thermal mass)
have been divided and the influences of NV on indoor
temperature have been obtained. However, functional
supplement of PCM and NV has not caused enough
attentions in passive design in China.
Figure 1: Climatic cooling potential distributions of NV
in northern China.
Meanwhile, energy saving performance of PCM-based
envelope, combination mode of building envelope and
PCM are also investigated (Kuznik et al. (2011)). Lin et
al. (2004) applied a kind of under floor electric heating
system with PCM plates to charge heat by using cheap
nighttime electricity and discharge the heat stored at
daytime. Jin et al. (2016) optimized the location of a thin
PCM layer in the frame wall. They found that, the optimal
PCM location was closer to the interior surface of the wall
with the increase of the interior surface temperature of the
wall. Mi et al. (2016) conducted energy savings
simulation and economic analysis of building integrated
with PCM in different cities of China. Energy saving
potential and PCM investment of different cities were
compared. Roman et al. (2016) employed thermal energy
simulation to determine the effectiveness of PCM roof

Proceedings of the 15th IBPSA ConferenceSan Francisco, CA, USA, Aug. 7-9, 2017
1132
technologies in mitigating urban heat island effects over
seven climatic zones across the United States of America.
Ascione et al. (2014) refurbished existing buildings by
means of addition of PCM plaster on the inner side of the
exterior envelope. The cooling energy savings were
calculated with reference to a well-insulated massive
building. Marin et al. (2016) obtained the potential of
using PCM-enhanced gypsum boards in lightweight
buildings, to increase the energy performance during both
heating and cooling seasons in arid and warm temperate
main climate areas. These studies show that, energy
saving calculation model of PCM based envelope has
been established and energy saving potential have been
obtained. However, thermal storage enhancement effect
of NV on PCM based envelope has not caused enough
attentions.
In naturally ventilated buildings, it has been well studied
and concluded that, the thermal mass could be employed
to reduce the air temperature fluctuation and maintain it
in a relatively small range (see Figure 2). To the authors’
knowledge, little research work reported in the opening
literature has made on the performance of PCW combined
with NV in different climate zones, especially in western
China with complex topography, scarce natural resources
and slow economic development. Therefore, the purpose
of the present work is to perform a simulation work of
PCW on the indoor air temperature under NV conditions
in summer. Different climate conditions of five typical
cities in western China are employed. Different phase
change temperature is also taken into consideration.
(a) Daytime
(b) Nighttime
Figure 2: Mechanism of PCW and NV.
Methodology
Building description
In present work, a typical four-story office building is
employed for simulation. The Sketchup model and
ground floor plan are illustrated in Figure 1. Each story of
the building has a height of 3.6 m and floor area of 504
m2 (31.9 m × 15.8 m). The window has an area of 3.3 m2
(1.5 m × 2.2 m) and the distance between the bottom of
the window and the floor is 0.9 m. The ratio of window to
wall area of the south wall and north wall is 0.25, which
is in the range recommended by the Civil building thermal
design code of China (Thermal design code for civil
building (1993)). In the present study, the PCMs are
arranged in the south wall of the building. The details of
the building envelopes follow the Design standard for
energy efficiency of public buildings (Design standard for
energy efficiency of public buildings (2015)).
(a) The Sketchup model of the building
(b) Ground floor plan
Figure 3: A typical four-story building.
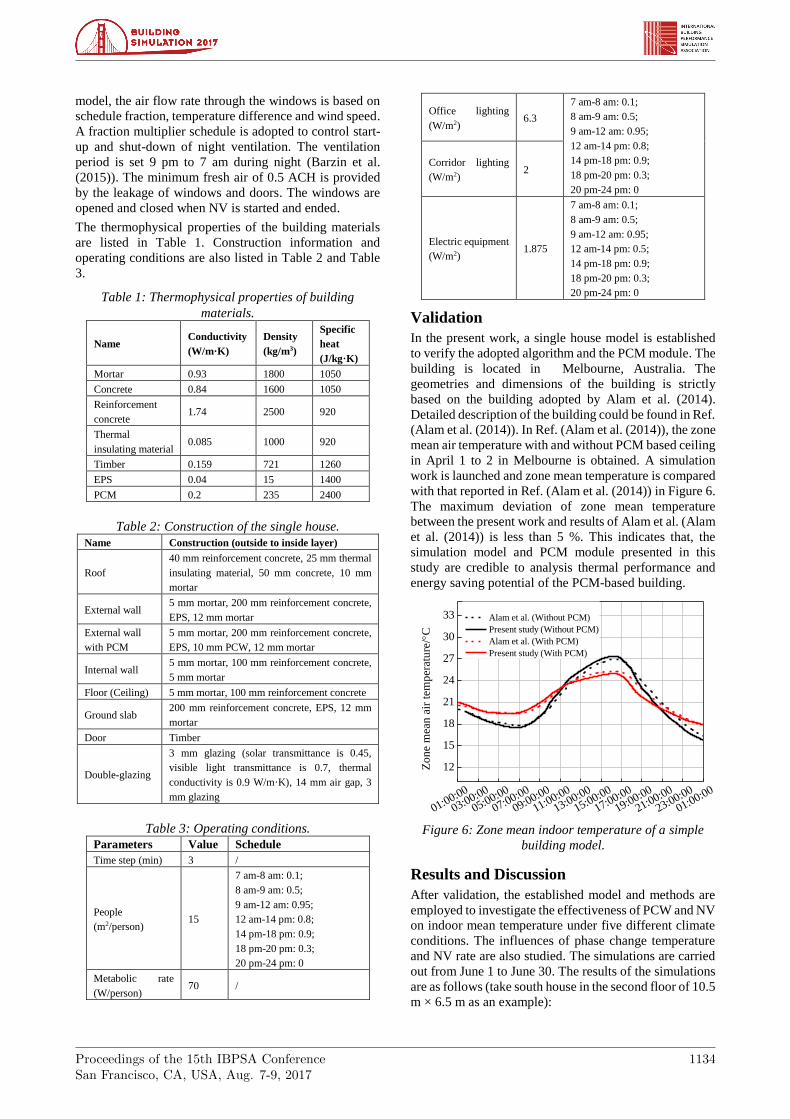
Climate in five typical cities
Locations and climate conditions of five typical cities in
western China is illustrated in Figure 4. Detailed
descriptions are as follows (Lam et al. (2006) and Yang et
al. (2003)):
Lhasa is the capital of the Tibet Autonomous Region in
China. It is in the cold climate zone with an annual mean
temperature of 8.3 ºC. It has a long winter with short,
rather cool, summer. Daily diurnal temperatures tend to
be large, around 12-18 ºC. Its maximum mean outdoor
temperature is 22.8 ºC and 22.2 ºC in June and July.
Xi’an is the capital of Shaanxi province. It is in the cold
climate zone but very close to the boundary of the hot
summer and cold winter climate region. It has distinct
Proceedings of the 15th IBPSA ConferenceSan Francisco, CA, USA, Aug. 7-9, 2017
1133
seasonal variations with hot summer and cold winter
characteristics. Its annual mean temperature and neutral
temperature are 13.3 ºC and 23.7 ºC, respectively. It is hot
and humid, especially in July and August.
Chengdu is the capital of Sichuan province. It is located
in hot summer and cold winter zone with an annual mean
temperature and neutral temperature of 16.2 ºC and 24.7
ºC, respectively. January is the coldest month of the whole
year with mean temperature ranging from 2.4 ºC to 9.5 ºC
while July is the hottest month of the whole year with
mean temperature ranging from 22.0 ºC to 29.6 ºC.
Kunming is the capital of Yunnan province. It is known
as spring city, bears a subtropical plateau monsoon
climate. The weather is relatively moderate with no chilly
winter and hot summer. The annual mean temperature and
neutral temperature are 14.6 ºC and 22.1 ºC, respectively.
The temperature in the coldest month (January) range
from 2.2 ºC to 15.3 ºC in January while in the hottest
month (July), the temperature range from 16.9 ºC to 23.9
ºC. Kunming has a large temperature difference between
the day and night.
Urumchi is the capital of the Xinjiang Uygur Autonomous
Region in China. It is located in a severe cold zone and
has an annual mean temperature and neutral temperature
of 7.1 ºC and 21.8 ºC, respectively. January is the coldest
month of the whole year with mean temperature ranging
from -17.9 ºC to -8.4 ºC while July is the hottest month of
the whole year with mean temperature ranging from 19.1
ºC to 31.2 ºC.
Figure 4: Locations and climate conditions of five
typical cities.
Simulation details
In the present work, building energy simulation program
EnergyPlus 8.6 is employed to conduct energy saving
analysis. In EnergyPlus, finite difference method (FDM)
is adopted for numerical formulation. Heat capacity
method is adopted for latent heat evolution (AL-Saadi and
Zhai (2013)). The simulations are performed in five
typical cities in western China (Lhasa, Xi’an, LanZhou,
Chengdu, KunMing and Urumchi) to find the effects of
different climates on the energy consumption of the
building with PCW and NV. The climate data for each
city is based on the standard IWEC weather files
(http://apps1.eere.energy.gov/buildings/energyplus/cfm/
weather_data3.cfm (2016)). The conduction finite
difference algorithm (ConFD) incorporated in
EnergyPlus is employed to simulate the thermal
performance of PCW. GroundHeatTransfer:Slab module
of the EnergyPlus is employed to model the heat transfer
between the floor and the ground (EnergyPlus (2016)).
According to Tabares-Valesco et al. (2012), time step of
the simulation is set to 3 min. Due to accurate hourly
performance is required, the node space is set to 0.1 (the
default value in EnergyPlus is 3). In order to evaluate the
energy saving resulting from the application of PCW, two
simulations (with and without PCW) in each city are
performed. Three BioPCMs with different phase change
temperature are adopted, which are PCM 23 (21-25 ºC),
PCM 25 (23-27 ºC) and PCM 27 (25-29 ºC). The latent
heat of the BioPCMs is 219 kJ/kg. Enthalpy-temperature
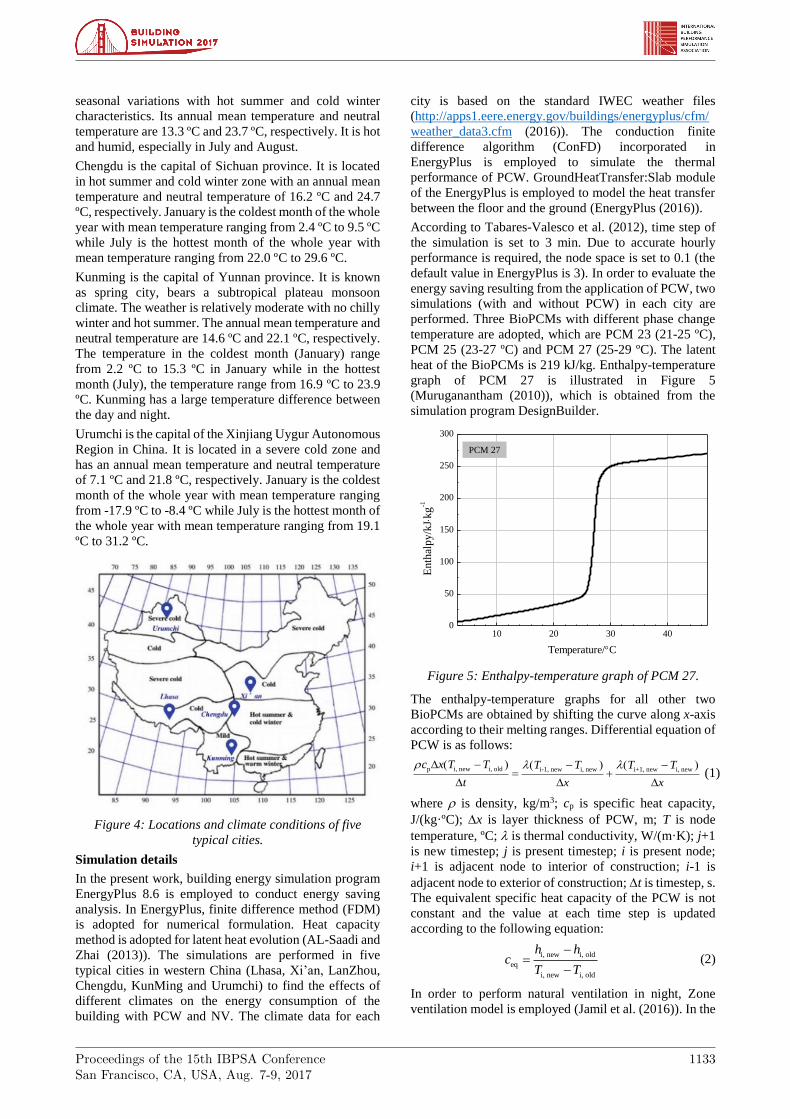
graph of PCM 27 is illustrated in Figure 5
(Muruganantham (2010)), which is obtained from the
simulation program DesignBuilder.
10 20 30 400
50
100
150
200
250
300E
nth
alp
y/k
Jk
g-1
Temperature/C
PCM 27
Figure 5: Enthalpy-temperature graph of PCM 27.
The enthalpy-temperature graphs for all other two
BioPCMs are obtained by shifting the curve along x-axis
according to their melting ranges. Differential equation of
PCW is as follows:
p i, new i, old i-1, new i, new i+1, new i, newc x T T T T T T
t x x
(1)
where is density, kg/m3; cp is specific heat capacity,
J/(kg·ºC); x is layer thickness of PCW, m; T is node
temperature, ºC; is thermal conductivity, W/(m·K); j+1
is new timestep; j is present timestep; i is present node;
i+1 is adjacent node to interior of construction; i-1 is
adjacent node to exterior of construction; t is timestep, s.
The equivalent specific heat capacity of the PCW is not
constant and the value at each time step is updated
according to the following equation:
i, new i, old
eq
i, new i, old
h hc
T T
(2)
In order to perform natural ventilation in night, Zone
ventilation model is employed (Jamil et al. (2016)). In the
Proceedings of the 15th IBPSA ConferenceSan Francisco, CA, USA, Aug. 7-9, 2017
1134
model, the air flow rate through the windows is based on
schedule fraction, temperature difference and wind speed.
A fraction multiplier schedule is adopted to control start-
up and shut-down of night ventilation. The ventilation
period is set 9 pm to 7 am during night (Barzin et al.
(2015)). The minimum fresh air of 0.5 ACH is provided
by the leakage of windows and doors. The windows are
opened and closed when NV is started and ended.
The thermophysical properties of the building materials
are listed in Table 1. Construction information and
operating conditions are also listed in Table 2 and Table
3.
Table 1: Thermophysical properties of building
materials.
Name Conductivity
(W/m·K)
Density
(kg/m3)
Specific
heat
(J/kg·K)
Mortar 0.93 1800 1050
Concrete 0.84 1600 1050
Reinforcement
concrete 1.74 2500 920
Thermal
insulating material 0.085 1000 920
Timber 0.159 721 1260
EPS 0.04 15 1400
PCM 0.2 235 2400
Table 2: Construction of the single house.
Name Construction (outside to inside layer)
Roof
40 mm reinforcement concrete, 25 mm thermal
insulating material, 50 mm concrete, 10 mm
mortar
External wall 5 mm mortar, 200 mm reinforcement concrete,
EPS, 12 mm mortar
External wall
with PCM
5 mm mortar, 200 mm reinforcement concrete,
EPS, 10 mm PCW, 12 mm mortar
Internal wall 5 mm mortar, 100 mm reinforcement concrete,
5 mm mortar
Floor (Ceiling) 5 mm mortar, 100 mm reinforcement concrete
Ground slab 200 mm reinforcement concrete, EPS, 12 mm
mortar
Door Timber
Double-glazing
3 mm glazing (solar transmittance is 0.45,
visible light transmittance is 0.7, thermal
conductivity is 0.9 W/m·K), 14 mm air gap, 3
mm glazing
Table 3: Operating conditions.
Parameters Value Schedule
Time step (min) 3 /
People
(m2/person) 15
7 am-8 am: 0.1;
8 am-9 am: 0.5;
9 am-12 am: 0.95;
12 am-14 pm: 0.8;
14 pm-18 pm: 0.9;
18 pm-20 pm: 0.3;
20 pm-24 pm: 0
Metabolic rate
(W/person) 70 /
Office lighting
(W/m2) 6.3
7 am-8 am: 0.1;
8 am-9 am: 0.5;
9 am-12 am: 0.95;
12 am-14 pm: 0.8;
14 pm-18 pm: 0.9;
18 pm-20 pm: 0.3;
20 pm-24 pm: 0
Corridor lighting
(W/m2) 2
Electric equipment
(W/m2) 1.875
7 am-8 am: 0.1;
8 am-9 am: 0.5;
9 am-12 am: 0.95;
12 am-14 pm: 0.5;
14 pm-18 pm: 0.9;
18 pm-20 pm: 0.3;
20 pm-24 pm: 0
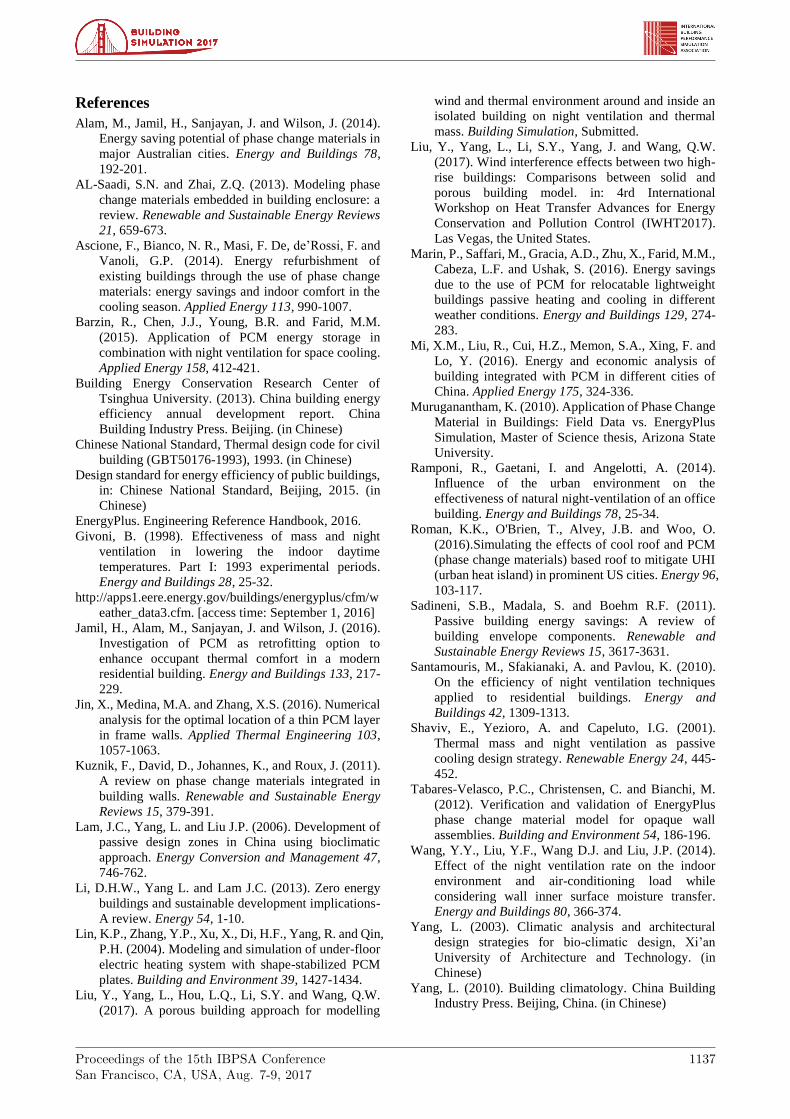
Validation
In the present work, a single house model is established
to verify the adopted algorithm and the PCM module. The
building is located in Melbourne, Australia. The
geometries and dimensions of the building is strictly
based on the building adopted by Alam et al. (2014).
Detailed description of the building could be found in Ref.
(Alam et al. (2014)). In Ref. (Alam et al. (2014)), the zone
mean air temperature with and without PCM based ceiling
in April 1 to 2 in Melbourne is obtained. A simulation
work is launched and zone mean temperature is compared
with that reported in Ref. (Alam et al. (2014)) in Figure 6.
The maximum deviation of zone mean temperature
between the present work and results of Alam et al. (Alam
et al. (2014)) is less than 5 %. This indicates that, the
simulation model and PCM module presented in this
study are credible to analysis thermal performance and
energy saving potential of the PCM-based building.
01:00:00
03:00:00
05:00:00
07:00:00
09:00:00
11:00:00
13:00:00
15:00:00
17:00:00
19:00:00
21:00:00
23:00:00
01:00:00
12
15
18
21
24
27
30
33
Zo
ne
mea
n a
ir t
emp
erat
ure
/C
Alam et al. (Without PCM)
Present study (Without PCM)
Alam et al. (With PCM)
Present study (With PCM)
Figure 6: Zone mean indoor temperature of a simple
building model.
Results and Discussion
After validation, the established model and methods are
employed to investigate the effectiveness of PCW and NV
on indoor mean temperature under five different climate
conditions. The influences of phase change temperature
and NV rate are also studied. The simulations are carried
out from June 1 to June 30. The results of the simulations
are as follows (take south house in the second floor of 10.5
m × 6.5 m as an example):

Proceedings of the 15th IBPSA ConferenceSan Francisco, CA, USA, Aug. 7-9, 2017
1135
The effect of climate conditions
In the first place, the effect of climate conditions on
indoor temperature is investigated. Under four design
conditions (without PCW and NV, with PCW, with NV
and with PCW and NV), indoor mean temperature is
obtained in five typical cities (see Figure 7). The night
ventilation is performed when the following two
conditions are satisfied: (1) The deviation between indoor
and outdoor temperature is more than 1 ºC; (2) The
outdoor temperature is in the range from 20 ºC to 26 ºC.
It could be concluded that, cooling potential in different
cities are different due to different climate conditions. In
Xi’an, Kunming, Urumchi and Chengdu, outdoor
temperature is in the range from 20 ºC to 26 ºC in most
time. Therefore, night ventilation is performed and an
obvious reduction of indoor temperature is depicted in
Figure 7 (a), (c), (d) and (e). It’s worth noting that in first
half in June, no obvious effects of night ventilation are
found due to local climate factors. In Lhasa, the difference
in zone mean temperature in four cases are quite small.
This is because the indoor temperature in Lhasa lies
outside of the range of phase change temperature of PCM
27. In Lhasa, the conditions of night ventilation are not
satisfied due to outdoor temperature is below 20 ºC. For
PCW, peak clipping effect is observed in only certain
days. In these days, the indoor zone mean temperature is
reduced compared with other three conditions. In the
remaining time, the cooling effect of PCW is limited. This
may be explained that in the present range of indoor
temperature, the functions of PCW don’t work well. It is
caused that the outdoor temperature does not drop enough
to solidify the PCW. Therefore, the PCW does not play
well its roles in maintaining the indoor temperature. In
future research, the phase change temperature,
arrangement, thickness of PCW could be further studied.
06/02 16:00:00
06/04 08:00:00
06/05 24:00:00
06/07 16:00:00
06/09 08:00:00
06/10 24:00:00
06/12 16:00:00
06/14 08:00:00
06/15 24:00:00
15
18
21
24
27
30
33
36
39 Xi'an, PCM 27
Zone
mea
n t
emper
ature
/C
Outdoor temperature
Without PCW and NV
With PCM
With NV
With PCM and NV
(a) Xi’an
06/02 16:00:00
06/04 08:00:00
06/05 24:00:00
06/07 16:00:00
06/09 08:00:00
06/10 24:00:00
06/12 16:00:00
06/14 08:00:00
06/15 24:00:00
0
3
6
9
12
15
18
21
24
27
30
Lhasa, PCM 27
Zone
mea
n t
emper
ature
/C
Outdoor temperature
Without PCW and NV
With PCM
With NV
With PCM and NV
(b) Lhasa
06/02 16:00:00
06/04 08:00:00
06/05 24:00:00
06/07 16:00:00
06/09 08:00:00
06/10 24:00:00
06/12 16:00:00
06/14 08:00:00
06/15 24:00:00
12
15
18
21
24
27
30
33
36 Kunming, PCM 27
Zone
mea
n t
emper
ature
/C
Outdoor temperature
Without PCW and NV
With PCM
With NV
With PCM and NV
(c) Kunming
06/02 16:00:00
06/04 08:00:00
06/05 24:00:00
06/07 16:00:00
06/09 08:00:00
06/10 24:00:00
06/12 16:00:00
06/14 08:00:00
06/15 24:00:00
15
18
21
24
27
30
33
36
39 Chengdu, PCM 27
Zo
ne
mea
n t
emp
erat
ure
/C
Outdoor temperature
Without PCW and NV
With PCM
With NV
With PCM and NV
(d) Chengdu

Proceedings of the 15th IBPSA ConferenceSan Francisco, CA, USA, Aug. 7-9, 2017
1136
06/02 16:00:00
06/04 08:00:00
06/05 24:00:00
06/07 16:00:00
06/09 08:00:00
06/10 24:00:00
06/12 16:00:00
06/14 08:00:00
06/15 24:00:00
9
12
15
18
21
24
27
30
33
36
39Urumchi, PCM 27
Zone
mea
n t
emper
ature
/C
Outdoor temperature
Without PCW and NV
With PCM
With NV
With PCM and NV
(e) Urumchi
Figure 7: Indoor mean temperature of southern room
in June.
The effect of phase change temperature
In this section, a simulation is carried out to examine the
influences of phase change temperature. Figure 8
demonstrates the indoor mean temperature at different
phase change temperature (take Xi’an as an example with
NV rate of 4 ACH). It can be concluded from daily data
that, the cooling effect of different PCM is significantly
influenced by weather conditions. For instance, the
cooling effect of PCM 25 is obviously better than PCM
23 and PCM 27 in June 12. However, in other three days
in Figure 8, the cooling effect of PCM 25 is equal to PCM
27. The results indicate that the daily cooling effect
analysis is insufficient to conclude which PCM is work
better. Our future research will focus on the cooling effect
in a relatively long period to reduce the influence of
random weather conditions.
06/10 24:00:00
06/11 15:00:00
06/12 06:00:00
06/12 21:00:00
06/13 12:00:00
06/14 03:00:00
06/14 18:00:00
06/15 09:00:00
21
22
23
24
25
26
27
28
29
30
Zone
mea
n t
emper
ature
/C
PCM 23
PCM 25
PCM 27
Figure 8: Indoor mean temperature at different phase
change temperature.
The effect of NV rates
The effect of NV rates on the indoor mean temperature is
numerically investigated. Figure 9 illustrates indoor mean
temperature at three different NV rates (take Xi’an with
PCM 27 as an example). With the increase of NV rates (4
ACH to 16 ACH), the zone mean temperature tend to
decrease. A maximum temperature reduction of 0.93 ºC is
obtained between 4 ACH and 16 ACH. It is also found
that, the downward trend is slowed when the NV rates
increase from 8 ACH to 16 ACH. In other words, 8 ACH
is recommended for the present building in Xi’an. The
further research could be conducted to obtain the cooling
effect over a relatively long period.
06/10 24:00:00
06/11 15:00:00
06/12 06:00:00
06/12 21:00:00
06/13 12:00:00
06/14 03:00:00
06/14 18:00:00
06/15 09:00:00
20
22
24
26
28
30
Zo
ne m
ean
tem
pera
ture
/C
4 ACH
8 ACH
16 ACH
Figure 9: Indoor mean temperature at different NV
rates.
Conclusions
1. In order to verify the EnergyPlus PCM model, a
single house model is established in the first place.
The maximum deviation of mean zone temperature
between the present work and results of Alam et al.
(2014) is less than 5 %. Therefore, the model and
methods in present work are reasonable and reliable
to deal with thermal analysis and energy saving
analysis with PCW.
2. The influences of three design conditions (PCW, NV
and PCW integrated with NV), PCMs with three
different phase change temperature and three NV
rates on indoor thermal environment are examined in
five typical cities in western China. Suitable phase
change temperature and NV rates are obtained in
Xi’an.
3. Further research is recommended to investigate the
quantitative cooling potential and energy saving
potential. The cost benefits analysis of PCW and NV
could also be conducted based on its economic cost
model.
Acknowledgement
This work was supported by China National Funds for
Distinguished Young Scientists (No. 51325803),
Foundation of State Key Laboratory of Green Building in
West China (No. LSKF201704) and Foundation of Key
Laboratory of Thermo-Fluid Science and Engineering,
Xi’an Jiaotong University (No. KLTFSE2016KF02). The
authors would like to thank Mr. Lei Zhang of Xi'an
University of Architecture and Technology for his
technical assistance.
Proceedings of the 15th IBPSA ConferenceSan Francisco, CA, USA, Aug. 7-9, 2017
1137
References
Alam, M., Jamil, H., Sanjayan, J. and Wilson, J. (2014).
Energy saving potential of phase change materials in
major Australian cities. Energy and Buildings 78,
192-201.
AL-Saadi, S.N. and Zhai, Z.Q. (2013). Modeling phase
change materials embedded in building enclosure: a
review. Renewable and Sustainable Energy Reviews
21, 659-673.
Ascione, F., Bianco, N. R., Masi, F. De, de’Rossi, F. and
Vanoli, G.P. (2014). Energy refurbishment of
existing buildings through the use of phase change
materials: energy savings and indoor comfort in the
cooling season. Applied Energy 113, 990-1007.
Barzin, R., Chen, J.J., Young, B.R. and Farid, M.M.
(2015). Application of PCM energy storage in
combination with night ventilation for space cooling.
Applied Energy 158, 412-421.
Building Energy Conservation Research Center of
Tsinghua University. (2013). China building energy
efficiency annual development report. China
Building Industry Press. Beijing. (in Chinese)
Chinese National Standard, Thermal design code for civil
building (GBT50176-1993), 1993. (in Chinese)
Design standard for energy efficiency of public buildings,
in: Chinese National Standard, Beijing, 2015. (in
Chinese)
EnergyPlus. Engineering Reference Handbook, 2016.
Givoni, B. (1998). Effectiveness of mass and night
ventilation in lowering the indoor daytime
temperatures. Part I: 1993 experimental periods.
Energy and Buildings 28, 25-32.
http://apps1.eere.energy.gov/buildings/energyplus/cfm/w
eather_data3.cfm. [access time: September 1, 2016]
Jamil, H., Alam, M., Sanjayan, J. and Wilson, J. (2016).
Investigation of PCM as retrofitting option to
enhance occupant thermal comfort in a modern
residential building. Energy and Buildings 133, 217-
229.
Jin, X., Medina, M.A. and Zhang, X.S. (2016). Numerical
analysis for the optimal location of a thin PCM layer
in frame walls. Applied Thermal Engineering 103,
1057-1063.
Kuznik, F., David, D., Johannes, K., and Roux, J. (2011).
A review on phase change materials integrated in
building walls. Renewable and Sustainable Energy
Reviews 15, 379-391.
Lam, J.C., Yang, L. and Liu J.P. (2006). Development of
passive design zones in China using bioclimatic
approach. Energy Conversion and Management 47,
746-762.
Li, D.H.W., Yang L. and Lam J.C. (2013). Zero energy
buildings and sustainable development implications-
A review. Energy 54, 1-10.
Lin, K.P., Zhang, Y.P., Xu, X., Di, H.F., Yang, R. and Qin,
P.H. (2004). Modeling and simulation of under-floor
electric heating system with shape-stabilized PCM
plates. Building and Environment 39, 1427-1434.
Liu, Y., Yang, L., Hou, L.Q., Li, S.Y. and Wang, Q.W.
(2017). A porous building approach for modelling
wind and thermal environment around and inside an
isolated building on night ventilation and thermal
mass. Building Simulation, Submitted.
Liu, Y., Yang, L., Li, S.Y., Yang, J. and Wang, Q.W.
(2017). Wind interference effects between two high-
rise buildings: Comparisons between solid and
porous building model. in: 4rd International
Workshop on Heat Transfer Advances for Energy
Conservation and Pollution Control (IWHT2017).
Las Vegas, the United States.
Marin, P., Saffari, M., Gracia, A.D., Zhu, X., Farid, M.M.,
Cabeza, L.F. and Ushak, S. (2016). Energy savings
due to the use of PCM for relocatable lightweight
buildings passive heating and cooling in different
weather conditions. Energy and Buildings 129, 274-
283.
Mi, X.M., Liu, R., Cui, H.Z., Memon, S.A., Xing, F. and
Lo, Y. (2016). Energy and economic analysis of
building integrated with PCM in different cities of
China. Applied Energy 175, 324-336.
Muruganantham, K. (2010). Application of Phase Change
Material in Buildings: Field Data vs. EnergyPlus
Simulation, Master of Science thesis, Arizona State
University.
Ramponi, R., Gaetani, I. and Angelotti, A. (2014).
Influence of the urban environment on the
effectiveness of natural night-ventilation of an office
building. Energy and Buildings 78, 25-34.
Roman, K.K., O'Brien, T., Alvey, J.B. and Woo, O.
(2016).Simulating the effects of cool roof and PCM
(phase change materials) based roof to mitigate UHI
(urban heat island) in prominent US cities. Energy 96,
103-117.
Sadineni, S.B., Madala, S. and Boehm R.F. (2011).
Passive building energy savings: A review of
building envelope components. Renewable and
Sustainable Energy Reviews 15, 3617-3631.
Santamouris, M., Sfakianaki, A. and Pavlou, K. (2010).
On the efficiency of night ventilation techniques
applied to residential buildings. Energy and
Buildings 42, 1309-1313.
Shaviv, E., Yezioro, A. and Capeluto, I.G. (2001).
Thermal mass and night ventilation as passive
cooling design strategy. Renewable Energy 24, 445-
452.
Tabares-Velasco, P.C., Christensen, C. and Bianchi, M.
(2012). Verification and validation of EnergyPlus
phase change material model for opaque wall
assemblies. Building and Environment 54, 186-196.
Wang, Y.Y., Liu, Y.F., Wang D.J. and Liu, J.P. (2014).
Effect of the night ventilation rate on the indoor
environment and air-conditioning load while
considering wall inner surface moisture transfer.
Energy and Buildings 80, 366-374.
Yang, L. (2003). Climatic analysis and architectural
design strategies for bio-climatic design, Xi’an
University of Architecture and Technology. (in
Chinese)
Yang, L. (2010). Building climatology. China Building
Industry Press. Beijing, China. (in Chinese)

Proceedings of the 15th IBPSA ConferenceSan Francisco, CA, USA, Aug. 7-9, 2017
1138
Yang, L.N. and Li, Y.G. (2008). Cooling load reduction
by using thermal mass and night ventilation. Energy
and Buildings 40, 2052-2058
Related Documents