Welcome message from author
This document is posted to help you gain knowledge. Please leave a comment to let me know what you think about it! Share it to your friends and learn new things together.
Transcript

Ricerca Sistema Elettrico
Sigla di identificazione
NNFISS – LP3 - 042
Rev.
0
Distrib.
P
Pag. di
2 8
Index
OVERVIEW .................................................................................................................... 3
SCOPE OF THE SUPPLY .............................................................................................. 4
DOCUMENTATION FOLLOW UP ............................................................................... 5
CALIBRATION SET-UP BY ENEA ............................................................................... 5
DELIVERY TIME .......................................................................................................... 6
PAYMENTS .................................................................................................................... 6
GUARANTEE, PENALTIES, SHIPMENT..................................................................... 6
ANNEX I: FLOW METER TECHNICAL SPECIFICATION ....................................... 7
REFERENCES ................................................................................................................ 8

Ricerca Sistema Elettrico
Sigla di identificazione
NNFISS – LP3 - 042
Rev.
0
Distrib.
P
Pag. di
3 8
OVERVIEW
In the frame of the research activities planned to support the development of a Lead cooled Fast
Reactor (LFR), ENEA assumed the commitment to run experimental tests to simulate the thermal-
hydraulic behavior of a pin fuel bundle cooled by heavy liquid metal.
These activities, which will be performed in the context of the Program Agreement between ENEA
and Ministry of Economical and Sustainable Development (MSE), will be carried out on NACIE
(NAtural Circulation Experiment) facility loop, located by ENEA Brasimone Research Centre.
NACIE ([1], [2]) is a rectangular loop facility which allows to perform experimental campaigns in the
field of the thermal-hydraulics, fluid-dynamics, chemistry control and heat transfer and to obtain
correlations essential for the design of nuclear systems cooled by heavy liquid metals. A sketch of
NACIE is shown in Fig. 1. It basically consists of two vertical pipes (O.D. 2.5”), working as riser and
downcomer, connected by two horizontal pipes (O.D. 2.5”). In the bottom of the riser a heat source is
installed, while a heat exchanger is placed in the upper part of the downcomer.
Fig. 1:Sketch of the NACIE facility.
NACIE is made in stainless steel (AISI 304) and can use both lead and the eutectic alloy LBE as
Cover Gas Inlet
Cover Gas Outlet
Gas
Injection
Heat Exchanger
Water Outlet
Water Inlet
Ultrasonic Flow Meter
Heat Source
Expansion Vessel
Riser
Downcomer
Cover Gas Inlet
Cover Gas Outlet
Gas
Injection
Heat Exchanger
Water Outlet
Water Inlet
Ultrasonic Flow Meter
Heat Source
Expansion Vessel
Riser
Downcomer

Ricerca Sistema Elettrico
Sigla di identificazione
NNFISS – LP3 - 042
Rev.
0
Distrib.
P
Pag. di
4 8
working fluid (about 1000kg). The lop has been designed to work up to 10 bar and 550°C. NACIE
allows both natural and enhanced circulation regime. Enhanced circulation measurements are realized
injecting Argon gas at the bottom of the riser, immediately above the heat source. The gas promotes
the circulation of the LBE and is recollected in the expansion vessel above the riser.
The heat source will consist of 19 electrical pins with a heat flux of q” = 1 MW/m2. The bundle will be
closed by a hexagonal wrapper. The total power of the new pin fuel bundle is ≈ 235 kW.
An inductive flow meter will be installed on NACIE to allow accurate measurements, to be supplied
by HZDR, which has a wide experience with the measuring techniques with Liquid Metals.
In the past the HLM flow rate has been estimated applying a heat balance through the heat source [3];
the proposal is to apply this methodology to calibrate on site the inductive flow meter which will be
supplied.
The goals of the experimental campaigns planned on the NACIE loop facility with the new inductive
flow meter and the new heat source are:
• the measurement of the pin wall temperature;
• the measurement of the subchannel temperature;
• the characterization of hot spots points;
• the observation of the axial thermal stratification of the coolant fluid and its entrance length in
the bundle subchannels;
• the measurement of the mass flow rate of LBE during natural and gas enhanced circulation
experiments.
The new flow meter will be an inductive phase-shift sensor able to measure the perturbation of the
magnetic field by the flow. It is characterized by a high temporal resolution and it can be applied at
high temperature (up to 450°C).
A sketch of the new flow meter for NACIE is shown in Fig. 2 (image from HZDR)
SCOPE OF THE SUPPLY
The aim of the Supply is
• the procurement of an inductive flow meter able to measure mass flow rate with HLM, in a
range of temperature of 150 – 450 °C and in a range of velocity of 0.1 – 2 m/s;
• the procurement of the electronic equipment needed to properly operate the sensors;
• the shipment of the components by the C.R. ENEA Brasimone, Italy;
• support for the installation of the sensor on NACIE loop; for this purpose, the thermal
insulator (100 mm thickness) and the heating cable (O.D. 10 mm) will be removed from the

Ricerca Sistema Elettrico
Sigla di identificazione
NNFISS – LP3 - 042
Rev.
0
Distrib.
P
Pag. di
5 8
pipe zone where the sensor will be installed, for a maximum length of 200 mm.
• support for the on-site calibration of the flow meter on the NACIE loop;
• support on-site for a past-evaluation of the sensors performance (if required by ENEA)
The flow rate will be installed on NACIE loop, in the vertical pipe downstream the heat exchanger.
The flow rate sensor will remain at ENEA after the installation.
Fig. 2:Sketch of the new inductive flow meter for NACIE.
DOCUMENTATION FOLLOW UP
The supply will be completed by a documentation set follow up. The following documents will be
delivered:
• Inductive Flow Meter: Scientific Background, Installation and Operation Handbook
• Pre-calibration Report
• Calibration procedure on site
• End of Manufacturing, Performed tests and Calibration Report
All the documents will have to be reviewed by ENEA (usually one week is allocated for that action).
CALIBRATION SET-UP BY ENEA

Ricerca Sistema Elettrico
Sigla di identificazione
NNFISS – LP3 - 042
Rev.
0
Distrib.
P
Pag. di
6 8
The calibration set-up of the flow meter will be performed by ENEA on the NACIE loop, by the
HZDR support on site.
The Supplier will communicate two weeks before the calibration on-site the actions to be performed
on the loop aiming to properly install the flow meter (i.e. length of the free part for the sensors
installation).
DELIVERY TIME
The flow meter has to be delivered within three months after the order.
The on-site calibration will take place within two months after the delivery of the flow meter.
PAYMENTS
• 30% of the total selling price after the delivery of the following documentation:
Inductive Flow Meter: Scientific Background, Installation and Operation Handbook.
Pre-Calibration Report.
• 40% of the total selling price after the delivery of the sensor and the related electronic
equipment.
• 30% of the total selling price after the calibration on site and the delivery of the documents
Calibration procedure on site.
End of Manufacturing, Supply and Calibration Report.
The Payments will be performed by Bank Transfer within 30 days after the invoice.
GUARANTEE, PENALTIES, SHIPMENT
The supplier will not be responsible concerning the performance of the flow meter.
Anyway the sensors and the electronic equipment will be guaranteed for a period of 24 months after
the delivery.
In case of a delay on the delivery, a liquidity damage of 0.3% of the total selling price a week with a
maximum limited to 10% of the total selling price will be applied.
The shipment will be Delivered Duty Unpaid (DDU), by the C.R. ENEA Brasimone, Italy, packaging
free of charge.

Ricerca Sistema Elettrico
Sigla di identificazione
NNFISS – LP3 - 042
Rev.
0
Distrib.
P
Pag. di
7 8
ANNEX I: FLOW METER TECHNICAL SPECIFICATION
NACIE (LBE loop)
Outer Diameter Pipe 73.02 mm
Inner Diameter Pipe 62.7 mm
Thickness Pipe 5.16 mm
Temperature 150 – 450 °C
Velocity 0.1 – 2 m/s
Mass flow rate 3 – 65 kg/s
Density range 10,140 – 10,535 kg/m3
Latent heat of melting at the normal melting point 38.5 kJ/kg
Boiling point 1,670 °C
Heat of vaporisation at the normal boiling point 854 kJ/kg
Saturation vapour pressure 7.93 x 10⁻¹⁴
– 3.17 x 10⁻⁴
Pa
Surface tension 0.389 – 0.409 N/m
Thermal expansion 1.26 x 10⁻⁴
– 1.31 x 10⁻⁴
K-1
Sound velocity 1,699 – 1,766 m/s
Heat capacity at constant pressure 143 – 149 J/kg K
Dynamic viscosity 1.40 x 10⁻³ - 2.94 x 10⁻³ Pa s
Kinematic viscosity 1.4 x 10⁻⁷ - 2.8 x 10⁻⁷ m2/s
Electrical resistivity 1.08 x 10⁻⁶
– 1.23 x 10⁻⁶
Ω m
Thermal conductivity 10.3 – 14.6 W/m K
Working Time (per year) 3000 h

Ricerca Sistema Elettrico
Sigla di identificazione
NNFISS – LP3 - 042
Rev.
0
Distrib.
P
Pag. di
8 8
REFERENCES
[1] “Natural circulation in a liquid metal one dimensional loop”, M. Tarantino, S. De Grandis, G.
Benamati, F. Oriolo, Journal of Nuclear Materials, 376 (2008), 409 - 414.
[2] “Experimental Investigation of the Thermal – Hydraulic behaviour of Heavy Liquid Metal
Cooled Reactors”, M. Tarantino, Ph.D thesis, University of Pisa, Academic Years 2005 – 2007.
[3] “Natural and gas enhanced circulation tests in the NACIE Heavy Liquid Metal loop”, M.
Tarantino, D. Bernardi, G. Coccoluto, P. Gaggini, V. Labanti, Proceedings of ICONE 18, 18th
International Conference in Nuclear Engineering, May 17 – 21, Xi’an, China.


Helmholtz-Zentrum Dresden-Rossendorf e.V. ; Bautzner Landstraße 400, 01328 Dresden;
Vorstand: Prof. Dr. Roland Sauerbrey, Prof. Dr. Dr. h. c. Peter Joehnk; VR 1693 beim
Amtsgericht Dresden
Helmholtz-Zentrum Dresden Rossendorf
Bautzner Landstraße 400
01328 Dresden, Germany
To:
ENEA
Experimental Engineering Technical Unit
Brasimone Research Certer
40032 Camugnano Bologna
Italy
Commissioning report
referring to order:
CJG No. 318 206 4248,
CUP No. J31 J11 000 13 000 6
Editor: Dr. D. Buchenau (HZDR)
Dresden, den 12.07.2012

Helmholtz-Zentrum Dresden-Rossendorf e.V. ; Bautzner Landstraße 400, 01328 Dresden;
Vorstand: Prof. Dr. Roland Sauerbrey, Prof. Dr. Dr. h. c. Peter Joehnk; VR 1693 beim
Amtsgericht Dresden
The following commissioning report relates to the works performed in the period from
Thuesday (02.07.2012) to Wednesday (03.07.2012). All steps with respect to the preparation
and execution of the commissioning phase of the inductive flow meter at the NACIE loop
were carried out by the following nominated persons as members of the Helmholtz-Zentrum
Dresden-Rossendorf (HZDR) and the SAAS-GmbH.
Dr. D. Buchenau
HZDR, Institute of Fluiddynamics, Department of Magnetohydrodynamics, 01328 Dresden,
Bautzner Landstraße 400, Germany.
Dr. S. Lenk
SAAS-GmbH, 01728 Bannewitz/Possendorf, Poisentalstraße 03, Germany
M. Flöter
SAAS-GmbH, 01728 Bannewitz/Possendorf, Poisentalstraße 03, Germany
The customer is represented by the following person:
Dr. Ivan Di Piazza
ENEA, UTIS-TCI C.R. Brasimone, 40032 Camugnano (Bo), Italy.
Following steps during installation and calibration of the contactless flow meter EMD-ps
were performed:
Period Results
3.7.2012 9:00 to 13:00 o’clock Assembly of the sensor system including
mechanical adjustment of the system and
installation of all necessary electrical
connections between supply/measurement
unit and sensor head at the NACIE-facility.
3.7.2012 14: 00 to 17:00 o’clock Basic functional tests. Adjustment of all
necessary parameters of the sensor system,
Admission of ENEA costumers to the device
based on the delivered manual instruction.
3.7. 2012 17:00 to 4.7.2012 9:00 o’clock Heating of the NACIE-loop to an operational
temperature of 300°C. Periodically appearing
fluctuations of the sensor output at a fixed
Helmholtz-Zentrum Dresden-Rossendorf e.V. ; Bautzner Landstraße 400, 01328 Dresden;
Vorstand: Prof. Dr. Roland Sauerbrey, Prof. Dr. Dr. h. c. Peter Joehnk; VR 1693 beim
Amtsgericht Dresden
loop temperature were observed. Presumably
the fluctuations are caused by switching on
and switching off heating elements of the
loop causing an additional flow driven heat
convection in the closed loop measured by
the flow meter.
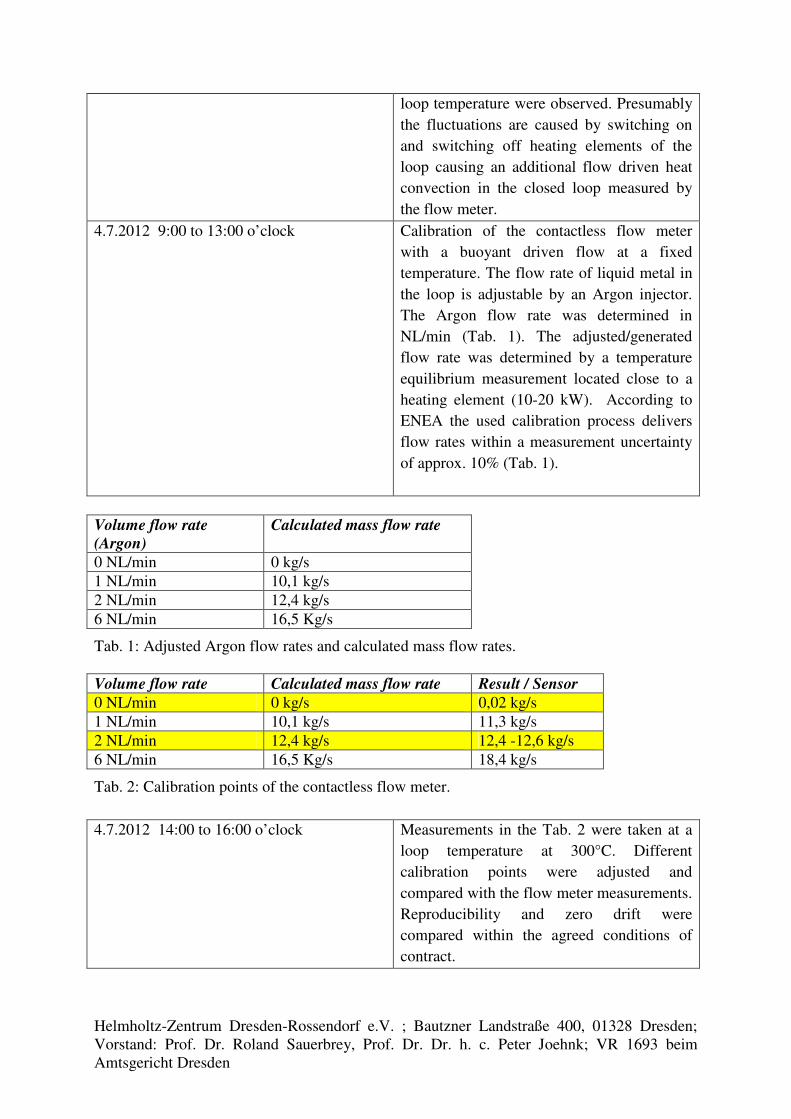
4.7.2012 9:00 to 13:00 o’clock Calibration of the contactless flow meter
with a buoyant driven flow at a fixed
temperature. The flow rate of liquid metal in
the loop is adjustable by an Argon injector.
The Argon flow rate was determined in
NL/min (Tab. 1). The adjusted/generated
flow rate was determined by a temperature
equilibrium measurement located close to a
heating element (10-20 kW). According to
ENEA the used calibration process delivers
flow rates within a measurement uncertainty
of approx. 10% (Tab. 1).
Volume flow rate
(Argon)
Calculated mass flow rate
0 NL/min 0 kg/s
1 NL/min 10,1 kg/s
2 NL/min 12,4 kg/s
6 NL/min 16,5 Kg/s
Tab. 1: Adjusted Argon flow rates and calculated mass flow rates.
Volume flow rate Calculated mass flow rate Result / Sensor
0 NL/min 0 kg/s 0,02 kg/s
1 NL/min 10,1 kg/s 11,3 kg/s
2 NL/min 12,4 kg/s 12,4 -12,6 kg/s
6 NL/min 16,5 Kg/s 18,4 kg/s
Tab. 2: Calibration points of the contactless flow meter.
4.7.2012 14:00 to 16:00 o’clock Measurements in the Tab. 2 were taken at a
loop temperature at 300°C. Different
calibration points were adjusted and
compared with the flow meter measurements.
Reproducibility and zero drift were
compared within the agreed conditions of
contract.

OT Possendorf, Poisentalstr. 3, D-01728 Bannewitz
1 Rev1.4 26.06.2012
EMD ps
Manual / Operating Instruction

2
Content:
1. Functionality and Application of the Device ...................................................................... 3 2. Information for the Electrical Safety .................................................................................. 6 3. Installation and Wiring ....................................................................................................... 7 4. Initiation and Symmetry Alignment .................................................................................. 11 5. Menu for the Operating of the Device ............................................................................. 13 5.1. “Measurement” – Measurement Value, Error Notifications ......................................... 13 5.2. “System Setup” – Input of System Parameters (secured by password) ...................... 14 5.3. „ Channel Setup” – Input of Channel Parameters (secured by password) .................. 15 5.4. „Calibration“ – Two Point Calibration, Zero Point Calibration ..................................... 16 5.5. „Service“ – Measurement value control ...................................................................... 17 6. Analog Output of EMD ps ............................................................................................... 18 7. USB-Interface for Data Storage ...................................................................................... 19 8. Technical data sheet ....................................................................................................... 20

3
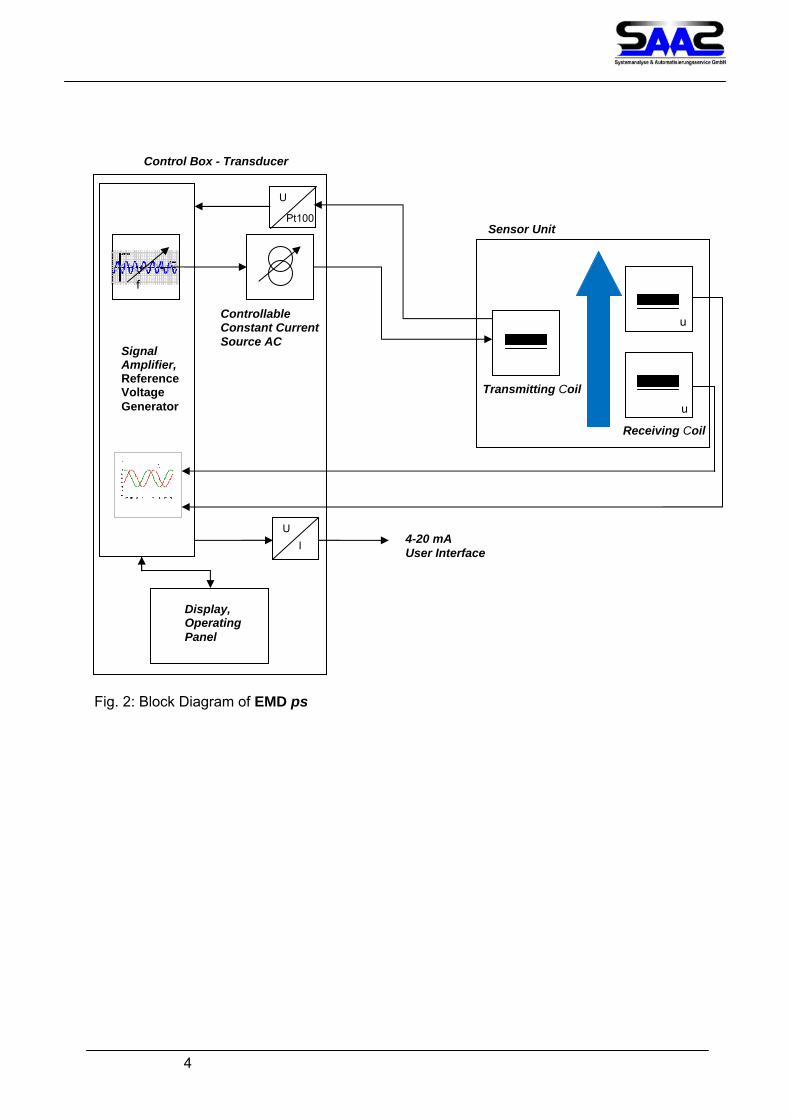
1. Functionality and Application of the Device The device EMD ps is intended for the recording of the flow rate for liquid metal in pipes. The measurement principle is based on the recording of current dependent distortions of phases induced by alternating voltage. The alternating voltage is induced into the fluid by a transmit-ter coil. A receiving coil which is also placed in the flow channel detects the induced voltage. A distortion in phases exists between the sent and received voltage, which is linear related to the average flow velocity of the fluid (Fig. 1). Fig.1 Principle of Measurement (origin from HZDR) The measuring device consists of the following:
- Sensor unit, to be assembled on a pipe - Evaluating unit transducer wall mounted
The maximum distance (cable length) between the sensor and transducer is 20m.
y
x
z
Flow Receiving Coil1
Receiving Coil 2
Channel Wall
Transmitting Coil
Magnetic Field
Induced Currents
4
Signal Amplifier, Reference Voltage Generator
Controllable Constant Current Source AC
f
Display, Operating Panel
Transmitting Coil
Receiving Coil
Sensor Unit
u
u
Pt100
U
U
I 4-20 mA User Interface
Control Box - Transducer
Fig. 2: Block Diagram of EMD ps
5
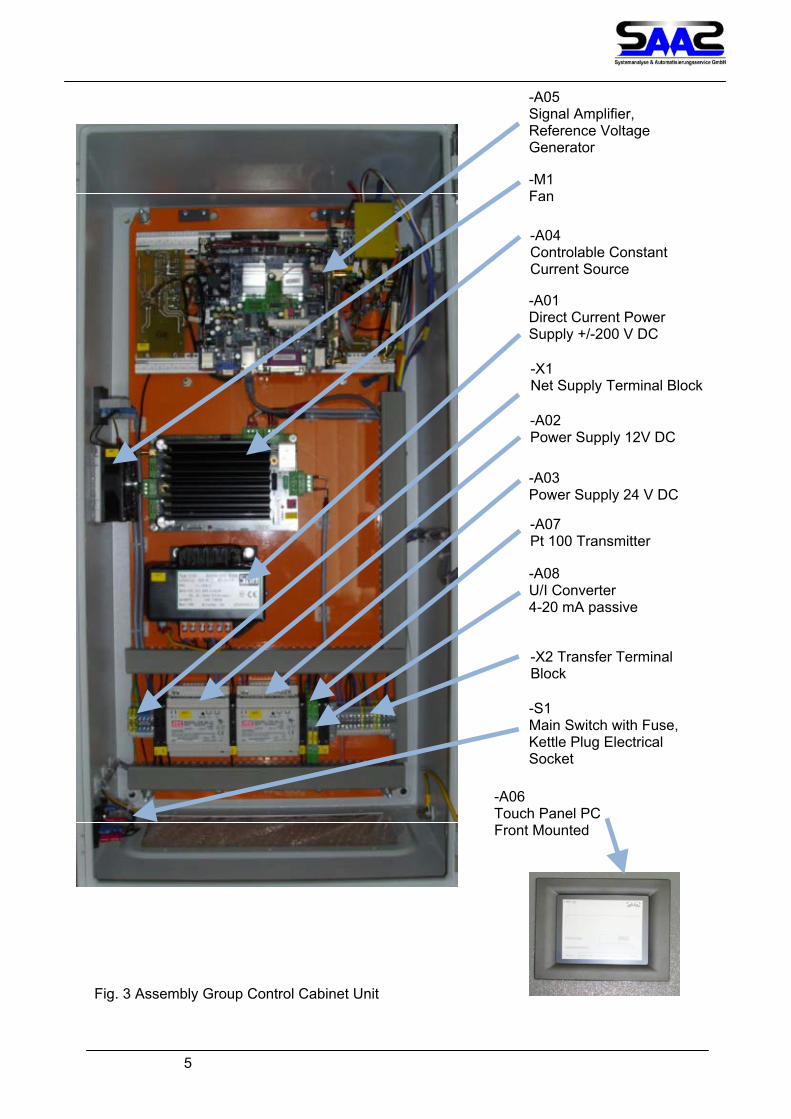
-X1 Net Supply Terminal Block
Fig. 3 Assembly Group Control Cabinet Unit
-A06 Touch Panel PC Front Mounted
-A05 Signal Amplifier, Reference Voltage Generator
-M1 Fan
-A04 Controlable Constant Current Source
-A01 Direct Current Power Supply +/-200 V DC
-S1 Main Switch with Fuse, Kettle Plug Electrical Socket
-A02 Power Supply 12V DC
-A03 Power Supply 24 V DC
-A07 Pt 100 Transmitter
-A08 U/I Converter 4-20 mA passive
-X2 Transfer Terminal Block

6
2. Information for the Electrical Safety The control cabinet unit is operating with a power supply with kettle plug. Before Opening the Device Remove the Power Plug! Energized Parts up to 200 V DC! The power supply voltage of transmitting coil is +/ - 200 V DC Before Opening the Sensor Casing Disconnect Induction Current Supply (Open Fuse Clip -F5, -F6)! Do Not Disconnect 200 V DC Power Supply from Signal Amplifier! Danger Because of Residual Voltage at the 200 V DC Power Supply Module after Supply Voltage 230 V AC Was Switched off! The device has the degree of protection IP 54 and is therefore suitable for usage in dry and frost-free rooms.
Inside of the Control Box Is Not Completely Screen Protected against Electric Shocks!
-A01
-A04

7
360 mm
820 mm
3. Installation and Wiring Step 1: Installation of Control Box - Transducer The control box is designed for wall installation Dimensions: Detail: Fig. 4 Wall Fastening of Control Box -Transducer

8
Step 2: Sensor Installation on the Pipe: The sensor unit consists of two symmetrical components, after removing the sensor casing (1), which are mounted around the pipe with the stream to be captured and (2) the aluminum clamps (1) which were constructed custom-fit to stream pipe, that secure the sensor. The measured positive direction of fluids flow is marked with an arrow. Abb. 5 Sensor Unit Assembling
(1)
(2) (3)

9
-X2:1
-X2:2 -X2:3 -X2:4
-X2:gn/ye Shield -X7:1
-X7:2 -X7:3 -X7:4
Cable W100: LiYCY GY 4x0,5
Terminal Box - Transmitting Coil
-F5 -F6
-X7:5 -X7:6
box -X2:gn/ye
-X2:8 -X2:9
-X2:12
-X8:1 -X8:2
-X8:3
Cable W101: LiYCY GY 2x0,75GY
-X2:13 -X8:4 -X2:11
-X2:10 Cable W102: LiYCY GY 2x0,75
Cable W103: LiYCY GY 2x0,75
Terminal Box - Receiving Coils
Transfer Terminal Block Control Box - Transducer
Step 3: Attachment of the Sensor Unit and the Control Cabinet without the Sensor Casing. For this purpose, the wires W100, W101, W102 and W103 are used to extend the connection between the coils and the control box -transducer. The sensor casing (3) Fig. 5 should be kept clear as far away as possible during the adjustment of the sensor, to minimize the influ-ence of the alternating field. The wiring between the sensor and the control cabinet is to be carried out suitable to local terms. The wire W101 has to have a distance of 100mm mini-mum to the wires W102 and W103. Fig. 6: General Wiring Diagram Sensor Unit – Control Box - Transducer

10
Control Box - Transducer
Earth Potential Terminal of the Building
Sensor Unit
For equipotential bonding the following connections (Fig 7) have to be realised: Fig.: 7 Equipotential Bounding between the EMD Components

11
4. Initiation and Symmetry Alignment Completely wired and assembled, the device can also be launched by turning on the main switch, even if the device has a sensor without a sensor casing. The error code is 0000H and green, if all components are working correctly. The Device Requires an Adaption Phase of about an Hour after Being Switched on. The main operating parameters can be observed in the menu under Service. The excitation frequency and current and are bound to type and preset.
Objective of the implementing and adjustment is the preferably symmetrical distribution of the receiving magnetic field onto the receiving coils without flowing medium. The main operating parameters can be observed in the menu under Service. The excitation frequency and current and are bound to type and preset. Objective of the implementing and adjustment is the preferably symmetrical distribution of the receiving magnetic field onto the receiving coils without flowing medium. The voltages u1 and u2 are to be adjusted as well as the minimization of the phase difference Δφ. This process is possible on both the sending and receiving side and if needed can be done on both these sides. The procedure for this process is the following:
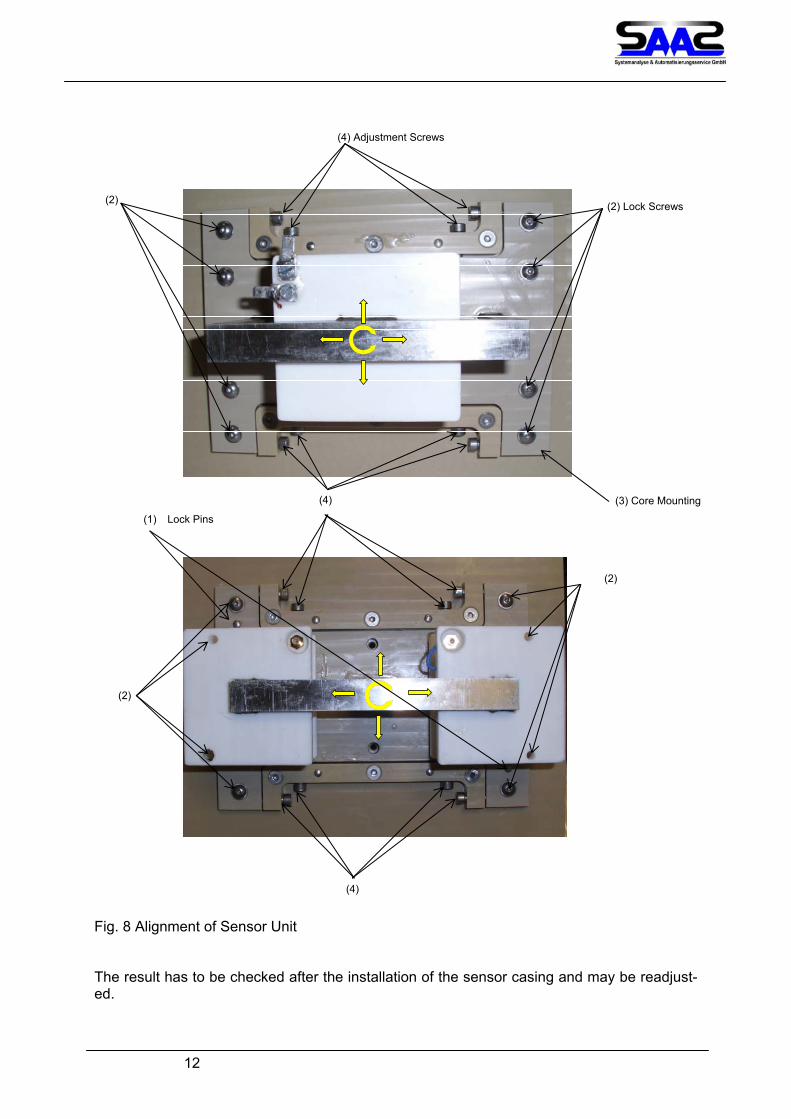
1. Remove lock pins (1), drive through with suitable tool, loosening the attachment bolts until one can move the core mounting (3)
2. Slide the core using the adjustment screws (4) until the induced voltage is the same and the phase difference is at its minimum.
12
Fig. 8 Alignment of Sensor Unit The result has to be checked after the installation of the sensor casing and may be readjust-ed.
(1) Lock Pins
(2) Lock Screws
(3) Core Mounting
(2)
(4) Adjustment Screws
(4)
(4)
(2)
(2)

13
5. Menu for the Operating of the Device The device EMD ps used a touch panel to operate.
5.1. “Measurement” – Measurement Value, Error Notifications The error notification (1) is coded in hexadecimal notation. The error code is 0000 and green, if all components are working correctly. Warnings are marked yellow. Error notifications which lead to the shutdown of the excitation current or a downtime of the measurement are red. The error can be reset after removing the error source by using the reset button. The temperature of the magnetic core (2) gives information about the thermal situation around the sensor. List of error notifications: Position Error Description Action
20 SetErrormA Measurement value out of range
Warning
21 CurrentFailure Induction current out of range (de‐viation more than 10 % from set point)
ShutDown
22 NoConnection No connection between panel and signal amplifier
HoldOn
23 Temperature Failure
Temperature measurement out of range, wire break
Warning
24 U1Failure Low voltage from transceiver coil 1
Warning
25 U2Failure Low voltage from transceiver coil 1
Warning
26 CalibrationFailure Result “ not a number” division by zero
Last calibration will be used fur‐ther on
27 ‐ 215 Unused
(1)
(2)

14
5.2. “System Setup” – Input of System Parameters (secured by password) The input of the nominal value of excitation current is restricted to a maximum of 500mA (2). The restriction for the excitation frequency is 300Hz (1). The temperature coefficient of the measurement value (3) is dependent on the fluid and therefore has to be determined by it. The preset values are sensor specific and should not be changed. There is the possibility to either save the diameter (5) of the pipe by selecting circular (4) or the area (6) directly. For the calculation of the flow stream the density (7) of the fluid can be set as a constant.
(1)
(2)
(3)
(4)
(5)
(6)
(7)

15
5.3. „ Channel Setup” – Input of Channel Parameters (secured by password) It is possible to determine 3 formats for the decimal place depending on the calibration of the display of the measurement value (1): xxx xx,x x,xx The following engineering units are available for the display of the measurement value (2): l/s, l/min, m3/h, kg/s, t/h The display value of the flow stream can be set to a moving average. A value is collected every 500ms. The input of 1 to 10 changes the duration of this cycle in multiples of 500ms (3). The device EMD ps has an analog output interface. Output is the displayed analog value. The dimensioning of the current output results from the ending points of the current range (4): 4 mA und 20 mA In case of error, if no correct measurement value can be recorded, a preset value is being displayed (5).
(1)
(2)
(3)
(4)
(5)

16
5.4. „Calibration“ – Two Point Calibration, Zero Point Calibration The device EMD ps has a linear characteristic line and is calibrated over two points. Since the device can determine the flow rate in both directions, the entry will not be verified for plausibility. Division by ZERO, due to an incorrect entry of calibration data will lead to a warn-ing and interruption of the calibration. See section 5.1 List of error notifications Therefore the calibration consists of two steps: Step 1: The menu contains the order “set 1. Point! ” (1) Adjustment of the flow rate, with reference value of the wanted rate, usually flow rate =0 and entry of the number in the appointed unit. (2) If the shown value of phase difference (3) does not change anymore, press “next” button. (4)
Step 2: Adjustment of the flow rate, with the second reference value of the wanted second rate and entry of the number in the appointed unit.(5) If the shown Value if phase difference does not change anymore, press “next” button.(4) The calibration will be completed and the device will return automatically to the measured value display. If the calibration was correct, the measured value display will now show the second calibration value. The calibration is now complete. With the button “exit” the calibration can be aborted any-time and the old calibration value will be kept. (6)
For fast calibration there is the option of zero balance.(7) By pressing the according button the present measurement value will be identificated as zero value. The according offset will be added to the present calibration. The bracing of the characteristic line will be kept. After the zero point calibration the device will return automatically to the measured value display.
(2)
(5)
(3)
(1) (4)

17
5.5. „Service“ – Measurement value control
Single measurement values can be monitored under this sub menu. Furthermore additional information corresponding to the values of calibration and the present values are displayed. In the following these values are defined:
• φ1 – phase-shift signal receiving coil 1 • φ2 – phase-shift signal receiving coil 2 • i – induction current • U1 – voltage signal receiving coil 1 • U2 – voltage signal receiving coil 2 • Δφ0 – deviation of phase-shift difference in reference to the calibration • ϑ 0 – core temperature in the moment of calibration • Δϑ0 – deviation of core temperature in reference to the calibration • Δφ – phase-shift difference between φ1 and φ2 (rough value) • v – velocity of flow
18
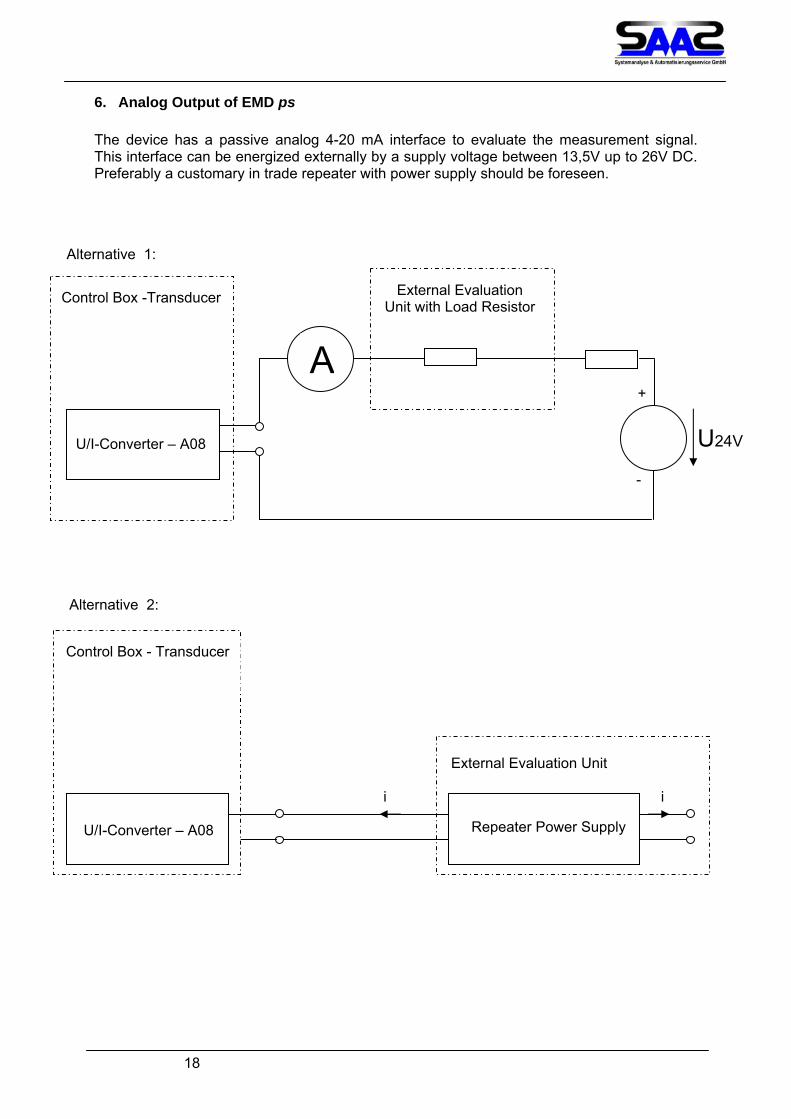
6. Analog Output of EMD ps The device has a passive analog 4-20 mA interface to evaluate the measurement signal. This interface can be energized externally by a supply voltage between 13,5V up to 26V DC. Preferably a customary in trade repeater with power supply should be foreseen.
A
External Evaluation Unit with Load Resistor
+
-
U24VU/I-Converter – A08
Repeater Power Supply
i i
U/I-Converter – A08
Alternative 1:
Control Box -Transducer
Alternative 2:
Control Box - Transducer
External Evaluation Unit
19
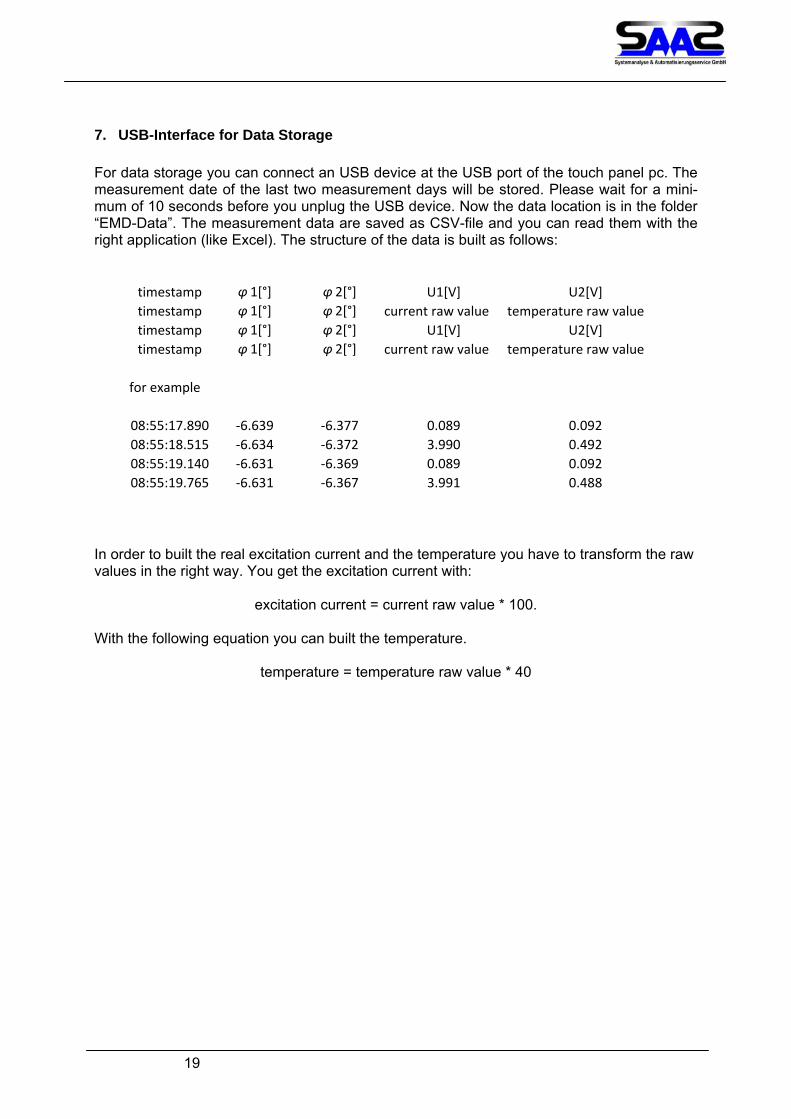
7. USB-Interface for Data Storage For data storage you can connect an USB device at the USB port of the touch panel pc. The measurement date of the last two measurement days will be stored. Please wait for a mini-mum of 10 seconds before you unplug the USB device. Now the data location is in the folder “EMD-Data”. The measurement data are saved as CSV-file and you can read them with the right application (like Excel). The structure of the data is built as follows:
timestamp φ 1[°] φ 2[°] U1[V] U2[V]timestamp φ 1[°] φ 2[°] current raw value temperature raw valuetimestamp φ 1[°] φ 2[°] U1[V] U2[V]timestamp φ 1[°] φ 2[°] current raw value temperature raw value
for example
08:55:17.890 ‐6.639 ‐6.377 0.089 0.09208:55:18.515 ‐6.634 ‐6.372 3.990 0.49208:55:19.140 ‐6.631 ‐6.369 0.089 0.09208:55:19.765 ‐6.631 ‐6.367 3.991 0.488
In order to built the real excitation current and the temperature you have to transform the raw values in the right way. You get the excitation current with:
excitation current = current raw value * 100.
With the following equation you can built the temperature.
temperature = temperature raw value * 40

20
8. Technical data sheet Power Supply: Supply Voltage: 230V AC Power Input: 1 A (Switch on Current: 4 A) Dimensions/Weight: Dimension Transducer Control Box WxHxD: 400x800x300 Wall Fastening Box Dimension Sensor Unit WxHxD: 215x20x510 Weight Transducer 35 kg Weight Sensor 8,5 kg Installation Standard Pipe do 73 mm Maximum of Cable Length between Sensor Unit and Transducer Box
20 m, More on Enquiry
Mounting Position Sensor Unit In Any Order Degree of Protection of Enclosure Sensor / Transducer:
IP54 / IP54
Fluid, external conditions: Maximum Temperature Work Environment 0°C to 30°C Maximum Relative Humidity Work Environ-ment
<85%
Other Mounting Conditions Indoor Maximum Operating Temperature of Sensor <500°C Fluid Temperature Fluid Liquid Metal Elec. Conductivity >105 S/m and
<=107 S/m Ranges: Flow Range: 0,05 l/s – 10 l/s, Free of Blow Holes Measures: l/s, l/min, m³/h, kg/s, t/h (Other on Enquiry) Pipe Dimensions: Standard: 20 mm – 73 mm (Major Dimen-
sions on Enquiry) Excitation Frequency: 150 Hz – 800 Hz to Parameterize Induction Current: 0 mA – 500 mA to Parameterize Output Signal / Interfaces 4 – 20 mA Measurement Uncertainty: 3% of Meas. Range under Condition of Con-
stant and Balanced Temperature Inlet Path: 5 x dI (Inside Diameter) Outlet Path: 3 x dI (Inside Diameter) Operation: Display: Touch Panel Menu Item „Measure“: Display of Measurement Value with Unit,
Error Code, Recent Temperature of Sensor Core
Menu Item „System Setup“: Input of System Parameters Menu Item „Channel Setup“: Input of Channel Parameters Menu Item „Calibration“: Two Point Calibration, Alternative: Zero Point
Calibration Menu Item „Service“: Display of Additional Parameters

PW setup 1404IP‐touch panel PC 192.168.100.133IP‐amplifier 192.168.100.115
Other Unit min max adjusted
Unit
HzmA°/10K
Parameter Settings ‐ EMDps
Transducer: Sensor:
System Parameterslanguageexcitation frequency
adjusted
Assembly Site: TagNr.: Customer:
max
300
min
Channel Parameters Unit min max
induction currenttemperature coefficientpipe cross sectioninside diameter
density
mm
kg/dm³ 0,1flow cross section
0‐1
20mm² 300 10000
error default value mA 3,8 20current unitvalue 20mA
value 4mAaveraging s 1x0,5 10x0,5
adjusted
unitdisplay format
circle ; other
german ; english ; italian
xxx ; xx.x ; x.xxl/s ; l/min ; m³/h ; kg/s ; t/h
current unit
5001
100
20
150

EMDps measuring transducer and sensor unitEd.
Original
GB_tpl001
saas_user +
Date
Date
Replaced by
EMD
S1Cover page
1
Modification
0 76
Appr
Replacement of
8 93
2
4
26.06.2012
2
=
Name
5
1 10/Blatt:
Seite:
Poisentalstraße 3SAAS GmbH
D-01728 Bannewitz / Germany
WUPE001D 20.07.1999
saas_user
Tel.: 035206/2387101728 Bannewitz/ OT PossendorfPoisentalstraße 3
SAAS GmbH
by (abbreviation):
EMDps 73
SAAS GmbH
EMDps measuring transducer and sensor unit
26.06.2012
12.04.2012
edit at:
create at:
responsible person of project:
type:
name of project:
manufacturer (firm):
name of construction:
EMD-ps-MU500 & EMD-ps-S73
Marcel Flöter

Page
Page
EMDps measuring transducer and sensor unitEd.
1
Original
GB_tpl001
saas_user +
Date
Date
Replaced by
EMD
S1Table of content
1
Modification
0 76
Appr
Replacement of
8 93
10
3
4
26.06.2012 SAAS GmbH
2
2
=
Name
5
Edited by
Column X: An automatically generated page was edited
supplementary page field
Table of contentsDatePage description
F06_001
XPage
=EMD+S1/1 saas_userCover page 26.06.2012
=EMD+S1/2 saas_userTable of content 26.06.2012
=EMD+S1/3 saas_user3Mounting plate overview 26.06.2012
=EMD+S1/4 saas_user4Control box overview 26.06.2012
=EMD+S1/5 saas_userControl box legend 26.06.2012
=EMD+S1/6 saas_userCable overview : =EMD+S1-W05 - =EMD+S1-W103 26.06.2012
=EMD+S1/7 saas_userInput power supply 26.06.2012
=EMD+S1/8 saas_userConstant current source 26.06.2012
=EMD+S1/9 saas_userSignal current source, reference voltage generator, touch panel pc 26.06.2012
=EMD+S1/10 saas_user10Connection plan selector 26.06.2012
2
9
8
5
6
7
1

EMDps measuring transducer and sensor unitEd.
2
Original
GB_tpl001
saas_user +
Date
Date
Replaced by
EMD
S1Mounting plate overview
1
Modification
0 76
Appr
Replacement of
8 93
4
4
26.06.2012
2
=
Name
5
3 10/3
Blatt:
Seite:
Poisentalstraße 3SAAS GmbH
D-01728 Bannewitz / Germany
15 m
m
125
mm
30x30 mm
30x30 mm
49 mm
30 m
m
29 mm
301
mm
51 m
m
30x30 mm
711 12 1315
16
1718
-M1
=EMD-A02RS.4707730DR-60-12
1
=EMD-A03GBM.24V
2
=EMD-A01SBA.075-078EGS20008
4
=EMD-A04SAAS.OV
EMD_Power 2005
=EMD-A05SAAS.VerstVerstärker
6
X18
X29

EMDps measuring transducer and sensor unitEd.
3
Original
GB_tpl001
saas_user +
Date
Date
Replaced by
EMD
S1Control box overview
1
Modification
0 76
Appr
Replacement of
8 93
5
4
26.06.2012
2
=
Name
5
4 10/4
Blatt:
Seite:
Poisentalstraße 3SAAS GmbH
D-01728 Bannewitz / Germany
800
mm
60 mm
30 m
m
36 mm
320
mm 100 mm
144
mm
36 m
m
80 mm
-S1KM Standard
400 mm
-Schrank 1-M2 -M3-M4
1
=EMD-A06TPC-20393
TPC-650H-N2AE1
=EMD-M1RIT.3237200SK.3237200
1
=EMD-M1RIT.3237100SK.3237100
2

Page
Page
EMDps measuring transducer and sensor unitEd.
4
Original
GB_tpl001
saas_user +
Date
Date
Replaced by
EMD
S1Control box legend
1
Modification
0 76
Appr
Replacement of
8 93
10
6
4
26.06.2012 SAAS GmbH
5
2
=
Name
5
part number
Enclosure legend F18_001
device tagitem number function textmanufacturerType number
4 A01
5 A04
SAASSAAS.VerstVerstärker6 A05
PXCPXC.2864370MINI MCR-SL-PT100-UI-200-NC7 A07
8 X1
9 X2
PXCPXC.2902829MINI MCR-SL-UI-2I16 A08
2 A03
SAASSAAS.OVEMD_Power 200
RSRS.4707730DR-60-121 A02
GBMGBM.24VPS/1AC/24DC/ 60W
SBASBA.075-078EGS20008

Page
Page
EMDps measuring transducer and sensor unitEd.
5
Original
GB_tpl001
saas_user +
Date
Date
Replaced by
EMD
S1Cable overview : =EMD+S1-W05 - =EMD+S1-W103
1
Modification
0 76
Appr
Replacement of
8 93
10
7
4
26.06.2012 SAAS GmbH
6
2
=
Name
5
F10_001
Cross-section [mm]Cable name Graphical page of cable diagramSource (from)
Cable overviewConductors
usedTarget (to) Length [m]all conductors function textcable type
power supply constant current source3 1-W05 0,5OZ-500 GY-A04-P23-A01 3
1 7x0,16-W06 0,8RG 174/U-A04-P27-A05 1
2 0,75-W07 0,4TRONIC-CY (LiY-CY) GY-F5-A04-P28 2
-F6
2 1-W22 1JZ-500 GY G-A05-X1-A02 3
-F3
3 1-W23 0,7JZ-500 GY G-A04-P24-X2 3
-A02
-F3
connection cable ventilator M13 1-W24 0,5JZ-500 GY G-M1-X1 3
3 1-W27 1JZ-500 GY G-A06-X2 3
-A06-X1-A03
-F4
Datentransfer Verstärker - Touch Panel PC1-W28 1-A06-A05
connection cable supply3 1,5-W29 0,3JZ-500 GY G-X1-S1 3
4 0,75-W100 5LiY-CY GY+PR-X07-X2 4
2 0,75-W101 5LiY-CY GY-F5-X2 2
-F6+PR-X07
receiving signal LE12 0,75-W102 5LiY-CY GY+PR-X08-X2 2
receiving signal LE22 0,75-W103 5LiY-CY GY+PR-X08-X2 2
reference signal from amplifier
excitation signal to transmitting coil
power supply hall sensor
power supply amplifier
power supply touch panel pc
PT100 measurment value
excitation signal LS
RJ45 crossover 8
-SH

EMDps measuring transducer and sensor unitEd.
6
Original
GB_tpl001
saas_user +
Date
Date
Replaced by
EMD
S1Inputpower supply
1
Modification
0 76
Appr
Replacement of
8 93
8
4
26.06.2012
2
=
Name
5
7 10/7
Blatt:
Seite:
Poisentalstraße 3SAAS GmbH
D-01728 Bannewitz / Germany
supply connector power supply 200V DC power supply 12V DC power supply 24V DCcontrol box ventilation
L-A02
121 V / 4,5A
-+
N
+' -'
-S125 A
5x2010A
L1 PE1 N1
L PE N
X1 4
L
-200 GND
N
+200
-A01230V/200V PE
1 2
PE
-M1M1~
1,0BK
1,0BU
1,0GNYE
1,0BK
1,0BU
1,0VT
power supply constant current source3x1
50 cmOZ-500 GY
-W05
321
-W29JZ-500 GY G
30 cm3x1,5
connection cable supply
1 GNYE 2
1
2
-F12,0A X1 5
1
2
-F22,0A
-X1 2
1,0BK
1,0BU
1,0BK
1,0BU
1,0GNYE
-X1 6 1
1,0VT
1,0VT
L
-+
N
+' -'
-A03230/24C
60W
connection cable ventilator M13x1
50 cmJZ-500 GY G
-W24
1 GNYE2
3
12V.1- / 9.1
12V+ / 8.0
200V+ / 8.0
GND / 8.0
200V- / 8.0
12V.2- / 8.0
24V.1- / 10.1
24V.2- / 9.6
24V+ / 10.1

EMDps measuring transducer and sensor unitEd.
7
Original
GB_tpl001
saas_user +
Date
Date
Replaced by
EMD
S1Constant current source
1
Modification
0 76
Appr
Replacement of
8 93
9
4
26.06.2012
2
=
Name
5
8 10/8
Blatt:
Seite:
Poisentalstraße 3SAAS GmbH
D-01728 Bannewitz / Germany
constant current supply
-A04
P23:1 2 3 P24:1 2 3
P25:1 2 3 P28:1 2 3 4
measuring signal hall sensor2x0,7570 cm
TRONIC-CY (LiY-CY) GY-W26
WHBNreference signal from amplifier
1x7x0,1680 cm
RG 174/U-W06
Innenexcitation signal to transmitting coil2x0,7540 cm
TRONIC-CY (LiY-CY) GY-W07
BN
1
2
-F32,0A
power supply hall sensor3x1
70 cmJZ-500 GY G
-W23
1 2 GNYE
P27:1 2
WH
200V+/7.5
GND/7.5
12V.2-/7.6
12V+/7.6
P27.1 / 9.0
P25/2 / 9.0
P25/1 / 9.0 P28/1 / 10.2
P28/4 / 10.2
P27.2 / 9.0
X2/11 / 10.6
P25/SH / 9.0
F3.19.1
200V-/7.5

EMDps measuring transducer and sensor unitEd.
8
Original
GB_tpl001
saas_user +
Date
Date
Replaced by
EMD
S1Signal current source, reference voltage generator, touch panel pc
1
Modification
0 76
Appr
Replacement of
8 93
10
4
26.06.2012
2
=
Name
5
9 10/9
Blatt:
Seite:
Poisentalstraße 3SAAS GmbH
D-01728 Bannewitz / Germany
signal current amplifier,reference voltage generator panel pc in control box door
-A05
X1:1 2
OUT5:1
REF-OUT:1
A:1
B:1
OUT5:2
A:2
B:2
REF-OUT:2
IN2:1
IN2:2
X1
power supply amplifier3x1
100 cmJZ-500 GY G
-W22
1 2
IN1:1
IN1:2
IN1:SH
-A06
X1:1 2
X1
PE
Datentransfer Verstärker - Touch Panel PC100 cm
RJ45 crossover-W28
power supply touch panel pc3x1
100 cmJZ-500 GY G
-W27
1 2 GNYE
12V.1-/7.6
F3.1/8.3
P27.1/8.3
P25/2/8.2
P25/1/8.2
P27.2/8.4
IN2.1/10.0
IN2.2/10.0
P25/SH/8.2
OUT1 / 10.4
OUT2 / 10.4
X2/12 / 10.6
X2/13 / 10.6
24V.2-/7.9
F4.1/10.1
X2:7/10.2
X2/8 / 10.6
X2/9 / 10.6
EMDps measuring transducer and sensor unitEd.
9
Original
GB_tpl001
saas_user +
Date
Date
Replaced by
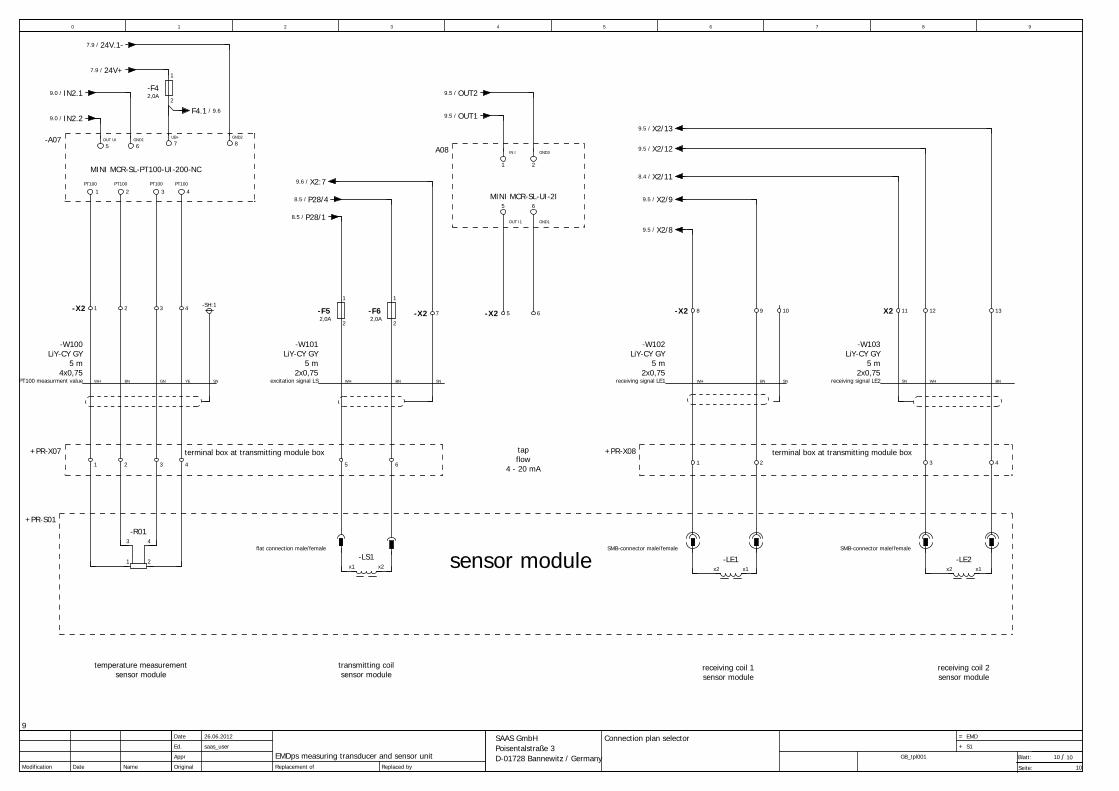
EMD
S1Connection plan selector
1
Modification
0 76
Appr
Replacement of
8 93 4
26.06.2012
2
=
Name
5
10 10/10
Blatt:
Seite:
Poisentalstraße 3SAAS GmbH
D-01728 Bannewitz / Germany
sensor module
tapflow
4 - 20 mA
terminal box at transmitting module box terminal box at transmitting module box
MINI MCR-SL-PT100-UI-200-NC
temperature measurementsensor module
transmitting coilsensor module
receiving coil 1sensor module
receiving coil 2sensor module
+PR-X07
1 2 3 4 5 6
1 2
3 4
-R01
x1 x2
-LS1x2 x1
-LE1x2 x1
-LE2
1 2 3 4
PT100 measurment value4x0,75
5 mLiY-CY GY
-W100
1
2
-F52,0A
1
2
-F62,0A
10 X2 11-X2 8 9 12 13-X2 1 2 3 4 -SH:1
SN
-X2 7
WH BN GN YE
-A07
+PR-X08
receiving signal LE12x0,75
5 mLiY-CY GY
-W102
SNWH BN receiving signal LE22x0,75
5 mLiY-CY GY
-W103
SN WH BN
-X2 5 6
A08
MINI MCR-SL-UI-2I
GND1
6
IN I
1
GND3
2
OUT I1
5
GND2
8UB+
7
1
2
-F42,0A
4PT100
3PT100
1PT100
2PT100
GND1
6OUT UI
5
excitation signal LS2x0,75
5 mLiY-CY GY
-W101
SNWH BN
+PR-S01
SMB-connector male/female SMB-connector male/femaleflat connection male/female
P28/1/8.5
P28/4/8.5
X2/11/8.4
X2/8/9.5
X2/9/9.5
X2/12/9.5
X2/13/9.5
X2:7/9.6
OUT1/9.5
OUT2/9.5
24V.1-/7.9
24V+/7.9
F4.1 / 9.6
IN2.1/9.0
IN2.2/9.0

21
Notes:

22
SAAS – Systemanalyse & Automatisierungsservice GmbH Poisentalstraße 3, D-01278 Bannewitz Tel.: 035206 23871 Fax: 035206 23828 e-mail: [email protected] web: www.saas-online.de
Related Documents