Energies 2014, 7, 7586-7601; doi:10.3390/en7117586 energies ISSN 1996-1073 www.mdpi.com/journal/energies Article Three-Dimensional Modeling of the Thermal Behavior of a Lithium-Ion Battery Module for Hybrid Electric Vehicle Applications Jaeshin Yi, Boram Koo and Chee Burm Shin * Department of Energy Systems Research, Ajou University, Suwon 443-749, Korea; E-Mails: [email protected] (J.Y.); [email protected] (B.K.) * Author to whom correspondence should be addressed; E-Mail: [email protected]; Tel.: +82-31-219-2388; Fax: +82-31-219-1612. External Editor: Sheng Zhang Received: 29 August 2014; in revised form: 6 November 2014 / Accepted: 11 November 2014 / Published: 18 November 2014 Abstract: This paper reports a modeling methodology to predict the effects of operating conditions on the thermal behavior of a lithium-ion battery (LIB) module. The potential and current density distributions on the electrodes of an LIB cell are predicted as a function of discharge time based on the principle of charge conservation. By using the modeling results of the potential and current density distributions of the LIB cell, the non-uniform distribution of the heat generation rate in a single LIB cell within the module is calculated. Based on the heat generation rate in the single LIB cell determined as a function of the position on the electrode and time, a three-dimensional thermal modeling of an LIB module is performed to calculate the three-dimensional velocity, pressure, and temperature distributions within the LIB module as a function of time at various operating conditions. Thermal modeling of an LIB module is validated by the comparison between the experimental measurements and the modeling results. The effect of the cooling condition of the LIB module on the temperature rise of the LIB cells within the module and the uniformity of the distribution of the cell temperatures are analyzed quantitatively based on the modeling results. Keywords: lithium-ion battery; battery module; thermal model; thermal management OPEN ACCESS

energies-07-07586
Dec 25, 2015
lithium ion battery
Welcome message from author
This document is posted to help you gain knowledge. Please leave a comment to let me know what you think about it! Share it to your friends and learn new things together.
Transcript

Energies 2014, 7, 7586-7601; doi:10.3390/en7117586
energies ISSN 1996-1073
www.mdpi.com/journal/energies
Article
Three-Dimensional Modeling of the Thermal Behavior of
a Lithium-Ion Battery Module for Hybrid Electric
Vehicle Applications
Jaeshin Yi, Boram Koo and Chee Burm Shin *
Department of Energy Systems Research, Ajou University, Suwon 443-749, Korea;
E-Mails: [email protected] (J.Y.); [email protected] (B.K.)
* Author to whom correspondence should be addressed; E-Mail: [email protected];
Tel.: +82-31-219-2388; Fax: +82-31-219-1612.
External Editor: Sheng Zhang
Received: 29 August 2014; in revised form: 6 November 2014 / Accepted: 11 November 2014 /
Published: 18 November 2014
Abstract: This paper reports a modeling methodology to predict the effects of operating
conditions on the thermal behavior of a lithium-ion battery (LIB) module. The potential
and current density distributions on the electrodes of an LIB cell are predicted as a function
of discharge time based on the principle of charge conservation. By using the modeling
results of the potential and current density distributions of the LIB cell, the non-uniform
distribution of the heat generation rate in a single LIB cell within the module is calculated.
Based on the heat generation rate in the single LIB cell determined as a function of the
position on the electrode and time, a three-dimensional thermal modeling of an LIB
module is performed to calculate the three-dimensional velocity, pressure, and temperature
distributions within the LIB module as a function of time at various operating conditions.
Thermal modeling of an LIB module is validated by the comparison between the
experimental measurements and the modeling results. The effect of the cooling condition
of the LIB module on the temperature rise of the LIB cells within the module and the
uniformity of the distribution of the cell temperatures are analyzed quantitatively based on
the modeling results.
Keywords: lithium-ion battery; battery module; thermal model; thermal management
OPEN ACCESS

Energies 2014, 7 7587
1. Introduction
The lithium-ion battery (LIB) is a preferred power source for hybrid electric vehicle (HEV)
applications, because it has a relatively higher energy density, longer cycle life, and lower self-discharge
rate as compared to other cell chemistries. As battery temperature greatly affects the performance,
safety and life of the LIB for HEV applications, automakers and battery suppliers are paying increased
attention to the thermal management for an LIB module [1,2]. In a battery module for HEV
applications, depending on the driving conditions and the type of heating and cooling, an uneven
temperature distribution can be created in the module. An uneven temperature distribution in an LIB
module could lead to an electrical imbalance in the battery module and thus lead to lower performance and
shorter battery life. It is, therefore, important to calculate accurately the uneven temperature distribution in
a battery module based on modeling to achieve the optimum performance of the battery module [3].
There have been many previous works on the modeling of LIBs and the reviews of LIB models are
given in [4,5]. Doyle et al. [6] developed a porous electrode model of the lithium polymer battery based
on the concentrated solution theory. Others [7–10] used or modified the model of Doyle et al. [6].
Kwon et al. [11] presented a different approach from the rigorous porous electrode model [6–14] to
predict the discharge behavior of an LIB cell. They developed a two-dimensional model to calculate
the potential and current density distribution on the electrodes of an LIB cell during constant current
discharge by solving the equations derived from the principle of charge conservation. Although they
did not include the potential distribution in the electrolyte phase and the lithium ion transport in their
model, the model maintains the validity even at high discharge rates and it saves significant
computational time as compared to the rigorous porous electrode model. Kim et al. [12–14] carried out
two-dimensional thermal modeling to predict the thermal behaviors of an LIB cell during discharge
and charge on the basis of the potential and current density distributions obtained by following the
same procedure of Kwon et al. [11]. They resolved two-dimensionally the heat generation rate as a
function of position on the electrode of battery cell and state of charge. They found that the
distributions of the heat generation rate become more non-uniform as the discharge/charge currents
increase under constant-current discharge/charge mode. They reported good agreement between the
modeling results and experimental IR (Infrared) measurements. Kim et al. [15] and Yi et al. [16]
extended their thermal model [12,13] to accommodate the dependence of the discharge behavior on the
environmental temperature.
Even though Kim et al. [12–14] reported the non-uniform distribution of the heat generation rate in an
LIB cell during charge and discharge, the heat generation rate in the battery cell was assumed to be
uniformly distributed in the many papers related to the thermal modeling for an LIB module or pack
published until recently [17–22]. In this work, a three-dimensional modeling is carried out to investigate
the effects of operating conditions on the thermal behavior of an LIB module. The non-uniform
distribution of the heat generation rate in an LIB cell within the module composed of eight LIB cells is
calculated by following the modeling approach for a single LIB cell adopted by Kim et al. [12–15].
Thermal modeling of an LIB module is validated by the comparison between the experimental
measurements and modeling results.

Energies 2014, 7 7588
2. Mathematical Model
The battery module consisting of eight prismatic pouch-type LIB cells fabricated by Top Battery Co.
(Ichon, Korea) is modeled in this work. The LIB cell has a nominal capacity of 30 Ah and is composed
of lithium nickel manganese cobalt oxide (NMC) positive electrodes, graphite negative electrodes,
and porous separators impregnated with plasticized electrolyte. In the battery module, two cells are
connected in parallel, composing a single strand, and then four strands are connected in series
(2P 4S configuration).
The modeling procedure of a single LIB cell adopted in this work is similar to that of the
two-dimensional model of Kwon et al. [11]. From the continuity of the current on the electrodes
during discharge, the following Poisson equations for the potentials in the positive and negative
electrodes can be derived:
2
p pV r J in p (1)
2
n nV r J in n (2)
where Vp and Vn are the potentials (V) of the positive and negative electrodes, respectively, rp and rn
are the resistances (Ω) of the positive and negative electrodes, respectively, and J is the current density
(current per unit area (A·m−2)) transferred through the separator from the negative electrode to the
positive electrode. Ωp and Ωn denote the computational domains of the positive and negative
electrodes, respectively. The resistances, rp and rn, are calculated as described in references [11–13].
The relevant boundary conditions for Vp are:
p0
V
n
on
1p (3)
n 0V on 2p (4)
where n / denotes the gradient in the direction of the outward normal to the boundary. The first
boundary condition (3) implies that there is no current flow through the boundary (Γp1) of the electrode
other than the tab. The second boundary condition (4) means that the linear current density through the
tab (Γp2) of length L (cm) has a value of I/L. I is the current (A) during discharge. The boundary
conditions for Vn are:
n 0V
n
on
1n (5)
p
p
1 V I
r n L
on
2p (6)
The first boundary condition (5) implies the same as in the case of Vp. The second boundary
condition (6) means that the potential at the tab of the negative electrode has a fixed value of zero as
the reference potential. The solutions to Equations (1) and (2) subject to the associated boundary
conditions of Equations (3)‒(6) are obtained by using a finite element method. The current density (J)
of Equations (1) and (2) depends on the polarization characteristics of the electrodes. In this work,
the following polarization expression used by Tiedemann and Newman [23,24] is adopted:

Energies 2014, 7 7589
p n( )J Y V V U (7)
where Y and U are the fitting parameters. As suggested by Gu [25], U and Y are expressed as functions
of the depth of discharge (DOD) as follows:
2 3
0 1 2 3a +a (DOD)+a (DOD) +a (DOD)
1
2U (8)
2 3 4 5
4 5 6 7 8 9a +a (DOD)+a (DOD) +a (DOD) +a (DOD) +a (DOD)Y (9)
where a0–a9 are the constants that provide the best fit of the modeling results to the experimental data
at an environmental temperature. The values of the parameters a0–a9 used in Equations (8) and (9) are
given in Table 1. By solving the equations listed above, the distribution of the current density, J, on the
electrodes can be obtained as a function of the position on the electrode and time. Therefore, the DOD
varies along with the position on the electrode and time elapsed during discharge. The distribution of
DOD on the electrode during discharge can be calculated from the distribution of J as follows:
0
0
T
DOD=DOD
t
Jdt
Q
(10)
where DOD0 is the initial value of DOD when the discharge process begins, t is the discharge time (s),
and QT is the theoretical capacity per unit area (Ah·m−2) of the electrodes.
After the distributions of the potential and current density on the electrodes of the battery cell are
obtained, the heat generation rate within the cell, q, can be calculated as a function of the position on
the electrode and time as follows:
2 2
p nococ cell p n
p n
V VdV
q a J V V T a adT r r
(11)
where a is the specific area of the battery (m−1), J is the current density (A·m−2) calculated by
Equation (7), Voc is the open-circuit potential of the cell (V), Vcell is the cell voltage (V) obtained
through the solutions of Equations (1) and (2), ap and an are the specific area of the positive and
negative electrodes (m−1), respectively, and pV and nV are the magnitudes of the gradient vectors
of pV and nV obtained by Equations (1) and (2) (A·m−1), respectively. The detailed definition of
each term on the right-hand side of Equation (11) is described in references [12,13].
Once the heat generation rate within the single LIB cell is determined as a function of the position
on the electrode and time, the information on the heat generation rate of the cell is transferred to the
computational fluid dynamics software to perform the three-dimensional thermal modeling of an LIB
module. The three-dimensional velocity, pressure, and temperature distributions within the LIB
module were calculated as a function of time at various operating conditions by using the
computational fluid dynamics (CFD) software ANSYS Fluent 14. A two equations high-Reynolds
number turbulence model (k–ε) was utilized. Mass flow inlet and pressure outlet boundary conditions
are used for the CFD calculations. The inlet boundary conditions for the flow field are set to 0.005781,
0.01156, 0.01734, and 0.02312 kg·s−1 for the volumetric flow rates of 10, 20, 30, and 40 ft3·min−1,

Energies 2014, 7 7590
respectively. The outlet boundary condition for the flow field is fixed at 1 atm. The inlet and outlet
boundary conditions for the temperature field are the fixed air temperature of 25 °C and the free
boundary condition, respectively. The natural-convection boundary condition is used for the outside
wall of the module in contact with the environmental air and the value of the heat transfer coefficient
used for calculation is 8 W·m−2·°C−1. The finite volume mesh used for calculation has 3,286,950 cells
and 693,921 nodes.
Table 1. Values of the fitting parameters a0–a9 used for calculations.
Parameter Value
a0 (V) 4.167
a1 (V) −1.283
a2 (V) 1.579
a3 (V) −1.115
a4 (Am−2) 47.042
a5 (Am−2) −179.25
a6 (Am−2) 839.61
a7 (Am−2) −1759.67
a8 (Am−2) 1713.13
a9 (Am−2) −635.27
3. Results and Discussion
In order to test the validity of the modeling, the calculated discharge curves based on modeling for
the 30 Ah battery fabricated by Top Battery Co. are compared with the experimental data on Figure 1.
The experiments were performed at room temperature. At various discharge rates from 1 to 3 C,
the experimental discharge curves are in good agreement with the modeling results. After obtaining the
distributions of the potential and current density on the electrodes during discharge, the temperature
distributions of the battery can be calculated as a function of time for various discharge rates by using
the heat generation rate calculated with Equation (11). The temperature distributions based on the
experimental IR image and the modeling at the discharge times of 450, 900, and 1800 s with 2 C rate
and at the discharge times of 300, 600, and 1200 s with 3 C rate are shown in Figure 2a–c, and
Figure 3a–c, respectively. The overall appearances of the temperature distributions from the experiment
and modeling are in good agreement. It is observed that the temperature near the current collecting tab
of the positive electrode is higher than that of the negative electrode. This phenomenon is due to the
fact that the electrical conductivity of the active material of the positive electrode is much lower than
that of the negative electrode, although both of the current flows near the tabs of the positive and
negative electrodes are similarly high as discussed in references [12,13]. The maximum, average, and
minimum temperatures from the experimental measurement for the LIB cell for the discharge rates of
2 and 3 C are compared with those predicted by the modeling in Figure 4a,b, respectively. The maximum,
average, and minimum temperatures from the experiment and modeling are in good agreement for the
whole range of DOD at both of the discharge rates.

Energies 2014, 7 7591
Figure 1. Comparison between experimental and modeling discharge curves at discharge rates
of 1, 2, and 3 C. Open symbols are experimental data and solid lines are modeling results.
Figure 2. Temperature distributions based on the experimental IR (Infrared) image
(upper) and the modeling (lower) for the LIB cell at the discharge times of (a) 450 s,
(b) 900 s, and (c) 1800 s with 2 C rate.
Energies 2014, 7 7592
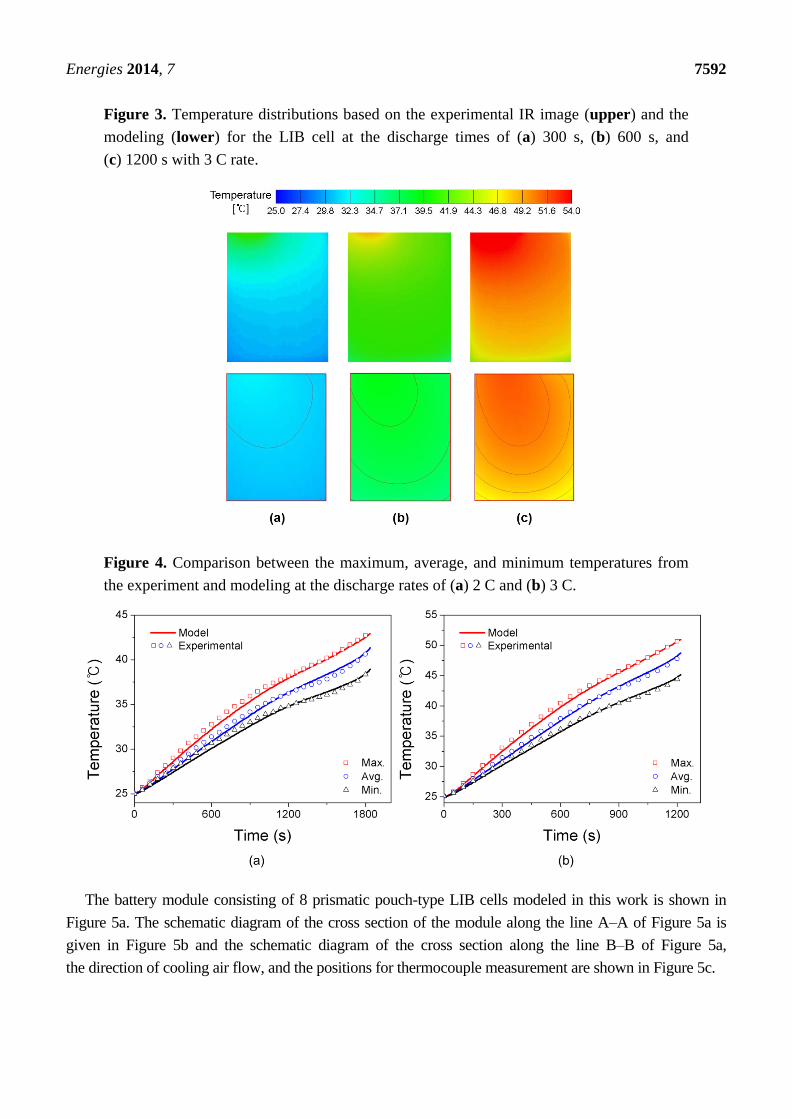
Figure 3. Temperature distributions based on the experimental IR image (upper) and the
modeling (lower) for the LIB cell at the discharge times of (a) 300 s, (b) 600 s, and
(c) 1200 s with 3 C rate.
Figure 4. Comparison between the maximum, average, and minimum temperatures from
the experiment and modeling at the discharge rates of (a) 2 C and (b) 3 C.
The battery module consisting of 8 prismatic pouch-type LIB cells modeled in this work is shown in
Figure 5a. The schematic diagram of the cross section of the module along the line A–A of Figure 5a is
given in Figure 5b and the schematic diagram of the cross section along the line B–B of Figure 5a,
the direction of cooling air flow, and the positions for thermocouple measurement are shown in Figure 5c.

Energies 2014, 7 7593
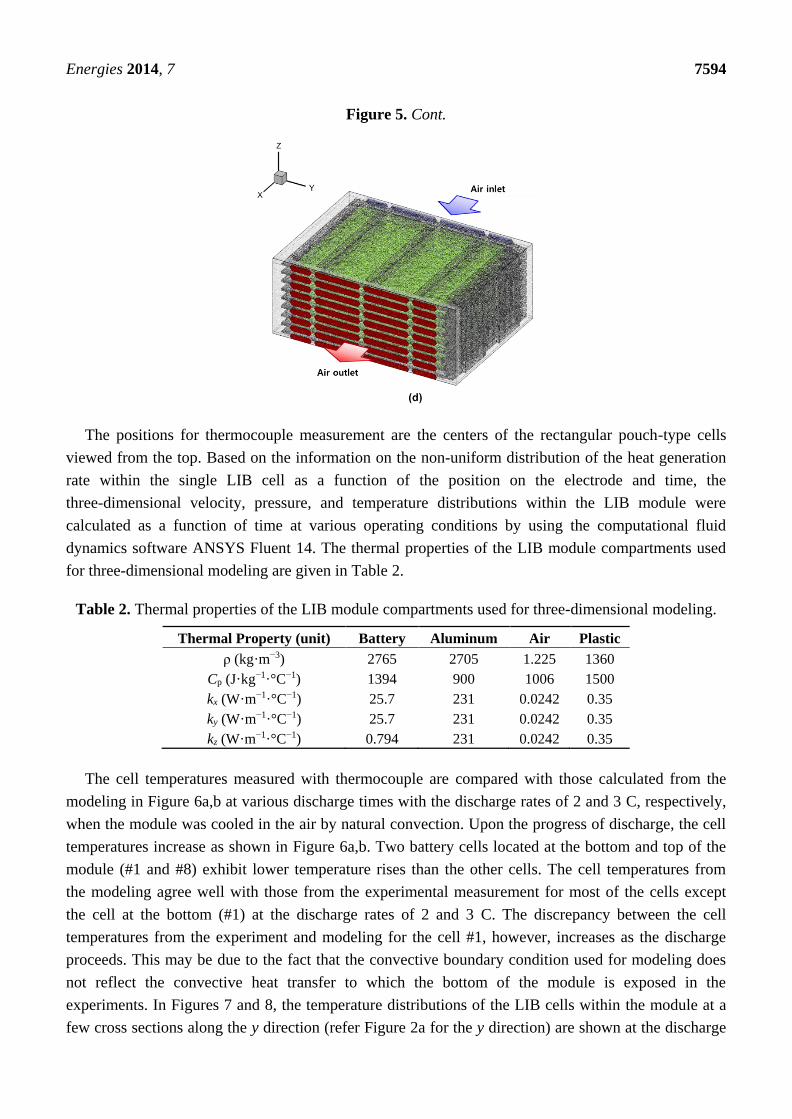
Figure 5. (a) Photograph of the LIB module; (b) Schematic diagram of the cross section of
the module along the line A–A of (a); (c) Schematic diagram of the cross section along the
line B–B of (a), the direction of cooling air flow, and the positions for thermocouple
measurement; and (d) Finite volume mesh used for CFD (computational fluid dynamics)
calculations and the direction of cooling air flow.
Energies 2014, 7 7594
Figure 5. Cont.
The positions for thermocouple measurement are the centers of the rectangular pouch-type cells
viewed from the top. Based on the information on the non-uniform distribution of the heat generation
rate within the single LIB cell as a function of the position on the electrode and time, the
three-dimensional velocity, pressure, and temperature distributions within the LIB module were
calculated as a function of time at various operating conditions by using the computational fluid
dynamics software ANSYS Fluent 14. The thermal properties of the LIB module compartments used
for three-dimensional modeling are given in Table 2.
Table 2. Thermal properties of the LIB module compartments used for three-dimensional modeling.
Thermal Property (unit) Battery Aluminum Air Plastic
ρ (kg·m−3) 2765 2705 1.225 1360
Cp (J·kg−1·°C−1) 1394 900 1006 1500
kx (W·m−1·°C−1) 25.7 231 0.0242 0.35
ky (W·m−1·°C−1) 25.7 231 0.0242 0.35
kz (W·m−1·°C−1) 0.794 231 0.0242 0.35
The cell temperatures measured with thermocouple are compared with those calculated from the
modeling in Figure 6a,b at various discharge times with the discharge rates of 2 and 3 C, respectively,
when the module was cooled in the air by natural convection. Upon the progress of discharge, the cell
temperatures increase as shown in Figure 6a,b. Two battery cells located at the bottom and top of the
module (#1 and #8) exhibit lower temperature rises than the other cells. The cell temperatures from
the modeling agree well with those from the experimental measurement for most of the cells except
the cell at the bottom (#1) at the discharge rates of 2 and 3 C. The discrepancy between the cell
temperatures from the experiment and modeling for the cell #1, however, increases as the discharge
proceeds. This may be due to the fact that the convective boundary condition used for modeling does
not reflect the convective heat transfer to which the bottom of the module is exposed in the
experiments. In Figures 7 and 8, the temperature distributions of the LIB cells within the module at a
few cross sections along the y direction (refer Figure 2a for the y direction) are shown at the discharge

Energies 2014, 7 7595
times of 1680 s with 2 C rate and 960 s with 2 C rate, respectively, for natural convection cooling.
As shown in Figure 6a,b, the temperatures of the two cells located at the bottom and top of the module
are lower than those of the other cells. Along the y direction, the cell temperatures at the cross section
close to the left wall of the module shown in Figure 5b are lower than those at the cross section close
to the right wall. That seems to be due to the relatively shorter path for heat transfer from the
atmospheric air surrounding the module to the cross section close to the left wall as compared to that
close to the right wall as can be seen in Figure 5b.
Figure 6. Comparison between the cell temperatures within the module from the
experiment and modeling at various discharge times with the discharge rates of (a) 2 C and
(b) 3 C for natural convection cooling.
Figure 7. Temperature distributions of the LIB cells within the module at a few cross
sections along the y direction at the discharge time of 1680 s with the discharge rate of 2 C
for natural convection cooling.

Energies 2014, 7 7596
Figure 8. Temperature distributions of the LIB cells within the module at a few cross
sections along the y direction at the discharge time of 960 s with the discharge rate of 3 C
for natural convection cooling.
In Figure 9a,b, the cell temperatures measured with thermocouple are compared with those
calculated from the modeling at different discharge times with the discharge rates of 2 and 3 C,
respectively, for various cooling conditions. As compared to the temperature rise for the case of natural
convection cooling, it was shown that the temperature rise can be lowered more or less 10 °C near the
end of discharge process with the discharge rates of 2 and 3 C by increasing the volumetric flow rate of
cooling air up to 40 ft3·min−1, when the module was cooled by forced convection. The temperature
rises of the two battery cells located at the bottom and top of the module (#1 and #8) are lower than
those of the other cells even for the forced convection cooling. That effect, however, diminishes as the
volumetric flow rate of cooling air increases, because the effect of forced convection becomes more
dominant at a high volumetric flow rate of cooling air than that of natural convection. The cell
temperatures from the modeling agree well with those from the experimental measurement at the
discharge rates of 2 and 3 C. The discrepancy between the cell temperatures from the experiment and
modeling for the cell #1 that appeared for the natural convection cooling disappears for the forced
convection cooling, because the relevance of the convective boundary condition used for modeling at
the bottom of the module becomes less important when the effect of forced convection is more
dominant at a high volumetric flow rate of cooling air than that of natural convection.
In Figures 10 and 11, the temperature distributions of the LIB cells within the module at a few cross
sections along the y direction are shown at the discharge times of 1680 s with 2 C rate and 960 s with
2 C rate, respectively, for various cooling conditions of forced convection. As shown in Figure 9a,b,
the temperatures of the two cells located at the bottom and top of the module are lower than those of
the other cells, but that effect becomes less significant as the volumetric flow rate of cooling air
increases. Along the y direction, the cell temperatures at the cross section close to the left wall of the
module are lower than those at the cross section close to the right wall. That effect also becomes less
significant as the volumetric flow rate of cooling air increases, because the effect of forced convection

Energies 2014, 7 7597
is more dominant at a high volumetric flow rate of cooling air than that of natural convection through
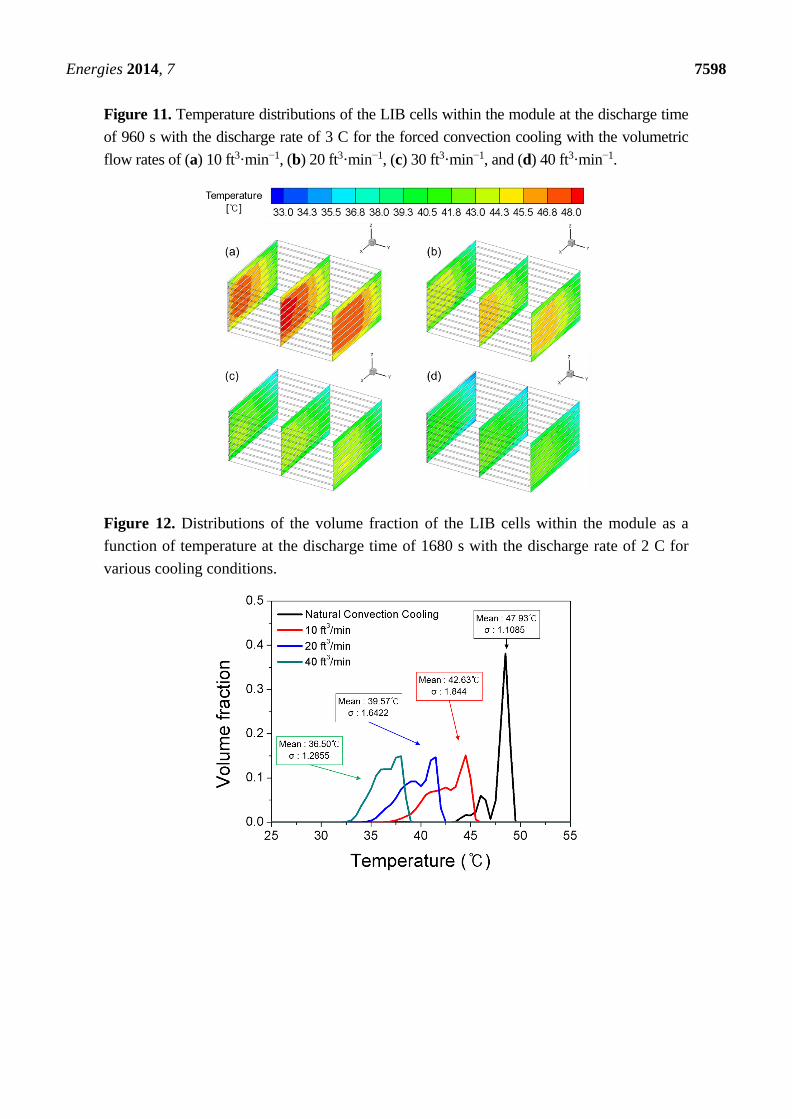
the side walls of the module. From the results and discussions on Figures 9–11, we can deduce that the
uniformity of the distribution of the cell temperatures within the module increase as the volumetric
flow rate of cooling air for forced convection increases. To quantify this effect, the distributions of the
volume fraction of the LIB cells within the module as a function of temperature at the discharge times
of 1680 s with 2 C rate and 960 s with 2 C rate in Figures 12 and 13, respectively, for various cooling
conditions. As shown in Figures 12 and 13, the mean temperatures of the cells within the module
decrease and the distributions of the cell temperatures become less dispersed by increasing the volumetric
flow rate of cooling air. From the results presented in Figures 12 and 13, we can analyze quantitatively the
effect of cooling condition on the temperature rise of the LIB cells within the module and the uniformity of
the distribution of the cell temperatures. This analysis is important to the optimal design of the thermal
management system for HEV applications, because the LIB temperature and the distribution uniformity of
the cell temperature greatly affect the performance, safety and life of the LIB module.
Figure 9. Comparison between the cell temperatures within the module from the
experiment and modeling at different discharge times with the discharge rates of (a) 2 C
and (b) 3 C for various cooling conditions.
Figure 10. Temperature distributions of the LIB cells within the module at the discharge
time of 1680 s with the discharge rate of 2 C for the forced convection cooling with the
volumetric flow rates of (a) 10 ft3·min−1, (b) 20 ft3·min−1, (c) 30 ft3·min−1, and (d) 40 ft3·min−1.
Energies 2014, 7 7598
Figure 11. Temperature distributions of the LIB cells within the module at the discharge time
of 960 s with the discharge rate of 3 C for the forced convection cooling with the volumetric
flow rates of (a) 10 ft3·min−1, (b) 20 ft3·min−1, (c) 30 ft3·min−1, and (d) 40 ft3·min−1.
Figure 12. Distributions of the volume fraction of the LIB cells within the module as a
function of temperature at the discharge time of 1680 s with the discharge rate of 2 C for
various cooling conditions.

Energies 2014, 7 7599
Figure 13. Distributions of the volume fraction of the LIB cells within the module as a
function of temperature at the discharge time of 960 s with the discharge rate of 3 C for
various cooling conditions.
4. Conclusions
A modeling procedure is developed to study the effects of operating conditions on the thermal behavior
of an LIB module. The potential and current density distribution on the electrodes of an LIB cell are
predicted as a function of discharge time based on the principle of charge conservation. By using the
modeling results of the potential and current density distributions of the LIB cell, the non-uniform
distribution of the heat generation rate in a single LIB cell within the module is calculated.
The temperature distributions from the modeling of a single LIB cell are in good agreement with those
from the experimental IR measurement at the discharge rates of 2 and 3 C. Based on the heat
generation rate within the single LIB cell determined as a function of the position on the electrode and
time, a three-dimensional thermal modeling of an LIB module is performed to calculate the
three-dimensional velocity, pressure, and temperature distributions within the LIB module as a
function of time at various operating conditions. Thermal modeling of an LIB module is validated by
the comparison between the experimental measurements with thermocouple and the modeling results
during discharge with the discharge rates of 2 and 3 C. The thermal modeling results for the case of
natural convection cooling of the module are compared to those for the case of forced convection
cooling at various volumetric flow rate of cooling air to investigate quantitatively the effect of the
cooling condition of the LIB module on the temperature rise of the LIB cells within the module and the
uniformity of the distribution of the cell temperatures. The modeling methodology presented in this
work may contribute to the optimal design of the thermal management system for HEV applications,
because the LIB temperature and the uniformity of the distribution of the cell temperatures within the
module are critical to the performance, safety and life of the LIB module.

Energies 2014, 7 7600
Acknowledgments
This research was financially supported by the “R&D Infrastructure for Green Electric Vehicle
(RE-EV)” through the Ministry of Trade Industry & Energy (MOTIE) and Korea Institute for
Advancement of Technology (KIAT).
Author Contributions
Jaeshin Yi prepared a draft of this manuscript, carried out the experimental measurement, and
performed the model validation. Boram Koo carried out the modeling and simulation. The whole
project was supervised by Chee Burm Shin. All authors revised and approved the manuscript.
Conflicts of Interest
The authors declare no conflict of interest.
References
1. Bandhauer, T.M.; Garimella, S.; Fuller, T.F. A critical review of thermal issues in lithium-ion
batteries. J. Electrochem. Soc. 2011, 158, R1–R25.
2. Williard, N.; He, W.; Hendricks, C.; Pecht, M. Lessons learned from the 787 dreamliner issue on
lithium-ion battery reliability. Energies 2013, 6, 4682–4696.
3. Cedar, G.; Doyle, M.; Arora, P.; Fuentes, Y. Computational modeling and simulation for
rechargeable batteries. MRS Bull. 2002, 27, 619–623.
4. Gomadam, P.M.; Weidner, J.W.; Dougal, R.A.; White, R.E. Mathematical modeling of lithium-ion
and nickel battery systems. J. Power Sources 2002, 110, 267–284.
5. Ramadesigan, V.; Northrop, P.W.C.; De, S.; Santhanagopalan, S.; Braatz, R.D.; Subramanian, V.R.
Modeling and simulation of lithium-ion batteries from a systems engineering perspective.
J. Electrochem. Soc. 2012, 159, R31–R45.
6. Doyle, M.; Fuller, T.F.; Newman, J. Modeling of galvanostatic charge and discharge of the
lithium/polymer/insertion cell. J. Electrochem. Soc. 1993, 140, 1526–1533.
7. Gu, W.B.; Wang, C.Y. Thermal-electrochemical modeling of battery systems. J. Electrochem. Soc.
2000, 147, 2910–2922.
8. Doyle, M.; Fuentes, Y. Computer simulations of a lithium-ionp battery and implications for higher
capacity next-generation battery designs. J. Electrochem. Soc. 2003, 150, A706–A713.
9. Srinivasan, V.; Wang, C.Y. Analysis of electrochemical and thermal behavior of Li-ion Cells.
J. Electrochem. Soc. 2003, 150, A98–A106.
10. Ramadass, P.; Haran, B.; Gomadam, P.M.; White, R.E.; Popov, B.N. Development of first
principles capacity fade model for Li-ion cells. J. Electrochem. Soc. 2004, 151, A196–A203.
11. Kwon, K.H.; Shin, C.B.; Kang, T.H.; Kim, C.S. A Two-dimensional modeling of a lithium-polymer
battery. J. Power Sources 2006, 163, 151–157.
12. Kim, U.S.; Shin, C.B.; Kim, C.S. Effect of electrode configuration on the thermal behavior of a
lithium-polymer battery. J. Power Sources 2008, 180, 909–916.

Energies 2014, 7 7601
13. Kim, U.S.; Shin, C.B.; Kim, C.S. Modeling for the scale-up of a lithium-ion polymer battery.
J. Power Sources 2009, 189, 841–846.
14. Kim, U.S.; Yi, J.; Shin, C.B.; Han, T.; Park, S. Modeling for the thermal behavior of a lithium-ion
battery during charge. J. Power Sources 2011, 196, 5115–5121.
15. Kim, U.S.; Yi, J.; Shin, C.B.; Han, T.; Park, S. Modeling the dependence of the discharge
behavior of a lithium-ion battery on the environmental temperature. J. Electrochem. Soc. 2011,
158, A611–A618.
16. Yi, J.; Kim, U.S.; Shin, C.B.; Han, T.; Park, S. Modeling the temperature dependence of the
discharge behavior of a lithium-ion battery in low environmental temperature. J. Power Sources
2013, 244, 143–148.
17. Chen, S.C.; Wan, C.C.; Wang, Y.Y. Thermal analysis of lithium-ion batteries. J. Power Sources
2005, 140, 111–124.
18. Spotnitz, R.M.; Weaver, J.; Yeduvaka, G.; Doughty, D.H.; Roth, E.P. Simulation of abuse
tolerance of lithium-ion battery packs. J. Power Sources 2013, 244, 143–148.
19. Zhu, C.; Li, X.; Song, L.; Xiang, L. Development of a theoretically based thermal model for
lithium ion battery pack. J. Power Sources 2013, 223, 155–164.
20. Xu, X.M.; He, R. Research on the heat dissipation performance of battery pack based on forced
air cooling. J. Power Sources 2013, 240, 33–41.
21. Fathabadi, H. A novel design including cooling media for lithium-ion batteries pack used in
hybrid and electric vehicles. J. Power Sources 2014, 245, 495–500.
22. Sabbah, R.; Kizilel, R.; Selman, J.R.; Al-Hallaj, S. Active (air-cooled) vs. passive (phase change
material) thermal management of high power lithium-ion packs: Limitation of temperature rise
and uniformity of temperature distribution. J. Power Sources 2008, 182, 630–638.
23. Tiedemann, W.; Newman, J. Current and potential distribution in lead-acid battery plates.
In Battery Design and Optimization; Gross, S., Ed.; The Electrochemical Society, Inc.:
Pennington, NJ, USA, 1979; pp. 39–49.
24. Newman, J.; Tiedemann, W. Potential and current distribution in electrochemical cells
interpretation of the half-cell voltage measurements as a function of reference electrode location.
J. Electrochem. Soc. 1993, 140, 1961–1968.
25. Gu, H. Mathematical analysis of a Zn / NiOOH cell. J. Electrochem. Soc. 1983, 130, 1459–1464.
© 2014 by the authors; licensee MDPI, Basel, Switzerland. This article is an open access article
distributed under the terms and conditions of the Creative Commons Attribution license
(http://creativecommons.org/licenses/by/4.0/).
Related Documents