Journal of Experimental Botany, Vol. 60, No. 1, pp. 19–42, 2009 doi:10.1093/jxb/ern179 DARWIN REVIEW Energetics and the evolution of carnivorous plants—Darwin’s ‘most wonderful plants in the world’ Aaron M. Ellison 1, * and Nicholas J. Gotelli 2 1 Harvard Forest, Harvard University, 324 North Main Street, Petersham, MA 01366, USA 2 Department of Biology, University of Vermont, 120 Marsh Life Sciences Building, Burlington, VT 05405, USA Received 6 May 2008; Revised 5 June 2008; Accepted 16 June 2008 Abstract Carnivory has evolved independently at least six times in five angiosperm orders. In spite of these independent origins, there is a remarkable morphological convergence of carnivorous plant traps and physiological convergence of mechanisms for digesting and assimilating prey. These convergent traits have made carnivorous plants model systems for addressing questions in plant molecular genetics, physiology, and evolutionary ecology. New data show that carnivorous plant genera with morphologically complex traps have higher relative rates of gene substitutions than do those with simple sticky traps. This observation suggests two alternative mechanisms for the evolution and diversification of carnivorous plant lineages. The ‘energetics hypothesis’ posits rapid morphological evolution resulting from a few changes in regulatory genes responsible for meeting the high energetic demands of active traps. The ‘predictable prey capture hypothesis’ further posits that complex traps yield more predictable and frequent prey captures. To evaluate these hypotheses, available data on the tempo and mode of carnivorous plant evolution were reviewed; patterns of prey capture by carnivorous plants were analysed; and the energetic costs and benefits of botanical carnivory were re-evaluated. Collectively, the data are more supportive of the energetics hypothesis than the predictable prey capture hypothesis. The energetics hypothesis is consistent with a phenome- nological cost–benefit model for the evolution of botanical carnivory, and also accounts for data suggesting that carnivorous plants have leaf construction costs and scaling relationships among leaf traits that are substantially different from those of non-carnivorous plants. Key words: Carnivorous plants, competition, construction costs, cost–benefit model, Darwin, energetics, niche overlap, phylogeny, prey capture, universal spectrum of leaf traits. Introduction ‘This plant, commonly called Venus’ fly-trap, from the rapidity and force of its movements, is one of the most wonderful in the world.’ (C. Darwin, Insectivorous plants, p. 231) 1 Carnivorous plants have evolved multiple times among the angiosperms (Fig. 1), and the degree of morphological and physiological convergence across carnivorous taxa is remarkable. Molecular sequence data have revealed the * To whom correspondence should be addressed. E-mail: [email protected] Abbreviations: A mass , mass-based photosynthetic rate in nmol CO 2 g 1 s 1 ; ANOVA, analysis of variance; atpB, chloroplast gene encoding the b chain of membrane-bound ATP synthase; C-value, amount of DNA in a haploid nucleus [in millions of base pairs (Mbp)]; coxI, mitochondrial gene encoding subunit 1 of cyctochrome c oxidase; ITS, internal transcribed spacer; J Chao , the Chao–Jaccard abundance-weighted index of similarity; nrITS, nuclear ribosomal ITS; matK, chloroplast gene believed to encode a maturase, it is located within the trnK intron; PIE, probability of interspecific encounter, used here as a measure of specialization on prey by carnivorous plants; PRT1, nuclear gene encoding peptide transferase 1; rbcL, chloroplast gene encoding ribulose-bisphosphate carboxylase; rps16, a non-coding chloroplast intron; RRTree, software for comparing sequence divergence rates among related lineages (by extension, it has also come to mean the statistical relative-rate test between groups of sequences on a phylogenetic tree); trnK, a non-coding chloroplast intron; it includes the matK exon; trnF and trnL, two other non-coding chloroplast introns; trnL-F, intergenic spacer between the trnL and trnF introns. 1 All quotations from Darwin’s Insectivorous plants are from the second (1898) edition. ª The Author [2008]. Published by Oxford University Press [on behalf of the Society for Experimental Biology]. All rights reserved. For Permissions, please e-mail: [email protected] at Dana Medical Library, University of Vermont on 29 January 2010 http://jxb.oxfordjournals.org Downloaded from

Welcome message from author
This document is posted to help you gain knowledge. Please leave a comment to let me know what you think about it! Share it to your friends and learn new things together.
Transcript

Journal of Experimental Botany, Vol. 60, No. 1, pp. 19–42, 2009doi:10.1093/jxb/ern179
DARWIN REVIEW
Energetics and the evolution of carnivorous plants—Darwin’s‘most wonderful plants in the world’
Aaron M. Ellison1,* and Nicholas J. Gotelli2
1 Harvard Forest, Harvard University, 324 North Main Street, Petersham, MA 01366, USA2 Department of Biology, University of Vermont, 120 Marsh Life Sciences Building, Burlington, VT 05405, USA
Received 6 May 2008; Revised 5 June 2008; Accepted 16 June 2008
Abstract
Carnivory has evolved independently at least six times in five angiosperm orders. In spite of these independent
origins, there is a remarkable morphological convergence of carnivorous plant traps and physiological convergence
of mechanisms for digesting and assimilating prey. These convergent traits have made carnivorous plants model
systems for addressing questions in plant molecular genetics, physiology, and evolutionary ecology. New data show
that carnivorous plant genera with morphologically complex traps have higher relative rates of gene substitutions
than do those with simple sticky traps. This observation suggests two alternative mechanisms for the evolution and
diversification of carnivorous plant lineages. The ‘energetics hypothesis’ posits rapid morphological evolutionresulting from a few changes in regulatory genes responsible for meeting the high energetic demands of active
traps. The ‘predictable prey capture hypothesis’ further posits that complex traps yield more predictable and
frequent prey captures. To evaluate these hypotheses, available data on the tempo and mode of carnivorous plant
evolution were reviewed; patterns of prey capture by carnivorous plants were analysed; and the energetic costs and
benefits of botanical carnivory were re-evaluated. Collectively, the data are more supportive of the energetics
hypothesis than the predictable prey capture hypothesis. The energetics hypothesis is consistent with a phenome-
nological cost–benefit model for the evolution of botanical carnivory, and also accounts for data suggesting that
carnivorous plants have leaf construction costs and scaling relationships among leaf traits that are substantiallydifferent from those of non-carnivorous plants.
Key words: Carnivorous plants, competition, construction costs, cost–benefit model, Darwin, energetics, niche overlap,phylogeny, prey capture, universal spectrum of leaf traits.
Introduction
‘This plant, commonly called Venus’ fly-trap, from the
rapidity and force of its movements, is one of the most
wonderful in the world.’
(C. Darwin, Insectivorous plants, p. 231)1
Carnivorous plants have evolved multiple times among
the angiosperms (Fig. 1), and the degree of morphologicaland physiological convergence across carnivorous taxa is
remarkable. Molecular sequence data have revealed the
* To whom correspondence should be addressed. E-mail: [email protected]: Amass, mass-based photosynthetic rate in nmol CO2 g�1 s�1; ANOVA, analysis of variance; atpB, chloroplast gene encoding the b chain ofmembrane-bound ATP synthase; C-value, amount of DNA in a haploid nucleus [in millions of base pairs (Mbp)]; coxI, mitochondrial gene encoding subunit 1 ofcyctochrome c oxidase; ITS, internal transcribed spacer; JChao, the Chao–Jaccard abundance-weighted index of similarity; nrITS, nuclear ribosomal ITS; matK,chloroplast gene believed to encode a maturase, it is located within the trnK intron; PIE, probability of interspecific encounter, used here as a measure ofspecialization on prey by carnivorous plants; PRT1, nuclear gene encoding peptide transferase 1; rbcL, chloroplast gene encoding ribulose-bisphosphatecarboxylase; rps16, a non-coding chloroplast intron; RRTree, software for comparing sequence divergence rates among related lineages (by extension, it has alsocome to mean the statistical relative-rate test between groups of sequences on a phylogenetic tree); trnK, a non-coding chloroplast intron; it includes the matKexon; trnF and trnL, two other non-coding chloroplast introns; trnL-F, intergenic spacer between the trnL and trnF introns.1 All quotations from Darwin’s Insectivorous plants are from the second (1898) edition.ª The Author [2008]. Published by Oxford University Press [on behalf of the Society for Experimental Biology]. All rights reserved.For Permissions, please e-mail: [email protected]
at Dana Medical Library, University of Vermont on 29 January 2010 http://jxb.oxfordjournals.orgDownloaded from
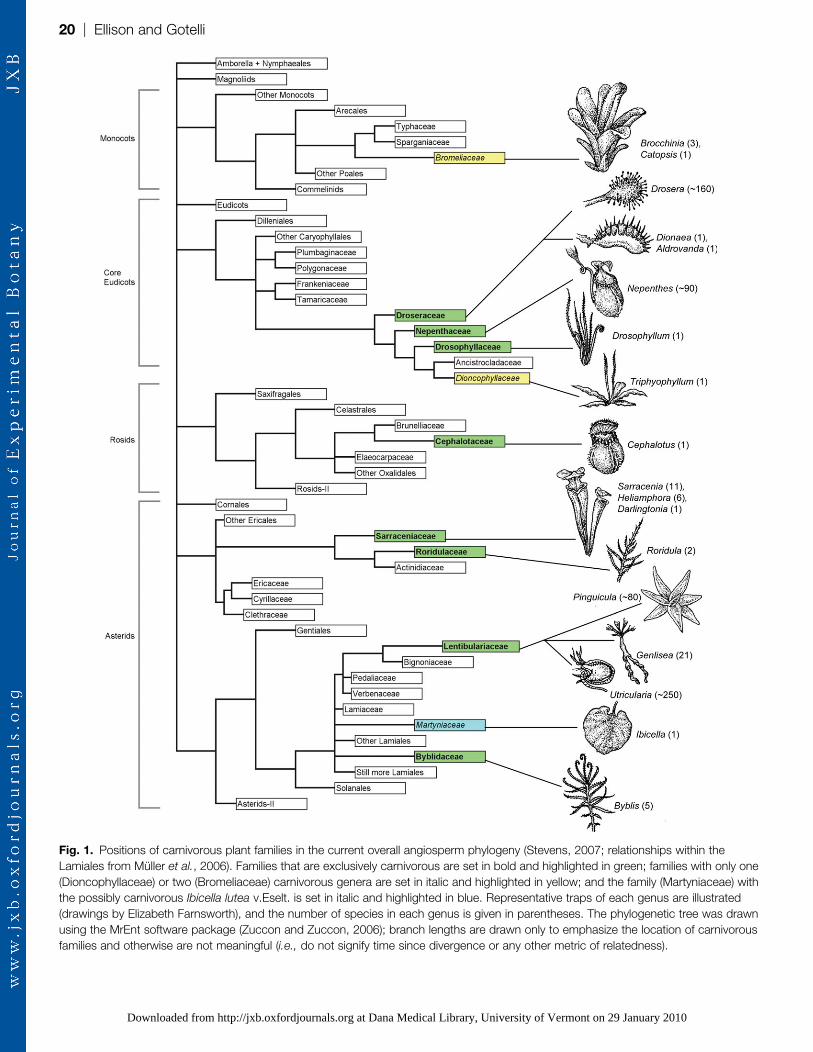
Fig. 1. Positions of carnivorous plant families in the current overall angiosperm phylogeny (Stevens, 2007; relationships within the
Lamiales from Muller et al., 2006). Families that are exclusively carnivorous are set in bold and highlighted in green; families with only one
(Dioncophyllaceae) or two (Bromeliaceae) carnivorous genera are set in italic and highlighted in yellow; and the family (Martyniaceae) with
the possibly carnivorous Ibicella lutea v.Eselt. is set in italic and highlighted in blue. Representative traps of each genus are illustrated
(drawings by Elizabeth Farnsworth), and the number of species in each genus is given in parentheses. The phylogenetic tree was drawn
using the MrEnt software package (Zuccon and Zuccon, 2006); branch lengths are drawn only to emphasize the location of carnivorous
families and otherwise are not meaningful (i.e., do not signify time since divergence or any other metric of relatedness).
20 | Ellison and Gotelli
at Dana Medical Library, University of Vermont on 29 January 2010 http://jxb.oxfordjournals.orgDownloaded from

phylogenetic history of the angiosperms (Stevens, 2007) and
have yielded a better understanding of the patterns of
evolution of carnivorous plants. The availability of reliable
phylogenies, new observations and experiments, cost–bene-
fit models (Givnish et al., 1984; Laakkonen et al., 2006),
and contemporary statistical methods have allowed carniv-
orous plants to emerge as model systems that can be used to
address a wide range of questions arising from plantmolecular genetics to physiology and evolutionary ecology
(Ellison and Gotelli, 2001; Ellison et al., 2003).
Charles Darwin laid the foundation for modern research
on carnivorous plants. In Insectivorous plants, Darwin
(1875) applied his then relatively new conception of
homology to illustrate evolutionary and functional conver-
gence across seemingly unrelated taxa. He provided the first
detailed descriptions of the structures by which eight generaof plants could entrap insects. With careful observations
and clever experiments, Darwin determined for the first
time that these plants directly dissolved animal protein
using enzymes whose action was similar to pepsin and other
proteases (see also Hepburn et al., 1919, 1927). He further
showed that dissolved nutrients were directly absorbed by
carnivorous plants and that captured prey contributes
significantly to plant growth (Darwin, 1875).Drawing on >125 years of subsequent research, this
review surveys recent progress in three areas of inquiry
that Darwin initiated in Insectivorous plants: (i) the tempo
and mode of carnivorous plant evolution; (ii) patterns and
processes of prey capture; and (iii) the energetic costs and
benefits of botanical carnivory. These three research fronts
are unified by stable phylogenetic placement of carnivorous
taxa, new data on gene evolution in carnivorous plants(Jobson and Albert, 2002; Muller et al., 2004), and the
refinement by Laakkonen et al. (2006) of the cost–benefit
model for the evolution of botanical carnivory originally
formulated by Givnish et al. (1984).
Current understanding of the phylogenetic placement of
carnivorous plants re-affirms the occurrence of convergence
in trapping mechanisms. Genomic data suggest biochemi-
cal, physiological, and ecological mechanisms that couldhave led to the rapid diversification of at least some
carnivorous plant lineages. New analyses of published data
on prey capture permit the evaluation of the degree of
specialization among carnivorous plant genera and link
evolutionarily convergent traits with the ecologically impor-
tant process of predation. The use of carbon to measure
both costs and benefits of carnivory allows carnivorous
plants to be placed into the ‘universal spectrum of leaftraits’ (Wright et al., 2004, 2005) that reflects fundamental
trade-offs associated with the allocation of carbon to
structural tissues and photosynthesis (Shipley et al., 2006).
The tempo and mode of carnivorous plantevolution
‘By comparing the structure of the leaves, their degree of
complication, and their rudimentary parts in the six genera
[Drosophyllum, Roridula, Byblis, Drosera, Dionaea, and
Aldrovanda], we are led to infer that their common parent
form partook of the characters of Drosophyllum, Roridula,
and Byblis.’
(Insectivorous plants, p. 289)
‘It stands accordingly to reason that the carnivorous plants
are quite as old as angiospermy, as an independent angiosper-
mous group bound with still older groups eventually beyond
the limits of angiospermy.’
(Croizat, 1960: 129)
In The origin of species, Darwin (1859) asserted theimportance of homology—the similarity of traits resulting
from shared ancestry—for understanding evolutionary rela-
tionships. Although the importance of homologous traits
(including sequences of DNA, genes, and proteins) in
reconstructing phylogenies is widely recognized, actually
identifying them remains a challenge. Nowhere is this
challenge more evident than in the history of the placement
of carnivorous plants in angiosperm phylogenies (Juniperet al., 1989). A proper interpretation of patterns of prey
capture, gene sequence data, and the evolution of carnivory
all rely on firm knowledge of the phylogenetic placement of
carnivorous plants and on stable nomenclature. Therefore,
this review begins with a survey of current knowledge of
carnivorous plant systematics, focused on how recent
syntheses of molecular and morphological data illuminate
the two most disparate hypotheses for the evolution anddiversification of carnivorous plants: Darwin’s (1875) hy-
pothesis that the specialization and evolutionary novelty of
carnivorous plants indicated convergence in independent
lineages, and Croizat’s (1960) hypothesis that carnivory
evolved once near the base of the angiosperm lineage.
Darwin asserted that all of the species with sticky-leaf (or
‘flypaper’) traps in the genera Drosera, Byblis, Roridula, and
Drosophyllum, along with the snap-trapping Venus’ fly-trap (Dionaea muscipula Ellis) and the water-wheel plant
(Aldrovanda vesiculosa L.) were closely related (19th century
botanists placed all six genera in the Droseraceae, the
sundew family). In Insectivorous plants, he discussed in
detail the apparent homology of the sessile glands that they
use to digest prey. He also asserted that neither the
butterworts (Pinguicula) (or the other Lentibulariaceae:
Genlisea and Utricularia) nor the Asian pitcher plants(Nepenthes) were ‘at all related to the Droseraceae’ (In-
sectivorous plants, p. 292). Darwin appears to have had little
familiarity with the American pitcher plants (Sarracenia,
Darlingtonia, and Heliamphora), nor did he discuss the
Australian pitcher plant Cephalotus follicularis Labill.
(Cephalotaceae),2 but it is safe to say that he recognized
at least three lineages of carnivorous plants: his
2 Sarracenia is mentioned in passing only on the penultimate page ofInsectivorous plants. In a letter to W Thiselton-Dyer (letter 724 in F Darwin,1903), he refers to Asa Gray’s examination of Sarracenia. In a letter to JDHooker (letter 726 in F Darwin, 1903), he writes of hoping that Hooker willresume work on Cephalotus and Sarracenia and provide comparative data forDarwin’s ongoing studies of Utricularia.
Carnivorous plants since Darwin | 21
at Dana Medical Library, University of Vermont on 29 January 2010 http://jxb.oxfordjournals.orgDownloaded from
‘Droseraceae’, the Lentibulariaceae, and the (Asian) pitcher
plants (Nepenthaceae).
In contrast to Darwin, Croizat (1960) asserted a common
origin for all carnivorous plants and placed them close to
the base of the entire angiosperm lineage.3 Croizat (1960)
asserted that the Lentibulariaceae, and in particular Utri-
cularia, was the basal angiosperm group, with morpholog-
ical evolution proceeding from the relatively amorphousUtricularia with its vestigial leaves, stems, and roots that are
barely distinguishable from one another, to plants with
more differentiated characters including cladodes, shoots,
and leaves. In Croizat’s view, Nepenthes was derived
directly from Utricularia.4 Although the scant fossil record
of carnivorous plants does suggest a long evolutionary
history for at least some taxa (Thanikaimoni and Vasanthy,
1974; Li, 2005; Heubl et al., 2006), modern phylogeneticanalyses of molecular markers and DNA sequences suggest
that carnivorous plants are highly derived, polyphyletic
taxa. Contrary to Croizat’s (1960) assertions, carnivorous
plants do not represent a monophyletic ancestral Ur-
angiosperm, nor are the vestigial structures of Utricularia
evolutionary precursors to the more familiar morphological
characters of higher plants.
Progress in resolving familial relationships
‘[C]onstructive discussion is out of the question, and
attempts made at demonstrating, e.g., that Utricularia is
‘‘derivative’’ forthwith disqualify their proponents as essen-
tially ill informed.’
(Croizat, 1960: 120)
Carnivorous plants can be found in four of the major
angiosperm lineages (the Monocots, Core Eudicots, Rosids,
and Asterids), and in five orders: Poales, Caryophyllales,
Oxalidales, Ericales, and Lamiales (Fig. 1). Convergence of
carnivorous plants and their traps is most apparent at the
ordinal level, whereas gene sequences have distinguished
between convergence and homology within orders, families,and genera.
Over 95% of the >600 species of carnivorous plants are
currently placed within the Caryophyllales and Lamiales
(Fig. 1). New combined analyses based on sequences of the
trnK intron and its associated matK gene, additional
chloroplast genes (atpB, rbcL), and nuclear 18S rDNA have
clarified relationships among carnivorous families within
the Caryophyllales (Heubl et al., 2006). These analyses
simultaneously confirm one of Darwin’s notions of homol-
ogy,5 but dispel another:6 Aldrovanda vesiculosa and Dio-
naea muscipula are sister taxa, and this clade of snap-trappers
is a sister group to the sundews (Drosera) with their sticky
leaves (Cameron et al., 2002; Rivadavia et al., 2003).
Three other carnivorous families—Nepenthaceae, Dro-
sophyllaceae, and Dioncophyllaceae—are also clearly
rooted within the Caryophyllales (Fig. 1). All three of thesefamilies are in a large clade linked to the Droseraceae by
a common ancestor, presumably one with flypaper traps.
Contrary to Darwin’s hypothesis that Nepenthes was ‘not at
all related to the Droseraceae’ (Insectivorous plants, p. 292),
this genus (i.e. its monogeneric family, the Nepenthaceae) is
the sister group of the Droseraceae (Fig. 1). The dewy pine
Drosophyllum lusitanicum Link is now firmly established in
its own family (Drosophyllaceae), and carnivory appears tohave been re-derived in the Dioncophyllaceae by the
flypaper-trapping Triphyophyllum peltatum (Hutch. &
Dalz.) Airy Shaw (Cuenoud et al., 2002; Heubl et al., 2006).
Carnivory also had more than one independent origin in
the Lamiales (Muller et al., 2004, 2006; Fig. 1). As in the
Caryophyllales, evolution of the trap structure in carnivo-
rous Lamiales has proceeded from flypaper traps in
Pinguicula to the more complex, unidirectionally twisted‘eel’ traps in Genlisea and the bladder traps of Utricularia
with their unique suction mechanism (Lloyd, 1942;
Guisande et al., 2007). At least half of all described
carnivorous species are in these three genera, which histor-
ically were linked based on shared floral characters (Taylor,
1989). Contemporary molecular analysis unites them based
on shared sequences in the trnL and rps16 introns, rbcL, the
functional coxI and matK genes, and 5.8S rDNA (Jobsonand Albert, 2002; Jobson et al., 2003; Muller et al., 2004,
2006; Cieslak et al., 2005). Despite Croizat’s posthumous
protestations to the contrary, both genetic and morpholog-
ical data support the monophyly of the Lentibulariaceae,
with Pinguicula sister to a Genlisea–Utricularia clade.
However, contrary to Albert et al. (1992), it is clear that the
other carnivorous family in this order, the Byblidaceae (fide
P1achno et al., 2006), is neither directly ancestral to theLentibulariaceae nor even closely related to it (Fig. 1).
The three remaining carnivorous dicot families—
Roridulaceae, Sarraceniaceae, and Cephalotaceae—illustrate
variations on the convergent theme of trap evolution. Based
on rbcL and 18S rDNA analyses, the African endemic
Roridulaceae (two species) was considered to be the sister to
the American Sarraceniaceae (three genera, 27 species) in the
Ericales (Albert et al., 1992; Conran and Dowd, 1993).However, the current placement of these two families in the
3 ‘The ‘‘carnivorous ancestor’’ can of course be figured, as I have, in function ofa morphogenetic and phylogenetic average quantified to fit everything – bytendency – between the Podostemonaceae/Lentibulariaceae and theSarraceniaceae/Dioncophyllaceae.’ (Croizat, 1960: 256).4 ‘The difference in all these regards between Nepenthes, and Utricularia andother lentibulariaceous genera is in every respect one of degree, not at all one ofkind. The ‘‘runner’’ which in the latter aggregate becomes by easy steps underour own eyes ‘‘cladode’’ and ‘‘leaf’’ (cf., e.g., U. alpina/Pinguicula vulgaris) is bynow fully fixed as ‘‘foliage’’ in Nepenthes. .the interrelations between ‘‘foliage’’and ‘‘stem’’ turn out to be far more complicated in Nepenthes than they are inthe simplest forms of the Lentibulariaceae [i.e., Utricularia].’ (Croizat, 1960: 181-182).
5 ‘these octofid projections [of the footstalk, backs of leaves, and spikes ofDionaea] are no doubt homologous with the papillae on the leaves of Droserarotundifolia’ (Insectivorous plants, p. 233).6 ‘The circumferential part of the leaf of Aldrovanda thus differs greatly from thatof Dionaea; nor can the points on the rim be considered as homologous withthe spikes round the leaves of Dionaea, as these latter are prolongations of theblade, and not mere epidermic productions. They appear also to serve fora widely different purpose.’ (Insectivorous plants, p. 263).
22 | Ellison and Gotelli
at Dana Medical Library, University of Vermont on 29 January 2010 http://jxb.oxfordjournals.orgDownloaded from

overall angiosperm phylogeny (Stevens, 2007) reverses this,
and has the Sarraceniaceae with its pitcher traps sister to
a clade containing the sticky-leaved Roridulaceae and the
non-carnivorous Actinidicaceae. If this placement is con-
firmed, it would represent one instance among carnivorous
plant lineages of morphologically more complex traps (here,
pitchers) being ancestral to simpler sticky traps. Similarly, the
Australian endemic Cephalotus follicularis (Cephalotaceae)has no apparent sticky-leaved ancestor (Fig. 1).
Within the monocots, carnivory has also evolved at least
twice in the Bromeliaceae genera Brocchinia (B. hectioides
Mez, B. reducta Baker, and possibly B. tatei L.B. Smith)
(Givnish, et al., 1984; Benzing et al., 1985) and Catopsis
berteroniana (Schultes & Schultes) Mez (Frank and O’Meara,
1984). As with Cephalotus, there is no apparent sticky-leaved
sister group to these bromeliads with pitcher traps.
Progress in resolving generic and subgenericrelationships
‘.at the present moment, I care more about Drosera than
the origin of all the species in the world.’
(Darwin 1860, in a letter to Charles Lyell7)
As the ordinal placement and systematics of carnivorous
plant families have stabilized, attention has turned to
resolving relationships among the genera and to resolvingsubgeneric relationships in the most speciose carnivorous
genera—Drosera, Nepenthes, Pinguicula, Genlisea, Utri-
cularia, and Sarracenia. In most cases, phylogenetic patterns
based only on inferred homologous morphological traits
have been misleading. However, when morphological data
have been combined with molecular analyses, novel insights
into the evolution and biogeography of these carnivorous
plant genera have emerged.
Drosera: As mentioned above, Drosera, Dionaea, and
Aldrovanda form a well-supported clade, with snap-trapping
having evolved only once in the clade consisting of Dionaea
and Aldrovanda (Cameron et al., 2002; Rivadavia et al.,
2003). The infrageneric classification of Drosera, on the
other hand, has gone through many revisions. All data
point to the basal position of D. regia Stephens, a SouthAfrican narrow endemic, in the monophyletic Drosera
clade. Beyond that conclusion, however, there is little
concordance among different proposed phylogenies and
subgeneric classifications.
Seine and Barthlott (1994) proposed a morphology-based
classification of Drosera consisting of three subgenera and
11 sections, but this classification is not congruent with
phylogenies based on molecular data alone (Rivadaviaet al., 2003; Williams et al., 2004) or on combining
molecular and morphological data (Rivadavia et al., 2003).
Further, different statistical analyses of rbcL data (e.g.
using MacClade in Rivadavia et al., 2003 and PAUP in
Williams et al., 1994) do not concur. For example, Williams
et al. (1994) identified a ‘capensis’ clade consisting of South
African and non-Australian temperate species, but this
clade was not clearly identified by Rivadavia et al. (2003),
who sequenced many more species than did Williams et al.
(1994). Rivadavia et al. (2003) hypothesized that Drosera
originated in southern Africa or in Australia; that South
American species arose by dispersal from Australia; andthat African species other than D. regia and D. indica L.
were subsequently derived from South American ancestors.
While shades of Croizat and Gondwanan vicariance could
be inferred from this analysis, a Gondwanan origin of
Drosera is not supported by the recent evolution of the
Droseraceae (Rivadavia et al., 2003). Clearly much more
work remains to be done in this genus.
Nepenthes: About 90 species of Nepenthes, the sister group
to the Droseraceae, occur throughout southeast Asia, with
many endemics on Borneo and Sumatra. Biogeographicoutliers (disjuncts) occur in India (N. khasiana Hook. f.), Sri
Lanka (N. distillatoria L.), the Seychelles (N. pervillei
Blume), and Madagascar (N. madagascarensis Poir. and
N. masoalensis Schmid-Hollinger) (Meimberg et al., 2001;
Meimberg and Heubl, 2006). Morphology has been of
limited use in resolving systematic relationships in this
genus (Jebb and Cheek, 1997), but phylogenetic analysis of
Nepenthes has improved dramatically as molecular datahave accrued (Meimberg et al., 2001; Meimberg and Heubl,
2006). Both chloroplast (trnK intron and matK gene) and
nuclear (PRT1 along with a non-plastid, translocated copy
of trnK) genes have been used in phylogenetic reconstruc-
tion (Meimberg et al., 2001; Meimberg and Heubl, 2006).
These results suggest that the five western, biogeographi-
cally disjunct species listed above are ancestral to three
clades consisting of the Indo-Malayan species. The re-latedness and, more importantly, the biogeographic origins
of these latter species suggest repeated colonizations and
radiations by Nepenthes within the Indonesian islands
throughout the Tertiary (Meimberg and Heubl, 2006).
Pinguicula: As with studies of Drosera and Nepenthes, the
new cladistic analyses of Pinguicula do not agree with
historical subgeneric classifications (Casper, 1966; Legendre,
2000). Based on sequencing of trnK/matK and morpholog-
ical analysis of 46 of the ;80 species of Pinguicula, Cieslak
et al. (2005) found high levels of support for five discrete,
geographically bounded lineages. This fundamental result
supplanted and simplified earlier subgeneric and sectionalclassifications (three subgenera and 12 sections; Casper,
1966; Legendre, 2000). In Cieslak et al.’s (2005) new
classification, the basal lineage appears to be tropical, with
successive branchings of clades consisting of Eurasian
species, East Asian species, the Eurasian P. alpina L., and
a Central American/Mexican/Caribbean group (Cieslak
et al., 2005; Muller et al., 2006). However, phylogenetic
reconstruction based on sequencing nrITS1 and nrITS2 of 29species of Pinguicula offered a different picture (Degtjareva
et al., 2006). Although both phylogenies found some support
7 Page 492 of the 1911 edition of The life and letters of Charles Darwin, editedby F Darwin.
Carnivorous plants since Darwin | 23
at Dana Medical Library, University of Vermont on 29 January 2010 http://jxb.oxfordjournals.orgDownloaded from

for a derived Central American/Mexican/Caribbean clade,
and the nrITS-based phylogeny was reasonably congruent
with Casper’s (1966) morphological classification, the
remaining clades identified by the nrITS-based phylogeny
were polyphyletic in the trnK-based phylogeny (Cieslak
et al., 2005). Resolving the infrageneric phylogeny of
Pinguicula requires clearer definition of informative morpho-
logical and molecular characters as well as sequence datafrom a wider range of species.
Genlisea and Utricularia: In contrast to the ongoing system-
atic confusion in Pinguicula, sequence data from matK,trnK, rbcL, rps16, and trnL-F (Jobson et al., 2003; Muller
et al., 2004, 2006) generally have supported the infrageneric
grouping of the 21 species of Genlisea based on differences
in the way capsules dehisce (Fischer et al., 2000). The South
American subgenus Tayloria is sister to a clade consisting of
three African species and five additional South American
species. The African species do not form a natural clade,
as the East African/Madagascan species G. margaretae
Hutchinson is more closely related to the South American
species than it is to the remaining African species (Fischer
et al., 2000; Muller et al., 2006).
The ;220 species of Utricularia have been organized into
three subgenera and ;21 sections. Analysis of trnL-F,
rps16, and trnK sequence data (Jobson et al., 2003; Muller
and Borsch, 2005) suggested a refinement of the three
subgenera Polypompholyx, Bivalvia, and Utricularia. Taylor’s(1989) 34 sections based on morphology were, with three
exceptions (sections Iperua, Setiscapella, and Psyllosperma),
upheld as monophyletic. Current analysis suggests a single
terrestrial origin for bladderworts in South America; the
aquatic and epiphytic habits of Utricularia species appear to
have been re-derived multiple times within the genus (Jobson
et al., 2003; Muller and Borsch, 2005; Muller et al., 2006).
Greilhuber et al. (2006) reported the remarkable resultthat many species of Genlisea and Utricularia have very
small nuclear genome sizes. In fact, they found that Genlisea
margaretae (C-value ¼ 63 Mbp), G. aurea St. Hil. (64
Mbp), Utricularia gibba L. (88 Mbp), U. blanchetii A.DC.
(135 Mbp), and U. parthenopipes P. Taylor (140 Mbp) have
smaller C-values than that found for the previous record
holder for the smallest angiosperm genome, Arabidopsis
thaliana (L.) Heynh. (157 Mbp). Neither the functionalsignificance nor the potential role in evolutionary diversifi-
cation of this apparent genome simplification in Genlisea
and Utricularia is known.
Sarracenia: Recent genetic analyses have revealed perhaps
the most taxonomic surprises in the American pitcher plants
(Sarraceniaceae). Three sets of phylogenetic reconstructions,
one based only on the chloroplast rbcL gene (Albert et al.,
1992), another that used rbcL along with two nuclear ITS
regions of rDNA (Bayer et al., 1996), and a third that used
ITS-2 along with the 26S rRNA gene (Neyland and
Merchant, 2006), have all supported the monophyly of theSarraceniaceae. Older analyses of biogeographical (Croizat,
1960; McDaniel, 1971; Maguire, 1978), palynological
(Thanikaimoni and Vasanthy, 1972), and morphological
(Macfarlane, 1893; deBuhr, 1977; Maguire, 1978; Juniper
et al., 1989) data have traditionally grouped the North
American genera Sarracenia and Darlingtonia together and
posited that the South American genus Heliamphora was
either sister to, or derived from, a Sarracenia–Darlingtonia
clade. In contrast, all of the molecular data suggest that
Darlingtonia is sister to a derived Sarracenia–Heliamphora
clade. This result is concordant with Renner’s (1989)hypothesis that modern-day Sarraceniaceae are derived
from a widespread common ancestor (or ancestral stock).
These results do not settle the long-standing debate about
whether the common ancestor of modern Sarraceniacae was
Neotropical (South America) or subtropical (southeast
North America) (Bayer et al., 1996; Neyland and Merchant,
2006). However, these results do help in resolving species-
level relationships within the genus Sarracenia. Three distinctclades now seem plausible in this genus: one consisting of
S. psittacina Michx., S. minor Walt., and S. flava L.; another
consisting of S. rubra Walt. (sensu lato), S. alata Wood, S.
oreophila (Kearney) Wherry, and S. leucophylla Raf.; and
a third consisting of S. purpurea L. (sensu lato).
Neither Bayer et al. (1996) nor Neyland and Merchant
(2006) provide support for separation of the S. rubra
complex into the separate species and subspecies S. jonesii
Wherry, S. alabamensis Case & Case, S. rubra ssp. gulfensis
Schnell, S. rubra ssp. wherryi (Case & Case) Schnell, and S.
rubra ssp. rubra Walt. (Case and Case, 1974, 1976; Schnell,
1977, 1979b; Godt and Hamrick, 1998). Although the S.
rubra complex is clearly derived within the genus (Romeo
et al., 1977), the molecular data provide no apparent
discrimination among them. The repeated failure to distin-
guish them as distinct taxa raises questions about theseparate listing of S. jonesii and S. alabamensis as endan-
gered species in the USA.
In contrast to the lack of taxonomic differentiation
within S. rubra, there do appear to be significant differences
among named taxa within S. purpurea. This species was
divided by Gleason and Cronquist (1991) into two varieties
(considered to be subspecies by Schnell, 2002), S. purpurea
purpurea (Raf.) Wherry and S. purpurea venosa (Raf.)Wherry; the latter has been further subdivided into three
varieties: venosa (Raf.) Fernald; montana Schnell &
Determann; and burkii Schnell (Schnell, 1979a, 1993;
Schnell and Determann, 1997) or two varieties (venosa,
montana) and the separate species S. rosea Naczi, Case &
Case (Naczi et al., 1999). The ITS-2 and 26S rRNA
analyses confirmed an earlier study based on allozymes
(Godt and Hamrick, 1999); all data clearly separateS. purpurea venosa var. burkii from the other named
varieties of S. purpurea venosa and S. purpurea purpurea,
and support its elevation to S. rosea (Neyland and
Merchant, 2006). Because S. rosea is endemic to the Florida
panhandle, additional data on its distribution, demography,
and threats to its persistence are immediately needed to
determine if it should be a candidate for listing as
threatened or endangered at either the state or federal level.Furthermore, both the allozyme work (Godt and
Hamrick, 1999) and the molecular analysis (Neyland and
24 | Ellison and Gotelli
at Dana Medical Library, University of Vermont on 29 January 2010 http://jxb.oxfordjournals.orgDownloaded from

Merchant, 2006) linked the two varieties of S. purpurea
venosa more closely to each other than to S. purpurea
purpurea; and the three taxa diverge from each other by
about as much as S. rosea diverges from the S. purpurea
clade (Neyland and Merchant, 2006). Thus, either the three
other subspecies/varieties of S. purpurea each should be
raised to species status (as tentatively suggested by Neyland
and Merchant, 2006), or they should be considered as asingle species with broad geographic variability (as suggested
by Gleason and Cronquist, 1991; Ellison et al., 2004).
Rates of genetic change and new hypotheses arisingfrom carnivorous plant genomics
As phylogenetic hypotheses have stabilized and as moregene sequence data have accrued for carnivorous plant
species, comparative analyses of evolutionary rates of the
different taxa have become possible. Initial attention has
focused on the Lentibulariaceae because of the extreme
specialization in trap morphology within the derived genera
Utricularia and Genlisea. Jobson and Albert (2002) found
that relative rates of nucleotide substitutions (based on
RRTree computations: Robinson-Rachavi and Huchon,2000) in seven loci (trnL/matK intron, trnL second exon,
trnL-F spacer, rps16 intron, cox1, and 5.8S RNA) occurred
4–14 times faster in Utricularia than in Pinguicula. Similarly,
Muller et al. (2004) reported that Genlisea and Utricularia
have relative rates of nucleotide substitutions (relative to an
Amborella+Nymphaeales outgroup) in matK that are 63%
higher than they are in Pinguicula.8 Muller et al. (2004) also
found that substitution rates of Genlisea and Utricularia
were higher than those of 292 other angiosperm taxa, and
that four other carnivorous plant genera—Pinguicula,
Drosera, Nepenthes, and Sarracenia—had substitution rates
more in line with those of other angiosperms (Fig. 2).
Two hypotheses have been suggested to account for the
high rates of molecular evolution observed in Utricularia
and Genlisea. First, Jobson and Albert (2002) hypothesized
that a single or small number of changes in regulatory genescould have led to rapid morphological evolution in Utri-
cularia. In particular, Jobson et al. (2004) focused on the
coxI subunit of cytochrome c oxidase. They showed that
a unique motif of two contiguous cysteine residues in coxI
has been subject to strong selection, and this novel structure
of coxI in Utricularia could help to provide the additional
metabolic energy required to reset Utricularia traps.
As Darwin and Croizat both noted, Utricularia showslittle differentiation between stems, shoots, and leaves. Such
‘relaxed’ morphology is often observed in aquatic and
epiphytic habitats, where neutral buoyancy (in the water)
or other supporting structures (for epiphytes) obviate the
need for structural tissues (such as large stems or wood).
Thus, the combination of a unique molecular mutation in
a key metabolic pathway and the relaxed morphological
requirements of aquatic and epiphytic habitats has been
hypothesized to be the driver of morphological diversity in
this genus (Jobson et al., 2004; Laakkonen et al., 2006). We
refer to this hypothesis as the ‘energetics hypothesis’.
Alternatively, Muller et al. (2004) pointed to the extreme
specialization of the traps in Genlisea and Utricularia
relative to the sticky leaves of Pinguicula and Drosera and
the pitfalls of Nepenthes and Sarracenia as paralleling the
differences in genetic substitution rates (Fig. 2). Like Jobson
et al. (2004), Muller et al. (2004) suggested that high
mutation rates in Utricularia and Genlisea are related to
relaxed morphological constraints. However, Muller et al.
(2004) further argued that morphological evolution in
carnivorous plants was achievable because they can directlytake up large biosynthetic building blocks, such as amino
acids, peptides, and nucleotides, that the plants obtain from
capturing and dissolving prey. Importantly, Muller et al.
(2004) suggested that Utricularia and Genlisea have more
predictable and frequent captures of prey in their habitats
relative to the other carnivorous genera, and that there is
a positive feedback between this reliable supply of prey and
Fig. 2. Relative rates of gene substitution in carnivorous plant
genera relative to the basal angiosperm (Amborella+Nym-
phaeales). Angiosperm taxa are arrayed on the x-axis from
smallest to largest rates of matK substitution rates. The relative
substitution rate on the y-axis is calculated as the difference
between K(Genlisea, outgroup)–K(other taxon, outgroup), where
K(taxon, outgroup)¼the maximum likelihood estimate of substitu-
tions per site between the taxon and the outgroup (Muller, 2005).
A rough estimate of the percentage difference in substitution rates
between two carnivorous plant taxa can be found as
1003 1� CP1 �CP2
CP1, where CPi is the relative substitution rate of
carnivorous plant species i (see text footnote 8 for caveats in using
this estimator). Figure reprinted from Muller (2004) with permission
of the author and the publisher, Georg Thieme Verlag KG.
8 This percentage comparison assumes similar molecular clocks and may bebiased by using the basal angiosperm (Amborella+Nymphaeales) as theoutgroup in the analysis (Kai Muller, personal communication to A Ellison, 5March 2008).
Carnivorous plants since Darwin | 25
at Dana Medical Library, University of Vermont on 29 January 2010 http://jxb.oxfordjournals.orgDownloaded from

further morphological evolution. We refer to this hypothesis
as the ‘predictable prey capture hypothesis’.
These two hypotheses were formulated for carnivorous
Lentibulariaceae (Genlisea and Utricularia relative to Pingui-
cula), but the general pattern of complex traps being derived
relative to simple (sticky-leaf) traps (Fig. 1) suggests that these
hypotheses could apply across carnivorous plant lineages.
Although the broader application of these hypotheses to othercarnivorous plant lineages is necessarily speculative, testing
between the energetics and predictable prey capture hypothe-
ses nonetheless could provide further insights into factors
driving the evolution of carnivorous plants. These analyses are
the focus of the subsequent sections of this paper.
Pattern and process in prey capture bycarnivorous plants
‘Now it would manifestly be a great disadvantage to the
plant [Dionaea muscipula] to waste many days in remaining
clasped over a minute insect, and several additional days or
weeks in afterwards recovering its sensibility; inasmuch as
a minute insect would afford but little nutriment. It would be
far better for the plant to wait for a time until a moderately
large insect was captured, and to allow all the little ones to
escape; and this advantage is secured by the slowly intercross-
ing marginal spikes, which act like the large meshes of
a fishing-net, allowing the small and useless fry to escape.’
(Insectivorous plants, pp. 251–252).
The available phylogenetic data suggest that in all
carnivorous lineages except perhaps the Sarraceniaceae/
Roridulaceae clade (Fig. 1), complex traps (pitchers, eel
traps, bladders) are derived relative to sticky-leaved, flypa-
per traps (Ellison and Gotelli, 2001). Muller et al. (2004)hypothesized that carnivorous genera with rapidly evolving
genomes (Genlisea and Utricularia) have more predictable
and frequent captures of prey than do genera with more
slowly evolving genomes; by extension it could be hypoth-
esized that, in general, carnivorous plants with more
complex traps should have more predictable and frequent
captures of prey than do those with relatively simple traps.
Increases in predictability and frequency of prey capturecould be achieved by evolving more elaborate mechanisms
for attracting prey, by specializing on particular types of
prey, or, as Darwin suggested, by specializing on particular
(e.g., large) sizes of prey. In all cases, one would expect that
prey actually captured would not be a random sample of
the available prey. Furthermore, when multiple species of
carnivorous plants co-occur, one would predict, again
following Darwin,9 that interspecific competition wouldlead to specialization on particular kinds of prey.
The accumulated contents of carnivorous plant traps can
provide an aggregate record of the prey that have been
successfully ‘sampled’ by the plant. Over the past 80 years,
many naturalists, botanists, and ecologists have gathered
data on prey contents of carnivorous plants from around
the world. Such samples can be used to begin to test the
hypothesis that carnivorous plant genera differ in prey
composition and to look for evidence of specialization inprey capture. Here these data are summarized and synthe-
sized in a meta-analysis to test for differences in prey
composition among carnivorous plant genera, and to look
for evidence of specialization in prey capture.
The data
Prey capture data were gathered from 30 studies that were
published (in the literature or in otherwise unpublished
MSc and PhD theses) between 1923 and 2007. These
studies encompass 87 records of prey capture for 46
species of carnivorous plants in eight genera: Drosera
(13 species), Dionaea (one species), Triphyophyllum (one
species), Nepenthes (11 species), Pinguicula (seven species),
Utricularia (five species), Sarracenia (seven species), and
Brocchinia (one species). The geographic scope of these
data is similarly broad, encompassing all continents on
which carnivorous plants occur. Each record (prey com-
position of a single plant taxon at a single locality) was
treated as an independent observation, and no distinc-tion was made in terms of within- and between-species
variability within each plant genus. Most studies con-
tained from dozens to thousands of individual prey items;
the one record of Drosera rotundifolia measured by Judd
(1969) in southwestern Ontario, Canada that contained
only six individual prey items was excluded from the
analysis. Using designations in the original publications,
prey were classified into 43 taxonomic groups. For insects,these taxonomic groups were usually orders, although
virtually all authors distinguished ants from other Hyme-
noptera, and this distinction was retained in the analysis.
There were a few coarser classifications (e.g. ‘Other
insects’, ‘Mollusca’), but prey in these categories were very
rare.
In the majority of the studies, the original data consisted
of counts of individual prey, usually pooled from trapsof several plants. Some studies of Pinguicula and other
sticky-leaved plants recorded the number of prey per leaf
area, whereas others summarized data as percentages of
captures per trap or as numbers of individuals per trap. For
the purposes of the present analyses, all of the observations
were converted to the proportion of prey collected for each
species within a study. Most carnivorous plants consume
a wide range of prey; a notable documented exception isNepenthes albomarginata Lobb ex Lindl., which, based on
field observations (Kato et al., 1993; Merbach et al., 2002)
and stable isotope analysis (Moran et al., 2001), appears to
prey almost exclusively on termites. Among other terrestrial
carnivorous plants, captured prey is dominated by ants and
9 ‘As species of the same genus have usually, though by no means invariably,some similarity in habits and constitution, and always in structure, the strugglewill generally be more severe between species of the same genus, when theycome into competition with each other, than species of distinct genera.’ [Theorigin of species, p. 64, 1996 Oxford University Press printing of the 2nd edition(1859)].
26 | Ellison and Gotelli
at Dana Medical Library, University of Vermont on 29 January 2010 http://jxb.oxfordjournals.orgDownloaded from

flies (Fig. 3), whereas captured prey of aquatic Utricularia
spp. is dominated by Cladocera (mean¼37% of prey) and
cyclopoid copepods (mean¼36% of prey).10
Do different carnivorous plant genera specialize onparticular prey?
Methods of data analysis: The first question considered waswhether there was any indication of specialization by
different carnivorous plant genera. A specialist would be
one whose prey consisted of many individuals of only a few
prey taxon, whereas a generalist predator would have prey
consisting of relatively few individuals spread among many
different prey taxon. A useful index of specialization is
Hurlbert’s (1971) probability of an interspecific encounter
(PIE):
PIE ¼ N
N � 13 1:0� +
S
i¼1
ðpiÞ2
in which S is the number of prey taxa, pi is theproportion of prey taxon i in the sample, and N is thetotal number of individual prey items in the sample. PIEranges from 0 to 1, and can be calculated for datameasured in disparate units such as counts, percentages,or densities (Gotelli, 2008).
In this analysis, PIE has a simple and direct statistical
interpretation: if an investigator randomly sampled two
individual prey items from the same trap (or set of traps
that are pooled for a species in a site), what are the chances
that they represented two different prey taxa? A value ofPIE close to 1 implies that the carnivorous plant genus was
not a prey specialist because any two randomly sampled
prey items would probably be from different prey taxa. In
contrast, a value of PIE close to 0 implies specialization on
a single prey taxon because any two randomly sampled prey
items would probably be the same. Note that the value of
PIE contains no information about the identity of the prey
taxa, only the numbers of prey taxa and the relativedistribution of individuals among them. Thus, two carnivo-
rous plant genera might have identical values of PIE, but
share no prey taxa in common.
In addition to PIE, the proportion of prey items
represented by ants (Formicidae) and the proportion
represented by flies and mosquitoes (Diptera), two of the
most important prey taxa for most carnivorous plants, were
also analysed. PIE and the proportion of ants and flies werearcsine-square root transformed prior to analysis (Gotelli
and Ellison 2004). A one-way ANOVA was used to compare
the response variables among the different genera of
carnivorous plants, without distinguishing among within-
and between-species variation within a genus. Statistical
analyses were conducted using R version 2.6.1.11
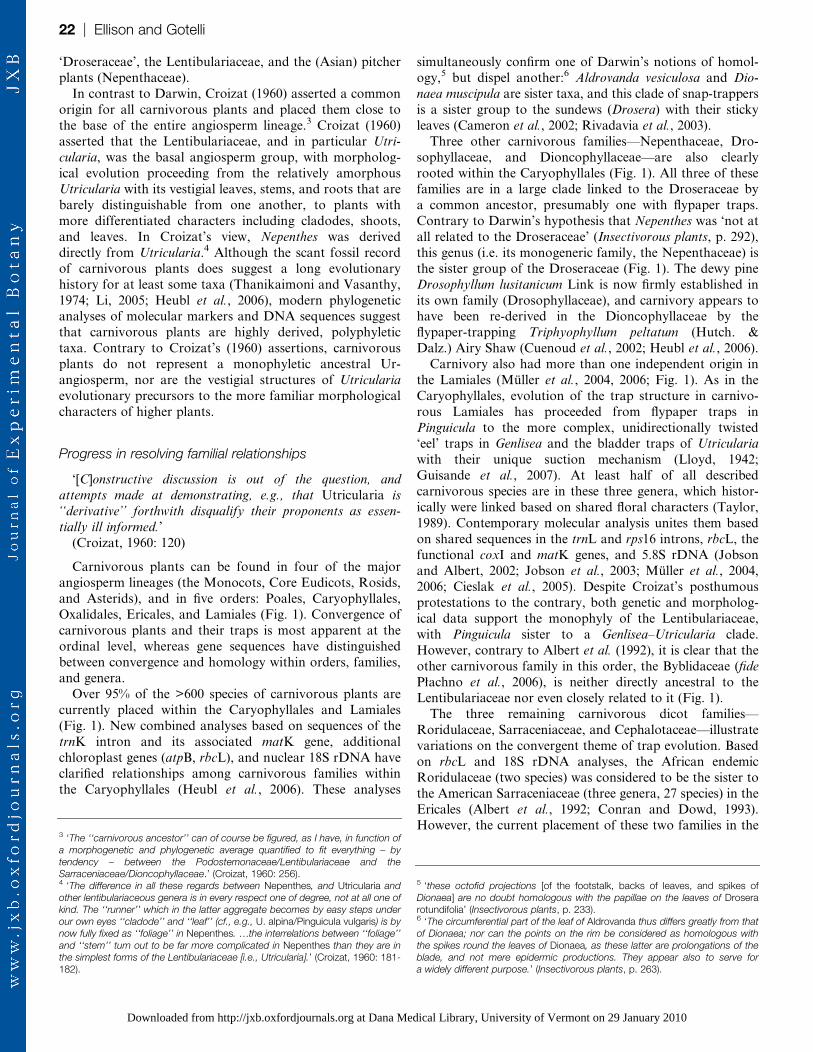
Results: The analysis of prey capture spectra using PIE
suggests that different carnivorous plant genera differsignificantly in their relative degree of taxonomic specializa-
tion, at least at the ordinal level of prey diversity
(F7,79¼2.03, P¼0.009). The analysis included a low outlier
for Drosera erythrorhiza Lindl. (Watson et al., 1982) in
which 10 826 of 10 911 prey items counted (99.2%) were
Collembola (PIE¼0.015), and only one sample for the
genus Triphyophyllum (Green et al., 1979), the most
generalist taxa measured (PIE¼0.802). However, removalof these two taxa from the analysis did not alter the
qualitative conclusion; PIE still differed among genera
(F6,78¼3.84, P¼0.002). The most specialized carnivorous
plant genera in the analysis were the pitcher plants
Brocchinia (PIE¼0.189), Nepenthes (PIE¼0.452), and Sar-
racenia (PIE¼0.491), and the most generalized genera were
Triphyophyllum (PIE¼0.802) and Utricularia (PIE¼0.713;
Fig. 4A).Differences among genera in the capture of particular
prey taxa were also very strong. Genera differed dramati-
cally in the proportion of ants and flies captured (ants,
F7.79¼36.01, P < 10�15; flies, F7,79¼8.29, P¼1.5310�7). The
pitcher plants Brocchinia, Nepenthes, and Sarracenia
had the highest proportions of ants in their diets (90,
73, and 55%, respectively), reflecting their higher
Fig. 3. Prey spectra of terrestrial carnivorous plant genera. The
slices of each ‘star’ plot are scaled to the average proportion of
each prey taxon (order except for ants—family Formicidae). Only
the 12 most common prey orders are shown. The key to the
colours is given in the lower right of the figure.
10 The raw data and complete list of studies from which the data were drawnare available as data set HF-111 from the Harvard Forest data archive: http://harvardforest.fas.harvard.edu/data/p11/hf111/hf111.html.11 http://www.r-project.org/
Carnivorous plants since Darwin | 27
at Dana Medical Library, University of Vermont on 29 January 2010 http://jxb.oxfordjournals.orgDownloaded from
specialization values (low PIE). Captures of ants were much
less frequent for the sticky traps of Drosera (3.4%) and
Pinguicula (0.5%), and for the aquatic, bladder-trapping
Utricularia (0%). Flies predominated in the diets of Drosera
(44%) and Pinguicula (52%) (Fig. 4C), but were uncommon
prey for Utricularia (3%) and Sarracenia (14%). A
notable outlier was a single study of Sarracenia purpurea by
Judd (1959), in which 690 of 1095 prey (63%) were
Diptera (not identified to suborders or families by Judd,
1959).Collectively, these results illustrate that different genera
of carnivorous plants do indeed selectively capture different
prey taxa. In some cases, the differences simply reflect
habitat differences: ants and adult flies are unavailable to
aquatic Utricularia or terrestrial Utricularia with subterra-
nean traps. However, the statistical significance of differ-
ences in captures of flies and ants by pitchers (Sarracenia
and Nepenthes) and sticky traps (Drosera and Pinguicula) is
not dependent on the inclusion of Utricularia in the
analysis, but rather do appear to reflect the different
morphological specializations in these genera.
Are they really specialists? Comparisons of capturedprey and available prey
Although the frequencies of prey collected in carnivorous
plant traps are rarely equiprobable, a predominance of
a single prey taxon, such as ants, need not indicate
specialization because some taxa simply may be more
abundant than others. In five published studies (Watson
et al., 1982; Zamora 1990, 1995; Antor and Garcıa, 1994;
Harms 1999), the investigators not only collected prey
from carnivorous plants but also used passive traps in the
habitat to sample available prey. Watson et al. (1982) used
life-sized and -shaped cardboard models of Drosera
erythrorhiza coated with Hyvis 10 (a tacky inert compound
based on polymerized butane) to assess prey available to
Drosera erythrorhiza in the field. Zamora (1990) used life-
sized and -shaped paper or wooden models to assess prey
available to Pinguicula nevadense (Lindbg.) and P. vallis-
neriifolia Webb., respectively. Antor and Garcıa (1994)
used sticky cards in one year (1990) and sticky, life-sized,
leaf-shaped models in another year (1991) to assess prey
available to Pinguicula longifolia Ram. ex. DC ssp. long-
ifolia. Harms (1999) used grab samples to determine prey
available to Utricularia intermedia Hayne, U. minor L. and
U. vulgaris L.
The appropriate null hypothesis is that the carnivorous
plant is a passive trap: the relative abundance of the dif-
ferent prey categories does not differ from the relative
abundance of prey in the environment. The alternative
hypothesis is that some prey taxa are selectively attracted or
captured by the plant. Under the alternative hypothesis,
there should be a significant difference in the relative
proportions of prey caught and the relative proportions of
prey available.
Fig. 4. Results of the analysis of prey capture by seven carnivorous
plant genera. (A) Probability of interspecific encounter (PIE), or the
probability that two prey items drawn at random from a trap are
from different taxa. High values of PIE indicate less specialization on
particular prey orders than do low values of PIE. (B) Proportion of
ants in the prey captured by each genus. (C) Proportion of flies in
the prey captured by each genus. For each variable, boxes illustrate
the median (horizontal line), upper, and lower quartiles (limits of the
box), upper and lower deciles (limits of the vertical lines), and
extreme values (individual points). The width of the box is pro-
portional to the square-root of the sample size. Note that for
Brocchinia and Triphyophyllum the sample size is only equal to 1
each, so there is no distribution from which to draw a box. The
values for those two species are indicated by a single horizontal line.
28 | Ellison and Gotelli
at Dana Medical Library, University of Vermont on 29 January 2010 http://jxb.oxfordjournals.orgDownloaded from
Methods of data analysis: To quantify the similarity of the
prey captured by plants to the prey collected in passive
traps, we used the Jaccard index, J (Jaccard, 1901):
J ¼ a
a þ b þ c
in which a is the number of shared species between twosamples (plant traps and passive traps), and b and c arethe number of unique species in each of the two samples.The Jaccard index was modified recently by Chao et al.(2005) to incorporate relative abundance and to accountstatistically for undetected shared species that might bepresent, but that did not occur in the samples. Like J, theChao–Jaccard (or JChao) index ranges from 0.0 (noshared to species) to 1.0 (all species shared). JChao wascalculated using the EstimateS software package (Colwell2005); 1000 bootstrap replications were used to estimateparametric 95% confidence intervals for the point-estimates of JChao.
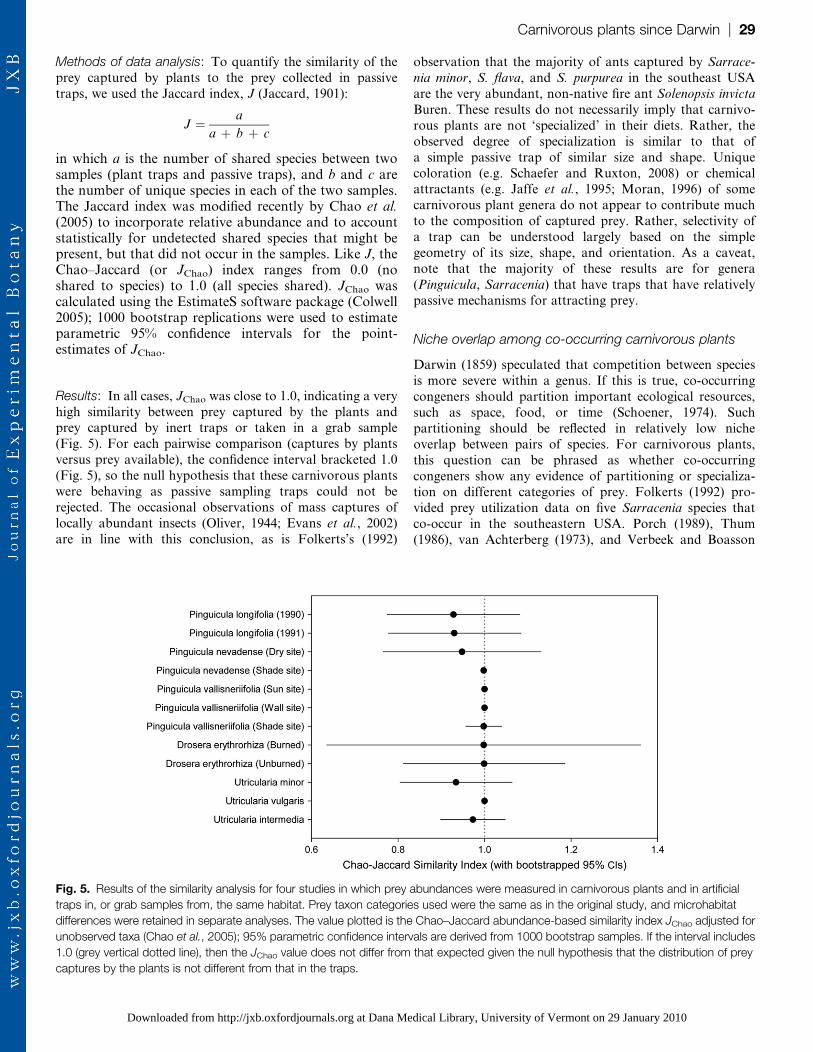
Results: In all cases, JChao was close to 1.0, indicating a very
high similarity between prey captured by the plants andprey captured by inert traps or taken in a grab sample
(Fig. 5). For each pairwise comparison (captures by plants
versus prey available), the confidence interval bracketed 1.0
(Fig. 5), so the null hypothesis that these carnivorous plants
were behaving as passive sampling traps could not be
rejected. The occasional observations of mass captures of
locally abundant insects (Oliver, 1944; Evans et al., 2002)
are in line with this conclusion, as is Folkerts’s (1992)
observation that the majority of ants captured by Sarrace-
nia minor, S. flava, and S. purpurea in the southeast USA
are the very abundant, non-native fire ant Solenopsis invicta
Buren. These results do not necessarily imply that carnivo-
rous plants are not ‘specialized’ in their diets. Rather, the
observed degree of specialization is similar to that of
a simple passive trap of similar size and shape. Unique
coloration (e.g. Schaefer and Ruxton, 2008) or chemicalattractants (e.g. Jaffe et al., 1995; Moran, 1996) of some
carnivorous plant genera do not appear to contribute much
to the composition of captured prey. Rather, selectivity of
a trap can be understood largely based on the simple
geometry of its size, shape, and orientation. As a caveat,
note that the majority of these results are for genera
(Pinguicula, Sarracenia) that have traps that have relatively
passive mechanisms for attracting prey.
Niche overlap among co-occurring carnivorous plants
Darwin (1859) speculated that competition between species
is more severe within a genus. If this is true, co-occurring
congeners should partition important ecological resources,
such as space, food, or time (Schoener, 1974). Such
partitioning should be reflected in relatively low niche
overlap between pairs of species. For carnivorous plants,
this question can be phrased as whether co-occurring
congeners show any evidence of partitioning or specializa-tion on different categories of prey. Folkerts (1992) pro-
vided prey utilization data on five Sarracenia species that
co-occur in the southeastern USA. Porch (1989), Thum
(1986), van Achterberg (1973), and Verbeek and Boasson
Fig. 5. Results of the similarity analysis for four studies in which prey abundances were measured in carnivorous plants and in artificial
traps in, or grab samples from, the same habitat. Prey taxon categories used were the same as in the original study, and microhabitat
differences were retained in separate analyses. The value plotted is the Chao–Jaccard abundance-based similarity index JChao adjusted for
unobserved taxa (Chao et al., 2005); 95% parametric confidence intervals are derived from 1000 bootstrap samples. If the interval includes
1.0 (grey vertical dotted line), then the JChao value does not differ from that expected given the null hypothesis that the distribution of prey
captures by the plants is not different from that in the traps.
Carnivorous plants since Darwin | 29
at Dana Medical Library, University of Vermont on 29 January 2010 http://jxb.oxfordjournals.orgDownloaded from
(1993) provided data on co-occurring species of Drosera
in, respectively, the southeastern USA, Germany, The
Netherlands, and southwestern Australia. These same data
were part of the prey utilization analyses described above,
but here these data are isolated for more detailed analysis of
niche overlap.
Methods of data analysis: How much niche overlap would
be expected by chance, in the absence of any competition?
The EcoSim software (Gotelli and Entsminger, 2007) wasused to quantify niche overlap using Pianka’s (1973) index
of overlap in resource use:
O12 ¼+n
i¼1
p1i p2iffiffiffiffiffiffiffiffiffiffiffiffiffiffiffiffiffiffiffiffiffiffiffiffiffiffi+n
i¼1
�p2
1i
��p2
2i
�s
where p1i and p2i are the proportion of prey used byspecies 1 and species 2, respectively. O12 ranges from 0.0(no shared prey) to 1.0 (identical prey utilization), and iscalculated for each pair of species in an assemblage. Forassemblages with more than two species, the average ofall pairwise values of Oij was calculated, where i and jindex each species. Null model analysis (Gotelli andGraves, 1996) is a statistical method for randomizingecological data to see whether patterns are more extremethan expected by chance. Thus, to determine whether ouraverage value of Oij differed from that expected underthe null hypothesis that the niche overlap reflected onlyrandom interactions, the software ‘reshuffled’ the ob-served utilization values to generate expected overlap ina null community that was unstructured by competition.We used the ‘RA-3’ algorithm in EcoSim; it retainsobserved niche breadths within a species, but randomizesthe particular prey categories that were used. Thisalgorithm has good statistical properties (Winemiller andPianka, 1990) and has been used in many other studies ofniche overlap (reviewed in Gotelli and Graves, 1996).
Results: For the most species-rich assemblages [five species
of Sarracenia (Folkerts, 1992) and five species of Drosera
(Verbeek and Boasson, 1993)], niche segregation was not
observed (Table 1). In the Sarracenia assemblage, the
highest observed niche overlap was between Sarracenia
flava and Sarracenia purpurea (overlap ¼0.99), and the
lowest overlap was between Sarracenia leucophylla and
Sarracenia psittacina (overlap¼0.26). The average overlap
for all 10 unique pairs was 0.637 (Table 1), which is about
midway between complete segregation (0.0) and complete
overlap (1.0). However, in the simulated ‘null assem-
blages’, the average niche overlap was only 0.197, and the
observed overlap in the real Sarracenia community waslarger than that found in 998 out of 1000 simulation trials.
Thus, the real five-species Sarracenia assemblage (and all
pairwise comparisons) showed significantly more niche
overlap than expected by chance (P¼0.002), directly
contradicting the hypothesis of niche segregation in
sympatry.
Similar results were found for five species of co-occurring
Drosera at the Fitzgerald River site in southwestern
Australia (Verbeek and Boasson, 1993). Observed pairwise
niche overlaps ranged from 0.65 (D. menziesii versus D.
paleacea) to 0.92 (D. glanduligera versus D. paleacea). The
average overlap for the pooled assemblage was 0.534, >96%of the 1000 simulations (Table 1). This result again
suggested significantly more niche overlap than expected by
chance (P¼0.04).
The high overlap in both cases was clear from an
inspection of the raw data. Except for S. leucophylla, which
favoured Diptera, all co-occurring Sarracenia primarily
captured ants (Folkerts 1992). The relatively modest
morphological differences between co-existing species ofSarracenia did not translate into appreciable differences in
composition of prey captured, suggesting that competition
for limiting resources was not regulating species co-
existence. Similarly, among co-occurring Drosera at Fitzger-
ald River, prey composition was dominated by Collembola,
Homoptera, and Diptera (Verbeek and Boasson, 1993).
No evidence of interspecific competition was found
among the Sarracenia assemblages composed of two orthree species (Folkerts, 1992), or among the two- or three-
species assemblages of Drosera in the southeastern USA,
Germany, The Netherlands, and at Murdoch University
(van Achterberg, 1973; Thum, 1986; Porch, 1989; Verbeek
and Boasson, 1993) (Table 1). In all cases, the observed
niche overlap was significantly greater than expected (Table 1),
which was the opposite of the pattern that would be predicted
by competitive segregation of prey.The two caveats to these results are that prey were
identified only to orders and that the analysis assumed that
all prey categories were equally abundant. Finer taxonomic
resolution of prey could reveal less overlap among prey. If
the assumption of equal abundance of prey categories is
violated, the analytic method used tends to overestimate the
amount of niche overlap because the results are dominated
by common taxa. In contrast, when independent estimatesof prey abundance are available, values of prey actually
used can be rescaled to downweight the importance of
common prey (for further discussion of statistical issues
associated with measures of niche overlap, see Gotelli and
Graves, 1996). Unfortunately, the studies used here for
assessing niche overlap did not include independent esti-
mates of prey availability.
Rates and efficiency of prey capture by pitcher plantsand bladderworts
‘From an examination which I made to-day on a leaf of the
S. flava about half grown, I am led to suspect that the surface,
where the fly stands so unsteadily, and from which it finally
drops down to the bottom of the tube, is either covered with
an impalpable and loose powder, or that the extremely
attenuated pubescence is loose. This surface gives to the touch
30 | Ellison and Gotelli
at Dana Medical Library, University of Vermont on 29 January 2010 http://jxb.oxfordjournals.orgDownloaded from
the sensation of the most perfect smoothness. The use of
a good microscope will determine this point.’
(Macbride, 1818: 52)
The statistical analysis of the prey spectra (Figs 3 and 4)
revealed that at relatively coarse taxonomic resolution
(genera of plants, orders of prey), carnivorous plants act as
opportunistic sit-and-wait predators, capturing prey in pro-
portion to their availability (Fig. 5), and rarely competing
with co-occurring congeners (Table 1). Additional evidence
from several species of pitcher plants and bladderworts,
however, suggests that these taxa do have some adaptations
to increase the rates and efficiency of capture of specific
prey items, at least under certain environmental conditions.
Detailed observations of Sarracenia purpurea using video
cameras (Newell and Nastase, 1998) and of Darlingtonia
californica Torrey using multiple observers (Dixon et al.,2005) found that fewer than 2% of ants visiting S. purpurea
or wasps visiting D. californica were successfully captured
by the plants. These observations were made under sunny
and relatively dry field conditions. Similar rates of ant
captures by Nepenthes rafflesiana Jack. (Bohn and Federle,
2004; Bauer et al., 2008) were observed under sunny and
dry conditions. However, when the pitcher lip (peristome)
of N. rafflesiana was wetted by rain, condensation, orsecretion of nectar by the extrafloral nectaries lining the
peristome, it became, like that of Macbride’s (1818)
Sarracenia flava, a nearly frictionless surface. Foraging ants
that contacted the wetted peristome ‘aquaplaned’ and
slipped into the pitcher in very large numbers (Bauer et al.,
2008); capture rates by N. rafflesiana under humid or wetconditions often reached 100% of foraging ants (Bauer
et al., 2008). As the other pitcher plants—Cephalotus and all
the Sarraceniaceae—also have extrafloral nectaries ringing
the peristome (Vogel, 1998; P1achno et al., 2007), it is not
unreasonable to hypothesize that these taxa also have
peristomes that could be wetted to increase prey capture
rates. Hopefully, we will not have to wait another 200 years
for a good microscopist to test this hypothesis for the othergroups of pitcher plants!
Adaptations to enhance prey capture by bladderworts
have also been postulated. The suction trap (described in
detail by Lloyd, 1942; Guisande et al., 2007) of Utricularia
is a highly specialized structure that is activated when
a passing animal touches a trigger hair (Lloyd, 1942
illustrated it as a ‘better mousetrap’). When triggered, the
trap opens inward, the prey is sucked in to the water-filledtrap, the door closes, and the prey is digested and absorbed.
Finally, the water is pumped out and the trap is reset. This
energy-intensive process appears to be facilitated by the
evolutionary change in coxI described above (Jobson et al.,
2004).
Beginning with Darwin (1875) investigators have hypoth-
esized that periphyton growing on the hairs and bristles
surrounding the trap attract zooplankton that graze theirway down to the trigger hairs. This hypothesis was verified
experimentally for U. vulgaris by Meyers and Strickler
(1979) and for U. foliosa L. (Dıaz-Olarte et al., 2007).
However, the presence and species composition of periphy-
ton on hairs and bristles of Utricularia appear to depend on
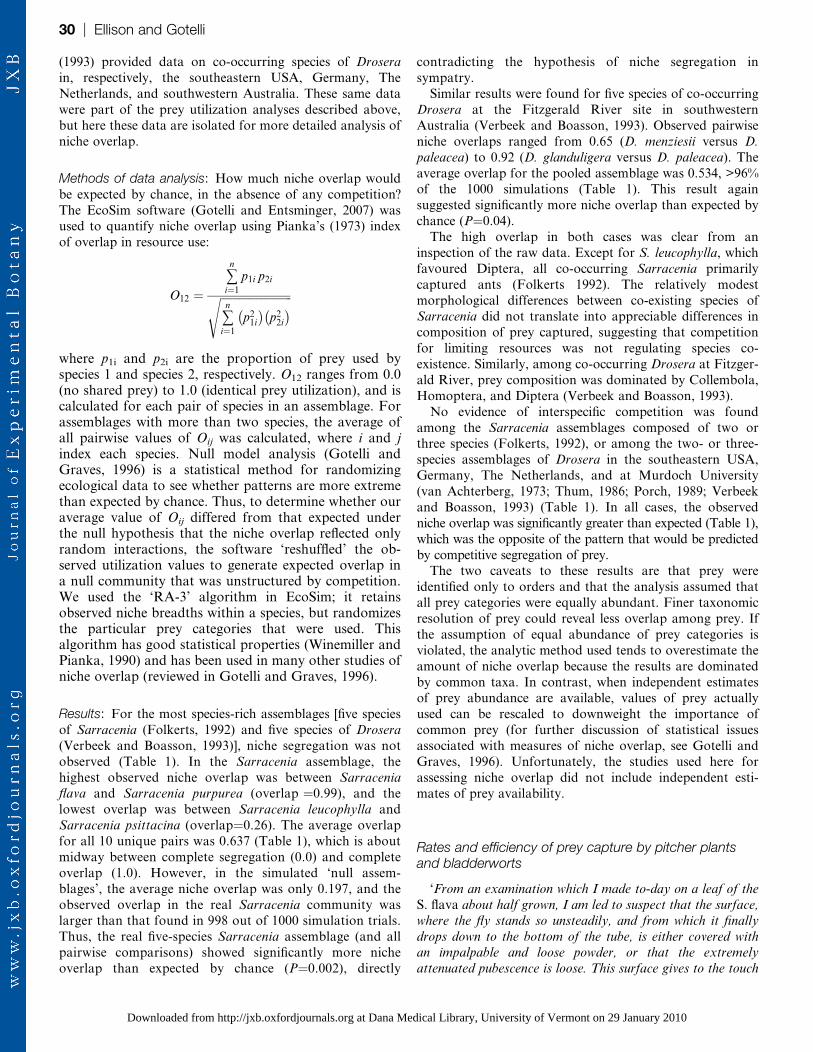
Table 1. Summary of null model analysis of niche overlap in prey utilization by congeneric carnivorous plants
Each row gives a different study and the number of co-existing congeneric species. Observed is the observed average pairwise niche overlap.Expected is the mean value of average pairwise niche overlap in 1000 randomizations of the resource utilization data. The P-value is the uppertail probability of finding the observed pattern if the data were drawn from the null distribution.
Niche overlap
Genus Site Species Observed Expected P
Sarraceniaa Okaloosa County, Florida, USA 5 0.637 0.197 0.002
Sarraceniab Santa Rosa County, Florida, USA 2 0.996 0.128 0.038
Sarraceniac Turner County, Georgia, USA 3 0.634 0.235 0.013
Sarraceniad Brunswick County, North Carolina, USA 3 0.975 0.128 0.001
Droserae Baldwin County, Alabama, USA 3 0.880 0.241 0.001
Droseraf Santa Rosa County, Florida, USA 2 0.868 0.256 0.001
Droserag Walton County, Florida, USA 2 0.738 0.205 0.031
Droserah Chiemsee, S. Bavaria, Germany 2 0.708 0.226 0.045
Droserai Eastern Netherlands 3 0.796 0.168 0.001
Droseraj Fitzgerald River, SW Australia 5 0.534 0.486 0.043
Droserak Murdoch University, SW Australia 3 0.801 0.614 0.001
a S. flava, S. leucophylla, S. rubra, S. purpurea, S. psittacina.b S. flava, S. psittacina.c S. flava, S. minor, S. psittacina;d S. flava, S. purpurea, S. rubra;e D. filiformis Raf. var. tracyi (Macf. ex Diels) Diels, D. intermedia Hayne, D. capillaris Poir.f D. intermedia, D. capillarisg D. filiformis var. tracyi, D. capillaris.h D. rotundifolia L., D. intermediai D. rotundifolia, D. intermedia, D. anglica Huds.j D. menziesii R.Br. ex. DC, D. drummondii Lehm. [¼ D. barbigera Planch.], D. glanduligera Lehm., D. paleacea DC, D. erythrorhiza Lindl.k D. pallida Lindl., D. stolonifera Endl., D. menziesii.
Carnivorous plants since Darwin | 31
at Dana Medical Library, University of Vermont on 29 January 2010 http://jxb.oxfordjournals.orgDownloaded from

local environmental conditions (Dıaz-Olarte et al., 2007), not
on a direct facilitation of periphyton growth by Utricularia
(cf. Ulanowicz, 1995). Determining causal relationships
between environmental conditions, morphological structures,
and prey capture rates and efficiency by Utricularia remains
an active area of research.
Do fly-traps really catch only large prey?
[Of 14 Dionaea leaves sent to Darwin by William M.
Canby], ‘[f]our of these had caught rather small insects, viz.
three of them ants, and the fourth a rather small fly, but the
other ten had all caught large insects, namely five elaters, two
chrysomelas, a curculio, a thick and broad spider, and
a scolopendra....But what most concerns us is the size of the
ten larger insects. Their average length from head to tail was
0.256 of an inch, the lobes of the leaves being on average 0.53
of an inch in length, so that the insects were very nearly half
as long as the leaves within which they were enclosed. Only
a few of these leaves, therefore, had wasted their powers by
capturing small prey, though it is probable that many small
insects had crawled over them and been caught, but had then
escaped through the bars.’
(Insectivorous plants, p. 252)
Our analyses suggest that carnivorous plants are not
selective predators with respect to prey composition.
However, is there any evidence that, as Darwin hypothe-
sized, they capture only relatively large prey? Here the data
are limited to two small collections of prey contents of the
Venus’ fly-trap, Dionaea muscipula (Darwin, 1875; Jones,
1923). In both cases, some assumptions had to be made toreconstruct the data and test the hypothesis that Dionaea
prey are unusually large.
Darwin (1875) provided the average size of only the 10
largest prey (0.256 inch¼6.5 mm); the sizes of the four
smaller prey items (three ants and a fly) were not reported.
Jones (1923) gave a bit more detail for 50 dissected Dionaea
leaves, each with one prey item: of the 50 prey items
recovered, ‘only one was less than 5 mm in length, and onlyseven, less than 6 mm; ten were 10mm or more in length, with
a maximum of 30 mm’ (Jones 1923: 593). Jones also reported
that the average length of the prey was 8.6 mm, and the
normal minimum observed was 6.4 mm (approximately the
average length of Darwin’s subsample).
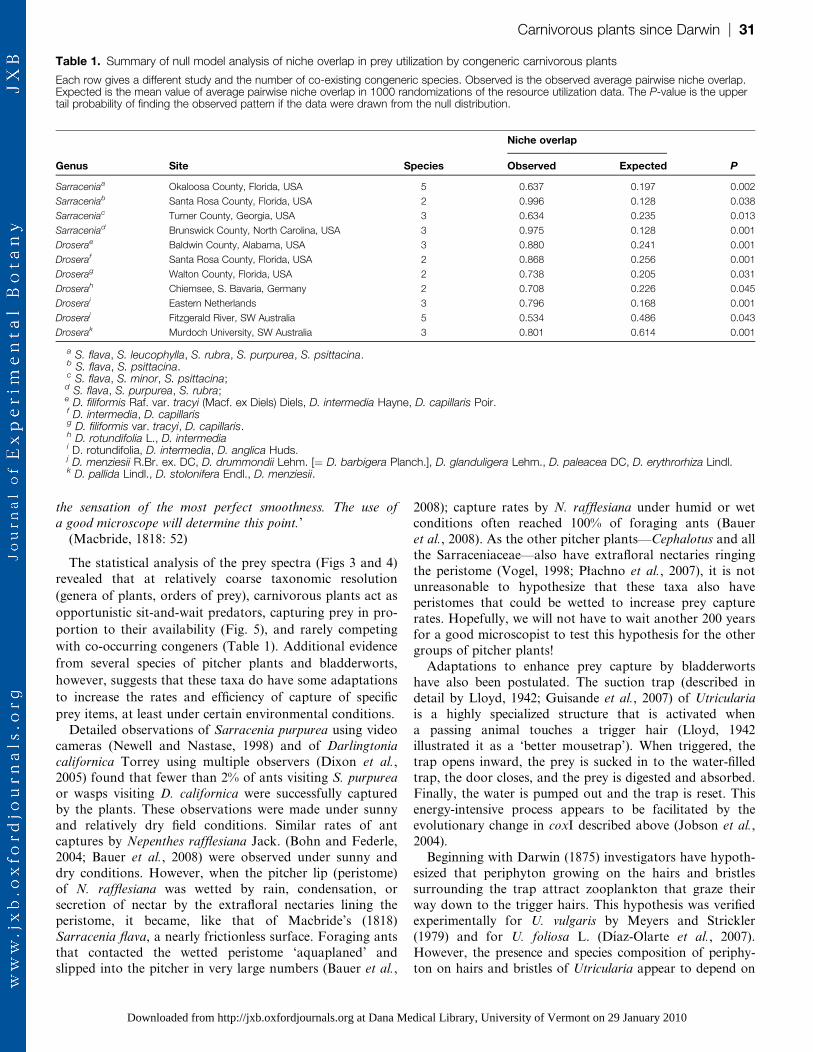
Based on Jones’s (1923) reported size intervals, prey size
distributions were simulated using R version 2.6.1 as being
drawn from a mixture of three normal distributions [N (5.5,0.25), N (20, 5), and N (8, 1)]12, with sample sizes respectively
equal to 7 (‘less than 6 mm’, but more than 5 mm), 10
(‘10mm or more in length, with a maximum of 30 mm’), and
32 (the remainder, unenumerated by Jones, but by inference
being between 6 and 10 mm long), plus one outlier (4 mm),
corresponding to the one ‘less than 5 mm in length’). This
mixture gave a skewed distribution of prey sizes with
mean¼9.3 mm, and a median¼7.6 mm. Darwin’s distribu-
tion of prey was similarly simulated as a mixture of two
normals: N (6.5, 1) and N (5.5, 0.25) with sample sizes of 10
and 4, respectively. Because Darwin gave no information on
the size of the four small prey items, the sample of small prey
sizes in this mixture was drawn from the same distribution asJones’s small prey. This mixture gave a skewed distribution
of prey sizes with mean¼6.0 mm and a median¼5.8 mm. The
two distributions are shown in Fig. 6.
The relevant question is whether either of these data sets
support the hypothesis that the average size of prey that
Dionaea captures is at least half the length of a 13.5 mm leaf
(Darwin’s ‘0.53 of an inch’). A plausible way to determine
this is to create replicate bootstrapped samples (i.e. withreplacement) of the available data and use these boot-
strapped samples to estimate the population mean and
confidence intervals (Efron, 1982).
The sample function in R was used to create 10 000
bootstrapped samples of both Darwin’s and Jones’s prey
size data. The estimated mean of the small population from
which Darwin drew his sample was 6 mm (95% CI¼5.70–
6.38), which fails to support the hypothesis that Dionaea
catches prey that is on average half as large as the trap (6.75
mm). In contrast, the estimated population mean of Jones’s
larger sample was 9.3 mm (95% CI¼7.92–10.86), a result
that is more in line with Darwin’s expectation.
What do they do with all that prey? Theenergetics of botanical carnivory
‘Ordinary plants.procure the requisite inorganic elements
from the soil by means of their roots....[T]here is a class of
plants which digest and afterwards absorb the animal matter,
namely, all the Droseraceae, Pinguicula, and, as discovered
by Dr. Hooker, Nepenthes.’
(Insectivorous plants, p. 365)
Based on his detailed observations of feeding behaviour
and nutrient absorption, Darwin discussed how carnivorous
structures might have evolved in plants. Later authors (e.g.
Lloyd, 1942; Juniper et al., 1989) generally followed hislead. Little attention was paid to why botanical carnivory
might evolve until Givnish et al. (1984) proposed a
cost–benefit model to explain why carnivorous plants are
most common in habitats that are bright and wet but very
low in nutrients. Givnish et al.’s (1984) model postulated
a trade-off between the nutrients gained by capturing
animals and the energy foregone by constructing photosyn-
thetically inefficient traps instead of leaves. Givnish et al.
(1984) asserted that carnivory would be expected to evolve
if the increased nutrients provided by carnivory gave plants
possessing carnivorous structure an energetic advantage
relative to co-occurring non-carnivorous plants. This model
was elaborated by Benzing (2000), who additionally
12 The notation N (l, r) means a normal distribution with mean ¼ l andstandard deviation ¼ r. We used the R function rnorm(.) to generate our sizedistributions.
32 | Ellison and Gotelli
at Dana Medical Library, University of Vermont on 29 January 2010 http://jxb.oxfordjournals.orgDownloaded from
considered decaying litter as a nutrient source and a third
axis of selection. Both models were initially derived from
studies of carnivorous bromeliads, but the cost–benefit
framework has been used to interpret results from a wide
range of observational and experimental studies on manycarnivorous plant species (reviewed by Ellison and Gotelli,
2001; Ellison, 2006).
The benefits of carnivory
Givnish et al. (1984) identified three ways in which nutrients
acquired through carnivory could result in energetic benefits
to the plants. First, photosynthesis could increase with
increasing nutrient uptake (following prey capture anddigestion). This photosynthetic benefit could be realized
through either an increase in the total mass of leaves the
plant can support or an increased Amass. Secondly, the
excess nutrients derived from carnivory could be dispropor-
tionately allocated to reproduction. This allocation to
reproduction should be measurable either as a positive
relationship between prey captured and seeds produced or
as an increase in nutrient content within the seeds. Thirdly,if carnivorous plants could extract carbon from prey, they
could bypass photosynthesis as a means of producing
sugars. This last benefit could be most important for
aquatic carnivorous plants, as CO2 used for photosynthesis
is often limiting because it must be obtained by diffusion
from the surrounding water (Adamec, 1997a, 1997b, 2006).
Most studies on the benefits of carnivory have found that
plants significantly increase growth (in terms of leaf mass ortotal biomass) in response to prey additions (see Table 1 of
Ellison, 2006). However, detailed measurements of photo-
synthesis of carnivorous plants in response to prey or
nutrient additions—the primary measure of the first hy-
pothesized benefit of carnivory—have generated more
equivocal results. Mendez and Karlsson (1999) reported no
significant increase in photosynthetic rates of Pinguicula
villosa L., P. vulgaris L., or Drosera rotundifolia when they
were provided supplemental prey. Adamec (2008) found
that the photosynthetic rate of Aldrovanda vesiculosa in-
creased following prey additions, but that of Utricularia
australis decreased following prey additions. However, for
both species, supplemental prey caused an increase ingrowth rates (Adamec, 2008). Wakefield et al. (2005) also
reported no significant change in photosynthetic rates of
Sarracenia purpurea pitchers fed additional prey in a field
study, although tissue N and P concentrations did increase
with feeding level. Nutrient storage in new Sarracenia
pitchers (Butler and Ellison, 2007) or reproductive struc-
tures (see below) are alternative sinks for excess nutrients
derived from prey captured by existing pitchers. Forexample, in a greenhouse study of prey addition to 10
species of Sarracenia, Amass increased in new pitchers, and
photosystem II stress (as measured by fluorescence) de-
creased with prey additions (Farnsworth and Ellison, 2008).
The second postulated benefit of carnivory has also been
demonstrated. Temperate-zone Pinguicula species, which
exhibit reproductive pre-formation (buds set in year y
flower and produce seeds in year y+1; Worley and Harder,
1999), increased vegetative reproduction in the year of prey
additions and also increased sexual reproduction in sub-
sequent years (Thoren and Karlsson, 1998; Worley and
Harder, 1999). In P. vallisneriifolia, neither flower set nor
fruit set changed with prey additions, but seed set (mea-
sured as seed:ovule ratio) did increase (Zamora et al., 1997).
A similar increase in seed:ovule ratio in response to prey
availability and inorganic nutrient addition was observed in
Sarracenia purpurea (Ne’eman et al., 2006), which also
makes pre-formed buds (Shreve, 1906). Three other Pingui-
cula species (P. alpina, P. villosa, and P. vulgaris) all
preferentially allocated nitrogen to reproductive structures
(Eckstein and Karlsson, 2001). Both fruit set and seed set of
Drosera intermedia and D. rotundifolia were positively
correlated with prey captured (Thum, 1989; Stewart and
Nilsen, 1992). Experimental prey additions subsequently
confirmed these correlative results (Thum, 1988).
In summary, increases in plant growth, nutrient storage,
and reproduction in response to increased prey have been
documented in a number of carnivorous plant species,although evidence for elevated photosynthetic rates is weak.
To date, there is only scant evidence for Givnish et al.’s
(1984) third prediction, that of heterotrophic uptake of C
from prey. Fabian-Galan and Savageanu (1968) found that14C from labelled Daphnia fed to both Aldrovanda vesiculosa
and Drosera capensis L. was incorporated into leaf and stem
tissues and into new growing tips of these carnivorous
plants. Similarly, Drosera erythrorhiza stored 14C fromlabelled flies in new growth (Dixon et al., 1980). Additional
evidence for facultative heterotrophy in carnivorous plants
is most likely to be found in aquatic carnivorous plants
(Adamec, 1997a, 1997b, 2006), as dissolved CO2 can limit
photosynthetic rates in submerged plants.
Fig. 6. Simulated frequency distributions of sizes of prey captured
by the Venus’ fly-trap, Dionaea muscipula, described by Darwin
(1875; black bars) and Jones (1923; grey bars). The arrow
indicates the average size of the Dionaea traps studied by Darwin
(Jones did not report trap size).
Carnivorous plants since Darwin | 33
at Dana Medical Library, University of Vermont on 29 January 2010 http://jxb.oxfordjournals.orgDownloaded from

The costs of carnivory
The costs of carnivory have been assessed much less
frequently than the benefits, perhaps because measuring
energy foregone is more difficult than measuring increased
growth, photosynthetic rates, or seed set. However, the
existing measurements do suggest that the costs can be
substantial. Among carnivorous plants with flypaper traps,
carbon and nutrients (in proteins) must be allocated to
construction of specialized leaf glands, sticky mucilage, and
digestive enzymes. Pate (unpublished data, as cited in Pate,
1986, p. 320) reported that Australian Drosera spp.
allocated 3–6% of net photosynthate to the production of
mucilage for leaf glands. In shaded conditions when light
levels fell well below photosynthetic saturation, Pinguicula
vallisneriifolia reduced its mucilage production, presumably
because it lacked sufficient carbon (Zamora et al., 1998). At
the opposite extreme, when nutrients were added to the soil,
Drosera rotundifolia reduced its mucus gland production
(Thoren et al., 2003). This result was attributable to the
avoidance of the costs of carnivory when nutrients were
obtained at a lower carbon cost.
Similar plasticity has been observed in Utricularia spp. and
Sarracenia spp. When prey or dissolved nutrients were
plentiful, the number of carnivorous bladders declined
significantly in U. macrorhiza Le Conte (Knight and Frost,
1991), U. vulgaris (Friday, 1992), and U. foliosa (Guisande
et al., 2000, 2004). Bladder traps are photosynthetically
inefficient, and Knight (1992) calculated that U. macrorhiza
of a given mass without bladders would grow 1.2–4.73 faster
than U. macrorhiza of the same mass with bladders. Like-
wise, Sarracenia purpurea produced non-carnivorous leaves
(phyllodia) when inorganic nutrients were added to levels
comparable with atmospheric inputs from anthropogenic
sources, and these phyllodia photosynthesized ;25% faster
than did carnivorous pitchers (Ellison and Gotelli, 2002).
Similar results were obtained for S. purpurea and eight other
species of Sarracenia fed supplemental prey (Farnsworth and
Ellison, 2008). The related Darlingtonia californica had
absolute levels of Amass of carnivorous plants that were 30–
50% lower than predicted from scaling relationships between
leaf nitrogen content and Amass of non-carnivorous plants
(Ellison and Farnsworth, 2005), and similar departures from
the universal spectrum of leaf traits have been observed for
other species of Sarracenia (Farnsworth and Ellison, 2008).Photosystems of carnivorous plants do appear to be
nutrient limited. Fluorescence measurements of greenhouse-
grown Sarracenia species suggested significant ‘stress’ of
photosystem II at low levels of prey capture, and this stress
was alleviated by prey additions (Farnsworth and Ellison,
2008). Observations of spectral reflectance also implied low
chlorophyll content and similar photosystem stress in
Nepenthes rafflesiana in the field (Moran and Moran,1998). Overall photosynthetic nitrogen use efficiency (lmol
CO2 mol N s�1; Aerts and Chapin, 2000) is 50% lower for
carnivorous plants than for non-carnivorous plants
(P¼1.3310�14, t-test; Fig. 7); and photosynthetic phospho-
rus use efficiency is 60% lower for carnivorous plants than
for non-carnivorous plants (P¼5.5310�7, t-test; Fig. 7).
These data on photosynthetic nutrient use efficiency further
support the hypothesis that carnivorous plants are outliers
with respect to scaling relationships between tissue nutrient
content and Amass that have been compiled for thousands of
non-carnivorous species (Wright et al., 2004, 2005). How-
ever, the data for non-carnivorous plants come from a wide
range of habitats and plant life-forms. It is not knownwhether carnivorous plants have higher photosynthetic
nutrient use efficiencies than co-occurring non-carnivorous
plants. However, there is no evidence to suggest that
carnivorous plants and non-carnivorous plants are actually
competing for nutrients (Brewer, 1999a, 1999b, 2003).
Can carnivorous plants escape Hobson’s Choice?
Where to elect there is but one,
‘Tis Hobson’s choice—take that, or none.
(from England’s reformation, by Thomas Ward; 1710)
The observations that carnivory appears to be energeti-
cally costly, that excess nutrients do not lead directly to
increasing photosynthetic rates in existing leaves or traps,
and that photosynthetic nutrient use efficiency of carnivo-rous plants is extremely low led Ellison and Farnsworth
(2005) to suggest that botanical carnivory is an evolutionary
Hobson’s Choice—the last resort when nutrients are
scarcely available from the soil. Two new lines of evidence
challenge this interpretation, however.
First, two recent studies have shown that the actual
energetic costs of constructing carnivorous traps are signifi-
cantly lower than the energetic costs of constructing phyllodiaof carnivorous plants (Osunkoya et al., 2007; Karagatzides
and Ellison, 2009) or leaves of non-carnivorous plants
(Fig. 8). These data include not only ‘passive’ traps (flypaper
traps of Drosera, pitfall traps of Nepenthes and Sarracenia)
but also the ‘active’ snap-traps of Dionaea. Thus, carnivorous
traps are relatively inexpensive structures that provide sub-
stantial nutrient gain for little energetic cost; thus, it would
take very little photosynthetic gain to yield a substantialmarginal benefit13 from a small investment in carnivory.
Not all active traps are equally active, however. The
snap-trap of the Venus’ fly-trap uses a mechanical trigger
(the mechanism of which is still poorly understood)
passively to release elastic energy stored in the fully
hydrated leaf (Forterre et al., 2005). This relatively cheap
trap is rarely reset; rather, after one (rarely two or three)
captures, the trap senesces (Darwin, 1875). In contrast,Utricularia’s suction trap is used multiple times, and must
be reset after it captures prey (Lloyd, 1942). Pumping out
water is an energetically expensive process, and how
Utricularia bears this cost has come to light only recently.
Jobson et al. (2004) found that the coxI gene in
Utricularia has a markedly different structure—with two
13 The marginal benefit is the difference between the total photosyntheticincrease resulting from nutrients gained from producing a new trap and the totalphotosynthetic cost of producing a trap as opposed to a phyllode or otherphotosynthetically more efficient structure.)
34 | Ellison and Gotelli
at Dana Medical Library, University of Vermont on 29 January 2010 http://jxb.oxfordjournals.orgDownloaded from
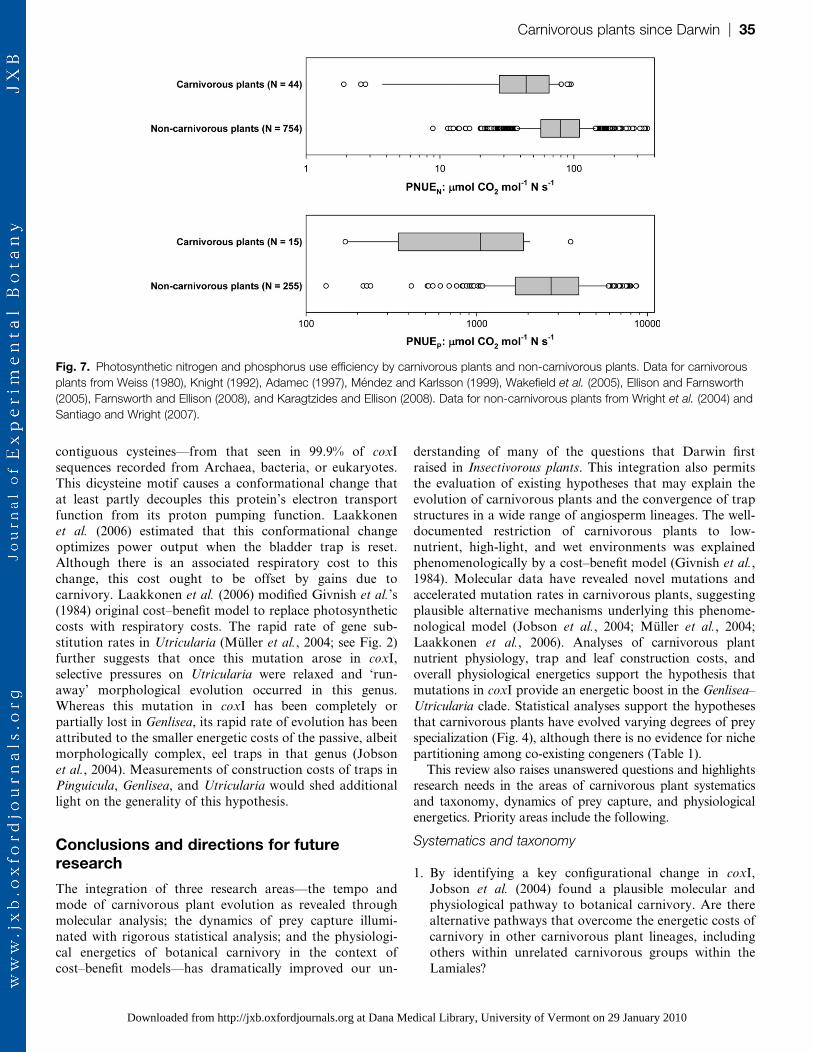
contiguous cysteines—from that seen in 99.9% of coxI
sequences recorded from Archaea, bacteria, or eukaryotes.
This dicysteine motif causes a conformational change that
at least partly decouples this protein’s electron transport
function from its proton pumping function. Laakkonenet al. (2006) estimated that this conformational change
optimizes power output when the bladder trap is reset.
Although there is an associated respiratory cost to this
change, this cost ought to be offset by gains due to
carnivory. Laakkonen et al. (2006) modified Givnish et al.’s
(1984) original cost–benefit model to replace photosynthetic
costs with respiratory costs. The rapid rate of gene sub-
stitution rates in Utricularia (Muller et al., 2004; see Fig. 2)further suggests that once this mutation arose in coxI,
selective pressures on Utricularia were relaxed and ‘run-
away’ morphological evolution occurred in this genus.
Whereas this mutation in coxI has been completely or
partially lost in Genlisea, its rapid rate of evolution has been
attributed to the smaller energetic costs of the passive, albeit
morphologically complex, eel traps in that genus (Jobson
et al., 2004). Measurements of construction costs of traps inPinguicula, Genlisea, and Utricularia would shed additional
light on the generality of this hypothesis.
Conclusions and directions for futureresearch
The integration of three research areas—the tempo andmode of carnivorous plant evolution as revealed through
molecular analysis; the dynamics of prey capture illumi-
nated with rigorous statistical analysis; and the physiologi-
cal energetics of botanical carnivory in the context of
cost–benefit models—has dramatically improved our un-
derstanding of many of the questions that Darwin first
raised in Insectivorous plants. This integration also permits
the evaluation of existing hypotheses that may explain the
evolution of carnivorous plants and the convergence of trap
structures in a wide range of angiosperm lineages. The well-documented restriction of carnivorous plants to low-
nutrient, high-light, and wet environments was explained
phenomenologically by a cost–benefit model (Givnish et al.,
1984). Molecular data have revealed novel mutations and
accelerated mutation rates in carnivorous plants, suggesting
plausible alternative mechanisms underlying this phenome-
nological model (Jobson et al., 2004; Muller et al., 2004;
Laakkonen et al., 2006). Analyses of carnivorous plantnutrient physiology, trap and leaf construction costs, and
overall physiological energetics support the hypothesis that
mutations in coxI provide an energetic boost in the Genlisea–
Utricularia clade. Statistical analyses support the hypotheses
that carnivorous plants have evolved varying degrees of prey
specialization (Fig. 4), although there is no evidence for niche
partitioning among co-existing congeners (Table 1).
This review also raises unanswered questions and highlightsresearch needs in the areas of carnivorous plant systematics
and taxonomy, dynamics of prey capture, and physiological
energetics. Priority areas include the following.
Systematics and taxonomy
1. By identifying a key configurational change in coxI,
Jobson et al. (2004) found a plausible molecular andphysiological pathway to botanical carnivory. Are there
alternative pathways that overcome the energetic costs of
carnivory in other carnivorous plant lineages, including
others within unrelated carnivorous groups within the
Lamiales?
Fig. 7. Photosynthetic nitrogen and phosphorus use efficiency by carnivorous plants and non-carnivorous plants. Data for carnivorous
plants from Weiss (1980), Knight (1992), Adamec (1997), Mendez and Karlsson (1999), Wakefield et al. (2005), Ellison and Farnsworth
(2005), Farnsworth and Ellison (2008), and Karagtzides and Ellison (2008). Data for non-carnivorous plants from Wright et al. (2004) and
Santiago and Wright (2007).
Carnivorous plants since Darwin | 35
at Dana Medical Library, University of Vermont on 29 January 2010 http://jxb.oxfordjournals.orgDownloaded from

2. Molecular data have strongly supported infrageneric mor-
phology-based classification systems for the speciose car-
nivorous genera of Utricularia and Genlisea, but do not
agree with morphological-based classifications of Drosera,
Pinguicula, or Sarracenia. Better integration of morpholog-ical and molecular data (cf. Williams et al., 1994), along
with full genomic sequences of representative carnivorous
plant species, could help to resolve phylogenies of many
groups of carnivorous plants
3. Complete genomic data also would allow for less biased
estimates of mutation rates in carnivorous plants relative
to non-carnivorous plants, and could provide an explana-
tion for the remarkably low C-values found in Utricularia
and Genlisea (Greilhuber et al., 2006). C-values are well
known to be correlated with cell size (Gregory, 2001),
which in turn may be correlated with bladder size.
Further analysis of the relationship between trap size
(and prey capture rates; see, for example, Sanabria-
Aranda et al., 2006), cell size, and C-values of Utricularia
would be illuminating.
4. The genetic analyses to date have suggested some bio-
geographical anomalies. Examples include repeated trans-
oceanic dispersal events in Drosera; repeated
colonizations of the Indonesian islands by Nepenthes;
and evidence that Darlingtonia is sister to a Sarracenia–
Heliamphora clade. As better distributional data and
genetic data become available, these should be explicitly
linked (using tools such as GeoPhyloBuilder14) to create
formal phylogeographic hypotheses regarding the origin
and diversification of carnivorous plants.
Dynamics of prey capture
1. Prey capture data should be better resolved taxonomically;
existing, ordinal data clearly are quite coarse, but family-
Fig. 8. Box plots illustrating leaf construction costs for traps of 23 carnivorous plants (data from Osunkoya et al., 2007; Karagatzides
and Ellison, 2008) and 269 non-carnivorous plants (data summarized in Karagatzides and Ellison, 2009)15. The scatter plot illustrates the
difference between construction costs of traps and laminae of Nepenthes (filled symbols); or phyllodia and pitchers of three species of
Sarracenia (open symbols) (data from Osunkoya et al., 2007; Karagatzides and Ellison, 2009); the dotted line indicates the location where
the construction costs of traps and laminae would be equal.
14 https://www.nescent.org/wg_EvoViz/GeoPhyloBuilder.15 Data available from the Harvard Forest Data Archive, dataset HF-112: http://harvardforest.fas.harvard.edu/data/p11/hfX112/hf112.html.
36 | Ellison and Gotelli
at Dana Medical Library, University of Vermont on 29 January 2010 http://jxb.oxfordjournals.orgDownloaded from
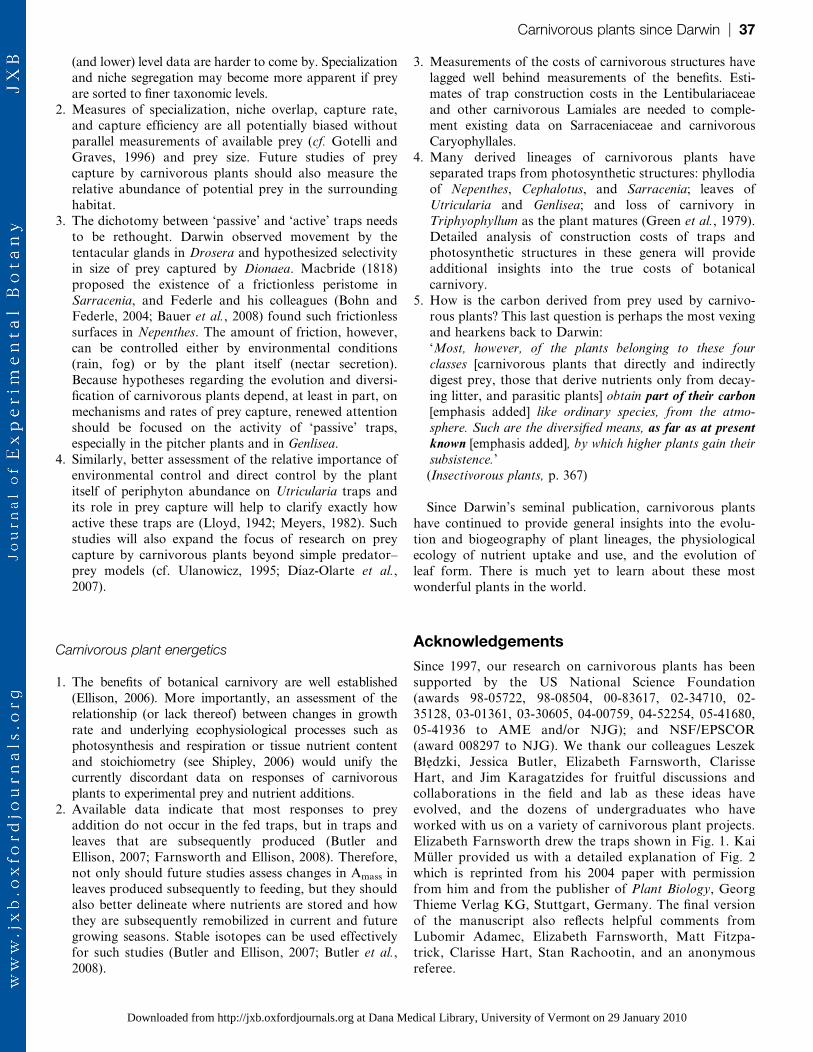
(and lower) level data are harder to come by. Specialization
and niche segregation may become more apparent if prey
are sorted to finer taxonomic levels.
2. Measures of specialization, niche overlap, capture rate,
and capture efficiency are all potentially biased without
parallel measurements of available prey (cf. Gotelli and
Graves, 1996) and prey size. Future studies of prey
capture by carnivorous plants should also measure therelative abundance of potential prey in the surrounding
habitat.
3. The dichotomy between ‘passive’ and ‘active’ traps needs
to be rethought. Darwin observed movement by the
tentacular glands in Drosera and hypothesized selectivity
in size of prey captured by Dionaea. Macbride (1818)
proposed the existence of a frictionless peristome in
Sarracenia, and Federle and his colleagues (Bohn andFederle, 2004; Bauer et al., 2008) found such frictionless
surfaces in Nepenthes. The amount of friction, however,
can be controlled either by environmental conditions
(rain, fog) or by the plant itself (nectar secretion).
Because hypotheses regarding the evolution and diversi-
fication of carnivorous plants depend, at least in part, on
mechanisms and rates of prey capture, renewed attention
should be focused on the activity of ‘passive’ traps,especially in the pitcher plants and in Genlisea.
4. Similarly, better assessment of the relative importance of
environmental control and direct control by the plant
itself of periphyton abundance on Utricularia traps and
its role in prey capture will help to clarify exactly how
active these traps are (Lloyd, 1942; Meyers, 1982). Such
studies will also expand the focus of research on prey
capture by carnivorous plants beyond simple predator–prey models (cf. Ulanowicz, 1995; Dıaz-Olarte et al.,
2007).
Carnivorous plant energetics
1. The benefits of botanical carnivory are well established
(Ellison, 2006). More importantly, an assessment of the
relationship (or lack thereof) between changes in growth
rate and underlying ecophysiological processes such as
photosynthesis and respiration or tissue nutrient content
and stoichiometry (see Shipley, 2006) would unify thecurrently discordant data on responses of carnivorous
plants to experimental prey and nutrient additions.
2. Available data indicate that most responses to prey
addition do not occur in the fed traps, but in traps and
leaves that are subsequently produced (Butler and
Ellison, 2007; Farnsworth and Ellison, 2008). Therefore,
not only should future studies assess changes in Amass in
leaves produced subsequently to feeding, but they shouldalso better delineate where nutrients are stored and how
they are subsequently remobilized in current and future
growing seasons. Stable isotopes can be used effectively
for such studies (Butler and Ellison, 2007; Butler et al.,
2008).
3. Measurements of the costs of carnivorous structures have
lagged well behind measurements of the benefits. Esti-
mates of trap construction costs in the Lentibulariaceae
and other carnivorous Lamiales are needed to comple-
ment existing data on Sarraceniaceae and carnivorous
Caryophyllales.
4. Many derived lineages of carnivorous plants have
separated traps from photosynthetic structures: phyllodiaof Nepenthes, Cephalotus, and Sarracenia; leaves of
Utricularia and Genlisea; and loss of carnivory in
Triphyophyllum as the plant matures (Green et al., 1979).
Detailed analysis of construction costs of traps and
photosynthetic structures in these genera will provide
additional insights into the true costs of botanical
carnivory.
5. How is the carbon derived from prey used by carnivo-rous plants? This last question is perhaps the most vexing
and hearkens back to Darwin:
‘Most, however, of the plants belonging to these four
classes [carnivorous plants that directly and indirectly
digest prey, those that derive nutrients only from decay-
ing litter, and parasitic plants] obtain part of their carbon[emphasis added] like ordinary species, from the atmo-
sphere. Such are the diversified means, as far as at presentknown [emphasis added], by which higher plants gain their
subsistence.’
(Insectivorous plants, p. 367)
Since Darwin’s seminal publication, carnivorous plants
have continued to provide general insights into the evolu-
tion and biogeography of plant lineages, the physiological
ecology of nutrient uptake and use, and the evolution of
leaf form. There is much yet to learn about these most
wonderful plants in the world.
Acknowledgements
Since 1997, our research on carnivorous plants has been
supported by the US National Science Foundation
(awards 98-05722, 98-08504, 00-83617, 02-34710, 02-
35128, 03-01361, 03-30605, 04-00759, 04-52254, 05-41680,
05-41936 to AME and/or NJG); and NSF/EPSCOR
(award 008297 to NJG). We thank our colleagues Leszek
B1edzki, Jessica Butler, Elizabeth Farnsworth, ClarisseHart, and Jim Karagatzides for fruitful discussions and
collaborations in the field and lab as these ideas have
evolved, and the dozens of undergraduates who have
worked with us on a variety of carnivorous plant projects.
Elizabeth Farnsworth drew the traps shown in Fig. 1. Kai
Muller provided us with a detailed explanation of Fig. 2
which is reprinted from his 2004 paper with permission
from him and from the publisher of Plant Biology, GeorgThieme Verlag KG, Stuttgart, Germany. The final version
of the manuscript also reflects helpful comments from
Lubomir Adamec, Elizabeth Farnsworth, Matt Fitzpa-
trick, Clarisse Hart, Stan Rachootin, and an anonymous
referee.
Carnivorous plants since Darwin | 37
at Dana Medical Library, University of Vermont on 29 January 2010 http://jxb.oxfordjournals.orgDownloaded from
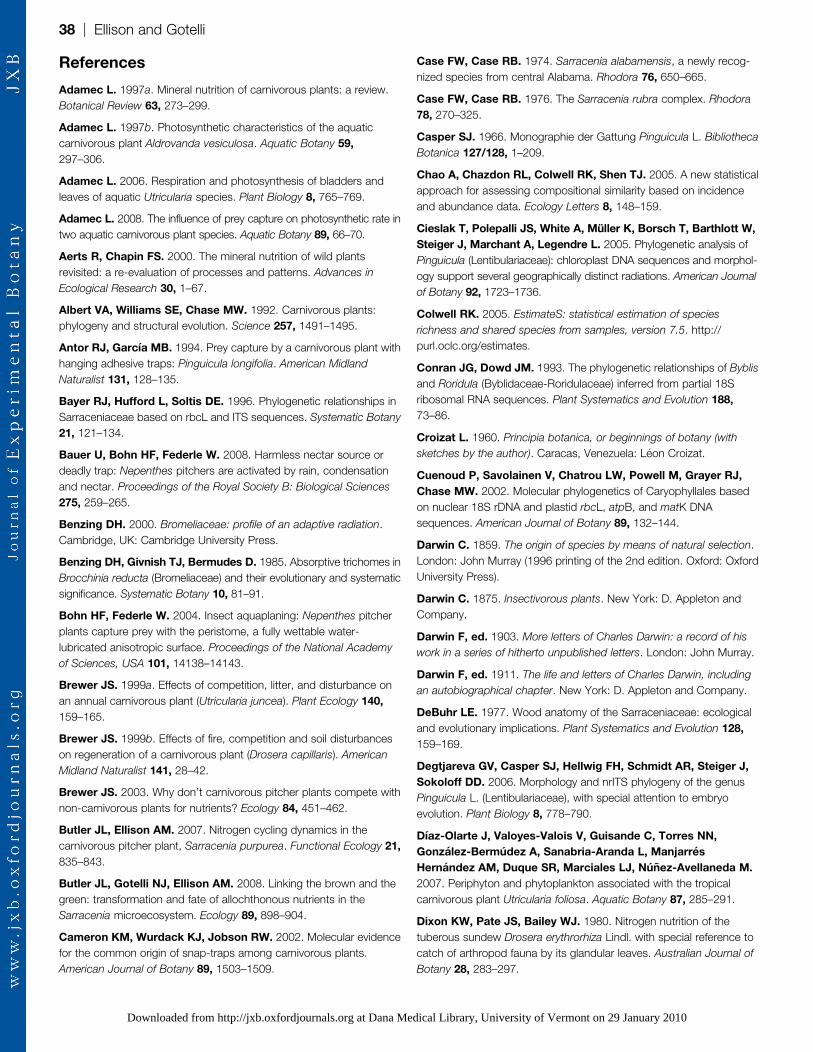
References
Adamec L. 1997a. Mineral nutrition of carnivorous plants: a review.
Botanical Review 63, 273–299.
Adamec L. 1997b. Photosynthetic characteristics of the aquatic
carnivorous plant Aldrovanda vesiculosa. Aquatic Botany 59,
297–306.
Adamec L. 2006. Respiration and photosynthesis of bladders and
leaves of aquatic Utricularia species. Plant Biology 8, 765–769.
Adamec L. 2008. The influence of prey capture on photosynthetic rate in
two aquatic carnivorous plant species. Aquatic Botany 89, 66–70.
Aerts R, Chapin FS. 2000. The mineral nutrition of wild plants
revisited: a re-evaluation of processes and patterns. Advances in
Ecological Research 30, 1–67.
Albert VA, Williams SE, Chase MW. 1992. Carnivorous plants:
phylogeny and structural evolution. Science 257, 1491–1495.
Antor RJ, Garcıa MB. 1994. Prey capture by a carnivorous plant with
hanging adhesive traps: Pinguicula longifolia. American Midland
Naturalist 131, 128–135.
Bayer RJ, Hufford L, Soltis DE. 1996. Phylogenetic relationships in
Sarraceniaceae based on rbcL and ITS sequences. Systematic Botany
21, 121–134.
Bauer U, Bohn HF, Federle W. 2008. Harmless nectar source or
deadly trap: Nepenthes pitchers are activated by rain, condensation
and nectar. Proceedings of the Royal Society B: Biological Sciences
275, 259–265.
Benzing DH. 2000. Bromeliaceae: profile of an adaptive radiation.
Cambridge, UK: Cambridge University Press.
Benzing DH, Givnish TJ, Bermudes D. 1985. Absorptive trichomes in
Brocchinia reducta (Bromeliaceae) and their evolutionary and systematic
significance. Systematic Botany 10, 81–91.
Bohn HF, Federle W. 2004. Insect aquaplaning: Nepenthes pitcher
plants capture prey with the peristome, a fully wettable water-
lubricated anisotropic surface. Proceedings of the National Academy
of Sciences, USA 101, 14138–14143.
Brewer JS. 1999a. Effects of competition, litter, and disturbance on
an annual carnivorous plant (Utricularia juncea). Plant Ecology 140,
159–165.
Brewer JS. 1999b. Effects of fire, competition and soil disturbances
on regeneration of a carnivorous plant (Drosera capillaris). American
Midland Naturalist 141, 28–42.
Brewer JS. 2003. Why don’t carnivorous pitcher plants compete with
non-carnivorous plants for nutrients? Ecology 84, 451–462.
Butler JL, Ellison AM. 2007. Nitrogen cycling dynamics in the
carnivorous pitcher plant, Sarracenia purpurea. Functional Ecology 21,
835–843.
Butler JL, Gotelli NJ, Ellison AM. 2008. Linking the brown and the
green: transformation and fate of allochthonous nutrients in the
Sarracenia microecosystem. Ecology 89, 898–904.
Cameron KM, Wurdack KJ, Jobson RW. 2002. Molecular evidence
for the common origin of snap-traps among carnivorous plants.
American Journal of Botany 89, 1503–1509.
Case FW, Case RB. 1974. Sarracenia alabamensis, a newly recog-
nized species from central Alabama. Rhodora 76, 650–665.
Case FW, Case RB. 1976. The Sarracenia rubra complex. Rhodora
78, 270–325.
Casper SJ. 1966. Monographie der Gattung Pinguicula L. Bibliotheca
Botanica 127/128, 1–209.
Chao A, Chazdon RL, Colwell RK, Shen TJ. 2005. A new statistical
approach for assessing compositional similarity based on incidence
and abundance data. Ecology Letters 8, 148–159.
Cieslak T, Polepalli JS, White A, Muller K, Borsch T, Barthlott W,
Steiger J, Marchant A, Legendre L. 2005. Phylogenetic analysis of
Pinguicula (Lentibulariaceae): chloroplast DNA sequences and morphol-
ogy support several geographically distinct radiations. American Journal
of Botany 92, 1723–1736.
Colwell RK. 2005. EstimateS: statistical estimation of species
richness and shared species from samples, version 7.5. http://
purl.oclc.org/estimates.
Conran JG, Dowd JM. 1993. The phylogenetic relationships of Byblis
and Roridula (Byblidaceae-Roridulaceae) inferred from partial 18S
ribosomal RNA sequences. Plant Systematics and Evolution 188,
73–86.
Croizat L. 1960. Principia botanica, or beginnings of botany (with
sketches by the author). Caracas, Venezuela: Leon Croizat.
Cuenoud P, Savolainen V, Chatrou LW, Powell M, Grayer RJ,
Chase MW. 2002. Molecular phylogenetics of Caryophyllales based
on nuclear 18S rDNA and plastid rbcL, atpB, and matK DNA
sequences. American Journal of Botany 89, 132–144.
Darwin C. 1859. The origin of species by means of natural selection.
London: John Murray (1996 printing of the 2nd edition. Oxford: Oxford
University Press).
Darwin C. 1875. Insectivorous plants. New York: D. Appleton and
Company.
Darwin F, ed. 1903. More letters of Charles Darwin: a record of his
work in a series of hitherto unpublished letters. London: John Murray.
Darwin F, ed. 1911. The life and letters of Charles Darwin, including
an autobiographical chapter. New York: D. Appleton and Company.
DeBuhr LE. 1977. Wood anatomy of the Sarraceniaceae: ecological
and evolutionary implications. Plant Systematics and Evolution 128,
159–169.
Degtjareva GV, Casper SJ, Hellwig FH, Schmidt AR, Steiger J,
Sokoloff DD. 2006. Morphology and nrITS phylogeny of the genus
Pinguicula L. (Lentibulariaceae), with special attention to embryo
evolution. Plant Biology 8, 778–790.
Dıaz-Olarte J, Valoyes-Valois V, Guisande C, Torres NN,
Gonzalez-Bermudez A, Sanabria-Aranda L, Manjarres
Hernandez AM, Duque SR, Marciales LJ, Nunez-Avellaneda M.
2007. Periphyton and phytoplankton associated with the tropical
carnivorous plant Utricularia foliosa. Aquatic Botany 87, 285–291.
Dixon KW, Pate JS, Bailey WJ. 1980. Nitrogen nutrition of the
tuberous sundew Drosera erythrorhiza Lindl. with special reference to
catch of arthropod fauna by its glandular leaves. Australian Journal of
Botany 28, 283–297.
38 | Ellison and Gotelli
at Dana Medical Library, University of Vermont on 29 January 2010 http://jxb.oxfordjournals.orgDownloaded from

Dixon PM, Ellison AM, Gotelli NJ. 2005. Improving the precision of
estimates of the frequency of rare events. Ecology 86, 1114–1123.
Eckstein RL, Karlsson PS. 2001. The effect of reproduction on
nitrogen use-efficiency of three species of the carnivorous genus
Pinguicula. Journal of Ecology 89, 798–806.
Efron B. 1982. The jackknife, the bootstrap, and other resampling
plans. Society of Industrial and Applied Mathematics Monograph 38,
1–92.
Ellison AM. 2006. Nutrient limitation and stoichiometry of carnivorous
plants. Plant Biology 8, 740–747.
Ellison AM, Buckley HL, Miller TE, Gotelli NJ. 2004. Morphological
variation in Sarracenia purpurea (Sarraceniaceae): geographic, envi-
ronmental, and taxonomic correlates. American Journal of Botany 91,
1930–1935.
Ellison AM, Farnsworth EJ. 2005. The cost of carnivory for Darling-
tonia californica (Sarraceniaceae): evidence from relationships among
leaf traits. American Journal of Botany 92, 1085–1093.
Ellison AM, Gotelli NJ. 2001. Evolutionary ecology of carnivorous
plants. Trends in Ecology and Evolution 16, 623–629.
Ellison AM, Gotelli NJ. 2002. Nitrogen availability alters the
expression of carnivory in the northern pitcher plant Sarracenia
purpurea. Proceedings of the National Academy of Sciences, USA 99,
4409–4412.
Ellison AM, Gotelli NJ, Brewer JS, Cochran-Stafira DL, Kneitel J,
Miller TE, Worley AC, Zamora R. 2003. The evolutionary ecology of
carnivorous plants. Advances in Ecological Research 33, 1–74.
Evans RE, MacRoberts BR, Gibson TC, MacRoberts MH. 2002.
Mass capture of insects by the pitcher plant Sarracenia alata
(Sarraceniaceae) in southwest Louisiana and southeast Texas. Texas
Journal of Science 54, 339–346.
Fabian-Galan G, Salageanu N. 1968. Considerations on the
nutrition of certain carnivorous plants (Drosera capensis and Aldro-
vanda vesiculosa). Revue Roumaine de Biologie, Serie de Botanique
13, 275–280.
Farnsworth EJ, Ellison AM. 2008. Prey availability directly affects
physiology, growth, nutrient allocation and scaling relationships among
leaf traits in 10 carnivorous plant species. Journal of Ecology 96,
213–221.
Fischer E, Porembski S, Barthlott W. 2000. Revision of the genus
Genlisea (Lentibulariaceae) in Africa and Madagascar with notes on
ecology and phytogeography. Nordic Journal of Botany 20, 291–318.
Folkerts DR. 1992. Interactions of pitcher plants (Sarracenia:
Sarraceniaceae) with their arthropod prey in the southeastern United
States. PhD thesis, University of Georgia, Athens, Georgia.
Forterre Y, Skotheim JM, Dumais J, Mahadevan L. 2005. How
the Venus flytrap snaps. Nature 433, 421–425.
Frank JH, O’Meara GF. 1984. The bromeliad Catopsis berteroniana
traps terrestrial arthropods but harbors Wyeomyia larvae (Diptera:
Culicidae). Florida Entomologist 67, 418–424.
Friday LE. 1992. Measuring investiment in carnivory: seasonal and
individual variation in trap number and biomass in Utricularia vulgaris L.
New Phytologist 121, 439–445.
Givnish TJ, Burkhardt EL, Happel RE, Weintraub JD. 1984.
Carnivory in the bromeliad Brocchinia reducta, with a cost/benefit
model for the general restriction of carnivorous plants to sunny, moist
nutrient-poor habitats. American Naturalist 124, 479–497.
Gleason HA, Cronquist A. 1991. Manual of vascular plants of
northeastern United States and adjacent Canada. Bronx, NY: New
York Botanical Garden.
Godt MJW, Hamrick JL. 1998. Allozyme diversity in the endangered
pitcher plant Sarracenia rubra ssp. alabamensis (Sarraceniaceae) and
its close relative S. rubra ssp. rubra. American Journal of Botany 85,
802–810.
Godt MJW, Hamrick JL. 1999. Genetic divergence among infra-
specific taxa of Sarracenia purpurea. Systematic Botany 23, 427–438.
Gotelli NJ. 2008. A primer of ecology, 4th edn. Sunderland, MA:
Sinauer Associates.
Gotelli NJ, Ellison AM. 2004. A primer of ecological statistics.
Sunderland, MA: Sinauer Associates.
Gotelli NJ, Entsminger GL. 2007. EcoSim: null models software for
ecology, version 7. Jericho, Vermont: Acquired Intelligence Inc. &
Kesey-Bear. http://garyentsminger.com/ecosim.htm.
Gotelli NJ, Graves GR. 1996. Null models in ecology. Washington,
DC: Smithsonian Institution Press.
Green S, Green TL, Heslop-Harrison Y. 1979. Seasonal hetero-
phylly and leaf gland features in Triphyophyllum (Dioncophyllaceae),
a new carnivorous plant genus. Botanical Journal of the Linnean
Society 78, 99–116.
Gregory TR. 2001. Coincidence, coevolution or causation? DNA
content, cell size, and the C-value enigma. Biological Reviews 76,
65–101.
Greilhuber J, Borsch T, Muller K, Worberg A, Porembski S,
Barthlott W. 2006. Smallest angiosperm genomes found in
Lentibulariaceae, with chromosomes of bacterial size. Plant Biology
8, 770–777.
Guisande C, Granado-Lorencio C, Andrade-Sossa C, Roberto
Duque SR. 2007. Bladderworts. Functional Plant Science and
Biotechnology 1, 58–68.
Guisande C, Andrade C, Granado-Lorencio C, Duque SR,
Nunez-Avellaneda M. 2000. Effects of zooplankton and conductivity
on tropical Utricularia foliosa investment in carnivory. Aquatic Ecology
34, 137–142.
Guisande C, Aranguren N, Andrade-Sossa C, Prat N, Granado-
Lorencio C, Barrios ML, Bolivar A, Nunez-Avellaneda M,
Duque SR. 2004. Relative balance of the cost and benefit associated
with carnivory in the tropical Utricularia foliosa. Aquatic Botany 80,
271–282.
Harms S. 1999. Prey selection in three species of the carnivorous
aquatic plant Utricularia (bladderwort). Archiv fur Hydrobiologie 146,
449–470.
Hepburn JS, Saint John EQ, Jones FM. 1919. Biochemical studies
of insectivorous plants. Contributions from the Botanical Laboratory of
the University of Pennsylvania 4, 419–463.
Hepburn JS, Saint John EQ, Jones FM. 1927. The biochemistry of
the American pitcher plants. Transactions of the Wagner Free Institute
of Science of Philadelphia 11, 1–95.
Carnivorous plants since Darwin | 39
at Dana Medical Library, University of Vermont on 29 January 2010 http://jxb.oxfordjournals.orgDownloaded from
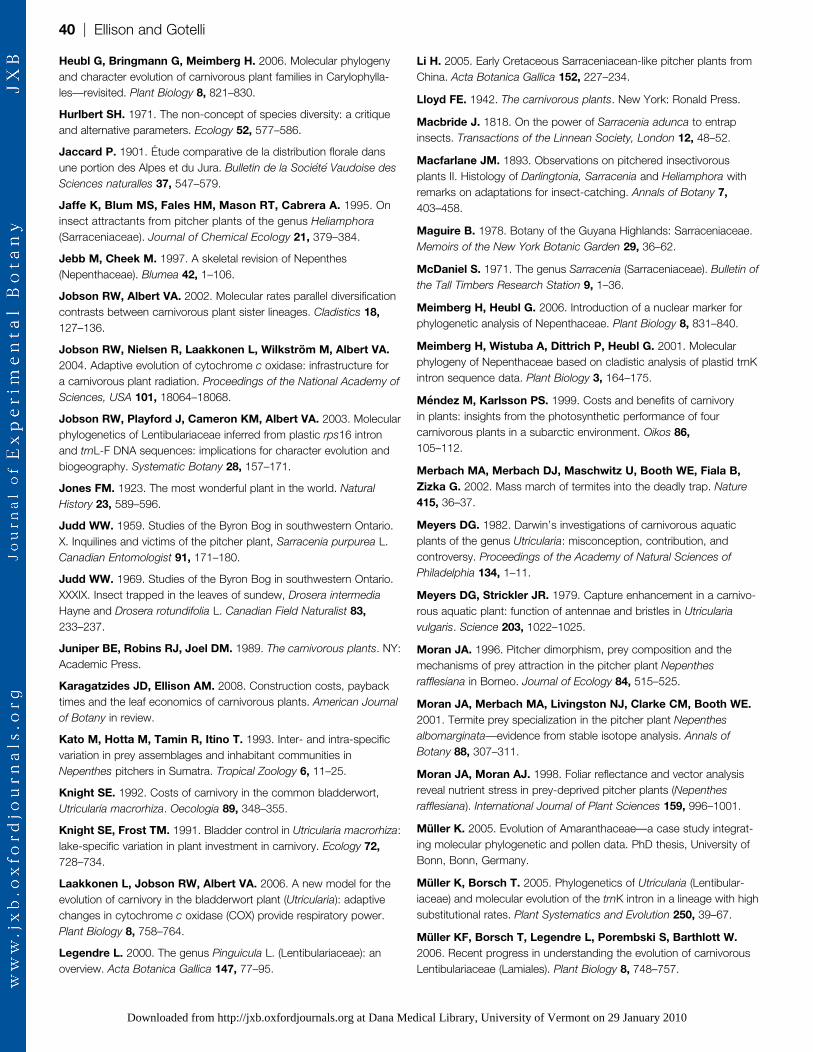
Heubl G, Bringmann G, Meimberg H. 2006. Molecular phylogeny
and character evolution of carnivorous plant families in Carylophylla-
les—revisited. Plant Biology 8, 821–830.
Hurlbert SH. 1971. The non-concept of species diversity: a critique
and alternative parameters. Ecology 52, 577–586.
Jaccard P. 1901. Etude comparative de la distribution florale dans
une portion des Alpes et du Jura. Bulletin de la Societe Vaudoise des
Sciences naturalles 37, 547–579.
Jaffe K, Blum MS, Fales HM, Mason RT, Cabrera A. 1995. On
insect attractants from pitcher plants of the genus Heliamphora
(Sarraceniaceae). Journal of Chemical Ecology 21, 379–384.
Jebb M, Cheek M. 1997. A skeletal revision of Nepenthes
(Nepenthaceae). Blumea 42, 1–106.
Jobson RW, Albert VA. 2002. Molecular rates parallel diversification
contrasts between carnivorous plant sister lineages. Cladistics 18,
127–136.
Jobson RW, Nielsen R, Laakkonen L, Wilkstrom M, Albert VA.
2004. Adaptive evolution of cytochrome c oxidase: infrastructure for
a carnivorous plant radiation. Proceedings of the National Academy of
Sciences, USA 101, 18064–18068.
Jobson RW, Playford J, Cameron KM, Albert VA. 2003. Molecular
phylogenetics of Lentibulariaceae inferred from plastic rps16 intron
and trnL-F DNA sequences: implications for character evolution and
biogeography. Systematic Botany 28, 157–171.
Jones FM. 1923. The most wonderful plant in the world. Natural
History 23, 589–596.
Judd WW. 1959. Studies of the Byron Bog in southwestern Ontario.
X. Inquilines and victims of the pitcher plant, Sarracenia purpurea L.
Canadian Entomologist 91, 171–180.
Judd WW. 1969. Studies of the Byron Bog in southwestern Ontario.
XXXIX. Insect trapped in the leaves of sundew, Drosera intermedia
Hayne and Drosera rotundifolia L. Canadian Field Naturalist 83,
233–237.
Juniper BE, Robins RJ, Joel DM. 1989. The carnivorous plants. NY:
Academic Press.
Karagatzides JD, Ellison AM. 2008. Construction costs, payback
times and the leaf economics of carnivorous plants. American Journal
of Botany in review.
Kato M, Hotta M, Tamin R, Itino T. 1993. Inter- and intra-specific
variation in prey assemblages and inhabitant communities in
Nepenthes pitchers in Sumatra. Tropical Zoology 6, 11–25.
Knight SE. 1992. Costs of carnivory in the common bladderwort,
Utricularia macrorhiza. Oecologia 89, 348–355.
Knight SE, Frost TM. 1991. Bladder control in Utricularia macrorhiza:
lake-specific variation in plant investment in carnivory. Ecology 72,
728–734.
Laakkonen L, Jobson RW, Albert VA. 2006. A new model for the
evolution of carnivory in the bladderwort plant (Utricularia): adaptive
changes in cytochrome c oxidase (COX) provide respiratory power.
Plant Biology 8, 758–764.
Legendre L. 2000. The genus Pinguicula L. (Lentibulariaceae): an
overview. Acta Botanica Gallica 147, 77–95.
Li H. 2005. Early Cretaceous Sarraceniacean-like pitcher plants from
China. Acta Botanica Gallica 152, 227–234.
Lloyd FE. 1942. The carnivorous plants. New York: Ronald Press.
Macbride J. 1818. On the power of Sarracenia adunca to entrap
insects. Transactions of the Linnean Society, London 12, 48–52.
Macfarlane JM. 1893. Observations on pitchered insectivorous
plants II. Histology of Darlingtonia, Sarracenia and Heliamphora with
remarks on adaptations for insect-catching. Annals of Botany 7,
403–458.
Maguire B. 1978. Botany of the Guyana Highlands: Sarraceniaceae.
Memoirs of the New York Botanic Garden 29, 36–62.
McDaniel S. 1971. The genus Sarracenia (Sarraceniaceae). Bulletin of
the Tall Timbers Research Station 9, 1–36.
Meimberg H, Heubl G. 2006. Introduction of a nuclear marker for
phylogenetic analysis of Nepenthaceae. Plant Biology 8, 831–840.
Meimberg H, Wistuba A, Dittrich P, Heubl G. 2001. Molecular
phylogeny of Nepenthaceae based on cladistic analysis of plastid trnK
intron sequence data. Plant Biology 3, 164–175.
Mendez M, Karlsson PS. 1999. Costs and benefits of carnivory
in plants: insights from the photosynthetic performance of four
carnivorous plants in a subarctic environment. Oikos 86,
105–112.
Merbach MA, Merbach DJ, Maschwitz U, Booth WE, Fiala B,
Zizka G. 2002. Mass march of termites into the deadly trap. Nature
415, 36–37.
Meyers DG. 1982. Darwin’s investigations of carnivorous aquatic
plants of the genus Utricularia: misconception, contribution, and
controversy. Proceedings of the Academy of Natural Sciences of
Philadelphia 134, 1–11.
Meyers DG, Strickler JR. 1979. Capture enhancement in a carnivo-
rous aquatic plant: function of antennae and bristles in Utricularia
vulgaris. Science 203, 1022–1025.
Moran JA. 1996. Pitcher dimorphism, prey composition and the
mechanisms of prey attraction in the pitcher plant Nepenthes
rafflesiana in Borneo. Journal of Ecology 84, 515–525.
Moran JA, Merbach MA, Livingston NJ, Clarke CM, Booth WE.
2001. Termite prey specialization in the pitcher plant Nepenthes
albomarginata—evidence from stable isotope analysis. Annals of
Botany 88, 307–311.
Moran JA, Moran AJ. 1998. Foliar reflectance and vector analysis
reveal nutrient stress in prey-deprived pitcher plants (Nepenthes
rafflesiana). International Journal of Plant Sciences 159, 996–1001.
Muller K. 2005. Evolution of Amaranthaceae—a case study integrat-
ing molecular phylogenetic and pollen data. PhD thesis, University of
Bonn, Bonn, Germany.
Muller K, Borsch T. 2005. Phylogenetics of Utricularia (Lentibular-
iaceae) and molecular evolution of the trnK intron in a lineage with high
substitutional rates. Plant Systematics and Evolution 250, 39–67.
Muller KF, Borsch T, Legendre L, Porembski S, Barthlott W.
2006. Recent progress in understanding the evolution of carnivorous
Lentibulariaceae (Lamiales). Plant Biology 8, 748–757.
40 | Ellison and Gotelli
at Dana Medical Library, University of Vermont on 29 January 2010 http://jxb.oxfordjournals.orgDownloaded from
Muller K, Borsch T, Legendre L, Porembski S, Theisen I,
Barthlott W. 2004. Evolution of carnivory in Lentibulariaceae and the
Lamiales. Plant Biology 6, 477–490.
Naczi RFC, Soper EM, Case Jr , Case RB. 1999. Sarracenia rosea
(Sarraceniaceae), a new species of pitcher plant from the southeastern
United States. Sida 18, 1183–1206.
Ne’eman G, Ne’eman R, Ellison AM. 2006. Limits to reproductive
success of Sarracenia purpurea (Sarraceniaceae). American Journal of
Botany 93, 1660–1666.
Newell SJ, Nastase AJ. 1998. Efficiency of insect capture by
Sarracenia purpurea (Sarraceniaceae), the northern pitcher plant.
American Journal of Botany 85, 88–91.
Neyland R, Merchant M. 2006. Systematic relationships of Sarrace-
niaceae inferred from nuclear ribosomal DNA sequences. Madrono 53,
223–232.
Oliver FW. 1944. A mass catch of Cabbage Whites by sundews.
Proceedings of the Royal Entomological Society of London, Series A
19, 5.
Osunkoya OO, Daud SD, Di-Giusto B, Wimmer FL, Holige TM.
2007. Construction costs and physico-chemical properties of the
assimilatory organs of Nepenthes species in northern Borneo. Annals
of Botany 99, 895–906.
Pate JS. 1986. Economy of symbiotic nitrogen fixation. In: Givnish TJ,
ed. On the economy of plant form and function. Cambridge, UK:
Cambridge University Press, 299–325.
Pianka ER. 1973. The structure of lizard communities. Annual Review
of Ecology and Systematics 4, 53–74.
P1achno BJ, Adamec L, Lichtscheidl IK, Peroutka M,
Adlassnig W, Vrba J. 2006. Fluorescence labelling of phosphatase
activity in digestive glands of carnivorous plants. Plant Biology 8, 813–
820.
P1achno BJ, Swiatek P, Wistuba A. 2007. The giant extra-floral
nectaries of carnivorous Heliamphora folliculata: architecture and
ultrastructure. Acta Biologica Cracoviensia Series Botanica 49, 91–
104.
Porch SS. 1989. Prey capture in three species of sundew (Droser-
aceae: Drosera) on the Gulf coastal plain. MSc thesis, Auburn
University, Auburn, Alabama.
Renner SS. 1989. Floral biological observations on Heliamphora tatei
(Sarraceniaceae) and other plants from Cerro de la Neblina in
Venezuela. Plant Systematics and Evolution 163, 21–29.
Rivadavia F, Kondo K, Kato M, Hasebe M. 2003. Phylogeny of the
sundews, Drosera (Droseraceae), based on chloroplast rbcL and
nuclear 18S ribosomal DNA sequences. American Journal of Botany
90, 123–130.
Robinson-Rechavi M, Huchon D. 2000. RRTree: relative-rate tests
between groups of sequences on a phylogenetic tree. Bioinformatics
16, 296–297.
Romeo JT, Bacon JD, Mabry TJ. 1977. Ecological considerations of
amino acids and flavonoids in Sarracenia species. Biochemical
Systematics and Ecology 5, 117–120.
Sanabria-Aranada L, Gonzalez-Bermudez A, Torres NN,
Guisande C, Manjarres-Hernandez A, Valoyes-Valois V, Dıaz-
Olarte J, Andrade-Sossa C, Duque SR. 2006. Predation by the
tropical plant Utricularia foliosa. Freshwater Biology 51, 1999–2008.
Santiago LS, Wright SJ. 2007. Leaf functional traits of tropical forest
plants in relation to growth form. Functional Ecology 21, 19–27.
Schaefer HM, Ruxton GD. 2008. Fatal attraction: carnivorous plants
roll out the red carpet to lure insects. Biology Letters 4, 153–155.
Schnell DE. 1977. Infraspecific variation in Sarracenia rubra Walt.:
some observations. Castanea 42, 149–170.
Schnell DE. 1979a. A critical review of published variants of
Sarracenia purpurea L. Castanea 44, 47–59.
Schnell DE. 1979b. Sarracenia rubra Walter ssp. gulfensis: a new
subspecies. Castanea 44, 218–219.
Schnell DE. 1993. Sarracenia purpurea L. ssp. venosa (Raf.) Wherry
var. burkii Schnell (Sarraceniacaea)—a new variety of the Gulf coastal
plain. Rhodora 95, 6–10.
Schnell DE. 2002. Carnivorous plants of the United States and
Canada. Portland, OR: Timber Press.
Schnell DE, Determann RO. 1997. Sarracenia purpurea L. ssp.
venosa (Raf.) Wherry var. montana Schnell & Determann (Sarracenia-
ceae): a new variety. Castanea 62, 60–62.
Schoener TW. 1974. Resource partitioning in ecological communi-
ties. Science 185, 27–39.
Seine R, Barthlott W. 1994. Some proposals on the infrageneric
classification of Drosera L. Taxon 43, 583–589.
Shipley B. 2006. Net assimilation rate, specific leaf area and leaf
mass ratio: which is most closely correlated with relative growth rate?
A meta-analysis. Functional Ecology 20, 565–574.
Shipley B, Lechowicz MJ, Wright I, Reich PB. 2006. Fundamental
trade-offs generating the worldwide leaf economics spectrum. Ecology
87, 535–541.
Shreve F. 1906. The development and anatomy of Sarracenia
purpurea. Botanical Gazette (Old Series) 42, 107–126.
Stevens PF. 2007. Angiosperm Phylogeny Website, Version 8, June
2007. http://www.mobot.org/MOBOT/research/APweb/. Last
accessed 29 February 2008.
Stewart CN, Nilsen ET. 1992. Drosera rotundifolia growth and
nutrition in a natural population with special reference to the significance
of insectivory. Canadian Journal of Botany 70, 1409–1416.
Taylor P. 1989. The genus Utricularia: a taxonomic monograph. Kew
Bulletin Additional Series 14.
Thanikaimoni G, Vasanthy G. 1974. Sarraceniaceae: palynology
and systematics. Pollen et Spores 14, 143–155.
Thoren LM, Karlsson PS. 1998. Effects of supplementary feeding on
growth and reproduction of three carnivorous plant species in
a subarctic environment. Journal of Ecology 86, 501–510.
Thoren LM, Tuomi J, Kamarainen T, Laine K. 2003. Resource
availability affects investment in carnivory in Drosera rotundifolia. New
Phytologist 159, 507–511.
Thum M. 1986. Segregation of habitat and prey in two sympatric
carnivorous plant species, Drosera rotundifolia and Drosera interme-
dia. Oecologia 70, 601–605.
Carnivorous plants since Darwin | 41
at Dana Medical Library, University of Vermont on 29 January 2010 http://jxb.oxfordjournals.orgDownloaded from

Thum M. 1988. The significance of carnivory for the fitness of Drosera
in its natural habitat. 1. The reactions of Drosera intermedia and D.
rotundifolia to supplementary feeding. Oecologia 75, 472–480.
Thum M. 1989. The significance of carnivory for the fitness of Drosera
in its natural habitat. 2. The amount of captured prey and its effect on
Drosera intermedia and Drosera rotundifolia. Oecologia 81, 401–411.
Ulanowicz RE. 1995. Utricularia’s secret: the advantage of positive
feedback in oligotrophic environments. Ecological Modelling 79, 49–57.
van Achterberg C. 1973. A study about the arthropoda caught by
Drosera species. Entomologische berichten 33, 137–140.
Verbeek NAM, Boasson R. 1993. Relationship between types of
prey captured and growth form in Drosera in southwestern Australia.
Australian Journal of Ecology 18, 203–207.
Vogel S. 1998. Remarkable nectaries: structure, ecology, organo-
phyletic perspectives—II. Nectarioles. Flora 193, 1–29.
Wakefield AE, Gotelli NJ, Wittman SE, Ellison AM. 2005. The
effect of prey addition on nutrient stoichiometry, nutrient limitation, and
morphology of the carnivorous plant Sarracenia purpurea (Sarracenia-
ceae). Ecology 86, 1737–1743.
Watson AP, Matthiessen JN, Springett BP. 1982. Arthropod
associates and macronutrient status of the red-ink sundew (Drosera
erythrorhiza Lindl.). Australian Journal of Ecology 7, 13–22.
Weiss TEJ. 1980. The effects of fire and nutrient availability on the
pitcher plant Sarracenia flava L. PhD thesis, University of Georgia,
Athens, GA.
Williams SE, Albert VA, Chase MW. 1994. Relationships of
Droseraceae: a cladistic analysis of rbcL sequence and morphological
data. American Journal of Botany 81, 1027–1037.
Winemiller KO, Pianka ER. 1990. Organization in natural assem-
blages of desert lizards and tropical fishes. Ecological Monographs 60,
27–55.
Worley AC, Harder LD. 1999. Consequences of preformation
for dynamic resource allocation by a carnivorous herb Pinguicula
vulgaris (Lentibulariaceae). American Journal of Botany 86,
1136–1145.
Wright IJ, Reich PB, Cornelissen JHC, et al. 2005. Assessing
the generality of global leaf trait relationships. New Phytologist 166,
485–496.
Wright IJ, Reich PB, Westoby M, et al. 2004. The worldwide leaf
economics spectrum. Nature 428, 821–827.
Zamora R. 1990. The feeding ecology of a carnivorous plant
(Pinguicula nevadense): prey analysis and capture constraints. Oeco-
logia 84, 376–379.
Zamora R. 1995. The trapping success of a carnivorous plant,
Pinguicula vallisneriifolia: the cumulative effects of availability, attrac-
tion, retention, and robbery of prey. Oikos 73, 309–322.
Zamora R, Gomez JM, Hodar JA. 1997. Responses of a carnivo-
rous plant to prey and inorganic nutrients in a Mediterranean
environment. Oecologia 111, 443–451.
Zamora R, Gomez JM, Hodar JA. 1998. Fitness responses of
a carnivorous plant in contrasting ecological scenarios. Ecology 79,
1630–1644.
Zuccon A, Zuccon D. 2006. MrEnt version 1.2. Stockholm, Sweden:
Swedish Museum of Natural History, Department of Vertebrate
Zoology and Molecular Systematics Laboratory. http://www.nrm.se/
MrEnt.
42 | Ellison and Gotelli
at Dana Medical Library, University of Vermont on 29 January 2010 http://jxb.oxfordjournals.orgDownloaded from
Related Documents