RESILIENT EnerCom Oil & Services Conference February 17, 2010

Welcome message from author
This document is posted to help you gain knowledge. Please leave a comment to let me know what you think about it! Share it to your friends and learn new things together.
Transcript

RESILIENT
EnerCom Oil & Services Conference
February 17, 2010

2
Forward-Looking Statements
Statements made by representatives of LINN Energy, LLC during the course of this presentation that
are not historical facts are forward-looking statements. These statements are based on certain
assumptions and expectations made by the Company which reflect management’s experience,
estimates and perception of historical trends, current conditions, anticipated future developments and
other factors believed to be appropriate. Such statements are subject to a number of assumptions,
risks and uncertainties, many of which are beyond the control of the Company, which may cause
actual results to differ materially from those implied or anticipated in the forward-looking statements.
These include risks relating to financial performance and results, our indebtedness under our credit
facility, availability of sufficient cash flow to pay distributions and execute our business plan, prices
and demand for gas, oil and natural gas liquids, our ability to replace reserves and efficiently develop
our current reserves, our ability to make acquisitions on economically acceptable terms, and other
important factors that could cause actual results to differ materially from those anticipated or implied
in the forward-looking statements. See “Risk Factors” in the Company’s 2008 Annual Report on Form
10-K, 2009 Quarterly Report on Form 10-Q for the period ended September 30, 2009, and any other
public filings and press releases. LINN Energy undertakes no obligation to publicly update any
forward-looking statements, whether as a result of new information or future events. This
presentation has been prepared as of February 9, 2010.

LINN Energy’s mission is to acquire, develop
and maximize cash flow from a growing portfolio of
long-life oil and natural gas assets.
4
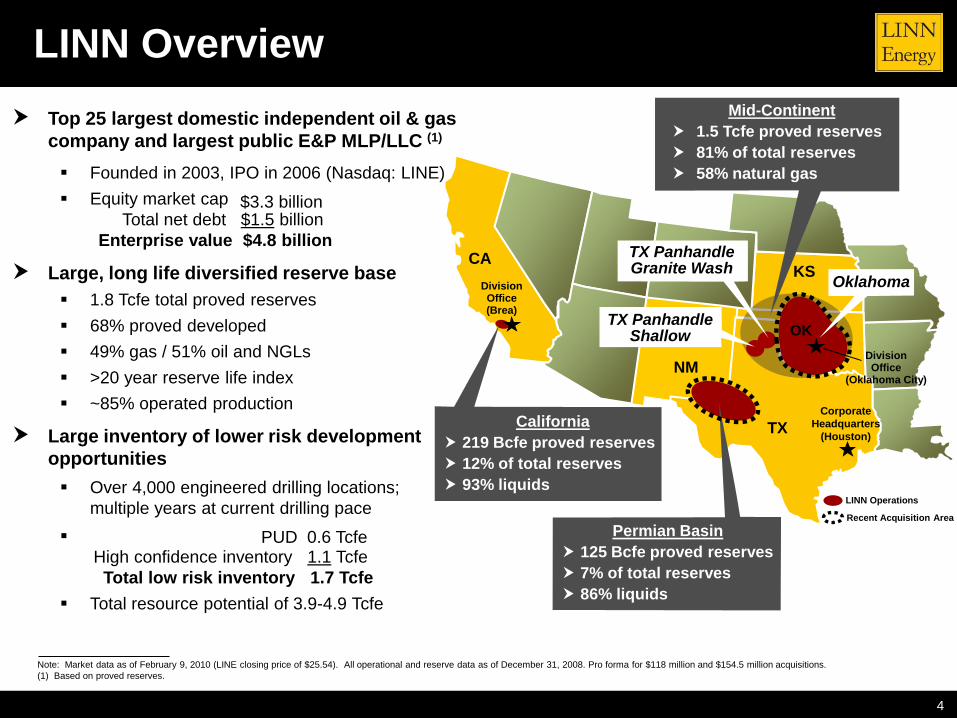
Top 25 largest domestic independent oil & gas
company and largest public E&P MLP/LLC (1)
Founded in 2003, IPO in 2006 (Nasdaq: LINE)
Equity market cap
Total net debt $1.5 billion
Enterprise value $4.8 billion
Large, long life diversified reserve base
1.8 Tcfe total proved reserves
68% proved developed
49% gas / 51% oil and NGLs
>20 year reserve life index
~85% operated production
Large inventory of lower risk development
opportunities
Over 4,000 engineered drilling locations;
multiple years at current drilling pace
High confidence inventory 1.1 Tcfe
Total low risk inventory 1.7 Tcfe
Total resource potential of 3.9-4.9 Tcfe
$3.3 billion
PUD 0.6 Tcfe
LINN Overview
Note: Market data as of February 9, 2010 (LINE closing price of $25.54). All operational and reserve data as of December 31, 2008. Pro forma for $118 million and $154.5 million acquisitions.
(1) Based on proved reserves.
KS
Corporate
Headquarters
(Houston)
Division Office(Brea)
CA
TX
Division Office
(Oklahoma City)
California
219 Bcfe proved reserves
12% of total reserves
93% liquids
Permian Basin
125 Bcfe proved reserves
7% of total reserves
86% liquids
OK
TX PanhandleGranite Wash
TX PanhandleShallow
Mid-Continent
1.5 Tcfe proved reserves
81% of total reserves
58% natural gas
NM
LINN Operations
Recent Acquisition Area
Oklahoma

5
Mature U.S. oil and natural gas basins provide significant opportunity for
future growth and consolidation
LINN’s strategy is to :
Acquire mature oil and natural gas properties with the appropriate attributes
Asset Attributes
• Stable, long-life production
• High percentage of PDP
• Shallow decline
• Long reserve life index
• Low-risk, low-cost repeatable drilling
Efficiently operate and develop acquired properties
Reduce commodity price and interest rate risk through hedging
Return cash flow through the form of a distribution payment to unitholders
LINN’s Strategy

6
Attractive Acquisition Margins
(1) Represents weighted average blended five year forward oil and gas strip prices as of the closing date of acquisitions completed during the year. Source: Bloomberg.
Despite rising acquisition costs, acquisition margins remain strong
$4.65 $4.82
$6.42
$9.98
$7.92
$14.34 $13.92
$14.44
$0.83 $0.68
$2.10 $1.61
$2.41 $1.58 $1.63 $2.13
$4.32
$8.37 $5.51
$12.76 $12.29 $12.31
$0.00
$2.00
$4.00
$6.00
$8.00
$10.00
$12.00
$14.00
$16.00
2003 2004 2005 2006 2007 2008 2009 2010
NYMEX Five Year Forward Strip ($ per Mcfe) (1)
LINN Weighted Average Acquisition Cost ($ per Mcfe)
$3.82 $4.14

7
Mid-Continent: Greater Stiles Ranch AreaTexas Panhandle Granite Wash Horizontal Well Activity
LINN spuds first horizontal well
0 4,000'
Scale
DYCO
STILES RANCH
Hemphill County
Newfield – McCoy 27-10H
IP: 12.0 MMcf/d
Newfield – Thomas 5-5H
IP: 20.0 MMcf/d
Newfield – Britt D 4-3H
IP: 21.0 MMcf/d
Newfield – McCoy 27-7H
IP: 25.0 MMcf/d
FRYE
RANCH
Devon – Zybach Truman 16-7H
IP: 14.9 MMcf/d
Devon – Holmes 17-5H
IP: 6.6 MMcf/dForest – Zybach 507H
IP: 17.0 MMcf/d
Newfield – Williams 33-7H
IP: 21.0 MMcf/d
Wheeler CountyDevon –Truman Zybach 16-10HIP: 8.3 MMcf/d
Samson – Zybach 313H
IP: 10.0 MMcf/d
Devon – Holmes 17-4H
IP: 11.8 MMcf/d
Tom Puryear 5-28H(Non-operated)
Newfield – Britt Ranch 14-13H
IP: 8.0 MMcf/d
Samson – Zybach 213H
IP: 5.9 MMcf/dNewfield – McCoy 27-8H
IP: 21.0 MMcf/d
Forest – Blasdale 204-1H
IP: 10.4 MMcf/d, 1,300 Bopd +
2,000 Bbls/d NGL’s
Chesapeake – Reed T 8H
IP: 5.6 MMcf/d
Forest Wells IP: 15.1 MMcf/d, 1,200 Bopd + 2,400 Bbls/d NGL’s
IP: 16.0 MMcf/d, 1,300 Bopd + 2,200 Bbls/d NGL’s
Industry Producing Wells
Industry Wells with IP’s
Industry Wells Permitted
1.0 – 3.1 MMcf/d
3.1 – 5.3 MMcf/d
LINN Acreage
Greater Stiles Ranch Area
~27,000 Gross Acres
~13,500 Net AcresLINN Peak Production from
Vertical Wells
Current Drilling Location
Waiting on Completion

8
Low risk asset base (1)
1.8 Tcfe of proved reserves
>20 year reserve life
68% proved developed
Financial flexibility
Extended maturity of credit facility to August 2012
($1.64 billion committed borrowing base)
2Q 2009, $250 million senior notes offering and $103 million public equity offering
4Q 2009, $189 million public equity offering
Borrowing capacity, including available cash, of ~$595 million at October 31, 2009
High levels of hedging
~100% of current production hedged through 2011
~100% of Mid-Continent basis hedged through 2011
~100% of floating interest rate expense hedged through 2013
Financial Strength
(1) Reserve data as of December 31, 2008. Pro forma for $118 million and $154.5 million acquisitions.
9
Note: Reserve data as of December 31, 2008. Reserves pro forma for $118 million and $154.5 million acquisitions.
(1) Based on mid-point of guidance estimates announced on November 4, 2009.
(2) Includes the effects of the Company’s interest rate hedges.
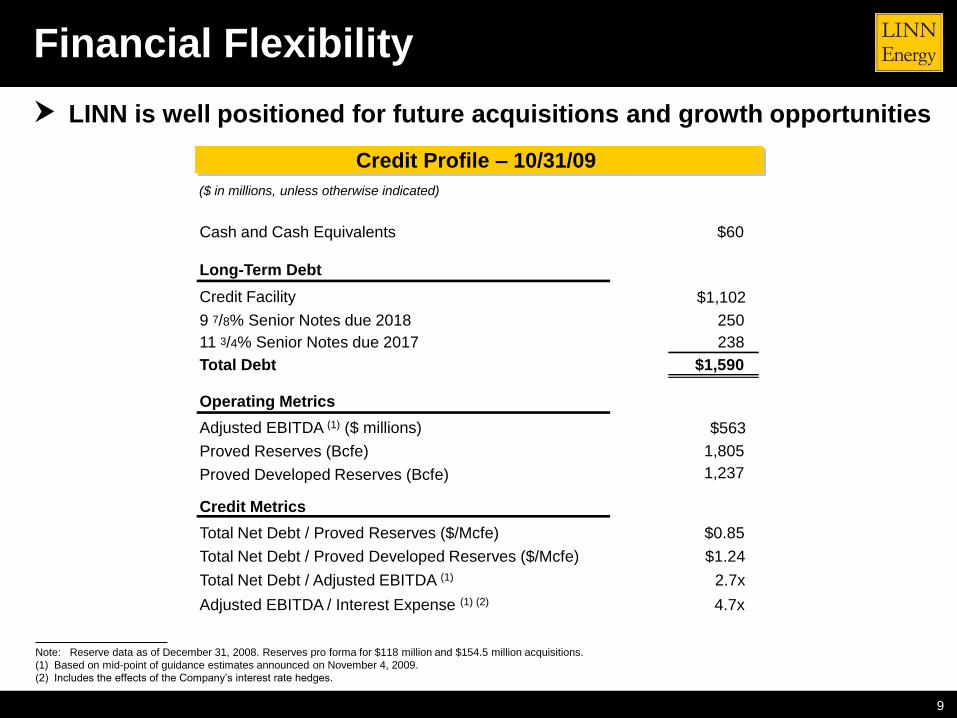
Financial Flexibility
LINN is well positioned for future acquisitions and growth opportunities
Credit Profile – 10/31/09
($ in millions, unless otherwise indicated)
Cash and Cash Equivalents
Credit Facility
9 7/8% Senior Notes due 2018
Total Debt
Operating Metrics
Adjusted EBITDA (1) ($ millions)
Proved Reserves (Bcfe)
Proved Developed Reserves (Bcfe)
Credit Metrics
Total Net Debt / Proved Reserves ($/Mcfe)
Total Net Debt / Proved Developed Reserves ($/Mcfe)
Total Net Debt / Adjusted EBITDA (1)
Adjusted EBITDA / Interest Expense (1) (2)
Long-Term Debt
11 3/4% Senior Notes due 2017
$60
250
$1,590
$0.85
$1.24
2.7x
4.7x
$1,102
238
1,805
$563
1,237

10
$90.00 $90.00 $100.00 $100.00
$90.00 $90.00
$110.00 $75.00
0
1,000
2,000
3,000
4,000
5,000
2010 2011 2012 2013
Vo
lum
e (
MB
bls
)
50%48%
$99.68 $82.50
Puts provide upside on hedged volumes Puts and collars provide upside on
hedged volumes
Gas Positions Oil Positions
Current Hedge Position
$9.50
$8.90
$8.84
$8.11
0.0
8.0
16.0
24.0
32.0
40.0
48.0
56.0
64.0
2010 2011
Vo
lum
e (
Bc
f)
Swaps Puts (1)
31%
39%
$8.66
$9.25
Percent Puts (2)
Approximately 100% hedged through 2011 provides cash flow stability
(1) Includes puts which settle on the Panhandle Eastern Pipeline Index (PEPL) to hedge basis differential associated with gas production in the Mid-Continent.
(2) Calculated as percentage of hedged volume in the form of puts.
(3) As presented in the table above, the Company has outstanding fixed price oil swaps on 6,000 Bbls per day at a price of $100.00 per Bbl for the years ending December 31, 2012, and
December 31, 2013. The Company has derivative contracts that extend the swaps for each of the years ending December 31, 2014, December 31, 2015, and December 31, 2016, if
the counterparties determine that the strike prices are in-the-money on a designated date in each respective preceding year. The extension for each year is exercisable without
respect to the other years.
(4) Includes collars with floor / ceiling prices of $90.00 / $112.00 and $90.00 / $112.25 on 250 MBbls and 276 MBbls of oil for FY 2010-FY 2011, respectively.
Percent Puts (2)Swaps (3) Collars (4) Puts (2)

11
102%
108%
44%
40%
29%
58%
0%
20%
40%
60%
80%
100%
120%
FY 2010E FY 2011E
LINE Swaps
% P
rod
uc
tio
n H
ed
ge
d
Note: 2009E production held flat for FY 2010E-2011E. LINN’s 2009E production based on mid-point of 2009E guidance announced on November 4, 2009. Source: RBC Capital Markets.
E&P Peer Group includes: Berry Petroleum, Comstock Resources, Encore Acquisition, Mariner Energy, Petrohawk, Quicksilver Resources, SandRidge Energy, Swift Energy and
Whiting Petroleum.
(1) 2009E peer group production per Wall Street research. Hedge data based on publicly available data.
LINE PutsLINE Collars
LINN Production Hedged vs. Peers
Hedged much more than peers while still preserving upside potential
Median Production Hedged Q3 09 (1)

12
Attractive Value & Liquidity in MLP Sector
Note: Market data as of February 9, 2010. Source: Bloomberg.
Last 3 Months Trading Data
LINN Energy offers:
Significant trading liquidity compared to MLP/LLC sector (55+ total)
No IDRs (no general partner burden on cash flow)
E&P sector provides more acquisition opportunities
Largest E&P MLP/LLC (less competition for larger acquisitions)
Yield spread of approximately 225 bps to midstream average
Average Average Daily Volume
Top 5 Most Liquid MLP/LLCs Ticker Price Units Traded Value ($MM) No IDRs Yield
Kinder Morgan Energy Partners, LP KMP $60.12 776 $46,636 6.86%
Enterprise Products Partners, LP EPD $31.05 1,282 $39,791 7.22%
Energy Transfer Partners, LP ETP $44.40 844 $37,461 8.10%
Linn Energy, LLC LINE $26.21 1,099 $28,817 9.87%
Plains All American Pipeline, LP PAA $52.30 346 $18,110 7.07%

13
-60%
-40%
-20%
0%
20%
40%
60%
80%
100%
120%
1/13/06 7/18/06 1/20/07 7/25/07 1/27/08 7/31/08 2/2/09 8/7/09 2/9/10
LINE Total Return LINE Price Appreciation S&P Mid-Cap E&P Index S&P 500 Index
LINN Historical Return
Note: Market data as of February 9, 2010 (LINE closing price of $25.54). Source: Bloomberg.
LINN Total Return and Stock Price Appreciation (LINE IPO – 2/9/10)
21.62%
-9.20%
81.84%
18.49%

14
Note: Market data as of February 9, 2010 (LINE closing price of $25.54).
(1) The Q1 2006 distribution, adjusted for the partial period from the Company's closing of the IPO on January 19, 2006 through March 31, 2006, equates to $0.32 per unit.
Distribution History
Since IPO, LINN has generated a total return of approximately 82%
58% increase in quarterly distribution since IPO
Consistently paid the distribution for 16 quarters
Distribution History
$ 0.63
$9.08
$0.80
$1.23
$1.75
$2.27
$2.84
$3.41
$4.04
$4.67
$5.30
$5.93
$6.56
$7.19
$7.82
$8.45
$ 0.63
$ 0.43
$ 0.63
$ 0.40
$ 0.40
$ 0.52
$ 0.52
$ 0.57
$ 0.57
$ 0.63
$ 0.63
$ 0.63
$ 0.63
$ 0.63
$ 0.63
$0.00
$1.00
$2.00
$3.00
$4.00
$5.00
$6.00
$7.00
$8.00
$9.00
Q1 Q2 Q3 Q4 Q1 Q2 Q3 Q4 Q1 Q2 Q3 Q4 Q1 Q2 Q3 Q4
- Current Distribution - Cumulative Distribution
2006 2007 2008 2009
(1)

LINN Energy’s mission is to acquire, develop
and maximize cash flow from a growing portfolio of
long-life oil and natural gas assets.

Appendix
17
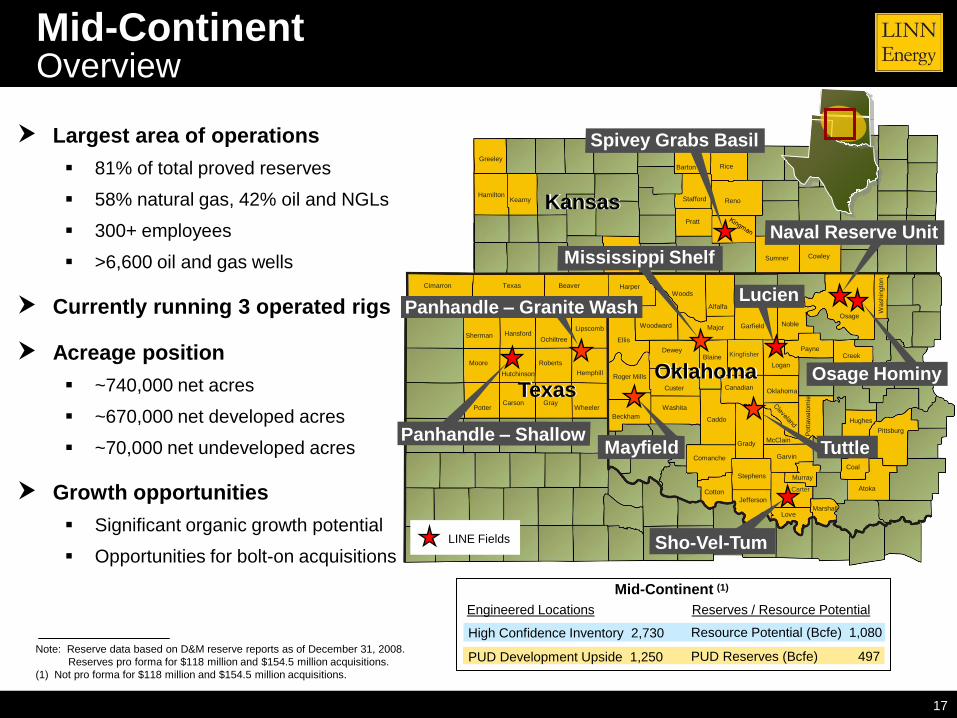
Mid-Continent Overview
Mid-Continent (1)
High Confidence Inventory 2,730
PUD Development Upside 1,250
Resource Potential (Bcfe) 1,080
PUD Reserves (Bcfe) 497
Reserves / Resource PotentialEngineered Locations
Largest area of operations
81% of total proved reserves
58% natural gas, 42% oil and NGLs
300+ employees
>6,600 oil and gas wells
Currently running 3 operated rigs
Acreage position
~740,000 net acres
~670,000 net developed acres
~70,000 net undeveloped acres
Growth opportunities
Significant organic growth potential
Opportunities for bolt-on acquisitions
Texas
Kansas
Oklahoma
Panhandle – Granite Wash
Mayfield TuttlePanhandle – Shallow
Osage Hominy
Sho-Vel-TumLINE Fields
Naval Reserve Unit
Barton
Clark Cowley
Greeley
Kearny
Pratt
Reno
Rice
Stafford
Sumner
Hamilton
Alfalfa
BeaverCimarron
Ellis
Garfield
Harper
MajorNoble
Osage
Texas
Woods
Woodward
Washin
gto
n
Carson Gray
Hansford
HemphillHutchinson
Lipscomb
Moore
Ochiltree
Potter
Roberts
Sherman
Wheeler
Beckham
Blaine
Caddo
CanadianCuster
Dewey
Logan
Roger Mills
Washita
Atoka
Coal
Comanche
Cotton
Creek
Garvin
Grady
Hughes
Jefferson
Love
McClain
Marshall
Murray
Payne
Pittsburg
Stephens
Pott
aw
ato
mie
Kingfisher
Carter
Oklahoma
Mississippi Shelf
Spivey Grabs Basil
Lucien
Note: Reserve data based on D&M reserve reports as of December 31, 2008.
Reserves pro forma for $118 million and $154.5 million acquisitions.
(1) Not pro forma for $118 million and $154.5 million acquisitions.

18
Mid-Continent: Acreage Comparison
(1) Estimated based on public data.
(2) Estimated based on available industry producing and permitting data.
Hemphill County
Wheeler County
Roberts County
Gray County
Greater Stiles Ranch Area
0 4 miles
Scale
0 4 miles
Scale
Frye
Ranch
Stiles Ranch
LINN Energy
Forest Oil (est) (1)
Newfield Exploration (est) (2)
Buffalo WallowTwo Step
Seventh StepMendota Ranch
Lard Ranch
Dyco
Twin Channel
LINN Granite Wash Acreage
~ 70,000 Gross Acres
~ 38,000 Net Acres
89% Held By Production
Industry leading position in the Granite Wash trend

19
TX
NM
Levelland
Iatan / Snyder
Spraberry
King Mountain
Gomez
Goldsmith
Carlsbad
GrayburgShafter Lake
Ozona
Owen Mesa / Pearl / Teas
Livingston Ridge
Eddy
Lea
Hockley
Garza
Dawson
Andrews
Howard
MidlandEctor
Winkler
Upton
Schieicher
Pecos
CraneWard
Crockett
LINE Fields
Permian Basin Overview
Long-life, low-risk reserves
21 MMBoe proved reserves
86% liquids (~68% proved developed)
Reserve life of over 20 years
7% of total reserves
Acreage position
~33,000 net acres
~33,000 net developed acres
Growth opportunities
>250 proved low-risk infill drilling and
optimization opportunities
Opportunities for bolt-on acquisitions
20
Brea Canyon Area
Tonner Area
LINN Acreage
Oil Wells
Brea-Olinda Field
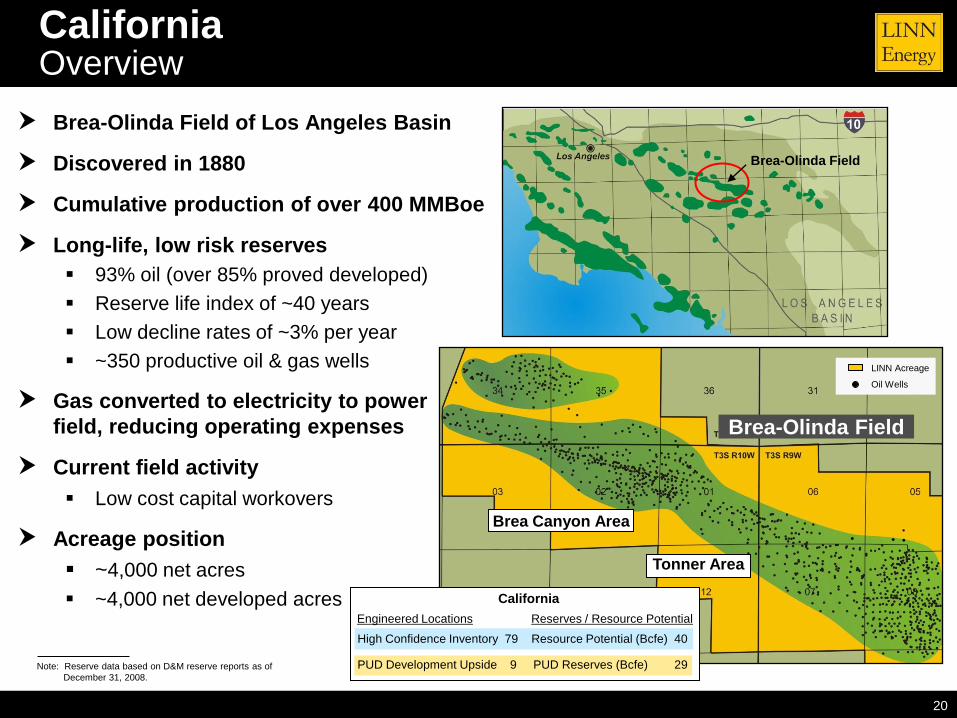
CaliforniaOverview
Brea-Olinda Field of Los Angeles Basin
Discovered in 1880
Cumulative production of over 400 MMBoe
Long-life, low risk reserves
93% oil (over 85% proved developed)
Reserve life index of ~40 years
Low decline rates of ~3% per year
~350 productive oil & gas wells
Gas converted to electricity to power
field, reducing operating expenses
Current field activity
Low cost capital workovers
Acreage position
~4,000 net acres
~4,000 net developed acres
Brea-Olinda Field
Note: Reserve data based on D&M reserve reports as of
December 31, 2008.
California
High Confidence Inventory 79 Resource Potential (Bcfe) 40
PUD Development Upside 9 PUD Reserves (Bcfe) 29
Reserves / Resource PotentialEngineered Locations

21
Low Risk Inventory For The Future
Includes 4,068 drilling locations and 2.6-3.6 Tcfe of capital inventory
High
Confidence
Inventory
1.1 Tcfe
PUD Development
Upside
0.53 Tcfe
Proved Developed
1.13 Tcfe
Prospective
Oklahoma 745 209
TX Panhandle – Shallow 333 143
TX Panhandle – Granite Wash 172 145
California 9 29
TX Panhandle – Granite Wash 757 570
Oklahoma 1,050 360
TX Panhandle – Shallow 923 150
California 79 40
Engineered Locations
Resource
Potential (Bcfe) Total Wells
Engineered Locations Reserves (Bcfe)
PDP / PDNP
PUD
2,809
Down spacing opportunities
Mississippi Shelf
TX Panhandle – Granite Wash (Horizontal)
TX Panhandle – Shallow
Unrisked Resource Potential (Tcfe)
Total Wells
1,259
1-2 Tcfe
2.8 Tcfe
3.8-4.8 Tcfe
1.7 Tcfe
1.1 Tcfe
Cumulative
Total
Note: Not pro forma for $118 million and $154.5 million acquisitions.
.
22
The Company defines adjusted EBITDA as income (loss) from continuing operations plus the following adjustments: Net operating cash flow from acquisitions and divestitures, effective date through closing date;
Interest expense;
Depreciation, depletion and amortization;
Impairment of goodwill and long-lived assets;
Write-off of deferred financing fees and other;
(Gain) loss on sale of assets, net;
Unrealized (gain) loss on commodity derivatives;
Unrealized (gain) loss on interest rate derivatives;
Realized (gain) loss on interest rate derivatives;
Realized (gain) loss on canceled derivatives;
Unit-based compensation expenses;
Exploration costs;
IPO cash bonuses; and
Income tax (benefit) expense.
Adjusted EBITDA is a significant non-GAAP performance metric used by Company management to indicate (prior to the establishment of any reserves by its Board of Directors) the cash distributions the Company expects to pay unitholders. Specifically, this financial measure indicates to investors whether or not the Company is generating cash flow at a level that can sustain or support an increase in its quarterly distribution rates. Adjusted EBITDA is also a quantitative metric used throughout the investment community with respect to publicly-traded partnerships and limited liability companies.
Historical Financial StatementsReconciliation of Non-GAAP Measures

23
The following presents a reconciliation of income (loss) from continuing operations
to adjusted EBITDA:
Historical Financial StatementsAdjusted EBITDA
($ in thousands) Year Ended December 31,
2008 2007 2006
Income (loss) from continuing operations $825,657 $(356,194) $69,811
Plus:
Net operating cash flow from acquisitions and
divestitures, effective date through closing date 3,436 67,417 712
Interest expense, cash 81,704 35,974 5,155
Interest expense, noncash 12,813 3,000 754
Depreciation, depletion and amortization 194,093 69,081 4,352
Impairment of goodwill and long-lived assets 50,505 --- ---
Write-off of deferred financing fees and other 6,728 3,460 3,342
(Gain) loss on sale of assets, net (98,763) 1,767 28
Unrealized (gain) loss on commodity derivatives (734,732) 388,733 (77,494)
Reclassification of derivative settlements --- (5,946) (5,654)
Unrealized (gain) loss on interest rate derivatives 50,638 29,548 (82)
Realized (gain) loss on interest rate derivatives 16,036 (1,467) (282)
Realized loss on canceled derivatives 81,358 --- ---
Unit-based compensation expenses 14,699 13,518 21,612
Exploration costs 7,603 4,053 286
IPO cash bonuses --- --- 2,039
Income tax (benefit) expense 2,712 4,788 (1,973)
Adjusted EBITDA from continuing operations $514,487 $257,732 $22,606
Adjusted EBITDA from discontinued operations $14,087 $42,681 $48,103

24
Reserve Replacement / F&D CalculationsReconciliation of Non-GAAP Measures
Year Ended
Costs incurred (in thousands): December 31 , 2008
Property acquisition costs:
Proved 595,795$
Unproved 4,111
Development costs 332,557
Costs incurred 932,463$
Less:
Asset retirement obligation costs (680)
Discontinued operations (32,207)
Costs expended - continuing operations 899,576$ A
Less:
Property acquisition costs - continuing operations (584,630)
Oil and gas capital 314,946$ B
Reserve data - continuing operations (MMcfe):
Purchase of minerals in place 368,136
Extensions, discoveries and other additions 228,083
Annual additions, excluding price-related revisions 596,219 C
Less:
Purchase of minerals in place (368,136)
Annual additions, excluding price-related revisions and acquisitions 228,083 D
Annual production 77,548 E
Calculations
Reserve replacement cost 1.51$ A / C
Reserve replacement ratio 769% C / E
Finding and development cost from the drill bit 1.38$ B / D
Drill bit reserve replacement ratio 294% D / E

25
Cautionary Note to U.S. Investors — The United States Securities and Exchange Commission (―SEC‖) permits oil and gas companies, in their filings with the SEC, to disclose only proved reserves that a company has demonstrated by actual production or conclusi ve formation tests to be economically and legally producible under existing economic and operating conditions. Any reserve estimate s provided in this presentation that are not specifically designated as being estimates of proved reserves may include not o nly proved reserves, but also other categories of reserves that the SEC's guidelines strictly prohibit the Company from including in filings with the SEC. Investors are urged to consider closely the disclosure in the Company’s Annual Report filed on Form 10-K for fiscal year ended December 31, 2008, available from the Company at 600 Travis, Suite 5100, Houston, Texas 77002 (Attn: Investor Relations). You can also obtain this report from the SEC by calling 1 -800-SEC-0330 or from the SEC's website at www.sec.gov.
Related Documents