End-Use Technology Study – An Assessment of Alternative Uses for Associated Gas November 5, 2012 John Harju, Chad Wocken, Brad Stevens, Jay Almlie, Steve Schlasner © 2012 University of North Dakota Energy & Environmental Research Center.

Welcome message from author
This document is posted to help you gain knowledge. Please leave a comment to let me know what you think about it! Share it to your friends and learn new things together.
Transcript
End-Use Technology Study – An Assessment of
Alternative Uses for Associated Gas
November 5, 2012
John Harju, Chad Wocken, Brad Stevens, Jay Almlie, Steve Schlasner
© 2012 University of North Dakota Energy & Environmental Research Center.
The International Center for Applied Energy Technology®
Background
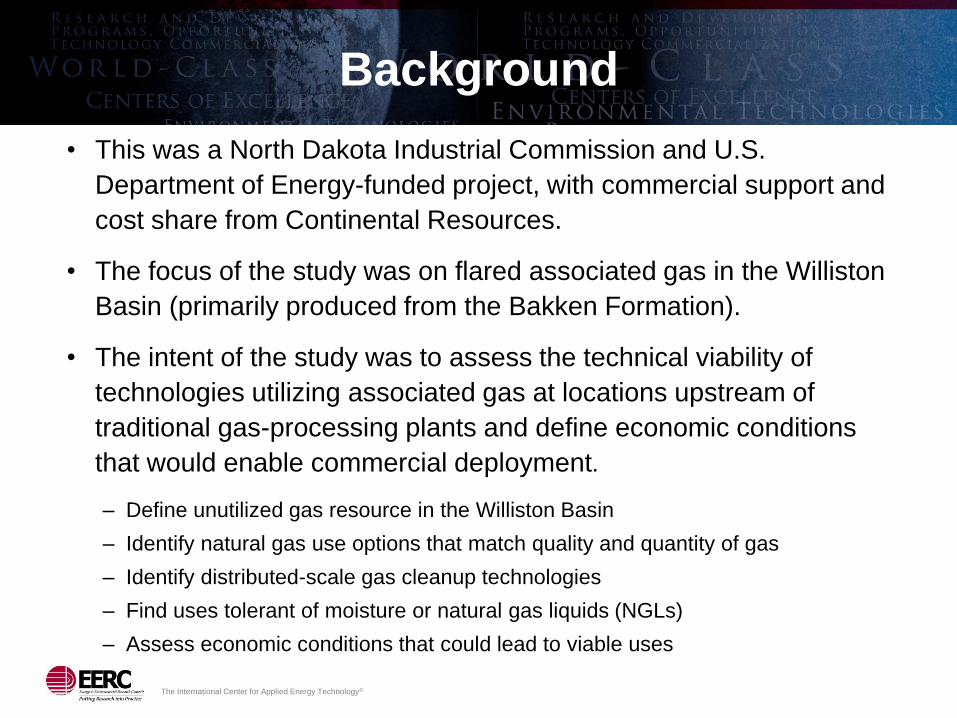
• This was a North Dakota Industrial Commission and U.S.
Department of Energy-funded project, with commercial support and
cost share from Continental Resources.
• The focus of the study was on flared associated gas in the Williston
Basin (primarily produced from the Bakken Formation).
• The intent of the study was to assess the technical viability of
technologies utilizing associated gas at locations upstream of
traditional gas-processing plants and define economic conditions
that would enable commercial deployment.
– Define unutilized gas resource in the Williston Basin
– Identify natural gas use options that match quality and quantity of gas
– Identify distributed-scale gas cleanup technologies
– Find uses tolerant of moisture or natural gas liquids (NGLs)
– Assess economic conditions that could lead to viable uses
The International Center for Applied Energy Technology®
Introduction to ND Oil and Gas
Production
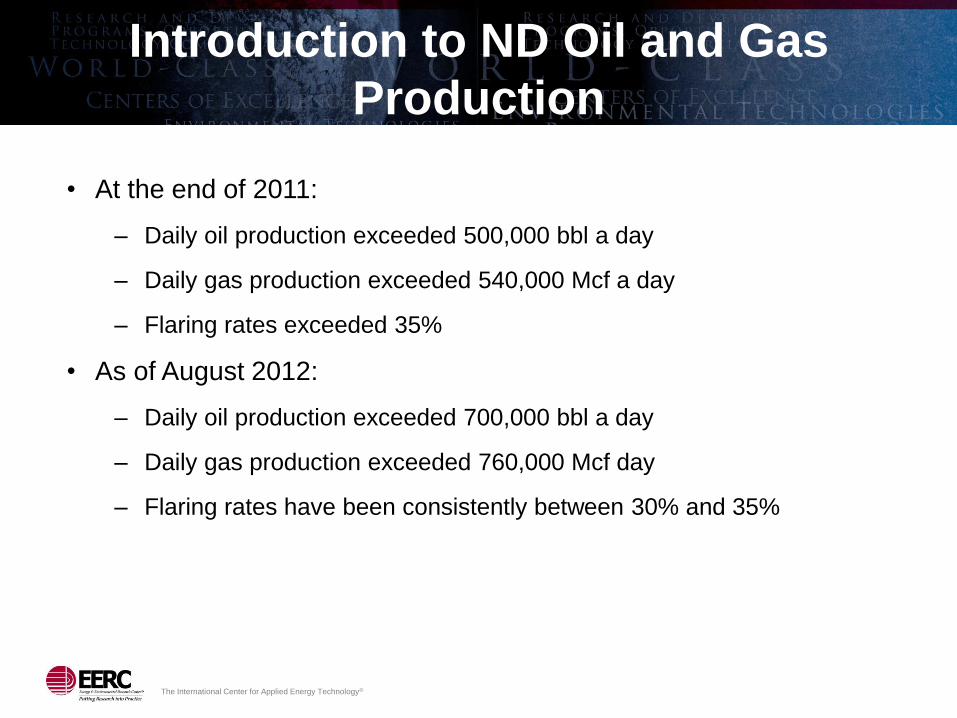
• At the end of 2011:
– Daily oil production exceeded 500,000 bbl a day
– Daily gas production exceeded 540,000 Mcf a day
– Flaring rates exceeded 35%
• As of August 2012:
– Daily oil production exceeded 700,000 bbl a day
– Daily gas production exceeded 760,000 Mcf day
– Flaring rates have been consistently between 30% and 35%

The International Center for Applied Energy Technology®
Observations Regarding Flaring
• Current flaring in the Williston Basin is a result of:
– A rapid increase in oil production
– Growing but still insufficient intrabasin infrastructure to move rich gas to
processing
– Growing but still limited infrastructure to move dry gas and NGLs to
markets outside the state.
• With that said,
– Forecasts indicate that oil and gas production should stabilize.
– Industry is investing significant amounts of money to develop
infrastructure and processing capabilities.
• The opportunity to capture revenue from flared gas is a moving target.
– Location-specific (geographic)
– Time-limited (temporal)

The International Center for Applied Energy Technology®
Flaring Occurrences Are Geographic
December 2011 Total Produced Gas Versus Total Flared Gas

The International Center for Applied Energy Technology®
Flaring Occurrences Are Temporal
January 2011 Total Flared Gas Versus December 2011 Total Flared Gas
The International Center for Applied Energy Technology®
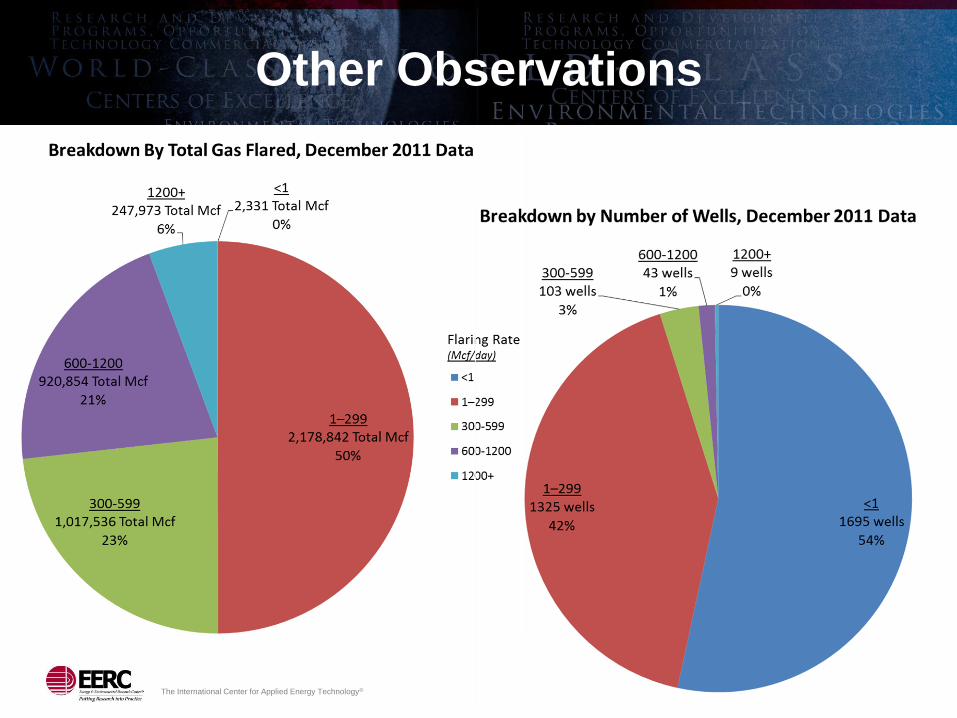
Other Observations
The International Center for Applied Energy Technology®
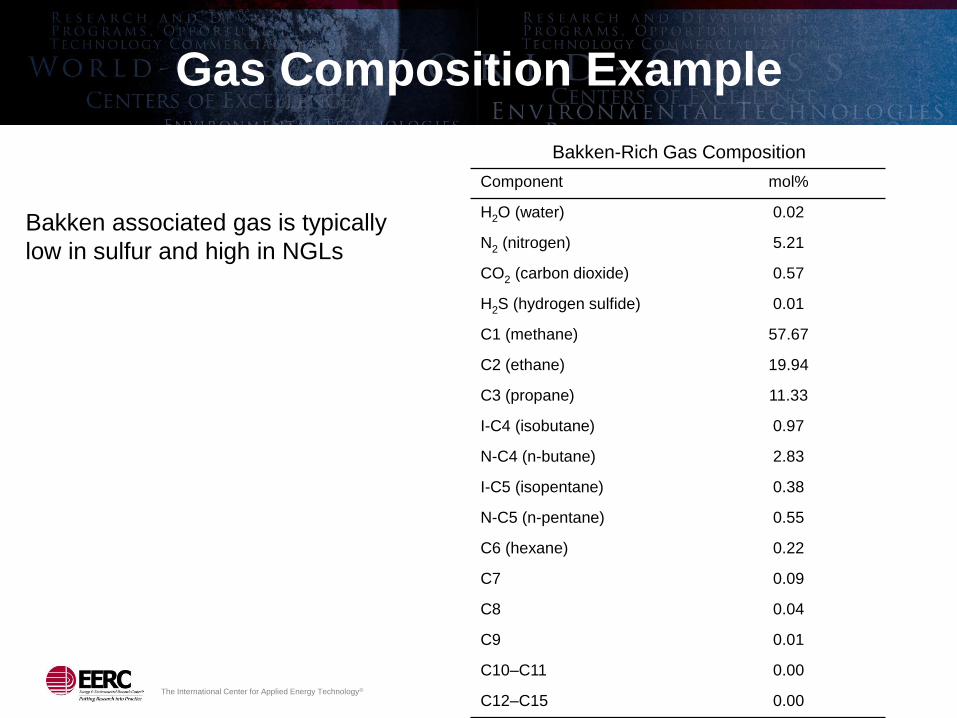
Gas Composition Example
Bakken-Rich Gas Composition
Component mol%
H2O (water) 0.02
N2 (nitrogen) 5.21
CO2 (carbon dioxide) 0.57
H2S (hydrogen sulfide) 0.01
C1 (methane) 57.67
C2 (ethane) 19.94
C3 (propane) 11.33
I-C4 (isobutane) 0.97
N-C4 (n-butane) 2.83
I-C5 (isopentane) 0.38
N-C5 (n-pentane) 0.55
C6 (hexane) 0.22
C7 0.09
C8 0.04
C9 0.01
C10–C11 0.00
C12–C15 0.00
Bakken associated gas is typically
low in sulfur and high in NGLs

The International Center for Applied Energy Technology®
Study Focus
• NGL recovery
– As a stand-alone operation
– As a pretreatment to other operations (i.e., power generation)
• Compressed natural gas/liquefied natural gas for vehicles
• Electric power generation
• Chemicals
The International Center for Applied Energy Technology®
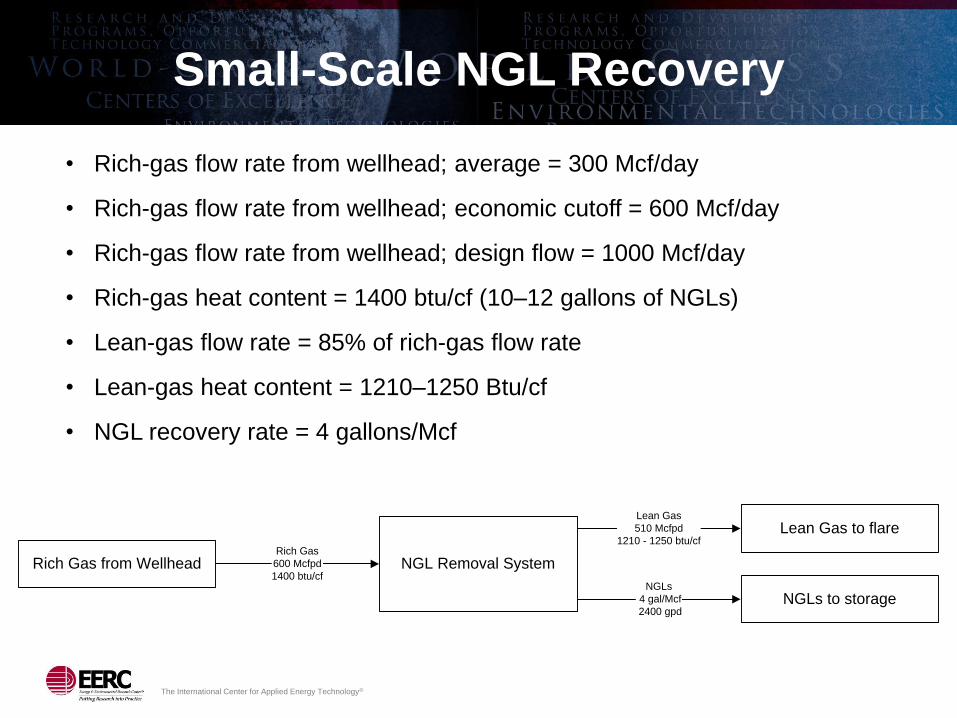
Small-Scale NGL Recovery
• Rich-gas flow rate from wellhead; average = 300 Mcf/day
• Rich-gas flow rate from wellhead; economic cutoff = 600 Mcf/day
• Rich-gas flow rate from wellhead; design flow = 1000 Mcf/day
• Rich-gas heat content = 1400 btu/cf (10–12 gallons of NGLs)
• Lean-gas flow rate = 85% of rich-gas flow rate
• Lean-gas heat content = 1210–1250 Btu/cf
• NGL recovery rate = 4 gallons/Mcf
NGLs
4 gal/Mcf
2400 gpd
NGL Removal System
Lean Gas to flare
NGLs to storage
Rich Gas from WellheadRich Gas
600 Mcfpd
1400 btu/cf
Lean Gas
510 Mcfpd
1210 - 1250 btu/cf
The International Center for Applied Energy Technology®
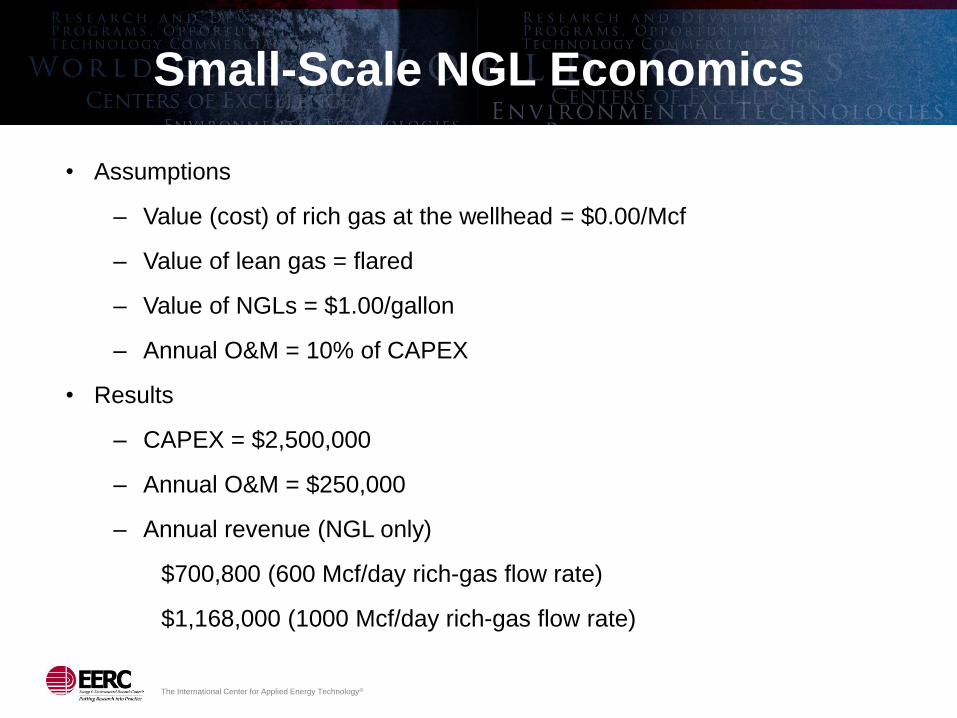
Small-Scale NGL Economics
• Assumptions
– Value (cost) of rich gas at the wellhead = $0.00/Mcf
– Value of lean gas = flared
– Value of NGLs = $1.00/gallon
– Annual O&M = 10% of CAPEX
• Results
– CAPEX = $2,500,000
– Annual O&M = $250,000
– Annual revenue (NGL only)
$700,800 (600 Mcf/day rich-gas flow rate)
$1,168,000 (1000 Mcf/day rich-gas flow rate)

The International Center for Applied Energy Technology®
CNG/LNG for Vehicles
• A disconnect exists between pipeline gas quality and required CNG fuel
quality standards.
• The opportunity for CNG exists as a diesel displacement fuel because of the
price differential between natural gas and diesel fuel.
Source: Alternative Fuels and Advanced Vehicles Data Center, 2012 Source: EIA, 2012

The International Center for Applied Energy Technology®
CNG Economics
Heavy-Duty Scenario
• Assumptions
– Value (cost) of rich gas at the wellhead = $0.00/Mcf
– Value of lean gas (CNG quality) = $1.89 GGE
– Price of diesel = $3.65 GGE
– Value of NGLs = $1.00/gallon
– Annual O&M = 10% of CAPEX
• Results
– CAPEX = $3,900,000
– Annual O&M = $390,000
– Annual NGL revenue $700,800 (600 Mcf/day rich-gas flow rate)
– Annual fuel savings versus diesel $306,000

The International Center for Applied Energy Technology®
Electric Power Generation
NGL Removal System
Lean Gas to electrical
generator
NGLs to storage
Rich Gas from WellheadRich Gas
600 Mcfpd
1400 btu/cf
Lean Gas
510 Mcfpd
1210 - 1250 btu/cf
NGLs
4 gal/Mcf
2400 gpd
Scenario
Rich-Gas Flow,
Mcf/day
NGLs Produced,
gallons/day
Lean-Gas Produced,
Mcf/day
Grid Support – Reciprocating Engine 1000 4000 850
Grid Support – Gas Turbine 1800 7200 1530
Local Power – Reciprocating Engine 600 2400 510
Local Power – Microturbine 600 2400 510

The International Center for Applied Energy Technology®
Electric Power Generation Economics
Local
Load
NGL Removal
System
Electrical
GeneratorLean
GasElectricity
Emissions
Flare
NGL
Storage
NGL
Storage
NGL
Storage
Electrical
GridRich
Gas
Oil and Associated Gas
From WellheadHeater/
Treater
Oil
Storage
Oil
Storage
Oil
Storage
Oil
To
Flare
To
Flare
Gas
NGL
Storage
NGL
To Storage
or Pipeline
Scenario
Capital Cost
Annual
O&M Cost
NGL
Revenue1
Electricity
Revenue1
Lean-Gas
Revenue1
Annual
Revenue1
Grid Support – Reciprocating Engine $7,500,000 $650,000 $1,168,000 $1,664,400 $0 $2,832,400
Grid Support – Gas Turbine $9,900,000 $890,000 $2,102,400 $2,049,840 $0 $4,152,240
Local Power – Reciprocating Engine $3,200,000 $270,000 $700,800 $157,680 $291,416 $1,149,896
Local Power – Microturbine $3,383,200 $283,640 $700,800 $122,932 $269,224 $1,092,956
1 Assumes 80% annual system availability.
The International Center for Applied Energy Technology®
Chemicals
• North American petrochemical industry is located in areas with:
– Large gas reserves
– Geologic storage
– Manufacturing facilities to produce chemical intermediates and finished
products
– Export terminals
• Chemical processes to make nitrogen-based fertilizer may have promise
– Large agricultural base
– Stranded gas
The International Center for Applied Energy Technology®
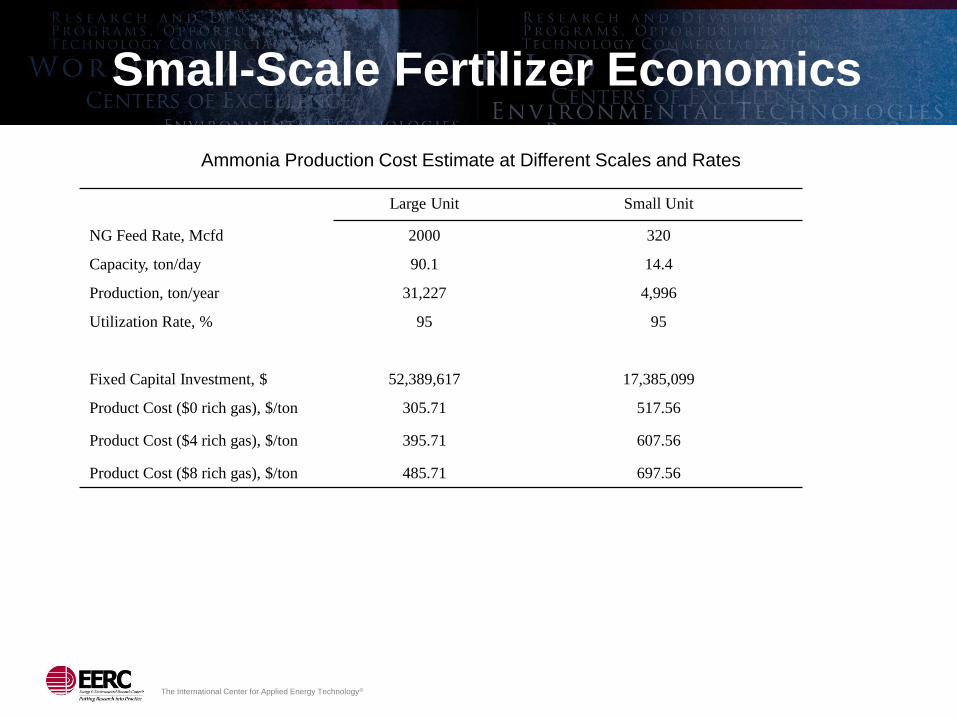
Small-Scale Fertilizer Economics
Large Unit Small Unit
NG Feed Rate, Mcfd 2000 320
Capacity, ton/day 90.1 14.4
Production, ton/year 31,227 4,996
Utilization Rate, % 95 95
Fixed Capital Investment, $ 52,389,617 17,385,099
Product Cost ($0 rich gas), $/ton 305.71 517.56
Product Cost ($4 rich gas), $/ton 395.71 607.56
Product Cost ($8 rich gas), $/ton 485.71 697.56
Ammonia Production Cost Estimate at Different Scales and Rates
The International Center for Applied Energy Technology®
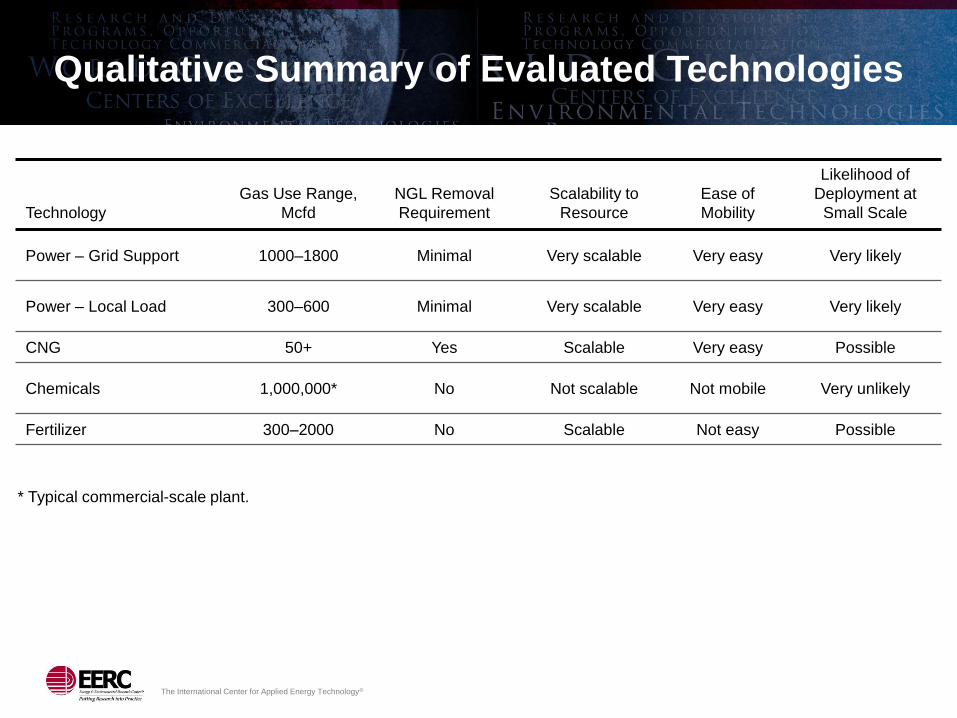
Qualitative Summary of Evaluated Technologies
Technology
Gas Use Range,
Mcfd
NGL Removal
Requirement
Scalability to
Resource
Ease of
Mobility
Likelihood of
Deployment at
Small Scale
Power – Grid Support 1000–1800 Minimal Very scalable Very easy Very likely
Power – Local Load 300–600 Minimal Very scalable Very easy Very likely
CNG 50+ Yes Scalable Very easy Possible
Chemicals 1,000,000* No Not scalable Not mobile Very unlikely
Fertilizer 300–2000 No Scalable Not easy Possible
* Typical commercial-scale plant.
The International Center for Applied Energy Technology®
Acknowledgments
Altech-Eco Corp. – Cassie Badillo
Aux Sable – Jim Asbury
BAF/Clean Energy – Brent Pope
Bakken Express, LLC – Tim Maloney
Basin Electric Power Cooperative – Dave Raatz and Jay Lundstrom
CHS, Inc. – Carl Younce
Clean Energy – Michael Eaves
Cummins NPower – Randy Phelps
Cummins Power Generation – Peter Schroeck
Dew Point Control, LLC – Myron Goforth
Dresser-Rand – Norman Price
Enbridge – Kelly Wilkins
Energy Engineering, Inc. – Ron Rebenitsch
GE Energy – Mike Farina
Hess Corporation – Cary Longie and Myles Dittus
Horizon Power Systems – Bryan Hensley and Bo Hensley
IMW/Clean Energy – Chris Damiani
Landi Renzo USA – Marco Genova
Linde LLC – Krish Krishnamurthy, Bryan Luftglass, and John Wei
Montana–Dakota Utilities Co. – Andrea Stomberg
North Dakota Association of Rural Electric Cooperatives – Harlan Fuglesten
North Dakota Industrial Commission/Oil & Gas Research Council – Bruce Hicks and Jim Lindholm
North Dakota Pipeline Authority – Justin Kringstad
Saddle Butte Pipeline, LLC – Shawn Rost
Westport Innovations, Inc. – Stephen Ptucha, Tahra Jutt, and Jonathan Burke

The International Center for Applied Energy Technology®
Contact Information
Energy & Environmental Research Center
University of North Dakota
15 North 23rd Street, Stop 9018
Grand Forks, ND 58202-9018
World Wide Web: www.undeerc.org
Telephone No. (701) 777-5000
Fax No. (701) 777-5181
Chad A. Wocken, Senior Research Manager
The International Center for Applied Energy Technology®
Acknowledgment This material is based upon work supported by the U.S. Department of Energy
National Energy Technology Laboratory under Award No. DE-FC26-08NT43291.
Disclaimer
This presentation was prepared as an account of work sponsored by an agency of the
United States Government. Neither the United States Government, nor any agency
thereof, nor any of their employees, makes any warranty, express or implied, or assumes
any legal liability or responsibility for the accuracy, completeness, or usefulness of any
information, apparatus, product, or process disclosed or represents that its use would not
infringe privately owned rights. Reference herein to any specific commercial product,
process, or service by trade name, trademark, manufacturer, or otherwise does not
necessarily constitute or imply its endorsement, recommendation, or favoring by the
United States Government or any agency thereof. The views and opinions of authors
expressed herein do not necessarily state or reflect those of the United States
Government or any agency thereof.
Related Documents