End-to-End Polyphonic Sound Event Detection Using Convolutional Recurrent Neural Networks with Learned Time-Frequency Representation Input Emre C ¸ akır Tampere University of Technology, Finland emre.cakir@tut.fi Tuomas Virtanen Tampere University of Technology, Finland tuomas.virtanen@tut.fi Abstract—Sound event detection systems typically consist of two stages: extracting hand-crafted features from the raw audio waveform, and learning a mapping between these features and the target sound events using a classifier. Recently, the focus of sound event detection research has been mostly shifted to the lat- ter stage using standard features such as mel spectrogram as the input for classifiers such as deep neural networks. In this work, we utilize end-to-end approach and propose to combine these two stages in a single deep neural network classifier. The feature extraction over the raw waveform is conducted by a feedforward layer block, whose parameters are initialized to extract the time- frequency representations. The feature extraction parameters are updated during training, resulting with a representation that is optimized for the specific task. This feature extraction block is followed by (and jointly trained with) a convolutional recurrent network, which has recently given state-of-the-art results in many sound recognition tasks. The proposed system does not outperform a convolutional recurrent network with fixed hand- crafted features. The final magnitude spectrum characteristics of the feature extraction block parameters indicate that the most relevant information for the given task is contained in 0 - 3 kHz frequency range, and this is also supported by the empirical results on the SED performance. Index Terms—neural networks, convolutional recurrent neural networks, feature learning, end-to-end I. I NTRODUCTION Sound event detection (SED) deals with the automatic identification of the sound events, i.e., sound segments that can be labeled as a distinctive concept in an audio signal. The aim of SED is to detect the onset and offset times for each sound event in an audio recording and associate a label with each of these events. At any given time instance, there can be either a single or multiple sound events present in the sound signal. The task of detecting a single event at a given time is called monophonic SED, and the task of detecting multiple sound events is called polyphonic SED. In recent years, SED has been proposed and utilized in various application areas including audio surveillance [1], urban sound analysis [2], multimedia event detection [3] and smart home devices [4]. The research leading to these results has received funding from the European Research Council under the European Unions H2020 Framework Programme through ERC Grant Agreement 637422 EVERYSOUND. The authors wish to acknowledge CSC IT Center for Science, Finland, for providing computational resources. SED has traditionally been approached as a two-stage problem: first, a time-frequency representation of the raw audio signal is extracted, then a classifier is used to learn the mapping between this representation and the target sound events. For the first stage, magnitude spectrograms, and human perception based methods such as mel spectrograms and mel frequency cepstral coefficients (MFCC) have been the most popular choices among SED researchers, and they have been used in a great portion of the submissions for the two recent SED challenges [5], [6]. For the second stage, deep learning methods such as convolutional and recurrent neural networks have recently been dominating the field with state-of-the-art performances [7]–[9]. Using time-frequency representations are beneficial in the following ways. Compared to raw audio signal in time domain, frequency domain content matches better with the semantic information about sounds. In addition, the representation is 2-D, which makes the vast research on classifiers on image- based recognition tasks applicable to SED. Also, they are often more robust to noisy environments than raw audio signals (as the noise and the target sources can occupy different regions in the frequency domain), and the obtained performance is often better than using the raw audio signals as input to the second stage. On the other hand, especially for human perception based representations, it can be argued that these representations utilize domain knowledge to discard some information from the data, which could have been otherwise useful given the optimal classifier method. A. Related Work Recently, classifiers with high expression capabilities such as deep neural networks have been utilized to learn directly from raw representations in several areas of machine learning. For instance, in image recognition, since the deep learning methods have been found to be highly effective with the works such as AlexNet [10], hand-crafted image features have been mostly replaced with raw pixel values as the inputs for the classifiers. For speech recognition, similar performance have been obtained for raw audio and log mel spectrograms in using convolutional, long-short term memory deep neural network (CLDNN) classifiers [11]. For music genre recognition, raw audio input for a CNN gives close performance to mel spectro-

Welcome message from author
This document is posted to help you gain knowledge. Please leave a comment to let me know what you think about it! Share it to your friends and learn new things together.
Transcript
End-to-End Polyphonic Sound Event DetectionUsing Convolutional Recurrent Neural Networks
with Learned Time-Frequency Representation InputEmre Cakır
Tampere University of Technology, [email protected]
Tuomas VirtanenTampere University of Technology, Finland
Abstract—Sound event detection systems typically consist oftwo stages: extracting hand-crafted features from the raw audiowaveform, and learning a mapping between these features andthe target sound events using a classifier. Recently, the focus ofsound event detection research has been mostly shifted to the lat-ter stage using standard features such as mel spectrogram as theinput for classifiers such as deep neural networks. In this work,we utilize end-to-end approach and propose to combine thesetwo stages in a single deep neural network classifier. The featureextraction over the raw waveform is conducted by a feedforwardlayer block, whose parameters are initialized to extract the time-frequency representations. The feature extraction parameters areupdated during training, resulting with a representation that isoptimized for the specific task. This feature extraction block isfollowed by (and jointly trained with) a convolutional recurrentnetwork, which has recently given state-of-the-art results inmany sound recognition tasks. The proposed system does notoutperform a convolutional recurrent network with fixed hand-crafted features. The final magnitude spectrum characteristics ofthe feature extraction block parameters indicate that the mostrelevant information for the given task is contained in 0 - 3 kHzfrequency range, and this is also supported by the empiricalresults on the SED performance.
Index Terms—neural networks, convolutional recurrent neuralnetworks, feature learning, end-to-end
I. INTRODUCTION
Sound event detection (SED) deals with the automaticidentification of the sound events, i.e., sound segments thatcan be labeled as a distinctive concept in an audio signal. Theaim of SED is to detect the onset and offset times for eachsound event in an audio recording and associate a label witheach of these events. At any given time instance, there can beeither a single or multiple sound events present in the soundsignal. The task of detecting a single event at a given timeis called monophonic SED, and the task of detecting multiplesound events is called polyphonic SED. In recent years, SEDhas been proposed and utilized in various application areasincluding audio surveillance [1], urban sound analysis [2],multimedia event detection [3] and smart home devices [4].
The research leading to these results has received funding from theEuropean Research Council under the European Unions H2020 FrameworkProgramme through ERC Grant Agreement 637422 EVERYSOUND. Theauthors wish to acknowledge CSC IT Center for Science, Finland, forproviding computational resources.
SED has traditionally been approached as a two-stageproblem: first, a time-frequency representation of the rawaudio signal is extracted, then a classifier is used to learnthe mapping between this representation and the target soundevents. For the first stage, magnitude spectrograms, and humanperception based methods such as mel spectrograms and melfrequency cepstral coefficients (MFCC) have been the mostpopular choices among SED researchers, and they have beenused in a great portion of the submissions for the two recentSED challenges [5], [6]. For the second stage, deep learningmethods such as convolutional and recurrent neural networkshave recently been dominating the field with state-of-the-artperformances [7]–[9].
Using time-frequency representations are beneficial in thefollowing ways. Compared to raw audio signal in time domain,frequency domain content matches better with the semanticinformation about sounds. In addition, the representation is2-D, which makes the vast research on classifiers on image-based recognition tasks applicable to SED. Also, they are oftenmore robust to noisy environments than raw audio signals (asthe noise and the target sources can occupy different regionsin the frequency domain), and the obtained performance isoften better than using the raw audio signals as input tothe second stage. On the other hand, especially for humanperception based representations, it can be argued that theserepresentations utilize domain knowledge to discard someinformation from the data, which could have been otherwiseuseful given the optimal classifier method.
A. Related Work
Recently, classifiers with high expression capabilities suchas deep neural networks have been utilized to learn directlyfrom raw representations in several areas of machine learning.For instance, in image recognition, since the deep learningmethods have been found to be highly effective with the workssuch as AlexNet [10], hand-crafted image features have beenmostly replaced with raw pixel values as the inputs for theclassifiers. For speech recognition, similar performance havebeen obtained for raw audio and log mel spectrograms in usingconvolutional, long-short term memory deep neural network(CLDNN) classifiers [11]. For music genre recognition, rawaudio input for a CNN gives close performance to mel spectro-
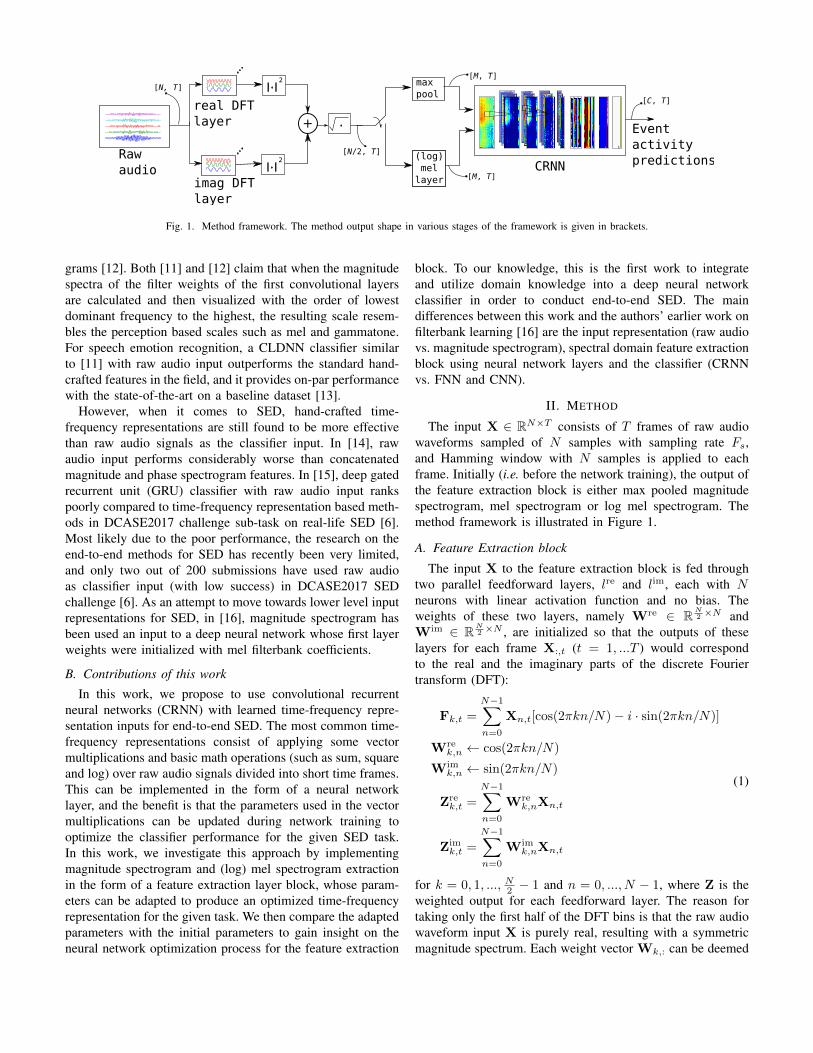
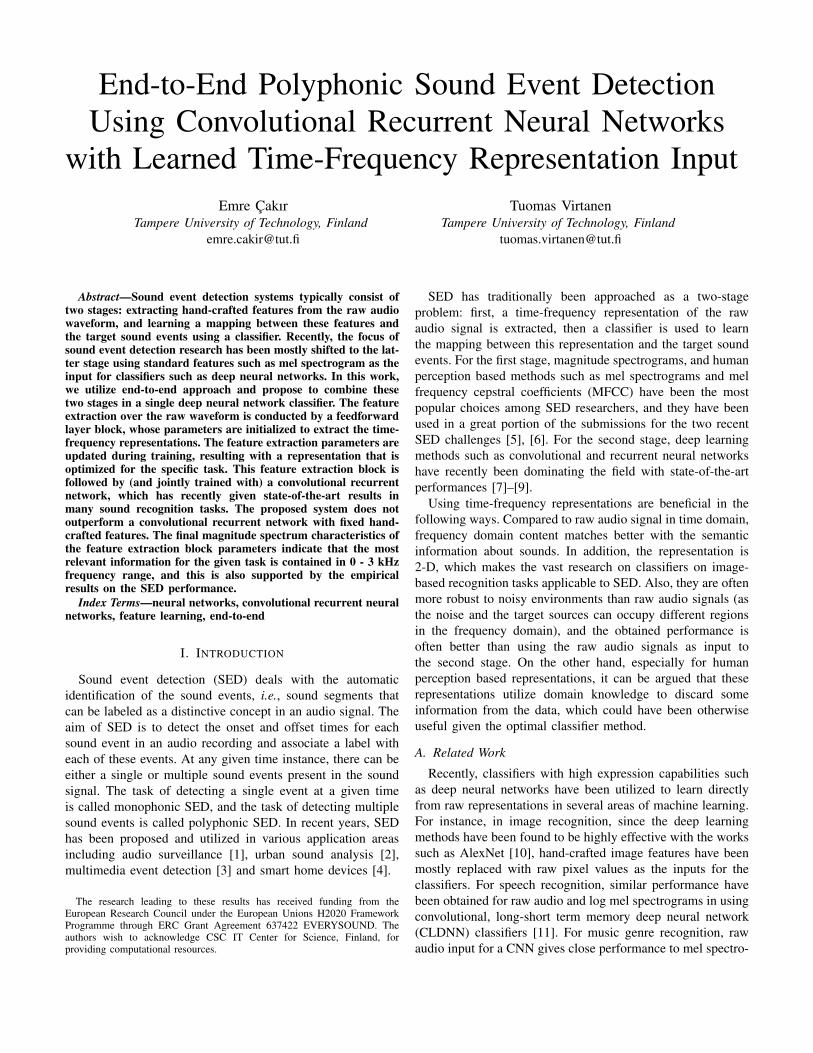
Fig. 1. Method framework. The method output shape in various stages of the framework is given in brackets.
grams [12]. Both [11] and [12] claim that when the magnitudespectra of the filter weights of the first convolutional layersare calculated and then visualized with the order of lowestdominant frequency to the highest, the resulting scale resem-bles the perception based scales such as mel and gammatone.For speech emotion recognition, a CLDNN classifier similarto [11] with raw audio input outperforms the standard hand-crafted features in the field, and it provides on-par performancewith the state-of-the-art on a baseline dataset [13].
However, when it comes to SED, hand-crafted time-frequency representations are still found to be more effectivethan raw audio signals as the classifier input. In [14], rawaudio input performs considerably worse than concatenatedmagnitude and phase spectrogram features. In [15], deep gatedrecurrent unit (GRU) classifier with raw audio input rankspoorly compared to time-frequency representation based meth-ods in DCASE2017 challenge sub-task on real-life SED [6].Most likely due to the poor performance, the research on theend-to-end methods for SED has recently been very limited,and only two out of 200 submissions have used raw audioas classifier input (with low success) in DCASE2017 SEDchallenge [6]. As an attempt to move towards lower level inputrepresentations for SED, in [16], magnitude spectrogram hasbeen used an input to a deep neural network whose first layerweights were initialized with mel filterbank coefficients.
B. Contributions of this work
In this work, we propose to use convolutional recurrentneural networks (CRNN) with learned time-frequency repre-sentation inputs for end-to-end SED. The most common time-frequency representations consist of applying some vectormultiplications and basic math operations (such as sum, squareand log) over raw audio signals divided into short time frames.This can be implemented in the form of a neural networklayer, and the benefit is that the parameters used in the vectormultiplications can be updated during network training tooptimize the classifier performance for the given SED task.In this work, we investigate this approach by implementingmagnitude spectrogram and (log) mel spectrogram extractionin the form of a feature extraction layer block, whose param-eters can be adapted to produce an optimized time-frequencyrepresentation for the given task. We then compare the adaptedparameters with the initial parameters to gain insight on theneural network optimization process for the feature extraction
block. To our knowledge, this is the first work to integrateand utilize domain knowledge into a deep neural networkclassifier in order to conduct end-to-end SED. The maindifferences between this work and the authors’ earlier work onfilterbank learning [16] are the input representation (raw audiovs. magnitude spectrogram), spectral domain feature extractionblock using neural network layers and the classifier (CRNNvs. FNN and CNN).
II. METHOD
The input X ∈ RN×T consists of T frames of raw audiowaveforms sampled of N samples with sampling rate Fs,and Hamming window with N samples is applied to eachframe. Initially (i.e. before the network training), the output ofthe feature extraction block is either max pooled magnitudespectrogram, mel spectrogram or log mel spectrogram. Themethod framework is illustrated in Figure 1.
A. Feature Extraction block
The input X to the feature extraction block is fed throughtwo parallel feedforward layers, lre and lim, each with Nneurons with linear activation function and no bias. Theweights of these two layers, namely Wre ∈ RN
2 ×N andWim ∈ RN
2 ×N , are initialized so that the outputs of theselayers for each frame X:,t (t = 1, ...T ) would correspondto the real and the imaginary parts of the discrete Fouriertransform (DFT):
Fk,t =N−1∑n=0
Xn,t[cos(2πkn/N)− i · sin(2πkn/N)]
Wrek,n ← cos(2πkn/N)
Wimk,n ← sin(2πkn/N)
Zrek,t =
N−1∑n=0
Wrek,nXn,t
Zimk,t =
N−1∑n=0
Wimk,nXn,t
(1)
for k = 0, 1, ..., N2 − 1 and n = 0, ..., N − 1, where Z is theweighted output for each feedforward layer. The reason fortaking only the first half of the DFT bins is that the raw audiowaveform input X is purely real, resulting with a symmetricmagnitude spectrum. Each weight vector Wk,: can be deemed

as an individual sinusoidal filter. For both lre and lim, theoutputs given the input X is calculated using the same weightsWre and Wim for each of the T frames. Both layers arefollowed by a square operation, the outputs of the layers aresummed, and finally a square root operator results with themagnitude spectrogram S ∈ RN
2 ×T :
Sk,t = |Fk,t| =√
(Zrek,t)
2 + (Zimk,t)
2 (2)
At this stage, S can be directly fed as input to a CRNNclassifier, or it can be further processed to obtain M (log)mel spectrogram using a feedforward layer with M neurons,rectified linear unit (ReLU) activations and no bias:
Zmelm,t = max(0,
N/2−1∑k=0
Wmelm,kSk,t) (3)
for m = 0, 1, ...M − 1. The weights Wmel of this layer isinitialized with the mel filterbank coefficients in the similarmanner with [16] and log compression is used in part of theexperiments as
Zlogmel = log(Zmel + ε) (4)
where ε = 0.001 is used to avoid numerical errors. Theparameters Wmel are obtained from Librosa [17] package andthe center frequencies for each mel band are calculated usingO’Shaughnessy’s formula [18]. For the experiments where thislayer is utilized, the weights Wre and Wim are kept fixed, asexplained in Table I.
In our experiments while using S directly as the input forCRNN, we observed that when the number of features for Sis dropped from N
2 to M by using max-pooling in frequencydomain, the computation time is substantially reduced withvery limited decrease in accuracy. Hence, we followed thisapproach when the mel feature layer is omitted.
B. Convolutional Recurrent block
Following the same approach with [8], the CRNN blockconsists of three parts:
1) convolutional layers with ReLU activations and non-overlapping pooling over frequency axis
2) gated recurrent unit (GRU) [19] layers, and3) a single feedforward layer with C units and sigmoid
activation, where C is the number of target event classes.The output of the feature extraction block, i.e., a sequence
of feature vectors, is fed to the convolutional layers and theactivations from the filters of the last convolutional layer arestacked over the frequency axis and fed to the GRU layers. Foreach frame, GRU layer activations are calculated using boththe current frame input and the previous frame outputs. Finally,the GRU layer activations are fed to the fully-connected layer.The output of this final layer is treated as the event activityprobability for each event. The aim of the network learningis to get the estimated frame-level class-wise event activityprobabilities as close as to their binary target outputs, wheretarget output is 1 if an event class is present in a given frame,
TABLE IA TABLE SHOWING WHICH WEIGHT MATRICES ARE LEARNED FOR EACH
EXPERIMENT. 3 STANDS FOR LEARNED, 7 STANDS FOR FIXED, AND -STANDS FOR NOT UTILIZED IN THE EXPERIMENT.
Learned? Wre Wim Wmel
DFT learned 3 3 -Mel learned 7 7 3
Log mel learned 7 7 3
and 0 vice versa. In the usage case, the estimated frame-levelevent activity probabilities are thresholded with 0.5 to obtainbinary event activity predictions. More detailed explanationabout CRNN block can be found in [8].
The network is trained with back-propagation through timeusing Adam optimizer [20] with learning rate 10−3, binarycross-entropy as the loss function and for maximum 300epochs. In order to reduce overfitting of the model, early stop-ping was used to stop training if the validation data frame-levelF1 score did not improve for 65 epochs. For regularization,batch normalization [21] was employed in convolutional layersand dropout [22] with rate 0.25 was employed in convolutionaland recurrent layers. Keras deep learning library [23] was usedto implement the network.
III. EVALUATION
A. Dataset
The dataset used in this work is called TUT-SED Synthetic2016. It is a publicly available polyphonic SED dataset, whichconsists of synthetic mixtures created by mixing isolated soundevents from 16 sound event classes. Polyphonic mixtures werecreated by mixing 994 sound event samples with the samplingrate 44.1 kHz. From the 100 mixtures created, 60% are usedfor training, 20% for testing and 20% for validation. The totallength of the data is 566 minutes. Different instances of thesound events are used to synthesize the training, validation andtest partitions. Mixtures were created by randomly selectingevent instance and from it, randomly, a segment of length 3-15seconds. Mixtures do not contain any additional backgroundnoise. Dataset creation procedure explanation and metadatacan be found in the web page 1 hosting the dataset.
B. Evaluation Metrics and Experimental Setup
The evaluation metrics used in this work are frame-levelF1 score and error rate. F1 score is the harmonic mean ofprecision and recall, and error rate is the sum of the rateof insertions, substitutions and deletions. Both metrics arecalculated in the same manner with [8] and they are explainedin more detail in [24].
The input X to the feature extraction block consists ofa sequence of 40 ms length frames with 50% overlap. Thenumber of frames in the sequence is T = 256 which corre-sponds to 2.56 seconds of raw audio. The audio signals have
1http://www.cs.tut.fi/sgn/arg/taslp2017-crnn-sed/tut-sed-synthetic-2016

TABLE IIFRAME-LEVEL F1 SCORE F1frm AND ERROR RATE ERfrm RESULTS FOR
DIFFERENT TIME-FREQUENCY REPRESENTATION METHODS ANDSAMPLING RATES. ”DFT” STANDS FOR MAGNITUDE SPECTROGRAM
USING LINEAR FREQUENCY SCALE, ”MEL” STANDS FOR MELSPECTROGRAM, ”FIXED” AND ”LEARNED” STANDS FOR WHETHER THE
WEIGHTS OF THE FEATURE EXTRACTION BLOCK ARE KEPT FIXED ORUPDATED DURING TRAINING.
Method F1frm ERfrm
DFT 8 kHz fixed 60.8±0.8 0.55±0.01DFT 8 kHz learned 60.8±0.8 0.55±0.01
Mel 8 kHz fixed 60.8±0.9 0.55±0.01Mel 8 kHz learned 61.0±0.8 0.56±0.01
Log mel 8 kHz fixed 63.1±0.6 0.52±0.01Log mel 8 kHz learned 58.6±1.6 0.56±0.01
DFT 16 kHz fixed 61.9±0.9 0.54±0.01DFT 16 kHz learned 60.1±1.7 0.58±0.03
Mel 16 kHz fixed 62.3±0.7 0.54±0.01Mel 16 kHz learned 60.6±0.9 0.57±0.02
Log mel 16 kHz fixed 65.8±1.4 0.50±0.01Log mel 16 kHz learned 59.9±1.3 0.56±0.01
DFT 24 kHz learned 58.1±1.6 0.59±0.03
Log mel 44.1 kHz fixed [8] 66.4±0.6 0.48±0.01
been resampled from the original rate of 44.1 kHz to 8, 16and 24 kHz in different experiments, which corresponds toN = 160, 320, and 480 features for each frame, respectively.This is done both to investigate the effect of discarding theinformation from higher frequencies, and also to reduce thememory requirements to be able to run experiments with adecent sized network and batch size. At the max pooling(or mel) layer of the feature extraction block, the number offeatures is set to M = 40.
In order to find the optimal network hyper-parameters, a gridsearch was performed, and the hyper-parameter set resultingwith the best frame-level F1 score on the validation datawas used in the evaluation. The grid search consists of everypossible combination of the following hyper-parameters: thenumber of convolutional filters / recurrent hidden units (thesame amount for both) {96, 256}; the number of recurrentlayers {1, 2, 3}; and the number of convolutional layers {1, 2,3 ,4} with the following frequency max pooling arrangementsafter each convolutional layer {(4), (2, 2), (4, 2), (8, 5), (2,2, 2), (5, 4, 2), (2, 2, 2, 1), (5, 2, 2, 2)}. Here, the numbersdenote the number of features at each max pooling step; e.g.,the configuration (5, 4, 2) pools the original 40 features in asingle feature in three stages: 40→8→2→1. This grid searchprocess is repeated for every experiment setup in Table II(except the last experiment, where a similar grid search hasbeen performed earlier for that work).
After finding the optimal hyper-parameters, each experimentis run ten times with different random seeds to reflect the effectof random weight initialization in convolutional recurrentblock of the proposed system. The mean and the standarddeviation (given after ±) of these experiments are provided.
C. Results
The effect of feature extraction with learned parametershave been investigated and compared with the fixed featureextraction parameters in Table II. For both frame-level F1score and error rate metrics, experiments with fixed featureextraction parameters often outperform the learned featureextraction methods in their corresponding sampling rates. Inaddition, the experiments with fixed parameters benefit fromthe increased sampling rate, whereas the performance doesnot improve for learned feature extraction parameters withhigher sampling rates. One should also note that the F1 scoreusing both learned and fixed parameters with 8 kHz samplingrate is 60.8%. Although there is some drop in performancefrom the highest F1 score of 66.4% at 44.1 kHz, it is stillremarkable performance considering that about 82% of thefrequency domain content of the original raw audio signal isdiscarded in the resampling process from 44.1 kHz to 8 kHz.This emphasizes the importance of low frequency componentsfor the given SED task. Since the computational load due tohigh amount of data in the raw audio representations is one ofthe concerns for end-to-end SED systems, it can be consideredto apply a similar resampling process for the end-to-end SEDmethods in the future.
In order to investigate how the original parameters ofthe feature extraction block have been modified during thetraining, the magnitude spectrum peak, i.e. the maximum valueof the magnitude spectrum, of the trained weights for Wre
k ,Wim
k , and Wrek + i ·Wim
k are calculated for each filter k.Without network training, these weights represent sinusoidsignals, therefore the magnitude spectrum of each filter isequal to a single impulse at the center frequency of the filter,whose amplitude equals to the number of filters. At the end ofthe training, the peak of the magnitude spectrum for each filterstays at the center frequency of the filter, while the amplitudeof the peak is either increased or decreased to a certain degree.In order to visualize the change in the peak amplitude, thepeak amplitude positioned at the center frequency for eachfilter after training is given in Figure 2. The same analysisis repeated for different experiments using raw audio inputswith different sampling rates (8 kHz, 16 kHz and 24 kHz) asinput to their feature extraction block which initially calculatesthe pooled magnitude spectrogram. The magnitude spectrumpeaks for each experiment is scaled with the number of filtersfor visualization purposes, and therefore each peak is equal to1 before the training. The three observations that can be madefrom Figure 2 is
• Although each of these three systems have differentCRNN architectures (grid search for each system resultswith different hyper-parameter set) and their raw audioinput is sampled with different rates, the magnitude
0.0 0.8 1.5 2.2 3.0 3.8 4.5 5.2 6.0 6.8 7.5 8.2 9.0 9.8 10.5 11.2Frequency [kHz]
0.5
0.6
0.7
0.8
0.9
1.0
1.1
1.2
1.3 Magnitude spectrum peaks for W re
DFT 8 kHz
DFT 16 kHz
DFT 24 kHz
0.0 0.8 1.5 2.2 3.0 3.8 4.5 5.2 6.0 6.8 7.5 8.2 9.0 9.8 10.5 11.2Frequency [kHz]
0.5
0.6
0.7
0.8
0.9
1.0
1.1
1.2
1.3 Magnitude spectrum peaks for W im
DFT 8 kHz
DFT 16 kHz
DFT 24 kHz
0.0 0.8 1.5 2.2 3.0 3.8 4.5 5.2 6.0 6.8 7.5 8.2 9.0 9.8 10.5 11.2Frequency [kHz]
0.5
0.6
0.7
0.8
0.9
1.0
1.1
1.2
1.3 Magnitude spectrum peaks for W re + jW im
DFT 8 kHz
DFT 16 kHz
DFT 24 kHz
0.0 0.2 0.5 0.8 1.0 1.2 1.5 1.8 2.0 2.2 2.5 2.8 3.0 3.2 3.5 3.8Frequency [kHz]
0.5
0.6
0.7
0.8
0.9
1.0
1.1
1.2
1.3 Magnitude spectrum peaks for W re + jW im up to 4 kHzDFT 8 kHz
DFT 16 kHz
DFT 24 kHz
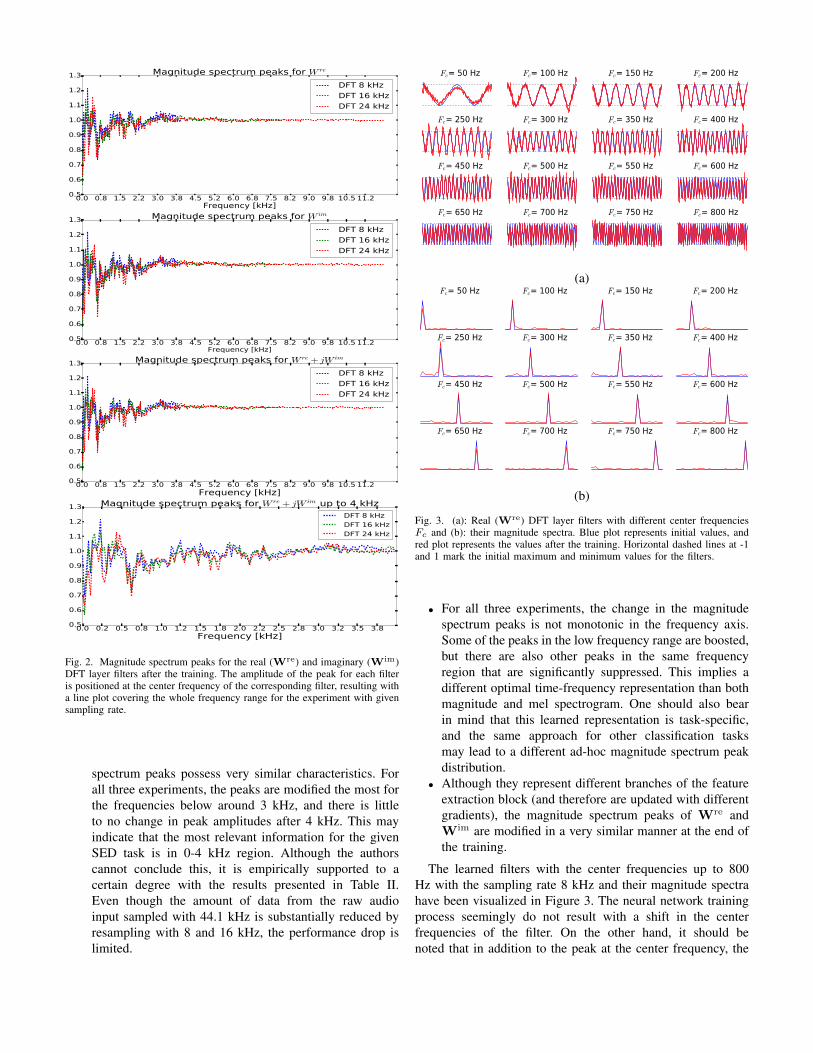
Fig. 2. Magnitude spectrum peaks for the real (Wre) and imaginary (Wim)DFT layer filters after the training. The amplitude of the peak for each filteris positioned at the center frequency of the corresponding filter, resulting witha line plot covering the whole frequency range for the experiment with givensampling rate.
spectrum peaks possess very similar characteristics. Forall three experiments, the peaks are modified the most forthe frequencies below around 3 kHz, and there is littleto no change in peak amplitudes after 4 kHz. This mayindicate that the most relevant information for the givenSED task is in 0-4 kHz region. Although the authorscannot conclude this, it is empirically supported to acertain degree with the results presented in Table II.Even though the amount of data from the raw audioinput sampled with 44.1 kHz is substantially reduced byresampling with 8 and 16 kHz, the performance drop islimited.
Fc= 50 Hz Fc= 100 Hz Fc= 150 Hz Fc= 200 Hz
Fc= 250 Hz Fc= 300 Hz Fc= 350 Hz Fc= 400 Hz
Fc= 450 Hz Fc= 500 Hz Fc= 550 Hz Fc= 600 Hz
Fc= 650 Hz Fc= 700 Hz Fc= 750 Hz Fc= 800 Hz
(a)Fc= 50 Hz Fc= 100 Hz Fc= 150 Hz Fc= 200 Hz
Fc= 250 Hz Fc= 300 Hz Fc= 350 Hz Fc= 400 Hz
Fc= 450 Hz Fc= 500 Hz Fc= 550 Hz Fc= 600 Hz
Fc= 650 Hz Fc= 700 Hz Fc= 750 Hz Fc= 800 Hz
(b)
Fig. 3. (a): Real (Wre) DFT layer filters with different center frequenciesFc and (b): their magnitude spectra. Blue plot represents initial values, andred plot represents the values after the training. Horizontal dashed lines at -1and 1 mark the initial maximum and minimum values for the filters.
• For all three experiments, the change in the magnitudespectrum peaks is not monotonic in the frequency axis.Some of the peaks in the low frequency range are boosted,but there are also other peaks in the same frequencyregion that are significantly suppressed. This implies adifferent optimal time-frequency representation than bothmagnitude and mel spectrogram. One should also bearin mind that this learned representation is task-specific,and the same approach for other classification tasksmay lead to a different ad-hoc magnitude spectrum peakdistribution.
• Although they represent different branches of the featureextraction block (and therefore are updated with differentgradients), the magnitude spectrum peaks of Wre andWim are modified in a very similar manner at the end ofthe training.
The learned filters with the center frequencies up to 800Hz with the sampling rate 8 kHz and their magnitude spectrahave been visualized in Figure 3. The neural network trainingprocess seemingly do not result with a shift in the centerfrequencies of the filter. On the other hand, it should benoted that in addition to the peak at the center frequency, the

0 5 10 15 20 25 30 35Bin index
0
0.5
1
1.5
2
2.5
3
3.5
Frequency [kH
z]
Mel 8 kHz
0 5 10 15 20 25 30 35Bin index
0
1.25
2.5
3.75
5
6.25
7.5
Mel 16 kHz
−0.6
−0.3
0.0
0.3
0.6
0.9
1.2
1.5
1.8
(a)
0
0.5
1
1.5
2
2.5
3
3.5
Frequency [kH
z]
Mel 8 kHz
0
1.25
2.5
3.75
5
6.25
7.5
Mel 16 kHz
0 5 10 15 20 25 30 35Bin index
0
0.5
1
1.5
2
2.5
3
3.5
Frequenc [kH
z]
Log mel 8 kHz
0 5 10 15 20 25 30 35Bin index
0
1.25
2.5
3.75
5
6.25
7.5
Log mel 16 kHz−0.6
−0.3
0.0
0.3
0.6
0.9
1.2
1.5
1.8
−0.6
−0.3
0.0
0.3
0.6
0.9
1.2
1.5
1.8
(b)
Fig. 4. (a): Initial, and (b): learned mel filterbank responses.
magnitude spectrum of each filter consists of other componentswith smaller amplitude values spread over the frequency range,which reflects that the pure sinusoid property of the filters arelost.
For the experiments where the mel layer is utilized, thelearned mel filterbank responses are visualized in Figure 4.One common point among the responses is that the filter-bank parameters covering lower frequency range have beenemphasized. The learned filterbank response that is the mostresembling its initial response belongs to mel layer with 8 kHzsampling rate, which also performs the best among these fourexperiments with 61% F1 score, as presented in Table II. Forthe response of both mel and log mel layers with samplingrate 16 kHz, the parameters covering higher frequency rangehave been emphasized, and the filter bandwidths for higherfrequencies have been increased. However this does not resultwith an improved performance, as these experiments provide60.6% and 59.9% F1 score, respectively.
IV. CONCLUSION
In this work, we propose to conduct end-to-end polyphonicSED using learned time-frequency representations as input to aCRNN classifier. The classifier is fed by a neural network layerblock, whose parameters are initialized to extract commontime-frequency representation methods over raw audio signals.These parameters are then updated through the training processfor the given SED task. The performance of this methodis slightly lower than directly using common time-frequencyrepresentations as input. During the network training, re-gardless of the input sampling rate and the neural networkconfiguration, the magnitude response of the feature extractionblock parameters have been significantly altered for the lower
frequencies (below 4 kHz), and stayed mostly the same forhigher frequencies.
REFERENCES
[1] P. Foggia, N. Petkov, A. Saggese, N. Strisciuglio, and M. Vento,“Reliable detection of audio events in highly noisy environments,”Pattern Recognition Letters, vol. 65, pp. 22–28, 2015.
[2] J. P. Bello, C. Mydlarz, and J. Salamon, “Sound analysis in smart cities,”in Computational Analysis of Sound Scenes and Events. Springer, 2018,pp. 373–397.
[3] Y. Wang, L. Neves, and F. Metze, “Audio-based multimedia eventdetection using deep recurrent neural networks,” in 2016 IEEE Int. Conf.on Acoustics, Speech and Signal Processing (ICASSP). IEEE, 2016,pp. 2742–2746.
[4] S. Krstulovic, “Audio event recognition in the smart home,” in Com-putational Analysis of Sound Scenes and Events. Springer, 2018, pp.335–371.
[5] A. Mesaros, T. Heittola, E. Benetos, P. Foster, M. Lagrange, T. Virtanen,and M. D. Plumbley, “Detection and classification of acoustic scenesand events: Outcome of the DCASE 2016 challenge,” IEEE/ACMTransactions on Audio, Speech, and Language Processing, vol. 26, no. 2,pp. 379–393, 2018.
[6] A. Mesaros, T. Heittola, A. Diment, B. Elizalde, A. Shah, E. Vincent,B. Raj, and T. Virtanen, “DCASE 2017 challenge setup: Tasks, datasetsand baseline system,” in Proceedings of the Detection and Classificationof Acoustic Scenes and Events 2017 Workshop (DCASE2017), November2017.
[7] H. Lim, J. Park, and Y. Han, “Rare sound event detection using 1Dconvolutional recurrent neural networks,” DCASE2017 Challenge, Tech.Rep., September 2017.
[8] E. Cakir, G. Parascandolo, T. Heittola, H. Huttunen, and T. Virtanen,“Convolutional recurrent neural networks for polyphonic sound eventdetection,” IEEE/ACM Transactions on Audio, Speech, and LanguageProcessing, vol. 25, no. 6, pp. 1291–1303, 2017.
[9] S. Adavanne, G. Parascandolo, P. Pertila, T. Heittola, and T. Virtanen,“Sound event detection in multichannel audio using spatial and harmonicfeatures,” DCASE2016 Challenge, Tech. Rep., September 2016.
[10] A. Krizhevsky, I. Sutskever, and G. E. Hinton, “Imagenet classificationwith deep convolutional neural networks,” in Advances in neural infor-mation processing systems, 2012, pp. 1097–1105.
[11] T. N. Sainath, R. J. Weiss, A. Senior, K. W. Wilson, and O. Vinyals,“Learning the speech front-end with raw waveform CLDNNs,” in Proc.Interspeech, 2015.
[12] S. Dieleman and B. Schrauwen, “End-to-end learning for music audio,”in IEEE International Conference on Acoustics, Speech and SignalProcessing (ICASSP). IEEE, 2014, pp. 6964–6968.
[13] G. Trigeorgis, F. Ringeval, R. Brueckner, E. Marchi, M. A. Nicolaou,B. Schuller, and S. Zafeiriou, “Adieu features? end-to-end speech emo-tion recognition using a deep convolutional recurrent network,” in IEEEInternational Conference on Acoustics, Speech and Signal Processing(ICASSP). IEEE, 2016, pp. 5200–5204.
[14] L. Hertel, H. Phan, and A. Mertins, “Comparing time and frequencydomain for audio event recognition using deep learning,” in InternationalJoint Conference on Neural Networks (IJCNN). IEEE, 2016, pp. 3407–3411.
[15] Y. Hou and S. Li, “Sound event detection in real life audio using multi-model system,” DCASE2017 Challenge, Tech. Rep., September 2017.
[16] E. Cakir, E. C. Ozan, and T. Virtanen, “Filterbank learning for deepneural network based polyphonic sound event detection,” in Interna-tional Joint Conference on Neural Networks (IJCNN). IEEE, 2016, pp.3399–3406.
[17] B. McFee, M. McVicar, C. Raffel, D. Liang, O. Nieto, E. Battenberg,J. Moore, D. Ellis, R. Yamamoto, R. Bittner, D. Repetto, P. Viktorin,J. F. Santos, and A. Holovaty, “librosa: 0.4.1,” Oct. 2015. [Online].Available: http://dx.doi.org/10.5281/zenodo.32193
[18] D. O’shaughnessy, Speech communication: human and machine. Uni-versities press, 1987.
[19] K. Cho, B. Van Merrienboer, D. Bahdanau, and Y. Bengio, “On theproperties of neural machine translation: Encoder-decoder approaches,”Eighth Workshop on Syntax, Semantics and Structure in StatisticalTranslation (SSST-8), 2014.
[20] D. Kingma and J. Ba, “Adam: A method for stochastic optimization,”in arXiv:1412.6980 [cs.LG], 2014.

[21] S. Ioffe and C. Szegedy, “Batch normalization: Accelerating deepnetwork training by reducing internal covariate shift,” CoRR, vol.abs/1502.03167, 2015.
[22] N. Srivastava, G. Hinton, A. Krizhevsky, I. Sutskever, and R. Salakhut-dinov, “Dropout: A simple way to prevent neural networks from over-fitting,” in Journal of Machine Learning Research (JMLR), 2014.
[23] F. Chollet, “Keras,” github.com/fchollet/keras, 2015.[24] A. Mesaros, T. Heittola, and T. Virtanen, “Metrics for polyphonic sound
event detection,” Applied Sciences, vol. 6, no. 6, p. 162, 2016.
Related Documents